A Novel Sample Generation Method for Deep Learning Lithological Mapping with Airborne TASI Hyperspectral Data in Northern Liuyuan, Gansu, China
Abstract
:1. Introduction
2. Related Work
2.1. Lithological Mapping Based on DL
2.2. Sample Dataset Construction Approaches for DL-Based Lithological Mapping
3. Study Area and Data
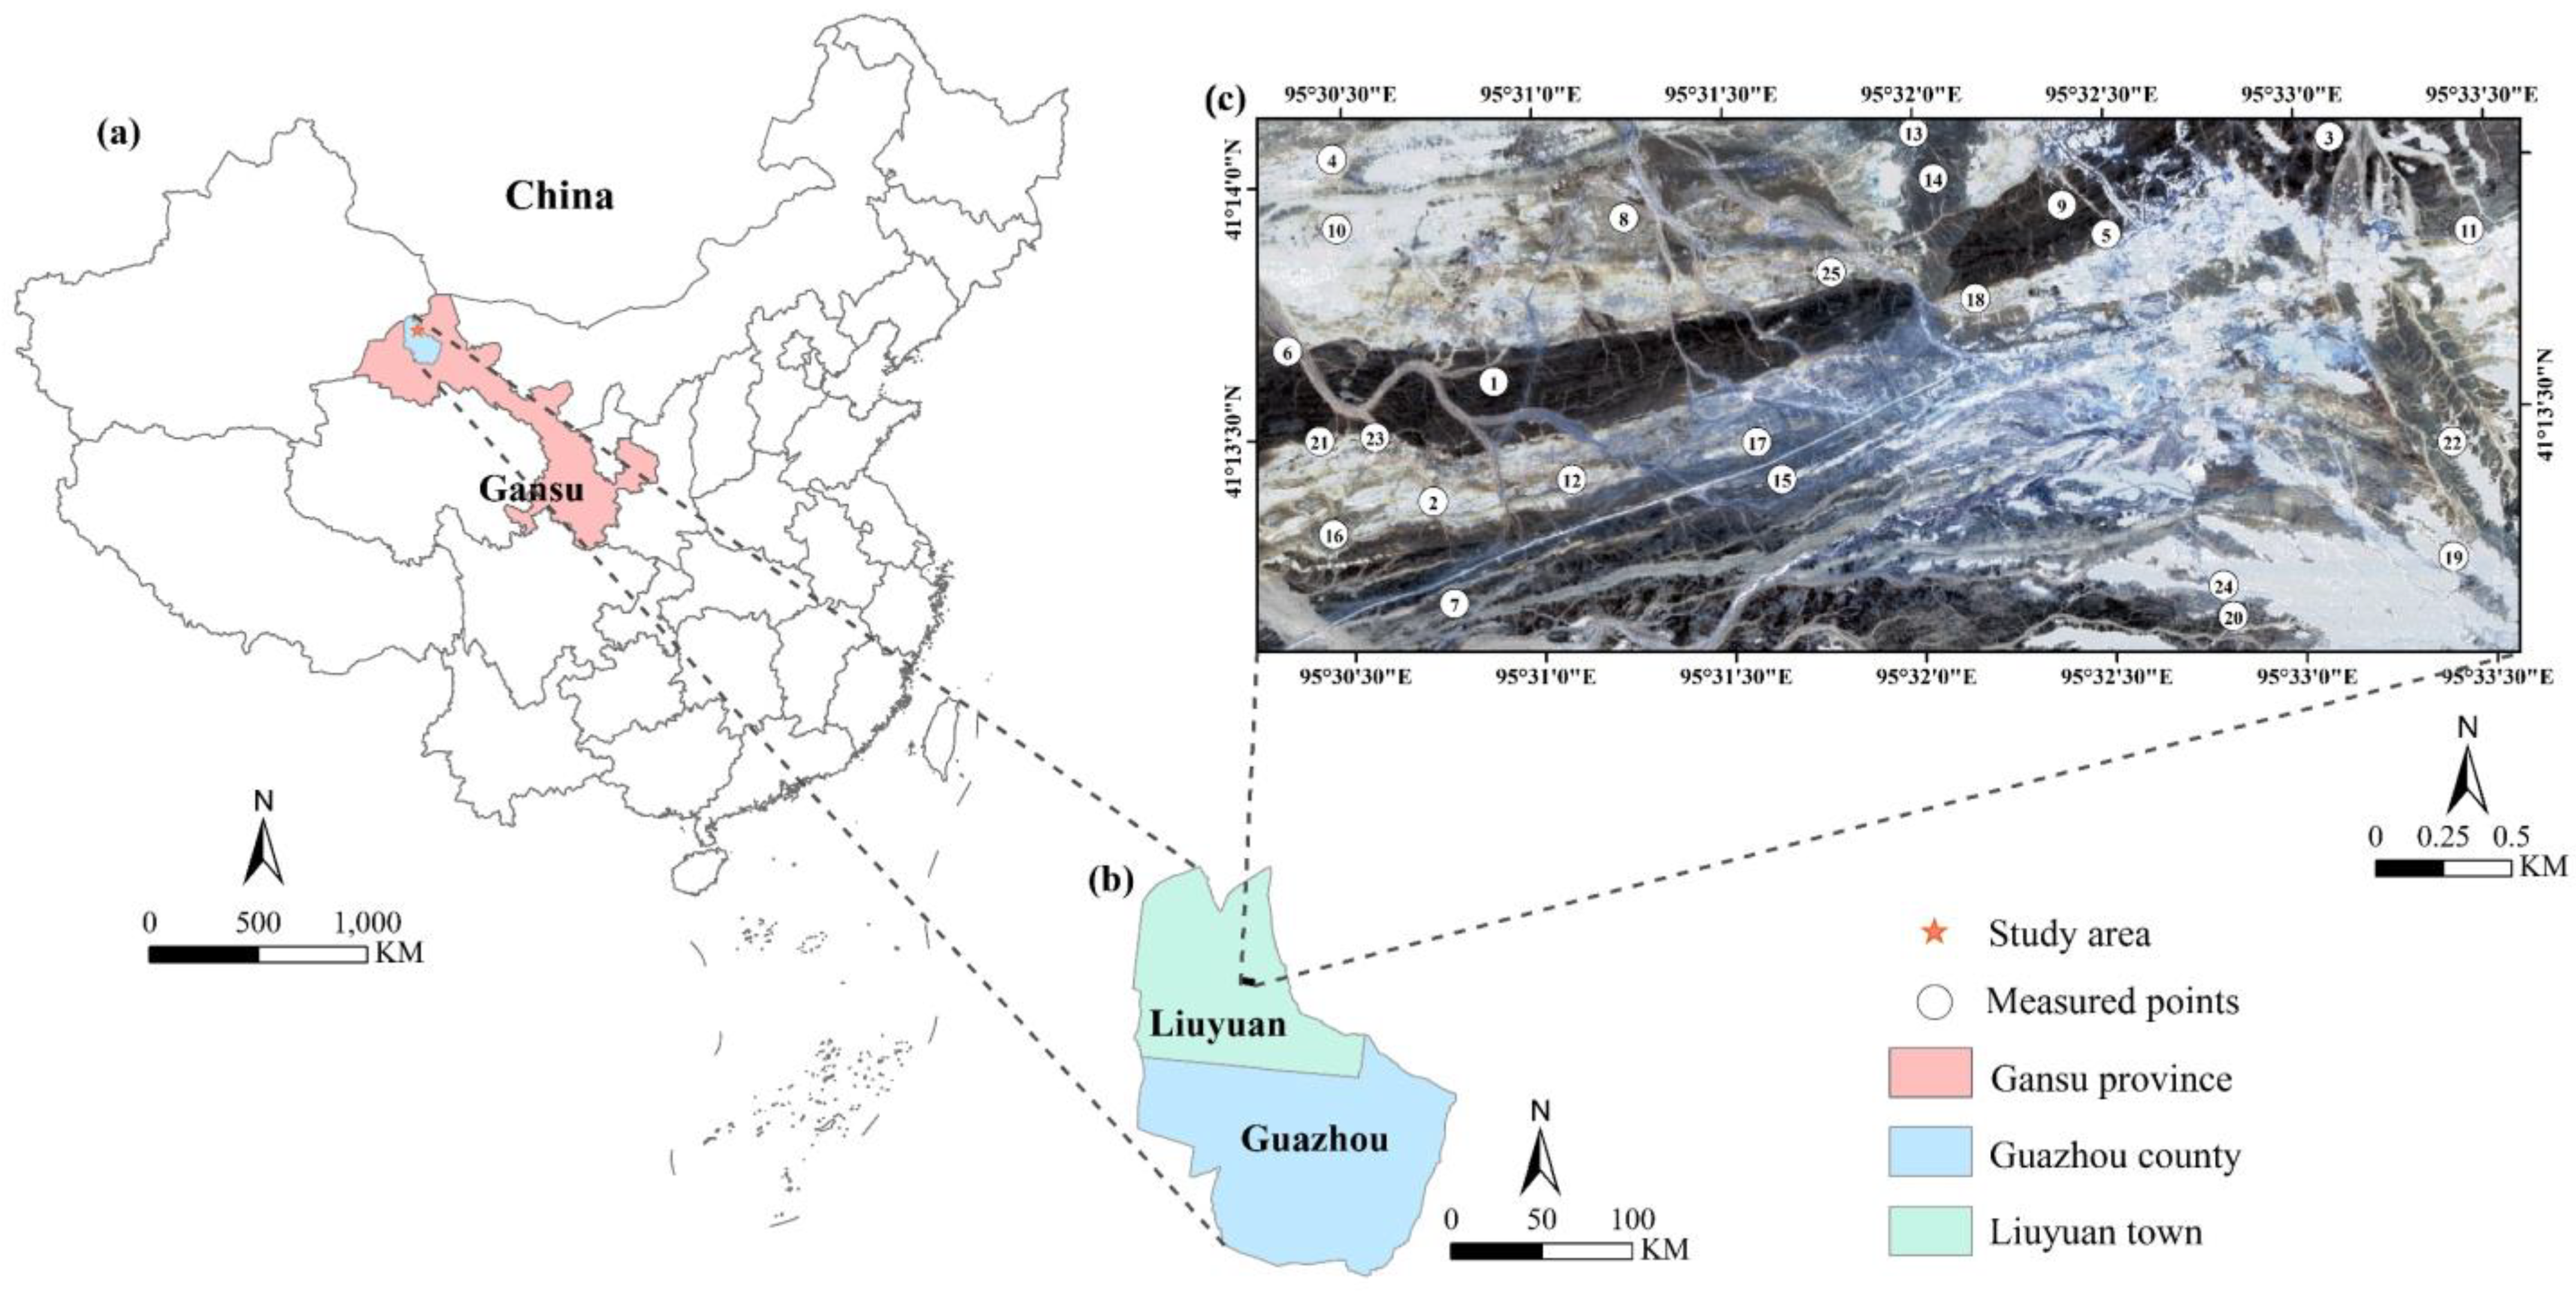
3.1. Overview of Study Site
3.2. TASI Data and Pre-Processing
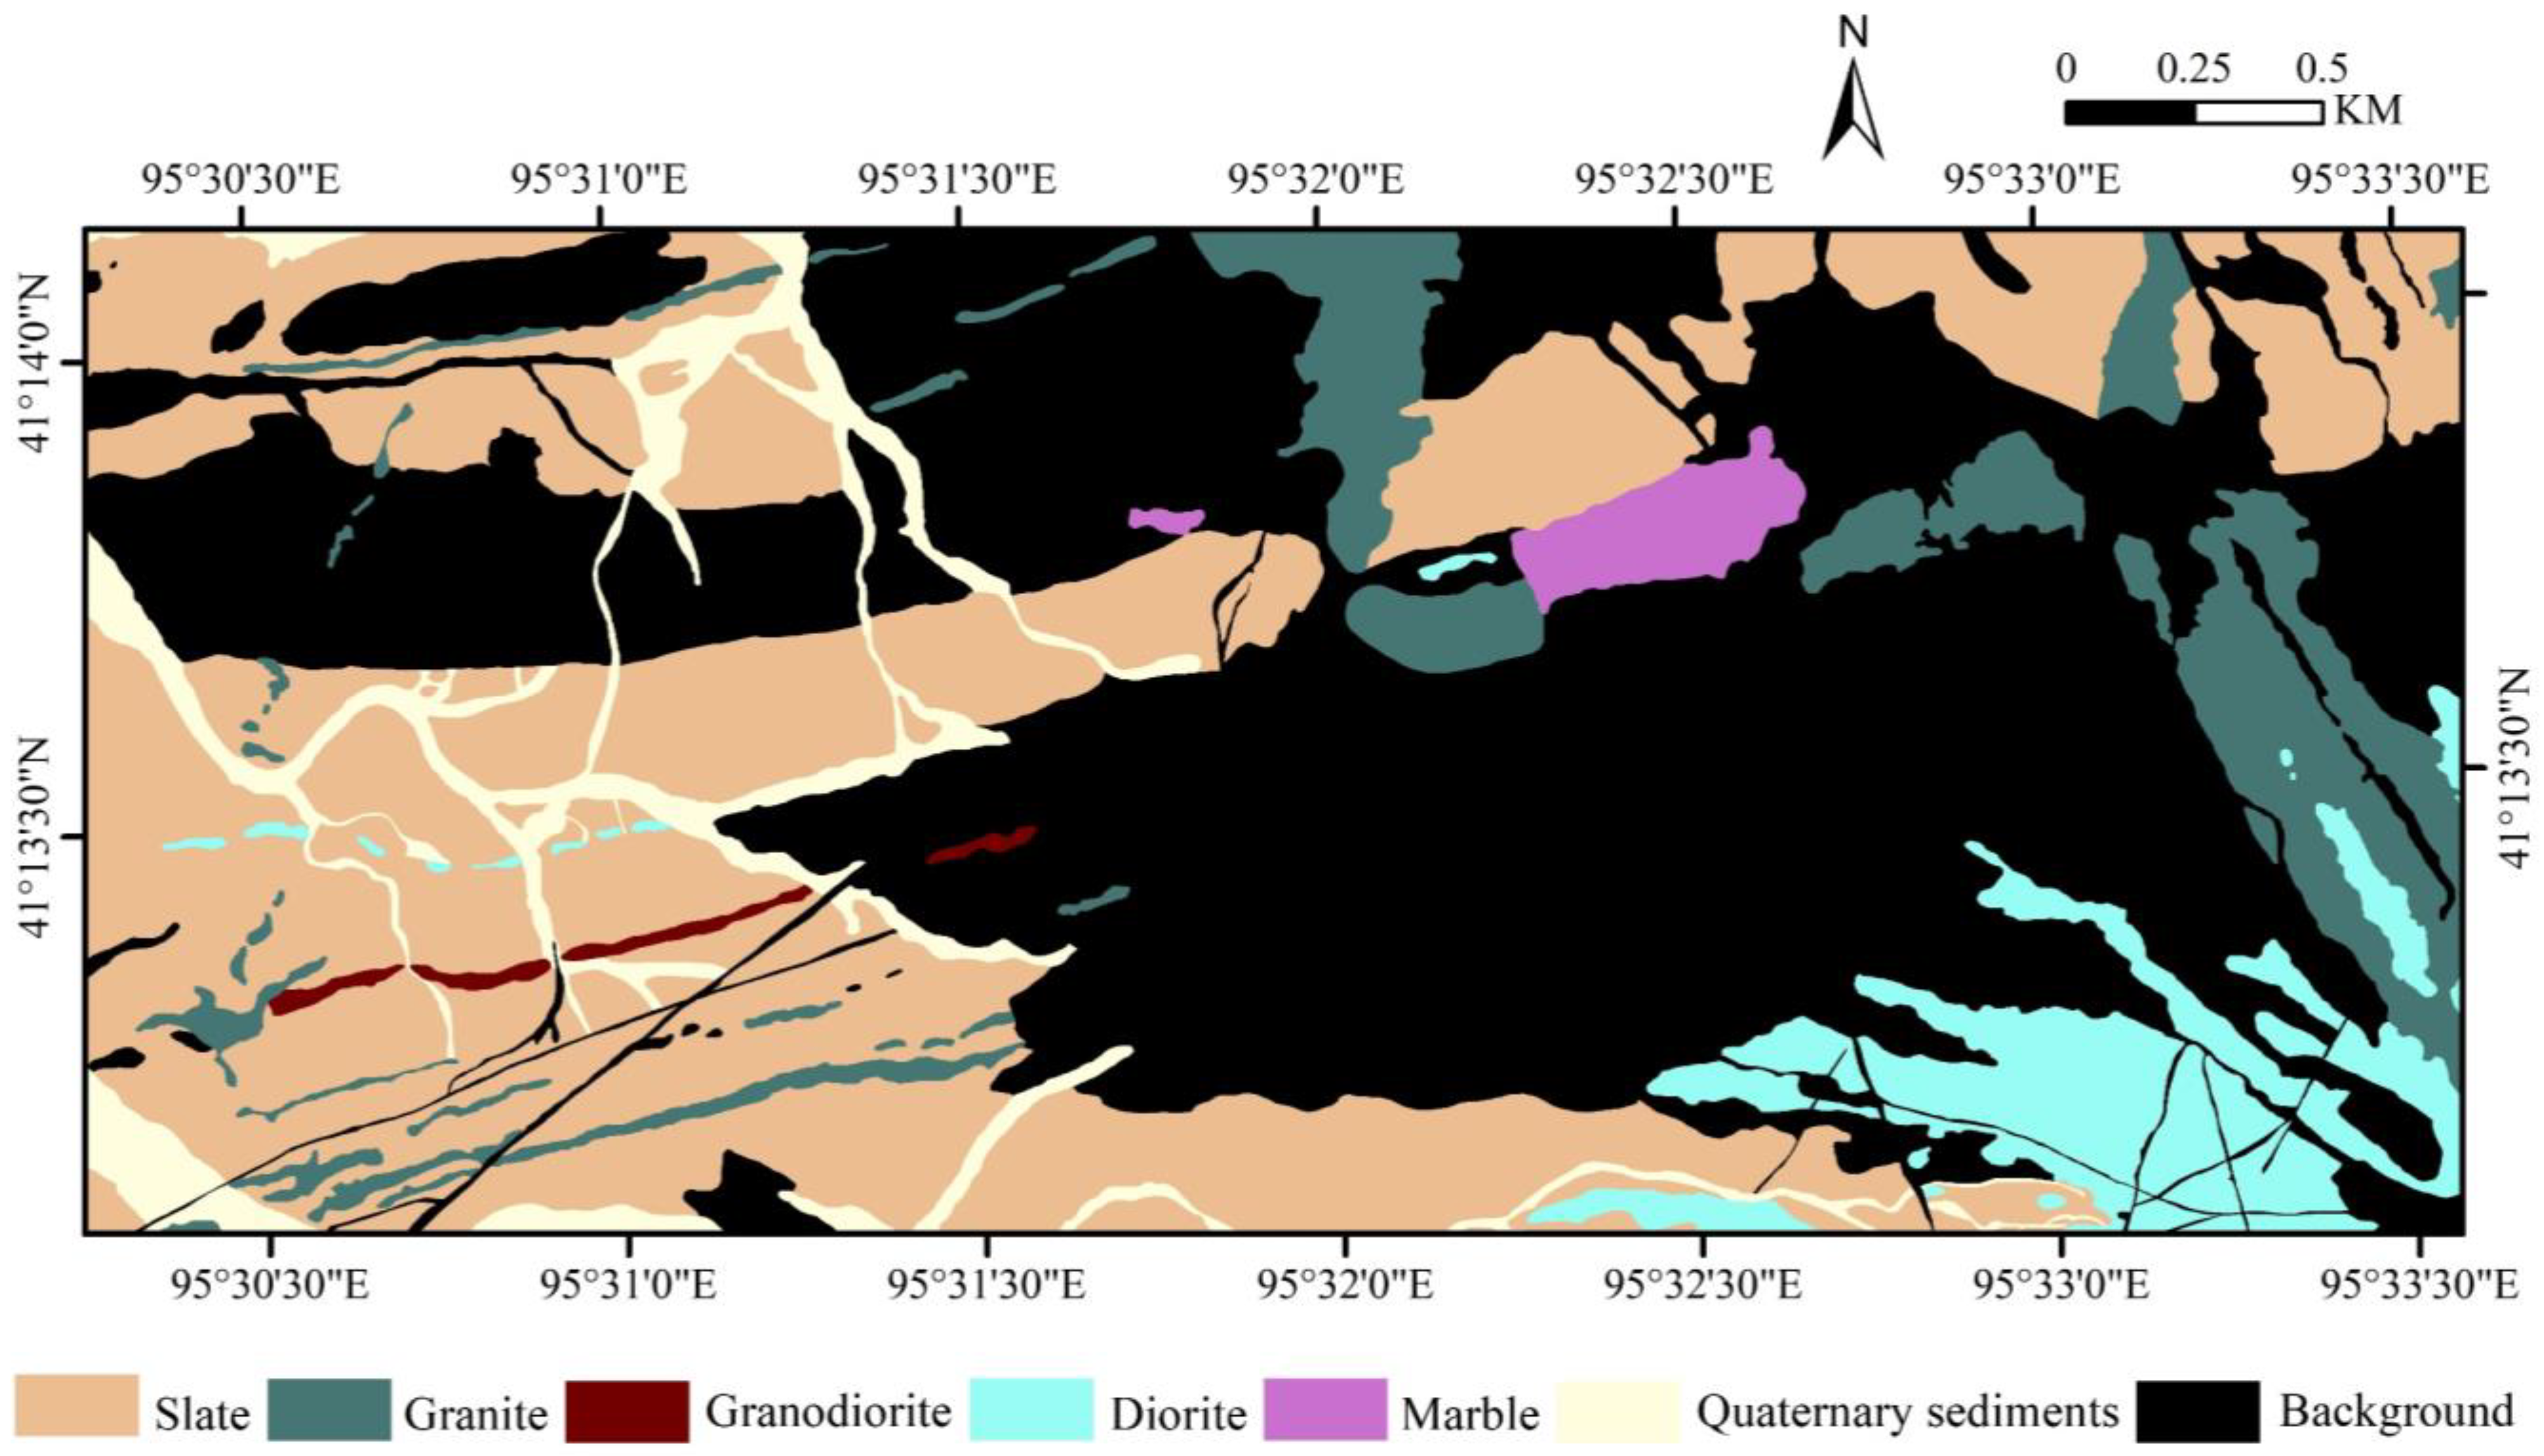
3.3. Geological Background and Ground-Truth Data
4. Methodology
4.1. Sample Dataset Construction
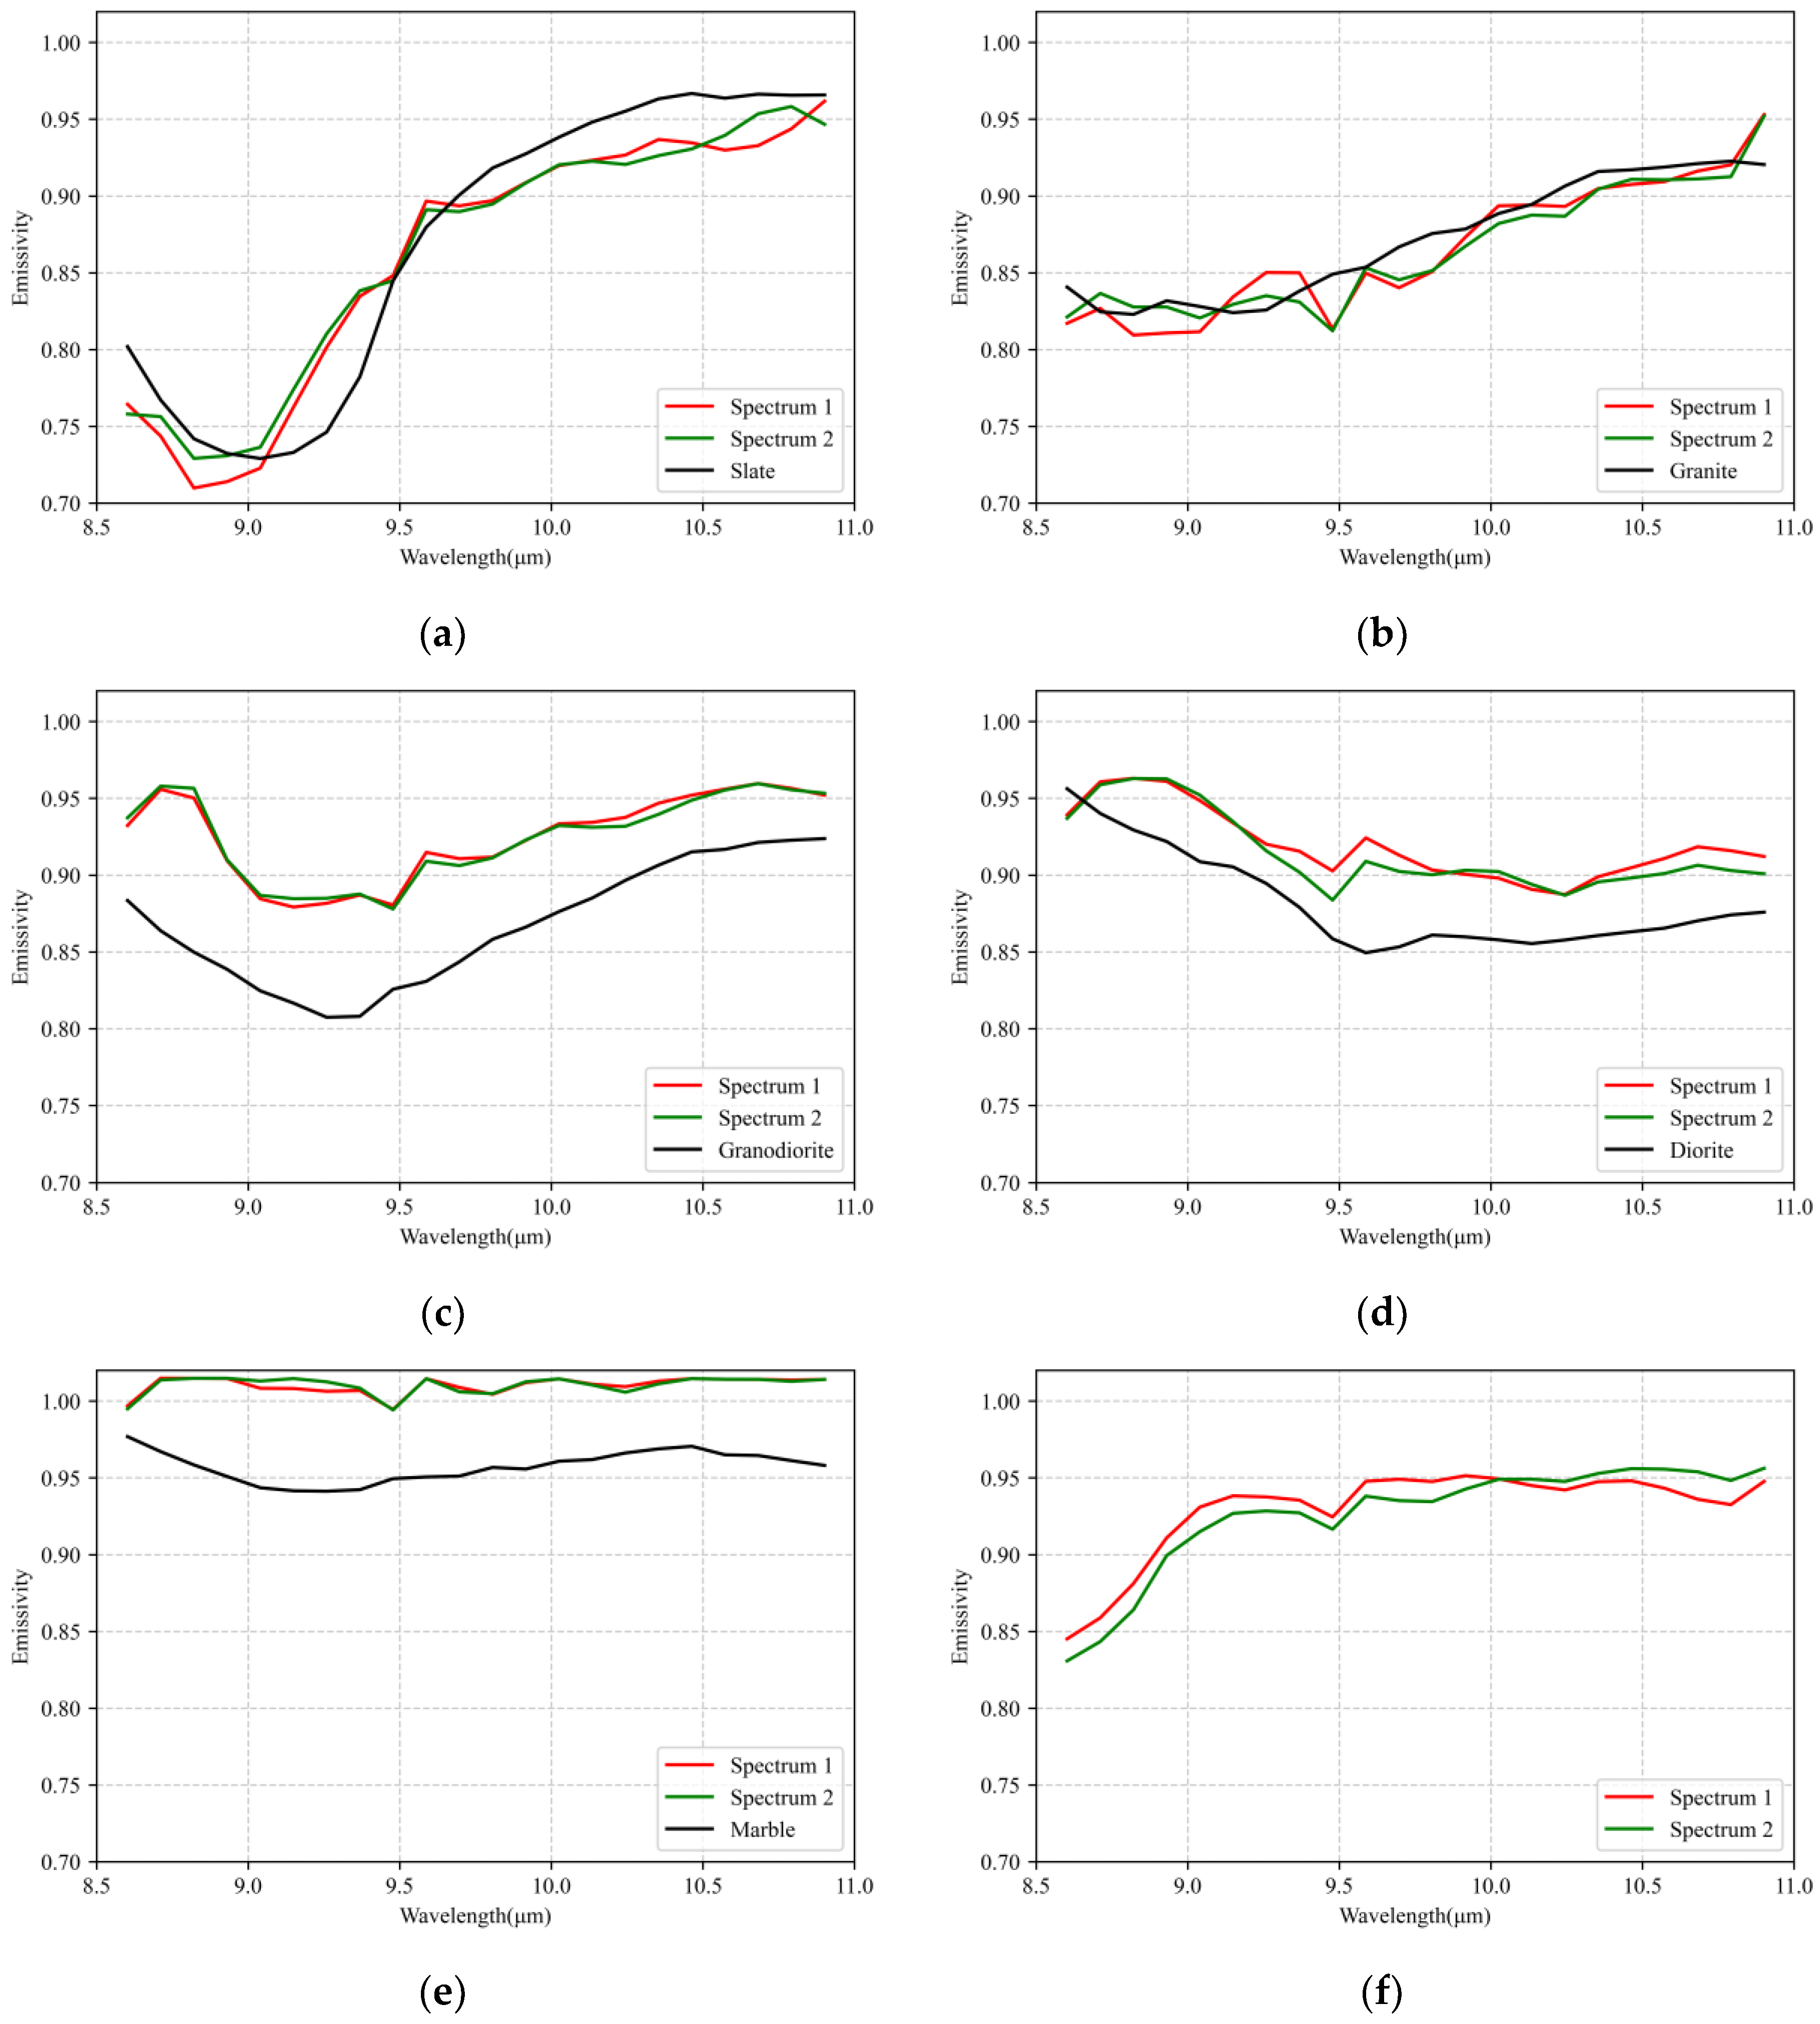
4.1.1. Multiple Spectra Extraction
4.1.2. Spectra Combination and Optimization
4.1.3. Lithological Type Identification
4.1.4. Sample Selection
| Algorithm 1 The sample selection using the abundance map |
| Input: Abundance map U (m, h, b), User defined given T |
| thresholds = [] |
| # Compute the cumulative pixel percentage of the histogram and determine thresholds. |
| For band in range(b): |
| histogram, bins = np.histogram(U[:, :, band].flatten(), bins = 255) |
| cumulative_pixel_percentage = np.cumsum((histogram/np.sum(histogram) * 100)) |
| indexes = np.argmax(cumulative_pixel_percentage >= T) |
| thresholds.append(bins[indexes]) |
| end for |
| # Pixels in U that are greater than or equal to the thresholds in each band are marked with the band index, otherwise they are marked as 0. |
| outputs_list = [] |
| For band in range(b): |
| outputs_list.append((U[:, :, band:band+1] >= thresholds[band]) * (band + 1)) |
| end for |
| Sband = np.concatenate(outputs_list, axis = −1) |
| # Combine pixels belonging to the same lithological type and obtain a labeled map for each lithological type. Next, show an example of the code to get Sclass1. |
| Sclass-1 = np.sum(Sband[:, :, i:i + map_width], axis = −1, keepdims = True) # i denotes the starting band in the Sband that belongs to a particular lithological type; map_width denotes how many bands in total belong to this lithological type. |
| Sclass1 [Sclass1 != 0] = Label # Label indicates the value of the type. |
| # Obtain the labeled map. |
| S = np.dstack((Sclass1, Sclass2, …, Sclassq)) # q indicates the number of lithological types. |
| # Remove multi-class pixels and reduce ambiguity. |
| multiple_values = np.sum(S != 0, axis = −1) > 1 |
| S[multiple_values] = 0 |
| S = np.sum(S, axis = −1) |
| Output: Labeled sample map S (m, h) |
4.2. Lithological Map Creation Models
- Two-dimensional convolutional neural network (2D-CNN)
- 2.
- Hybrid spectral CNN (HybridSN)
- 3.
- Multiscale residual network (MSRN)
- 4.
- Spectral-spatial residual network (SSRN)
- 5.
- Spectral partitioning residual network (SPRN)
5. Results
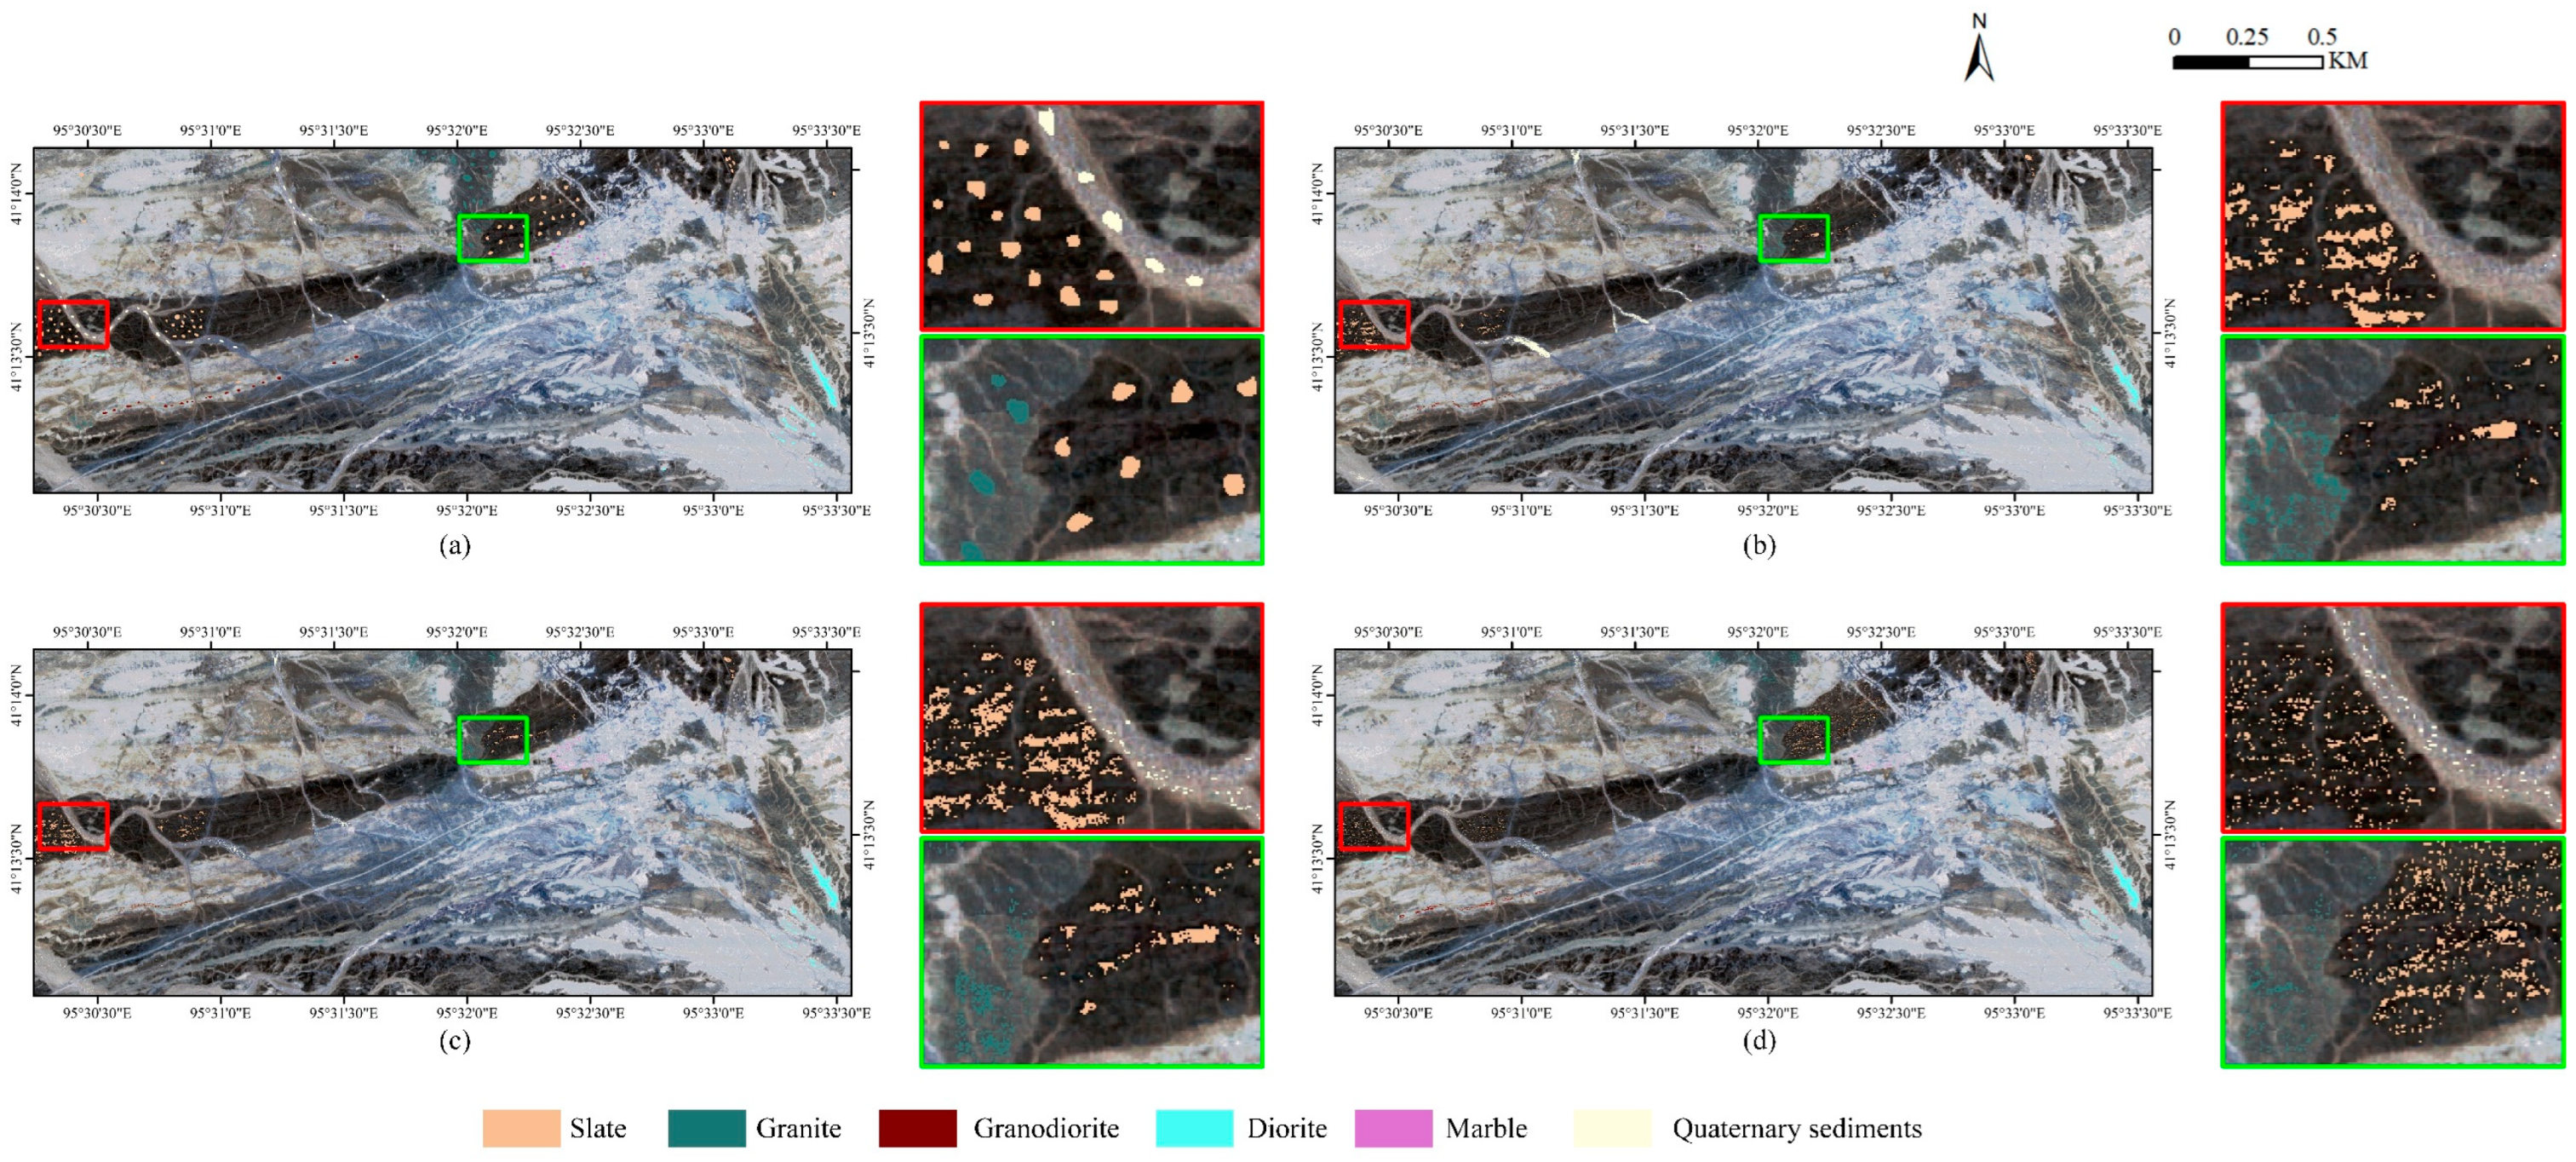
5.1. Sample Dataset Generation
5.2. Lithological Mapping Results of DLs
5.3. Comparison of Sample Collection Methods
- ROI: ROI selects patches from the image as samples based on user selection.
- Spectral angle mapping (SAM): SAM determines the samples by comparing the angle between the ground-measured spectra (used as the reference spectra) and the pixel spectra. Given that slate, granite, and diorite each have numerous field-measured spectra, selecting appropriate reference spectra becomes challenging. In our study, we have selected the measured spectra that exhibit the highest correlation with the image endmember spectra to ensure the greatest similarity between the reference spectra and the pixel spectra. Notably, the type of quaternary sediment lacks matching field-measured spectra, so its lithological endmember spectrum is used.
- Spectral unmixing (SU): SU extracts one spectrum for each lithology and uses FCLS to generate abundance maps. It utilizes the abundance map to select samples for each class.
6. Discussions
6.1. Sample Dataset Construction Algorithmic Considerations
6.2. DL Algorithmic Considerations
7. Conclusions
- (1)
- MLS3 considers the potential differences in spectra of the same lithology, reduces the influence of subjective factors, and achieves an overall accuracy of 2.25–6.96% higher than other sample collection methods. In general, MLS3 is designed to generate labeled samples in a more scientific and comprehensive manner.
- (2)
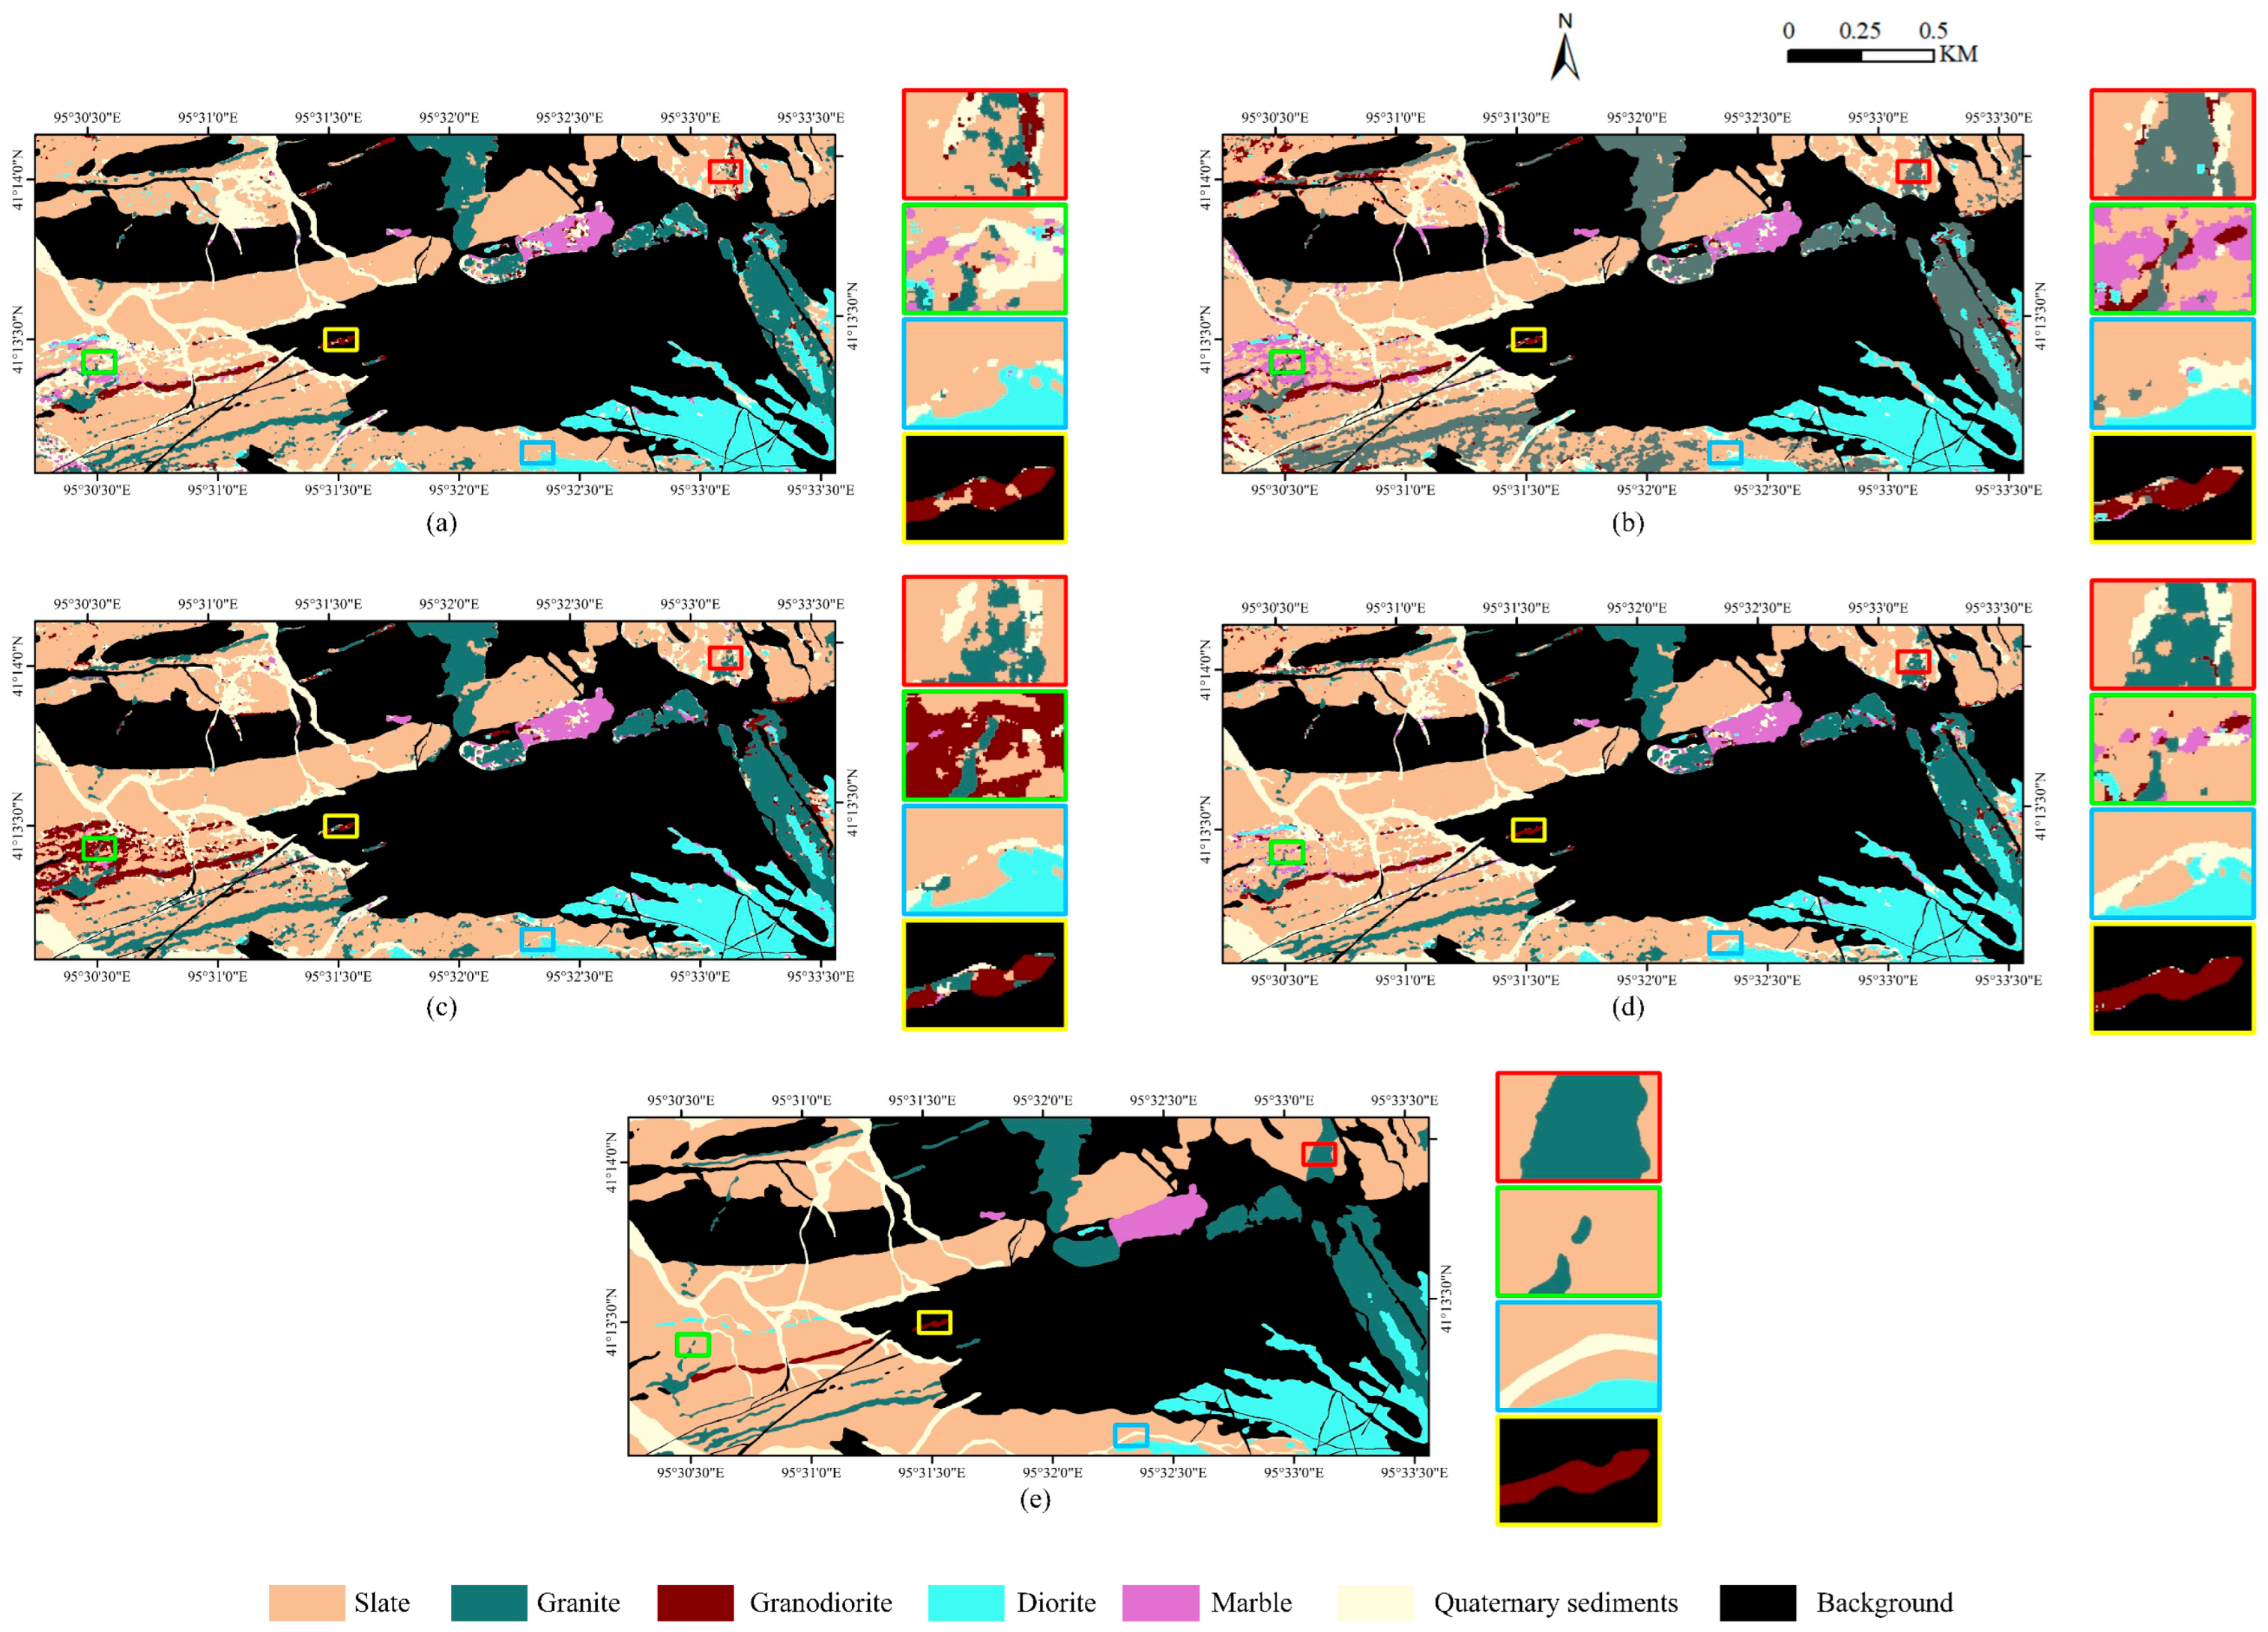
- MLS3 can be successfully applied to various DL models to enhance the performance of lithological mapping. Particularly, SPRN shows the best result compared to other CNN methods, with 84.03% for OA and 0.7416 for Kappa, respectively. SPRN improves the lithological mapping task due to its strong learning capabilities.
Author Contributions
Funding
Data Availability Statement
Acknowledgments
Conflicts of Interest
References
- El Fels, A.E.A.; El Ghorfi, M. Using Remote Sensing Data for Geological Mapping in Semi-Arid Environment: A Machine Learning Approach. Earth Sci. Inform. 2022, 15, 485–496. [Google Scholar] [CrossRef]
- Han, W.; Zhang, X.; Wang, Y.; Wang, L.; Huang, X.; Li, J.; Wang, S.; Chen, W.; Li, X.; Feng, R.; et al. A Survey of Machine Learning and Deep Learning in Remote Sensing of Geological Environment: Challenges, Advances, and Opportunities. ISPRS J. Photogramm. Remote Sens. 2023, 202, 87–113. [Google Scholar] [CrossRef]
- Shirmard, H.; Farahbakhsh, E.; Muller, R.D.; Chandra, R. A Review of Machine Learning in Processing Remote Sensing Data for Mineral Exploration. Remote Sens. Environ. 2022, 268, 112750. [Google Scholar] [CrossRef]
- Hosseinjani, M.; Tangestani, M.H. Mapping Alteration Minerals Using Sub-Pixel Unmixing of ASTER Data in the Sarduiyeh Area, SE Kerman, Iran. Int. J. Digit. Earth 2011, 4, 487–504. [Google Scholar] [CrossRef]
- Kodikara, G.R.L.; Woldai, T. Spectral Indices Derived, Non-Parametric Decision Tree Classification Approach to Lithological Mapping in the Lake Magadi Area, Kenya. Int. J. Digit. Earth 2018, 11, 1020–1038. [Google Scholar] [CrossRef]
- Peyghambari, S.; Zhang, Y. Hyperspectral Remote Sensing in Lithological Mapping, Mineral Exploration, and Environmental Geology: An Updated Review. J. Appl. Remote Sens. 2021, 15, 031501. [Google Scholar] [CrossRef]
- Tripathi, M.K.; Govil, H.; Chattoraj, S.L. Identification of Hydrothermal Altered/Weathered and Clay Minerals through Airborne AVIRIS-NG Hyperspectral Data in Jahajpur, India. Heliyon 2020, 6, e03487. [Google Scholar] [CrossRef] [PubMed]
- Raj, S.K.; Ahmed, S.A.; Srivatsav, S.K.; Gupta, P.K. Iron Oxides Mapping from E0-1 Hyperion Data. J. Geol. Soc. India 2015, 86, 717–725. [Google Scholar] [CrossRef]
- Ye, B.; Tian, S.; Cheng, Q.; Ge, Y. Application of Lithological Mapping Based on Advanced Hyperspectral Imager (AHSI) Imagery Onboard Gaofen-5 (GF-5) Satellite. Remote Sens. 2020, 12, 3990. [Google Scholar] [CrossRef]
- Shirmard, H.; Farahbakhsh, E.; Heidari, E.; Beiranvand Pour, A.; Pradhan, B.; Müller, D.; Chandra, R. A Comparative Study of Convolutional Neural Networks and Conventional Machine Learning Models for Lithological Mapping Using Remote Sensing Data. Remote Sens. 2022, 14, 819. [Google Scholar] [CrossRef]
- van der Meer, F.D.; van der Werff, H.M.A.; van Ruitenbeek, F.J.A.; Hecker, C.A.; Bakker, W.H.; Noomen, M.F.; van der Meijde, M.; Carranza, E.J.M.; de Smeth, J.B.; Woldai, T. Multi- and Hyperspectral Geologic Remote Sensing: A Review. Int. J. Appl. Earth Obs. Geoinf. 2012, 14, 112–128. [Google Scholar] [CrossRef]
- Raji, O.; Ouabid, M.; Bodinier, J.-L.; El Messbahi, H.; Malainine, C.E.; Tabbakh, Z. An Integrated Approach for Rapid Delineation of K-Rich Syenites Suitable as Unconventional Potash Resources. Nat. Resour. Res. 2021, 30, 3219–3239. [Google Scholar] [CrossRef]
- Zheng, S.; An, Y.; Shi, P.; Zhao, T. Mapping the Lithological Features and Ore-Controlling Structures Related to Ni-Cu Mineralization in the Eastern Tian Shan, NW China from ASTER Data. Remote Sens. 2021, 13, 206. [Google Scholar] [CrossRef]
- Ni, L.; Xu, H.; Zhou, X. Mineral Identification and Mapping by Synthesis of Hyperspectral VNIR/SWIR and Multispectral TIR Remotely Sensed Data with Different Classifiers. IEEE J. Sel. Top. Appl. Earth Obs. Remote Sens. 2020, 13, 3155–3163. [Google Scholar] [CrossRef]
- Aslett, Z.; Taranik, J.V.; Riley, D.N. Mapping Rock Forming Minerals at Boundary Canyon, Death Valey National Park, California, Using Aerial SEBASS Thermal Infrared Hyperspectral Image Data. Int. J. Appl. Earth Obs. Geoinf. 2018, 64, 326–339. [Google Scholar] [CrossRef]
- Black, M.; Riley, T.R.; Ferrier, G.; Fleming, A.H.; Fretwell, P.T. Automated Lithological Mapping Using Airborne Hyperspectral Thermal Infrared Data: A Case Study from Anchorage Island, Antarctica. Remote Sens. Environ. 2016, 176, 225–241. [Google Scholar] [CrossRef]
- Cui, J.; Yan, B.; Dong, X.; Zhang, S.; Zhang, J.; Tian, F.; Wang, R. Temperature and Emissivity Separation and Mineral Mapping Based on Airborne TASI Hyperspectral Thermal Infrared Data. Int. J. Appl. Earth Obs. Geoinf. 2015, 40, 19–28. [Google Scholar] [CrossRef]
- Chen, Y.; Dong, Y.; Wang, Y.; Zhang, F.; Liu, G.; Sun, P. Machine Learning Algorithms for Lithological Mapping Using Sentinel-2 and SRTM DEM in Highly Vegetated Areas. Front. Ecol. Evol. 2023, 11, 1250971. [Google Scholar] [CrossRef]
- Xi, J.; Jiang, Q.; Liu, H.; Gao, X. Lithological Mapping Research Based on Feature Selection Model of ReliefF-RF. Appl. Sci. 2023, 13, 11225. [Google Scholar] [CrossRef]
- Kumar, C.; Chatterjee, S.; Oommen, T.; Guha, A. Automated Lithological Mapping by Integrating Spectral Enhancement Techniques and Machine Learning Algorithms Using AVIRIS-NG Hyperspectral Data in Gold-Bearing Granite-Greenstone Rocks in Hutti, India. Int. J. Appl. Earth Obs. Geoinf. 2020, 86, 102006. [Google Scholar] [CrossRef]
- Othman, A.A.; Gloaguen, R. Integration of Spectral, Spatial and Morphometric Data into Lithological Mapping: A Comparison of Different Machine Learning Algorithms in the Kurdistan Region, NE Iraq. J. Asian Earth Sci. 2017, 146, 90–102. [Google Scholar] [CrossRef]
- Wang, X.; Zuo, R.; Wang, Z. Lithological Mapping Using a Convolutional Neural Network Based on Stream Sediment Geochemical Survey Data. Nat. Resour. Res. 2022, 31, 2397–2412. [Google Scholar] [CrossRef]
- Yu, J.; Zhang, L.; Li, Q.; Li, Y.; Huang, W.; Sun, Z.; Ma, Y.; He, P. 3D Autoencoder Algorithm for Lithological Mapping Using ZY-1 02D Hyperspectral Imagery: A Case Study of Liuyuan Region. J. Appl. Remote Sens. 2021, 15, 042610. [Google Scholar] [CrossRef]
- Pan, T.; Zuo, R.; Wang, Z. Geological Mapping via Convolutional Neural Network Based on Remote Sensing and Geochemical Survey Data in Vegetation Coverage Areas. IEEE J. Sel. Top. Appl. Earth Obs. Remote Sens. 2023, 16, 3485–3494. [Google Scholar] [CrossRef]
- Wang, Z.; Zuo, R.; Liu, H. Lithological Mapping Based on Fully Convolutional Network and Multi-Source Geological Data. Remote Sens. 2021, 13, 4860. [Google Scholar] [CrossRef]
- Han, W.; Li, J.; Wang, S.; Zhang, X.; Dong, Y.; Fan, R.; Zhang, X.; Wang, L. Geological Remote Sensing Interpretation Using Deep Learning Feature and an Adaptive Multisource Data Fusion Network. IEEE Trans. Geosci. Remote Sens. 2022, 60, 1–14. [Google Scholar] [CrossRef]
- Zhang, C.; Yi, M.; Ye, F.; Xu, Q.; Li, X.; Gan, Q. Application and Evaluation of Deep Neural Networks for Airborne Hyperspectral Remote Sensing Mineral Mapping: A Case Study of the Baiyanghe Uranium Deposit in Northwestern Xinjiang, China. Remote Sens. 2022, 14, 5122. [Google Scholar] [CrossRef]
- Jia, S.; Jiang, S.; Lin, Z.; Li, N.; Xu, M.; Yu, S. A Survey: Deep Learning for Hyperspectral Image Classification with Few Labeled Samples. Neurocomputing 2021, 448, 179–204. [Google Scholar] [CrossRef]
- Lin, C.; Guo, S.; Chen, J.; Sun, L.; Zheng, X.; Yang, Y.; Xiong, Y. Deep Learning Network Intensification for Preventing Noisy-Labeled Samples for Remote Sensing Classification. Remote Sens. 2021, 13, 1689. [Google Scholar] [CrossRef]
- Dong, Y.; Yang, Z.; Liu, Q.; Zuo, R.; Wang, Z. Fusion of GaoFen-5 and Sentinel-2B Data for Lithological Mapping Using Vision Transformer Dynamic Graph Convolutional Network. Int. J. Appl. Earth Obs. Geoinf. 2024, 129, 103780. [Google Scholar] [CrossRef]
- Cardoso-Fernandes, J.; Teodoro, A.C.; Lima, A.; Roda-Robles, E. Semi-Automatization of Support Vector Machines to Map Lithium (Li) Bearing Pegmatites. Remote Sens. 2020, 12, 2319. [Google Scholar] [CrossRef]
- Serbouti, I.; Raji, M.; Hakdaoui, M.; El Kamel, F.; Pradhan, B.; Gite, S.; Alamri, A.; Maulud, K.N.A.; Dikshit, A. Improved Lithological Map of Large Complex Semi-Arid Regions Using Spectral and Textural Datasets within Google Earth Engine and Fused Machine Learning Multi-Classifiers. Remote Sens. 2022, 14, 5498. [Google Scholar] [CrossRef]
- Abrams, M.; Yamaguchi, Y. Twenty Years of ASTER Contributions to Lithologic Mapping and Mineral Exploration. Remote Sens. 2019, 11, 1394. [Google Scholar] [CrossRef]
- Clabaut, É.; Lemelin, M.; Germain, M.; Williamson, M.-C.; Brassard, É. A Deep Learning Approach to the Detection of Gossans in the Canadian Arctic. Remote Sens. 2020, 12, 3123. [Google Scholar] [CrossRef]
- Pal, M.; Rasmussen, T.; Porwal, A. Optimized Lithological Mapping from Multispectral and Hyperspectral Remote Sensing Images Using Fused Multi-Classifiers. Remote Sens. 2020, 12, 177. [Google Scholar] [CrossRef]
- Lin, N.; Fu, J.; Jiang, R.; Li, G.; Yang, Q. Lithological Classification by Hyperspectral Images Based on a Two-Layer XGBoost Model, Combined with a Greedy Algorithm. Remote Sens. 2023, 15, 3764. [Google Scholar] [CrossRef]
- Li, C.; Tian, S.; Li, S.; Yin, M. Temperature and Emissivity Separation via Sparse Representation with Thermal Airborne Hyperspectral Imager Data. J. Appl. Remote Sens. 2016, 10, 042003. [Google Scholar] [CrossRef]
- Liu, H.; Wu, K.; Xu, H.; Xu, Y. Lithology Classification Using TASI Thermal Infrared Hyperspectral Data with Convolutional Neural Networks. Remote Sens. 2021, 13, 3117. [Google Scholar] [CrossRef]
- Gillespie, A.; Rokugawa, S.; Matsunaga, T.; Cothern, J.S.; Hook, S.; Kahle, A.B. A Temperature and Emissivity Separation Algorithm for Advanced Spaceborne Thermal Emission and Reflection Radiometer (ASTER) Images. IEEE Trans. Geosci. Remote Sens. 1998, 36, 1113–1126. [Google Scholar] [CrossRef]
- Cui, J.; Yan, B.; Wang, R.; Tian, F.; Zhao, Y.; Liu, D.; Yang, S.; Shen, W. Regional-Scale Mineral Mapping Using ASTER VNIR/SWIR Data and Validation of Reflectance and Mineral Map Products Using Airborne Hyperspectral CASI/SASI Data. Int. J. Appl. Earth Obs. Geoinf. 2014, 33, 127–141. [Google Scholar] [CrossRef]
- Wang, C.; Du, Z.; Yu, X.; Li, Y.; Lv, X.; Sun, H.; Du, Y. 1:50 000 Mineral Geological Map Database of the Huaniushan Map-Sheet, Gansu. Geol. China 2019, 46, 55–65. [Google Scholar] [CrossRef]
- Li, H.; Wu, K.; Xu, Y. An Integrated Change Detection Method Based on Spectral Unmixing and the CNN for Hyperspectral Imagery. Remote Sens. 2022, 14, 2523. [Google Scholar] [CrossRef]
- Bioucas-Dias, J.M.; Nascimento, J.M.P. Hyperspectral Subspace Identification. IEEE Trans. Geosci. Remote Sens. 2008, 46, 2435–2445. [Google Scholar] [CrossRef]
- Gruninger, J.H.; Ratkowski, A.J.; Hoke, M.L. The Sequential Maximum Angle Convex Cone (SMACC) Endmember Model. In Proceedings of the Algorithms and Technologies for Multispectral, Hyperspectral, and Ultraspectral Imagery X, SPIE, Orlando, FL, USA, 12 August 2004; Volume 5425, pp. 1–14. [Google Scholar]
- Jain, A.K.; Dubes, R.C. Algorithms for Clustering Data; Prentice-Hall, Inc.: Upper Saddle River, NJ, USA, 1988; ISBN 978-0-13-022278-7. [Google Scholar]
- Dennison, P.E.; Roberts, D.A. Endmember Selection for Multiple Endmember Spectral Mixture Analysis Using Endmember Average RMSE. Remote Sens. Environ. 2003, 87, 123–135. [Google Scholar] [CrossRef]
- Quintano, C.; Fernández-Manso, A.; Roberts, D.A. Multiple Endmember Spectral Mixture Analysis (MESMA) to Map Burn Severity Levels from Landsat Images in Mediterranean Countries. Remote Sens. Environ. 2013, 136, 76–88. [Google Scholar] [CrossRef]
- Kruse, F.A.; Lefkoff, A.B.; Boardman, J.W.; Heidebrecht, K.B.; Shapiro, A.T.; Barloon, P.J.; Goetz, A.F.H. The Spectral Image Processing System (SIPS)—Interactive Visualization and Analysis of Imaging Spectrometer Data. Remote Sens. Environ. 1993, 44, 145–163. [Google Scholar] [CrossRef]
- Jain, R.; Sharma, R.U. Airborne Hyperspectral Data for Mineral Mapping in Southeastern Rajasthan, India. Int. J. Appl. Earth Obs. Geoinf. 2019, 81, 137–145. [Google Scholar] [CrossRef]
- Heinz, D.; Chang, C.-I.; Althouse, M.L.G. Fully Constrained Least-Squares Based Linear Unmixing. In Proceedings of the IEEE 1999 International Geoscience and Remote Sensing Symposium. IGARSS’99 (Cat. No.99CH36293), Hamburg, Germany, 28 June –2 July 1999; Volume 2, pp. 1401–1403. [Google Scholar]
- Heylen, R.; Burazerovic, D.; Scheunders, P. Fully Constrained Least Squares Spectral Unmixing by Simplex Projection. IEEE Trans. Geosci. Remote Sens. 2011, 49, 4112–4122. [Google Scholar] [CrossRef]
- Roy, S.K.; Krishna, G.; Dubey, S.R.; Chaudhuri, B.B. HybridSN: Exploring 3-D–2-D CNN Feature Hierarchy for Hyperspectral Image Classification. IEEE Geosci. Remote Sens. Lett. 2020, 17, 277–281. [Google Scholar] [CrossRef]
- Gao, H.; Yang, Y.; Li, C.; Gao, L.; Zhang, B. Multiscale Residual Network with Mixed Depthwise Convolution for Hyperspectral Image Classification. IEEE Trans. Geosci. Remote Sens. 2021, 59, 3396–3408. [Google Scholar] [CrossRef]
- Zhong, Z.; Li, J.; Luo, Z.; Chapman, M. Spectral-Spatial Residual Network for Hyperspectral Image Classification: A 3-D Deep Learning Framework. IEEE Trans. Geosci. Remote Sens. 2018, 56, 847–858. [Google Scholar] [CrossRef]
- Zhang, X.; Shang, S.; Tang, X.; Feng, J.; Jiao, L. Spectral Partitioning Residual Network with Spatial Attention Mechanism for Hyperspectral Image Classification. IEEE Trans. Geosci. Remote Sens. 2022, 60, 1–14. [Google Scholar] [CrossRef]
- He, X.; Chen, Y. Transferring CNN Ensemble for Hyperspectral Image Classification. IEEE Geosci. Remote. Sens. Lett. 2021, 18, 876–880. [Google Scholar] [CrossRef]
- Masarczyk, W.; Głomb, P.; Grabowski, B.; Ostaszewski, M. Effective Training of Deep Convolutional Neural Networks for Hyperspectral Image Classification through Artificial Labeling. Remote Sens. 2020, 12, 2653. [Google Scholar] [CrossRef]
- Kale, K.V.; Solankar, M.M.; Nalawade, D.B.; Dhumal, R.K.; Gite, H.R. A Research Review on Hyperspectral Data Processing and Analysis Algorithms. Proc. Natl. Acad. Sci. India Sect. A Phys. Sci. 2017, 87, 541–555. [Google Scholar] [CrossRef]
- Paoletti, M.E.; Haut, J.M.; Plaza, J.; Plaza, A. Deep Learning Classifiers for Hyperspectral Imaging: A Review. ISPRS J. Photogramm. Remote Sens. 2019, 158, 279–317. [Google Scholar] [CrossRef]
- Yu, L.; Peng, J.; Chen, N.; Sun, W.; Du, Q. Two-Branch Deeper Graph Convolutional Network for Hyperspectral Image Classification. IEEE Trans. Geosci. Remote Sens. 2023, 61, 1–14. [Google Scholar] [CrossRef]
- Ding:, K.; Lu, T.; Fu, W.; Li, S.; Ma, F. Global-Local Transformer Network for HSI and LiDAR Data Joint Classification. IEEE Trans. Geosci. Remote Sens. 2022, 60, 1–13. [Google Scholar] [CrossRef]





| Lithologies | Training Set | Validation Set | Test Set |
|---|---|---|---|
| Slate | 2676 | 892 | 893 |
| Granite | 1909 | 636 | 637 |
| Granodiorite | 409 | 136 | 138 |
| Diorite | 1734 | 578 | 579 |
| Marble | 303 | 101 | 101 |
| Quaternary sediments | 1077 | 359 | 360 |
| Total | 8108 | 2702 | 2708 |
| Lithologies | 2D-CNN | HybridSN | MSRN | SSRN | SPRN | |||||
|---|---|---|---|---|---|---|---|---|---|---|
| PA | UA | PA | UA | PA | UA | PA | UA | PA | UA | |
| Slate | 67.56 | 89.86 | 72.21 | 92.22 | 76.92 | 93.51 | 83.28 | 93.70 | 83.25 | 95.27 |
| Granite | 65.70 | 74.41 | 75.46 | 63.56 | 78.35 | 71.12 | 75.34 | 81.58 | 79.17 | 82.98 |
| Granodiorite | 57.35 | 18.92 | 63.67 | 19.03 | 81.31 | 24.01 | 80.15 | 31.51 | 93.68 | 31.65 |
| Diorite | 78.54 | 66.93 | 77.08 | 83.68 | 83.06 | 86.75 | 89.91 | 90.44 | 94.43 | 87.90 |
| Marble | 73.98 | 22.38 | 77.51 | 39.08 | 81.26 | 42.24 | 85.79 | 50.60 | 84.98 | 58.39 |
| Quaternary sediments | 74.56 | 38.63 | 77.85 | 43.51 | 80.76 | 49.15 | 82.49 | 52.22 | 84.77 | 54.19 |
| OA | 69.14 | 73.81 | 78.27 | 82.69 | 84.03 | |||||
| Kappa | 0.5331 | 0.5947 | 0.6573 | 0.7179 | 0.7416 | |||||
| Lithologies | ROI | SAM | SU | MLS3 |
|---|---|---|---|---|
| Slate | 4461 | 3502 | 4181 | 4461 |
| Granite | 3182 | 1794 | 4305 | 3182 |
| Granodiorite | 683 | 463 | 699 | 683 |
| Diorite | 2891 | 2413 | 2888 | 2891 |
| Marble | 505 | 131 | 539 | 505 |
| Quaternary sediments | 1796 | 3437 | 1743 | 1796 |
| Total | 13,518 | 11,740 | 14,355 | 13,518 |
| Lithologies | ROI | SAM | SU | MLS3 | ||||
|---|---|---|---|---|---|---|---|---|
| PA | UA | PA | UA | PA | UA | PA | UA | |
| Slate | 83.64 | 92.33 | 73.70 | 94.45 | 79.01 | 94.61 | 83.25 | 95.27 |
| Granite | 72.14 | 82.77 | 82.79 | 64.96 | 78.74 | 74.76 | 79.17 | 82.98 |
| Granodiorite | 89.68 | 32.46 | 89.29 | 20.35 | 89.97 | 12.43 | 93.68 | 31.65 |
| Diorite | 94.16 | 84.11 | 95.28 | 85.86 | 92.28 | 90.25 | 94.43 | 87.90 |
| Marble | 71.02 | 54.10 | 79.19 | 38.56 | 82.15 | 66.60 | 84.98 | 58.39 |
| Quaternary sediments | 73.84 | 49.58 | 68.25 | 50.08 | 81.29 | 56.26 | 84.77 | 54.19 |
| OA | 81.78 | 77.07 | 80.70 | 84.03 | ||||
| Kappa | 0.7003 | 0.6455 | 0.6946 | 0.7416 | ||||
Disclaimer/Publisher’s Note: The statements, opinions and data contained in all publications are solely those of the individual author(s) and contributor(s) and not of MDPI and/or the editor(s). MDPI and/or the editor(s) disclaim responsibility for any injury to people or property resulting from any ideas, methods, instructions or products referred to in the content. |
© 2024 by the authors. Licensee MDPI, Basel, Switzerland. This article is an open access article distributed under the terms and conditions of the Creative Commons Attribution (CC BY) license (https://creativecommons.org/licenses/by/4.0/).
Share and Cite
Liu, H.; Wu, K.; Zhou, D.; Xu, Y. A Novel Sample Generation Method for Deep Learning Lithological Mapping with Airborne TASI Hyperspectral Data in Northern Liuyuan, Gansu, China. Remote Sens. 2024, 16, 2852. https://doi.org/10.3390/rs16152852
Liu H, Wu K, Zhou D, Xu Y. A Novel Sample Generation Method for Deep Learning Lithological Mapping with Airborne TASI Hyperspectral Data in Northern Liuyuan, Gansu, China. Remote Sensing. 2024; 16(15):2852. https://doi.org/10.3390/rs16152852
Chicago/Turabian StyleLiu, Huize, Ke Wu, Dandan Zhou, and Ying Xu. 2024. "A Novel Sample Generation Method for Deep Learning Lithological Mapping with Airborne TASI Hyperspectral Data in Northern Liuyuan, Gansu, China" Remote Sensing 16, no. 15: 2852. https://doi.org/10.3390/rs16152852
APA StyleLiu, H., Wu, K., Zhou, D., & Xu, Y. (2024). A Novel Sample Generation Method for Deep Learning Lithological Mapping with Airborne TASI Hyperspectral Data in Northern Liuyuan, Gansu, China. Remote Sensing, 16(15), 2852. https://doi.org/10.3390/rs16152852


