Abstract
Efforts to identify suitable habitat for wildlife conservation are crucial for safeguarding biodiversity, facilitating management, and promoting sustainable coexistence between wildlife and communities. Our study focuses on identifying potential black rhino (Diceros bicornis) habitat within the Ngorongoro Conservation Area (NCA), Tanzania, across wet and dry seasons. To achieve this, we used remote sensing data with and without field data. We employed a comprehensive approach integrating Sentinel-2 and PlanetScope images, vegetation indices, and human activity data. We employed machine learning recursive feature elimination (RFE) and random forest (RF) algorithms to identify the most relevant features that contribute to habitat suitability prediction. Approximately 36% of the NCA is suitable for black rhinos throughout the year; however, there are seasonal shifts in habitat suitability. Anthropogenic factors increase land degradation and limit habitat suitability, but this depends on the season. This study found a higher influence of human-related factors during the wet season, with suitable habitat covering 53.6% of the NCA. In the dry season, browse availability decreases and rhinos are forced to become less selective of the areas where they move to fulfil their nutritional requirements, with anthropogenic pressures becoming less important. Furthermore, our study identified specific areas within the NCA that consistently offer suitable habitat across wet and dry seasons. These areas, situated between Olmoti and the Crater, exhibit minimal disturbance from human activities, presenting favourable conditions for rhinos. Although the Oldupai Gorge only has small suitable patches, it used to sustain a large population of rhinos in the 1960s. Land cover changes seem to have decreased the suitability of the Gorge. This study highlights the importance of combining field data with remotely sensed data. Remote sensing-based assessments rely on the importance of vegetation covers as a proxy for habitat and often overlook crucial field variables such as shelter or breeding locations. Overall, our study sheds light on the imperative of identifying suitable habitat for black rhinos within the NCA and underscores the urgency of intensified conservation efforts. Our findings underscore the need for adaptive conservation strategies to reverse land degradation and safeguard black rhino populations in this dynamic multiple land-use landscape as environmental and anthropogenic pressures evolve.
1. Introduction
The conservation and management of critically endangered species is an urgent priority due to escalating threats to biodiversity worldwide. To promote recovery, it is essential to manage a species under the ecological carrying capacity (ECC) and understand habitat requirements and the factors influencing animal distribution [1,2]. These requirements comprise a range of ecological factors, including food availability, water sources, breeding areas, and shelter [3,4]. Additionally, understanding these parameters provides valuable insights for land-use planning, protected area establishment, and the creation of wildlife corridors [2]. Such measures promote gene flow, reduce habitat fragmentation, and facilitate movement between suitable habitats, which are vital for the genetic diversity and viability of wildlife populations [2,5]. By identifying and preserving areas that fulfil population requirements, conservation efforts can focus on targeting strategies that maintain or restore degraded critical habitats to ensure species recovery.
The black rhino is a critically endangered species with a global population of circa 5630 individuals, approximately 1000 of which are Eastern black rhinos (D. b. michaeli), mostly in Kenya and Tanzania [2,6]. They are generally solitary or form small family groups, reaching sexual maturity at around 5–7 years with a lifespan of approximately 35–40 years [7,8]. Black rhinos are selective browsers, generally preferring the woody species found in savannah and bushveld areas [2]. They can browse up to 220 species of plants, but a great portion of their diets relies on three or four plant species, making their diets less diverse than the species available [9,10,11]. Although the primary threat to the black rhino is poaching—driven by a high demand for rhino horn—habitat loss from deforestation, livestock grazing, human settlement development, and agricultural expansion lead to land degradation and pose an increasing threat to rhino populations [12,13]. Habitat degradation and loss also increases intra-species competition for limited resources, further exacerbating the population’s vulnerability to external pressures [14]. Additionally, black rhinos have the highest mortality from intra-sexual competition of any mammal, which is one of the key indicators (combined with declining inter-calving intervals) of the ECC being exceeded [15,16,17].
The Ngorongoro Conservation Area (NCA) in Tanzania serves as a stronghold for the Eastern black rhino, hosting approximately 30% (161 individuals) of the country’s total population [5]. In recent years, increased anti-poaching patrols and monitoring in the NCA have allowed the black rhino population to reach 55 individuals [5]. Given this recent population growth, it is essential to identify habitat areas capable of supporting a growing rhino population [5,18]. By pinpointing these areas, conservation efforts can prioritise their protection and that of the rhinos’ preferred habitat, thus promoting a favourable environment for black rhino conservation [19,20].
Seasonal shifts significantly impact plant growth and availability, influencing the nutritional content and abundance of preferred browse for black rhinos [9,19,21]. During the dry season, the reduction in green browse prompts rhinos to seek areas with higher browse density or to adapt their movement patterns to find alternative food sources, and therefore, investigating seasonal patterns becomes crucial in evaluating habitat suitability [9,19,21].
Black rhinos avoid areas of human activity, such as settlements and roads [22]. In 2022/2023, the NCA received over 752,232 visitors, with recent (for 2023/2024) numbers approaching one million (NCAA, 2023). This growth has generated substantial economic revenue and facilitated extensive infrastructure growth, but also led to higher rates of disturbance in and around the Crater [23]. The Maasai community residing in the NCA also increased from approximately 8000 people in 1959 to nearly 100,000 by 2018 [24,25]. Alongside this demographic expansion, the estimated livestock population associated with the community surpassed 800,000 in 2018 [24,25]. The combination of these factors provides a unique opportunity to study how human disturbances impact black rhino habitat suitability.
Species distribution models (SDMs) combine species occurrences with spatial data based on environmental and ecological variables of a given geographic area to predict species distributions [26]. SDMs are widely used in invasive species management, climate change impact assessment, habitat restoration, ecological research, land use planning, and wildlife management [27,28,29,30,31,32]. SDMs can provide information to facilitate efficient conservation management by pinpointing key habitats, potential migration corridors, and areas that require increased protection [29,33]. For instance, [34] showed how combining SDMs with dispersal scenarios could provide valuable information regarding the potential habitat expansion of large carnivores. Hybrid models combining SDMs with population dynamics have also been used in Canada to identify essential habitat areas for the Ord’s kangaroo rat (Dipodomys ordii [35]).
Previous conservation efforts for black rhinos have focused on establishing protected areas and increasing security using anti-poaching patrols and fencing [36]. However, habitat quality and food availability are equally important factors that need to be considered to sustain and promote population growth [9,37,38]. Within this framework, the overarching aim of this research is to provide the NCA management with accurate data to support black rhino population expansion and conservation. We do this by providing answers to the following research questions: (i) how does seasonal variability impact habitat suitability for the black rhino; (ii) how do human disturbances impact habitat suitability; and (iii) in the absence of field data, can theoretical models be used to predict habitat suitability?
2. Study Area
The NCA is a protected area located in northern Tanzania. During the wet season, temperatures fluctuate between 7.5 °C and 14.5 °C, while in the dry season, they range from 10.6 °C to 19.6 °C [39]. Rainfall demonstrates distinct patterns featuring two wet seasons from March to May and October to December, as well as two dry seasons from January to February and June to October [40]. Annual rainfall varies from 450 mm/year in lowlands to 1200 mm/year in the highlands [41]. The NCA boundary was adapted from [41] and a 2 km buffer was added (Figure 1).
The NCA includes diverse vegetation types, including highland grassland plains, open canopy woodland, closed canopy forests, and savannah grasslands (Figure 1; [42,43,44]). The vegetation suitable for grazing is essential for wildlife but also Maasai livestock that either reside within or are passing through the NCA [45]. The NCA has an open border policy that allows grazing livestock for resident and non-resident Maasai; however, the Northern Highland Forest Reserve and the Crater floor are restricted areas [45].
The evolution of management policies over time has often resulted in disagreements between communities and the Ngorongoro Conservation Area Authority [39,41]. For example, the decision to ease restrictions on cultivation resulted in a rise in cultivated areas [41,46,47]. The conversion of land to cultivation fields creates environmental pressures through vegetation changes and habitat patchiness [48,49]. Additionally, a fire ban implemented in 1976 contributed to shrub growth and the spread of invasive plant species as there was no vegetation control other than herbivory [39,47]. For rhinos, the absence of fire and shrub growth positively impacts habitat, but for cattle the effect is the opposite [45,50]. Shrub growth and the spread of invasive unpalatable species decreases suitable pasture so the pastoralists resort to cultivation to sustain their households [45]. A shift from traditional pastoral systems to cultivation, combined with an increase in human population, could cause land degradation and be detrimental to the ecosystem in the long-term [37,47].
The NCA has undergone significant habitat changes, particularly experiencing forest loss and woody encroachment [44]. While some of these changes may be natural, driven by herbivory, rainfall, and vegetation succession, many are attributed to human activities, including management policies, tourism development, and the expanding human population and livestock [37].
With regard to rhino populations, in 1966, the Crater and Oldupai Gorge areas within the NCA (Figure 1) supported 108 and 69 rhinos, respectively [8]. By 1993, poaching had reduced the rhino population to 13 individuals [5]. More recently, a relatively high population rate of growth has been reported, leading to the current total of 55 animals as of 2018 [5].

Figure 1.
(A) True colour composite (RGB) of a Landsat image with the zoomed in areas of interest (A1,A2); (B) Topography of the study area (ESRI World Hillshade); (C) Land cover classification of the study area for the year 2020 [44] and zoomed in areas of interest (C1,C2).
Figure 1.
(A) True colour composite (RGB) of a Landsat image with the zoomed in areas of interest (A1,A2); (B) Topography of the study area (ESRI World Hillshade); (C) Land cover classification of the study area for the year 2020 [44] and zoomed in areas of interest (C1,C2).

3. Datasets and Methods
Field data on the presence/absence of animal species are invaluable for habitat suitability modelling. However, it is often the case that conducting fieldwork is not feasible as it is labour-intensive, requires expertise on the ground, is time-consuming, and expensive. We mapped rhino habitat suitability in the NCA with and without field data on rhino presence and compared the outcomes to assess whether a theoretical habitat suitability model can be used without field data. The Crater was included in the analysis but was filtered out from the maps for safety reasons for the resident rhinos.
To model habitat suitability with field data, we first assumed that areas currently used by rhinos are suitable and used satellite imagery to identify other suitable areas beyond their current range. We employed a comprehensive approach integrating Sentinel-2 (10 m, European Space Agency’s (ESA) Copernicus Programme) and PlanetScope (4.7 m, Planet Team, 2022) images, vegetation indices and human activity data (https://www.nbs.go.tz/”, accessed on 2 June 2023; Google Earth Pro (v. 7.3.6.9326, [51]). We employed machine learning recursive feature elimination (RFE) and random forest (RF) algorithms to identify the most relevant features (Table 3) that contribute to habitat suitability prediction [52,53,54]. RFE systematically evaluates different combinations of features and eliminates the least significant ones, reducing model complexity [54]. The model was trained with point location presence and pseudo-absence data collected in the field. To assess the effect of seasonal variability on habitat suitability, we used satellite data from both the dry and the wet seasons and assessed them separately. In the NCA, human presence has been suggested as a possible driver of rhino distribution [37,55]. To investigate how humans and livestock impact habitat suitability, we ran RFE and RF with two versions of the human activity data: one with the current situation and a simplified one with all settlements and livestock removed and some of the roads (only tourism-related roads were kept). The output was four suitability maps: one for each season, the current human activity data, and the simplified less intense version.
To map habitat suitability without field data, we employed fuzzy logic using land cover data scored according to their ability to fulfil rhino diet requirements (bushland and shrubland) and human disturbances, using both the current situation as well as the simplified, less intense version [22,42,56]. Fuzzy logic analysis is widely used in predictive modelling to map habitat suitability [57,58,59,60]. The fuzzy approach assigns a probability score to classes identifying the ranges between boundaries of each class and can be employed in the absence of field data [61,62]. The output was two suitability maps: one with the current human activity data and one with the simplified one.
3.1. Datasets
3.1.1. Sentinel-2
We used all Sentinel 2 images (10 m) acquired over the study area between 1 March 2022 and 30 September 2022 with less than 75% cloud cover. Level 2 images were processed into analysis-ready data products using the Framework for Operational Radiometric Correction for Environmental monitoring (FORCE) software version v.3.7 [63], following the approach and parameters detailed in the work by Borges et al. 2020 [42].
Finally, we calculated 14 vegetation indices (VIs, Table 1) employed in vegetation studies to detect habitat types. These were then added to the Sentinel-2 spectral bands. Different vegetation indices have their own nuances and strengths, making them valuable tools for accurately mapping various types of land cover. For instance, VIs such as the Normalised Difference Vegetation Index (NDVI), Green Normalised Difference Vegetation Index (GNDVI), and Enhanced Vegetation Index (EVI) are commonly used to assess general vegetation health and density across various habitats, including forests, grasslands, and savannas [64,65,66]. Water-related indices, such as the Modified Normalised Difference Water Index (MNDWI) and Normalised Difference Water Index (NDWI), highlight wetlands and other water-abundant areas, indicating habitats that support lush vegetation critical for rhinos, especially during the dry season [67,68].

Table 1.
List of vegetation indices calculated from the Sentinel-2 spectral bands to be tested using the recursive feature elimination procedure. R—Red; G—Green; B—Blue; NIR—Near-infrared; WIR1—Shortwave Infrared 1; RE1—Red Edge 1; RE2—Red Edge 2.
3.1.2. Planet Scope
Planet data were extracted from the Planet Labs Public Benefit Corporation (PBC) database for the dry (October 2022) and the wet season (March 2022) at a spatial resolution of 4.7 m (Planet Team, 2022). Adding the Planet data to the analysis enhances the spatial resolution (from 10 m to 4.7 m), facilitating the distinction of spectrally similar habitats [77].
3.1.3. Human Activity
Settlement data were incorporated in the habitat suitability analysis, including the location of villages, towns, tourism infrastructure, and any other building identifiable in the high-resolution Google imagery (CNES/Airbus, Figure S1). The initial settlement data from the 2012 Population and Housing Census were extracted from the Tanzania National Bureau of Statistics database (“https://www.nbs.go.tz/”, accessed on 2 June 2023) and updated using Google Earth Pro (v. 7.3.6.9326) to account for changes since the initial census.
In protected areas, black rhinos are known to avoid areas frequented by humans, namely those surrounding lodges, camping sites, or roads due to disturbances [22]. This behaviour has been suggested in the NCA as a possible driver of rhino distribution [37,55,78]. To establish how settlements impact habitat suitability, a new simplified settlement layer was created, including the lodges and ranger stations and excluded villages (Figure S2). The settlements that border the Northern Highland Forest Reserve, below Mount Oldeani (Figure S2), were also kept as they part of Karatu town and were included in the original boundary and its buffer [41].
We created the road network data via manual digitisation over Airbus imagery acquired between 2016 and 2022 using Google Earth Pro (v. 7.3.6.9326, [51]). We identified all existing main roads used for tourism as well as smaller roads used by the local population to reach villages and towns (Figure S1). To assess the effect of roads on habitat suitability, we also developed a simplified road dataset (Figure S2), which included only tourism-related roads, as these roads are expected to continue being used in the foreseeable future.
Finally, the livestock presence/absence data were created based on current NCA policies—livestock is permitted anywhere except in the Ngorongoro Crater and the Northern Highland Forest Reserve [39]. For the reduced activity version, livestock was removed from all the NCA. Overall, the reduced human activity version excluded villages, non-tourist roads and livestock.
The human activity layers (settlements, roads, and livestock) were treated as presence or absence data for each variable. The predictive model employed the “real” comprehensive dataset, while the simplified version employed the same model but applied to the simplified dataset.
3.1.4. Land Cover Layer
The land cover layer we used in our modelling came from our previous work in the area [42]: this dataset was based on Sentinel 1 and Sentinel 2 data from the dry and short-dry seasons and comprises nine land cover classes at a 10 m resolution (overall accuracy of 86.3 ± 1.5%). For black rhinos in the NCA, bushland and shrubland are highly relevant land cover classes due to their high browse availability, which is easy to access. These habitats also provide essential shelter and access to water sources. Woodland is also significant as it offers browse, shelter, and water sources, albeit to a slightly lesser extent compared to bushland and shrubland. In contrast, while forests have abundant foliage, much of it is often out of reach for rhinos, which diminishes their suitability as primary habitats.
3.1.5. Rhino Presence Data
The training samples were collected between March and September 2023 to cover wet and dry seasons, excluding the short-dry season (January to February) and the second wet season (October–December, [40,42]). The locations comprised areas known to be frequented by rhinos (following monitoring teams’ advice), areas where direct observations occurred or rhino signs were found (e.g., bites in plants, dung piles, tracks). A total of 272 samples were collected: 109 presence and 163 pseudo-absences. Of these 272, there were 39 collected in shrubland, 128 in grassland, 40 in woodland, 21 in forest, and 44 in bushland. Each data point comprised 30 m diameter circular plots collected randomly on the ground. As there are only 55 rhinos (2018), presence data were established through the identification of direct signs, such as rhino sightings, and indirect signs, like bites on vegetation (black rhino bites have a distinct sharp-cut edge at a 45° angle), tracks, or dung [5]. Pseudo-absence data were collected in areas where no sightings of black rhinos were recorded by the NCA monitoring team over the years. Pseudo-absence data were randomly collected in areas that exhibited comparable conditions in terms of vegetation composition, geography, water presence, etc., known to be suitable for black rhinos [79,80].
3.2. Methods
3.2.1. Recursive Feature Elimination
We used recursive feature elimination [54] in R language (v. 4.3.1) to identify the optimal band combination for the highest accuracy out of the 31 available bands (10 Sentinel-2, 14 VIs, 4 PlanetScope, 3 human disturbance) for the two distinct seasons. The random forest algorithm, embedded in RFE, is an efficient non-parametric machine learning model based on ensembles of regression trees, commonly used for image classification and land cover mapping [81,82,83].
Each season had its training data and 80% of them were allocated to train the model, with the remaining 20% left aside for validation. RFE systematically evaluates different combinations of bands by eliminating the least significant bands and assessing their impact on model performance [54]. This approach helps identify the most informative bands for accurate classification of the habitat [84]. The RFE process was conducted separately for the dry and wet seasons to determine the best band combination for each season. Validation was then performed, and the prediction maps were produced for each season using the best band combinations identified through the RFE using the raster package in R.
3.2.2. Fuzzy Analysis
To assess rhino habitat suitability, each land cover type was assigned a score based on available information on habitat use in the NCA (Table 2, [56]). The scoring system ranged from 0.0 to 1.0 (Table 2), with 0.0 representing unsuitable habitat and 1.0 representing highly suitable habitat, as suggested by Gwynn (2022; [58]), for the allocation of fuzzy membership scores.
Table 2.
Suitability score for each land cover type considering the black rhino biological requirements in the NCA.
We applied fuzzy logic to develop scored maps based on land cover types expected to fulfil rhino food requirements and the distribution of human disturbances with the aim of identifying areas that were expected to be suitable [22,42,56]. Fuzzy membership (linear) was applied separately to the current and simplified versions of the roads and settlements datasets, generating suitability maps for each variable. Distances from the roads or settlements between 0 km and 2.5 km were scored as unsuitable (=0), while distances over or equal to 2.5 km were assigned a value of 1.0 (i.e., suitable). These values were based on expert knowledge and corroborated by the presence data during the fieldwork. The categorical land cover data were reclassified according to Table 2, followed by the fuzzy membership steps described above. Finally, fuzzy overlaying was employed, and the three outputs were added together to create the habitat suitability map without field data.
4. Results
4.1. Habitat Suitability Using Field Data
The best combination for predicting black rhino habitat suitability in the wet season (Table 3) included 11 layers (four spectral bands, four indices, and three anthropogenic layers) and achieved an accuracy of approximately 76.2%. For the dry season, the best data combination comprised 13 predictors (nine spectral bands, three indices, and one anthropogenic layers) and achieved an accuracy of 88.2%.
Table 3.
Recursive feature elimination results showing the best combination of layers for suitability mapping for both seasons.
Based on these models, the NCA has approximately 3377 km2 (36.9%) of potentially suitable habitat for the black rhino during the wet season (Figure 2A). Similarly, during the dry season, the suitable habitat covers approximately 3263 km2 (35.6%) of the NCA. The area that remains suitable through both seasons covers 1912 km2. This includes the Ngorongoro Crater (NC), which has been filtered out at the request of the Ngorongoro Conservation Area Authority (NCAA) to ensure animal safety. The Serengeti plains, west of the NCA, are suitable mostly during the wet season but there are also areas that can support black rhino presence throughout the year (Figure 2A). The Oldupai Gorge is mostly unsuitable except for a few patches during the dry season and around the Gorge during the wet season (Figure 2(A1,B1)). The area between Olmoti Crater and the NC (Figure 2(A2,B2)) remains suitable for the black rhino throughout both seasons.
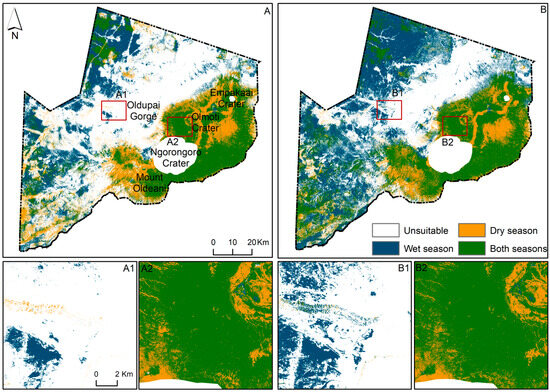
Figure 2.
Suitable habitat based on rhino presence/absence data with current human disturbances (A); and with simplified human disturbances (B). (A1,A2,B1,B2) are example subsets. The Ngorongoro Crater has been removed for safety reasons.
Under simplified human disturbances, the suitable area during solely the wet season increases by 1526.5 km2 (16.7%) covering 4903 km2 (53.6%) of the entire area (Figure 2B). During the dry season, the NCA remains almost unchanged, covering approximately 3344 km2 (35.5%) once the human disturbances are simplified (Figure 2B). The area that remains suitable through both seasons improved by 312 km2, covering 2224 km2. The Oldupai Gorge and surrounding area becomes more suitable once human disturbances are simplified during the wet season (Figure 2(B1)). The area between Olmoti Crater and the NC is suitable for the black rhino under both seasons (Figure 2(B2)).
4.2. Habitat Suitability without Field Data
When comparing the models, the model with field data shows results that are contrary to the model without field data. The suitability maps of the fuzzy membership analysis show woody vegetation areas as dark green (>90% suitability, Figure 3A). Most of the NCA, including the Serengeti plains and the NC, is comprised of open grasslands with little or no vegetation and is classified as unsuitable (<27% suitability, Figure 3A). When human disturbances are reduced, the suitable area increases throughout (Figure 3B). The Oldupai Gorge and highlands between the NC and Olmoti Crater also become more suitable (Figure 3(A1,A2,B1,B2)), but overall remain less suitable when compared to Figure 2.

Figure 3.
Suitable habitat based only on remote sensing data with current human disturbances (A); and with simplified human disturbances (B). (A1,A2,B1,B2) are example subsets. The Ngorongoro Crater has been removed for safety reasons.
5. Discussion
Identifying optimal suitable habitat is paramount for targeted conservation efforts, to halt land degradation, safeguard biodiversity, and promote sustainable coexistence between wildlife and communities [2]. In the context of critically endangered species, such as the black rhino, it becomes increasingly important to detect key habitat that can support growing populations [2,5]. Here, we identified potential black rhino habitat, for the wet and dry seasons, and assessed how human activities impact habitat quality within the NCA.
5.1. Seasonal Differences
Our results show that, when mapping habitat, dry season data produce higher accuracy (88.2%) than during the wet season (76.2%). Dry season data are often preferred due to the lower cloud cover and higher contrasts between grass and woody plants [84,85]. Additionally, dry season availability is the key population limiting factor from an ecological perspective, because if it can sustain rhinos in the dry season, then it will also be able to in the wet season [86,87].
There are also differences between the best combination of data for each season (Table 3). For instance, during the dry season, the spectral bands are more relevant than anthropogenic factors when mapping suitability (Table 3). The natural seasonal shifts can explain this, as the decrease in browse availability may force the animals to frequent areas with different vegetation [88,89]. During the wet season, when plenty of browse is available, the anthropogenic factors (roads, settlements, and livestock presence) become more important in identifying suitable habitat as the availability of more food often means that the rhinos can be more selective (Table 3).
During the dry season potentially suitable habitat for black rhino covers 35.6% (3263 km2) of the NCA (Figure 2A). However, in context of conservation, it is essential to account for seasonal changes as wildlife is often confined to protected areas and unable to migrate long distances [88,89]. Surprisingly, the suitable area was only 1.4% higher (114 km2) during the wet season than the dry season (Figure 2B). This is unexpected given that rhino diet in the Ngorongoro Crater during the wet season is composed mostly of herbs, forbs, and legumes, which tend to disappear or dry up during the dry season [55,56]. In the NCA, bushland cover often includes palatable browse, water resources, and shelter, and is therefore suitable for rhinos [43,44,56]. Most of the bushland cover on the rim of the Crater is comprised of evergreen species and we may expect fewer seasonal changes (Figure 2, [42,43]).
The Serengeti plains, west of the NCA, are suitable mostly during the wet season but become unsuitable as the season changes (Figure 2A). This shift in suitability is expected as the vegetation comprises seasonal species that lose their leaves or die during the dry season [43]. The area surrounding Oldupai Gorge remains mostly unsuitable throughout both seasons except for a few patches (Figure 2(A1)). In the 1960s, the Gorge supported a population of 69 black rhinos [8]. Compared to the Crater population, these individuals probably occupied larger home ranges to fulfil the nutritional requirements, suggesting that the vegetation was already less desirable than in the Crater [8]. In addition, in recent decades, the Oldupai Gorge has experienced changes in vegetation, specifically the loss of woody cover [44]. Land cover changes impact vegetation composition and likely contribute to the disappearance of the black rhino population from the Oldupai area.
Historically, the Gorge was part of a corridor between the NCA and the Serengeti National Park and, considering that rhinos used to inhabit this area, the suitability of the Serengeti and Oldupai plains (Figure 2A) should be further investigated with the aim of restoring connectivity between protect areas.
5.2. Anthropogenic Factors
Anthropogenic activities profoundly influence wildlife habitats, often leading to land degradation and posing significant challenges to the conservation of endangered species such as rhinos [2,22]. One of the main drivers for rhino distribution is browse availability; however, areas with adequate browse may be deemed unsuitable due to anthropogenic factors [90]. In Namibia, for example, human presence has been linked to an increase in calf mortality due to limited movement patterns, home range establishment, social structure, resource selection, and habitat use by black rhinos [90,91]. As such, human disturbances should be considered when identifying areas that could support a black rhino population. Our findings support previous studies suggesting that human activities are major drivers in rhino location and habitat stability but there are seasonal variations [8,19,22,92].
We used a categorical threshold (below/above 2.5 km from the nearest road/settlement) as an index of human disturbances for its simplicity, interpretability, and practical utility for conservation efforts. This approach ensures a robust analysis despite data limitations and provides clear guidelines for management decisions. During the wet season, our analysis pinpointed roads as the predominant predictor of rhino habitat suitability, with the location of settlements and livestock presence also playing a role (Table 3). Once human activities are removed from the model, there is an apparent increase (16.7%) in suitable habitat and 53.6% of the NCA becomes suitable (Figure 2B). Conversely, the dry season presents a contrasting scenario, wherein limited browse resources, due to seasonal shifts, reduce the importance of human disturbances (Table 3, Figure 2B). Settlements, however, continue to play a role but to a lesser extent than that observed during the wet season (Table 3).
Rainfall variability between the wet and dry seasons is closely linked to vegetation growth and rainfall, impacting browse availability for large herbivores in arid and semi-arid environments [93]. During the wet season, due to higher rainfall, there is a higher availability of browse, so rhinos can afford to seek alternative areas with reduced human disturbance [8,90,93]. When the dry season arrives and browse is limited, rhinos are forced to become less selective and frequent different areas (e.g., nearer the roads) in order to fulfil their nutrient requirements [8,90,93].
5.3. Habitat Suitability with and without Field Data
Over small protected areas, field-based mapping provides essential information on the dynamics of savannah vegetation structure and distribution. However, in larger areas, techniques are time-consuming, expensive, and inefficient [94,95]. Earth Observation data are increasingly used to identify and monitor habitat cover and its characteristics, and even in the absence of ground data, they still provide important information [96,97,98]. Black rhinos can survive in a wide range of habitats, including marsh areas, forests, and even deserts, and browse availability is a driver of their distribution and habitat preference [20,56,99,100,101]. However, the highest densities of black rhinos occur in savannah areas and bushvelds, mainly due to the higher availability of woody species [2]. Our results show that areas with higher bushland cover, namely the Highland Forest reserve, NC rim, and between Olmoti Crater and the NC, are the most suitable areas to sustain a black rhino population (Figure 3(A2,B2)), in agreement with Figure 2(A2,B2). These areas have an abundance of browse and are located away from human activities and, as seen in Figure 2A,B, removing these from the model positively impacts habitat suitability (Figure 3A,B).
SDMs that integrate field-collected data with remotely sensed data have been shown to improve model accuracy [102,103]. Using only remote sensing data often overpredicts species distributions due to landscape-level similarities [102,103]. Accurate habitat suitability mapping becomes increasingly important when considering endangered species threatened by land degradation [29,33]. Within the NCA, when comparing the models in areas like the Oldupai Gorge area and the Serengeti plains, the model with field data (Figure 2A) shows results that are contrary to the model without field data (Figure 3A). The Oldupai Gorge is classified as a suitable habitat as it comprises woodland and shrubland cover (Figure 3(A1), Table 2). Additionally, areas such as the Serengeti plains, primarily grasslands, appear unsuitable (white, Figure 3A) due to lower woody cover with little to no feeding value for rhinos [7]. Grassland scored zero because black rhino diets comprise woody plant species (Table 2, [7,9,10]). However, the NCA black rhino population is unique in that, for safety reasons, they spend a significant amount of time on the Crater floor, which is mostly grassland, feeding on herbs or sleeping [8,56]. Without field data, the Gorge and the Serengeti plains would have been misidentified, potentially posing significant threats to the NCA’s long-term rhino population growth. To enhance the accuracy of our findings, it is imperative to combine field data with remotely sensed data. Remote sensing heavily relies on theoretical data that favour browse availability and often overlook crucial field variables such as shelter locations. These locations may not necessarily offer the best browsing conditions and may incorrectly be classified as unsuitable, despite their essential role in rhino conservation. Therefore, integrating approaches that combine field data with remotely sensed data ensures more precise and reliable results in habitat suitability assessments.
5.4. Limitations
Our study utilised remote sensing data in conjunction with field data to identify potential black rhino habitats within the NCA. While remote sensing provides extensive spatial and temporal coverage, it has inherent limitations that must be acknowledged [104,105]. For instance, the spatial resolution may not be sufficient to detect smaller habitat patches that are crucial for rhino conservation. The resolution of freely available remote sensing data, such as Sentinel-2 (10 m), remains one of the main constraints. Other datasets, such as Pléiades at 0.5 m (Airbus Defence and Space) or Satellite pour l’Observation de la Terre (SPOT) at 1.5 m (European Space Agency), offer much higher resolution, but the costs associated with acquiring these data are significantly higher.
Additionally, temporal resolution, or the frequency of data acquisition, both remote sensing and field work, can affect the accuracy of habitat suitability models, especially in dynamic environments wherein conditions change rapidly [106]. Our field season lasted 7 months, covering both wet and dry seasons, which is comprehensive but may still miss certain temporal dynamics.
Integrating additional environmental layers, such as detailed soil data and precise water availability metrics, into our SDMs may ensure a more comprehensive assessment of habitat suitability by addressing factors beyond vegetation covers [106]. For instance, black rhinos are water-dependent, and mapping water availability in the Ngorongoro Conservation Area (NCA) is particularly challenging due to difficulties in distinguishing between saltwater (e.g., Lake Magadi in the Ngorongoro Crater) and freshwater sources. Having precise water availability data would be crucial for accurately identifying suitable habitats for rhinos.
Lastly, this study is focused on the Ngorongoro Conservation Area, which may limit the applicability of findings to other rhino habitats, and extrapolation to different regions may require caution. However, our methods can be replicated in other locations, which would provide more site-specific information.
6. Conclusions
Despite an increase in rhino numbers, there is emerging research that shows a decline in the quality and quantity of browse in the NCA, and consequently a decrease in suitable habitat for black rhinos [5,39,44]. If there is an increase in competition for resources, rhinos may be driven out of the Crater to potentially dangerous areas; therefore, there is an urgent need to identify suitable areas that can support an increasing black rhino population [5]. Approximately 36% of the NCA is suitable for black rhinos throughout the year (Figure 2A). Currently, the rhinos are mostly located in the Ngorongoro Crater, but there are areas outside the Crater that could potentially support future populations. Anthropological factors impact habitat suitability, but this depends on the season (Figure 2A,B). During the wet season, when the influence of human factors are reduced, habitat suitability increases to 53.6% which agrees with previous research (Figure 2, [88,89]). However, in the dry season, browse availability decreases and rhinos become less selective of areas where they move to fulfil their nutritional requirements, with anthropological pressures becoming less important (Figure 2, [88,89]).
Our study also identified areas that are consistently suitable throughout seasons and not severely impacted by human factors, such as between the Olmoti and Ngorongoro Craters (Figure 2(A2,B2)). In recent decades, the area experienced a decrease in forest cover, and increase in bushland and the vegetation has not been surveyed since the 1960s [43,44,56]. Since bushland is associated with browse availability, areas such between the Olmoti and Ngorongoro Craters are likely to contain suitable browse. Contrastingly, the Oldupai Gorge currently only supports suitable small patches (Figure 2(A1)), even though it housed a large population of rhinos in the 1960s [8]. Land cover changes, namely encroachment and spread of invasive species, seem to have decreased the suitability of the Gorge, but the area should be studied further before being deemed unsuitable. Ultimately, areas that are deemed suitable for rhinos require increased security and detailed vegetation surveys to detect the presence or absence of the browse preferred by rhinos. Areas that are deemed unsuitable should be surveyed more thoroughly, particularly if in the past they used to be occupied by black rhinos.
Supplementary Materials
The following supporting information can be downloaded at: https://www.mdpi.com/article/10.3390/rs16152855/s1, Figure S1: Current roads and settlements in the NCA; Figure S2: Reduced roads (only tourist roads) and reduced settlements (only lodges and ranger facilities and buffer areas near Karatu).
Author Contributions
Conceptualisation, J.B., E.S. and T.P.H.; methodology J.B., E.S. and T.P.H.; validation, J.B., A.K. and D.M.; formal analysis, J.B.; data curation, J.B. and O.O.; writing—original draft preparation, J.B., E.S., T.P.H., M.J. and B.C.; writing—review and editing, J.B., E.S., T.P.H., M.J., B.C., A.K., D.M. and A.L.L.; supervision, E.S., M.J., B.C., A.K., D.M. and A.L.L.; project administration, E.S., M.J. and A.L.L.; funding acquisition, J.B. and A.L.L. All authors have read and agreed to the published version of the manuscript.
Funding
This work was supported by the U.S. Fish and Wildlife Service [F21AP03326, 2023]; Foundation Lucie Burgers for Comparative Behaviour Research, Arnhem, The Netherlands.
Data Availability Statement
Remote sensing data will available but the presence data are confidential.
Conflicts of Interest
Author Thomas P. Higginbottom was employed by the company Airbus Defense and Space. The remaining authors declare that the research was conducted in the absence of any commercial or financial relationships that could be construed as a potential conflict of interest
References
- Boyce, M.S.; Johnson, C.J.; Merrill, E.H.; Nielsen, S.E.; Solberg, E.J.; van Moorter, B. REVIEW: Can Habitat Selection Predict Abundance? J. Anim. Ecol. 2016, 85, 11–20. [Google Scholar] [CrossRef] [PubMed]
- Emslie, R. Diceros Bicornis. The IUCN Red List of Threatened Species 2020: E.T6557A152728945. Available online: https://www.iucnredlist.org/species/6557/152728945 (accessed on 2 September 2021).
- Freeman, E.W.; Meyer, J.M.; Bird, J.; Adendorff, J.; Schulte, B.A.; Santymire, R.M. Impacts of Environmental Pressures on the Reproductive Physiology of Subpopulations of Black Rhinoceros (Diceros Bicornis Bicornis) in Addo Elephant National Park, South Africa. Conserv. Physiol. 2014, 2, cot034. [Google Scholar] [CrossRef] [PubMed]
- Tatman, S.C.; Stevens-Wood, B.; Smith, V.B.T. Ranging Behaviour and Habitat Usage in Black Rhinoceros, Diceros Bicornis, in a Kenyan Sanctuary. Afr. J. Ecol. 2000, 38, 163–172. [Google Scholar] [CrossRef]
- Kohi, E.M.; Lobora, A.L. Conservation and Management Plan for Black Rhino in Tanzania 2019–2023, 4th ed.; TAWIRI: Arusha, Tanzania, 2019. [Google Scholar]
- Knight, M. African Rhino Specialist Group Report/Rapport Du Groupe de Spécialistes Du Rhinocéros d’Afrique. Pachyderm 2019, 60, 14–39. [Google Scholar]
- Emslie, R.H.; Adcock, K. Feeding Ecology of the Black Rhinoceros. In Proceedings of the a Symposium on Rhinos as Game Ranch Animal, Wildlife Group of the South African Veterinary Association, Onderstepoort, South Africa, 9–10 September 1994; pp. 65–81. [Google Scholar]
- Goddard, J. Home Range, Behaviour and Recruitment Rates of Two Black Rhinoceros Populations. Afr. J. Ecol. 1967, 5, 133–150. [Google Scholar] [CrossRef]
- Buk, K.G.; Knight, M.H. Seasonal Diet Preferences of Black Rhinoceros in Three Arid South African National Parks. Afr. J. Ecol. 2010, 48, 1064–1075. [Google Scholar] [CrossRef]
- Ganqa, N.M.; Scogings, P.F.; Raats, J.G. Diet Selection and Forage Quality Factors Affecting Woody Plant Selection by Black Rhinoceros in the Great Fish River Reserve, South Africa. S. Afr. J. Wildl. Res. 2005, 35, 77–83. [Google Scholar]
- Leader-Williams, N. Black Rhino in South Luangwa National Park: Their Distribution and Future Protection. Oryx 1985, 19, 27–33. [Google Scholar] [CrossRef]
- Chanyandura, A.; Muposhi, V.K.; Gandiwa, E.; Muboko, N. An Analysis of Threats, Strategies, and Opportunities for African Rhinoceros Conservation. Ecol. Evol. 2021, 11, 5892–5910. [Google Scholar] [CrossRef]
- Leader-Williams, N. Regulation and Protection: Successes and Failures in Rhinoceros Conservation. In The Trade in Wildlife; Routledge: London, UK, 2002; ISBN 978-1-84977-393-5. [Google Scholar]
- Landman, M.; Schoeman, D.S.; Kerley, G.I.H. Shift in Black Rhinoceros Diet in the Presence of Elephant: Evidence for Competition? PLoS ONE 2013, 8, 8. [Google Scholar] [CrossRef]
- Berger, J. Science, Conservation and Black Rhinos. J. Mammal. 1994, 75, 298–308. [Google Scholar] [CrossRef]
- Okita-Ouma, B. Population Performance of Black Rhinoceros (Diceros Bicornis Michaeli) in Six Kenyan Rhino Sanctuaries. Master’s Thesis, University of Kent, Canterbury, UK, 2004. [Google Scholar]
- Okita-Ouma, B.; Pettifor, R.; Clauss, M.; Prins, H.H.T. Effect of High Population Density of Eastern Black Rhinoceros, a Mega-Browser, on the Quality of Its Diet. Afr. J. Ecol. 2021, 59, 826–841. [Google Scholar] [CrossRef]
- Emslie, R.; Brooks, M. African Rhino. Status Survey and Conservation Action Plan; IUCN: Gland, Switzerland; Cambridge, UK, 1999; pp. 1–102. [Google Scholar]
- Buk, K.G.; Knight, M.H. Habitat Suitability Model for Black Rhinoceros in Augrabies Falls National Park, South Africa. S. Afr. J. Wildl. Res. 2012, 42, 82–93. [Google Scholar] [CrossRef]
- Lush, L.; Mulama, M.; Jones, M. Predicting the Habitat Usage of African Black Rhinoceros (Diceros Bicornis) Using Random Forest Models. Afr. J. Ecol. 2015, 53, 346–354. [Google Scholar] [CrossRef]
- Cerling, T.E.; Andanje, S.A.; Gakuya, F.; Kariuki, J.M.; Kariuki, L.; Kingoo, J.W.; Khayale, C.; Lekolool, I.; Macharia, A.N.; Anderson, C.R.; et al. Stable Isotope Ecology of Black Rhinos (Diceros Bicornis) in Kenya. Oecologia 2018, 187, 1095–1105. [Google Scholar] [CrossRef]
- Muntifering, J.R.; Linklater, W.L.; Naidoo, R.; Uri-Khob, S.; du Preez, P.; Beytell, P.; Jacobs, S.; Knight, A.T. Black Rhinoceros Avoidance of Tourist Infrastructure and Activity: Planning and Managing for Coexistence. Oryx 2021, 55, 150–159. [Google Scholar] [CrossRef]
- Harris, W.; de Kort, S.; Bettridge, C.; Borges, J.; Cain, B.; Hamadi; Dulle, I.; Fyumagwa, R.; Gadiye, D.; Jones, M.; et al. A Learning Network Approach to Resolve Conservation Challenges in the Ngorongoro Conservation Area. Afr. J. Ecol. 2020, 59, 326–331. [Google Scholar] [CrossRef]
- Lyimo, E.; Kohi, E.; Maliti, H.; Kimaro, J.; Mwita, M.; Kija, H. Population Trends in the Ngorongoro Conservation Area since 1995 to 2018; Tanzania Wildlife Research Institute: Arusha, Tanzania, 2020. [Google Scholar]
- Manzano, P.; Yamat, L. Livestock Sector in the Ngorongoro District: Analysis, Shortcomings and Options for Improvement; Famine Early Warning Systems Network: Washington, DC, USA, 2018. [Google Scholar]
- Elith, J.; Graham, C.H.; Anderson, R.P.; Dudík, M.; Ferrier, S.; Guisan, A.; Hijmans, R.J.; Huettmann, F.; Leathwick, J.R.; Lehmann, A.; et al. Novel Methods Improve Prediction of Species’ Distributions from Occurrence Data. Ecography 2006, 29, 129–151. [Google Scholar] [CrossRef]
- Araújo, M.B.; New, M. Ensemble Forecasting of Species Distributions. Trends Ecol. Evol. 2007, 22, 42–47. [Google Scholar] [CrossRef]
- Guisan, A.; Tingley, R.; Baumgartner, J.B.; Naujokaitis-Lewis, I.; Sutcliffe, P.R.; Tulloch, A.I.T.; Regan, T.J.; Brotons, L.; McDonald-Madden, E.; Mantyka-Pringle, C.; et al. Predicting Species Distributions for Conservation Decisions. Ecol. Lett. 2013, 16, 1424–1435. [Google Scholar] [CrossRef]
- Guisan, A.; Thuiller, W. Predicting Species Distribution: Offering More than Simple Habitat Models. Ecol. Lett. 2005, 8, 993–1009. [Google Scholar] [CrossRef] [PubMed]
- Guisan, A.; Zimmermann, N.E. Predictive Habitat Distribution Models in Ecology. Ecol. Model. 2000, 135, 147–186. [Google Scholar] [CrossRef]
- Kramer-Schadt, S.; Niedballa, J.; Pilgrim, J.D.; Schröder, B.; Lindenborn, J.; Reinfelder, V.; Stillfried, M.; Heckmann, I.; Scharf, A.K.; Augeri, D.M.; et al. The Importance of Correcting for Sampling Bias in MaxEnt Species Distribution Models. Divers. Distrib. 2013, 19, 1366–1379. [Google Scholar] [CrossRef]
- Peterson, A.T.; Papeş, M.; Soberón, J. Rethinking Receiver Operating Characteristic Analysis Applications in Ecological Niche Modeling. Ecol. Model. 2008, 213, 63–72. [Google Scholar] [CrossRef]
- Elith, J.; Leathwick, J.R. Species Distribution Models: Ecological Explanation and Prediction Across Space and Time. Annu. Rev. Ecol. Evol. Syst. 2009, 40, 677–697. [Google Scholar] [CrossRef]
- Pratzer, M.; Nill, L.; Kuemmerle, T.; Zurell, D.; Fandos, G. Large Carnivore Range Expansion in Iberia in Relation to Different Scenarios of Permeability of Human-Dominated Landscapes. Divers. Distrib. 2023, 29, 75–88. [Google Scholar] [CrossRef]
- Heinrichs, J.A.; Bender, D.J.; Gummer, D.L.; Schumaker, N.H. Assessing Critical Habitat: Evaluating the Relative Contribution of Habitats to Population Persistence. Biol. Conserv. 2010, 143, 2229–2237. [Google Scholar] [CrossRef]
- Brett, R.A. Conservation Strategy and Management Plan for the Black Rhinoceros (Diceros Bicornis) in Kenya; Kenya Wildlife Service: Nairobi, Kenya, 1993. [Google Scholar]
- Mills, A.; Morkel, P.; Runyoro, V.; Amiyo, A.; Muruthi, P.; Borner, M.; Thirgood, S. (PDF) Management of Black Rhino in the Ngorongoro Crater; Ngorongoro Conservation Area Authority, African Wildlife Foundation, Frankfurt Zoological Society: Arusha, Tanzania, 2003. [Google Scholar]
- Muya, S.M.; Oguge, N.O. Effects of Browse Availability and Quality on Black Rhino (Diceros Bicornis Michaeli) Diet in Nairobi National Park, Kenya. Afr. J. Ecol. 2000, 38, 62–71. [Google Scholar] [CrossRef]
- Amiyo, T.A. Ngorongoro Crater Rangelands: Condition, Management and Monitoring. Master’ s Thesis, University of Kwazulu-Natal, Durban, South Africa, 2006. [Google Scholar]
- Hunter, F.D.L.; Mitchard, E.T.A.; Tyrrell, P.; Russell, S. Inter-Seasonal Time Series Imagery Enhances Classification Accuracy of Grazing Resource and Land Degradation Maps in a Savanna Ecosystem. Remote Sens. 2020, 12, 198. [Google Scholar] [CrossRef]
- Boone, R.B.; Galvin, K.A.; Thornton, P.K.; Swift, D.M.; Coughenour, M.B. Cultivation and Conservation in Ngorongoro Conservation Area, Tanzania. Hum. Ecol. 2006, 34, 809–828. [Google Scholar] [CrossRef]
- Borges, J.; Higginbottom, T.P.; Symeonakis, E.; Jones, M. Sentinel-1 and Sentinel-2 Data for Savannah Land Cover Mapping: Optimising the Combination of Sensors and Seasons. Remote Sens. 2020, 12, 3862. [Google Scholar] [CrossRef]
- Herlocker, D.J.; Dirschl, H.J. Vegetation of the Ngorongoro Conservation Area, Tanzania; Canadian Wildlife Service: Ottawa, ON, Canada, 1972. [Google Scholar]
- Borges, J.; Higginbottom, T.P.; Cain, B.; Gadiye, D.E.; Kisingo, A.; Jones, M.; Symeonakis, E. Landsat Time Series Reveal Forest Loss and Woody Encroachment in the Ngorongoro Conservation Area, Tanzania. Remote Sens. Ecol. Conserv. 2022, 8, 808–826. [Google Scholar] [CrossRef]
- Swanson, L.A. Ngorongoro Conservation Area: Spring of Life; Master of Environmental Studies Capstone Projects; University of Pennsylvania: Philadelphia, PA, USA, 2007. [Google Scholar]
- Masao, C.A.; Makoba, R.; Sosovele, H. Will Ngorongoro Conservation Area Remain a World Heritage Site amidst Increasing Human Footprint? Int. J. Biodivers. Conserv. 2015, 7, 394–407. [Google Scholar] [CrossRef]
- Niboye, E.P. Vegetation Cover Changes in Ngorongoro Conservation Area from 1975 to 2000: The Importance of Remote Sensing Images. Open Geogr. J. 2010, 3, 15–27. [Google Scholar] [CrossRef]
- Scogings, P.F.; Johansson, T.; Hjalten, J.; Kruger, J. Responses of Woody Vegetation to Exclusion of Large Herbivores in Semi-Arid Savannas. Austral Ecol. 2012, 37, 56–66. [Google Scholar] [CrossRef]
- Wigley, B.J.; Fritz, H.; Coetsee, C.; Bond, W.J. Herbivores Shape Woody Plant Communities in the Kruger National Park: Lessons from Three Long-Term Exclosures. Koedoe 2014, 56, a1165. [Google Scholar] [CrossRef]
- Anderson, M.; Ngoti, P.M.; Nzunda, M.L.; Griffith, D.M.; Speed, J.D.M.; Fossøy, F.; Røskaft, E.; Graae, B.J. The Burning Question: Does Fire Affect Habitat Selection and Forage Preference of the Black Rhinoceros Diceros Bicornis in East African Savannahs? Oryx 2020, 54, 234–243. [Google Scholar] [CrossRef]
- Ludwig, A.; Meyer, H.; Nauss, T. Automatic Classification of Google Earth Images for a Larger Scale Monitoring of Bush Encroachment in South Africa. Int. J. Appl. Earth Obs. Geoinf. 2016, 50, 89–94. [Google Scholar] [CrossRef]
- Breiman, L. Random Forests. Mach. Learn. 2001, 45, 5–32. [Google Scholar] [CrossRef]
- Demarchi, L.; Kania, A.; Ciężkowski, W.; Piórkowski, H.; Oświecimska-Piasko, Z.; Chormański, J. Recursive Feature Elimination and Random Forest Classification of Natura 2000 Grasslands in Lowland River Valleys of Poland Based on Airborne Hyperspectral and LiDAR Data Fusion. Remote Sens. 2020, 12, 1842. [Google Scholar] [CrossRef]
- Guyon, I.; Weston, J.; Barnhill, S.; Vapnik, V. Gene Selection for Cancer Classification Using Support Vector Machines. Mach. Learn. 2002, 46, 389–422. [Google Scholar] [CrossRef]
- Gadiye, D.; Eshiamwatta, G.W.; OdadiI, W.O. Spatial-Temporal Distribution of the Black Rhino Population in the Ngorongoro Crater, Tanzania. Int. J. Biol. Res. 2016, 4, 232–236. [Google Scholar] [CrossRef]
- Goddard, J. Food Preferences of Two Black Rhinoceros Populations. East Afr. Wildl. J. 1968, 6, 1–18. [Google Scholar] [CrossRef]
- Adriaenssens, V.; Baets, B.D.; Goethals, P.L.M.; Pauw, N.D. Fuzzy Rule-Based Models for Decision Support in Ecosystem Management. Sci. Total Environ. 2004, 319, 1–12. [Google Scholar] [CrossRef] [PubMed]
- Gwynn, V.; Symeonakis, E. Rule-Based Habitat Suitability Modelling for the Reintroduction of the Grey Wolf (Canis Lupus) in Scotland. PLoS ONE 2022, 17, e0265293. [Google Scholar] [CrossRef]
- Pestka, Z.; Zbyryt, A.; Menderski, S.; Jakubas, D. Habitat Suitability Mapping of White Stork Ciconia Ciconia in One of Its Key European Breeding Areas. Ecol. Indic. 2023, 151, 110278. [Google Scholar] [CrossRef]
- Zabihi, K.; Paige, G.B.; Hild, A.L.; Miller, S.N.; Wuenschel, A.; Holloran, M.J. A Fuzzy Logic Approach to Analyse the Suitability of Nesting Habitat for Greater Sage-Grouse in Western Wyoming. J. Spat. Sci. 2017, 62, 215–234. [Google Scholar] [CrossRef]
- Qiu, F.; Chastain, B.; Zhou, Y.; Zhang, C.; Sridharan, H. Modeling Land Suitability/Capability Using Fuzzy Evaluation. GeoJournal 2014, 79, 167–182. [Google Scholar] [CrossRef]
- Woodcock, C.E.; Gopal, S. Fuzzy Set Theory and Thematic Maps: Accuracy Assessment and Area Estimation. Int. J. Geogr. Inf. Sci. 2000, 14, 153–172. [Google Scholar] [CrossRef]
- Frantz, D. FORCELandsat + Sentinel-2 Analysis Ready Data and Beyond. Remote Sens. 2019, 11, 1124. [Google Scholar] [CrossRef]
- Tucker, C.J. Red and Photographic Infrared Linear Combinations for Monitoring Vegetation. Remote Sens. Environ. 1979, 8, 127–150. [Google Scholar] [CrossRef]
- Gitelson, A.A.; Kaufman, Y.J.; Merzlyak, M.N. Use of a Green Channel in Remote Sensing of Global Vegetation from EOS-MODIS. Remote Sens. Environ. 1996, 58, 289–298. [Google Scholar] [CrossRef]
- Liu, H.Q.; Huete, A. A Feedback Based Modification of the NDVI to Minimize Canopy Background and Atmospheric Noise. IEEE Trans. Geosci. Remote Sens. 1995, 33, 457–465. [Google Scholar] [CrossRef]
- Xu, H. Modification of Normalised Difference Water Index (NDWI) to Enhance Open Water Features in Remotely Sensed Imagery. Int. J. Remote Sens. 2006, 27, 3025–3033. [Google Scholar] [CrossRef]
- Gao, B. NDWI—A Normalized Difference Water Index for Remote Sensing of Vegetation Liquid Water from Space. Remote Sens. Environ. 1996, 58, 257–266. [Google Scholar] [CrossRef]
- Barnes, E.M.; Clarke, T.R.; Richards, S.E.; Colaizzi, P.D.; Haberland, J.; Kostrzewski, M.; Waller, P.; Choi, C.; Riley, E.; Thompson, T. Coincident Detection of Crop Water Stress, Nitrogen Status and Canopy Density Using Ground-Based Multispectral Data. In Proceedings of the 5th International Conference on Precision Agriculture and Other Resource Management, Bloomington, MN, USA, 16–19 July 2000. [Google Scholar]
- Frampton, W.J.; Dash, J.; Watmough, G.; Milton, E.J. Evaluating the Capabilities of Sentinel-2 for Quantitative Estimation of Biophysical Variables in Vegetation. ISPRS J. Photogramm. Remote Sens. 2013, 82, 83–92. [Google Scholar] [CrossRef]
- Blackburn, G.A. Quantifying Chlorophylls and Caroteniods at Leaf and Canopy Scales: An Evaluation of Some Hyperspectral Approaches. Remote Sens. Environ. 1998, 66, 273–285. [Google Scholar] [CrossRef]
- Delegido, J.; Verrelst, J.; Alonso, L.; Moreno, J. Evaluation of Sentinel-2 Red-Edge Bands for Empirical Estimation of Green LAI and Chlorophyll Content. Sensors 2011, 11, 7063–7081. [Google Scholar] [CrossRef]
- Gitelson, A.A.; Keydan, G.P.; Merzlyak, M.N. Three-Band Model for Noninvasive Estimation of Chlorophyll, Carotenoids, and Anthocyanin Contents in Higher Plant Leaves. Geophys. Res. Lett. 2006, 33, L1140. [Google Scholar] [CrossRef]
- Dash, J.; Curran, P.J. The MERIS Terrestrial Chlorophyll Index. Int. J. Remote Sens. 2004, 25, 5403–5413. [Google Scholar] [CrossRef]
- Richardson, A.J.; Wiegand, C.L. Distinguishing Vegetation from Soil Background Information. Photogramm. Eng. Remote Sens. 1977; 43, 1541–1552. [Google Scholar]
- Daughtry, C.S.T.; Walthall, C.L.; Kim, M.S.; de Colstoun, E.B.; McMurtrey, J.E. Estimating Corn Leaf Chlorophyll Concentration from Leaf and Canopy Reflectance. Remote Sens. Environ. 2000, 74, 229–239. [Google Scholar] [CrossRef]
- Symeonakis, E.; Veron, S.; Baldi, G.; Banchero, S.; de Abelleyra, D.; Castellanos, G. Savannah Land Cover Characterisation: A Quality Assessment Using Sentinel 1/2, Landsat, PALSAR and PlanetScope. In Proceedings of the Living Planet Symposium, Milan, Italy, 7 January 2019. [Google Scholar]
- Gadiye, D. Population Dynamics and Feeding Ecology of the Black Rhino (Diceros Bicornis) in Ngorongoro Conservation Area, Tanzania. Master’s Thesis, Egerton University, Nakuru, Kenya, 2016. [Google Scholar]
- Phillips, S.J.; Dudík, M.; Elith, J.; Graham, C.H.; Lehmann, A.; Leathwick, J.; Ferrier, S. Sample Selection Bias and Presence-Only Distribution Models: Implications for Background and Pseudo-Absence Data. Ecol. Appl. 2009, 19, 181–197. [Google Scholar] [CrossRef] [PubMed]
- Phillips, S.J.; Anderson, R.P.; Schapire, R.E. Maximum Entropy Modeling of Species Geographic Distributions. Ecol. Model. 2006, 190, 231–259. [Google Scholar] [CrossRef]
- Li, X.J.; Cheng, X.W.; Chen, W.T.; Chen, G.; Liu, S.W. Identification of Forested Landslides Using LiDar Data, Object-Based Image Analysis, and Machine Learning Algorithms. Remote Sens. 2015, 7, 9705–9726. [Google Scholar] [CrossRef]
- Rodriguez-Galiano, V.F.; Ghimire, B.; Rogan, J.; Chica-Olmo, M.; Rigol-Sanchez, J.P. An Assessment of the Effectiveness of a Random Forest Classifier for Land-Cover Classification. ISPRS J. Photogramm. Remote Sens. 2012, 67, 93–104. [Google Scholar] [CrossRef]
- Symeonakis, E.; Higginbottom, T.P.; Petroulaki, K.; Rabe, A. Optimisation of Savannah Land Cover Characterisation with Optical and SAR Data. Remote Sens. 2018, 10, 499. [Google Scholar] [CrossRef]
- Higginbottom, T.P.; Symeonakis, E.; Meyer, H.; van der Linden, S. Mapping Fractional Woody Cover in Semi-Arid Savannahs Using Multi-Seasonal Composites from Landsat Data. ISPRS J. Photogramm. Remote Sens. 2018, 139, 88–102. [Google Scholar] [CrossRef]
- Haro-Carrion, X.; Southworth, J. Understanding Land Cover Change in a Fragmented Forest Landscape in a Biodiversity Hotspot of Coastal Ecuador. Remote Sens. 2018, 10, 1980. [Google Scholar] [CrossRef]
- Makaure, J.; Makaure, C. Biological Sciences Department, Midlands State University Dry Season Browse Preference for the Black Rhinoceros (Diceros Bicornis): The Case of the Midlands Black Rhino Conservancy (MBRC), Zimbabwe. Greener J. Biol. Sci. 2013, 3, 031–047. [Google Scholar] [CrossRef]
- Oloo, T.W.; Brett, R.; Young, T.P. Seasonal Variation in Feeding Ecology of Black Rhinoceros (Diceros Bicornis) in Laikipia, Kenya. Afr. J. Ecol. 1994, 32, 142–157. [Google Scholar] [CrossRef]
- Baltensperger, A.P.; Joly, K. Using Seasonal Landscape Models to Predict Space Use and Migratory Patterns of an Arctic Ungulate. Mov. Ecol. 2019, 7, 18. [Google Scholar] [CrossRef] [PubMed]
- Van Moorter, B.; Engen, S.; Fryxell, J.M.; Panzacchi, M.; Nilsen, E.B.; Mysterud, A. Consequences of Barriers and Changing Seasonality on Population Dynamics and Harvest of Migratory Ungulates. Theor. Ecol. 2020, 13, 595–605. [Google Scholar] [CrossRef]
- Odendaal-Holmes, K.; Marshal, J.P.; Parrini, F. Disturbance and Habitat Factors in a Small Reserve: Space Use by Establishing Black Rhinoceros (Diceros Bicornis). S. Afr. J. Wildl. Res. 2014, 44, 148–160. [Google Scholar] [CrossRef]
- Hearn, M.E.; Loutit, B.D.; Uri-Khob, S. The Black Rhinoceros of North-Western Namibia (Diceros Bicornis Bicornis): The Role of Density-Dependence and Its Management Implications. J.-Namib. Sci. Soc. 2000, 48, 11–39. [Google Scholar]
- Mukinya, J.G. Feeding and Drinking Habits of the Black Rhinoceros in Masai Mara Game Reserve. Afr. J. Ecol. 1977, 15, 125–138. [Google Scholar] [CrossRef]
- Beytell, P.C. Reciprocal Impacts of Black Rhino and Community-Based Ecotourism in North-West Namibia. Master’s Thesis, University of Stellenbosch, Stellenbosch, South Africa, 2010. [Google Scholar]
- Eisfelder, C.; Kuenzer, C.; Dech, S. Derivation of Biomass Information for Semi-Arid Areas Using Remote-Sensing Data. Int. J. Remote Sens. 2012, 33, 2937–2984. [Google Scholar] [CrossRef]
- Yang, J.; Prince, S.D. Remote Sensing of Savanna Vegetation Changes in Eastern Zambia 1972–1989. Int. J. Remote Sens. 2000, 21, 301–322. [Google Scholar] [CrossRef]
- Adole, T.; Dash, J.; Atkinson, P.M. A Systematic Review of Vegetation Phenology in Africa. Ecol. Inform. 2016, 34, 117–128. [Google Scholar] [CrossRef]
- Woodcock, C.E.; Allen, R.; Anderson, M.; Belward, A.; Bindschadler, R.; Cohen, W.; Gao, F.; Goward, S.N.; Helder, D.; Helmer, E.; et al. Free Access to Landsat Imagery. Science 2008, 320, 1011. [Google Scholar] [CrossRef]
- Wulder, M.A.; Masek, J.G.; Cohen, W.B.; Loveland, T.R.; Woodcock, C.E. Opening the Archive: How Free Data Has Enabled the Science and Monitoring Promise of Landsat. Remote Sens. Environ. 2012, 122, 2–10. [Google Scholar] [CrossRef]
- Klingel, H.; Klingel, U. The Rhinoceroses of Ngorongoro Crater. Oryx 1966, 8, 302–306. [Google Scholar]
- Kotze, D.C.; Zacharias, P.J.K. Utilization of Woody Browse and Habitat by the Black Rhino (Diceros Bicornis) in Western Itala Game Reserve. Afr. J. Range Forage Sci. 1993, 10, 36–40. [Google Scholar] [CrossRef]
- Leader-Williams, N. Conservation—Deserts Rhinos Dehorned. Nature 1989, 340, 599–600. [Google Scholar] [CrossRef]
- Cord, A.; Rödder, D. Inclusion of Habitat Availability in Species Distribution Models through Multi-Temporal Remote-Sensing Data? Ecol. Appl. 2011, 21, 3285–3298. [Google Scholar] [CrossRef]
- Schwager, P.; Berg, C. Remote Sensing Variables Improve Species Distribution Models for Alpine Plant Species. Basic Appl. Ecol. 2021, 54, 1–13. [Google Scholar] [CrossRef]
- Wang, Y.; Lu, Z.; Sheng, Y.; Zhou, Y. Remote Sensing Applications in Monitoring of Protected Areas. Remote Sens. 2020, 12, 1370. [Google Scholar] [CrossRef]
- Boyle, S.A.; Kennedy, C.M.; Torres, J.; Colman, K.; Pérez-Estigarribia, P.E.; de la Sancha, N.U. High-Resolution Satellite Imagery Is an Important yet Underutilized Resource in Conservation Biology. PLoS ONE 2014, 9, e86908. [Google Scholar] [CrossRef]
- Pennino, M.G.; Vilela, R.; Bellido, J.M. Effects of Environmental Data Temporal Resolution on the Performance of Species Distribution Models. J. Mar. Syst. 2019, 189, 78–86. [Google Scholar] [CrossRef]


Disclaimer/Publisher’s Note: The statements, opinions and data contained in all publications are solely those of the individual author(s) and contributor(s) and not of MDPI and/or the editor(s). MDPI and/or the editor(s) disclaim responsibility for any injury to people or property resulting from any ideas, methods, instructions or products referred to in the content. |
© 2024 by the authors. Licensee MDPI, Basel, Switzerland. This article is an open access article distributed under the terms and conditions of the Creative Commons Attribution (CC BY) license (https://creativecommons.org/licenses/by/4.0/).