Article

Advanced GNSS Spoofing Detection: Aggregated Correlation Residue Likelihood Analysis

1
National Time Service Center, Chinese Academy of Sciences, Xi’an 710600, China
2
Key Laboratory of Time Reference and Applications, Chinese Academy of Sciences, Xi’an 710600, China
3
University of Chinese Academy of Sciences, Beijing 101408, China
4
Institute of Information Sensing, Xidian University, Xi’an 710600, China
*
Author to whom correspondence should be addressed.
Remote Sens. 2024, 16(15), 2868; https://doi.org/10.3390/rs16152868 (registering DOI)
Submission received: 1 July 2024 / Revised: 27 July 2024 / Accepted: 2 August 2024 / Published: 5 August 2024

Abstract

:
Compared to conventional spoofing, emerging spoofing attacks pose a heightened threat to security applications within the global navigation satellite system (GNSS) due to their subtly designed signal structures. In response, a novel spoofing detection method entitled aggregated correlation residue likelihood analysis (A-CoRLiAn) is proposed in this study. Requiring only the addition of a pair of supplementary correlators, A-CoRLiAn harnesses correlation residues to formulate a likelihood metric, subsequently aggregating weighted decisions from all tracked satellites to ascertain the presence of spoofing. Evaluated under six diverse spoofing scenarios (including emerging challenges) in the Texas Spoofing Test Battery (TEXBAT) via Monte Carlo simulations, A-CoRLiAn yields a detection rate of 99.71%, demonstrating sensitivity, robustness, autonomy, and a lightweight architecture conducive to real-time implementation against spoofing threats.

1. Introduction

The global navigation satellite system (GNSS) plays an important role in critical systems, such as military and civilian communications, securities trading, financial systems, and smart grids [1]. Thus, their position, navigation, and timing (PNT) security should be guaranteed. Nowadays, information and navigation warfare are trending in modern warfare, and spoof jamming has become a major threat that cannot be ignored. The spoofing signal has the same structure as that of a genuine signal. It can invade an enemy receiver that has no corresponding defensive measures and change or control its positioning and timing results, without destroying the tracking loop or being detected. To avoid critical consequences, user terminals must be equipped with spoofing detection methods. Therefore, spoofing detection has gradually become popular for GNSS anti-jamming.
Generally, spoofing attacks can be classified into the three following categories [2]: simplistic, intermediate, and sophisticated. Simplistic spoofing directly simulates GNSS signals, which are then amplified and transmitted. This type of spoofing is out of sync with genuine signals, making it easier to detect, but it can still pose a threat to undefended receivers when the power is sufficiently high. Intermediate spoofing captures and modifies genuine signals for transmission, requiring the precise control of the delay and power. Sophisticated spoofing uses a closed-loop system to continuously monitor the target and simulate genuine signals, potentially employing multiple antennas to create a deceptive array pattern, making it the most covert and difficult to detect. Currently, there are no successful public instances of sophisticated spoofing attacks; therefore, studies have focused on the detection methods for intermediate spoofing attacks. Nonetheless, some emerging spoofing techniques [3,4] have devised subtle signal structures to achieve greater stealth, thereby posing more formidable challenges for detection methodologies.
GNSS authentication techniques are classified into three principal categories [5]: (1) cryptographic techniques [6,7] that exploit unpredictable but verifiable signal modulation in the GNSS spreading code or navigation data, (2) geometric techniques [8,9] that exploit the angle-of-arrival (AOA) diversity of authentic GNSS signals, and (3) GNSS signal processing techniques that do not fall into categories (1) and (2).
However, cryptographic signal authentication requires continuous systematic planning and upgrading in the future to integrate encryption modulation into various GNSS signals. Using AOA information, the receiver can perform spatial filtering through adaptive null steering, enhancing the genuine signal while suppressing the spoofing interference. However, AOA detection imposes significant demands on antennas, requiring multiple antennas or antenna mobility, which leads to high implementation costs. It is only effective when the spoofing signals are transmitted from a single antenna, making it challenging to cope with distributed spoofing. Moreover, AOA detection operates under a particular assumption regarding the direction of spoofing signal propagation, which may not always hold true in practice. Many detection methods rely on supplementary equipment, such as high-precision accelerometers [10,11], vision sensors [12,13], odometers [14,15], and navigation-grade inertial measurement units (IMUs) [16,17], which are not suitable for low-cost and portable devices. Thus, it is crucial to conduct further research into independent detection methods.
Currently, in the field of GNSS signal processing technologies, several independent detection methodologies exist, including the observation mutation [18], correlation distortion [19,20], and power [2,21] detection methods. Researchers [22] refer to observation mutation and correlation distortion detection as time of arrival (TOA) detection. This paper primarily focuses on correlation distortion detection.
Signal quality monitoring (SQM) technology, categorized under correlation distortion detection, was originally designed for multipath detection [23,24,25]. Classical SQM detection theory is widely used owing to its simple structure and high feasibility, but its assumptions are not universal, resulting in limited robustness.
Since the distribution of the correlator output can be predetermined in the absence of interference, it enables the detection of spoofing by examining its statistical properties. A chi-squared goodness-of-fit (GoF) test is conducted on the correlator outputs, accompanied by the proposition of a spoofing mitigation scheme on a vector-based tracking receiver [2]. Building upon the GoF test of Jahromi, the Pini group introduced a novel chi-squared statistic based on paired correlators [26], employing both GoF and sign tests as statistical evaluation methods. The efficacy of their detection approach was validated using the publicly available TEXBAT dataset. However, neither work provides explicit statistical probabilities of detection, and the GoF test necessitates continuous recalibration.
Moreover, correlation distortion analysis can be integrated with power detection techniques to facilitate a joint approach for spoofing detection [27,28]. A PD detector based on power and distortion features has been introduced [29], yet it necessitates an additional power monitoring module and yielded a non-negligible missed detection rate in practical experiments. Building upon this, a PD-ML detector has been proposed, and it enhances the detection performance by substituting a new distortion metric for the symmetric difference [30]. Nevertheless, the incorporation of the grid search methodology increases the computational complexity.
Consequently, the design of a sensitive, convenient, real-time, and robust spoofing detection method is crucial for GNSS anti-spoofing. In this study, we propose a novel spoofing detection methodology entitled aggregated correlation residue likelihood analysis (A-CoRLiAn). This approach introduces a pair of extra correlators into the tracking loop, leveraging the linear properties of the residual correlation function model to conduct multi-tap maximum likelihood estimations. The estimated outcomes are then scrutinized through hypothesis testing to reveal potential spoofing activities. A-CoRLiAn exhibits promising aptitude for the identification of spoofing attacks, especially when aggregating decisions across the detection outcomes of all tracked satellites. Its detection robustness persists in all scenarios, including emerging challenges.

2. Materials and Methods

2.1. Spoofing Attack Pattern and Signal Model

A spoofing signal is generated by using a signal simulator based on the premise that the geographical location of the target is known. Figure 1 shows the changing process of the correlation function over time in the presence of spoofing. The spoofing signal is aligned with the genuine signal by adjusting the code phase, and the power advantage is used to control the tracking loop of the target receiver [19].
This study is based on a binary phase shift keying (BPSK) signal system. When spoofing occurs, the received signal is the sum of the genuine signal, spoofing signals, and additive white Gaussian noise n ( t ) with variance σ 2 , and it can be modeled as follows:
s ( t ) = A i = 0 M α i c ( τ τ i ) cos ϕ i + n ( t ) ,
where M is the number of spoofing signals, and A denotes the amplitude of the genuine signal. τ and ϕ denote the time delay and phase, and c ( t ) is a pseudorandom code. In addition, α i denotes the amplitude attenuation relative to the genuine signal and α 0 = 1 .
The satellite navigation receiver employs a three-branch configuration within the delay-locked loop (DLL), comprising early, prompt, and late branches, to execute correlation operations essential for tracking. The normalized correlation function of the prompt branch can be expressed as
R ( τ ) = i = 0 M α i e j ϕ i Λ ( τ τ i ) + R n ,
where R n signifies the portion of the correlation result attributed to the noise n ( t ) , T c denotes the chip duration, and Λ ( τ ) is the normalized ideal correlation function:
Λ ( τ ) = { 1 | τ | / T c               | τ | T c 0                                                     e l s e .

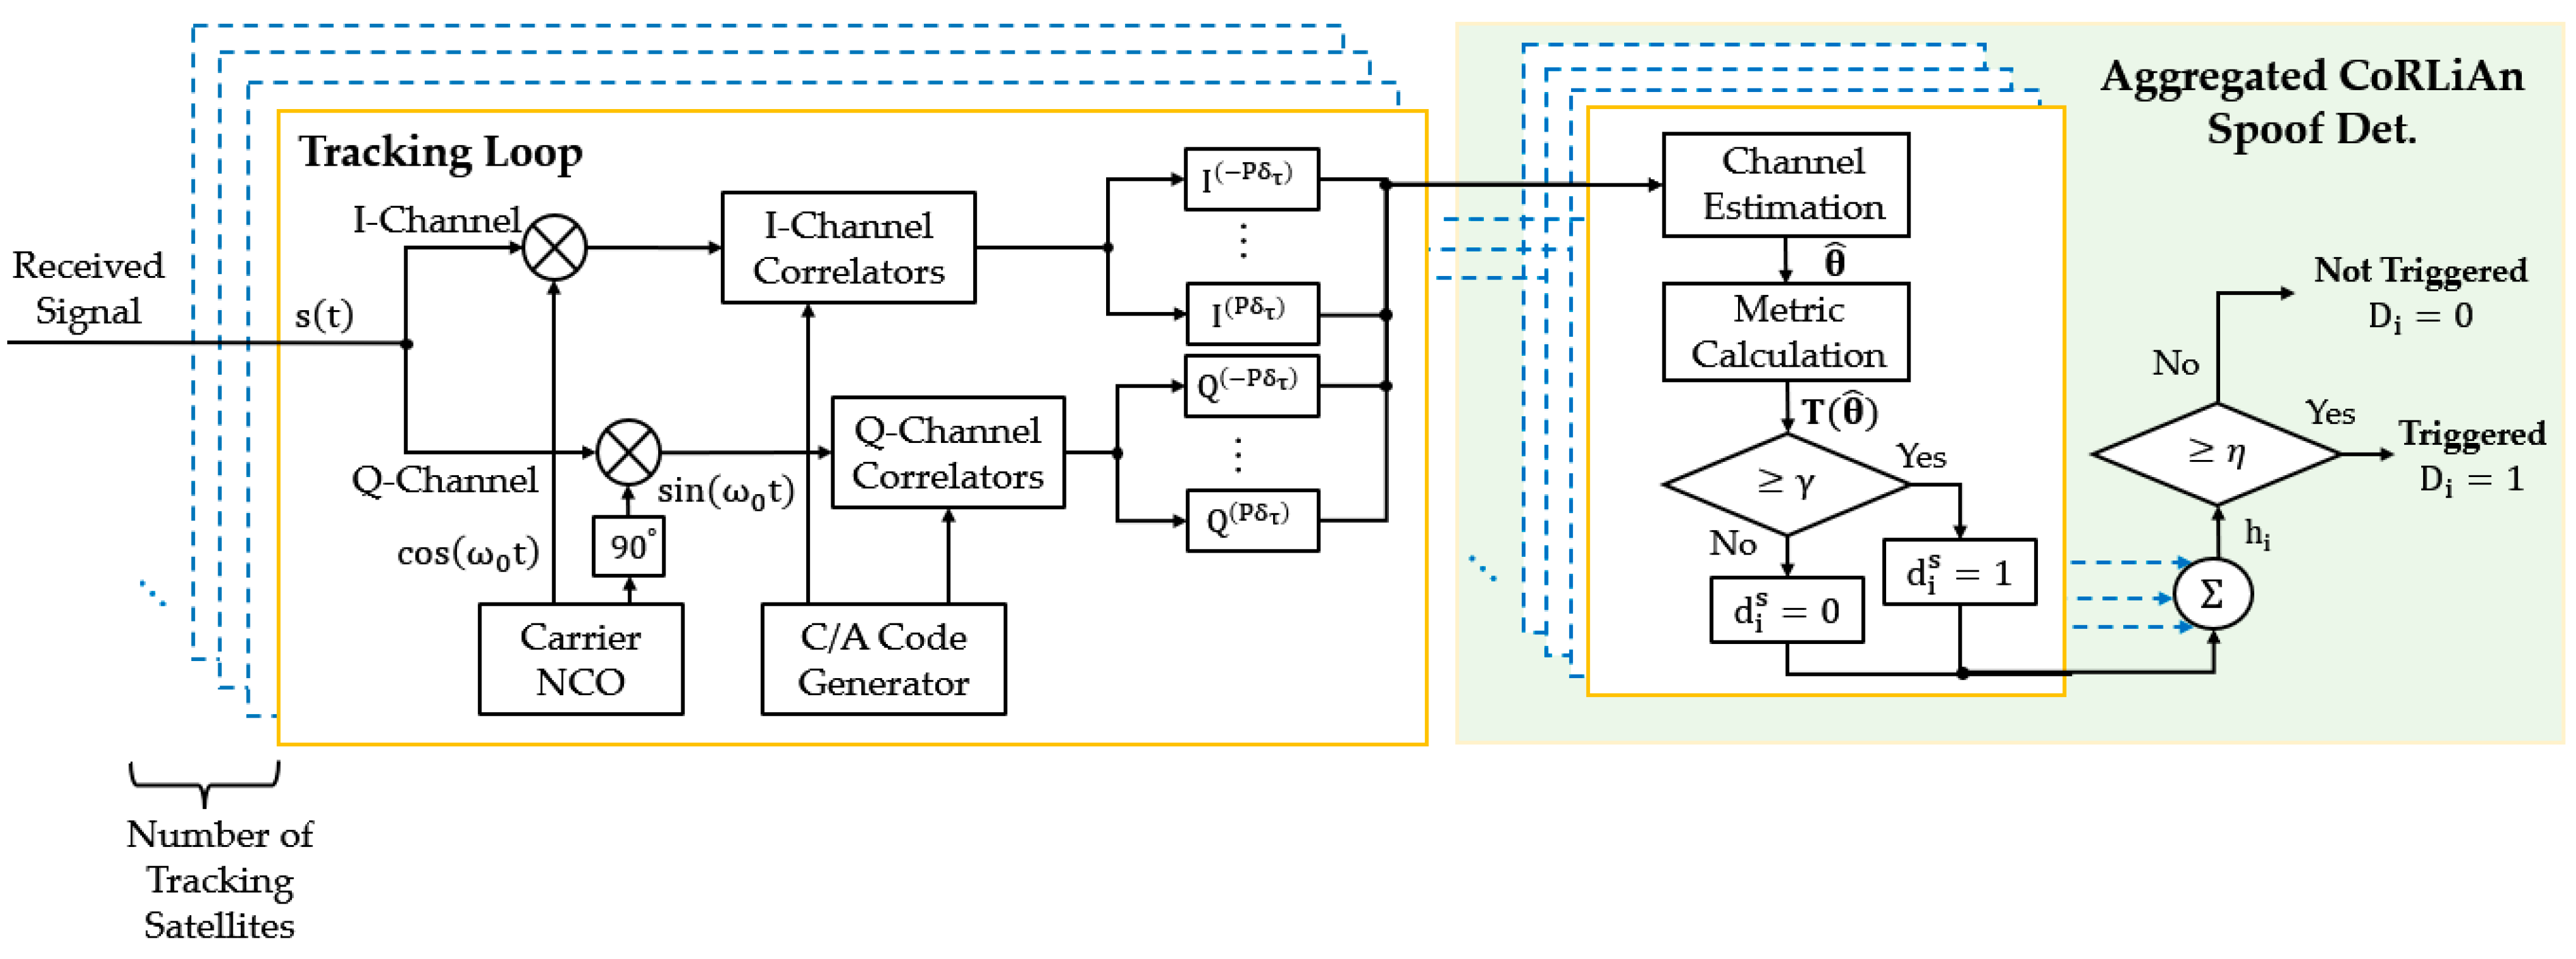
2.2. A-CoRLiAn Method

In this study, the CoRLiAn method is proposed, which uses the outputs of the detection correlators to superimpose a stable correlation function and then establishes a metric for the detection of spoofing by using maximum likelihood estimation (MLE) and generalized likelihood ratio tests (GLRT). Based on the CoRLiAn results, we can implement the aggregated decision to finalize the A-CoRLiAn method. This section describes the steps of the proposed method. Figure 2 illustrates the scheme of the A-CoRLiAn method, which comprises four principal steps.
Step 1.
Channel estimation;
Step 2.
Metric computation;
Step 3.
Single-satellite decision-making;
Step 4.
Multi-satellite decision aggregation.
Notably, the first three steps collectively constitute the CoRLiAn approach, dedicated to spoofing detection on individual satellites.
The tap-delay line (TDL) system identification model, demonstrated in Figure 3, is a widely utilized approach in channel estimation, comprising a structure of finite impulse response (FIR) filters. In this model, each filter tap is characterized by its own weight and delay, typically employing uniform delay intervals between taps [31]. Assuming that there are ( 2 P + 1 ) correlators and ( 2 p + 1 ) taps, with the correlator spacing set as δ τ and the tap spacing as Δ τ , we can obtain the correlator location vector δ c = [ P δ τ , , δ τ , 0 , δ τ , P δ τ ] T and the tap location vector Δ t = [ p Δ τ , , Δ τ , 0 , Δ τ , p Δ τ ] T . Consequently, the linear model of the correlation outputs is
R = P Λ θ + R n + ε R .
Here, θ is the ( 2 p + 1 ) × 1 tap weight vector corresponding to Δ t . In the presence of spoofing, θ = θ s + θ a , where θ s represents the tap weight vector associated with the spoofing signal and θ a represents the tap weight vector associated with the authentic signal. Each element of θ , denoted as θ ( i ) , has the form α i e j ϕ i , while P Λ represents the known observation matrix ( 2 P + 1 ) × ( 2 p + 1 ) . The term ε R signifies systemic errors present in the measurements. There is a correlation between the outputs of correlators R , and R n is colored noise.
Typically, we take P = p and δ τ = Δ τ = Δ , in which case P Λ becomes a Toeplitz matrix, expressed as follows:
P Λ = [ Λ ( 0 ) Λ ( 2 P Δ ) Λ ( 2 P Δ ) Λ ( 0 ) ] .
Before any alert occurs, we need to statistically average the signal power to derive θ a , which, except for θ ( 0 ) , should have all other weights set to zero. By mean-centering R , systematic errors ε R can also be removed. After removing the genuine peak P Λ θ a and systemic errors ε R from R , the residual correlation function R is obtained. If spoofing is present, the linear model of R can be expressed as
R = P Λ θ s + R n ,
and the mean, denoted as μ R , of R is
μ R = P Λ θ s ,
while the covariance matrix of colored noise R n is
C n = σ 2 P Λ .
Consequently, R follows a complex Gaussian distribution N ( P Λ θ s , σ 2 P Λ ) .
When the normal equation N = P Λ H C n 1 P Λ is invertible, maximum likelihood estimation θ ^ s is [32]
θ ^ s = ( P Λ H C n 1 P Λ ) 1 P Λ H C n 1 R .
According to the N - P criterion, the verification analysis of spoofing detection can be regarded as a problem for hypothesis testing. Assuming that Θ 0 represents the nominal channel condition, spoofing attack detection is divided into two hypotheses: (1) the null hypothesis H 0 corresponds to no spoofing signal, where θ = θ a Θ 0 ; (2) the alternative hypothesis H 1 corresponds to the existence of both spoofing and genuine signals, where θ = θ s + θ a Θ 0 :
H 0 : A θ ^ s = b ,
H 1 : A θ ^ s b .
Here, A can be set as a ( 2 p + 1 ) × ( 2 p + 1 ) identity matrix, and b can be set as a ( 2 p + 1 ) × 1 zero vector.
Subsequently, we perform the GLRT [33] for θ ^ s , and the detection metric T ( θ ^ ) is used to quantify the difference between the actual and nominal correlation residues:
T ( θ ^ s ) = ( A θ ^ s b ) H [ A ( P Λ H C n 1 P Λ ) 1 A H ] 1 ( A θ ^ s b ) σ 2 / 2 .
Under H 0 , T ( θ ^ s ) ~ χ 2 ( 2 p + 1 ) , thus allowing us to determine the original threshold γ based on the significance level α . Due to the input being smoothed correlation values, the noise fluctuation is reduced; thus, the threshold needs to be adjusted downward to some extent to accommodate the changes in the distribution that T ( θ ^ s ) follows. This can be accomplished by introducing the threshold scaling factor β , which enables us to derive the revised threshold γ = γ β . The introduction of β allows the flexible adjustment of the detector sensitivity without altering the basic structure of the detection algorithm, optimizing the performance. For each time unit of tracked satellites, we compare T ( θ ^ ) with γ , resulting in a decision d :
d = { 0 ,   T < γ ( H 0   a c c e p t e d ) 1 ,   T γ ( H 1   a c c e p t e d ) .
Up to this point, we have completed the spoofing detection for an individual satellite. To give the host a final judgment on whether there is spoofing, we could integrate the decisions of the tracked satellites by using the majority rule to further improve the flexibility of the proposed method.
At the time instant i , we define the aggregated test
h i = s = 1 N i d i s ,
where N i indicates the number of satellites tracked, and s stands for the satellite ID. Then, we determine the aggregated decision D as follows:
D i = { 0 ,   h i < η i , q   ( H 0   a c c e p t e d ) 1 ,   h i η i , q   ( H 0   r e j e c t e d ) ,
and the threshold of the aggregated decision is set as
η i , q = N i q ( e . g . ,   q = 2 , 3 , 4 ) ,
where q indicates the maximum proportion of abnormal satellites that we can accept.

2.3. Theoretical Performance Analysis

2.3.1. Performance Analysis of Estimation

A.
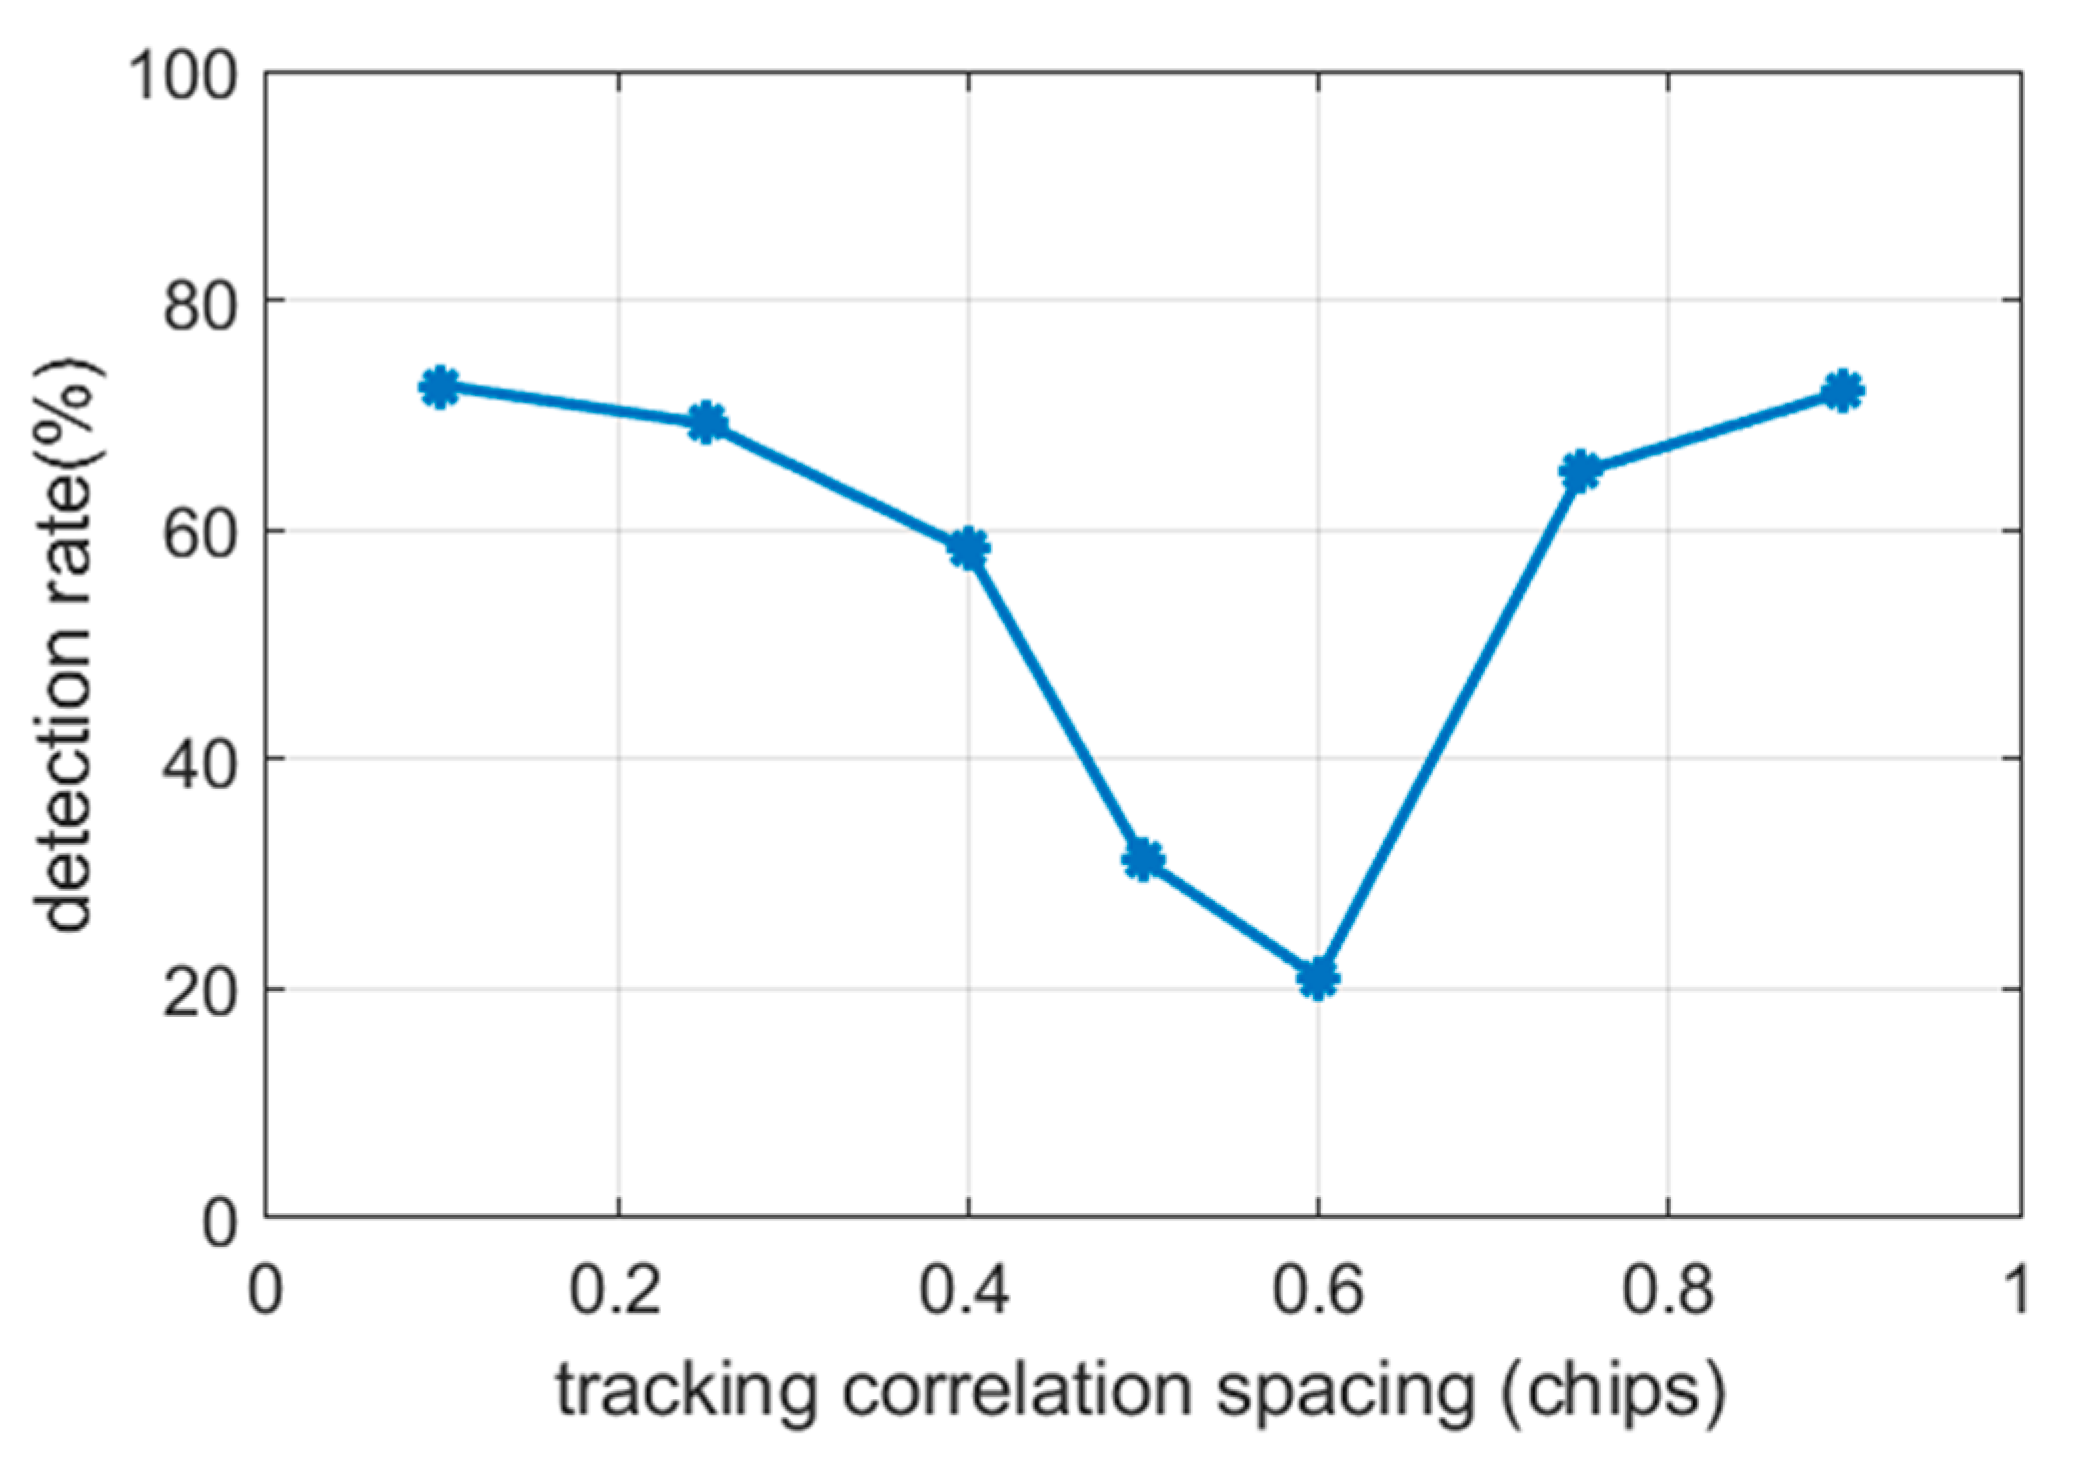
Influence of Correlator Spacing
The noise and the discrete tap delay introduce performance constraints on the estimation results θ ^ , introducing estimation errors θ n and a limited resolution ρ .
Firstly, the perturbation form of the linear model can be expressed as
P Λ T C n 1 ( R s + R n ) = N ( θ s + θ n ) ;
consequently, the upper bound ϖ on the relative error of θ ^ is given by
θ n θ s ϖ = κ ( N ) P Λ T D T ( D R n ) P Λ T D T ( D R s ) ,
where κ ( N ) is the condition number of N .
To examine the impact of the delay spacing Δ on ϖ , we employ the whitening matrix D , enabling us to derive ϖ via D R n and D R s . Assuming a signal-to-noise ratio (SNR) of 20 dB, the variations in κ ( N ) and ϖ with Δ are as depicted in Figure 4, illustrating that both increase as Δ decreases. This phenomenon arises because smaller delay intervals Δ render N nearly singular, thereby inducing ill-conditioned equations.
On the other hand, the estimation method restricts the estimated delays to a set of discrete points defined by tap interval Δ , consequently yielding a delay resolution ρ that is half of Δ [34].
In summary, within a given observation span, narrower tap spacing Δ enhances the delay resolution ρ of the estimation method, albeit requiring a larger number of correlators. Conversely, an excessively small Δ inflates the estimation errors. Consequently, the estimation errors and resolution emerge as competing performance metrics. Given this study’s focus on spoofing detection without stringent requirements on the resolution of the estimated time delay, a larger Δ and fewer detection correlators can be adopted.
B.
Necessity of Additional Correlators
We set the minimum spacing between the tracking correlators to δ t r a . Assuming that three detection correlators (including the prompt correlator) are fixed with Δ = 0.5 c h i p s , CoRLiAn is applied under varying δ t r a , yielding detection rate P d , depicted in Figure 5. It is evident that as δ t r a approaches Δ , P d decreases; conversely, it rises again when δ t r a moves away from Δ . This behavior arises from the tracking loop’s ability to enhance the symmetry in the correlation outputs, thereby improving their match with the nominal correlation function. However, in the presence of spoofing, this process contradicts CoRLiAn’s goal of measuring the deformation in the correlation function’s shape. To achieve superior performance, CoRLiAn should avoid employing the same set of correlators as the tracking loop. A recommendation is to increase the spacing to at least 0.5 chips or more, as this significantly enhances the detection efficacy.

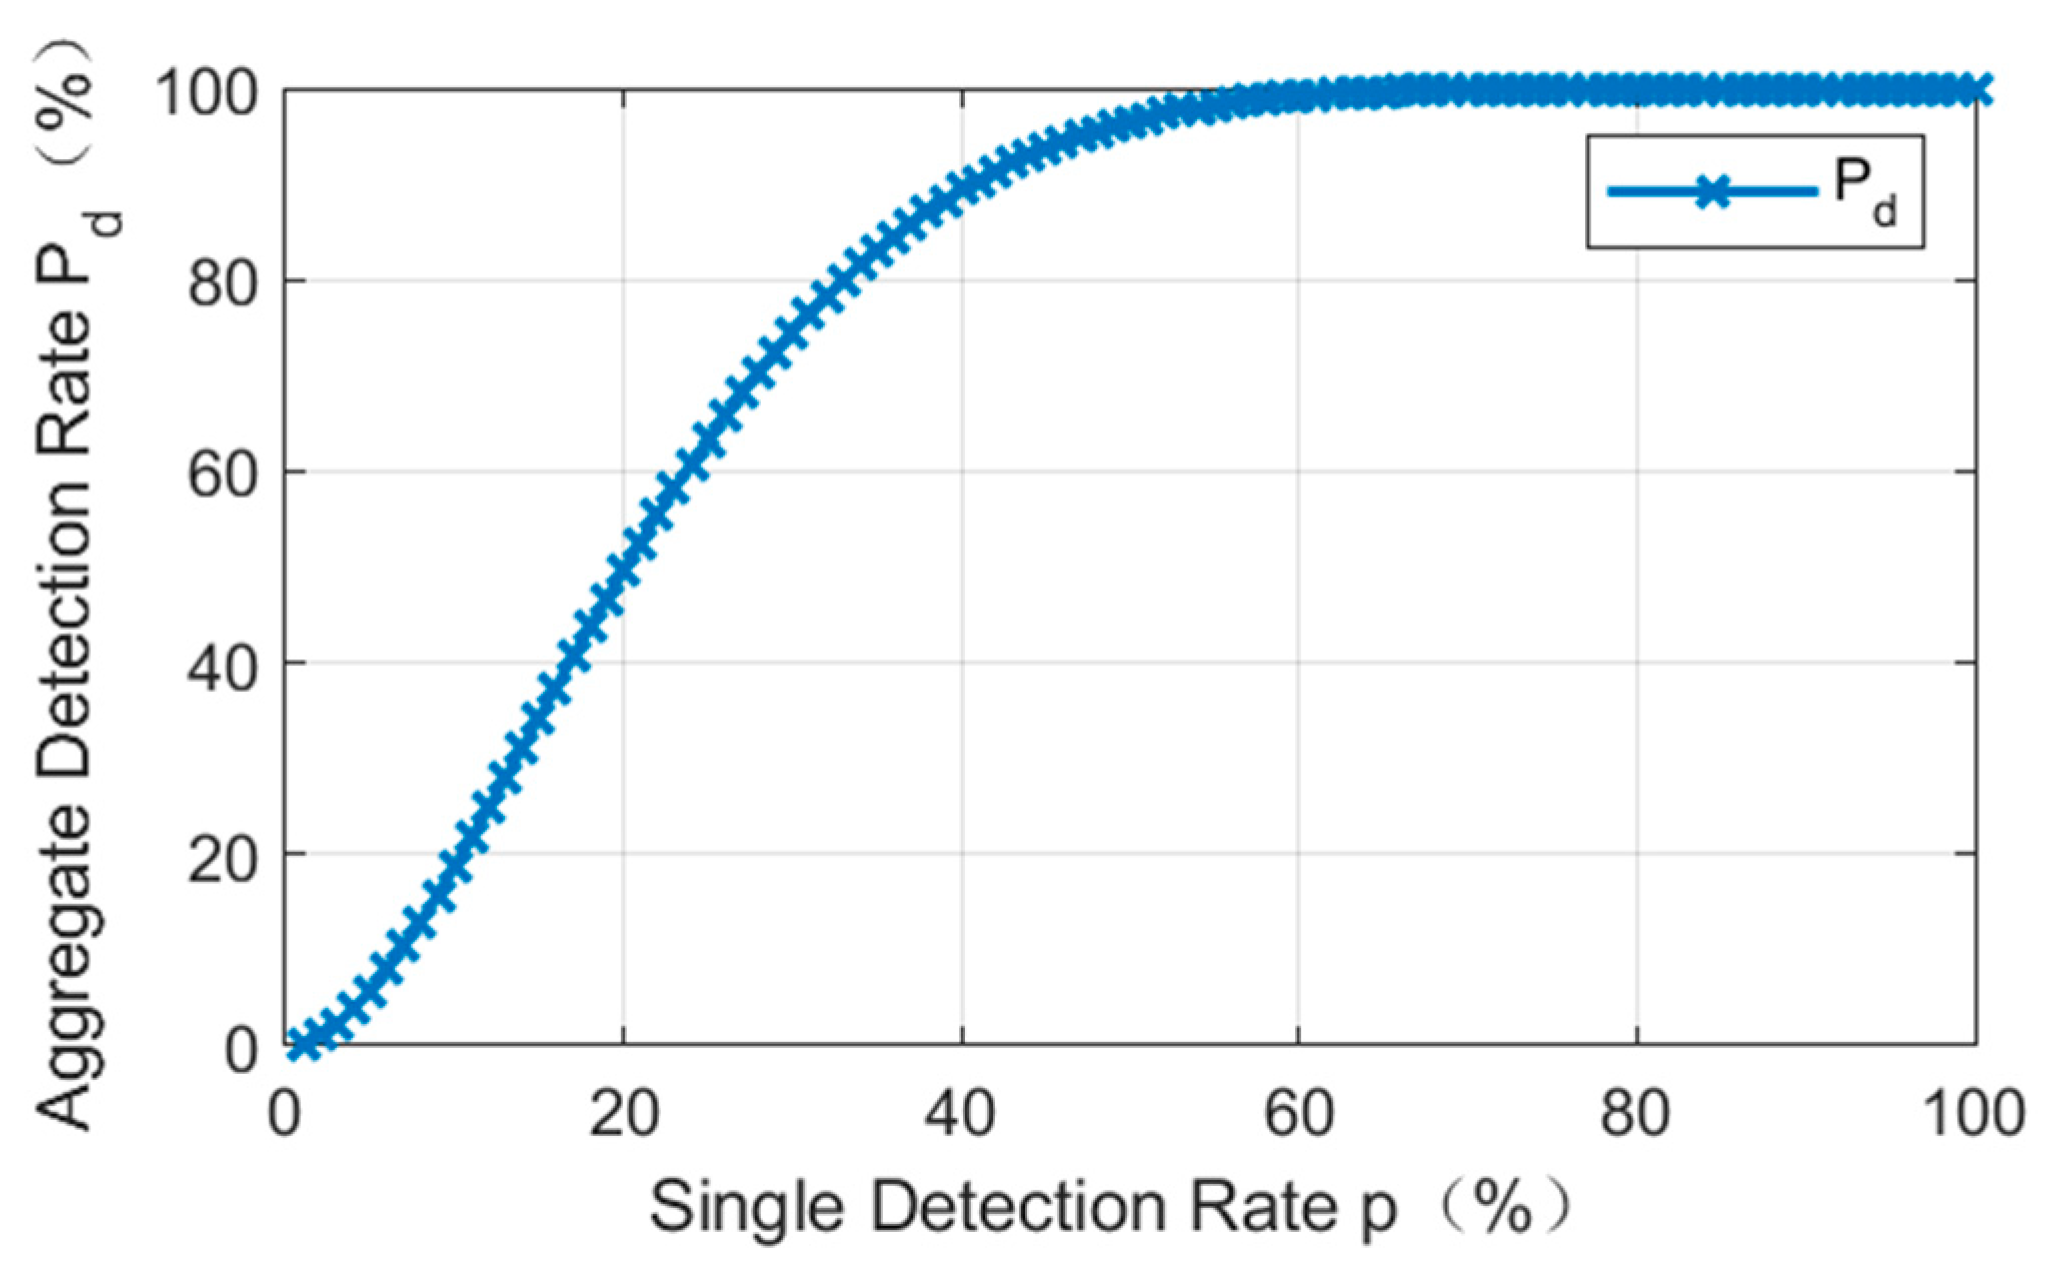
2.3.2. Performance Analysis of Aggregated Decision

At any given moment, the CoRLiAn detections for individual satellites are mutually independent. Assuming that the average false alarm rate is e , the aggregated decision process can be modeled as a repeated Bernoulli experiment performed n times, represented as h ~ B ( n , e ) . The probability of the cumulative quantity h exceeding η can be calculated via its cumulative distribution function, denoted as F α ( · ) . Consequently, the theoretical false alarm probability of the aggregated approach is derived as follows:
P f a = 1 F α ( η 1 ; N ; e ) ,
where
  F α ( η 1 ; N ; e ) = k = 0 η 1 ( N k ) e k ( 1 e ) N k .
Given the unknown distribution of T ( θ ^ ) under H 1 , the detection probability of CoRLiAn cannot be directly derived. To illustrate the efficacy improvement of aggregated detection, we may simply assume that the detection probability for each satellite’s CoRLiAn is identical, denoted as p . Consequently, the aggregated detection probability can be derived as
P d = 1 F p ( η 1 ; N ; p ) ,
where
F p ( η 1 ; N ; p ) = k = 0 η 1 ( N k ) p k ( 1 p ) N k .
Assuming N = 8 , η = 2 and e = 0.03 , Equation (19) yields a false alarm probability P f a ( h 2 | H 0 ) = 0.0223 , representing a 25.67% reduction compared to e . The relationship between p and P d as per Equation (21) is depicted in Figure 6, illustrating that when p > 40 % , A-CoRLiAn elevates P d above 90%. This highlights A-CoRLiAn’s capability to simultaneously enhance the detection probability while reducing the false alarms, underscoring inter-satellite information fusion as a potent strategy to further boost the detection performance.

2.4. Preparation for Performance Evaluation: Dataset and Analytical Methods

Based on the content discussed in Section 2.3, the A-CoRLiAn method in this paper uses a pair of additional detection correlators. Herein, the tracking correlator spacing δ t r a is set to 0.5   chips , while the observation spacing Δ is configured to 1   chip . The integration time is set equal to 1 millisecond, and the correlator output yields an A-CoRLiAn detection decision every cumulative 1 s. In this study, the significance level is uniformly set as α = 0.05 .
The Texas Spoofing Test Battery (TEXBAT), a publicly available dataset from the University of Texas in Austin, Texas, is an industry-recognized dataset for the effective validation of anti-spoofing technologies and has been widely used for spoofing and anti-spoofing research. TEXBAT targets GPS L1C/A signals with eight attack scenarios, among which ds2–ds7 are six non-repeated spoofing attack scenarios [3,35,36], as shown in Table 1. “Spoofing Type” indicates the dimension of the spoofing, which is divided into 600 m positional spoofing and 2 μs time spoofing. “Platform Mobility” indicates whether the spoofing platform is static or dynamic. “Power Adv.” indicates the power advantage of the spoofer. “Entry Time” indicates the time at which the spoofing signals are added. “Frequency Lock” indicates whether the spoofing signal maintains carrier phase alignment with the genuine signal. The “Locked” mode breaks the consistency between the code and carrier of the spoofing signal, whereas the “Unlocked” mode maintains this consistency.
ds2–ds6 belong to traditional spoofing, where the structure of the spoofing signal is identical to that of the genuine signal, whereas ds7 represents a novel spoofing type where the combined signal structure matches that of the authentic signal. Owing to the novelty and uniqueness of the ds7 structure, numerous approaches discussed in the literature have either not been validated against ds7 data [25,26,27,28,37,38,39] or have demonstrated inadequate detection performance [40,41,42,43].
To verify the effectiveness of A-CoRLiAn and facilitate a comparison of its performance with that of other spoofing detection methods, ds2–ds7 of TEXBAT were retrieved using the GPS software receiver (V2.0.0.20240123) embedded in the proposed A-CoRLiAn method. All tracked satellites contribute to an aggregated decision-making process for each record.
After processing the data, tallying the occurrences of H 1 decisions within distinct states yields the detection and false alarm probabilities for the A-CoRLiAn method.
P f a = i = 1 N D i N | H 0 ,
P d = i = 1 N D i N | H 1 ,
where N is the number of decisions made during the specified period.

3. Detection Results of A-CoRLiAn Method

3.1. Performance of A-CoRLiAn Method

This section will demonstrate the performance of the A-CoRLiAn method using the emerging spoofing case ds7 from TEXBAT, with the threshold scaling factor β set to 24.1.
A.
Decisions of CoRLiAn
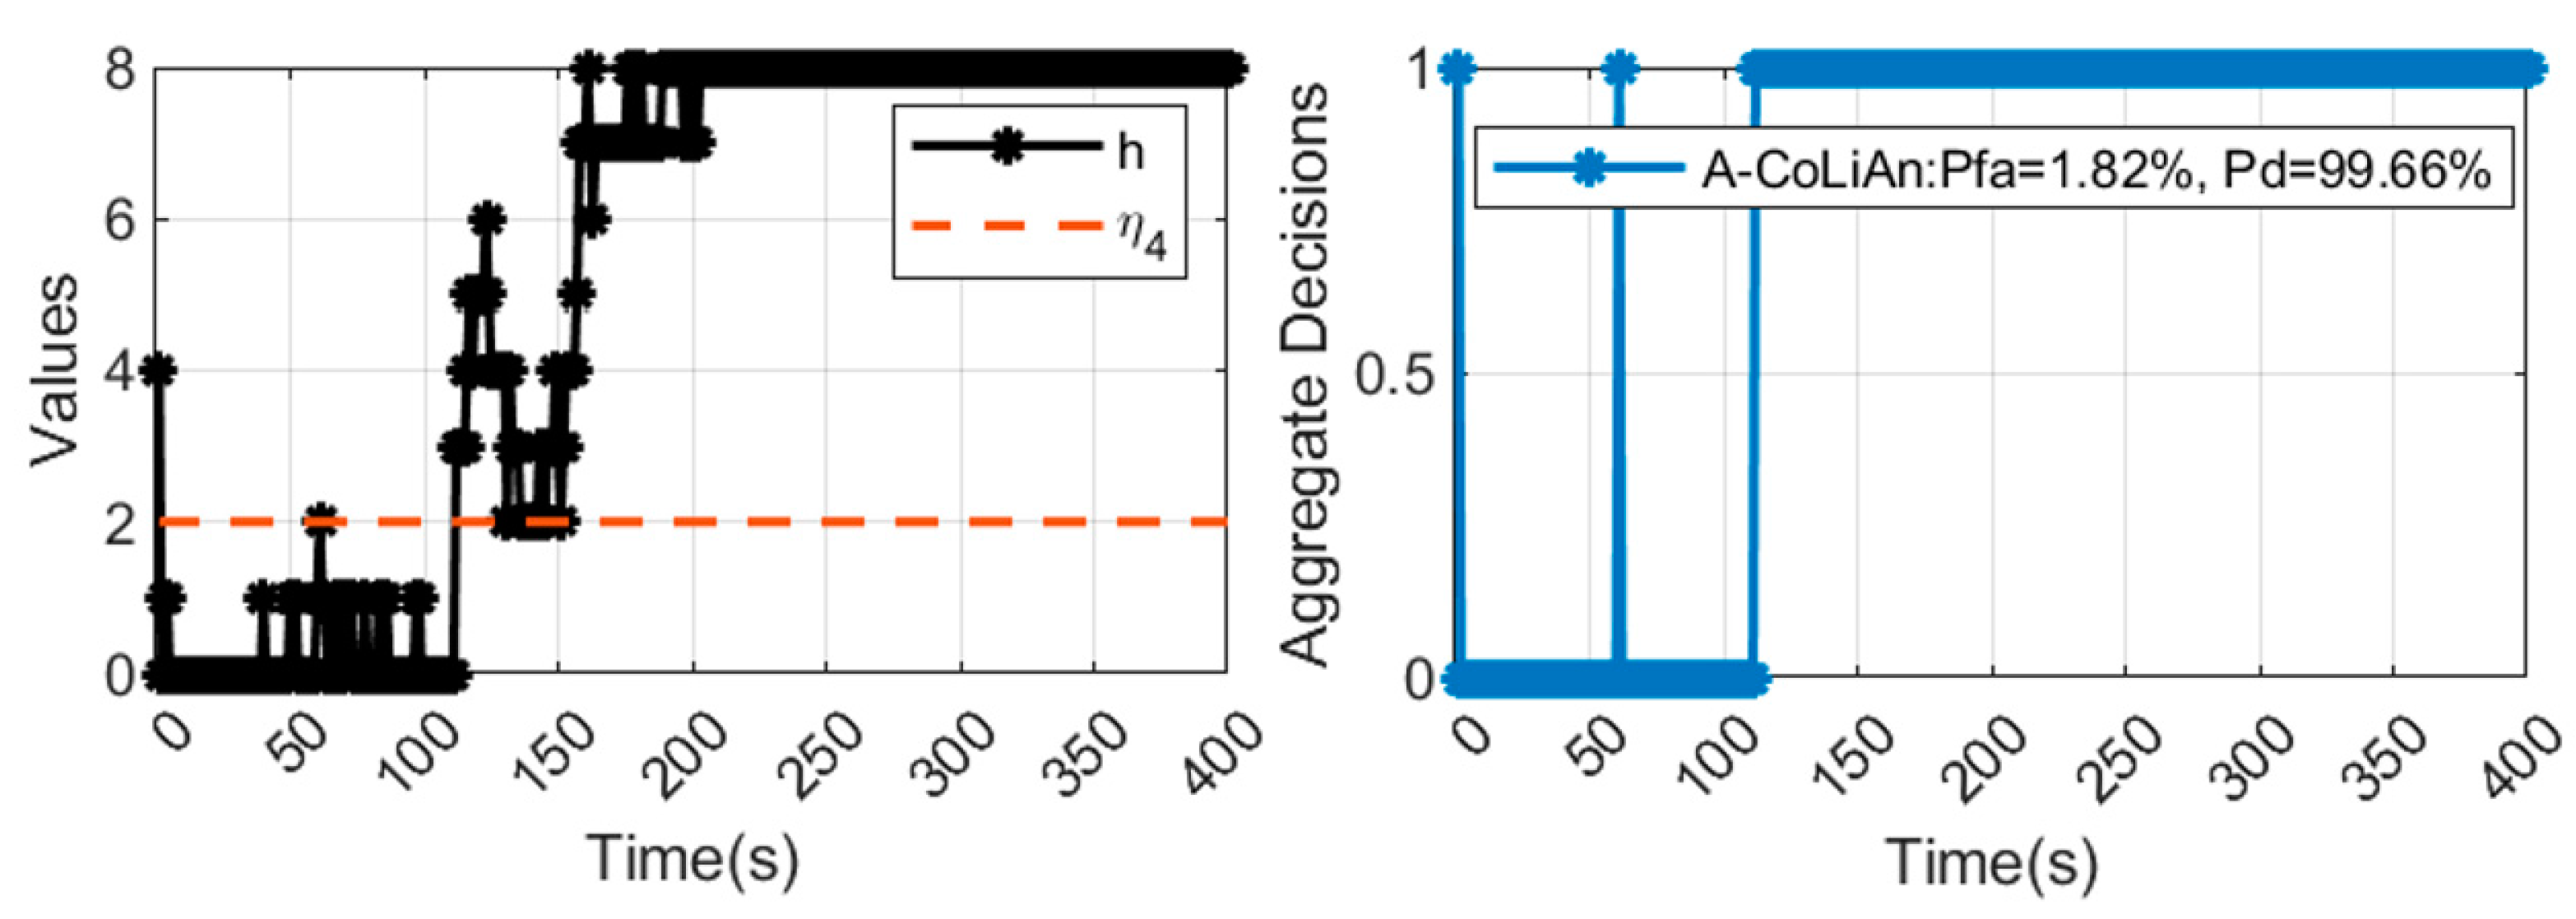
Due to space constraints, this section demonstrates the detection performance of the proposed CoRLiAn method using tracked satellites from ds7.
As per Table 1, the interval from 110 s to 400 s denotes the period of deception presence in ds7. Considering ds7 SVN 13 as an example, the CoRLiAn method was performed from 238 s to 239 s to detect spoofing. The residual components of the actual propagation channel parameter θ ^ s can be calculated according to Equation (9) in Section 2.3. As shown in Figure 7, the actual residual correlation functions R and θ ^ s are indicated by orange lines, and the expected nominal correlation function R b and the expected channel parameter b under H 0 are indicated by blue lines.
These are the results of a single test. We continuously performed CoRLiAn on the tracked satellites of ds7 within 400 s. The change in the metrics over time is shown in Figure 8, and the value of the threshold γ is 0.32, which is marked using the orange dashed line.
According to the metrics in Figure 8, the corresponding decisions of the tracked satellites are shown in in Figure 9, and the statistical results of the detection and false alarm probabilities within the 400 s range are marked.
B.
Decisions of Aggregated CoRLiAn
This section presents the performance of the aggregated CoRLiAn method in making aggregated decisions for all of the tracked satellites.
Based on the decisions of the tracked satellites in Figure 9, Figure 10 illustrates the aggregated metrics and decisions for ds7.

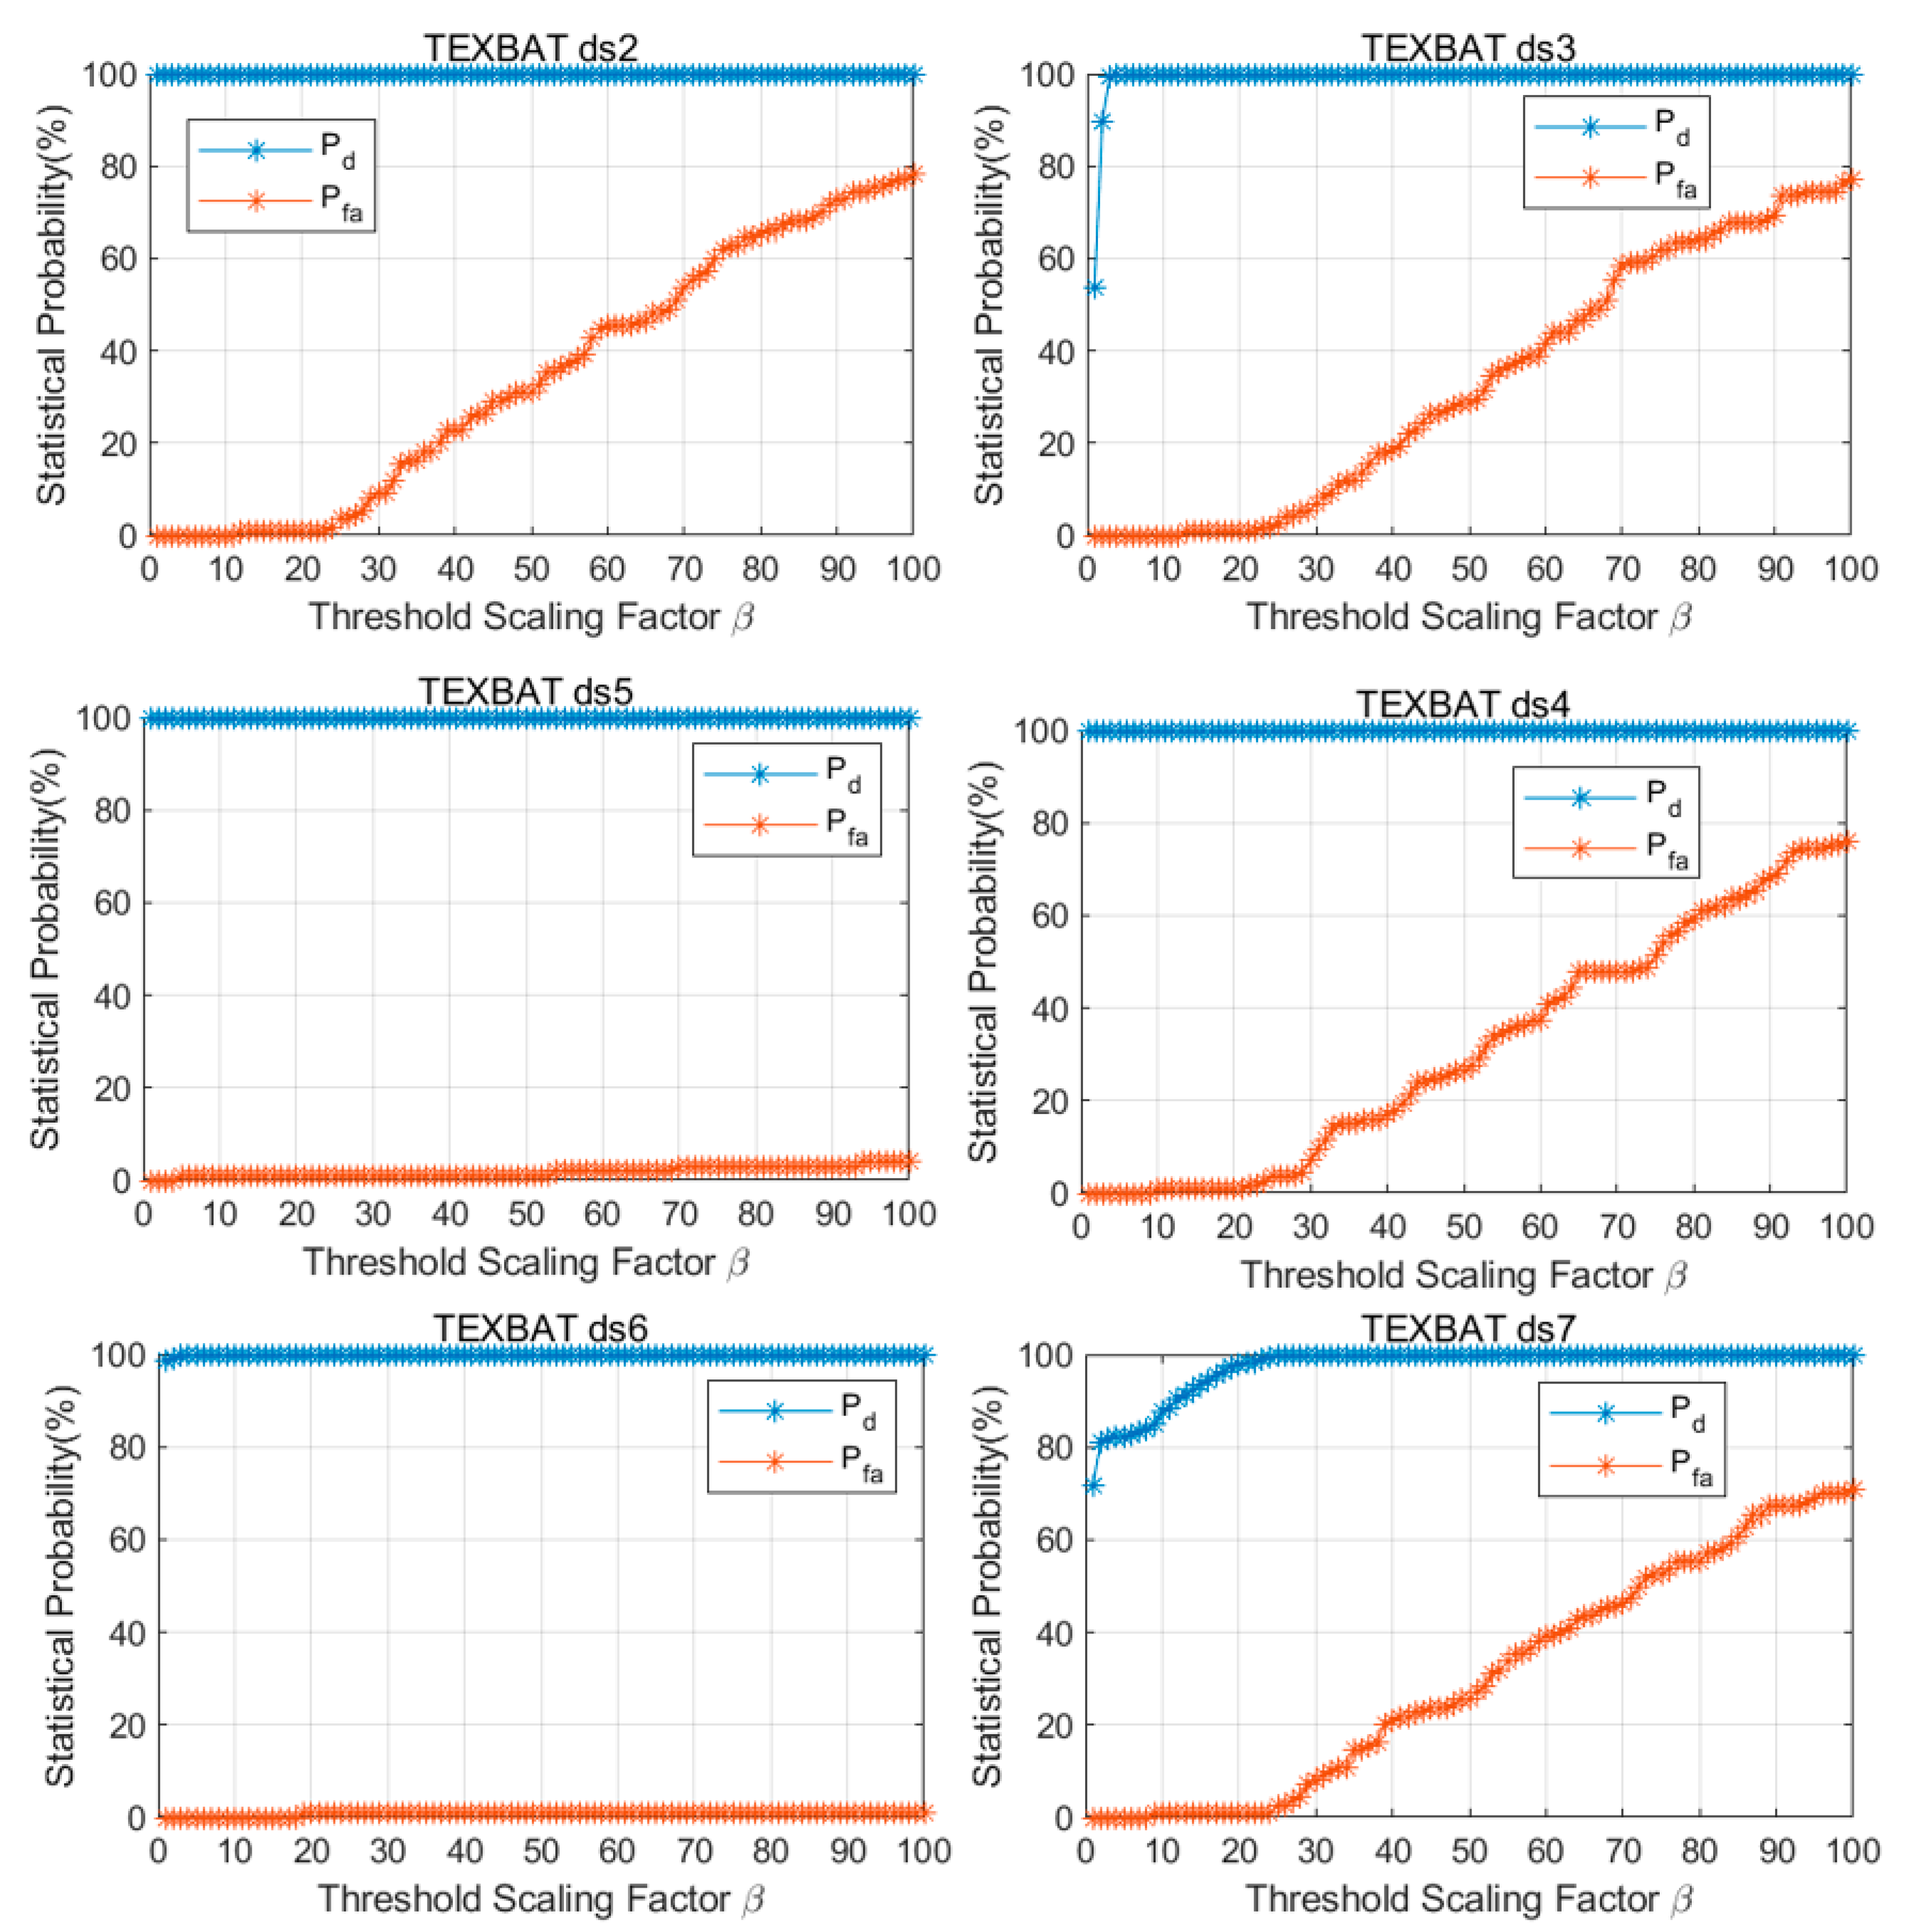
3.2. Influence of Threshold Scaling Factor

Adjusting the threshold scaling factor ( β ) from 1 to 100, the detection performance in six non-repeated spoofing attack scenarios (TEXBAT ds2–7) is depicted in Figure 11. In addition, the six records can be combined to form 2400 Monte Carlo simulations. Figure 12 shows the Monte Carlo detection performance of the proposed method under varied threshold scaling factors β .
Based on A-CoRLiAn’s varying detection capabilities across the scenarios, two detection modes can be configured: a low-sensitivity mode with β = 4 and a high-sensitivity mode with β = 24.1 . These two values are considered optimal to address traditional and emerging spoofing, respectively. The A-CoRLiAn algorithm is reapplied to ds2–ds7 under both modes. Table 2 shows the final false alarm rates and detection probabilities of the A-CoRLiAn method under both modes.

4. Discussion

4.1. Performance Analysis

First, the sensitivity and robustness of the A-CoRLiAn method are discussed. As shown in Figure 7, the residual correlation function R and the residual components of channel parameter θ ^ s have significant amplitude changes and asymmetries. Currently, the detection metric T is 27.69 and the threshold γ is 0.32; thus, CoRLiAn correctly identifies the existence of spoofing. This process demonstrates that the CoRLiAn method utilizes the deformities of the correlation function generated by spoofing to quantify the anomalies of the propagation channel. Figure 8 demonstrates a sequential decrease in the satellite signal quality, accompanied by a corresponding decline in the CoRLiAn metric T . Notably, during spoofing episodes, these metrics distinctively diverge from normal operational levels, enabling detection through thresholding. As evidenced in Figure 9, under the proposed CoRLiAn method, P f a stays within 5% across all tracked satellites for ds7, while   P d ranges from 77.59% to 98.28%. Despite the absence of information fusion from multiple satellites, CoRLiAn still achieves commendable performance.
Figure 10 reveals that the proposed A-CoRLiAn method provides a sustained warning for ds7 over 289 s, achieving a lower false alarm rate and a 99.66% detection rate. This outcome surpasses the individual satellite detection probabilities depicted in Figure 9, illustrating that the aggregated strategy enhances the detection performance by consolidating the satellite decisions, thereby highlighting the superiority of information fusion.
Figure 11 illustrates that for static scenarios (ds2–ds4), the impact trend of the threshold scaling factor β on A-CoRLiAn’s detection performance is generally consistent. Moreover, for dynamic scenarios (ds5–ds6), the influence of β is notably less significant. When 4 β 27 , A-CoRLiAn for traditional spoofing (ds2–6) can achieve a detection probability of over 99.65% with a false alarm rate lower than 5%. For many values of β , the detection probabilities are the same as when β = 27 ; among these values, A-CoRLiAn has the smallest false alarm rate when β = 4 . For the emerging spoofing scenario ds7, A-CoRLiAn requires heightened sensitivity, necessitating a narrower optimal range for β . When 12 β 28 , A-CoRLiAn for emerging spoofing (ds7) can achieve a detection probability ranging from 90.34% to 99.65% with a false alarm rate lower than 5%. For many values of β , the detection probability is 99.65%; among these values, A-CoRLiAn has the smallest false alarm rate when β = 24.1 . Figure 12 shows that the Monte Carlo performance simulation based on the TEXBAT dataset can achieve a detection probability greater than 96.78% with a false alarm rate lower than 5% when 4 β 29 .
In summary, A-CoRLiAn’s performance is not overly sensitive to β , which has a relatively wide range of viable values. Considering the different spoofing detection sensitivity requirements, the recommended range of β can be subdivided into two: a lower-sensitivity range of 4 β 12 and a higher-sensitivity range of 12 β 27 .
As evident in Table 2, the A-CoRLiAn method demonstrates robust detection performance across all six scenarios. Under the low-sensitivity mode, it achieves detection probabilities exceeding 99.65% against conventional spoofing threats (ds2–ds6) that mimic genuine signals, with no false alarms. To address the emerging challenge posed by ds7, we switch to the high-sensitivity mode, elevating the detection rate to 99.66% while maintaining an acceptably low P f a of 1.82%. Some of the false alarms are attributed to instability in the tracking initialization data, hence inflating P f a . In both modes, extensive Monte Carlo simulations—2400 runs—yielded detection rates of 96.78% and 99.71%, respectively, further validating its effectiveness.
A-CoRLiAn exhibits comparatively lower detection capabilities against ds7 due to the unique spoofing methodology employed in this scenario. Specifically, ds7 employs a traction strategy where the authentic and false peaks are subtracted, with the deceptive peak designed to have dynamically varying power. This introduces subtler distortions to the composite peak, causing the CoRLiAn metric T to rise more gradually.
Furthermore, the A-CoRLiAn method is distinguished by its lightweight structure and real-time performance, achieved with the addition of just a pair of correlators, thereby avoiding the substantial computational demands and noticeable latency associated with large matrices and facilitating straightforward implementation. Data processing within the A-CoRLiAn method is also devoid of computationally intensive modules, such as the grid search procedure [31,35]. It also features a standalone design, free from reliance on external information sources. Compared to AOA, A-CoRLiAn does not restrict the direction of spoofing arrival and is suitable for detecting distributed spoofing. This gives the method broader applicability.
The GoF test, which is likewise based on correlator outputs, shares the advantage of being lightweight. Its validity has also been demonstrated using TEXBAT ds2–ds6 [27]. It does not provide precise test probability values or validate against the emerging challenge, ds7. The time sequences that it presents reveal that GoF only offers respectable probabilities for ds6, and notably worse probabilities are observed in other scenarios (ds2–ds5). Under the Monte Carlo simulations, the detection probability for ds2–ds6 using GoF is approximately 57.66%, whereas the A-CoRLiAn method boosts this figure by approximately 42%, reaching 99.66%, manifesting significantly enhanced robustness and superior detection performance.

4.2. Limitations and Prospects

The A-CoRLiAn methodology has already achieved remarkable detection efficacy, with the Monte Carlo simulation detection rates exceeding 96.78% under low-sensitivity mode and surpassing 99.71% under high-sensitivity mode, while maintaining a satisfactorily low P f a . While these results denote strong performance, we believe that there remains room for the further enhancement of its detection capabilities.
First, the detection correlators are uniformly distributed and may not align with potential anomalies in the correlation peaks. This is not conducive to the detection metric capturing as much abnormal information as possible. Second, the threshold, fixed under a given β , is constant and determined by the number of detection correlators, without further dynamic adjustment based on noise variance. Third, A-CoRLiAn is limited to the correlation delay domain, which is likely to be ineffective for the new spoofing traction method without the drastic deformation of the correlation peak morphology.
Consequently, the proposed A-CoRLiAn method merits deeper exploration. Investigating intelligently adaptive, unevenly spaced detector correlators can enhance the focus on anomalous regions. Refining the thresholding strategy by incorporating noise variance as a reference for dynamic threshold adjustments holds potential for further inquiry. In addition, A-CoRLiAn can be extended to the delay Doppler two-dimensional domain for detection. Moreover, A-CoRLiAn has thus far been validated solely for BPSK signals, and its applicability to other signals requires further investigation. Under favorable conditions, the A-CoRLiAn method can be integrated with external information sources to elevate the detection performance to even greater heights.

5. Conclusions

This paper introduces a spoofing detection method called aggregated correlation residue likelihood analysis (A-CoRLiAn) and provides a recommended range for the key parameter—the threshold scaling factor. A-CoRLiAn effectively addresses both conventional threats and emerging challenges in the TEXBAT dataset and is easy to implement physically. Since A-CoRLiAn places no requirements on the direction of spoofing arrival, it is also suitable for distributed spoofing scenarios. The method can be made more intelligent through threshold adjustment, which may require further research using longer spoofing datasets. Overall, A-CoRLiAn provides a low-cost, efficient, accurate, and robust spoofing detection solution for the GNSS anti-spoofing domain.

Author Contributions

Conceptualization, N.J.; methodology, N.J.; software, N.J.; validation, N.J. and Y.R.; formal analysis, X.W. and N.J.; investigation, N.J.; resources, N.J., Y.R., X.W. and D.Z.; data curation, N.J.; writing—original draft preparation, N.J.; writing—review and editing, Y.R., X.W. and D.Z.; visualization, N.J.; supervision, Y.R., X.W. and D.Z.; project administration, Y.R. and D.Z.; funding acquisition, Y.R., X.W. and D.Z. All authors have read and agreed to the published version of the manuscript.

Funding

This study received no external funding.

Data Availability Statement

The original contributions presented in the study are included in the article, further inquiries can be directed to the corresponding author/s.

Conflicts of Interest

The authors declare no conflicts of interest.

References

  1. Qi, Y. Research on GNSS Multi Spoofing Strategy Based on Software Defined Receiver. Master’s Thesis, Nanjing University of Aeronautics and Astronautics, Nanjing, China, 2019. [Google Scholar]
  2. Jahromi, A.J.; Broumandan, A.; Nielsen, J.; Lachapelle, G. GPS spoofer countermeasure effectiveness based on signal strength, noise power, and C/N0 measurements. Int. J. Satell. Commun. Netw. 2012, 30, 181–191. [Google Scholar] [CrossRef]
  3. T. R. Laboratory, Texbat Data Sets 7 and 8. Available online: http://radionavlab.ae.utexas.edu/datastore/texbat/texbat_ds7_and_ds8.pdf (accessed on 6 October 2023).
  4. Ji, N.; Rao, Y.; Wang, X.; Zou, D.; Chen, X.; Guo, Y. Spoofing Traction Strategy Based on the Generation of Traction Code. Remote Sens. 2023, 15, 500. [Google Scholar] [CrossRef]
  5. Psiaki, M.L.; Humphreys, T.E. GNSS Spoofing and Detection. Proc. IEEE 2016, 104, 1258–1270. [Google Scholar] [CrossRef]
  6. Fernandez-Hernandez, I.; Winkel, J.; O’Driscoll, C.; Cancela, S.; Terris-Gallego, R.; López-Salcedo, J.A.; Seco-Granados, G.; Chiara, A.D.; Sarto, C.; Blonski, D.; et al. Semiassisted Signal Authentication for Galileo: Proof of Concept and Results. IEEE Trans. Aerosp. Electron. Syst. 2023, 59, 4393–4404. [Google Scholar] [CrossRef]
  7. Seco-Granados, G.; Gómez-Casco, D.; López-Salcedo, J.A.; Fernández-Hernández, I. Detection of replay attacks to GNSS based on partial correlations and authentication data unpredictability. GPS Solut. 2021, 25, 33. [Google Scholar] [CrossRef]
  8. Mao, P.R.; Yuan, H.; Chen, X.; Gong, Y.K.; Li, S.H.; Li, R.; Luo, R.D.; Zhao, G.Y.; Fu, C.A.; Xu, J.J. A GNSS Spoofing Detection and Direction-Finding Method Based on Low-Cost Commercial Board Components. Remote Sens. 2023, 15, 2781. [Google Scholar] [CrossRef]
  9. Xiao, L.; Li, X.; Liao, Z. GNSS Spoofing Detection with Using Linear Array. In Proceedings of the 2020 IEEE 8th International Conference on Computer Science and Network Technology (ICCSNT), Dalian, China, 20–22 November 2020; pp. 181–185. [Google Scholar]
  10. Neish, A.; Lo, S.; Chen, Y.H.; Enge, P.; Inst, N. Uncoupled Accelerometer Based GNSS Spoof Detection for Automobiles using Statistic and Wavelet Based Tests. In Proceedings of the 2018 31st International Technical Meeting of the Satellite Division of the Institute of Navigation (ION GNSS+ 2018), Miami, FL, USA, 24–28 September 2018; pp. 2938–2962. [Google Scholar]
  11. Kwon, K.C.; Shim, D.S. Performance Analysis of Direct GPS Spoofing Detection Method with AHRS/Accelerometer. Sensors 2020, 20, 954. [Google Scholar] [CrossRef] [PubMed]
  12. Varshosaz, M.; Afary, A.; Mojaradi, B.; Saadatseresht, M.; Parmehr, E.G. Spoofing Detection of Civilian UAVs Using Visual Odometry. ISPRS Int. J. Geo-Inf. 2020, 9, 6. [Google Scholar] [CrossRef]
  13. Qiao, Y.R.; Zhang, Y.X.; Du, X. A Vision-Based GPS-Spoofing Detection Method for Small UAVs. In Proceedings of the 2017 13th International Conference ON Computational Intelligence and Security (CIS), Hong Kong, China, 15–18 December 2017; pp. 312–316. [Google Scholar]
  14. Broumandan, A.; Lachapelle, G. Spoofing Detection Using GNSS/INS/Odometer Coupling for Vehicular Navigation. Sensors 2018, 18, 1305. [Google Scholar] [CrossRef]
  15. Vagle, N.; Broumandan, A.; Lachapelle, G. Multiantenna GNSS and Inertial Sensors/Odometer Coupling for Robust Vehicular Navigation. IEEE Internet Things J. 2018, 5, 4816–4828. [Google Scholar] [CrossRef]
  16. Wei, Y.; Li, H.; Lu, M. Spoofing profile estimation-based GNSS spoofing identification method for tightly coupled MEMS INS/GNSS integrated navigation system. IET Radar Sonar Navig. 2020, 14, 216–225. [Google Scholar] [CrossRef]
  17. Wang, S.Z.; Zhan, X.Q.; Zhai, Y.W.; Liu, B.Y. Fault Detection and Exclusion for Tightly Coupled GNSS/INS System Considering Fault in State Prediction. Sensors 2020, 20, 590. [Google Scholar] [CrossRef] [PubMed]
  18. Mosavi, M.R.; Nasrpooya, Z.; Moazedi, M. Advanced Anti-Spoofing Methods in Tracking Loop. J. Navig. 2016, 69, 883–904. [Google Scholar] [CrossRef]
  19. Cavaleri, A.; Motella, B.; Pini, M.; Fantino, M. Detection of Spoofed GPS Signals at Code and Carrier Tracking Level. In Proceedings of the 5th ESA Workshop on Satellite Navigation Technologies/European Workshop on GNSS Signals and Signal Processing (NAVITEC), European Space Res & Technol Ctr, Noordwijk, The Netherlands, 8–10 December 2010. [Google Scholar]
  20. Yang, Y.C.; Li, H.; Lu, M.Q. Performance Assessment of Signal Quality Monitoring Based GNSS Spoofing Detection Techniques. In Proceedings of the 6th China Satellite Navigation Conference (CSNC), Xi’an, China, 13–15 May 2015; pp. 783–793. [Google Scholar]
  21. Dehghanian, V.; Nielsen, J.; Lachapelle, G. GNSS Spoofing Detection Based on Signal Power Measurements: Statistical Analysis. Int. J. Navig. Obs. 2012, 2012, 313527. [Google Scholar] [CrossRef]
  22. Gao, Y.; Li, H.; Lu, M.Q.; Feng, Z. Intermediate Spoofing Strategies and Countermeasures. Tsinghua Sci. Technol. 2013, 18, 599–605. [Google Scholar]
  23. Phelts, R.E. Multicorrelator Techniques for Robust Mitigation of Threats to GPS Signal Quality. Ph.D. Thesis, Stanford University, Stanford, CA, USA, 2001. [Google Scholar]
  24. Mubarak, O.M.; Dempster, A.G. Analysis of early late phase in single-and dual-frequency GPS receivers for multipath detection. GPS Solut. 2010, 14, 381–388. [Google Scholar] [CrossRef]
  25. Sun, C.; Cheong, J.W.; Dempster, A.G.; Demicheli, L.; Cetin, E.; Zhao, H.; Feng, W. Moving variance-based signal quality monitoring method for spoofing detection. GPS Solut. 2018, 22, 83. [Google Scholar] [CrossRef]
  26. Gamba, M.T.; Truong, M.D.; Motella, B.; Falletti, E.; Ta, T.H. Hypothesis testing methods to detect spoofing attacks: A test against the TEXBAT datasets. GPS Solut. 2017, 21, 577–589. [Google Scholar] [CrossRef]
  27. Miralles, D.; Levigne, N.; Bornot, A.; Rouquette, P.; Akos, D.M.; Chen, Y.H.; La, S.; Walter, T. An Assessment of GPS Spoofing Detection Via Radio Power and Signal Quality Monitoring for Aviation Safety Operations. IEEE Intell. Transp. Syst. Mag. 2020, 12, 136–146. [Google Scholar] [CrossRef]
  28. Wang, L.; Zhang, L.J.; Wu, R.B. GNSS Spoofing Detection Based on Power Monitoring Combined with SQM. J. Signal Process. 2023, 39, 505–515. [Google Scholar]
  29. Wesson, K.D.; Gross, J.N.; Humphreys, T.E.; Evans, B.L. GNSS Signal Authentication Via Power and Distortion Monitoring. IEEE Trans. Aerosp. Electron. Syst. 2018, 54, 739–754. [Google Scholar] [CrossRef]
  30. Gross, J.N.; Kilic, C.; Humphreys, T.E. Maximum-Likelihood Power-Distortion Monitoring for GNSS-Signal Authentication. IEEE Trans. Aerosp. Electron. Syst. 2019, 55, 469–475. [Google Scholar] [CrossRef]
  31. Zhou, S.; Ou, G.; Tang, X.M. Clustering sparse fitting scheme for GNSS multipath channel simulation. J. Natl. Univ. Def. Technol. 2023, 45, 87–94. [Google Scholar]
  32. Kay, S. Fundamentals of Statistical Signal Processing: Estimation Theory; Prentice-Hall: Englewood Cliffs, NJ, USA, 1993. [Google Scholar]
  33. Kay, S. Fundamentals of Statistical Signal Processing: Detection Theory; Prentice-Hall: Englewood Cliffs, NJ, USA, 1998. [Google Scholar]
  34. Blanco-Delgado, N.; Nunes, F.D. Multipath Estimation in Multicorrelator GNSS Receivers using the Maximum Likelihood Principle. IEEE Trans. Aerosp. Electron. Syst. 2012, 48, 3222–3233. [Google Scholar] [CrossRef]
  35. Humphreys, T.E.; Bhatti, J.A.; Shepard, D.; Wesson, K. The Texas Spoofing Test Battery: Toward a Standard for Evaluating GPS Signal Authentication Techniques. In Proceedings of the 25th International Technical Meeting of The Satellite Division of the Institute of Navigation (ION GNSS 2012), Nashville, TN, USA, 17–21 September 2012. [Google Scholar]
  36. T. R. Laboratory, Texas Spoofing Test Battery (TEXBAT). Available online: http://radionavlab.ae.utexas.edu/texbat (accessed on 6 October 2023).
  37. Sun, C.; Cheong, J.W.; Dempster, A.G.; Zhao, H.; Feng, W. GNSS Spoofing Detection by Means of Signal Quality Monitoring (SQM) Metric Combinations. IEEE Access 2018, 6, 66428–66441. [Google Scholar] [CrossRef]
  38. Sun, C.; Cheong, J.W.; Dempster, A.G.; Zhao, H.; Bai, L.; Feng, W. Robust Spoofing Detection for GNSS Instrumentation Using Q-Channel Signal Quality Monitoring Metric. IEEE Trans. Instrum. Meas. 2021, 70, 1–15. [Google Scholar] [CrossRef]
  39. Wang, W.; Gong, J. GNSS spoofing detection algorithm based on composite SQM variance#br#. J. Civil Aviat. Univ. China 2020, 38, 7–12. [Google Scholar]
  40. Turner, M.; Wimbush, S.; Enneking, C.; Konovaltsev, A. Spoofing Detection by Distortion of the Correlation Function. In Proceedings of the 2020 IEEE/ION Position, Location and Navigation Symposium (PLANS), Portland, OR, USA, 20–23 April 2020; pp. 566–574. [Google Scholar]
  41. Wang, W.Y.; Gong, J.; Wang, J.M. GNSS spoofing interference detection based on variance of SCB. Syst. Eng. Electron. 2021, 43, 2254–2262. [Google Scholar]
  42. Wang, W.Y.; Li, N.; Wu, R.; Closas, P. Detection of Induced GNSS Spoofing Using S-Curve-Bias. Sensors 2019, 19, 922. [Google Scholar] [CrossRef]
  43. Zhu, R.C.; Wang, W.Y. SCS-based multi-star joint induced spoofing detection algorithm. Mod. Electron. Tech. 2023, 46, 1–8. [Google Scholar]
Figure 1. Changing process of absolute correlation function under spoofing attack (left) and its top view (right).
Remotesensing 16 02868 g001
Figure 2. Scheme of A-CoRLiAn method.
Remotesensing 16 02868 g002
Figure 3. TDL system identification model.
Remotesensing 16 02868 g003
Figure 4. Impact of delay interval Δ on κ ( N ) and ϖ .
Remotesensing 16 02868 g004
Figure 5. Detection rate P d under varied δ t r a .
Remotesensing 16 02868 g005
Figure 6. Aggregated CoRLiAn detection probability P d at various p.
Remotesensing 16 02868 g006
Figure 7. Comparison of critical variables for single CoRLiAn decision under spoofing (orange) and non-spoofing (blue) conditions: residual correlation values (left) and corresponding channel parameters (right) for ds7 SVN 13 (238–239 s).
Remotesensing 16 02868 g007
Figure 8. The 400 s CoRLiAn metrics T (blue) for eight tracked satellites in ds7, alongside threshold γ = 0.32 (orange), the probing effectiveness and the robustness.
Remotesensing 16 02868 g008
Figure 9. The 400 s CoRLiAn decisions d for eight tracked satellites in ds7, illustrating its effectiveness and robustness.
Remotesensing 16 02868 g009
Figure 10. The 400 s aggregated test metrics h (left) and decisions D (right) of A-CoRLiAn for eight tracked satellites in ds7, illustrating the enhanced detection performance achieved through aggregation.
Remotesensing 16 02868 g010
Figure 11. Detection performance of A-CoRLiAn method under varied threshold scaling factors β across six non-repeated spoofing attack scenarios, aimed at investigating the sensitivity of the threshold scaling factor β to different attack scenarios.
Remotesensing 16 02868 g011
Figure 12. Monte Carlo (TEXBAT ds2-7) detection performance of the A-CoRLiAn method under varied threshold scaling factors β , aimed at investigating the recommended threshold scaling factors.
Remotesensing 16 02868 g012
Table 1. Overview of the TEXBAT spoofing scenarios.
No.Spoofing TypePlatform MobilityPower Adv.Frequency LockEntry Time (s)
ds2TimeStaticOverpoweredUnlocked110.1
ds3TimeMatchedLocked118.9
ds4PositionMatchedLocked113.8
ds5TimeDynamicOverpoweredUnlocked100
ds6PositionMatchedLocked100
ds7TimeStaticMatchedLocked110
Table 2. Detection performance of A-CoRLiAn on ds2–ds7 under both modes.
ModeProb.ds2ds3ds4ds5ds6ds7Monte Carlo
(ds2–ds7)
Low Sensitivity ( β = 4 ) P f a 0%0%0%0%0%0%0%
P d 100.0%99.65%99.65%99.67%99.67%82.07%96.78%
High Sensitivity ( β = 24.1 ) P f a 1.82%1.69%2.65%1%1%1.82%1.66%
P d 100.0%99.65%99.65%99.67%99.67%99.66%99.71%
Disclaimer/Publisher’s Note: The statements, opinions and data contained in all publications are solely those of the individual author(s) and contributor(s) and not of MDPI and/or the editor(s). MDPI and/or the editor(s) disclaim responsibility for any injury to people or property resulting from any ideas, methods, instructions or products referred to in the content.

