Article

Pyramid Cascaded Convolutional Neural Network with Graph Convolution for Hyperspectral Image Classification

by
Haizhu Pan
1,2,*,
Hui Yan
1,
Haimiao Ge
1,2,
Liguo Wang
3 and
Cuiping Shi
4
1
College of Computer and Control Engineering, Qiqihar University, Qiqihar 161000, China
2
Heilongjiang Key Laboratory of Big Data Network Security Detection and Analysis, Qiqihar University, Qiqihar 161000, China
3
College of Information and Communication Engineering, Dalian Nationalities University, Dalian 116000, China
4
College of Telecommunication and Electronic Engineering, Qiqihar University, Qiqihar 161000, China
*
Author to whom correspondence should be addressed.
Remote Sens. 2024, 16(16), 2942; https://doi.org/10.3390/rs16162942
Submission received: 25 June 2024 / Revised: 4 August 2024 / Accepted: 8 August 2024 / Published: 11 August 2024

Abstract

:
Convolutional neural networks (CNNs) and graph convolutional networks (GCNs) have made considerable advances in hyperspectral image (HSI) classification. However, most CNN-based methods learn features at a single-scale in HSI data, which may be insufficient for multi-scale feature extraction in complex data scenes. To learn the relations among samples in non-grid data, GCNs are employed and combined with CNNs to process HSIs. Nevertheless, most methods based on CNN-GCN may overlook the integration of pixel-wise spectral signatures. In this paper, we propose a pyramid cascaded convolutional neural network with graph convolution (PCCGC) for hyperspectral image classification. It mainly comprises CNN-based and GCN-based subnetworks. Specifically, in the CNN-based subnetwork, a pyramid residual cascaded module and a pyramid convolution cascaded module are employed to extract multiscale spectral and spatial features separately, which can enhance the robustness of the proposed model. Furthermore, an adaptive feature-weighted fusion strategy is utilized to adaptively fuse multiscale spectral and spatial features. In the GCN-based subnetwork, a band selection network (BSNet) is used to learn the spectral signatures in the HSI using nonlinear inter-band dependencies. Then, the spectral-enhanced GCN module is utilized to extract and enhance the important features in the spectral matrix. Subsequently, a mutual-cooperative attention mechanism is constructed to align the spectral signatures between BSNet-based matrix with the spectral-enhanced GCN-based matrix for spectral signature integration. Abundant experiments performed on four widely used real HSI datasets show that our model achieves higher classification accuracy than the fourteen other comparative methods, which shows the superior classification performance of PCCGC over the state-of-the-art methods.

Graphical Abstract

1. Introduction

With the development of hyperspectral imaging techniques, hyperspectral images (HSIs) with abundant spectral signatures and spatial features are available. HSIs have hundreds of narrow and continuous electromagnetic spectrum bands, spanning from the visible to the near-infrared ranges. HSI can reflect the area on an earth surface with spectral and spatial information. And, it has been widely utilized in various applications, e.g., mineral exploitation [1], environment surveillance [2], water quality monitoring [3], and urban planning [4,5]. Among various applications, HSI classification, which discriminates each land-cover type at the pixel-by-pixel level [6], plays a critical role and has attracted more researchers to study it. However, it is a significant challenge for HSI classification that the HSIs contain excessively high spectral dimensions and complex spatial features [7].
The traditional methods based on hand-crafted features for HSI classification mainly fall into two categories, such as spectral-based and spatial spectral-based methods [8,9]. The spectral-based method, e.g., random forest [10], k-nearest neighbor [11], and support vector machine [12], which only learn spectral signatures, produce the classification maps with salt-and-pepper phenomena and unsatisfactory classification performance. At the same time, the principal component analysis [13] method is developed to remove redundant spectral signatures for spectral signatures extraction. To further improve the classification performance, another category of methods based on spectral-spatial feature have emerged, such as extended morphological profile [14] and superpixel segmentation [15]. In these, the classification result is enhanced compared with the spectral-based methods. Although the aforementioned methods can effectively solve the HSI classification tasks, these methods have some limited feature extraction capabilities and fail to learn deep semantic information due to a lack of strong data fitting abilities and being less robust for complex HSI data scenes [16,17].
Over the past few years, deep learning (DL) has been recognized as a powerful data analysis technique [18] for effectively addressing nonlinear problems, and it has been extensively used for HSI processing tasks. Compared with traditional machine learning methods, DL, which includes various deep networks such as CNN [19], RNN [20], GNN [21], Transformer [22,23,24], and GAN [25], makes significant progress in HSI classification. Among various network architectures, CNN and GCN have received the most attention. In the case of CNN, it is extensively used because it can reuse convolutional kernels with shared weights across input feature maps, enabling it to adeptly learn features of images [26]. For example, Hu et al. [19] employ 1D convolution to learn features along the spectral channel of the HSI data cube, resulting in good classification performance compared with traditional methods. Although the method based on 1D convolution better adapts to spectral signatures, it overlooks spatial information, which limits the capability of the method to describe spatial contextual information. To cope with this problem, in [27], a novel devised dual-branch spectral and spatial model is proposed. This network uses 1D convolution and 2D convolution to learn spectral signatures and spatial features separately. Subsequently, a fully connected layer is utilized to exploit spectral and spatial correlation. The mentioned double-branch network learns the spectral signatures and spatial features separately. To jointly excavate features from a 3D HSI cube, in [28], a newly developed cascaded 3D convolution to learn spectral-spatial features is used. However, this cascaded 3D CNN uses a 3D kernel with a size of ( h × w × d ) , which has many parameters. In this article, 3D convolutions with kernel sizes of ( h × w × 1 ) and ( 1 × 1 × d ) are employed to reduce the network parameters. Meanwhile, too many 3D convolutions will lead to the disappearance of the network gradients and decrease the final classification accuracy. To conquer this phenomenon, the residual network [29] and the dense network [30] are utilized. Although the above-mentioned CNN-based methods can be better used for HSI classification, they overlook the extraction of multiscale features [31], thus not being robust enough for various HSI data scenes. Meanwhile, the CNN method based on grid data has limitations in capturing the relationships between samples in HSI data.
With the emergence of graph neural network (GNN) [32] architecture, GNNs have been used by some researchers as effective tools to deal with HSI data based on non-Euclidean geometry properties. Among various GNN architectures [33,34,35], GCN has been widely used in HSI processing due to its direct application to arbitrarily shaped graphs, allowing it to learn the graph structure information and node features simultaneously [36]. To proficiently utilize the relationships between different nodes, the methods for graph construction of HSI data typically include superpixel-based and pixel-based [37,38] approaches. Specifically, from the perspective of superpixels, in [33], a novel graph convolutional method that utilizes the GCN to extract features from the constructed graph using superpixel methods was explored. Based on the superpixel graph, Wan et al. [33] employ multiscale stacked GCN layers to learn context-based spatial information. Although the above-mentioned methods based on GCN can achieve satisfactory feature extraction, the graph constructed by the superpixel method tends to overlook certain local spectral and spatial information. Then, a graph-in-graph method is devised by Jia et al. [39], where each node within a local range structure is called an internal graph, and all the nodes of the HSI form an external graph. This approach can highlight both the local and global information of the entire graph. Although the graph based on superpixels can describe the local features of HSI well, pixels with different labels may be assigned to the same superpixel region, resulting in the misclassification of results in the final classification map [8]. Meanwhile, the constructed superpixel-based graph models may overlook pixel-level feature descriptions, which further leads to poor pixel-level classification results. To cope with these difficulties, from another pixel-based perspective, a mini-batch GCN method is proposed by [40], which employs a batch-by-batch GCN network training approach for pixel-wise feature extraction of HSI data. Based on the patch training strategy, Gao et al. [41] propose a novel model, which proficiently improves neighborhood node aggregation by adaptively learning the weight correlations between different nodes. Zhang et al. [42] devise a proficient GCN method, which regards the HSI data as graph-structured data and systematically aggregates structural information between different nodes for pixel-wise land cover processing.
GCNs use convolution as a weighted function to indicate the influence exerted on a target node by its neighbors and itself, which is beneficial for graph-based data processing. The constructed graph can be updated to adapt to the HSI data representations produced by each GCN layer, which in turn makes the data representations more accurate [43]. Meanwhile, the GCN can handle arbitrary graph-based data and efficiently learn the internal similarity relationships between adjacent nodes in HSI data [44]. Following the benefits of GCN, some researchers try to combine the advantages of CNNs and GCNs for classifying different HSI data scenes [45]. Lu et al. [46] develop a novel model that combines a separable GCN with a CNN for HSI classification. Specifically, the model encodes spectral–spatial features, adaptively learned by the designed attention module, into the structure of a graph. Then, a separable deep GCN is developed to learn long-range contextual structure relationships from the graph. Meanwhile, a local convolutional feature extraction network is employed to extract complementary local features. To make the model compatible with different HSI data scenes, Li et al. [47] design a staged feature fusion model that combines CNNs and GCNs. In the first stage, the model uses CNN to extract non-local features. In the second stage, GCN is employed to optimize the connectivity relationships of the graph constructed based on spectral similarity. Shi et al. [44] propose a novel network that has a graph convolution branch and grouping convolution branch. In the graph branch, a multihop graph rectify attention is proposed to weigh the features extracted by the GCN. In the convolution branch, a spectral intra-group and inter-group signature extraction module is designed to address the problem of high spectral dimensionality. Ghotekar et al. [45] devise an feature segmentation network, consisting of hybrid convolution and graph convolution networks, for HSI classification. First, a CNN is used to extract multi-layer features. Then, the features are fed into GCN module to obtain patch-to-patch correlation feature maps. Finally, the extracted features are concatenated to be fed into the linear layer for the final classification results.
These hybrid collaborative networks, which include CNNs and GCNs, show efficient performance in HSI processing. Nevertheless, some challenges persist in hybrid networks for HSI feature learning. For hybrid networks, the CNN module based on the single-scale kernel exhibits limited effectiveness in extracting features from original spectral and spatial information included in complex HSI data scenes. And the lack of multiscale features will inevitably lead to poor classification results. To extract graph-based high-level features, the GCN-based module employs multiple stacked graph convolutional layers, which inevitably results in oversmoothing issues. Considering that CNNs employ shared kernels across spectral feature maps to learn pixel spectral signatures and GCNs obtain pixel spectral signatures through two different matrix multiplications, the CNN-based spectral signatures may have a certain degree of incompatibility with the GCN-based spectral signatures. Therefore, directly integrating the two different types of pixel spectral signatures can result in degraded final classification accuracy.
In this article, we propose a novel pyramid cascaded convolutional neural network with graph convolution (PCCGC) for HSI classification. It contains two parallel subnetworks, e.g., a CNN-based subnetwork and a GCN-based subnetwork. Specifically, from the perspective of the CNN-based subnetwork, it includes a spectral pyramid residual cascaded module and a spatial pyramid convolution cascaded module. The spectral module features a designed spectral pyramid hybrid convolution block and multiple 3D spectral convolution layers, which are connected in a cascaded manner for multiscale spectral signature extraction. Moreover, considering that HSIs have rich spectral signatures, a residual connection is employed for spectral signature extraction. The spatial module is similar to the spectral module for multiscale spatial feature extraction. The difference between the two modules is the 3D convolution kernel used. Then, an adaptive feature-weighted fusion strategy is utilized to fuse multiscale spectral and spatial features based on their respective weights. From another perspective of the GCN subnetwork, a band selection network (BSNet) is used to learn the spectral signatures in the HSI using nonlinear inter-band dependencies. Then, a spectral-enhanced GCN module is utilized to learn and accentuate the important information in the spectral matrix. And to prevent the oversmoothing problem and learn deep features, multiple graph convolution layers are utilized in a one-shot strategy. Subsequently, a mutual-cooperative attention mechanism is constructed that can align the spectral signatures between a BSNet-based matrix with a spectral-enhanced GCN-based matrix for pixel-wise spectral signature integration. It can transfer the spectral features extracted by BSNet to the GCN-based feature matrix through cross multi-head self-attention blocks, and transfer the spectral features learned by the spectral-enhanced GCN module to the BSNet-based spectral feature matrix through cross multi-head self-attention block. Finally, an additive fusion strategy is utilized to fuse the features extracted by the CNN-based and the GCN-based subnetworks. Our main contributions are as follows:
(1) To extract multiscale spectral and spatial features from complex HSI datasets, the spectral pyramid residual cascaded module and spatial pyramid convolution cascaded module are designed. The spectral module includes a devised spectral pyramid hybrid convolution block and multiple 3D spectral convolution layers, which are connected in a cascaded manner. Moreover, considering that HSIs have rich spectral signatures, a residual connection is employed to enhance spectral signature extraction. The spatial module is similar to the spectral module but is used for spatial feature extraction. Furthermore, the 3D convolution kernels used in spectral and spatial modules are different, which benefits the extraction of spectral and spatial features separately. Then, an adaptive feature-weighted fusion strategy is utilized to fuse multiscale spectral and spatial features based on their respective weights.
(2) To model the important spectral relations of the samples, a spectral-enhanced GCN module is employed. It can strengthen the deep significant spectral relations based on the constructed graph and capture the interconnectivity between pixels as well as the interdependencies among spectral signatures. To prevent the oversmoothing problem, the multiple graph convolution layers in the spectral-enhanced GCN module are stacked in a one-shot strategy.
(3) A mutual-cooperative attention mechanism is constructed to align the spectral signatures between the BSNet-based matrix and the spectral-enhanced GCN-based matrix for spectral signature integration. It transfers the spectral features extracted by BSNet to the GCN-based feature matrix through a cross multi-head self-attention block, and transfers the spectral features learned by the spectral-enhanced GCN module to the BSNet-based spectral feature matrix through another cross multi-head self-attention block. Subsequently, the two aligned matrices are concatenated for spectral signature integration.
(4) A novel method called the PCCGC is proposed to realize hyperspectral image classification. PCCGC can extract CNN-based multiscale spectral and spatial features, which are then fused adaptively. In addition, PCCGC utilizes BSNet and spectral-enhanced GCN for significant pixel-wise spectral signature extraction, and these extracted pixel-wise spectral signatures are integrated using a mutual-cooperation attention mechanism. Furthermore, the integrated spectral signature are added to the CNN-based features, resulting in the proposed model achieving good classification performance.
The remainder of this article is structured as follows: related work is shown in Section 2, the devised PCCGC is characterized in Section 3, the experimental results are listed in Section 4, some parameters of PCCGC are discussed in Section 5, and the conclusion is presented in Section 6.

2. Related Work

2.1. Convolutional Neural Network

An HSI data patch with a size H × W × D is specified as input data, where H × W indicates the spatial size, and D represents the number of spectral bands [48]. In (1), the 3D convolution has p 3D convolution kernels of size ( h × w × c ) . Following the 3D convolution process, p feature maps of size ( H h + 1 ) × ( W w + 1 ) × ( D c + 1 ) are generated. Moreover, by calculating the dot product between the local area position ( x , y , z ) and the weight matrix, each feature map ( F ) is obtained [49]. The output of a neuron v l , i x , y , z at the position ( x , y , z ) of the i -th F in the l th layer can be calculated by:
v l , i x , y , z = δ p h = 0 H l 1 w = 0 W l 1 c = 0 C l 1 k l , i , p h , w , c × v l 1 , p x + h , y + w , z + c + b l , i
where δ indicates the activation function, such as Mish, and b l , i is the bias of the i th F in the l th layer. The p index indicates the connection between the current F and the F in the previous layer. W l and H l are indicate the width and height of the 3D convolution kernel in the spatial dimension, respectively. C l refers to the 3D convolution kernel size of the spectral dimension. The weight k l , i , p h , w , c is used to convolve the input data cube v l 1 , p x + h , y + w , z + c in 3D convolution kernels, with an offset of ( h , w , c ) [50].
The (1) in our manuscript is the process of the 3D convolution, which is similar to 1D and 2D convolution. However, it is essential to note that the input format of a 3D convolutional network is ( B b a t c h , C c h a n n e l , H h e i g h t , W w i d t h , D s p e c t r a l ) . The 3D feature extraction model has demonstrated itself to be very effective in simultaneously capturing the spatial and spectral features of 3D feature maps by applying 3D kernels to 3D hyperspectral image data scenes [8,51]. Compared with the 1D convolution and 2D convolution operation process for HSI data with rich spectral signatures, the 3D convolution can greatly decrease spectral distortion phenomenon and learn more information (e.g., spatial-spectral correlation characteristics and absorption differences between adjacent spectral bands). Moreover, the 3D CNN is theoretically well-suited to excavating 3D feature maps for HSI processing since HSIs are usually denoted as a 3D patch cube.

2.2. Graph Convolutional Network

Graph neural networks (GNNs) can generalize the convolution process from grid-based data to graph-based data. The fundamental concept is to describe a node V with its own feature and neighbors’ feature. The model based on graph convolution can learn the high-level node feature representation through multiple stacked convolutional layers. And, GNNs fall into two categories [52], being spectral-based [53] and spatial-based [54] methods. And the spectral-based GNN methods define convolution in the graph signal processing. Spatial-based GNN methods define convolution by the information propagation strategy. Among Spatial-based and Spectral-based GNN methods, the GCN is widely employed due to its generality.
The undirected graph is typically defined as G = ( V , E ) , where V denotes the set of nodes or vertices, and E represents the set of edges. According to the undirected graph G , the adjacency A is constructed. Based on the convolution on the undirected graph, here is a layer-by-layer propagation rule for multiple layers GCN, defined as follows:
H ( i + 1 ) = φ ( D ~ 1 2 A ~ D ~ 1 2 H i W i )
where A ~ = A + I is termed as renormalization of A , A is the adjacency matrix of G , and I is the identity matrix. D ~ is defined as renormalization of D , and D i i = j ( A i j ) is a diagonal matrix indicating the degree of A . φ ( ) indicates an activation function, such as ELU(). H ( i + 1 ) R N × D and H ( i ) R N × D is the matrix of ( i + 1 ) th and ( i ) th layer, respectively. Besides, H 0 = X , where X indicates a matrix of feature vectors of the input node. W i represent the trainable weight matrix.

2.3. CNN and GCN for HSI Classifications

Considering that HSI data has rich spectral and spatial information, an effective model is well-suited to HSI data classification. CNNs can effectively extract local features using shared weight kernels. Based on different convolutional kernels, 1D CNNs extract spectral signatures, 2D CNNs extract spatial features, and 3D CNNs extract spectral-spatial features. The use of CNNs can greatly improve HSI processing performance. Meanwhile, GCNs generalize the convolution operation to graph data [8], allowing for the learning of node feature representations. High-level feature representations can be captured by multiple stacked GCN layers [52]. In HSI data, GCNs are employed to capture spatial contextual structure information, which is advantageous for HSI information processing. Based on the above-mentioned, some models combining CNNs with GCNs are designed for HSI classification. Liu et al. [43] design a novel heterogeneous network called CNN-enhanced GCN. Specifically, the 2D CNN is used to extract features from local-range regular regions, while the GCN is employed to learn features from long-range irregular region. The features extracted by both CNN and GCN are then used as complementary features for HSI classification. Lu et al. [46] develop a novel SDGCP method. It employs a separable deep GCN for learning long-range contextual structure features. The learned features are then combined with local complementary features extracted by CNN for HSI classification. Wang et al. [55] design a novel DF2Net for HSI classification, which includes two subnetworks: a spectral–spatial hypergraph convolutional subnetwork for learning long-range and high-order correlations, and a spectral–spatial convolution subnetwork for pixel-wise local feature extraction.

3. Methods

3.1. The Overall Structure of PCCGC

In this article, we propose a novel PCCGC method for HSI classification. As depicted in Figure 1, it contains two parallel subnetworks, e.g., a CNN-based subnetwork and a GCN-based subnetwork. Specifically, from the view of CNN subnetwork, a spectral pyramid residual cascaded module (SpePRCM) is used to extract multiscale spectral signatures. Meanwhile, a spatial pyramid convolution cascaded module (SpaPCCM) is employed to extract multiscale spatial features. And, the features extracted by the CNN subnetwork are more robust for the proposed model in classifying HSIs. Furthermore, an adaptive feature-weighted fusion strategy is utilized to adaptively fuse multiscale spectral and spatial features based on their respective weights. From another perspective of the GCN subnetwork, a BSNet is used to learn the spectral signatures in the HSI using non-linear inter-band dependencies, which also reduces the computational cost of GCN. Then, the spectral-enhanced GCN module is utilized to learn and accentuate the important information in the spectral matrix. Subsequently, a mutual-cooperative attention mechanism is constructed to align the spectral signatures between a BSNet-based matrix and a spectral-enhanced GCN-based matrix for spectral signature integration. Finally, the additive fusion strategy is utilized to fuse the features extracted from GCN-based and CNN-based subnetworks. In the following, we will elaborate on the functionalities of each module in the proposed model.

3.2. Adaptive Feature-Weighted Feature Fusion Based SpePRCM and SpaPCCM

Considering the HSI data cubes, which contain plentiful spectral signatures and a lot of spatial information, the SpePRCM and SpaPCCM are devised to extract multiscale spectral and spatial features separately. Moreover, the spectral pyramid hybrid convolution (SpePHC) block and spatial pyramid hybrid convolution (SpaPHC) block are included in SpePRCM and SpaPCCM separately. And then an adaptive feature-weighted fusion strategy is employed to fuse the extracted multiscale spectral and spatial information. Furthermore, the 3D convolutional layer used hereinafter refers to 3D convolution, Mish activation function, and Batch Normalization.

3.2.1. Spectral Pyramid Hybrid Convolution Block

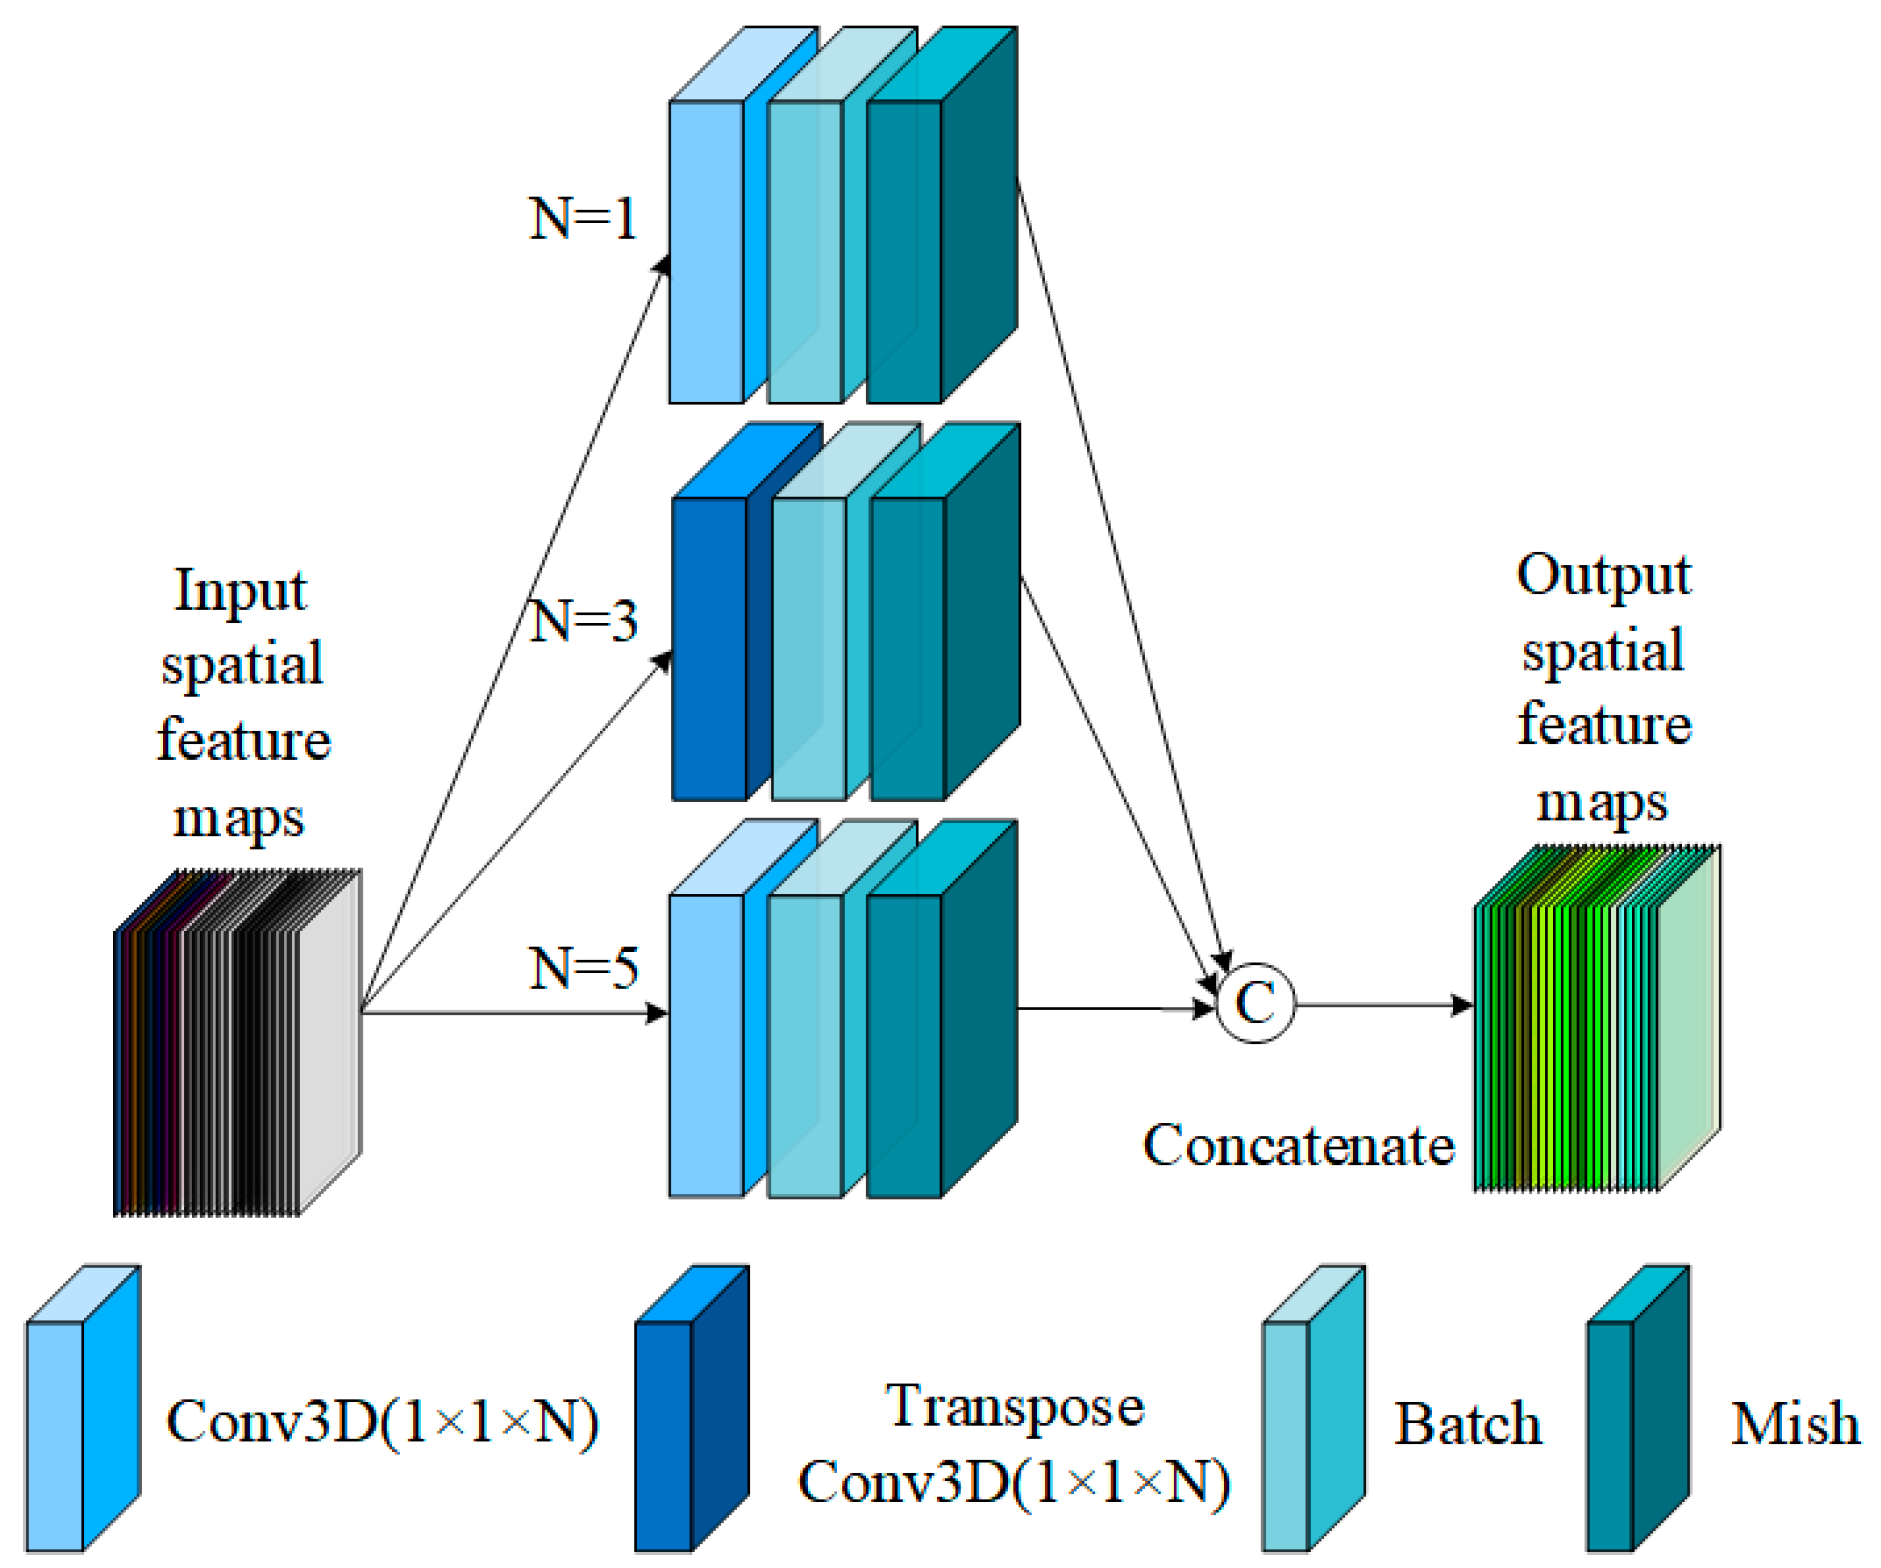
The proposed SpePHC, as shown in Figure 2, includes a pyramid architecture with different types of convolutional layers, featuring various sizes of kernels and varying numbers of output feature channels. The processed spectral feature maps F M s p e i R h × w × d , where i indicates the i th layer, are fed into the SpePHC block, then F M s p e i are processed in parallel by three different steps, e.g., S t e p _ 1 ,   S t e p _ 2 , and S t e p _ 3 . For S t e p _ 1 , the F M s p e i are convolved by the 3D convolutional layer C o n v s p e i _ 3 located at the bottom of the pyramid architecture, with the purpose of learning the spectral feature using a kernel size of 1 × 1 × 5 . This results in the spectral feature maps F M s p e ( i + 1 ) _ 3 , which have an output dimension of 36 . For S t e p _ 2 , the F M s p e i are convolved by the 3D Transpose convolutional layer T r a n s C o n v s p e i _ 2 located at the middle of the pyramid architecture, with the purpose of learning the spectral feature using a kernel size of 1 × 1 × 3 . This yields the spectral feature map F M s p e ( i + 1 ) _ 2 , which has an output dimension of 24 . For S t e p _ 3 , the F M s p e i are convolved by the 3D convolutional layer C o n v s p e i _ 1 located at the top of the pyramid architecture, which uses a kernel size of 1 × 1 × 1 . The output dimensions of resulting spectral feature maps F M s p e ( i + 1 ) _ 1 are 12 . Then, we concatenate the three different spectral feature maps using the concatenate operation in the channel dimension, and the output spectral feature maps F M s p e i + 2 are obtained. The detailed operation process is shown in the following:
F M s p e ( i + 1 ) _ 1 = C o n v s p e i _ 1 ( F M s p e i )
F M s p e ( i + 1 ) _ 2 = T r a n s C o n v s p e i _ 2 ( F M s p e i )
F M s p e ( i + 1 ) _ 3 = C o n v s p e i _ 3 ( F M s p e i )
F M s p e i + 2 = C o n c a t ( F M s p e ( i + 1 ) _ 3 , F M s p e ( i + 1 ) _ 2 , F M s p e ( i + 1 ) _ 1 ) d i m = c h a n n e l
where C o n c a t ( ) d i m = c h a n n e l indicates the concatenation operation that operates on the channel dimension.

3.2.2. Spatial Pyramid Hybrid Convolution Block

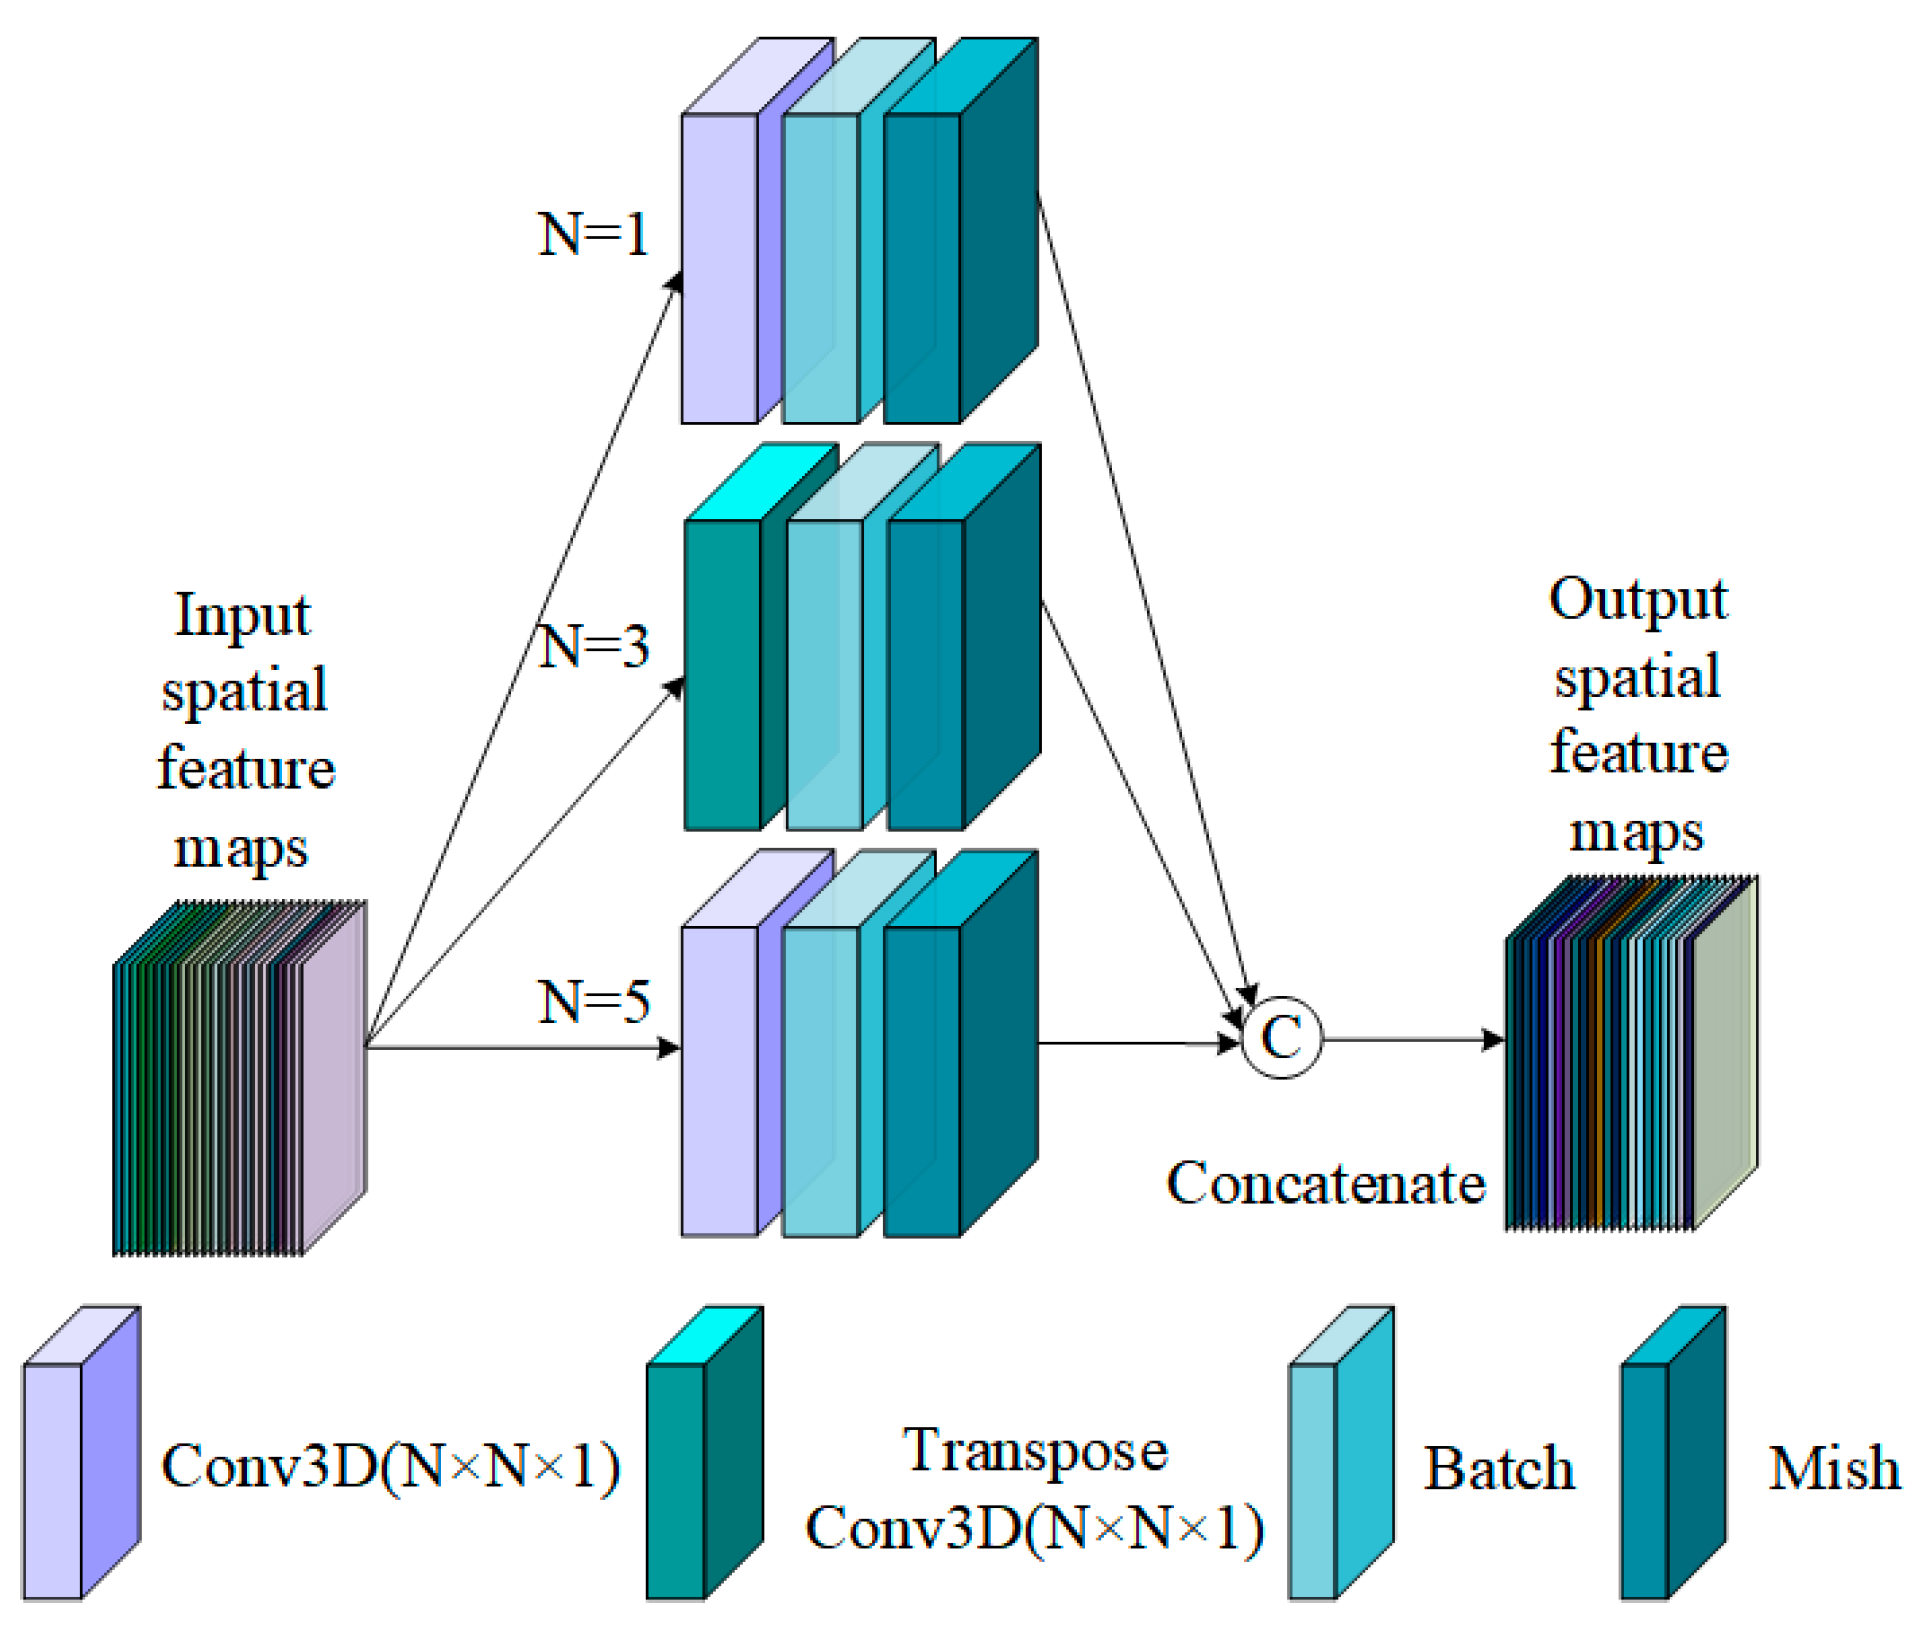
The proposed spatial pyramid hybrid convolution (SpaPHC), as shown in Figure 3, is employed to learn multiscale spatial features. It has almost the same pyramid architecture as SpePHC and includes three parallel steps for processing the processed spatial feature maps F M s p a i .
For the first and second step, it has almost the same procedures as the S t e p _ 1 and S t e p _ 2 in the SpePHC block, but with different kernel sizes within the 3D convolutional layer C o n v s p a i _ 1 and 3D Transpose convolutional layer C o n v s p a i _ 2 , which are 5 × 5 × 1 and 3 × 3 × 1 respectively. And then, two different spatial feature maps are generated, namely, F M s p a ( i + 1 ) _ 3 with output dimension 12, and F M s p a ( i + 1 ) _ 2 with output dimension 24. For the third step, the F M s p a i are convolved by the 3D convolutional layer C o n v s p a i _ 1 located at the top of the pyramid architecture using a kernel size of 1 × 1 × 1 , resulting in the spatial feature maps F M s p a ( i + 1 ) _ 1 with an output dimension of 48 . Then, we concatenate the three different spatial feature maps in the channel dimension, the output spatial feature maps F M s p a i + 2 are obtained.
F M s p a ( i + 1 ) _ 1 = C o n v s p a i _ 1 ( F M s p a i )
F M s p a ( i + 1 ) _ 2 = T r a n s C o n v s p a i _ 2 ( F M s p a i )
F M s p a ( i + 1 ) _ 3 = C o n v s p a i _ 3 ( F M s p a i )
F M s p a i + 2 = C o n c a t ( F M s p a ( i + 1 ) _ 3 , F M s p a ( i + 1 ) _ 2 , F M s p a ( i + 1 ) _ 1 ) d i m = c h a n n e l
The C o n c a t ( ) d i m = c h a n n e l indicates the concatenation operation that operates on the channel dimension of the spatial feature maps.
The proposed SpePHC and SpaPHC can generate spectral and spatial feature maps with various receptive field and corresponding output feature channels, learning information about more granular-level objects with larger output feature channels, as well as capturing more details about context information with smaller output feature channels.

3.2.3. The Multiscale Spectral and Spatial Feature Extraction of SpePRCM and SpaPCCM

In the spectral pyramid residual cascaded module (SpePRCM), the original feature map F M H S I j , j indicates the j th layer, and is first processed by the 3D convolutional layer C o n v s p e j with a kernel size of 1 × 1 × 7 to extract the spectral signatures. This generates the spectral feature maps F M s p e j + 1 with the output channel number of 46 . To extract the multiscale spectral features, the F M s p e j + 1 are fed into the SpePHC block P s p e ( x ; ε ) , the F M s p e j + 2 are generated, where ε is a learnable parameter. Then, the concatenation operation is employed on this F M s p e j + 1 and F M s p e j + 2 along the channel dimension. To further extract the spectral features from the previous feature maps and prevent information loss, the 3D convolutional layer C o n v s p e j + 2 with a kernel size of ( 1 × 1 × 1 ) is employed, to obtain the multiscale spectral feature maps F M s p e j + 3 . At the same time, the residual connection R e s ( ) is added to the F M s p e j + 1 and F M s p e j + 3 to assist the spectral pyramid feature extraction module in learning the original spectral signatures, thereby benefiting the improvement of classification accuracy. Finally, to fully extract the multiscale spectral signatures in the HSIs and decrease the depths of the HSI data cube, the 3D convolutional layer C o n v s p e j + 3 with a kernel size of ( 1 × 1 × ( b a n d 7 2 + 1 ) ) is utilized to obtain the spectral feature maps F M s p e j + 4 with an output channel number of 72 . The detailed operation is presented below:
F M s p e j + 1 = C o n v s p e j ( F M H S I j )
F M s p e j + 2 = P ( F M s p e j + 1 )
F M s p e j + 3 = C o n v s p e j + 2 ( C a t ( F M s p e j + 1 , F M s p e j + 2 ) d i m = c h a n n e l )
F M s p e j + 4 = C o n v s p e j + 3 ( R e s ( F M s p e j + 1 , F M s p e j + 3 ) )
The spatial pyramid convolution cascaded module includes the 3D convolutional layer C o n v s p a j with a kernel size of 1 × 1 × b a n d , which is employed to squeeze the depth of the F M H S I j , resulting in the spatial feature maps F M s p a j + 1 . Then, the SpaPHC block P s p a ( x ; ε ) is utilized to extract the multiscale spatial feature, yielding the spatial feature maps F M s p a j + 2 . And the subsequent operations in the spatial pyramid feature extraction module are similar to the spectral signature extraction process in the spectral pyramid feature extraction module. The detailed multiscale spatial feature extraction process in the spatial pyramid convolution cascaded module is shown as follows:
F M s p a j + 1 = C o n v s p a j ( F M H S I j )
F M s p a j + 2 = P ( F M s p a j + 1 )
F M s p a j + 3 = C o n v s p a j + 2 ( C a t ( F M s p a j + 1 , F M s p a j + 2 ) d i m = c h a n n e l )
The F M s p a j + 3 are the output spatial feature maps generated from the spatial pyramid convolution cascaded module (SpaPCCM). The SpePHC and SpaPHC are included in CNN-based subnetwork which make it more generalized and robust while learning from different datasets.

3.2.4. The Multiscale Spectral and Spatial Feature Fusion with the Adaptive Feature-Weighted Fusion Strategy

Considering the importance of the feature for classification results, the extracted multiscale spectral and spatial features play a significant but unequal role. Meanwhile, to fully harness the extracted spectral and spatial features, inspired by [56], the adaptive feature-weighted fusion strategy is employed. It can fuse the spectral signatures and spatial features adaptively. In this strategy, the extracted features located at the same location are added element-wise, aggregating information across spectral signatures and spatial features, thereby enhancing the features that are important to the classification accuracy. Meanwhile, to dynamically allocate weights, two different weight coefficients, namely, α _ 1 and α _ 2 , are used. To avoid the poor classification accuracy that could result from these two values being too large or too small, a softmax function is applied to adjust the values of α _ 1 and α _ 2 . Then, α _ 1 and α _ 2 will balance the spectral signatures and spatial features, enhancing the fusion of different information according to the impact of various features on classification accuracy. The detailed operation is illustrated as follows:
F M = α _ 1 · F M s p e j + 4 + α _ 2 · F M s p a j + 3 ,   ( α _ 1 + α _ 2 = 1 )

3.3. Spectral-Enhanced GCN Module

To learn the features in the non-grid image data scene, the GCN is employed. It can capture information different from the CNN, thereby enhancing the classification accuracy. The graph is usually defined as G = ( V , E ) , where V represent the set of nodes or vertices, and E represent the set of edges. Assume v i ϵ V to indicate a node and e i j = v i , v j ϵ E to indicate an edge starting from v i to v j . The neighborhood of a node v is characterized by the set N U M ( v ) = { u V | v , u E } . The adjacency matrix A n × n of graph G is defined as follows:
A n × n = 1 , e i j E 0 , e i j E
Graph G might possess node attributes denoted as S , where S R m × c is a node feature matrix, and s v R c represents the feature vector of a node v . Simultaneously, a graph G might possess edge attributes denoted as S e , where S e R m × d is an edge feature matrix, and s e v , u R d denotes the feature vector of an edge ( v , u ) .
In this part, the spectral-enhanced GCN module is developed to extract and accentuate the features from the spectral channel. Considering the input scalar types required by the GCN, we need to construct an undirected graph G = ( V , E ) based on each patch from HSI data. Due to the abundance of spectral signatures in each pixel of original HSI, the GCN methods based on the origin HSI data will create a larger graph, resulting in an abundance of computational resource costs [37,57]. To address the above-mentioned issue, inspired by [58], we employ the BSNet to select important spectral signatures from the original HSI patch F M H S I R h × w × c in the spectral channel.
F M B S = B S N e t ( F M H S I ; θ )
where F M B S is the output of BSNet, and B S N e t ( ) function indicates the BSNet. Here, θ is the learnable parameter in BSNet. This selection enhances the performance of GCN for HSI classification by considering the nonlinear interdependencies among different spectral bands.
By stacking multi-layer GCN, it is possible to learn deeper node information from the constructed graph. However, stacking a certain number of GCN layers will result in a decrease in model performance and lower classification accuracy. In this part, to avoid the mentioned issues, the multi-hop adjacency matrix [57] is constructed, in which record nodes are at a distance of d hops from the selected nodes. It can excavate the underlying feature relationships and enlarge the receptive field. The used multi-hop adjacency matrix is constructed in the spectral channel to help the GCN learn the spectral signature in the HSI.
For constructing the multi-hop adjacency matrix, the F M H S I processed by the BSNet is first transformed into feature nodes M B S R h w c :
M B S = r e s h a p e F M B S
where M B S is the result processed by BSNet, abbreviated as the BS-based feature matrix, and r e s h a p e ( ) indicates the reshape operation. Then, the multi-hop adjacency matrix A is constructed based on the M B S .
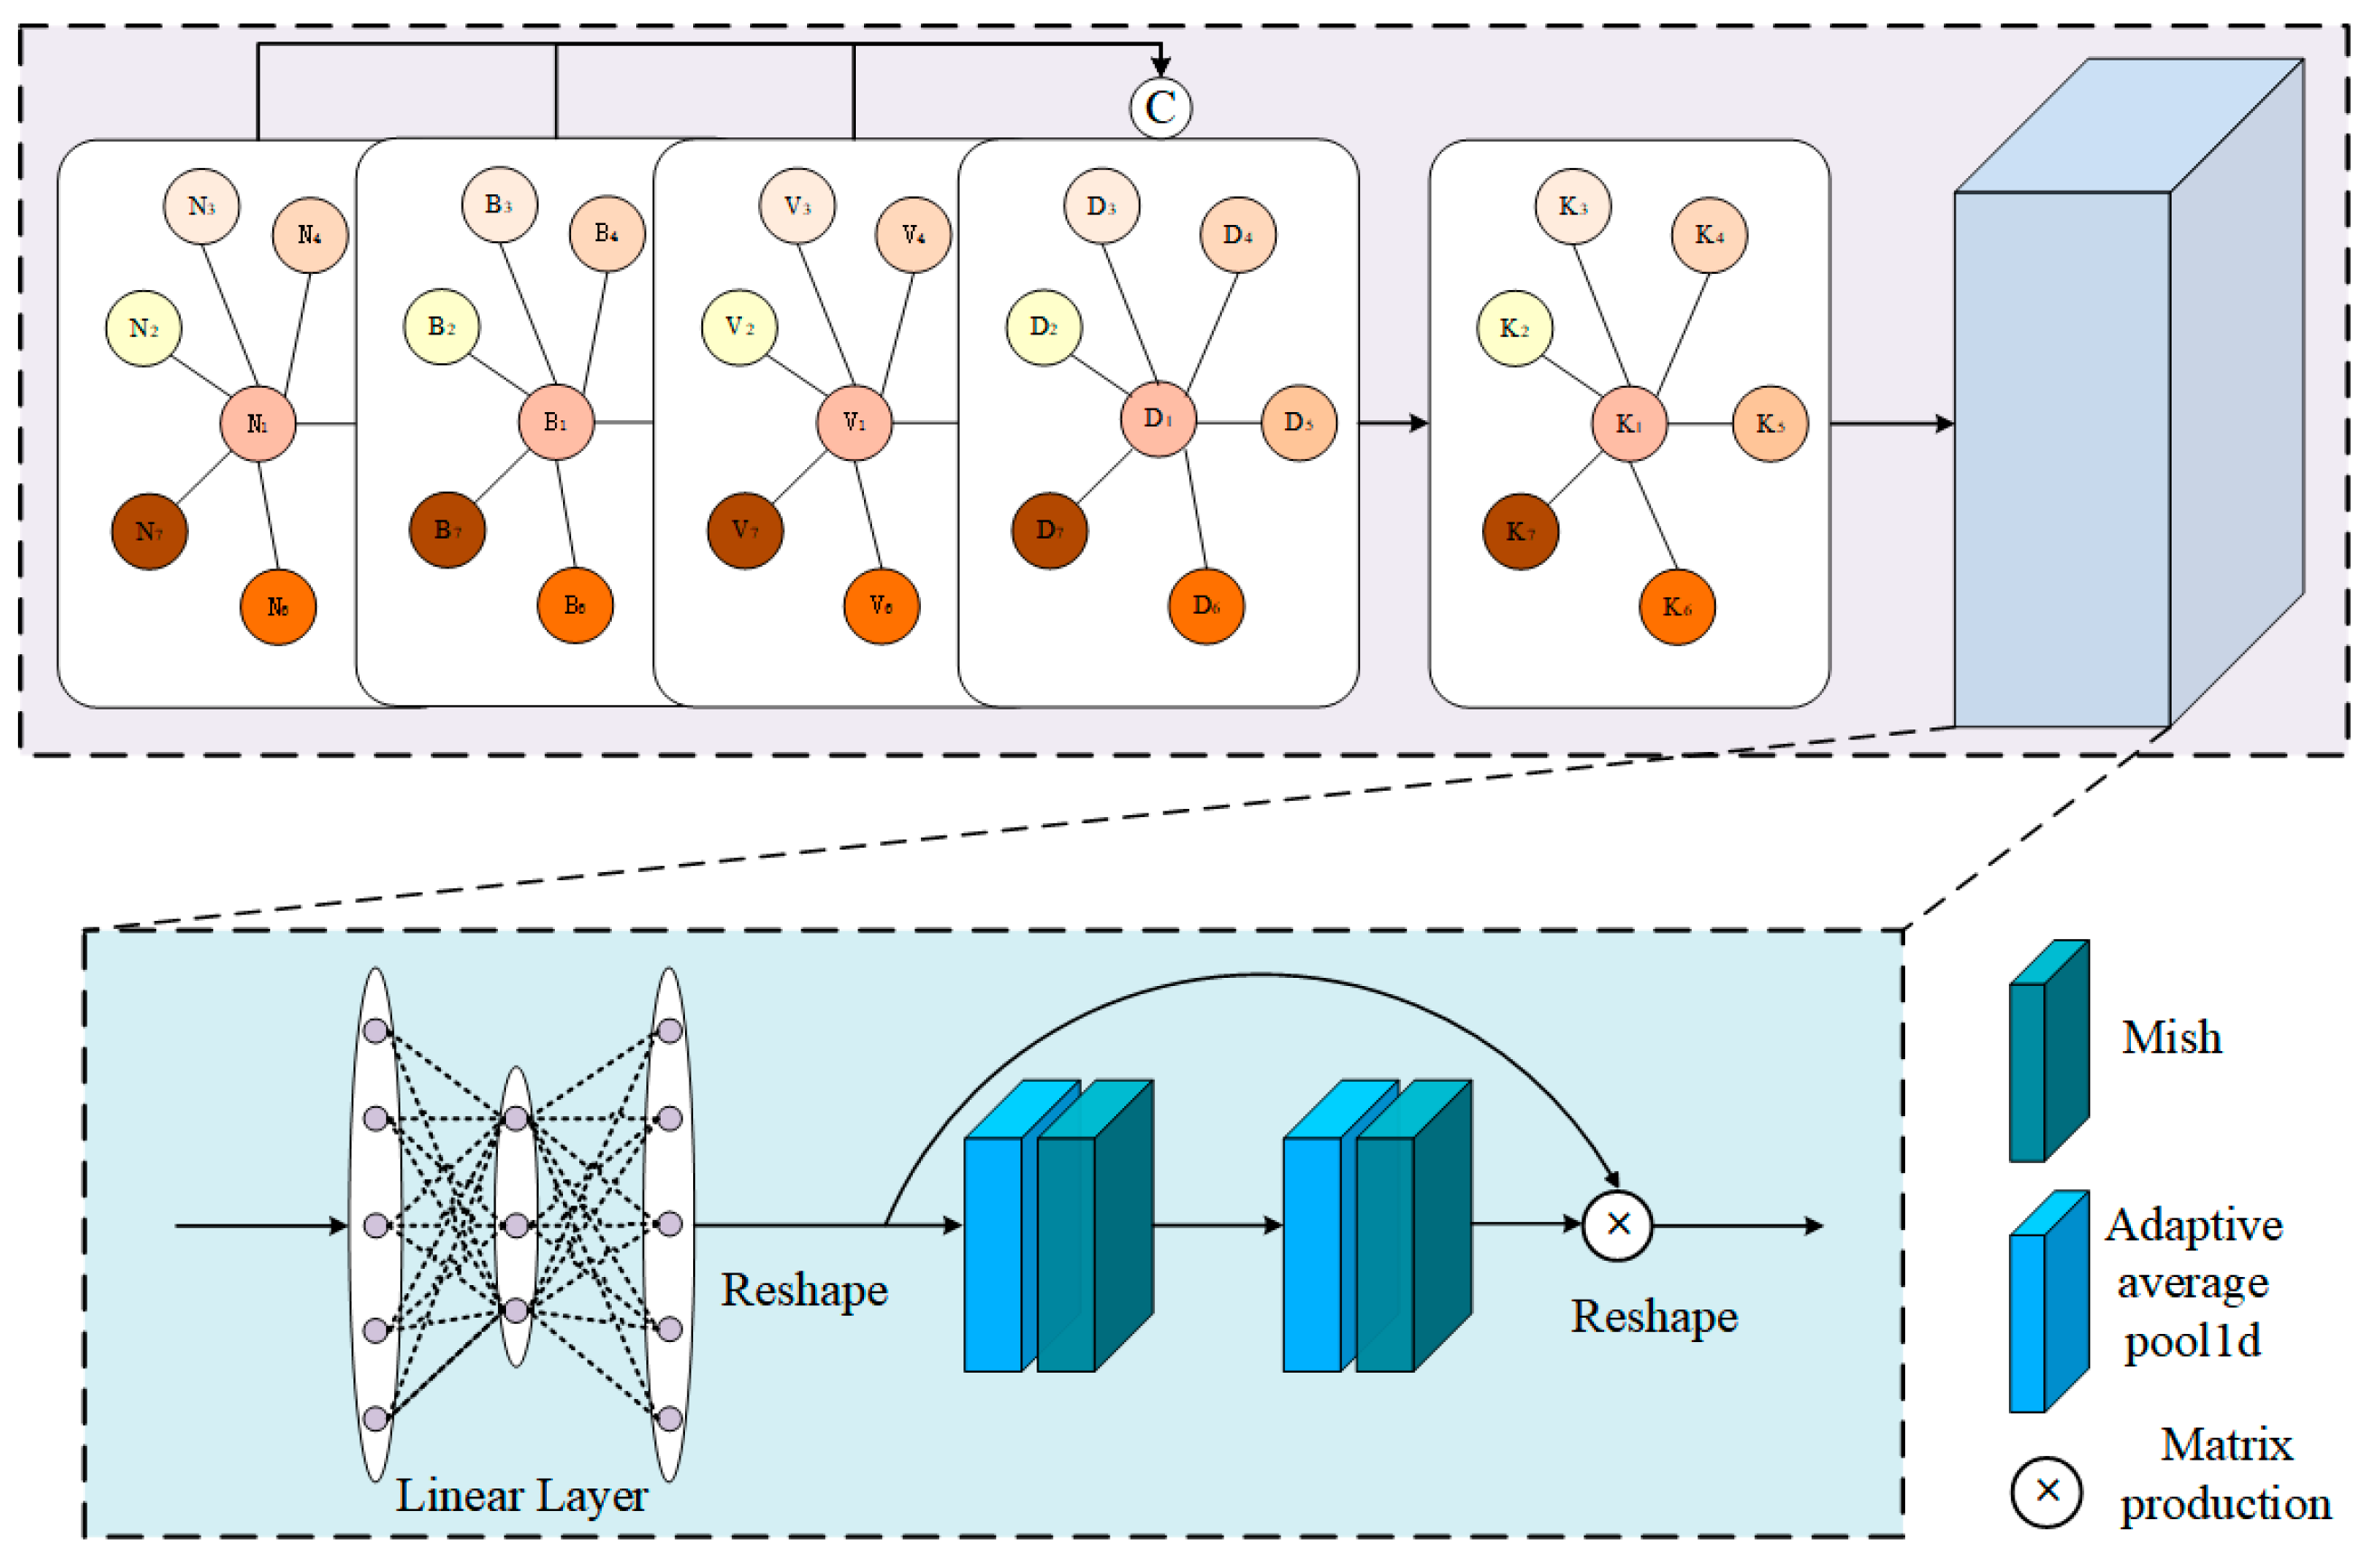
The spectral-enhanced GCN module, depicted in Figure 4, is employed to learn the feature relationships among multi-hop adjacency matrix through a multi-layer GCN. To learn the features of HSIs from the perspective of GCN, a four-layer cascaded GCN, in which the number of GCN layers is discussed in the Section 5.2, is first implemented in a one-shot strategy. In each GCN layer, a collection of feature nodes from the M B S , denoted as N i = N 1 , N 2 , N 3 , , N n , N R , where n represents the number of feature nodes, are fed into the GCN layer. And a learnable parameter matrix W R d × d is employed on each node, resulting in the nodes N j i + 1 with comprehensive expressive abilities. Then, the nodes N i + 1 j are multiplied by the adjacency matrix A . An exponential linear unit (Elu) activation function is used to accelerate the GCN learning process, which is denoted as:
E l u N j i + 1 = N j i + 1 , i f   N j i + 1 > 0 α exp N j i + 1 , i f   N j i + 1 0
In the above expression, the hyperparameter α controls the points at which Elu function saturates towards negative values for negative inputs in the GCN layer. Then, the concatenation operation is utilized to concatenate the features from the outputs of the four GCN layers.
F i + 5 = E l u ( N i , W i , A )
F i + 5 = C a t ( F i + 1 , F i + 2 , F i + 3 , F i + 4 )
where C a t ( ) denotes the concatenation operation. F i + 1 indicates the features yielded from the i -th GCN layer. To mitigate the overfitting problem in the four-layer GCN, which may lead to a decrease in HSI classification performance, the dropout technique is utilized. The parameter p (here, we set the p value to 0.3) in the dropout layer of each GCN layer is used as a threshold value that determines which part of the features in the GCN layer is dropped. To further learn and integrate information from the HSIs, another one-layer GCN is employed after these four GCN layers. Meanwhile, an Elu nonlinearity activation function is used. Finally, to ensure comparability among the features yielded from different GCN layers, the softmax function is applied.
F i + 6 = e x p ( E l u ( ( F i + 5 , W i + 5 , A ) ) ) k N i E l u ( ( F i + 5 , W i + 5 , A ) )
After obtaining the features extracted from the four-layer cascaded GCN and the one-layer GCN, we further enhance them through a spectral-enhanced method. Specifically, the linear layer is employed to improve the linear expressive skill of the features. Then, we reshape the features to obtain the feature matrix M 1 R c × h w . In order to learn the significant spectral signature, the two cascaded adaptive average pooling layers are used. Additionally, a Mish activation function is included in the adaptive average pooling layer to avoid gradient saturation. Then, the feature matrix M 2 R c × 1 is obtained. Finally, the M 1 R c × h w is multiplied with the M 2 R c × 1 to obtain the feature matrix M G C N R c × h w with significant information in the spectral channel. Furthermore, the important values in the spectral channel of the feature matrix are emphasized. And the detailed procedure is shown as follows:
M 1 = r e s h a p e ( F i + 6 )
M 2 = M i s h ( A A P o o l 2 ( M i s h ( A A P o o l 1 ( M 1 ) ) ) )
M G C N = M 1 M 2
where in Equation (33) indicates the matrix product operation. M G C N is the result of processing by a spatial-based GCN module, abbreviated as the GCN-based feature matrix.
In this module, the GCN layers are employed to learn the inherent features of nodes, which are different for CNN to extract. Then, the spectral-based method is employed to accentuate significant features in the spectral dimension. The significant spectral signature can be learned and accentuated, and the HSI classification performance can be enhanced through the spectral-enhanced GCN module.

3.4. Mutual-Cooperative Attention Mechanism

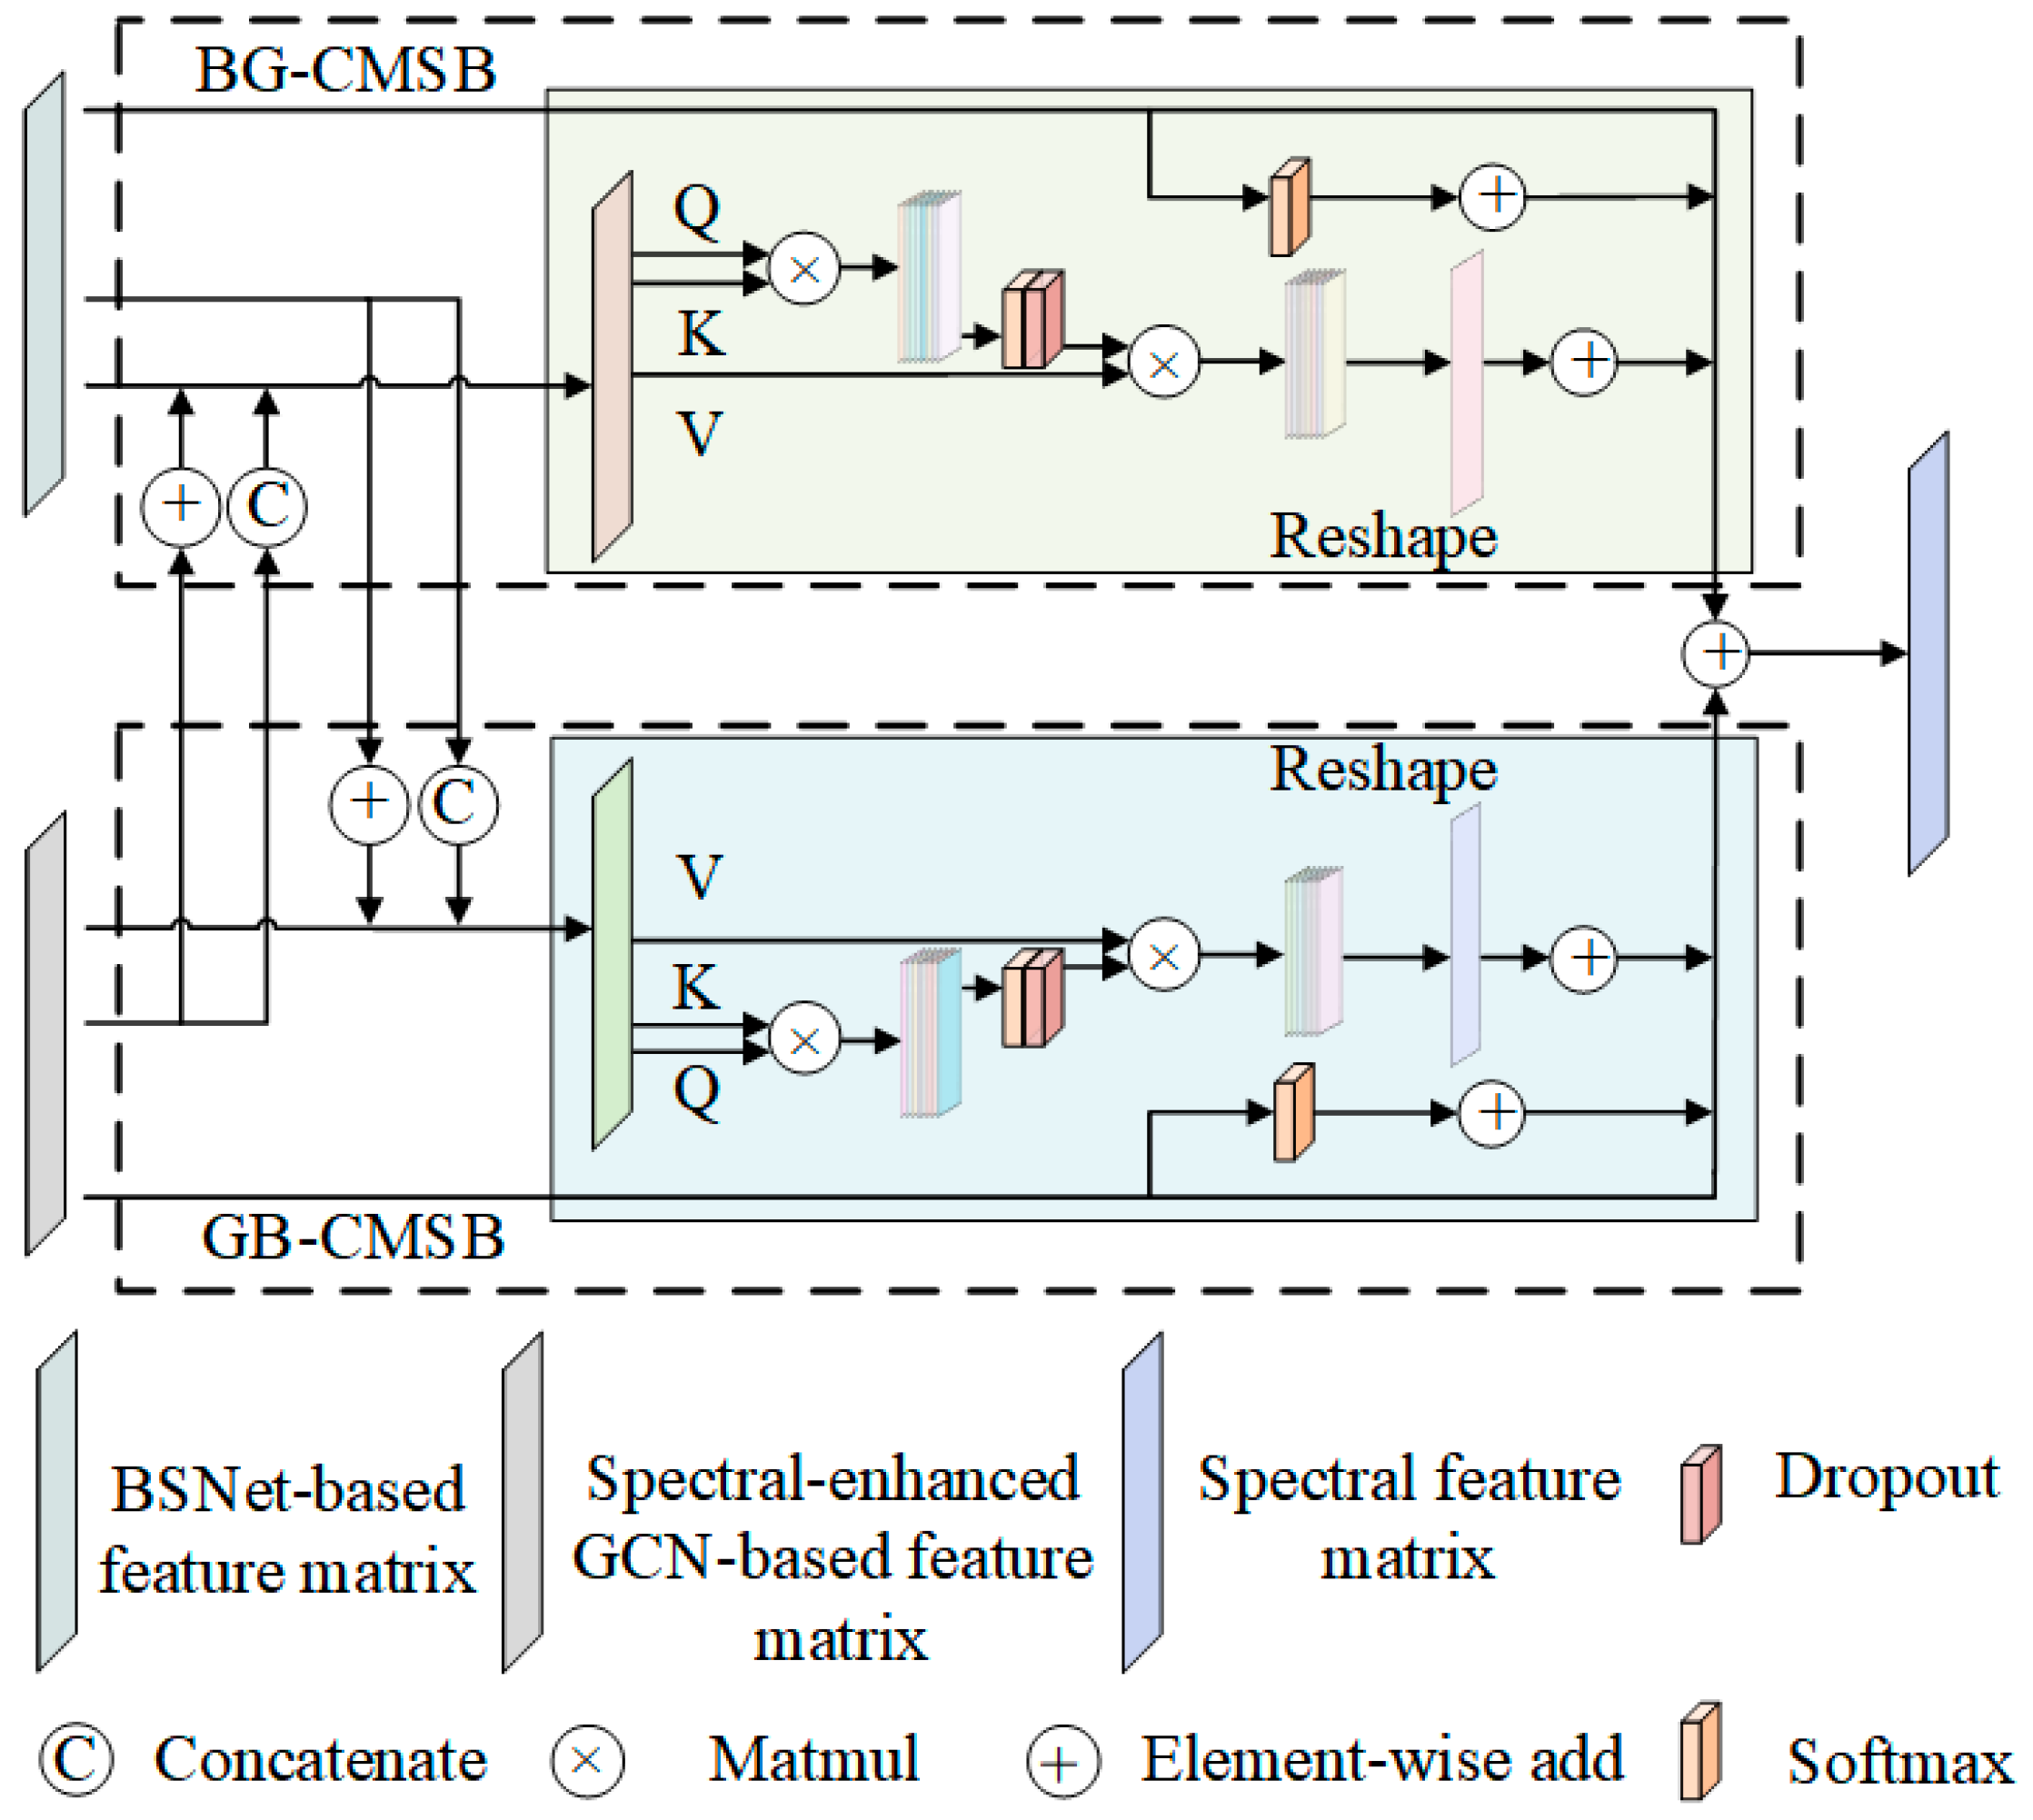
After obtaining the feature matrix M G C N , extracted by spectral-enhanced GCN module, and the feature matrix M B S , extracted by BSNet, we construct a customized mutual-cooperative attention mechanism (MCAM) to align the spectral signature between M G C N and M B S . As shown in Figure 5, the MCAM mainly includes two cross multi-head self-attention mechanisms (CMSM). One improved CMSM, referred to as the M B S to M G C N cross multi-head self-attention block (BG-CMSB), enables the transfer of spectral signatures from M B S into M G C N . Vice versa, the other CMSM, referred to as the M G C N to M B S cross multi-head self-attention block (GB-CMSB), enables the transfer of enhanced spectral signature from M G C N to M B S . Subsequently, the obtained two-feature matrices are merged using an element-wise addition operation. The detailed process is shown as follows:
M = A ( f B G C M S B M B S , M G C N , f G B C M S B M G C N , M B S )
where f B G C M S B ( ) , f G B C M S B ( ) , and A ( ) represent the BG-CMSB, GB-CMSB, and the element-wise addition, respectively. M indicates the output feature matrix of the mutual-cooperative attention mechanism.

3.4.1. BS-Based Feature Matrix to GCN-Based Feature Matrix Cross Multi-Head Self-Attention Block

The proposal of this block is aimed at improving the transfer and expression of spectral signatures between BS-based feature matrix M B S and GCN-based feature matrix M G C N . Given M B S R h w × c and M G C N R h w × c are inputs to BG-CMSB. The BG-CMSB initially combines the M B S and M G C N using the element-wise addition, resulting in the feature matrix M B G i _ 1 . Then, M B G i _ 1 is concatenated with M B S to construct a new feature matrix. Next, the new feature matrix is separately multiplied with two different matrices, thereby linearly constructing the key K R h w × 2 c and value V R h w × 2 c simultaneously. At the same time, the M B S is used, being multiplied with a weight matrix to linearly construct the query Q R h w × c . Additionally, the Q , K , and V are all projection matrices. Then Q , K , and the scale factor are processed by softmax, subsequently with V , to calculate the cross multi-head self-attention score from M B S to M G C N . Moreover, the scale factor is used to control the gradient of the model during the training process. The detailed overall operation is shown as follows:
C A B G = A t t e n t i o n Q , K , V = s o f t m a x ( Q K T d d i m )
d d i m = 1 c
To obtain stable results, we execute the attention calculation process multiple times in parallel; here, it is executed eight times. Then, we reshape the C A B G , and the linear operation is used to project the reshaped attention score into M B G i _ 2 R h w × c . Subsequently, a softmax operation is performed. To enhance the important features, the residual connection is added on the M B S . Subsequently, element-wise addition is used to concatenate the M B S and the processed result of M B S using softmax as well as M B G i _ 2 . The process is shown as follows:
M B G C M S B = M B S + s o f t m a x M B S + M B G i _ 2
where M B G C M S B indicates the resulting feature maps from BG-CMSB, and s o f t m a x ( ) is the softmax function.

3.4.2. GCN-Based Feature Matrix to BS-Based Feature Matrix Cross Multi-Head Self-Attention Block

This block is devised to transfer and improve the expression of enhanced spectral signature between GCN-based feature matrix M G C N and BS-based feature matrix M B S . Given M B S R h w × c and M G C N R h w × c as inputs to GB-CMSB, the GB-CMSB first combines the M G C N and M B S using the element-wise addition, resulting in the feature matrix M G B i _ 1 . Then, M G B i _ 1 is concatenated with M G C N to linearly build the key K R h w × 2 c and value V R h w × 2 c simultaneously. At the same time, the M G C N is employed to linearly construct the value Q R h w × c . The following operations are similar to those of the BG-CMSB:
M G B i _ 2 = r e s h a p e ( C A G B M G B i _ 1 , M G C N )
M G B C M S B = M G C N + s o f t m a x M G C N + M G B i _ 2
where C A G B is the result of the CMSM score from M G C N to M B S , and r e s h a p e ( ) indicates the reshape operation.
Then, the obtained M B G C M S B and M G B C M S B are concatenated to obtain an output result for the mutual-cooperative attention mechanism. With the help of the mutual-cooperative attention mechanism, integrating comprehensive spectral features from various neural networks has a positive impact on subsequent classification tasks.

3.5. Additive Feature Fusion Based on CNN-Based Subnetworks and GCN-Based Subnetworks

Considering that the features extracted from different network architectures may play different roles in HSI classification, it is important to fuse multi-type features with a proper fusion strategy. For instance, classification performance can be enhanced when different types of features are effectively integrated. Conversely, when different types of features cannot be effectively integrated, the classification performance may be degraded.
In this article, the proposed network includes two subnetworks: one is the CNN-based subnetwork, and the other is the GCN-based subnetwork, which includes a spectral-enhanced module and a mutual-cooperative attention mechanism. Specifically, we first reshape the features extracted from CNN subnetwork, and then a linear layer is utilized to yield the final classification performance of CNN subnetwork. Concurrently, the features extracted from the GCN subnetwork are reshaped. An adaptive average pooling layer is utilized to produce the final classification performance of the GCN subnetwork. Finally, an additive fusion strategy is employed to achieve the final classification results of PCCGC. Based on the above operations, the CNN-based features can be well integrated with the GCN-based features in an additive strategy for the HSI processing.

4. Experiments

4.1. Experimental Datasets

In this part of the experiments, five widely used real HSI datasets are utilized to validate the robustness and practicality of our designed model, e.g., the Pavia University dataset, WHU-Hi-Honghu dataset, Houston University dataset, and Indian Pines dataset.
(1) Pavia University (PU) dataset: The PU is collected by using the ROSIS equipment over the University of Pavia, Italy, and its surrounding areas. The spatial area of the PU dataset is 610 × 340 pixels, with an approximate resolution of 1.3 m per pixel. The PU dataset in our experiment includes 103 spectral bands, spanning a spectrum wavelength from 430 to 860 nm. The quantities of samples for each class utilized in the training, validation, and testing sets are exhibited in Table 1.
(2) Houston University (Houston) dataset: The Houston dataset is gathered over the campus of University of Houston, Houston, USA. The spatial dimension size of the Houston dataset is 349 × 1905 pixels, with 144 spectral bands from 380 to 1050 nm, and the spatial resolution of Houston is about 2.5 m per pixel. The Houston dataset contains 15 categories, and the number of samples used for training, validation, and testing are recorded in Table 2.
(3) WHU-Hi-Honghu (Honghu) dataset: The Honghu dataset is obtained in Hubei Province, China via imaging sensors mounted on a UAV platform. And, the Honghu dataset has a spatial size of 940 × 475 pixels, containing 270 spectral bands spanning from 400 to 1000 nm. In our experiments, only 16 categories are selected due to the limitations of the utilized device. The numbers of training, validation, and testing samples for each selected class, as well as the corresponding totals, are listed in Table 3.
(4) Indian Pines (IP) dataset: The IP scene data is acquired using the Airborne/Infrared Imaging Spectrometer (AVIRIS) sensor over the Indian Pines area of northwestern Indiana. The spatial scale of the IP imagery is 145 × 145 pixels, consisting of 220 spectral bands ranging from 400 nm to 2500 nm. The IP image includes 16 categories, and the number of labelled samples for training, validation, and testing are displayed in Table 4.
(5) Xiongan New Area (Xiongan) dataset: The Xiongan (Matiwan Village) scene data is acquired using the Visble and Near-Infrared Imaging Spectrometer over the Xiongan Country, and Baiyangdian Lake. The spatial range of the Xiongan imagery is 3750 × 1580 pixels, containing 250 spectral bands ranging from 400 to 1000 nm. The Xiongan image includes 19 categories, and the number of labelled samples for training, validation, and testing are listed in Table 5.

4.2. Experimental Setting

4.2.1. The Details of Experiment Implementation

To validate the superior classification performance of our devised method, fourteen different comparative methods, e.g., SSRN [59], DBDA [60], SSGCA [61], PCIA [62], MDBNet [63], HDDA [64], DBPFA [65], ChebNet [66], GCN [67], MVAHN [68], DGFNet [38], DKDMN [69], FTINet [49], and MRCAG [41] are used for comparison with our method, and the description of each comparative method is shown in Section 4.2.2. To provide a clearer perspective on the classification results for each method, the metric of overall accuracy (OA), average accuracy (AA), and kappa ( K ), and each class classification accuracies are used to assess their classification performance. All experiments are performed in the same environment, namely, a mini base station equipped with 128 GB of DDR4 RAM as well as 8 × NVIDIA GeForce RTX 2080Ti Graphical Processing Units, with a memory of 11 GB. The software environment used in our experiment includes CUDA Version 11.6, PyTorch 1.10.1, and python 3.8.
To keep a fair comparison environment, we standardized the parameters, optimizer, and architecture of the other fourteen comparison methods to be consistent with the experimental settings of our proposed model. During the training process of our proposed model, the parameter is updated by applying the Adam optimizer. And, the sets {0.0005, 350}, {0.0009, 150}, {0.0007, 120}, and {0.0003, 130} are elected as the learning rate and number of epochs for the proposed model in the PU, Houston, Honghu, and IP data scenes separately, which is discussed in Section 5.3. Moreover, the set {0.0007, 200} is selected as the learning rate and number of epochs for the proposed model in the Xiongan data scenes. The spatial size of 9 × 9 is employed for the HSI patch cube, and the batch size of 64 is chosen. Early stopping is utilized in the training process of our model. Also, the numbers for the training set, validation set, and the test set for PU, Honghu, Houston, IP, and Xiongan data scenes can be observed in Table 1, Table 2, Table 3, Table 4 and Table 5.
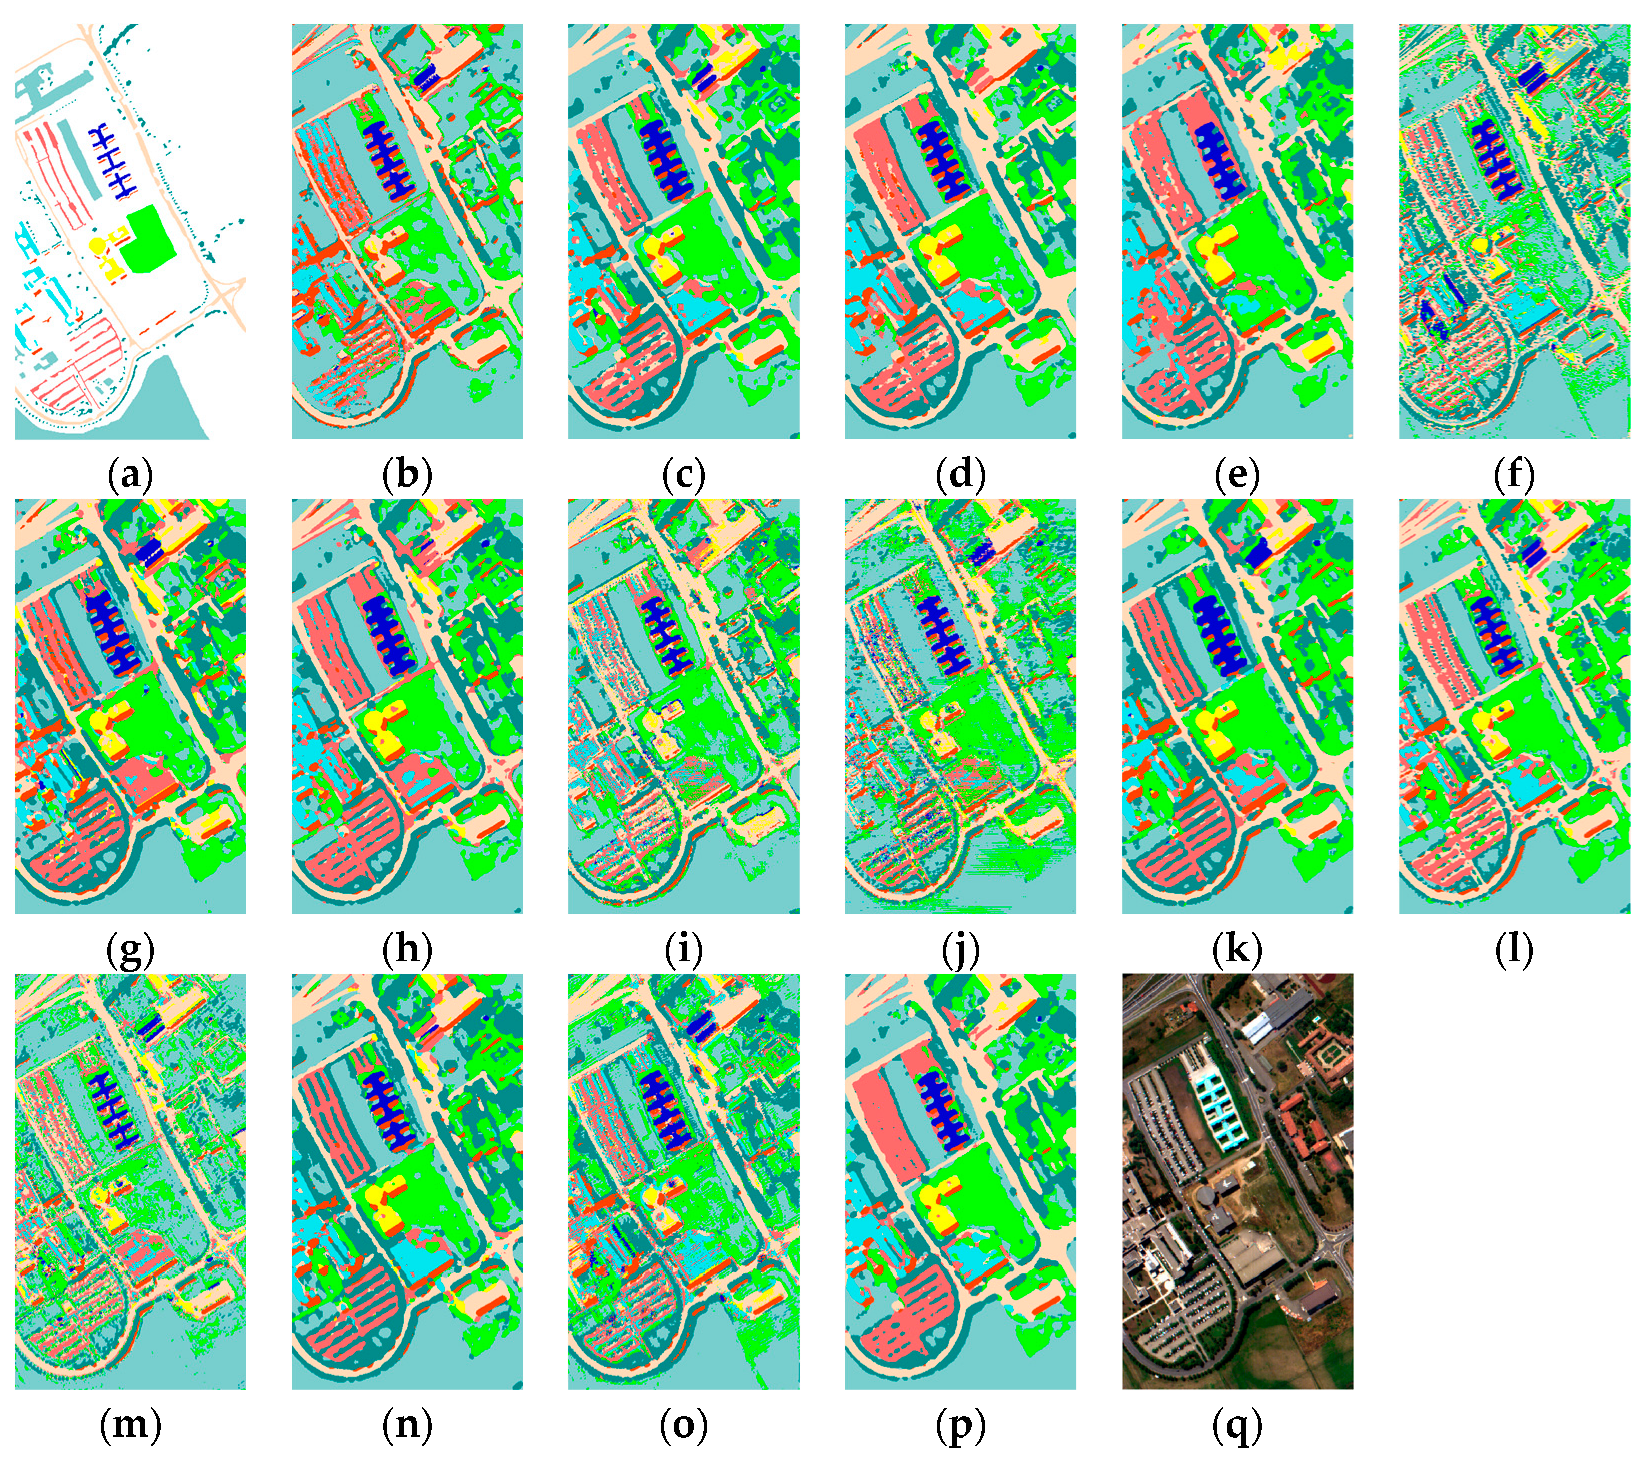
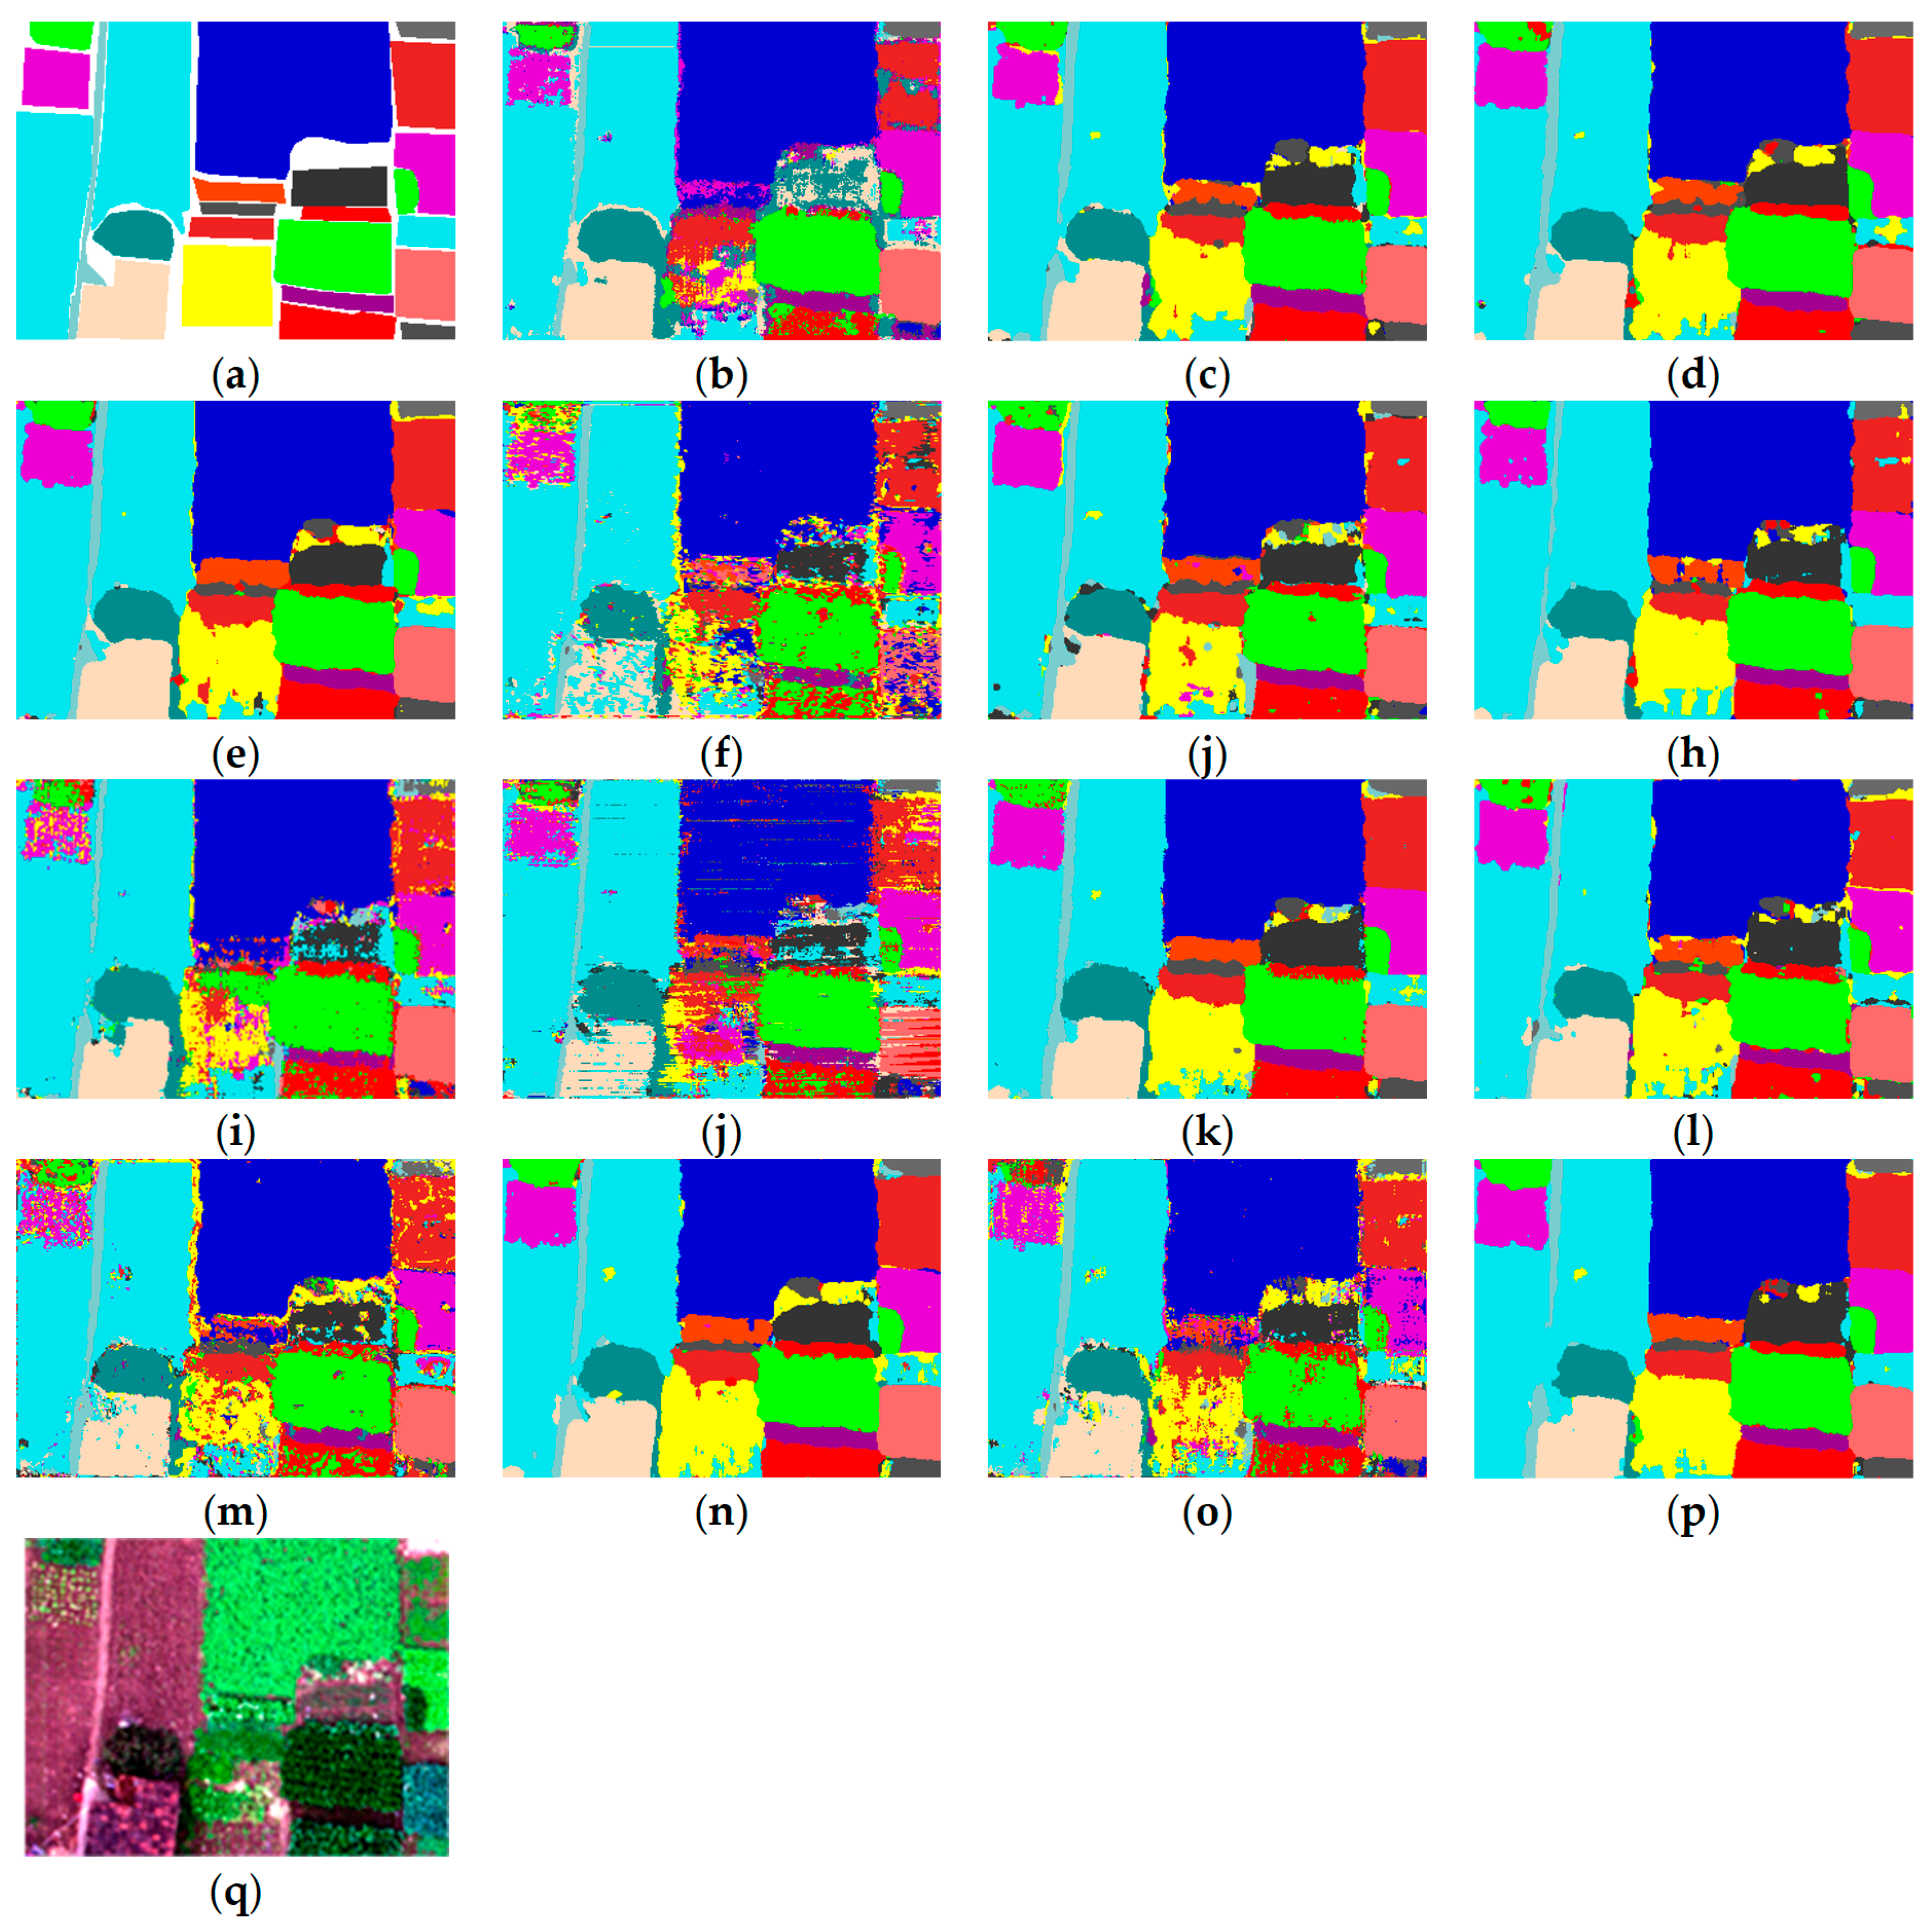
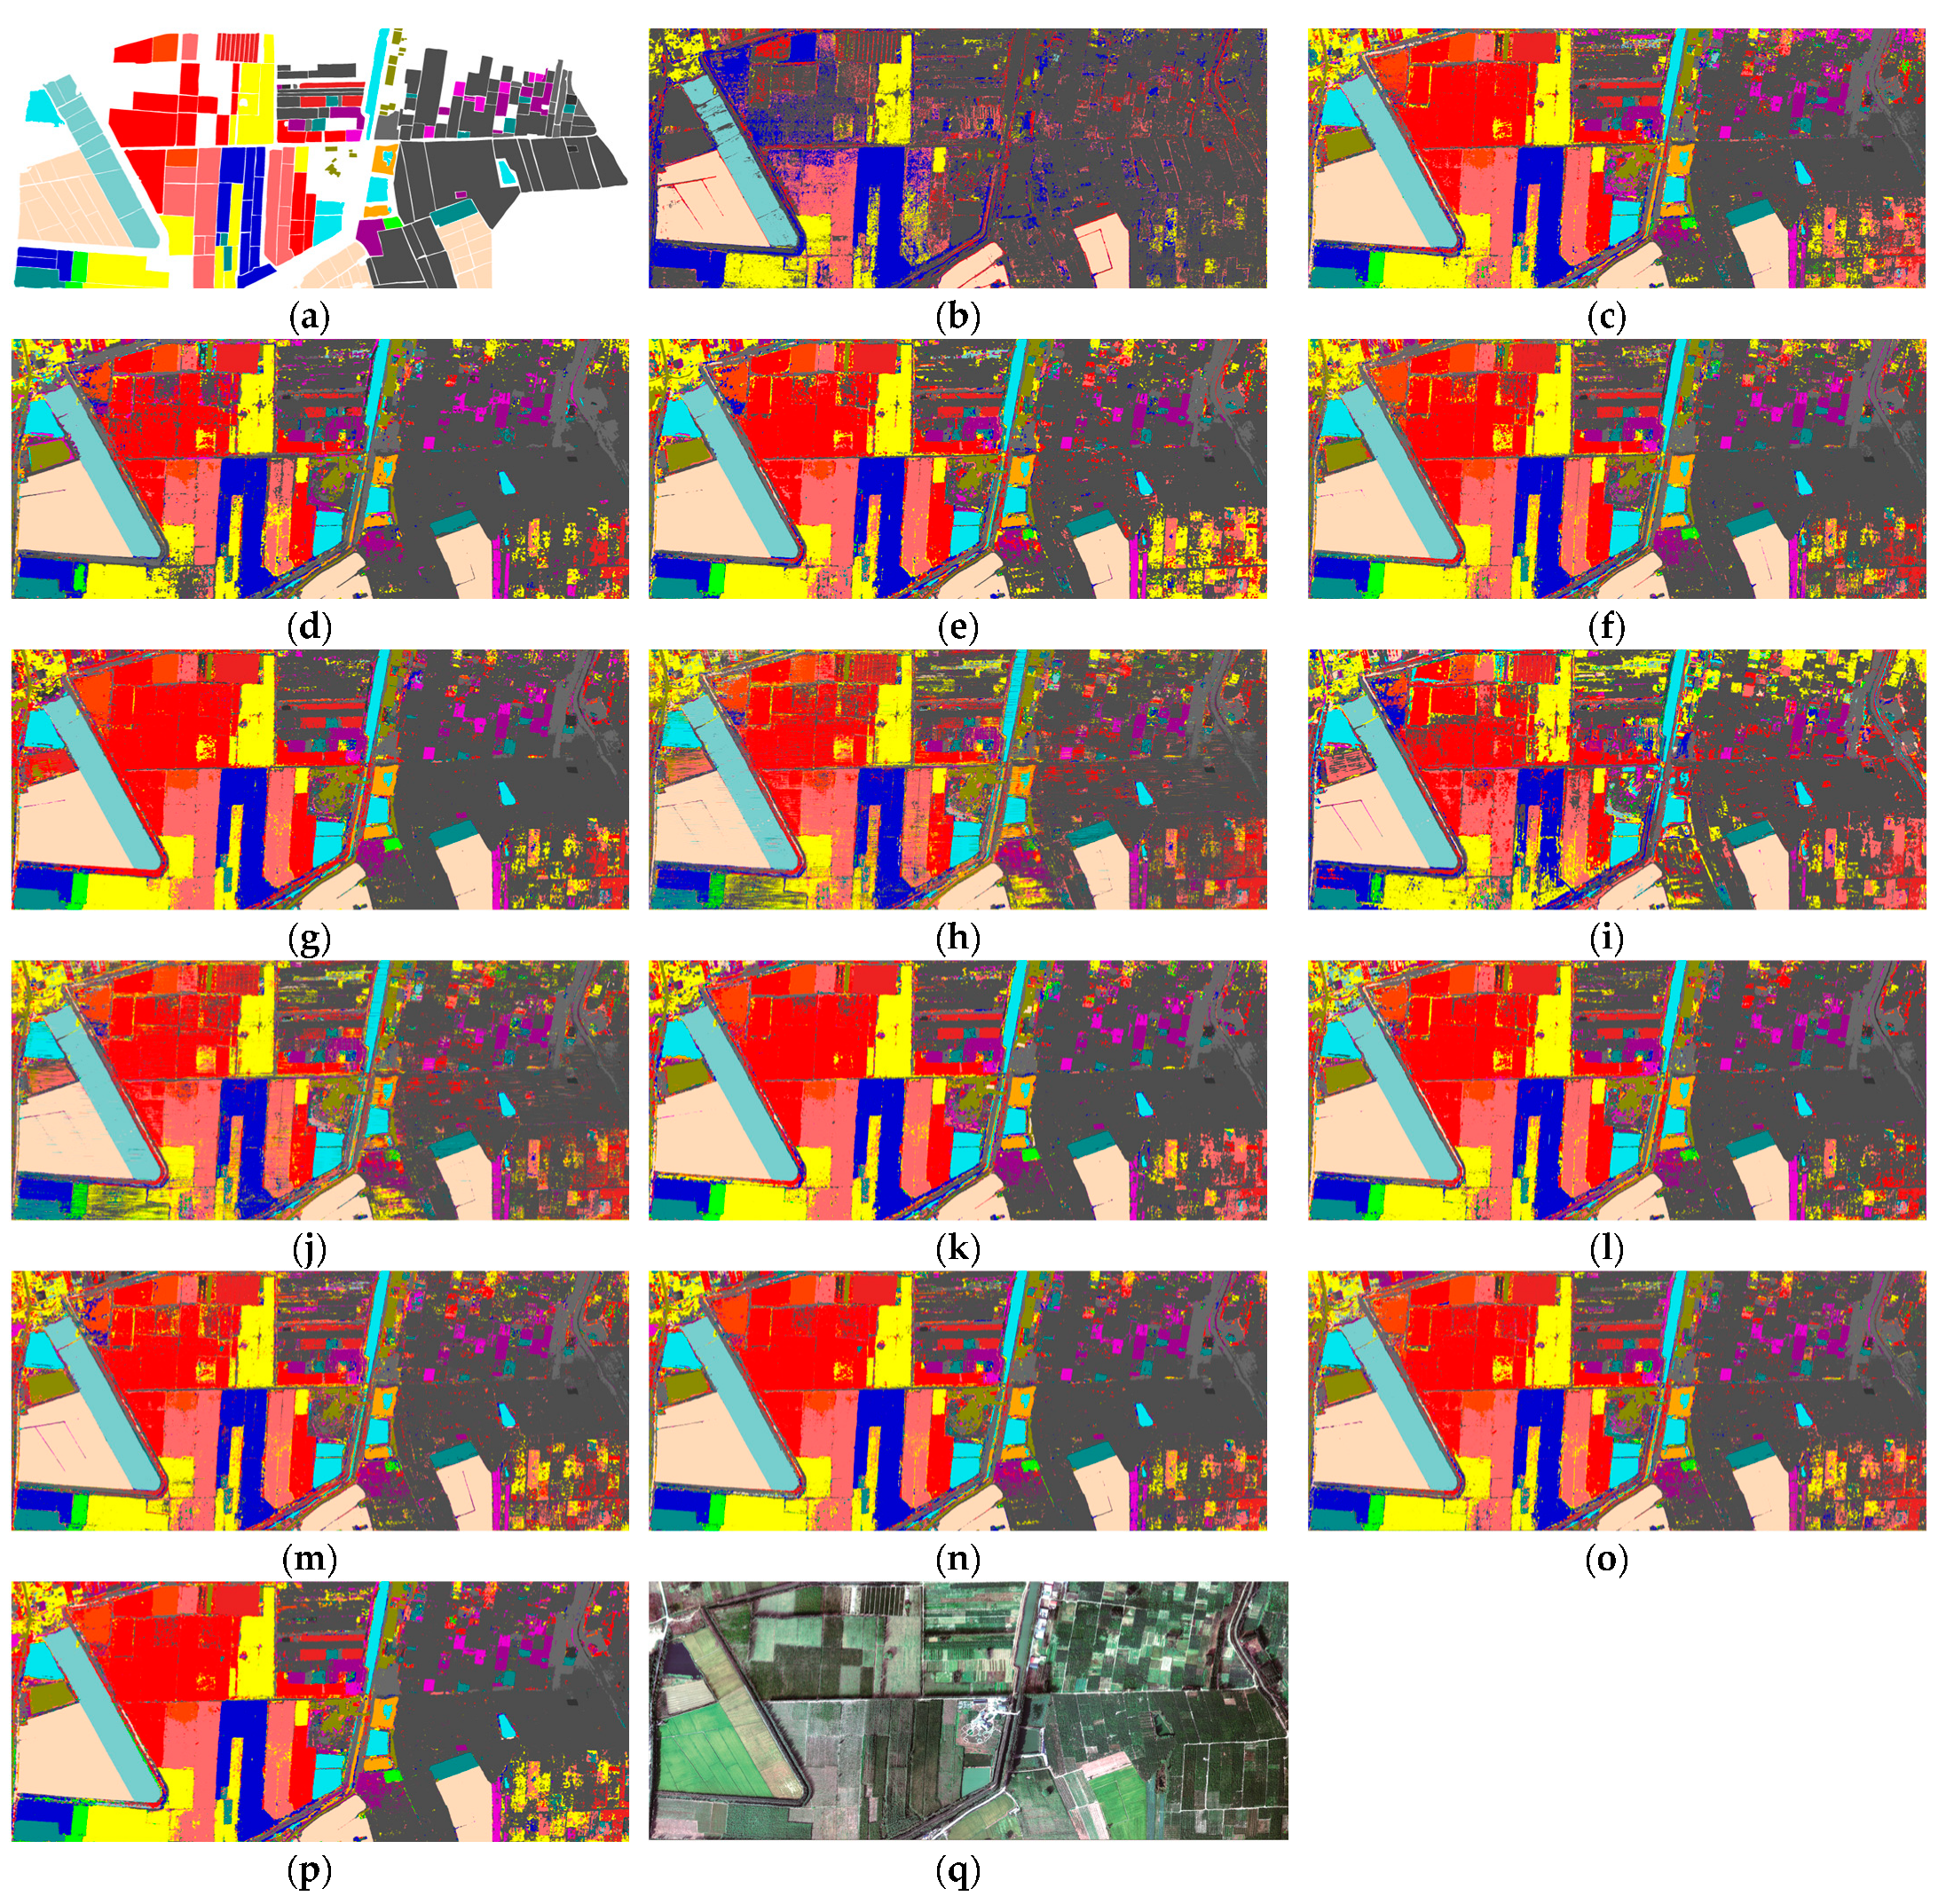
The averaged results and standard deviation of quantitative assessments, in terms of OA, AA, K , and the accuracy values for each class, and qualitative assessments for the fourteen comparative methods and our proposed method on the five HSI datasets are recorded in Table 6, Table 7, Table 8, Table 9 and Table 10, and Figure 6, Figure 7, Figure 8, Figure 9 and Figure 10, respectively. And, the averaged results and standard deviations for all measurements are derived based on ten repeated experiments. Additionally, the highest values for the three indices and accuracy values for each class are bolded.

4.2.2. The Fourteen State-of-the-Art Comparison Methods

(1) SSRN: The SSRN adopts spectral and spatial residual modules as its backbone and combines them in a consecutive manner to address the accuracy decreasing problem. It first extracts spectral signatures and then extracts the spatial features for pixel-wise HSI classification. Additionally, batch normalization is used in each 3D convolutional layer to regulate the feature extraction process.
(2) DBDA: The DBDA has spectral and spatial branches, with dense spectral block and channel attention mechanisms included in the spectral branch for extracting and refining spectral features, and a spatial attention block and a dense spatial block included in the spatial branch for learning and optimizing spatial information. Then, a concatenation operation is utilized to fuse spectral and spatial information.
(3) SSGCA: The SSGCA first uses a spectral–spatial module to excavate spectral and spatial features separately. Then, a channel global context attention mechanism is developed to enhance the significance of the extracted spectral signatures, and a position global context attention mechanism is devised to enhance the importance of the extracted spatial features.
(4) PCIA: The PCIA is a dual-branch model, which first uses spectral and spatial pyramidal blocks to efficiently learn spectral and spatial information. Then, a novel iterative attention, namely, a new expectation-maximization attention, is employed to refine the learned spectral and spatial information. Finally, the refined spectral-spatial information is conveyed to the fully connected layer for the final classification outcomes.
(5) MDBNet: The MDBNet uses PCA to operate on the original dataset, yielding the processed dataset. The processed dataset is then processed by the multiscale spectral–spatial feature extraction module to extract the multiscale spectral and spatial features. Then, a dual-branch information fusion block consisting of residual connections and dense connections is used to learn discriminant features. Finally, a new shuffle attention is proposed to adaptively weigh the spectral and spatial features, resulting in improved classification accuracy.
(6) HDDA: The HDDA architecture features a novel hybrid dense module and dual attention mechanisms. It utilizes a stacked autoencoder to decrease the number of channels in the HSI. And then, a hybrid 2D-3D CNN module is employed to extract the spectral and spatial information. The channel and spatial attention mechanism is designed to refine the extracted spectral and spatial features separately. Additionally, a dropout layer and batch normalization are employed separately to mitigate overfitting and enhance computational efficiency.
(7) DBPFA: The DBPFA mainly consists of dual-branches and an improved attention mechanism for HSI classification. It includes a spectral feature extraction branch for extracting spectral signatures and a spatial feature excavating branch for extracting spatial features. It also includes a polarized fully attention for learning context feature information.
(8) ChebNet: The Spectral GCN is a graph convolutional operation with fast local convolutional filters, where the filter is approximated by a K -order Chebyshev polynomial. And, it is applicable to any graph structure. In this article, a filter with a 1-order Chebyshev polynomial is used.
(9) GCN: The GCN is an efficient tool based on convolutional neural networks and constructed by an approximation of localized first-order spectral graph convolutions, which can be directly operate on graphs. The GCN is also a linear layer model that can learn the representation of both graph edges relations and node information. In this article, a five-layer GCN is employed.
(10) MVAHN: The MVAHN is a new hybrid vision architecture-based model, which first utilizes CNN to extract the spectral signatures and spatial features from HSIs. Next, the generated features are divided into two components; one is for the GCN module, and another is for the transformer module. Finally, a residual learning block is used to fuse the extracted features.
(11) MRCAG: The MRCAG model mainly has three components: a developed multiscale random shape convolution part for learning convolution-based multiscale features, where the convolution kernels used are randomized. A designed adaptive graph convolution part for learning graph-based features, where the weights for neighborhood nodes are learned adaptively. A local feature processing part is designed to exploit CNN-based features and GCN-based features, enhancing the feature representation.
(12) FTINet: The FTINet method consists of three stages: First, multiple stacked CIformers are used to learn the dynamic and static spatial contextual information of the data. Then, concatenated FTCUs are employed to learn the spectral and topological features of the processed data. Meanwhile, the edges of the graph are learned for information aggregation and propagation. Finally, the learned features and information are fed into the classification stage to produce the classification results.
(13) DKDMN: The DKDMN method is a hybrid neural network architecture. It first employs the proposed multi-scale spectral signature extraction module for spectral signature extraction. Then, the extracted multiscale spectral signature is combined with positional embedding for Transformer preprocessing. Then, the signatures are fed into the designed module for comprehensive spectral signature learning. This module is composed of multiple CNN-Transformer blocks and a residual GCN. To better achieve the final classification results, the learned spectral signature is combined with the features extracted by the diffusion model.
(14) DGFNet: The DGFNet is a dual-branch GNN fusion network, which includes a spatial-based branch and a spectral-based branch. It takes HSI subcubes as input data. The spatial branch first employs a Graph Attention Network to learn the intrinsic relationships within the input data. Then, it develops a local guidance module to learn significant features. The spectral branch employs weights for different spectral bands to obtain spectral features. Finally, a linear layer is used to fuse the spatial features and spectral features.

4.3. Experimental Results

In this section, for the five widely used data scenes, the training set, validation set, and test set are composed of randomly selected labeled samples from each category on the five HSI data scenes, which are recorded in Table 1, Table 2, Table 3, Table 4 and Table 5 separately. Table 6, Table 7, Table 8, Table 9 and Table 10 show the accuracy of OA, AA, K , and each class of the fourteen competitive methods as well as our proposed model on the five widely used data scenes. Figure 6, Figure 7, Figure 8, Figure 9 and Figure 10 show the ground truth map, full-pixel classification maps, and False-color images on the PU, Houston, Honghu, and IP data scenes. The detailed discussion of classification results on the five used data scenes is shown as follows:
(1) Classification results on the PU dataset: In the PU dataset, as recorded in Table 6, in terms of the value of OA, our proposed method surpasses SSRN, DBDA, SSGCA, PCIA, MDBNet, HDDA, DBPFA, ChebNet, GCN, and MVAHN by about 13.33%, 2.76%, 0.76%, 1.30%, 15.63%, 2.89%, 1.38%, 10.93%, 9.88%, and 0.50%, respectively, demonstrating the superior classification performance of our method. The methods based on CNN, namely SSRN, DBDA, SSGCA, PCIA, MDBNet, HDDA, and DBPFA, all achieved excellent classification performance in terms of OA, AA, K , and accuracy values for each class, except for SSRN and MDBNet. This can be attributed to CNN being one of the powerful data fitting tools of deep learning. The GCN-based methods, namely ChebNet and GCN, exhibit lower classification performance, except for MVAHN. This can be ascribed to the fact that GCN-based methods only consider features from a single perspective. To some extent, the pure GCN-based method has limited feature extraction performance compared to the spectral and spatial CNN-based method. The hybrid vision architectures, namely our proposed method and MVAHN, which are based on CNN and GCN architecture, both achieve outstanding classification performance on the PU dataset. Specifically, our proposed method achieve the highest OA, AA, and K values among the other fourteen comparative methods on the PU dataset. Furthermore, from Figure 6, the classification map yielded by our proposed method is not only clearer than those from the other fourteen comparative experiments, but also has smoother land cover edges. Conversely, the classification maps yielded by MDBNet and GCN show a lot of salt-and-pepper scenarios.
(2) Classification results on the Houston dataset: For the Houston dataset, our proposed method achieves the highest records in terms of OA, AA, and K compared to the fourteen comparative methods, as documented in Table 7. The OA value of our proposed method is approximately 0.47% higher than that of MVAHA, about 0.33% higher than SSGCA, a CNN-based method with higher OA among CNN-based methods, and about 18.53% higher than ChebNet, a GCN-based method with higher OA among GCN-based methods.
This is due to the fact that our proposed method is designed by combining the CNN and GCN networks, which can excavate the multiscale spectral-spatial features and learn the pixel-wise spectral signature among the graphs. From Figure 7, it can be observed that our proposed method exhibits a classification map that closely resembles the ground-truth feature map in comparison to the other fourteen classification methods.
(3) Classification results on the Honghu dataset: On the Honghu dataset, as seen in Figure 8a, the terrain regions of same land covers are more concentrated, so this dataset is more conductive to being distinguished. From Table 8, our proposed method shown higher values of OA, AA, and K compared with the fourteen comparative methods. The MVAHN achieve the second classification performance. The reason for this can be attributed to the method combining the CNN and GCN, which enables the extraction of different types of features. The CNN-based methods, namely PCIA and DBPFA, all get good classification performance, but worse than hybrid CNN and GCN methods. It is also shown that the features extracted by CNN-based methods are less expressive than the hybrid CNN and GCN methods. Furthermore, the classification performance of categories of C1, C4, C5, C12, and C15 that are obtained by our proposed method is higher than the other fourteen comparative methods, which is shown the in better feature extraction ability of our proposed method. At the same time, from Figure 8, the classification map obtained by our proposed method has less salt-and-pepper noise and more similarity to the ground truth map.
(4) Classification results on the IP dataset: To validate the classification performance under limited training samples, the IP data scene is used. From Table 9, it can be seen that our proposed model gets the best classification accuracy on OA, AA, and K . Meanwhile, our proposed model gets 100% classification accuracy on the classes of C1, C8, and C13, which demonstrates the effectiveness of our devised model under the IP data scene. Especially under the condition of limited sample quantities from classes C1, C7, C9, and C16, our proposed model achieves good accuracy in individual class classification. The SSRN and ChebNet receive 0% classification accuracy on C7 and C9, respectively. However, both the MVAHN and our proposed model achieve better classification accuracy on C7 and C9 compared to SSRN and ChebNet. This shows that the model combining CNN with GCN has better feature extraction performance than a model only based on CNN or GCN architecture. In Figure 9, the classification map generated by our proposed model shows clear boundaries between different classes. Compared to other comparative methods, MDBNet gets a worse OA value, and its classification map exhibits a higher occurrence of the salt-and-pepper noise phenomenon.
(5) Classification results on the Xiongan dataset: To further validate the superior classification performance of our designed method, we use the Xiongan dataset. From Table 10, it can be observed that our method achieves the best OA, AA, and k compared to other methods. Conversely, the SSRN method, which is based on CNN, has lower classification results, especially for the AA value, compared to other comparative methods. The classification accuracy of C3, C4, C6, C9, C11, C12, C16, C17, and C18 produced by SSRN is 0%, which contributes to the lower AA value. MVAHN, a hybrid architecture that combines CNN and GCN models, yields comparable results but has slightly lower classification performance than our method. For GCN-based comparative methods, such as ChebNet and GCN, the classification results are relatively lower compared to other methods. Other comparative methods, such as DGFNet, FTINet, and MRCAG exhibit acceptable classification results. From Figure 10, the full-pixel classification map of SSRN displays unclear edges between different classes, resulting in a poor classification map. Our method shows a classification map that is more similar to the ground-truth map, demonstrating superior classification performance.

5. Discussion

5.1. The Importance of an Adaptive Feature-Weighted Strategy in Feature Fusion

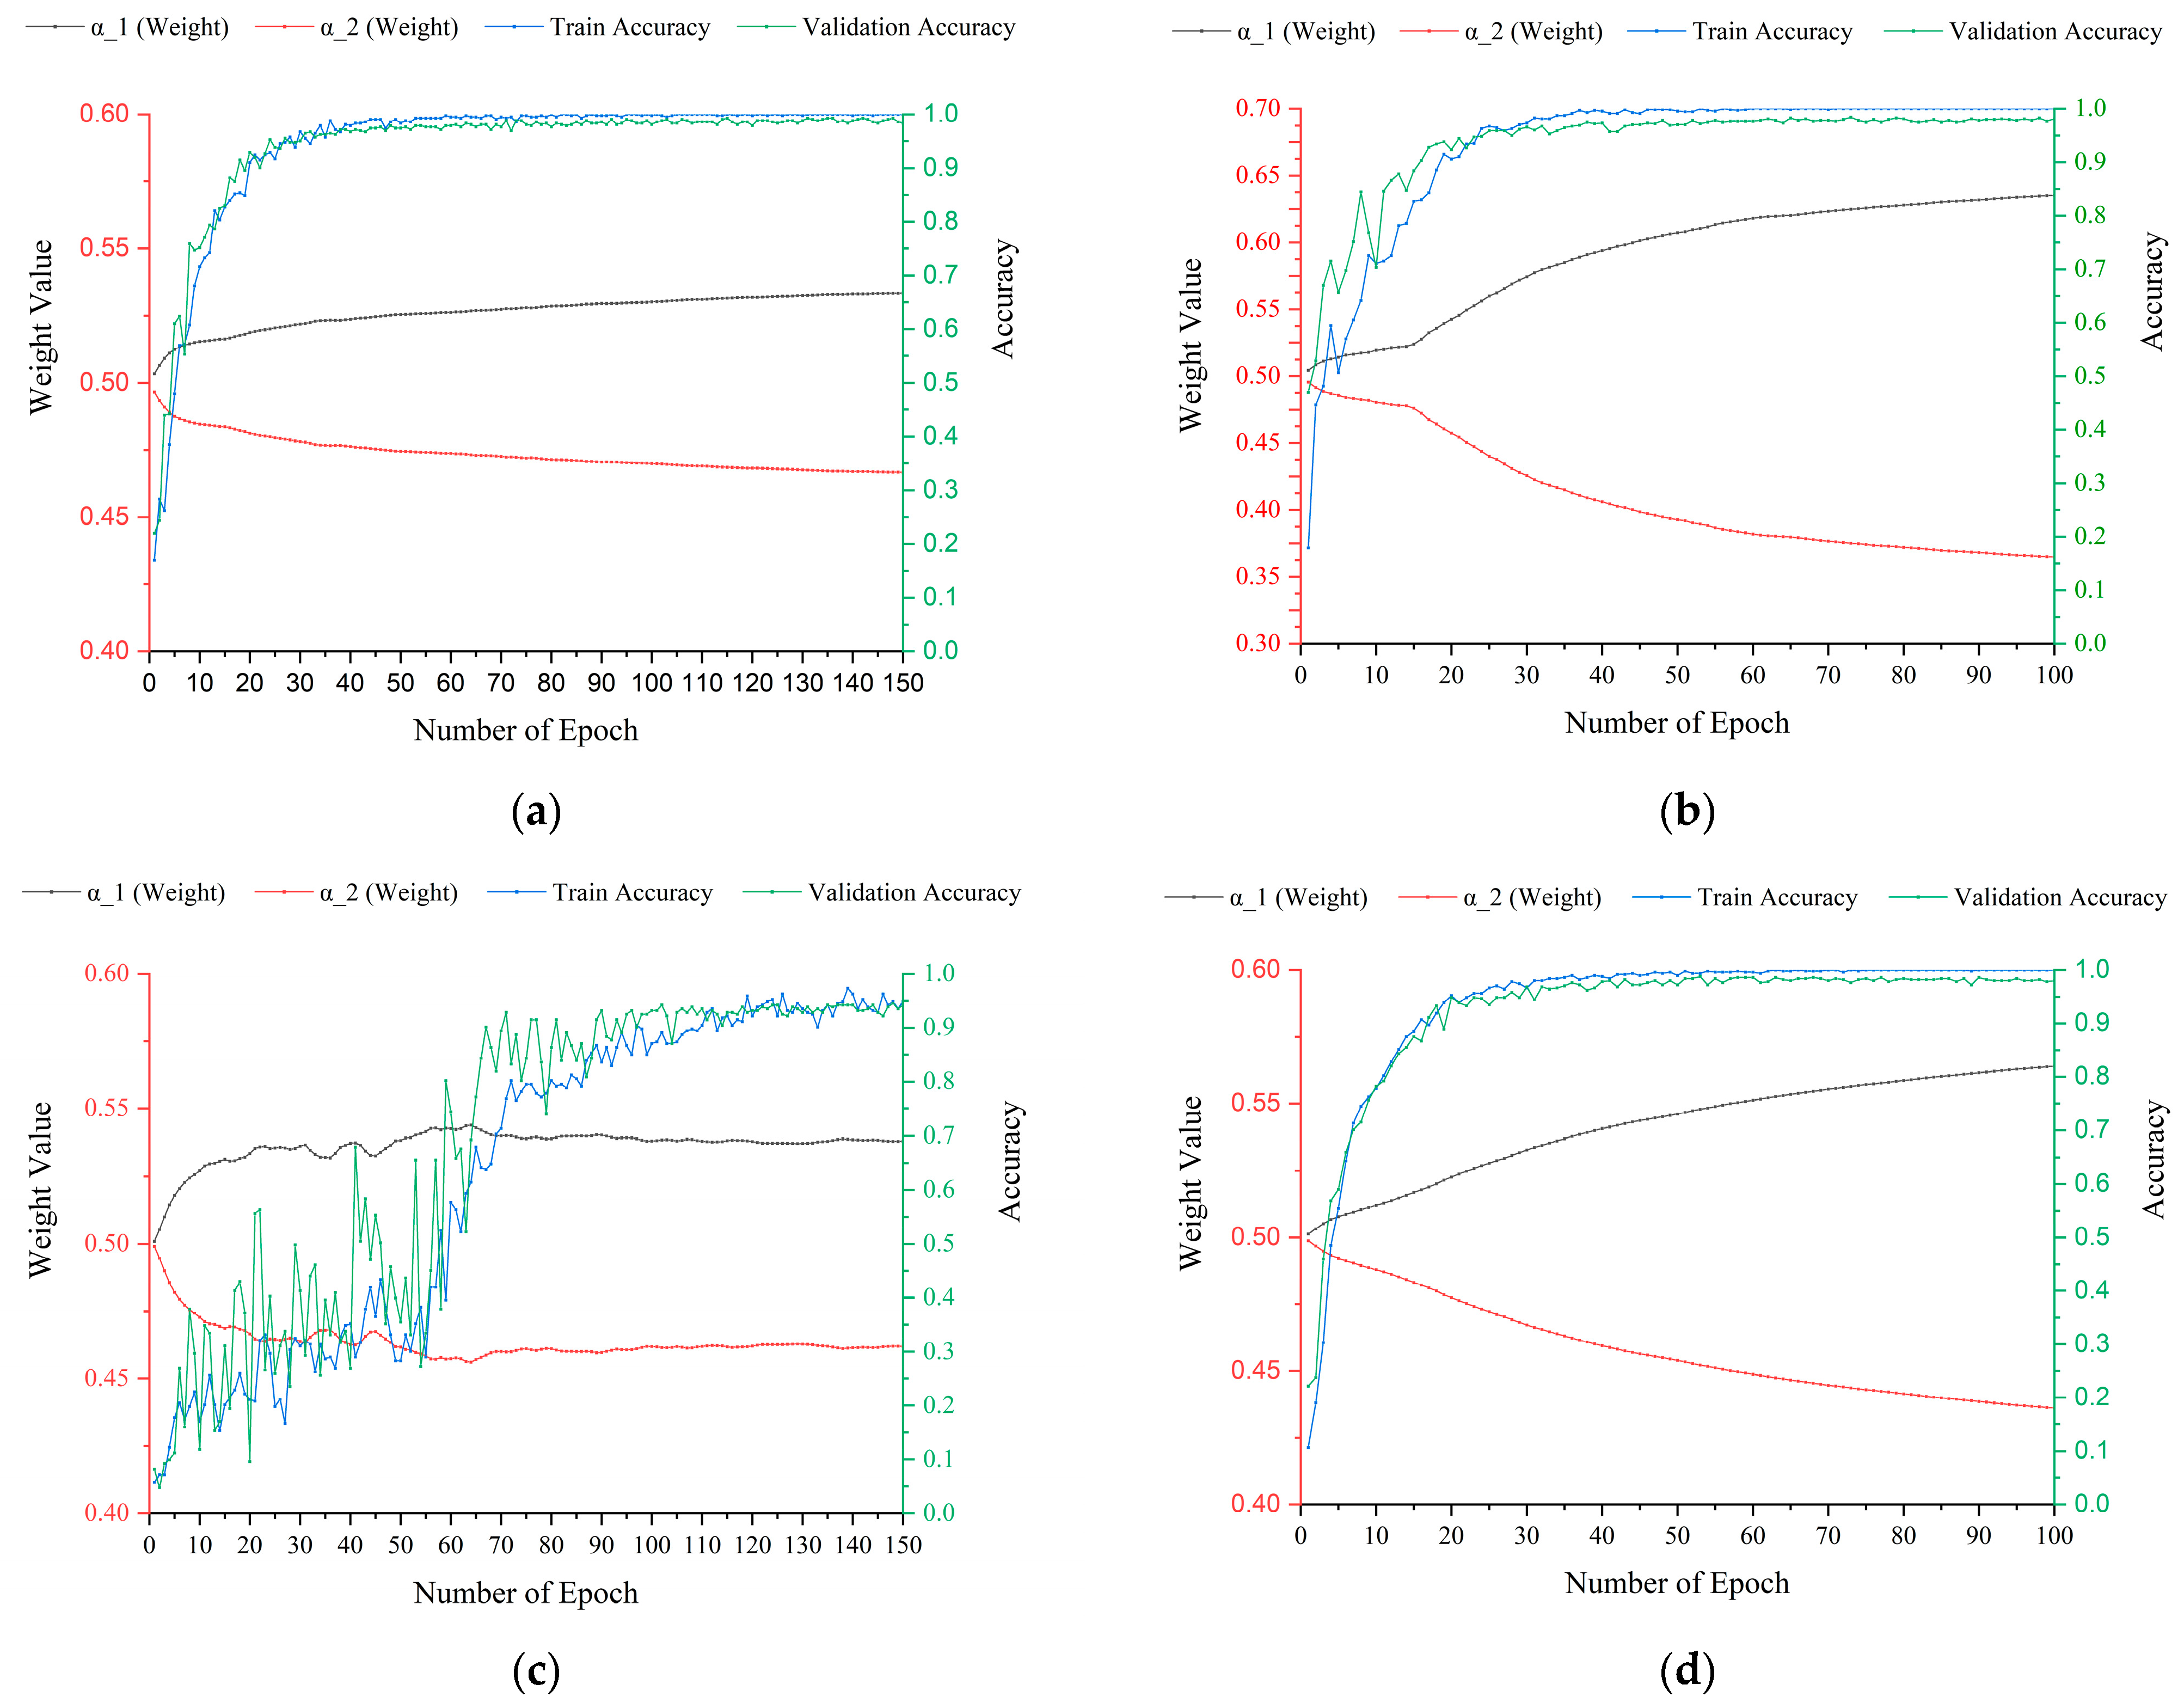
In the CNN subnetwork of our proposed method, the extracted spectral and spatial information plays unequally significant roles in the classification process. The spectral signature learning weight α_1 and spatial features learning weight α_2 are employed to show the importance of spectral and spatial features in the training accuracy and validation accuracy of the four used HSI datasets. As shown in Figure 11a, it can be observed that for the PU data scene, the value of the spectral learning weight α_1 is higher than that of the spatial weight α _ 2 , and the difference between them becomes increasingly larger as the epochs increase, while both the training accuracy and validation accuracy are increasing. Therefore, when the proposed method achieves higher training and validation accuracy, it demonstrates that the spectral learning weight α _ 1 and the spatial learning weight α _ 2 play different roles in classification, which shows the appropriateness of the used adaptive feature-weighted fusion strategy. The extracted spectral signatures have a relatively larger proportion than spatial features in classification. From Figure 11a, when the value of α _ 1 is 0.5329 and the value of α _ 2 is 0.4671, the proposed model gets the best performance in training and validation accuracy on the PU dataset.
Additionally, in Figure 11b–d, feature learning weights α _ 1 and α _ 2 are analyzed respectively on Honghu, Houston, and IP data scene. In these three figures, phenomena similar to those in Figure 11a can be observed. Especially in the Honghu data scene, when the value of α_1 is 0.6279 and the value of α_2 is 0.3721, the training accuracy reaches a value of 100%, and the validation accuracy reaches a value of 98.09%.

5.2. The Value of n in n-Layer GCN of the Spectral-Enhanced GCN Module

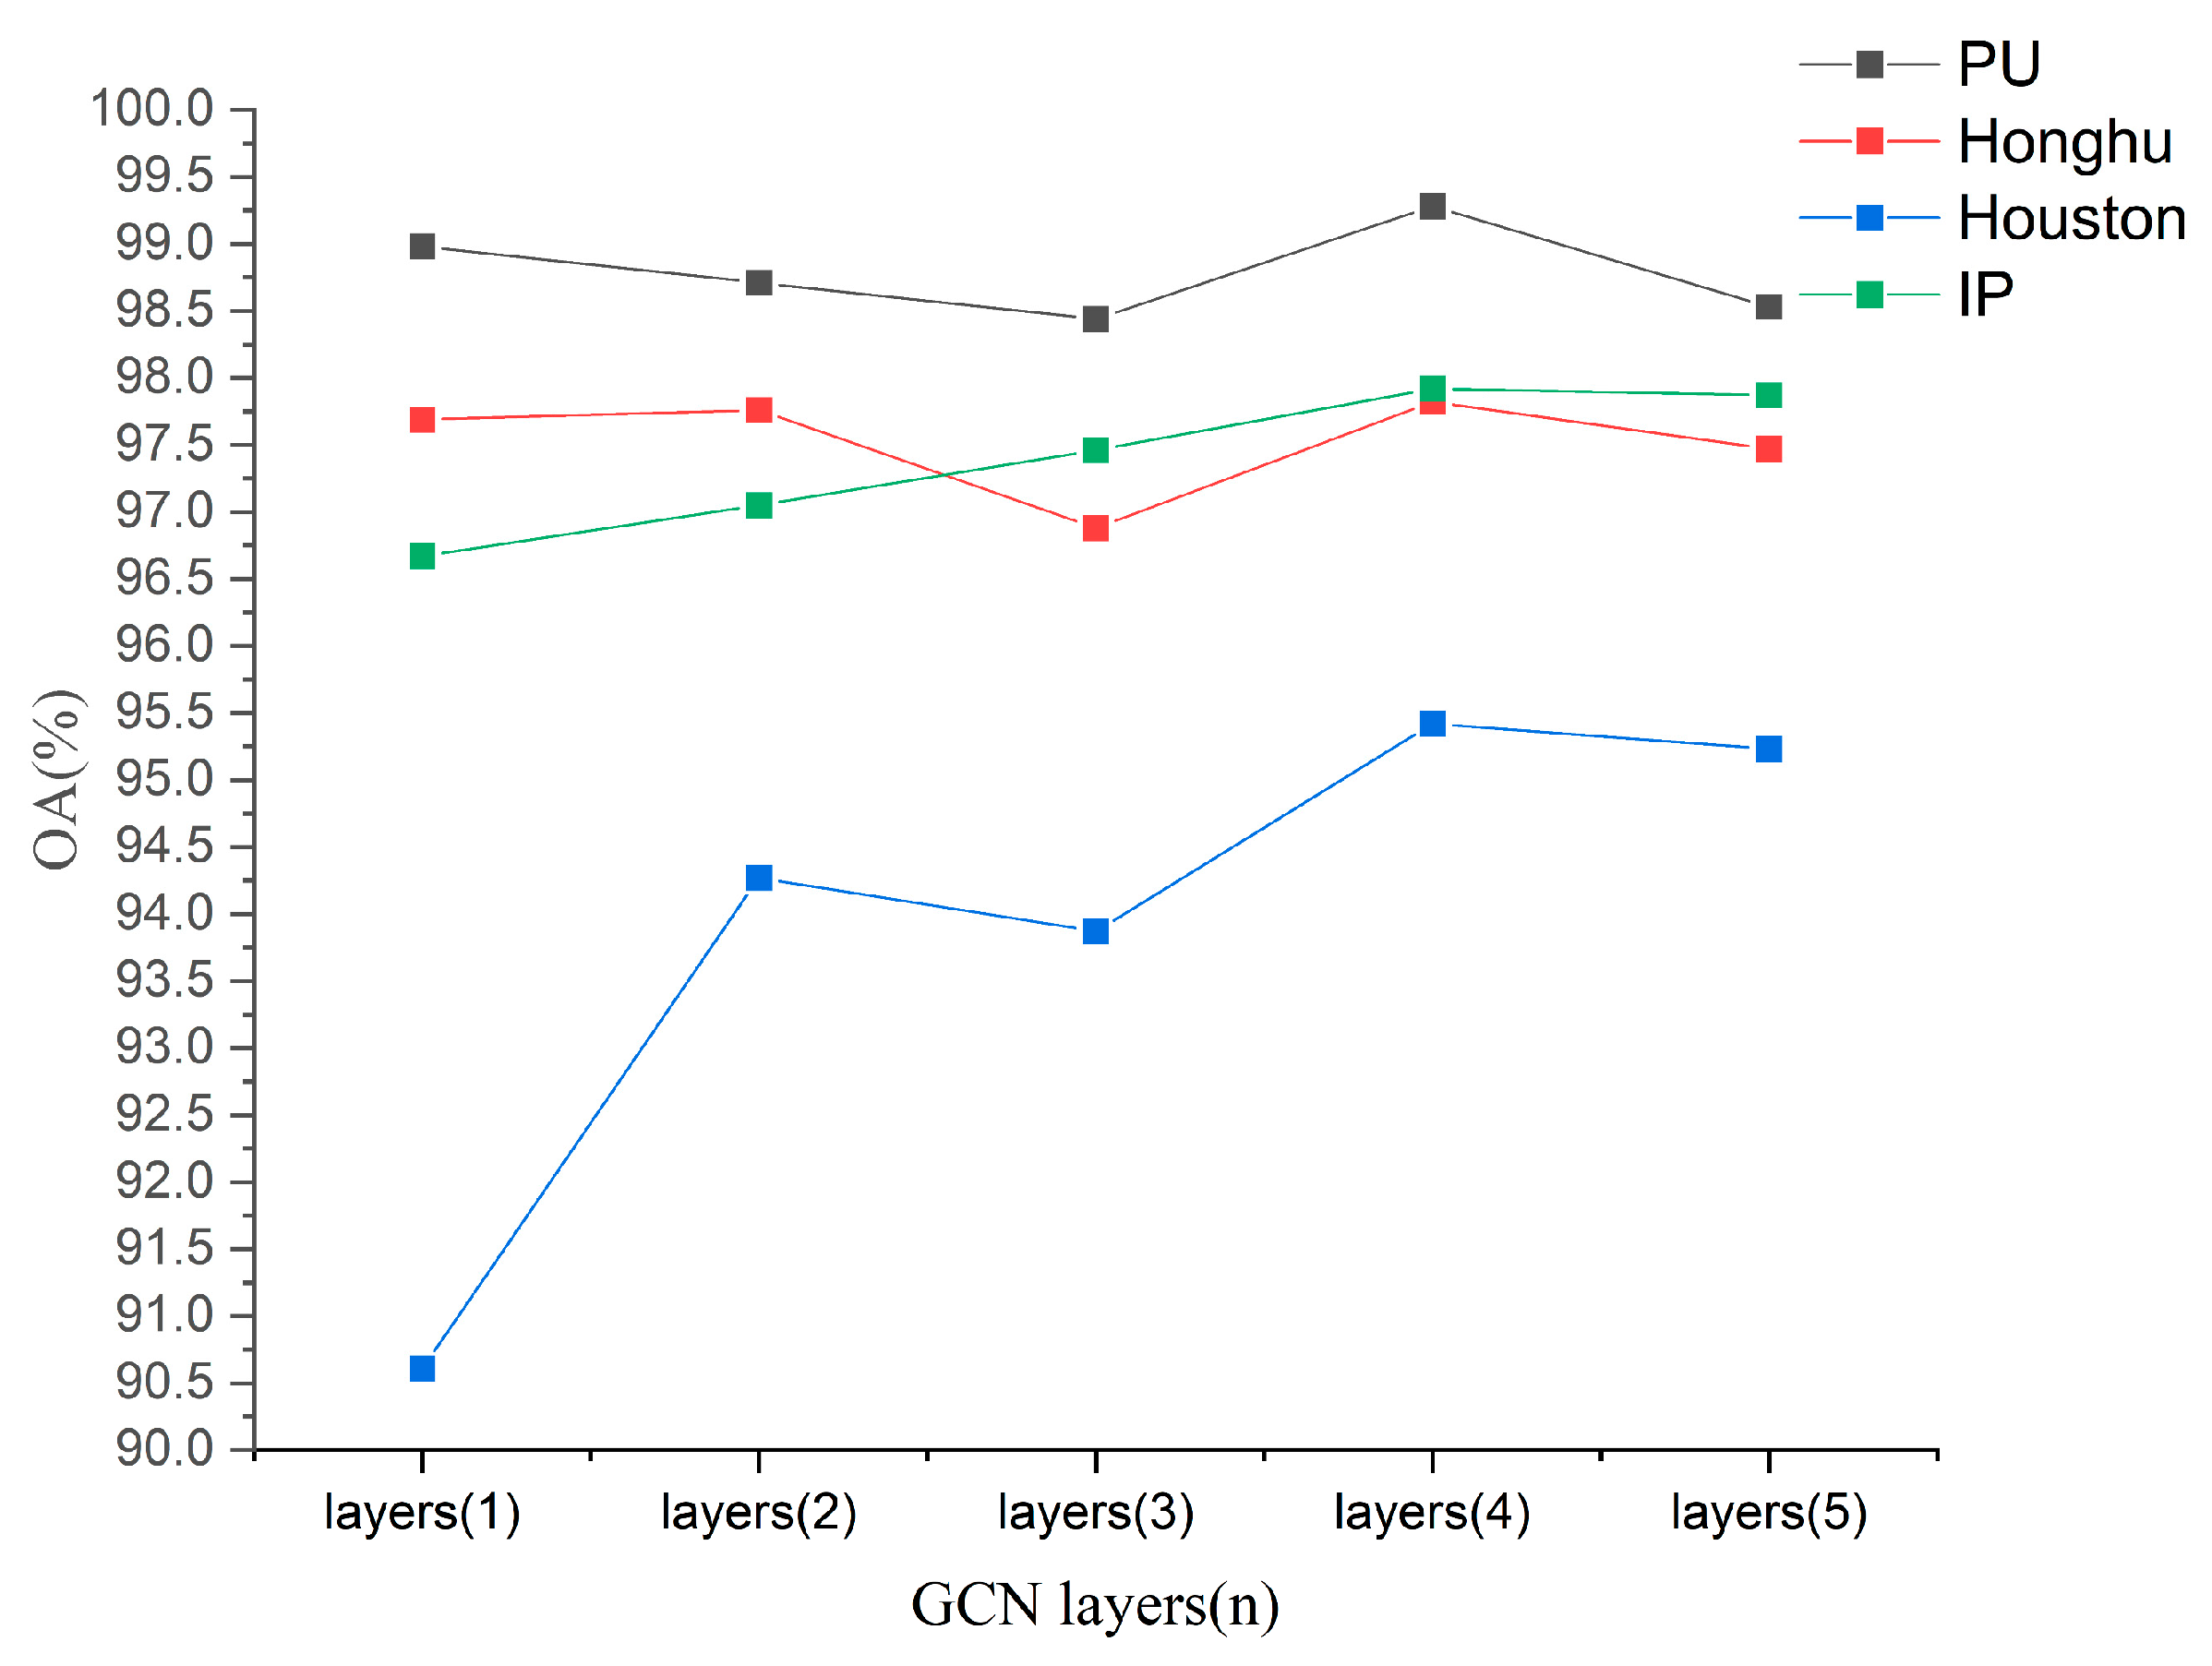
To learn the features from the perspective of GCN as well as to learn the relations in the spectral feature matrix, an n -layer GCN is used. In general, GCN-based architectures can learn deep node features by using more stacked GCN layers. However, when the GCN layers reach a certain level, it will lead to a drop in the performance of the spectral-enhanced GCN module. Additionally, using the spectral-enhanced GCN module with fewer GCN layers results in inadequate capture of deep information. To ensure that the values of n are reasonable, an experiment is conducted. To be specific, we implement experiments with different n -layer ( n = 1 ,   2 ,   3 ,   4 ,   5 ) GCNs in spectral-enhanced GCN modules on the four datasets used. The purpose is to determine the optimal value of n to achieve the best performance of our model. From Figure 12, when the value of n is 4, the OA of our model gets the best classification accuracy on four used data scenes separately. Therefore, a four-layer GCN is utilized in the spectral-enhanced GCN module, which is beneficial for spectral signature learning.

5.3. The Learning Rate under Different Epoch Numbers

The learning rate, a vital hyperparameter, plays a great role in training a deep learning-based model. And, it has a significant influence on both the convergence and the final classification performance of our model. Additionally, the number of epochs can affect the convergence speed of the model as well as its training time. So, we evaluate the impact of various learning rates on the classification accuracy of our proposed model under the different number of epochs on the four used data scenes, and the results are shown in Figure 13. To analyze the impact of learning rates and various epochs on the proposed model, the learning rate for the PU, Honghu, Houston, IP, and Xiongan are selected from the sets {0.007, 3 × 10⁻⁴, 5 × 10⁻⁴, 7 × 10⁻⁴, 9 × 10⁻⁴}, {0.003, 0.007, 3 × 10⁻⁴, 7 × 10⁻⁴, 9 × 10⁻⁴}, {0.003, 0.005, 3 × 10⁻⁴, 5 × 10⁻⁴, 7 × 10⁻⁴, 9 × 10⁻⁴}, and {0.01, 0.005, 3 × 10⁻⁴, 5 × 10⁻⁴, 7 × 10⁻⁴}. Simultaneously, the learning rate settings for PU, Honghu, Houston, and IP are tested under various epochs sets {200, 250, 300, 350, 400}, {100, 120, 150, 180, 200}, {100, 120, 150, 180, 200}, and {130, 150, 200, 250, 300} respectively. From Figure 13, it is observed that when the set of learning rate and epochs {5 × 10⁻⁴, 350}, {7 × 10⁻⁴, 120}, {9 × 10⁻⁴, 150}, and {3 × 10⁻⁴, 130} are selected for the PU, Honghu, Houston, IP, and Xiongan data scenarios separately, our proposed model gets the best classification performance in each of these data scenes.

5.4. Impact of Different Training Samples on the Classification Result

For our proposed model and other comparative methods, as deep learning-based models, the training sample is an important factor that influences the classification performance.
To analyze the classification performance of our proposed model and the other fourteen comparison algorithms under different limited training samples, {0.5%, 1%, 2%, 3%, 4%}, {1%, 2%, 3%, 4%, 5%}, {2%, 3%, 4%, 5%, 6%}, and {5%, 6%, 7%, 8%, 9%} training samples sets are separately selected to train our proposed model and fourteen different comparison algorithms and to evaluate their classification performances on the PU, Honghu, Houston, and IP data scenes separately. From Figure 14, it is clear that our proposed model exhibits the best classification accuracy under different training samples, especially with limited training samples.

5.5. Visual Results about Different Methods

In this section, to intuitively visualize the classification performance of fourteen comparative methods and our devised model, a t-distributed stochastic neighbor embedding (T-SNE) technique is employed. And, we take IP data scene as an example. From the Figure 15e, it can be observed that the classification map of MDBNet shows different class mix-ups together, causing a phenomenon of confusion. This is consistent with the result from Table 9, that the OA of MDBNet is lower than other comparative methods. Additionally, the T-SNE-based classification maps of DBPFA, MVAHN, and our proposed model demonstrate a clearer inter-class separation phenomenon. Furthermore, the intra-class separation phenomenon of the T-SNE-based classification maps produced by our model is the best compared to DBPFA and MVAHN, demonstrating the superior classification performance of our method. Meanwhile, as depicted in Figure 15f,j,k, the T-SNE-based classification map generated by the hybrid GCN and CNN model exhibits a better inter-class separation phenomenon compared to the T-SNE-based classification maps generated by models based solely on GCN or CNN, which shows the benefit of models that combine the CNN and GCN for feature extraction. From Figure 15l, the T-SNE-based classification map of our proposed model, which shows a better inter-class and intra-class clustering scenario, indicates better classification performance compared to other comparative methods.

5.6. Ablation Experiment

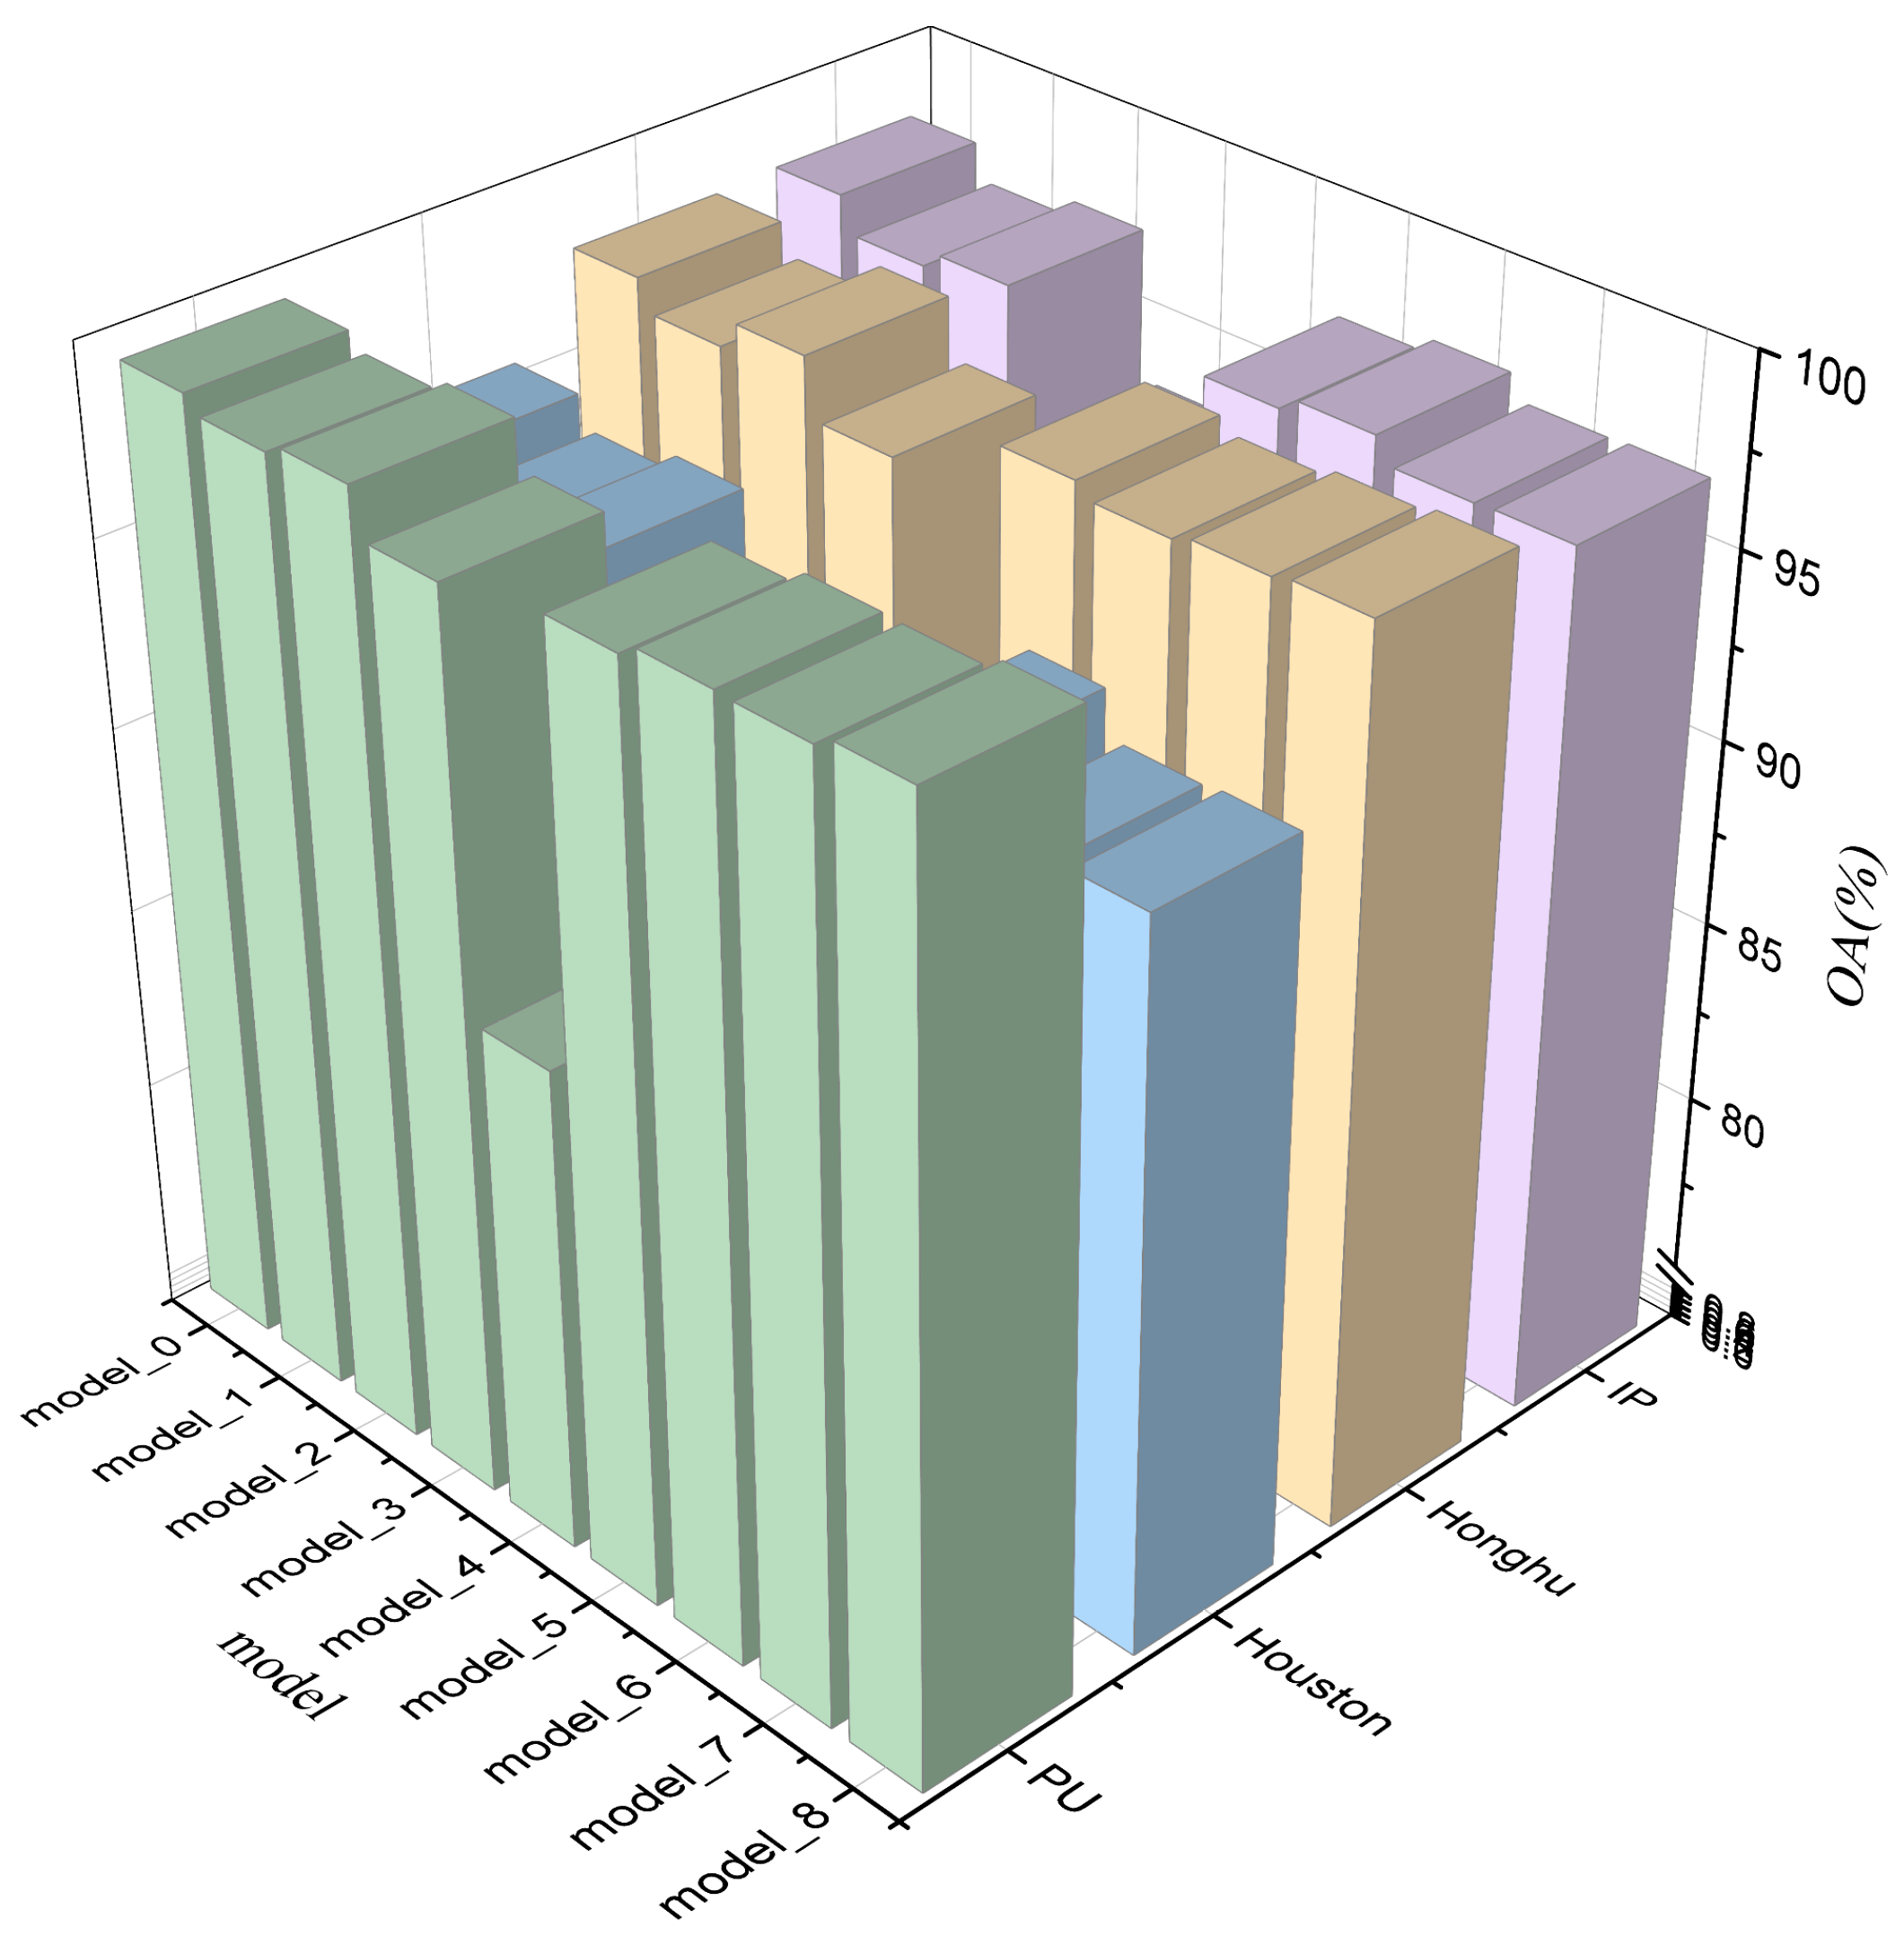
As described in the Methods Section, our proposed model mainly includes a CNN-based subnetwork and a GCN-based subnetwork. And in each subnetwork, the spectral and spatial pyramid hybrid convolution block, adaptive feature-weighted fusion strategy, spectral-enhanced GCN module, and mutual-cooperative attention mechanism are crucial for our proposed model. In this section, some ablation experiments are performed to verify the effectiveness of various designed modules in our proposed model. The environment settings of ablation experiments performed on PU, Honghu, Houston, and IP image data scenes are described in Section 4.2. And, we take the value of OA as an evaluation indicator to show the effectiveness of various devised modules, which will compare the complete model with the model lacking corresponding modules to show the effectiveness of each corresponding module. In detail, from Figure 16, the OA of model_0 is higher than that of model_1, model_2, model_3, model_4, model_5, model_6, model_7, and model_8, which shows the reasonability and the superlative classification accuracy of our proposed model.
To demonstrate the validity of the designed spectral pyramid hybrid convolution block and spatial pyramid hybrid convolution block, we individually eliminate the spatial pyramid hybrid convolution block and spectral pyramid hybrid convolution block from the complete model. As demonstrated in Figure 16, the OAs of model_8 and model_7 are both lower than that of model_0, which indicates the importance of the spectral pyramid hybrid block and spatial pyramid hybrid convolution block in multiscale feature extraction.
To verify the effectiveness of the devised GCN-based subnetwork, we remove the GCN-based subnetwork from the proposed model. The OA of model_5 is lower than that of model_0, which shows the effectiveness of the GCN-based subnetwork.
To demonstrate the robustness of the CNN-based subnetwork to the complete model, we remove the CNN-based subnetwork; as shown in Figure 16, the OA of model_4 is lower than that of model_0 on the four widely used HSI data scenes. Meanwhile, the OA of model_4 is lower than others on the model axis; especially on the IP data scene, the OA of model_4 is much lower than model_0. And, the limited feature extraction ability of the GCN-based subnetwork is also shown.
To show the importance of the mutual-cooperative attention mechanism, we remove the mutual-cooperative attention mechanism from the proposed model; as shown in Figure 16, the OA of model_1 is lower than the OA of model_0, which indicates the importance of the mutual-cooperative attention mechanism. Meanwhile, the OAs of model_2 and model_3 are both lower than the OA of model_0, which shows the significance of the mutual-cooperative attention mechanism without BSNet-based spectral features and GCN-based spectral signatures separately. And, the phenomenon that the OA of model_3 is lower than the OA of model_0 also demonstrates the significance of spectral-enhanced GCN modules.

5.7. The Visualization of the Spectral-Enhanced GCN Module

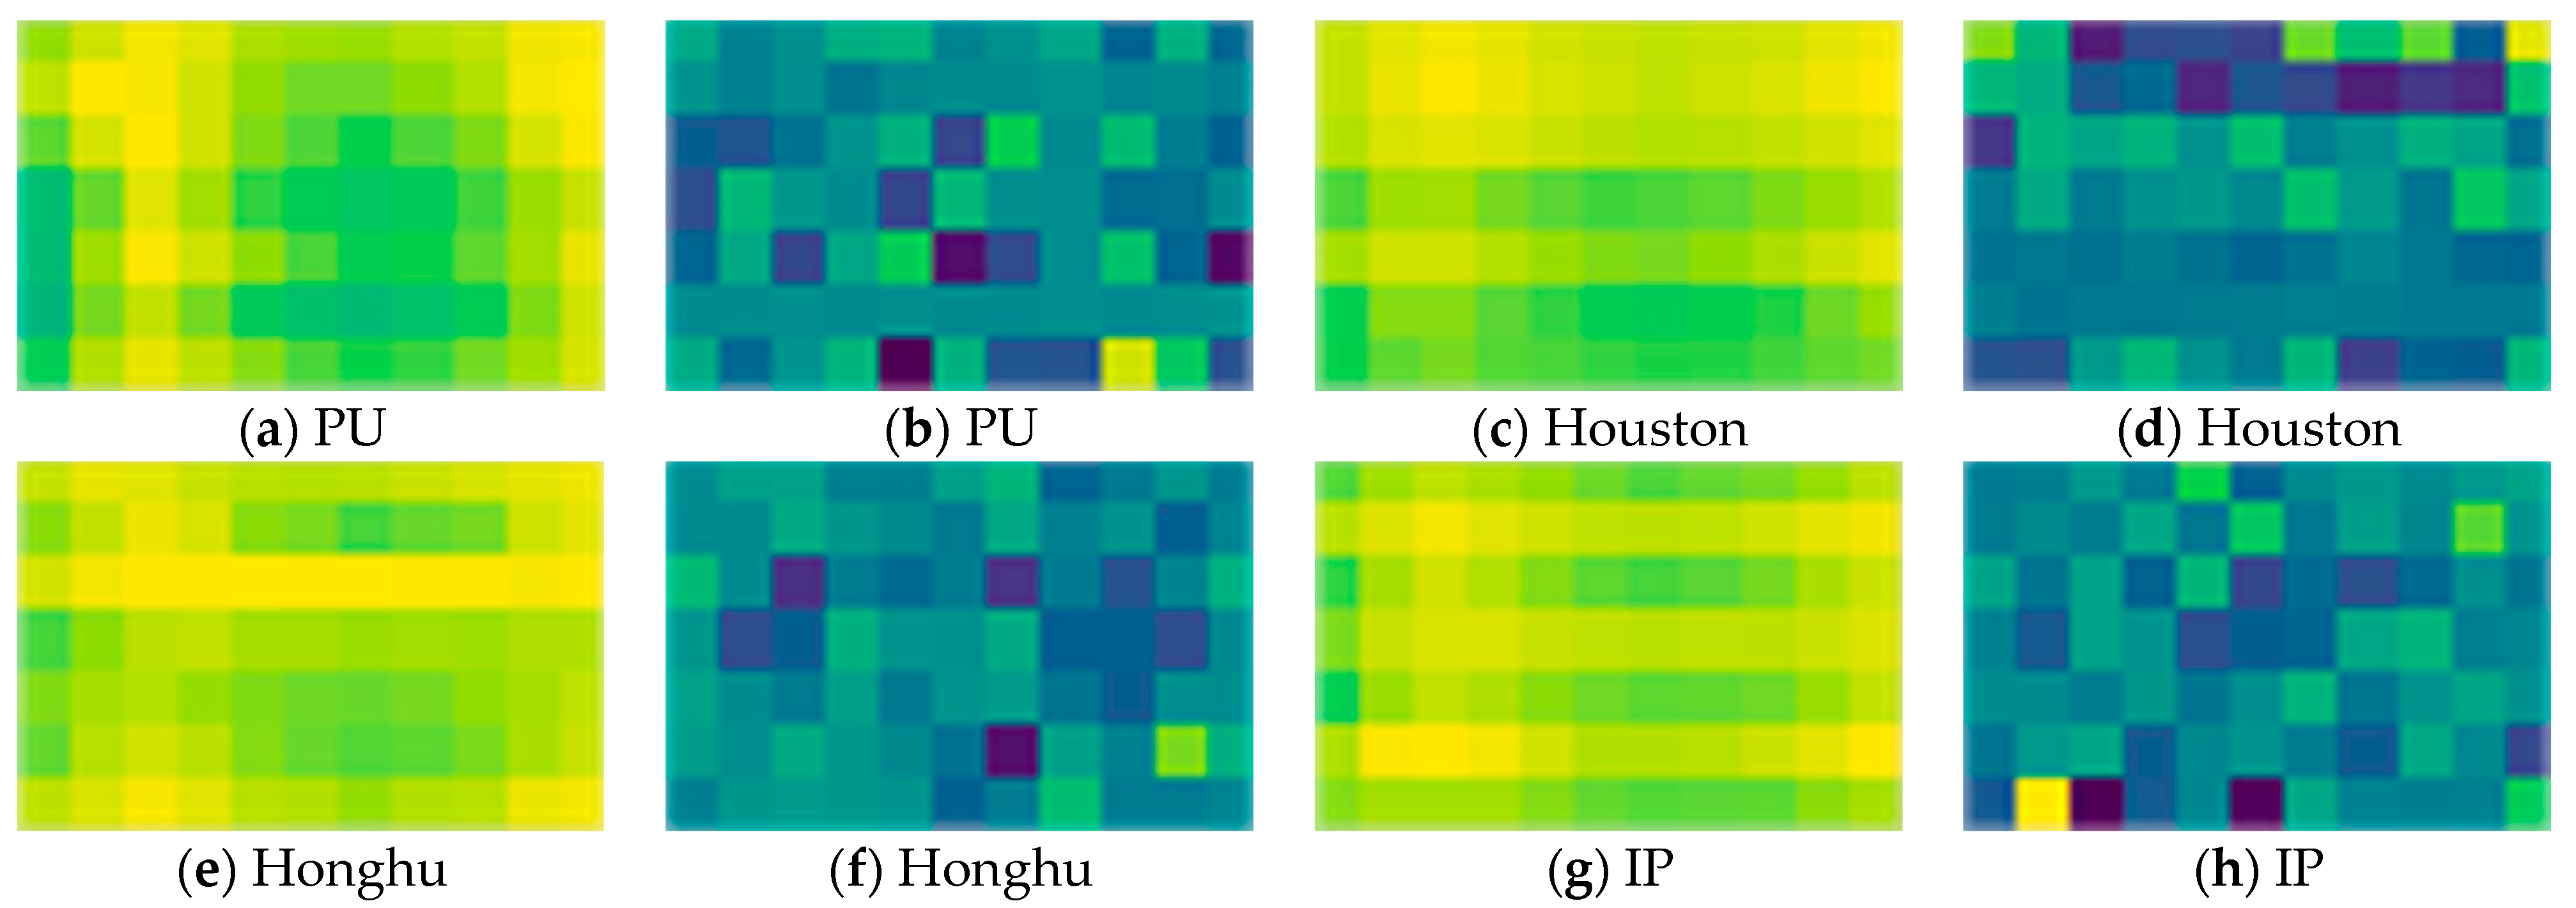
To validate the effectiveness of the proposed spectral-enhanced GCN modules, the heatmaps of features before and after using the spectral-enhanced GCN module are shown in Figure 17. Taking the PU data scene as an example, we randomly chose a 9 × 11 pixel region from the spectral matrix to show the features contained in the spectral matrix. From Figure 17a, it can be seen that the image has lighter color, especially in the range of lighter green, and each pixel does not show significant differences. It shows that the features within a certain region before using the spectral-enhanced GCN module have weak differences. Conversely, from Figure 17b, it can be seen that the heatmap displays darker colors, with different darker shades among pixels for different classes. According to Figure 17b,d,f,g,h, the features within the feature matrix are accentuated, which demonstrates the effectiveness of the proposed spectral-enhanced GCN module. On the Houston, Honghu, and IP datasets, Figure 17c,e,g shows that the feature matrices display relatively lighter colors. In contrast, Figure 17d,f,h present relatively darker feature maps, which are processed by the spectral-enhanced GCN module. These heatmaps exhibit more pronounced differences between pixels of different classes, highlighting the significant features in the feature map.

5.8. Training Times

In this subsection, the time consumed in experiments is discussed to compare the efficiency of our proposed method on each dataset used. Table 11, Table 12, Table 13 and Table 14 show the detailed training and testing times for each comparative method and our method. Taking the PU data scene as an example, Table 11 shows that the method called HDDA has the highest training time. HDDA also has the highest testing times compared to other methods. The GCN comparative method has the lowest training and testing times. SSRN, DBDA, and MDBNet have much higher training and testing times than our proposed method. For the other datasets used in our experiment section, our method exhibits similar training and testing times compared to other comparative methods. Although our proposed method does not have the lowest training and testing times, its time efficiency is acceptable compared to other comparative methods.

6. Conclusions

In this article, we propose a novel PCCGC method that combines CNN and GCN for HSI classification. It contains two parallel subnetworks, namely, a CNN-based subnetwork and a GCN-based subnetwork. Specifically, in the CNN subnetwork, a SpePRCM is employed to extract multiscale spectral signatures. Meanwhile, SpaPCCM is used to extract multiscale spatial features. Furthermore, an adaptive feature-weighted fusion strategy is employed to adaptively fuse multiscale spectral and spatial features based on their respective weights. Based on the above, the CNN subnetwork can enhance the robustness of the proposed model in classifying HSIs. In the GCN subnetwork, a BSNet is first used to learn the spectral signatures in the origin HSI using nonlinear inter-band dependencies. Then, the spectral-enhanced GCN module is employed to learn and accentuate the important features in the spectral channel. Subsequently, a mutual-cooperative attention mechanism is constructed that can align the spectral signatures between BSNet-based matrix with spectral-enhanced GCN-based matrix for spectral signature integration. Finally, the additive fusion strategy is utilized to fusion the features extracted from GCN-based and CNN-based subnetworks. The effectiveness and robustness of our designed model are demonstrated by quantitative and qualitative experiments. In addition, to verify the superior performance of our model, numerous parametric analyses and ablation experiments are conducted.
However, the spectral-enhanced module used in GCN-based subnetwork only learns the significant features in the spectral channel. In the future, the designed GNN will be employed to extract the features from the spectral and spatial channels simultaneously. And, a fusion-based mechanism will be employed to exquisitely combine the CNN and GCN model.

Author Contributions

Conceptualization, H.P. and H.Y.; methodology, H.P., H.Y. and H.G.; software, H.P., H.Y. and H.G.; validation, H.P., H.Y. and H.G.; formal analysis, H.P. and H.Y.; investigation, H.P., H.Y. and H.G.; resources, H.P., L.W. and C.S.; data curation, H.P. and H.G.; writing—original draft preparation, H.P. and H.Y.; writing—review and editing, H.P. and H.Y.; visualization, H.P., H.Y. and H.G.; supervision, H.P. and H.Y.; project administration, H.P., L.W. and C.S.; funding acquisition, H.P. and C.S. All authors have read and agreed to the published version of the manuscript.

Funding

This research was funded by Heilongjiang Provincial Natural Science Foundation of China, grant number LH2023F050, the Fundamental Research Funds in Heilongjiang Provincial Universities under Grant, grant number 145309208, the National Natural Science Foundation of China, grant number 42271409, and the Heilongjiang Provincial Higher Education Teaching and Reform Project, grant number SJGZ20220112.

Data Availability Statement

Data available in a publicly accessible repository: Pavia University dataset and Indian Pines (http://www.ehu.eus/ccwintco/index.php/Hyperspectral_Remote_Sensing_Scenes, accessed on 24 June 2024); Houston 2013 dataset (https://www.grss-ieee.org/resources/tutorials-documents/, accessed on 24 June 2024), WHU-Hi-Honghu (http://rsidea.whu.edu.cn/resource_WHUHi_sharing.htm, accessed on 24 June 2024).

Conflicts of Interest

The authors declare no conflicts of interest.

References

  1. Lorenz, S.; Salehi, S.; Kirsch, M.; Zimmermann, R.; Unger, G.; Vest Sørensen, E.; Gloaguen, R. Radiometric Correction and 3D Integration of Long-Range Ground-Based Hyperspectral Imagery for Mineral Exploration of Vertical Outcrops. Remote Sens. 2018, 10, 176. [Google Scholar] [CrossRef]
  2. Rajabi, R.; Zehtabian, A.; Singh, K.D.; Tabatabaeenejad, A.; Ghamisi, P.; Homayouni, S. Editorial: Hyperspectral Imaging in Environmental Monitoring and Analysis. Front. Environ. Sci. 2024, 11, 1353447. [Google Scholar] [CrossRef]
  3. Kütük, M.; Geneci, İ.; Bilge Özdemir, O.; Koz, A.; Esentürk, O.; Yardımcı Çetin, Y.; Alatan, A.A. Ground-Based Hyperspectral Image Surveillance System for Explosive Detection: Methods, Experiments, and Comparisons. IEEE J. Sel. Top. Appl. Earth Obs. Remote Sens. 2023, 16, 8747–8763. [Google Scholar] [CrossRef]
  4. Waczak, J.; Aker, A.; Wijeratne, L.O.H.; Talebi, S.; Fernando, A.; Dewage, P.M.H.; Iqbal, M.; Lary, M.; Schaefer, D.; Lary, D.J. Characterizing Water Composition with an Autonomous Robotic Team Employing Comprehensive In Situ Sensing, Hyperspectral Imaging, Machine Learning, and Conformal Prediction. Remote Sens. 2024, 16, 996. [Google Scholar] [CrossRef]
  5. Gallacher, C.; Benz, S.; Boehnke, D.; Jehling, M. A Collaborative Approach for the Identification of Thermal Hot-Spots: From Remote Sensing Data to Urban Planning Interventions. AGILE GIScience Ser. 2024, 5, 23. [Google Scholar] [CrossRef]
  6. Ge, H.; Wang, L.; Liu, M.; Zhao, X.; Zhu, Y.; Pan, H.; Liu, Y. Pyramidal Multiscale Convolutional Network with Polarized Self-Attention for Pixel-Wise Hyperspectral Image Classification. IEEE Trans. Geosci. Remote Sens. 2023, 61, 5504018. [Google Scholar] [CrossRef]
  7. Jia, X.; Kuo, B.-C.; Crawford, M.M. Feature Mining for Hyperspectral Image Classification. Proc. IEEE 2013, 101, 676–697. [Google Scholar] [CrossRef]
  8. Liu, Q.; Xiao, L.; Yang, J.; Wei, Z. CNN-Enhanced Graph Convolutional Network with Pixel- and Superpixel-Level Feature Fusion for Hyperspectral Image Classification. IEEE Trans. Geosci. Remote Sens. 2021, 59, 8657–8671. [Google Scholar] [CrossRef]
  9. Liu, Q.; Dong, Y.; Zhang, Y.; Luo, H. A Fast Dynamic Graph Convolutional Network and CNN Parallel Network for Hyperspectral Image Classification. IEEE Trans. Geosci. Remote Sens. 2022, 60, 5530215. [Google Scholar] [CrossRef]
  10. Zhao, C.; Wan, X.; Zhao, G.; Cui, B.; Liu, W.; Qi, B. Spectral-Spatial Classification of Hyperspectral Imagery Based on Stacked Sparse Autoencoder and Random Forest. Eur. J. Remote Sens. 2017, 50, 47–63. [Google Scholar] [CrossRef]
  11. Guo, Y.; Cao, H.; Han, S.; Sun, Y.; Bai, Y. Spectral–Spatial HyperspectralImage Classification With K-Nearest Neighbor and Guided Filter. IEEE Access 2018, 6, 18582–18591. [Google Scholar] [CrossRef]
  12. Chen, Y.-N.; Thaipisutikul, T.; Han, C.-C.; Liu, T.-J.; Fan, K.-C. Feature Line Embedding Based on Support Vector Machine for Hyperspectral Image Classification. Remote Sens. 2021, 13, 130. [Google Scholar] [CrossRef]
  13. Sun, W.; Yang, G.; Peng, J.; Du, Q. Lateral-Slice Sparse Tensor Robust Principal Component Analysis for Hyperspectral Image Classification. IEEE Geosci. Remote Sens. Lett. 2020, 17, 107–111. [Google Scholar] [CrossRef]
  14. Luo, H.; Tang, Y.Y.; Biuk-Aghai, R.P.; Yang, X.; Yang, L.; Wang, Y. Wavelet-Based Extended Morphological Profile and Deep Autoencoder for Hyperspectral Image Classification. Int. J. Wavelets Multiresolution Inf. Process. 2018, 16, 1850016. [Google Scholar] [CrossRef]
  15. Fang, L.; Li, S.; Kang, X.; Benediktsson, J.A. Spectral–Spatial Classification of Hyperspectral Images With a Superpixel-Based Discriminative Sparse Model. IEEE Trans. Geosci. Remote Sens. 2015, 53, 4186–4201. [Google Scholar] [CrossRef]
  16. Wang, T.; Wang, G.; Tan, K.E.; Tan, D. Spectral Pyramid Graph Attention Network for Hyperspectral Image Classification. arXiv 2020, arXiv:2001.07108. [Google Scholar]
  17. Zhang, X.; Chen, S.; Zhu, P.; Tang, X.; Feng, J.; Jiao, L. Spatial Pooling Graph Convolutional Network for Hyperspectral Image Classification. IEEE Trans. Geosci. Remote Sens. 2022, 60, 1–15. [Google Scholar] [CrossRef]
  18. Liu, M.; Pan, H.; Ge, H.; Wang, L. MS3Net: Multiscale Stratified-Split Symmetric Network with Quadra-View Attention for Hyperspectral Image Classification. Signal Process. 2023, 212, 109153. [Google Scholar] [CrossRef]
  19. Hu, W.; Huang, Y.; Wei, L.; Zhang, F.; Li, H. Deep Convolutional Neural Networks for Hyperspectral Image Classification. J. Sens. 2015, 2015, 258619. [Google Scholar] [CrossRef]
  20. Hang, R.; Liu, Q.; Hong, D.; Ghamisi, P. Cascaded Recurrent Neural Networks for Hyperspectral Image Classification. IEEE Trans. Geosci. Remote Sens. 2019, 57, 5384–5394. [Google Scholar] [CrossRef]
  21. Yang, A.; Li, M.; Ding, Y.; Hong, D.; Lv, Y.; He, Y. GTFN: GCN and Transformer Fusion Network With Spatial-Spectral Features for Hyperspectral Image Classification. IEEE Trans. Geosci. Remote Sens. 2023, 61, 6600115. [Google Scholar] [CrossRef]
  22. Yao, J.; Zhang, B.; Li, C.; Hong, D.; Chanussot, J. Extended Vision Transformer (ExViT) for Land Use and Land Cover Classification: A Multimodal Deep Learning Framework. IEEE Trans. Geosci. Remote Sens. 2023, 61, 5514415. [Google Scholar] [CrossRef]
  23. Mei, S.; Song, C.; Ma, M.; Xu, F. Hyperspectral Image Classification Using Group-Aware Hierarchical Transformer. IEEE Trans. Geosci. Remote Sens. 2022, 60, 5539014. [Google Scholar] [CrossRef]
  24. Wu, K.; Fan, J.; Ye, P.; Zhu, M. Hyperspectral Image Classification Using Spectral–Spatial Token Enhanced Transformer With Hash-Based Positional Embedding. IEEE Trans. Geosci. Remote Sens. 2023, 61, 5507016. [Google Scholar] [CrossRef]
  25. Miftahushudur, T.; Grieve, B.; Yin, H. Permuted KPCA and SMOTE to Guide GAN-Based Oversampling for Imbalanced HSI Classification. IEEE J. Sel. Top. Appl. Earth Obs. Remote Sens. 2024, 17, 489–505. [Google Scholar] [CrossRef]
  26. Xu, M.; Sun, J.; Yao, K.; Cai, Q.; Shen, J.; Tian, Y.; Zhou, X. Developing Deep Learning Based Regression Approaches for Prediction of Firmness and pH in Kyoho Grape Using Vis/NIR Hyperspectral Imaging. Infrared Phys. Technol. 2022, 120, 104003. [Google Scholar] [CrossRef]
  27. Yang, J.; Zhao, Y.-Q.; Chan, J.C.-W. Learning and Transferring Deep Joint Spectral–Spatial Features for Hyperspectral Classification. IEEE Trans. Geosci. Remote Sens. 2017, 55, 4729–4742. [Google Scholar] [CrossRef]
  28. Qi, W.; Zhang, X.; Wang, N.; Zhang, M.; Cen, Y. A Spectral-Spatial Cascaded 3D Convolutional Neural Network with a Convolutional Long Short-Term Memory Network for Hyperspectral Image Classification. Remote Sens. 2019, 11, 2363. [Google Scholar] [CrossRef]
  29. Fu, C.; Du, B.; Zhang, L. ReSC-Net: Hyperspectral Image Classification Based on Attention-Enhanced Residual Module and Spatial-Channel Attention. IEEE Trans. Geosci. Remote Sens. 2024, 62, 5518615. [Google Scholar] [CrossRef]
  30. Li, Y.; Yang, X.; Tang, D.; Zhou, Z. RDTN: Residual Densely Transformer Network for Hyperspectral Image Classification. Expert Syst. Appl. 2024, 250, 123939. [Google Scholar] [CrossRef]
  31. Pan, H.; Zhao, X.; Ge, H.; Liu, M.; Shi, C. Hyperspectral Image Classification Based on Multiscale Hybrid Networks and Attention Mechanisms. Remote Sens. 2023, 15, 2720. [Google Scholar] [CrossRef]
  32. Ding, Y.; Chong, Y.; Pan, S.; Zheng, C.-H. Class-Imbalanced Graph Convolution Smoothing for Hyperspectral Image Classification. IEEE Trans. Geosci. Remote Sens. 2024, 62, 5510618. [Google Scholar] [CrossRef]
  33. Wan, S.; Gong, C.; Zhong, P.; Du, B.; Zhang, L.; Yang, J. Multi-scale Dynamic Graph Convolutional Network for Hyperspectral Image Classification. IEEE Trans. Geosci. Remote Sens. 2019, 58, 3162–3177. [Google Scholar] [CrossRef]
  34. Zhang, Y.; Miao, R.; Dong, Y.; Du, B. Multiorder Graph Convolutional Network With Channel Attention for Hyperspec-tral Change Detection. IEEE J. Sel. Top. Appl. Earth Obs. Remote Sens. 2024, 17, 1523–1534. [Google Scholar] [CrossRef]
  35. Dong, Y.; Liu, Q.; Du, B.; Zhang, L. Weighted Feature Fusion of Convolutional Neural Network and Graph Attention Network for Hyperspectral Image Classification. IEEE Trans. Image Process. 2022, 31, 1559–1572. [Google Scholar] [CrossRef]
  36. Guan, R.; Li, Z.; Tu, W.; Wang, J.; Liu, Y.; Li, X.; Tang, C.; Feng, R. Contrastive Multiview Subspace Clustering of Hyperspectral Images Based on Graph Convolutional Networks. IEEE Trans. Geosci. Remote Sens. 2024, 62, 5510514. [Google Scholar] [CrossRef]
  37. Zhou, H.; Luo, F.; Zhuang, H.; Weng, Z.; Gong, X.; Lin, Z. Attention Multihop Graph and Multiscale Convolutional Fusion Network for Hyperspectral Image Classification. IEEE Trans. Geosci. Remote Sens. 2023, 61, 5508614. [Google Scholar] [CrossRef]
  38. Li, W.; Liu, Q.; Fan, S.; Xu, C.; Bai, H. Dual-Stream GNN Fusion Network for Hyperspectral Classification. Appl. Intell. 2023, 53, 26542–26567. [Google Scholar] [CrossRef]
  39. Jia, S.; Jiang, S.; Zhang, S.; Xu, M.; Jia, X. Graph-in-Graph Convolutional Network for Hyperspectral Image Classification. IEEE Trans. Neural Netw. Learn. Syst. 2024, 35, 1157–1171. [Google Scholar] [CrossRef]
  40. Hong, D.; Gao, L.; Yao, J.; Zhang, B.; Plaza, A.; Chanussot, J. Graph Convolutional Networks for Hyperspectral Image Classification. IEEE Trans. Geosci. Remote Sens. 2021, 59, 5966–5978. [Google Scholar] [CrossRef]
  41. Gao, H.; Sheng, R.; Chen, Z.; Liu, H.; Xu, S.; Zhang, B. Multiscale Random-Shape Convolution and Adaptive Graph Convolution Fusion Network for Hyperspectral Image Classification. IEEE Trans. Geosci. Remote Sens. 2024, 62, 5516017. [Google Scholar] [CrossRef]
  42. Zhang, Z.; Cai, Y.; Liu, X.; Zhang, M.; Meng, Y. An Efficient Graph Convolutional RVFL Network for Hyperspectral Image Classification. Remote Sens. 2023, 16, 37. [Google Scholar] [CrossRef]
  43. Liu, X.; Liu, S.; Chen, W.; Qu, S. HDECGCN: A Heterogeneous Dual Enhanced Network Based on Hybrid CNNs Joint Multiscale Dynamic GCNs for Hyperspectral Image Classification. IEEE Trans. Geosci. Remote Sens. 2024, 62, 5515717. [Google Scholar] [CrossRef]
  44. Shi, C.; Yue, S.; Wu, H.; Zhu, F.; Wang, L. A Multihop Graph Rectify Attention and Spectral Overlap Grouping Convolutional Fusion Network for Hyperspectral Image Classification. IEEE Trans. Geosci. Remote Sens. 2024, 62, 5520517. [Google Scholar] [CrossRef]
  45. K Ghotekar, R.; Shaw, K.; Rout, M. Deep Feature Segmentation Model Driven by Hybrid Convolution Network for Hyper Spectral Image Classification. Int. J. Comput. Digit. Syst. 2024, 15, 719–738. [Google Scholar] [CrossRef] [PubMed]
  46. Lu, Y.; Mei, S.; Xu, F.; Ma, M.; Wang, X. Separable Deep Graph Convolutional Network Integrated With CNN and Prototype Learning for Hyperspectral Image Classification. IEEE Trans. Geosci. Remote Sens. 2024, 62, 5516216. [Google Scholar] [CrossRef]
  47. Li, H.; Xiong, X.; Liu, C.; Ma, Y.; Zeng, S.; Li, Y. SFFNet: Staged Feature Fusion Network of Connecting Convolutional Neural Networks and Graph Convolutional Neural Networks for Hyperspectral Image Classification. Appl. Sci. 2024, 14, 2327. [Google Scholar] [CrossRef]
  48. El Abady, N.F.; Zayed, H.H.; Taha, M. An Efficient Technique for Detecting Document Forgery in Hyperspectral Document Images. Alex. Eng. J. 2023, 85, 207–217. [Google Scholar] [CrossRef]
  49. Fan, S.; Liu, Q.; Li, W.; Bai, H. A Frequency and Topology Interaction Network for Hyperspectral Image Classification. Eng. Appl. Artif. Intell. 2024, 133, 108234. [Google Scholar] [CrossRef]
  50. Feng, H.; Wang, Y.; Chen, C.; Xu, D.; Zhao, Z.; Zhao, T. Hyperspectral Image Classification Framework Based on Multichannel Graph Convolutional Networks and Class-Guided Attention Mechanism. IEEE Trans. Geosci. Remote Sens. 2024, 62, 5515115. [Google Scholar] [CrossRef]
  51. Jiang, M.; Su, Y.; Gao, L.; Plaza, A.; Zhao, X.-L.; Sun, X.; Liu, G. GraphGST: Graph Generative Structure-Aware Transformer for Hyperspectral Image Classification. IEEE Trans. Geosci. Remote Sens. 2024, 62, 5504016. [Google Scholar] [CrossRef]
  52. Wu, Z.; Pan, S.; Chen, F.; Long, G.; Zhang, C. A Comprehensive Survey on Graph Neural Networks. IEEE Trans. Neural Netw. Learn. Syst. 2019, 32, 4–24. [Google Scholar] [CrossRef] [PubMed]
  53. Yu, W.; Wan, S.; Li, G.; Yang, J.; Gong, C. Hyperspectral Image Classification with Contrastive Graph Convolutional Network. IEEE Trans. Geosci. Remote Sens. 2023, 61, 5503015. [Google Scholar] [CrossRef]
  54. Shi, C.; Wu, H.; Wang, L. CEGAT: A CNN and Enhanced-GAT Based on Key Sample Selection Strategy for Hyperspectral Image Classification. Neural Netw. 2023, 168, 105–122. [Google Scholar] [CrossRef] [PubMed]
  55. Wang, Q.; Huang, J.; Meng, Y.; Shen, T. DF2Net: Differential Feature Fusion Network for Hyperspectral Image Classification. IEEE J. Sel. Top. Appl. Earth Obs. Remote Sens. 2024, 17, 10660–10673. [Google Scholar] [CrossRef]
  56. Wang, J.; Li, J.; Shi, Y.; Lai, J.; Tan, X. AM3Net: Adaptive Mutual-Learning-Based Multimodal Data Fusion Network. IEEE Trans. Circuits Syst. Video Technol. 2022, 32, 5411–5426. [Google Scholar] [CrossRef]
  57. Xue, H.; Sun, X.-K.; Sun, W.-X. Multi-Hop Hierarchical Graph Neural Networks. In Proceedings of the 2020 IEEE International Conference on Big Data and Smart Computing (BigComp), Busan, Republic of Korea, 19–22 February 2020; IEEE: Busan, Republic of Korea, 2020; pp. 82–89. [Google Scholar]
  58. Cai, Y.; Liu, X.; Cai, Z. BS-Nets: An End-to-End Framework for Band Selection of Hyperspectral Image. IEEE Trans. Geosci. Remote Sens. 2020, 58, 1969–1984. [Google Scholar] [CrossRef]
  59. Zhong, Z.; Li, J.; Luo, Z.; Chapman, M. Spectral–Spatial Residual Network for Hyperspectral Image Classification: A 3-D Deep Learning Framework. IEEE Trans. Geosci. Remote Sens. 2018, 56, 847–858. [Google Scholar] [CrossRef]
  60. Li, R.; Zheng, S.; Duan, C.; Yang, Y.; Wang, X. Classification of Hyperspectral Image Based on Double-Branch Dual-Attention Mechanism Network. Remote Sens. 2020, 12, 582. [Google Scholar] [CrossRef]
  61. Li, Z.; Cui, X.; Wang, L.; Zhang, H.; Zhu, X.; Zhang, Y. Spectral and Spatial Global Context Attention for Hyperspectral Image Classification. Remote Sens. 2021, 13, 771. [Google Scholar] [CrossRef]
  62. Shi, H.; Cao, G.; Ge, Z.; Zhang, Y.; Fu, P. Double-Branch Network with Pyramidal Convolution and Iterative Attention for Hyperspectral Image Classification. Remote Sens. 2021, 13, 1403. [Google Scholar] [CrossRef]
  63. Gao, H.; Zhang, Y.; Chen, Z.; Li, C. A Multiscale Dual-Branch Feature Fusion and Attention Network for Hyperspectral Images Classification. IEEE J. Sel. Top. Appl. Earth Obs. Remote Sens. 2021, 14, 8180–8192. [Google Scholar] [CrossRef]
  64. Zhao, J.; Hu, L.; Dong, Y.; Huang, L. Hybrid Dense Network with Dual Attention for Hyperspectral Image Classification. Remote Sens. 2021, 13, 4921. [Google Scholar] [CrossRef]
  65. Ge, H.; Wang, L.; Liu, M.; Zhu, Y.; Zhao, X.; Pan, H.; Liu, Y. Two-Branch Convolutional Neural Network with Polarized Full Attention for Hyperspectral Image Classification. Remote Sens. 2023, 15, 848. [Google Scholar] [CrossRef]
  66. Defferrard, M.; Bresson, X.; Vandergheynst, P. Convolutional Neural Networks on Graphs with Fast Localized Spectral Filtering; EPFL: Lausanne, Switzerland, 2017. [Google Scholar]
  67. Kipf, T.N.; Welling, M. Semi-Supervised Classification with Graph Convolutional Networks. arXiv 2016, arXiv:1609.02907. [Google Scholar]
  68. Zhao, F.; Zhang, J.; Meng, Z.; Liu, H.; Chang, Z.; Fan, J. Multiple Vision Architectures-Based Hybrid Network for Hyperspectral Image Classification. Expert Syst. Appl. 2023, 234, 121032. [Google Scholar] [CrossRef]
  69. Zhang, J.; Zhao, F.; Liu, H.; Yu, J. Data and Knowledge-Driven Deep Multiview Fusion Network Based on Diffusion Model for Hyperspectral Image Classification. Expert Syst. Appl. 2024, 249, 123796. [Google Scholar] [CrossRef]
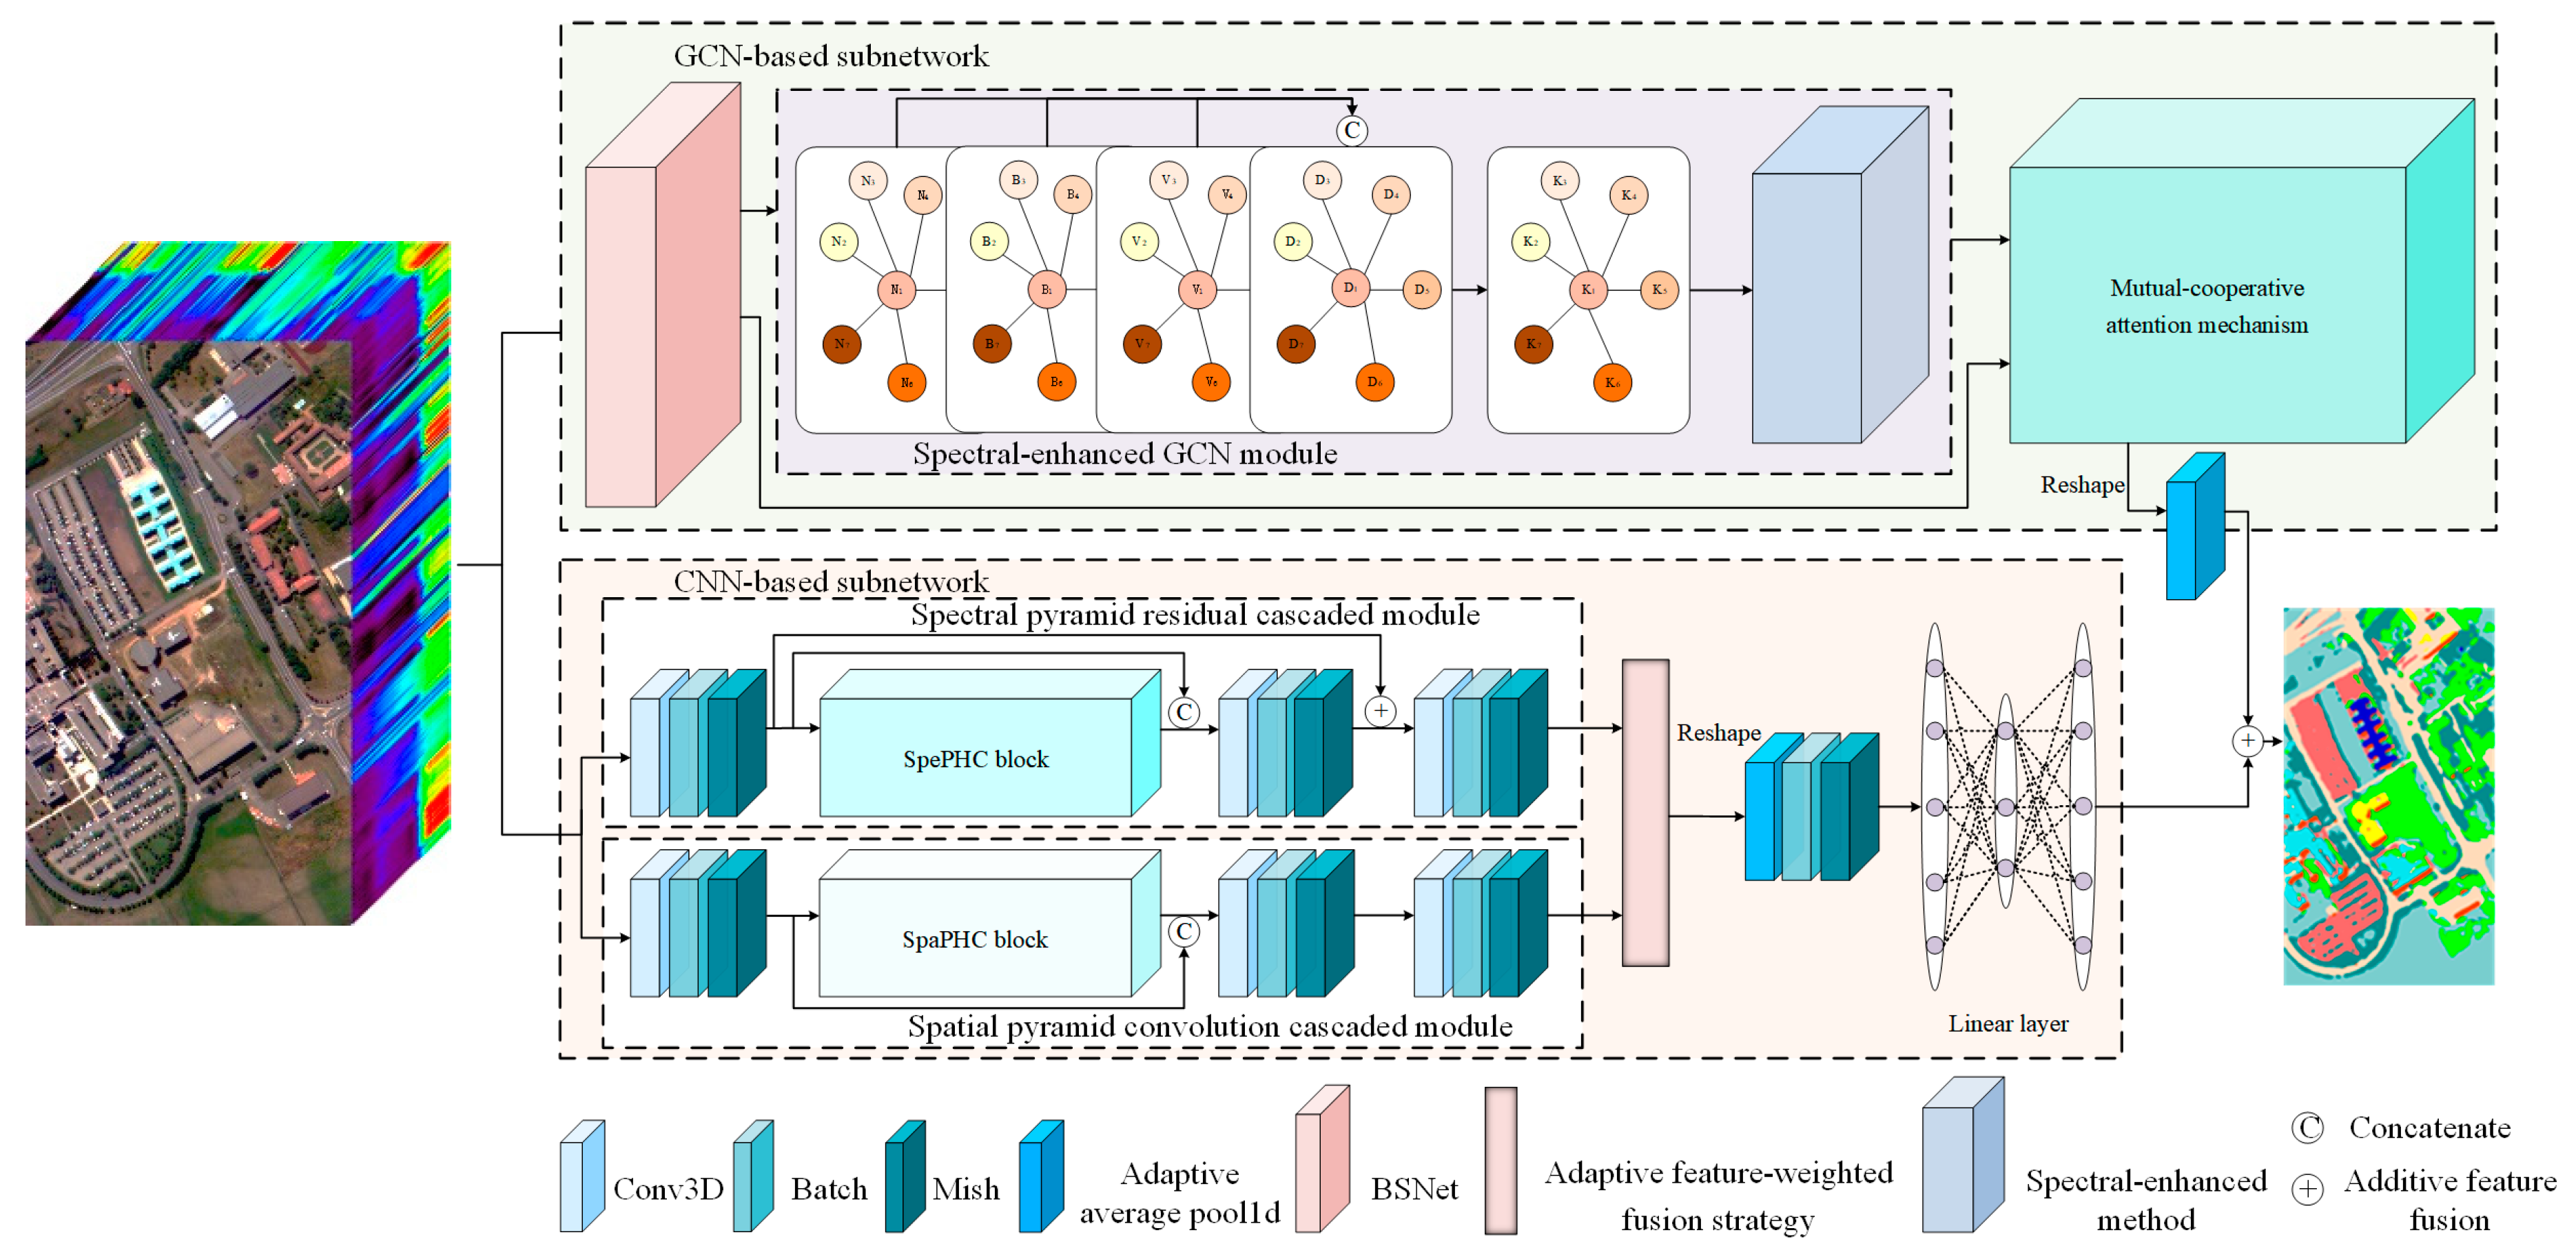
Figure 1. The overall structure of the PCCGC.
Remotesensing 16 02942 g001
Figure 2. The detailed structure of the SpePHC block.
Remotesensing 16 02942 g002
Figure 3. The detailed structure of the SpaPHC block.
Remotesensing 16 02942 g003
Figure 4. The detailed structure of the spectral-enhanced GCN module.
Remotesensing 16 02942 g004
Figure 5. The structure of the mutual-cooperative attention mechanism.
Remotesensing 16 02942 g005
Figure 6. Full-pixel classification maps for the PU data scene. (a) Ground-truth; (b) SSRN; (c) DBDA; (d) SSGCA; (e) PCIA; (f) MDBNet; (g) HDDA; (h) DBPFA; (i) ChebNet; (j) GCN; (k) MVAHN; (l) DGFNet; (m) FTINet; (n) DKDMN; (o) MRCAG; (p) Ours; (q) False-color image.
Remotesensing 16 02942 g006
Figure 7. Full-pixel classification maps for the Houston data scene. (a) Ground-truth; (b) SSRN; (c) DBDA; (d) SSGCA; (e) PCIA; (f) MDBNet; (g) HDDA; (h) DBPFA; (i) ChebNet; (j) GCN; (k) MVAHN; (l) DGFNet; (m) FTINet; (n) DKDMN; (o) MRCAG; (p) Ours; (q) False-color image.
Remotesensing 16 02942 g007aRemotesensing 16 02942 g007b
Figure 8. Full-pixel classification maps for the Houghu data scene. (a) Ground-truth; (b) SSRN; (c) DBDA; (d) SSGCA; (e) PCIA; (f) MDBNet; (g) HDDA; (h) DBPFA; (i) ChebNet; (j) GCN; (k) MVAHN; (l) DGFNet; (m) FTINet; (n) DKDMN; (o) MRCAG; (p) Ours; (q) False-color image.
Remotesensing 16 02942 g008
Figure 9. Full-pixel classification maps for the IP data scene. (a) Ground-truth; (b) SSRN; (c) DBDA; (d) SSGCA; (e) PCIA; (f) MDBNet; (g) HDDA; (h) DBPFA; (i) ChebNet; (j) GCN; (k) MVAHN; (l) DGFNet; (m) FTINet; (n) DKDMN; (o) MRCAG; (p) Ours; (q) False-color image.
Remotesensing 16 02942 g009
Figure 10. Full-pixel classification maps for the IP data scene. (a) Ground-truth; (b) SSRN; (c) DBDA; (d) SSGCA; (e) PCIA; (f) MDBNet; (g) HDDA; (h) DBPFA; (i) ChebNet; (j) GCN; (k) MVAHN; (l) DGFNet; (m) FTINet; (n) DKDMN; (o) MRCAG; (p) Ours; (q) False-color image.
Remotesensing 16 02942 g010
Figure 11. The train accuracy and validation accuracy under the influence of weight α _ 1 and weight α _ 2 on (a) PU; (b) Honghu; (c) Houston; and (d) IP data scenes.
Remotesensing 16 02942 g011
Figure 12. The OA of our proposed model under different GCN layers on PU, Honghu, Houston, and IP data scenes.
Remotesensing 16 02942 g012
Figure 13. The OA of learning rate of our method under different epochs on (a) PU; (b) Honghu; (c) Houston; (d) IP data scenes.
Remotesensing 16 02942 g013
Figure 14. The OA of different classification methods under different training samples on (a) PU; (b) Honghu; (c) Houston; (d) IP data scenes.
Remotesensing 16 02942 g014
Figure 15. Feature visualization map of ten comparative methods and our proposed method on IP data scene. (a) Origin data; (b) SSRN; (c) DBDA; (d) SSGCA; (e) PCIA; (f) MDBNet; (g) HDDA; (h) DBPFA; (i) ChebNet; (j) GCN; (k) MVAHN; (l) DGFNet; (m) FTINet; (n) DKDMN; (o) MRCAG; (p) ours.
Remotesensing 16 02942 g015
Figure 16. Ablation experiments of our proposed model on PU, Houston, Honghu, and IP data scenes: model_0: complete model; model_1: model without mutual-cooperative mechanism; model_2: model with mutual-cooperative attention mechanism that includes GCN-based spectral signature; model_3: model without spectral-enhanced GCN module; model_4: the model that only includes GCN-based subnetwork; model_5: model that only includes CNN-based subnetwork; model_6: model without adaptive feature-weighted fusion strategy; model_7: model without spectral pyramid hybrid convolution block; model_8: model without spatial pyramid hybrid convolution block.
Remotesensing 16 02942 g016
Figure 17. The features before the spectral-enhanced GCN module: (a,c,e,g), the features after the spectral-enhanced GCN module: (b,d,f,h).
Remotesensing 16 02942 g017
Table 1. The landcover classes of the PU, the color of each class, and the number of each class in the training set, validation set, and test set.
ClassColorTotalTrainValidationTest
C1 663166666499
C2 18,64918618618,277
C3 209920202059
C4 306430303004
C5 134513131319
C6 502950504929
C7 133013131304
C8 368236363610
C9 94799929
Total 42,77642342341,930
Table 2. The landcover classes of the Houston, the color of each class, and the number of each class in the training set, validation set, and test set.
ClassColorTotalTrainValidationTest
C1 125125251201
C2 125425251204
C3 6971313671
C4 124424241196
C5 124224241194
C6 32566313
C7 126825251218
C8 124424241196
C9 125225251202
C10 122724241179
C11 123524241187
C12 123324241185
C13 46999451
C14 42888412
C15 6601313634
Total 15,02929329314,443
Table 3. The landcover classes of the Honghu, the color of each class, and the number of each class in the training set, validation set, and test set.
ClassColorTotalTrainValidationTest
C1 332033333254
C2 148214141454
C3 18,72518718718,351
C4 179217171758
C5 14,93914914914,641
C6 580858585692
C7 405440403974
C8 237523232329
C9 93999921
C10 258425252534
C11 397939393901
C12 430743434221
C13 10021010982
C14 56355553
C15 97399955
C16 203720201997
Total 68,87968168167,517
Table 4. The landcover classes of the IP, the color of each class, and the number of each class in the training set, validation set, and test set.
ClassColorTotalTrainValidationTest
C1 462242
C2 142871711286
C3 8304141748
C4 2371111215
C5 4832424435
C6 7303636658
C7 281126
C8 4782323432
C9 201118
C10 9724848876
C11 24551221222211
C12 5932929535
C13 2051010185
C14 126563631139
C15 3861919348
C16 934485
Total 10,2495055059239
Table 5. The landcover classes of the Xiongan, the color of each class, and the number of each class in the training set, validation set, and test set.
ClassColorTotalTrainValidationTest
C1 426,13842614261417,616
C2 187,42518741874183,677
C3 124,86212481248122,366
C4 91,51891591589,688
C5 197,21819721972193,274
C6 19,66319619619,271
C7 296,53829652965290,608
C8 276,75527672767271,221
C9 44,23244244243,348
C10 372,70837273727365,254
C11 67,21067267265,866
C12 29,76329729729,169
C13 85,54785585583,837
C14 68,88568868867,509
C15 986,13998619861966,417
C16 745674747308
C17 27,17827127126,636
C18 650665656376
C19 26,14026126125,618
Total 3,341,88133,41133,4113,275,059
Table 6. Classification results of the PU data based on 1% training samples.
ClassSSRNDBDASSGCAPCIAMDBNetHDDADBPFAChebNetGCNMVAHNDGFNetFTINetDKDMNMRCAGOurs
C184.43 ± 1.3596.21 ± 0.3496.20 ± 1.1098.47 ± 0.3185.75 ± 0.2995.57 ± 0.3599.51 ± 0.2078.60 ± 0.7783.78 ± 1.3598.60 ± 0.1292.69 ± 0.1488.98 ± 0.4998.58 ± 0.5484.90 ± 2.5398.54 ± 0.07
C288.67 ± 0.9098.54 ± 0.1099.33 ± 0.0999.86 ± 0.1285.74 ± 0.2999.28 ± 0.3598.91 ± 0.1094.58 ± 0.2695.19 ± 0.0899.78 ± 0.1399.07 ± 0.4486.15 ± 0.3398.22 ± 0.8492.03 ± 1.9399.79 ± 0.06
C353.60 ± 2.4795.66 ± 0.4899.03 ± 0.3594.83 ± 1.1359.23 ± 1.1891.31 ± 1.5896.23 ± 1.1667.15 ± 0.8073.84 ± 1.5599.23 ± 0.1194.47 ± 0.1054.21 ± 1.5296.70 ± 1.5253.67 ± 4.2199.31 ± 0.40
C4100.00 ± 0.0097.46 ± 0.1398.59 ± 0.0299.23 ± 0.3393.43 ± 0.2296.73 ± 0.6999.24 ± 0.1498.51 ± 0.1997.37 ± 0.3298.35 ± 0.1199.73 ± 0.0298.97 ± 0.2493.97 ± 0.5895.27 ± 1.9798.83 ± 0.09
C599.84 ± 0.1499.58 ± 0.0499.66 ± 0.0496.30 ± 0.9297.49 ± 0.2598.08 ± 0.5595.00 ± 0.2097.50 ± 0.3297.15 ± 0.3692.61 ± 0.18100.00 ± 0.0096.27 ± 0.2799.97 ± 0.0497.48 ± 0.3498.38 ± 0.11
C698.44 ± 0.6199.09 ± 0.2199.84 ± 0.0299.97 ± 0.0376.62 ± 1.2399.01 ± 2.3799.90 ± 0.0394.70 ± 0.2192.13 ± 0.2699.66 ± 0.0598.12 ± 1.3878.57 ± 2.1799.47 ± 0.0473.36 ± 1.4499.92 ± 0.02
C799.92 ± 0.2098.84 ± 0.23100.00 ± 0.0098.79 ± 1.3664.78 ± 0.5583.10 ± 0.6194.13 ± 4.5357.20 ± 3.0154.53 ± 4.9399.97 ± 0.0598.36 ± 0.9563.48 ± 3.2193.12 ± 1.8765.58 ± 4.14100.00 ± 0.00
C881.16 ± 1.9383.32 ± 0.4095.54 ± 0.8287.18 ± 1.1878.63 ± 1.0086.94 ± 1.0290.01 ± 0.6172.23 ± 0.3576.07 ± 0.6895.64 ± 0.3484.89 ± 1.1170.00 ± 3.8492.79 ± 0.5270.45 ± 1.1897.58 ± 1.19
C974.69 ± 6.5596.18 ± 0.3998.97 ± 0.2397.34 ± 0.4799.35 ± 0.0798.28 ± 0.95100.00 ± 0.0095.95 ± 0.7995.88 ± 0.7696.38 ± 0.2097.73 ± 0.4399.58 ± 0.2898.85 ± 0.3594.38 ± 1.7199.79 ± 0.03
OA85.95 ± 0.7096.52 ± 0.0598.52 ± 0.2797.98 ± 0.1583.65 ± 0.1296.39 ± 0.4497.90 ± 0.2588.35 ± 0.3389.40 ± 0.6098.78 ± 0.0796.42 ± 0.0983.70 ± 0.5397.44 ± 0.4784.96 ± 1.1599.28 ± 0.08
AA86.75 ± 0.2696.10 ± 0.0498.57 ± 0.2096.89 ± 0.3082.34 ± 0.1294.26 ± 0.2396.99 ± 0.6384.05 ± 0.6485.11 ± 0.6797.80 ± 0.0496.12 ± 0.0981.80 ± 0.4796.85 ± 0.3080.79 ± 0.9499.13 ± 0.10
K × 10080.88 ± 1.0095.38 ± 0.0798.04 ± 0.3697.32 ± 0.2077.82 ± 0.1795.22 ± 0.5897.21 ± 0.3384.35 ± 0.4585.84 ± 0.7798.39 ± 0.0995.24 ± 0.1177.87 ± 0.7496.60 ± 0.6279.91 ± 1.7299.05 ± 0.10
Table 7. Classification results of the Houston data based on 2% training samples.
ClassSSRNDBDASSGCAPCIAMDBNetHDDADBPFAChebNetGCNMVAHNDGFNetFTINetDKDMNMRCAGOurs
C188.54 ± 8.2497.98 ± 0.1197.36 ± 0.1895.64 ± 0.6986.00 ± 0.4787.66 ± 0.5892.15 ± 0.3989.93 ± 0.3686.42 ± 1.3185.30 ± 1.0596.52 ± 0.4282.39 ± 1.7398.05 ± 0.2091.32 ± 0.7292.51 ± 0.78
C295.54 ± 7.9394.21 ± 0.7191.47 ± 0.4295.99 ± 0.1692.30 ± 0.3195.44 ± 0.05100.00 ± 0.0076.75 ± 0.6085.50 ± 1.3294.08 ± 0.8090.86 ± 0.4694.99 ± 1.1686.94 ± 0.6290.32 ± 1.0795.19 ± 0.97
C399.53 ± 0.27100.00 ± 0.00100.00 ± 0.00100.00 ± 0.0099.55 ± 0.00100.00 ± 0.0099.97 ± 0.0996.10 ± 0.4195.98 ± 0.91100.00 ± 0.0099.11 ± 0.2491.96 ± 0.64100.00 ± 0.00100.00 ± 0.00100.00 ± 0.00
C461.95 ± 48.0193.14 ± 0.0891.69 ± 0.3794.39 ± 0.1385.90 ± 0.7995.48 ± 0.4196.39 ± 0.1692.61 ± 0.5085.69 ± 1.4696.05 ± 0.2890.65 ± 0.1888.72 ± 0.5194.16 ± 0.1990.92 ± 02798.78 ± 0.34
C575.29 ± 8.4497.85 ± 0.2989.59 ± 0.3498.51 ± 0.1398.91 ± 0.0499.72 ± 0.0899.83 ± 0.3185.72 ± 0.2288.48 ± 1.9099.24 ± 0.3398.59 ± 0.1891.35 ± 0.1996.14 ± 0.3594.20 ± 1.5399.91 ± 0.03
C697.70 ± 1.8896.82 ± 0.21100.00 ± 0.00100.00 ± 0.0099.23 ± 0.0099.68 ± 0.00100.00 ± 0.0097.83 ± 0.4090.79 ± 1.9097.44 ± 0.8599.28 ± 0.0083.58 ± 1.83100.00 ± 0.0098.88 ± 0.3295.23 ± 1.13
C761.44 ± 12.3988.84 ± 0.6292.83 ± 0.9196.14 ± 0.5174.51 ± 0.4596.67 ± 0.2294.79 ± 0.9082.64 ± 0.4665.89 ± 0.9292.87 ± 0.2285.87 ± 1.5077.83 ± 3.6595.43 ± 0.2485.81 ± 2.1096.33 ± 0.55
C845.99 ± 8.9299.98 ± 0.0591.71 ± 0.8199.12 ± 0.2494.20 ± 0.2594.16 ± 0.5597.83 ± 0.3889.00 ± 1.1958.57 ± 2.0497.58 ± 0.3592.61 ± 0.0680.89 ± 0.64100.00 ± 0.0088.48 ± 3.5497.83 ± 0.30
C995.56 ± 3.7593.04 ± 0.9096.93 ± 0.1791.69 ± 0.4278.02 ± 0.6887.56 ± 0.7589.39 ± 0.7467.54 ± 0.3270.58 ± 2.0696.06 ± 1.2088.20 ± 0.8558.22 ± 1.9591.47 ± 0.4869.44 ± 10.0089.30 ± 0.70
C1087.82 ± 10.2193.50 ± 0.1596.03 ± 1.7681.71 ± 0.1178.84 ± 0.4796.13 ± 1.7184.75 ± 0.9354.53 ± 0.3048.84 ± 1.5291.91 ± 1.3087.83 ± 0.9472.43 ± 2.5380.86 ± 0.3766.28 ± 4.4895.81 ± 0.51
C1199.64 ± 0.9597.17 ± 0.3588.07 ± 5.3897.72 ± 0.2779.86 ± 0.5495.64 ± 2.1691.72 ± 0.6274.35 ± 0.4151.76 ± 0.9696.78 ± 0.4293.19 ± 0.0674.38 ± 2.0592.68 ± 0.1783.28 ± 3.0689.99 ± 0.49
C1282.08 ± 4.4990.85 ± 0.4789.34 ± 0.2988.37 ± 0.5781.50 ± 0.5095.09 ± 0.3596.37 ± 0.4254.03 ± 0.6853.69 ± 0.4583.75 ± 1.6088.68 ± 1.1963.24 ± 0.8589.64 ± 1.2381.07 ± 3.5195.75 ± 0.44
C13100.00 ± 0.0067.17 ± 0.6667.51 ± 6.8690.58 ± 0.8993.29 ± 0.2189.55 ± 0.7292.40 ± 0.3584.42 ± 1.7150.65 ± 3.9396.00 ± 0.6158.10 ± 2.6023.40 ± 2.6884.87 ± 0.1880.37 ± 2.1788.31 ± 0.25
C1488.63 ± 4.6192.38 ± 0.0095.59 ± 0.0099.30 ± 0.0792.99 ± 0.2092.03 ± 0.6189.51 ± 1.4395.18 ± 0.1797.65 ± 0.4295.40 ± 0.5992.38 ± 0.0098.78 ± 0.1695.15 ± 0.0092.11 ± 0.1899.29 ± 1.09
C1588.34 ± 0.6294.63 ± 0.0094.11 ± 0.1499.83 ± 0.0598.66 ± 0.1493.33 ± 0.1996.02 ± 0.5397.82 ± 0.2678.67 ± 3.3198.05 ± 0.5296.52 ± 0.0893.28 ± 1.1098.60 ± 0.0085.64 ± 0.4599.63 ± 0.12
OA77.23 ± 2.1693.55 ± 0.1091.69 ± 0.4194.49 ± 0.0386.77 ± 0.1094.36 ± 0.3294.31 ± 0.0677.87 ± 0.1072.02 ± 0.7693.81 ± 0.1090.42 ± 0.3379.46 ± 0.9592.84 ± 0.1284.35 ± 0.6295.42 ± 0.08
AA84.53 ± 3.2593.17 ± 0.0992.15 ± 0.0795.27 ± 0.0388.92 ± 0.0694.54 ± 0.2994.74 ± 0.1182.56 ± 0.1073.94 ± 0.5894.70 ± 0.0390.56 ± 0.3078.36 ± 0.7493.60 ± 0.0986.54 ± 0.1395.59 ± 0.13
K × 10075.34 ± 2.3393.03 ± 0.1191.03 ± 0.4494.05 ± 0.0385.69 ± 0.1093.90 ± 0.3493.85 ± 0.0676.03 ± 0.1169.74 ± 0.8293.31 ± 0.1189.65 ± 0.3677.75 ± 1.0392.26 ± 0.1283.08 ± 0.6895.04 ± 0.09
Table 8. Classification results of the Honghu data based on 1% training samples.
ClassSSRNDBDASSGCAPCIAMDBNetHDDADBPFAChebNetGCNMVAHNDGFNetFTINetDKDMNMRCAGOurs
C160.82 ± 3.5095.24 ± 0.4097.91 ± 0.4098.85 ± 0.1271.95 ± 0.3998.28 ± 0.3596.53 ± 0.5298.07 ± 0.0895.22 ± 1.1296.22 ± 0.0594.47 ± 0.0592.93 ± 0.7293.39 ± 0.1788.86 ± 1.3999.64 ± 0.15
C293.96 ± 2.0180.88 ± 2.2784.51 ± 1.6287.29 ± 1.1690.40 ± 0.3573.60 ± 5.3495.10 ± 1.5478.06 ± 2.3690.21 ± 1.5580.05 ± 0.3992.11 ± 0.4374.01 ± 0.8586.14 ± 1.2077.75 ± 3.5991.11 ± 0.63
C395.54 ± 0.9095.85 ± 0.9898.40 ± 0.8198.02 ± 0.1887.87 ± 0.3197.97 ± 0.7995.06 ± 2.3191.54 ± 0.8292.21 ± 0.4698.61 ± 0.1095.48 ± 1.4192.43 ± 1.3997.76 ± 0.3696.12 ± 0.7396.84 ± 0.20
C440.80 ± 4.2298.55 ± 0.5899.86 ± 0.0598.38 ± 0.1183.39 ± 0.8098.45 ± 1.5399.25 ± 0.5185.24 ± 1.2385.30 ± 3.8697.44 ± 0.1599.80 ± 0.1088.84 ± 0.3497.78 ± 0.2093.86 ± 0.3899.96 ± 0.03
C592.91 ± 1.9399.21 ± 0.1399.78 ± 0.0799.41 ± 0.0487.51 ± 0.3499.31 ± 0.0997.42 ± 1.9393.39 ± 0.3995.24 ± 0.6499.71 ± 0.0099.61 ± 0.0895.79 ± 0.3499.28 ± 0.1393.65 ± 0.3999.83 ± 0.08
C683.91 ± 3.2397.05 ± 1.2793.87 ± 1.4797.90 ± 0.1875.01 ± 0.4796.48 ± 0.4994.11 ± 5.3181.05 ± 0.5295.06 ± 0.7297.73 ± 0.2096.76 ± 0.9384.65 ± 0.5397.86 ± 0.2488.15 ± 1.9095.47 ± 0.21
C799.30 ± 0.4689.84 ± 0.9790.91 ± 2.7188.35 ± 1.1545.58 ± 0.2890.23 ± 1.5392.70 ± 2.4963.99 ± 1.5463.17 ± 1.5392.60 ± 0.3588.33 ± 0.4961.71 ± 1.5087.36 ± 1.3169.02 ± 4.4796.43 ± 0.49
C8100.00 ± 0.0098.42 ± 0.3799.49 ± 0.0999.70 ± 0.0965.29 ± 0.6698.16 ± 0.6399.16 ± 0.7393.27 ± 0.5095.73 ± 0.7999.28 ± 0.0898.61 ± 0.3796.23 ± 0.2599.61 ± 0.0797.50 ± 1.0899.50 ± 0.02
C90.00 ± 0.0096.80 ± 0.3795.89 ± 1.0888.48 ± 0.1651.10 ± 1.1989.93 ± 1.7193.05 ± 2.5866.94 ± 5.4876.26 ± 2.6797.35 ± 0.6188.49 ± 0.9965.09 ± 6.6991.57 ± 1.1781.28 ± 6.1597.25 ± 0.54
C1098.47 ± 0.7495.58 ± 1.1689.02 ± 1.2594.14 ± 0.3863.10 ± 0.5788.64 ± 5.6193.79 ± 1.2169.90 ± 0.7586.43 ± 1.1993.64 ± 0.6088.95 ± 0.8977.72 ± 1.8196.07 ± 0.1874.03 ± 2.4897.17 ± 0.29
C1176.94 ± 2.2596.54 ± 3.4697.57 ± 1.2493.92 ± 0.6179.23 ± 1.0594.72 ± 3.8799.21 ± 0.4275.94 ± 0.3671.28 ± 3.9099.07 ± 0.1697.89 ± 0.7073.36 ± 2.1897.56 ± 0.9781.47 ± 1.8596.80 ± 0.23
C1268.79 ± 4.2099.66 ± 0.1096.69 ± 5.0099.61 ± 0.0381.52 ± 0.7292.99 ± 0.5099.16 ± 1.4072.69 ± 0.6079.37 ± 0.5899.55 ± 0.2397.41 ± 0.3785.27 ± 1.9098.72 ± 0.4884.78 ± 0.8399.86 ± 0.04
C1334.11 ± 6.8893.04 ± 0.2699.41 ± 0.1798.08 ± 0.1276.92 ± 0.7299.13 ± 0.2498.82 ± 0.8896.91 ± 0.8681.88 ± 6.6199.07 ± 0.0995.26 ± 0.7584.20 ± 2.6696.70 ± 0.2892.54 ± 2.2197.54 ± 0.69
C1490.80 ± 1.0498.65 ± 1.2299.96 ± 0.1298.39 ± 1.6878.85 ± 0.6288.55 ± 4.02100.00 ± 0.0082.92 ± 0.7864.85 ± 1.6995.79 ± 0.5188.31 ± 1.0477.50 ± 2.7898.62 ± 0.0980.27 ± 5.06100.00 ± 0.00
C1589.76 ± 29.9289.61 ± 1.7191.15 ± 3.1397.40 ± 0.7050.53 ± 1.2694.36 ± 1.6999.00 ± 0.7172.71 ± 0.9667.11 ± 3.7196.25 ± 0.9499.19 ± 0.6073.17 ± 1.3199.74 ± 0.1841.04 ± 3.6099.17 ± 0.14
C160.00 ± 0.0091.89 ± 1.2997.68 ± 0.6896.37 ± 0.1173.70 ± 1.1889.16 ± 1.2597.26 ± 1.8885.56 ± 0.8676.50 ± 1.4295.56 ± 0.4591.10 ± 0.4678.54 ± 1.6597.32 ± 0.5284.91 ± 2.4297.66 ± 0.46
OA82.12 ± 1.3796.16 ± 0.7496.87 ± 0.5397.09 ± 0.1380.20 ± 0.1095.66 ± 0.8596.20 ± 1.7186.25 ± 0.0988.21 ± 0.7897.56 ± 0.0795.90 ± 0.3387.09 ± 0.1796.91 ± 0.0188.70 ± 0.3297.82 ± 0.05
AA70.38 ± 2.0594.80 ± 0.7495.76 ± 0.2095.89 ± 0.2972.62 ± 0.2293.12 ± 1.0296.85 ± 0.8981.76 ± 0.2882.24 ± 1.2896.12 ± 0.1294.49 ± 0.1381.34 ± 0.5495.96 ± 0.1782.83 ± 0.5497.77 ± 0.07
K × 10079.00 ± 1.6495.49 ± 0.8796.34 ± 0.6296.60 ± 0.1676.54 ± 0.1294.92 ± 1.0095.52 ± 2.0383.77 ± 0.1086.11 ± 0.9297.14 ± 0.0995.19 ± 0.4084.84 ± 0.2296.38 ± 0.0186.75 ± 0.3797.44 ± 0.06
Table 9. Classification results of the IP data based on 5% training samples.
ClassSSRNDBDASSGCAPCIAMDBNetHDDADBPFAChebNetGCNMVAHNDGFNetFTINetDKDMNMRCAGOurs
C10.00 ± 0.00100.00 ± 0.00100.00 ± 0.0097.55 ± 0.8264.44 ± 1.7994.03 ± 1.91100.00 ± 0.00100.00 ± 0.0073.83 ± 4.1296.87 ± 0.52100.00 ± 0.00100.00±0.0097.63 ± 0.030.00 ± 0.00100.00 ± 0.00
C289.93 ± 10.4294.41 ± 3.0397.63 ± 1.2198.62 ± 1.7047.25 ± 0.7494.85 ± 0.5098.16 ± 0.5171.35 ± 0.7776.26 ± 0.9097.61 ± 0.2685.29 ± 1.0865.15 ± 1.3197.77 ± 0.4460.57 ± 1.7597.40 ± 0.54
C384.88 ± 5.8894.66 ± 0.2098.44 ± 0.6697.11 ± 0.3146.46 ± 0.8196.20 ± 0.3192.39 ± 0.5767.13 ± 1.1046.93 ± 4.0196.63 ± 0.1889.36 ± 1.9352.57 ± 1.4696.50 ± 0.4461.54 ± 3.6598.99 ± 0.42
C460.00 ± 48.9898.42 ± 1.3694.93 ± 2.5899.10 ± 0.3356.10 ± 1.9895.06 ± 1.2099.03 ± 2.2963.51 ± 4.0857.63 ± 4.4899.48 ± 0.1485.04 ± 4.2941.21 ± 3.51100.00 ± 0.0059.34 ± 3.4692.98 ± 0.28
C571.86 ± 21.3096.05 ± 1.0393.77 ± 1.8894.40 ± 0.6463.99 ± 0.9795.13 ± 0.6997.62 ± 0.5094.35 ± 0.6174.96 ± 1.8799.74 ± 0.0096.64 ± 0.2079.13 ± 2.3299.02 ± 0.6683.44 ± 0.8897.04 ± 0.55
C680.70 ± 4.3099.18 ± 0.1297.74 ± 0.2096.80 ± 0.1576.59 ± 0.4599.13 ± 0.5496.68 ± 0.6977.77 ± 0.4885.92 ± 1.2998.59 ± 0.0798.14 ± 0.2167.46 ± 0.9999.95 ± 0.0775.49 ± 2.6398.31 ± 0.60
C70.00 ± 0.0072.61 ± 9.2662.86 ± 22.0369.96 ± 35.0250.92 ± 7.44100.00 ± 0.0090.00 ± 30.000.00 ± 0.0090.92 ± 14.4663.15 ± 1.5981.23 ± 13.3680.00 ± 28.2843.58 ± 0.350.00 ± 0.0098.89 ± 2.22
C896.65 ± 4.0193.57 ± 0.6099.36 ± 1.4199.84 ± 0.4178.48 ± 1.5699.04 ± 0.3296.09 ± 0.3389.18 ± 0.3589.13 ± 0.9696.68 ± 1.2797.60 ± 1.3689.09 ± 0.6099.85 ± 0.1188.17 ± 0.82100.00 ± 0.00
C90.00 ± 0.00100.00 ± 0.000.00 ± 0.000.00 ± 0.0024.72 ± 4.3896.32 ± 2.410.00 ± 0.000.00 ± 0.0053.33 ± 6.67100.00 ± 0.0092.31 ± 10.8816.67 ± 23.5786.63 ± 0.730.00 ± 0.0073.85 ± 2.31
C1063.66 ± 4.7294.64 ± 1.3693.50 ± 1.4995.07 ± 0.4444.05 ± 1.0993.06 ± 0.5992.37 ± 4.9785.09 ± 0.6073.67 ± 1.2296.33 ± 0.6094.22 ± 1.7072.67 ± 0.2795.75 ± 0.1053.86 ± 2.1596.79 ± 0.36
C1193.00 ± 2.7196.20 ± 0.2598.50 ± 0.8995.48 ± 0.2460.26 ± 0.4196.20 ± 0.2995.70 ± 0.4768.66 ± 0.6877.30 ± 3.0097.84 ± 0.1390.66 ± 1.5667.85 ± 0.5798.12 ± 0.3071.57 ± 0.6898.97 ± 0.42
C1271.53 ± 12.2496.95 ± 0.1893.14 ± 6.7096.91 ± 0.1540.18 ± 1.3195.00 ± 1.0896.45 ± 0.8647.91 ± 0.4951.25 ± 1.9898.03 ± 0.6584.41 ± 0.8348.40 ± 2.9192.82 ± 0.6854.63 ± 0.4995.85 ± 0.72
C1398.28 ± 2.5799.39 ± 0.1793.98 ± 3.1898.98 ± 0.1666.73 ± 0.6698.35 ± 0.28100.00 ± 0.0093.07 ± 0.4373.91 ± 2.1098.35 ± 0.2899.61 ± 0.2789.17 ± 1.46100.00 ± 0.0097.57 ± 1.23100.00 ± 0.00
C1496.40 ± 3.0597.92 ± 0.2399.75 ± 0.1097.00 ± 0.1477.88 ± 1.2996.53 ± 0.2197.85 ± 0.6786.36 ± 0.6987.83 ± 3.6997.18 ± 0.2497.05 ± 0.4894.41 ± 0.3396.35 ± 0.7087.82 ± 2.0997.78 ± 0.43
C1594.16 ± 7.9496.39 ± 0.5890.55 ± 1.3196.08 ± 0.2670.61 ± 1.0393.91 ± 0.5094.50 ± 1.1782.25 ± 0.7570.41 ± 3.4298.10 ± 0.2694.20 ± 2.0170.71 ± 0.9493.89 ± 0.2383.21 ± 1.3698.70 ± 0.13
C1687.48 ± 9.9497.51 ± 0.0398.74 ± 0.0498.79 ± 0.0059.59 ± 3.1094.22 ± 2.8398.73 ± 0.0496.63 ± 1.1553.61 ± 3.2098.45 ± 0.5297.54 ± 0.98100.00 ± 0.0096.18 ± 0.5191.96 ± 1.3596.03 ± 0.68
OA84.12 ± 3.5296.03 ± 0.6596.86 ± 0.9796.74 ± 0.2260.16 ± 0.1195.87 ± 0.1496.02 ± 0.8775.38 ± 0.1374.00 ± 1.7897.48 ± 0.1291.80 ± 0.5070.68 ± 0.3896.94 ± 0.1170.88 ± 0.8997.92 ± 0.12
AA68.03 ± 4.5495.49 ± 0.2288.31 ± 2.0089.48 ± 2.2658.02 ± 0.4396.06 ± 0.3390.35 ± 2.4770.20 ± 0.3471.06 ± 1.2695.81 ± 0.2592.71 ± 0.3670.91 ± 2.6693.38 ± 0.1060.58 ± 0.5796.35 ± 0.13
K × 10081.82 ± 4.0495.47 ± 0.7496.42 ± 1.1196.27 ± 0.2554.13 ± 0.1495.29 ± 0.1695.45 ± 0.9971.49 ± 0.1670.29 ± 2.1097.12 ± 0.1490.62 ± 0.5866.15 ± 0.4496.51 ± 0.1266.49 ± 1.0597.63 ± 0.13
Table 10. Classification results of the Xiongan data based on 1% training samples.
ClassSSRNDBDASSGCAPCIAMDBNetHDDADBPFAChebNetGCNMVAHNDGFNetFTINetDKDMNMRCAGOurs
C1100.00 ± 0.0099.78 ± 0.1999.96 ± 0.0399.99 ± 0.0099.98 ± 0.0199.97 ± 0.0399.74 ± 0.2098.54 ± 1.0899.63 ± 0.1299.40 ± 0.1999.95 ± 0.0299.83 ± 0.1499.99 ± 0.0099.83 ± 0.0499.99 ± 0.00
C298.23 ± 2.4699.59 ± 0.1099.90 ± 0.0899.86 ± 0.0799.83 ± 0.0999.94 ± 0.0399.32 ± 0.3196.38 ± 1.6198.77 ± 0.4499.75 ± 0.0199.70 ± 0.0999.53 ± 0.0999.95 ± 0.0199.56 ± 0.0799.85 ± 0.12
C30.00 ± 0.0099.81 ± 0.0697.85 ± 0.5499.62 ± 0.0399.73 ± 0.0399.40 ± 0.5998.64 ± 0.3793.36 ± 2.3898.79 ± 0.4299.84 ± 0.0299.34 ± 0.2299.05 ± 0.3699.91 ± 0.0399.49 ± 0.1099.63 ± 0.03
C40.00 ± 0.0090.32 ± 1.6690.51 ± 4.2591.70 ± 0.7394.56 ± 0.2984.12 ± 15.5682.52 ± 6.3669.78 ± 2.1986.06 ± 0.7193.58 ± 1.5296.09 ± 0.2690.54 ± 2.9794.86 ± 0.9691.83 ± 1.7796.91 ± 0.18
C532.23 ± 9.1892.43 ± 5.1288.48 ± 3.6193.13 ± 0.2398.12 ± 0.4994.51 ± 6.0892.22 ± 2.1675.28 ± 7.7491.31 ± 0.7598.30 ± 0.3297.93 ± 0.4993.76 ± 0.4098.15 ± 0.3296.03 ± 0.5798.46 ± 0.22
C60.00 ± 0.0088.32 ± 1.4098.55 ± 0.3090.20 ± 0.8794.88 ± 0.4596.32 ± 0.6997.04 ± 1.4463.51 ± 16.5075.40 ± 4.8093.89 ± 0.9696.48 ± 0.5187.09 ± 5.1296.37 ± 1.1891.04 ± 1.3796.19 ± 1.09
C780.50 ± 6.0692.18 ± 1.2584.66 ± 7.5288.95 ± 2.2595.23 ± 0.8690.00 ± 8.5482.93 ± 1.8869.82 ± 3.1886.47 ± 0.9095.34 ± 0.8095.16 ± 2.0690.43 ± 0.3194.98 ± 0.2992.43 ± 1.1896.56 ± 0.29
C851.68 ± 40.8988.89 ± 1.9893.28 ± 4.1884.64 ± 0.8893.49 ± 0.5693.20 ± 3.3278.54 ± 3.2370.64 ± 4.3783.63 ± 1.3493.60 ± 0.6795.79 ± 0.4690.15 ± 1.3792.33 ± 0.7491.14 ± 0.5494.55 ± 0.21
C90.00 ± 0.0094.33 ± 2.1586.48 ± 3.6295.76 ± 0.4190.91 ± 0.3596.31 ± 2.7799.56 ± 0.1885.51 ± 3.6991.52 ± 0.4895.14 ± 0.2788.31 ± 0.5988.79 ± 1.2593.08 ± 0.7787.02 ± 3.7895.90 ± 0.58
C1063.74 ± 14.9190.53 ± 3.9597.67 ± 1.2489.41 ± 1.6896.34 ± 0.1994.98 ± 2.1993.51 ± 1.4963.64 ± 5.5688.00 ± 0.6096.67 ± 0.4697.93 ± 0.2792.58 ± 1.3195.81 ± 0.7994.37 ± 0.3598.19 ± 0.34
C110.00 ± 0.0097.30 ± 0.9296.21 ± 1.3696.78 ± 0.2096.33 ± 0.7396.99 ± 0.7898.00 ± 1.1083.84 ± 9.0893.78 ± 1.4096.71 ± 0.2698.00 ± 0.7991.32 ± 2.7397.49 ± 0.2594.13 ± 0.5498.10 ± 0.71
C120.00 ± 0.0080.38 ± 1.6458.62 ± 7.8087.68 ± 2.5882.00 ± 2.4280.46 ± 10.3278.03 ± 4.5739.88 ± 15.4579.10 ± 2.4685.88 ± 1.3288.53 ± 1.3371.02 ± 2.0084.82 ± 0.6377.96 ± 1.5693.03 ± 1.00
C1364.70 ± 45.7980.04 ± 5.3773.53 ± 1.0284.17 ± 1.8686.61 ± 1.5876.37 ± 16.9889.34 ± 1.4976.51 ± 1.5579.02 ± 1.0283.06 ± 0.5889.18 ± 0.1278.95 ± 1.6583.35 ± 0.3581.30 ± 1.8788.43 ± 1.09
C1466.42 ± 46.9785.55 ± 2.9666.59 ± 3.7582.75 ± 2.2990.89 ± 0.6390.00 ± 4.7691.32 ± 4.8763.62 ± 1.9372.84 ± 2.6792.93 ± 0.4792.14 ± 0.8986.26 ± 0.3389.46 ± 0.9985.11 ± 1.6194.24 ± 1.09
C1558.84 ± 3.7293.69 ± 0.9584.31 ± 5.3492.99 ± 1.3195.74 ± 0.5594.86 ± 3.0887.22 ± 2.5574.14 ± 3.3088.88 ± 0.4097.67 ± 0.2793.26 ± 1.1393.15 ± 0.0896.01 ± 0.2094.51 ± 0.3797.63 ± 0.54
C160.00 ± 0.0088.50 ± 1.4678.74 ± 7.4495.92 ± 1.4584.86 ± 1.6988.46 ± 20.395.69 ± 0.5874.06 ± 8.9671.91 ± 3.6184.28 ± 1.5288.12 ± 2.4077.68 ± 2.7293.04 ± 0.5985.89 ± 1.2288.42 ± 0.83
C170.00 ± 0.0093.56 ± 1.3884.63 ± 9.4095.75 ± 1.8496.16 ± 0.4598.27 ± 0.3198.47 ± 0.560.00 ± 0.0086.94 ± 4.1998.31 ± 0.1998.03 ± 0.1494.76 ± 3.0796.41 ± 0.3196.41 ± 0.3498.82 ± 0.23
C180.00 ± 0.0076.80 ± 10.7033.16 ± 46.9095.55 ± 2.3885.99 ± 3.5073.69 ± 22.9873.94 ± 9.500.00 ± 0.0071.11 ± 3.1289.63 ± 1.0493.83 ± 0.3474.54 ± 1.3190.70 ± 1.3386.79 ± 2.1292.54 ± 1.17
C19100.00 ± 0.0098.88 ± 0.5899.27 ± 0.4798.53 ± 0.1898.83 ± 0.3299.05 ± 0.6996.02 ± 2.760.00 ± 0.0096.92 ± 1.0498.93 ± 0.2899.86 ± 0.0396.57 ± 2.2498.67 ± 0.0997.88 ± 0.8398.78 ± 0.47
OA62.40 ± 2.4793.38 ± 1.4789.00 ± 2.5992.65 ± 0.3996.09 ± 0.0694.04 ± 4.2289.81 ± 1.1977.14 ± 2.7589.90 ± 0.2996.66 ± 0.1195.89 ± 0.5493.14 ± 0.3996.02 ± 0.1194.39 ± 0.2097.49 ± 0.15
AA37.70 ± 5.4991.10 ± 1.5684.86 ± 3.5092.81 ± 0.2493.71 ± 0.4391.94 ± 4.8791.16 ± 1.0263.08 ± 3.1486.32 ± 0.9194.36 ± 0.1895.14 ± 0.0889.26 ± 1.1994.49 ± 0.0991.72 ± 0.0796.12 ± 0.24
K × 10054.16 ± 2.5692.28 ± 1.7387.04 ± 3.1391.42 ± 0.4795.44 ± 0.0893.07 ± 4.9088.02 ± 1.4372.89 ± 3.3988.20 ± 0.3496.11 ± 0.1395.19 ± 0.6492.00 ± 0.4595.37 ± 0.1293.47 ± 0.2497.07 ± 0.18
Table 11. Training and testing times of different comparative methods and our method on the PU data.
SSRNDBDASSGCAPCIAMDBNetHDDADBPFAChebNetGCNMVAHNDGFNetFTINetDKDMNMRCAGOurs
Train Time (s)23.7942.3731.3926.7751.72211.9450.5512.8613.2548.3992.5069.9484.0623.0050.12
Test Time (s)3.887.204.195.4212.5021.427.932.302.328.1628.289.6712.0918.787.15
Table 12. Training and testing times of different comparative methods and our method on the Houston data.
SSRNDBDASSGCAPCIAMDBNetHDDADBPFAChebNetGCNMVAHNDGFNetFTINetDKDMNMRCAGOurs
Train Time (s)177.3510.3010.0010.1514.8022.7711.424.143.8116.3346.4278.5853.4123.4617.79
Test Time (s)0.640.840.871.101.512.361.030.460.441.518.233.513.175.841.56
Table 13. Training and testing times of different comparative methods and our method on the Honghu data.
SSRNDBDASSGCAPCIAMDBNetHDDADBPFAChebNetGCNMVAHNDGFNetFTINetDKDMNMRCAGOurs
Train Time (s)793.08206.92194.94215.90252.041026.96190.637.9010.2551.13110.74102.42156.4461.60362.80
Test Time (s)14.9420.9817.5124.0866.6086.4821.483.163.2613.7651.8016.9730.9731.9244.05
Table 14. Training and testing times of different comparative methods and our method on the IP data.
SSRNDBDASSGCAPCIAMDBNetHDDADBPFAChebNetGCNMVAHNDGFNetFTINetDKDMNMRCAGOurs
Train Time (s)798.44152.2486.51111.95127.58442.7181.3214.0410.9151.0986.1098.1090.1834.22114.91
Test Time (s)1.643.181.882.275.648.872.401.080.694.716.412.362.464.263.79
Disclaimer/Publisher’s Note: The statements, opinions and data contained in all publications are solely those of the individual author(s) and contributor(s) and not of MDPI and/or the editor(s). MDPI and/or the editor(s) disclaim responsibility for any injury to people or property resulting from any ideas, methods, instructions or products referred to in the content.