Article

Cascaded-Filter-Based Reverberation Suppression Method of Short-Pulse Continuous Wave for Active Sonar

by
Yonglin Cui
1,2,
Shuhan Liao
1,2,*,
Juncheng Gao
1,2,
Haidong Zhu
1,2,
Nengtong Zhao
1,2 and
An Luo
1,2
1
College of Electrical and Information Engineering, Hunan University, Changsha 410082, China
2
State Key Laboratory of High-Efficiency and High-Quality Conversion for Electric Power, Hunan University, Changsha 410082, China
*
Author to whom correspondence should be addressed.
Remote Sens. 2024, 16(16), 2949; https://doi.org/10.3390/rs16162949
Submission received: 20 June 2024 / Revised: 7 August 2024 / Accepted: 9 August 2024 / Published: 12 August 2024

Abstract

:
Reverberation is the main background interference in active sonar and seriously interferes with the extraction of the target echo. Active sonar systems can use short-pulse continuous wave (CW) signals to reduce the reverberation intensity. However, as the pulse width of the CW signals decreases, the reverberation envelope exhibits a high-frequency oscillating phenomenon. Active sonar often uses the cell average constant false alarm ratio (CA-CFAR) method to process the reverberation, which steadily decays with transmission distance. However, the high-frequency oscillation of the reverberation envelope deteriorates the performance of CA-CFAR, which causes a higher false alarm rate. To tackle this problem, the formation mechanism of the high-frequency oscillation characteristics of the reverberation envelope of the short-pulse-width CW signals is modeled and analyzed, and on this basis, an α filter is designed to suppress the high-frequency oscillation of the reverberation envelope before applying CA-CFAR. The simulation and lake trial results indicate that this method can effectively suppress high-frequency oscillations of the reverberation envelope, as well as exhibit robustness and resistance to reverberation interference.

1. Introduction

Reverberation is one of the most important interferences affecting active sonar detection performance, especially in shallow seas [1]. Reverberation is generated by the transmitting signal and is closely related to its characteristics. The intensity of reverberation varies with the strength and pulse width of the transmitting signal and horizontal distance. To minimize blind spots, improve range resolution, and enhance measurement accuracy when detecting close-range underwater targets, short-pulse-width continuous wave (CW) signals are commonly used as the transmitting signal [2,3].
Traditional target detection methods have been studied to improve detection performance in the reverberation background [4,5,6,7]. One such common method is matched filtering (MF), a prevalent technique in active sonar target detection. However, MF uses a fixed detection threshold, leading to a significant increase in the false alarm rate when the power level of the reverberation background experiences even slight fluctuations [4,5]. The cell average constant false alarm ratio (CA-CFAR) estimates the reverberation background power by using the mean value of auxiliary data adjacent to the cell to be normalized, and then the detection threshold adaptively changes based on the estimated reverberation background value [6,7]. When the reverberation decays monotonously and steadily with transmission distance, which is called steadily-decay reverberation in this paper, the CA-CFAR can perform well in suppressing reverberation. However, in most cases, the reverberation background decays nonmonotonically and has fluctuations, which is called the non-steadily-decay reverberation background in this paper, and this means the background value cannot be accurately estimated by CA-CFAR, resulting in a high false alarm rate or low detection rate. The diagrams of steadily-decay and non-steadily-decay reverberation background are shown in Figure 1.
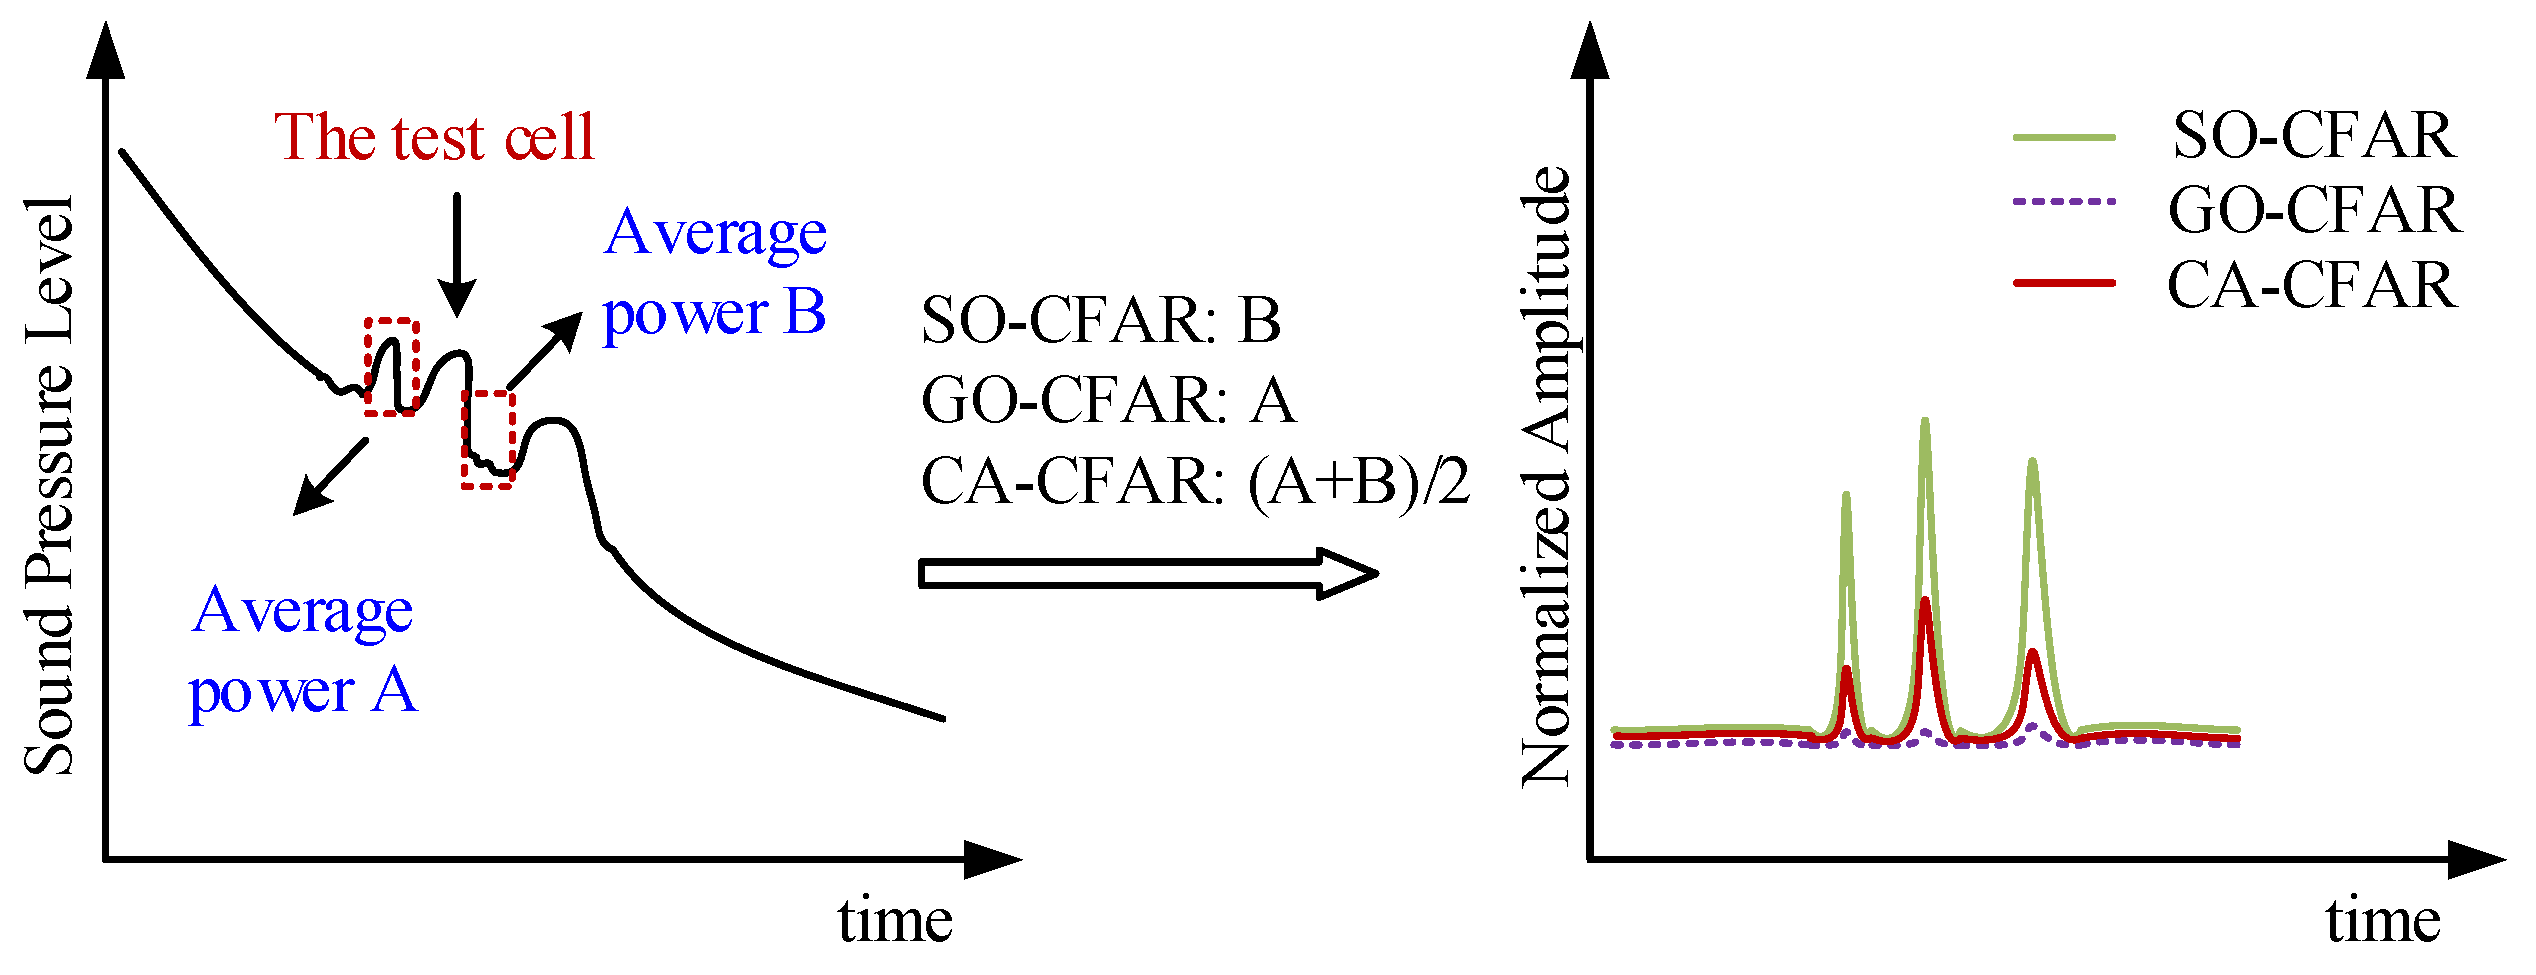
To overcome the impact of non-steadily-decay backgrounds on detection, [8] proposes the smallest of CFAR detection (SO-CFAR), and [9] proposes the greatest of CFAR detection (GO-CFAR), as is shown in Figure 2. These methods compare the average reverberation background power levels on both sides of the test cell and select one of them. The former selects the smallest of them as the reference value of the normalization and effectively improves the target detection performance. By contrast, the latter selects the greatest of them as the reference value of the normalization and effectively decreases the false alarm rate. In addition, some research combines CA-CFAR, SO-CFAR, and GO-CFAR to improve the robustness of target detection in a non-steady reverberation background [10,11,12]. The above methods still cannot simultaneously ensure a high detection rate and low false alarm rate. Therefore, it is indispensable to analyze the formation mechanism of non-steadily-decay reverberation phenomena and correspondingly improve the ability of target detection in a reverberation background.
An important feature of non-steadily-decay reverberation is that there are oscillations in the reverberation envelope, and this oscillation phenomenon has been observed in different sea trials and lake trials [13,14,15,16,17,18,19]. As the pulse width of the CW signal decreases, the oscillation phenomenon of the reverberation envelope becomes more intense [14]. The coherent reverberation theory of ray-normal mode is proposed to explain the oscillation phenomenon of the long-range reverberation envelope, and uses the interference between different normal modes to predict the oscillation structure [15,16,17]. The oscillation period of the short-range reverberation envelope is analyzed by the ray theory non-coherent superposition theory [18] and the finite element method [19], respectively. In this paper, it is found via a trial in Dongjiang Lake = that the reverberation envelope exhibits high-frequency oscillation when the short-pulse CW is transmitted, and this high-frequency oscillation makes it difficult to accurately estimate the reverberation background power via the CA-CFAR method, causing a high false alarm rate. In [15,16,17,18], the oscillation of the reverberation envelope is modeled and analyzed, but the impact of pulse width on the oscillation is not considered. Ref. [19] qualitatively analyzes the effect of pulse width on the reverberation envelope oscillation through simulation, but does not provide an expression of the oscillation period quantitatively. Therefore, it is necessary to establish a model for the reverberation of short-pulse-width CW signals, and to analyze the formation mechanism of the high-frequency-oscillating decay of the reverberation envelope.
In this paper, the primary contribution is the modeling of the mechanism of the high-frequency oscillation phenomenon observed in the reverberation envelope of a short-pulse-width CW signal. By incorporating lake trial data, the underlying causes of these high-frequency oscillations are identified. Furthermore, the frequency of the oscillation can be obtained theoretically from the proposed model, and this provides a theoretical basis for the filter design to reduce the false alarm rate caused by the high-frequency oscillation of the reverberation envelope. The specific contributions can be summarized as follows:
  • The formation mechanism of high-frequency-oscillating decay characteristics of the reverberation envelope of the short-pulse-width CW signals is modeled and analyzed based on the cell scattering model. The oscillation frequency is theoretically deduced;
  • Based on the experimental data from the lake trial, the underlying causes of the high-frequency oscillation of the reverberation envelope of short-pulse-width CW signals are analyzed;
  • A cascaded filter is designed to improve the target detection capability under the non-steadily-decay reverberation background while simultaneously reducing the false alarm rate. Specifically, before applying CA-CFAR to filter out low-frequency oscillations, an α filter is designed based on the high-frequency oscillation components of the reverberation envelope and the pulse width of the transmitted signal, with the purpose of suppressing high-frequency oscillations.
The rest of this paper is organized as follows. In Section 2, the performances of the traditional CA-CFAR methods in non-steadily-decay reverberation scenarios are analyzed. In Section 3, the model of reverberation of short-pulse-width CW signals is established and the high-frequency-oscillating decay characteristics of the reverberation envelope are analyzed. Section 4 proposes the operation principles of the cascaded reverberation-suppression algorithm. The experimental tests are carried out in Section 5 and the discussion is outlined in Section 6. Finally, the conclusion is given in Section 7.

2. Problem Statement

In this section, the principle of the traditional detection method, i.e., CA-CFAR, is briefly introduced. Then, the high-frequency-oscillating phenomenon of the reverberation envelope of short-pulse-width CW is introduced, and on this basis, the inadequacy of CA-CFAR for detecting target echo in scenarios with high-frequency-oscillating reverberation is fully analyzed.

2.1. Traditional Reverberation Background Target Detection Method Using CA-CFAR

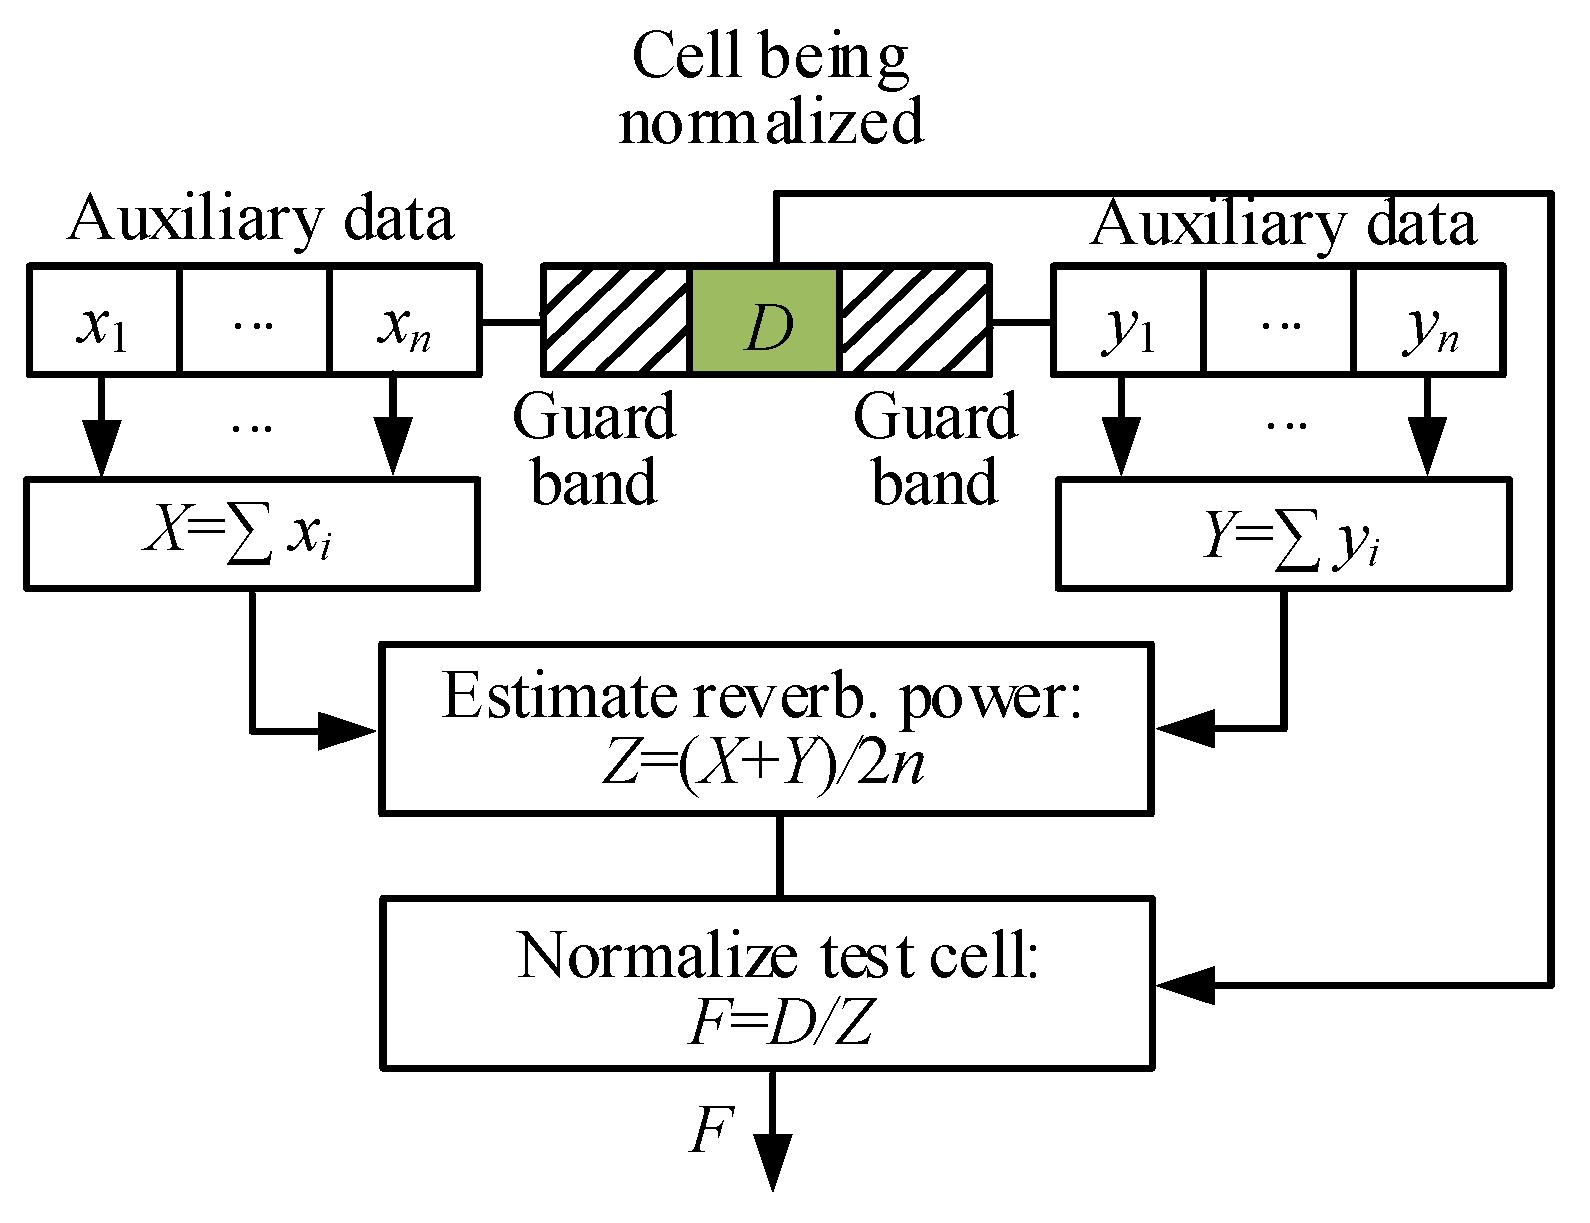
The flow diagram of CA-CFAR is shown in Figure 3. In CA-CFAR, the power of the background signal is regarded as the mean power of neighboring auxiliary data of the test cell, which is used to normalize the data of the test cell [20]. The shaded regions represent the guard bands, which are used to prevent the leakage of target energy and ensure accuracy in estimating the background reverberation power level using auxiliary data. Let D be the test cell, the leading auxiliary data be x1, …, xn and the lagging auxiliary data be y1, …, yn. The lengths of the auxiliary data on both sides of the test cell are both n, respectively. The estimated reverberation power level Z can be obtained by taking the mean of X and Y, as shown below,
Z = 1 2 n i = 1 n x i + i = 1 n y i
Then, the normalized test cell is
F = D / Z

2.2. High-Frequency-Oscillating Phenomenon of Reverberation Envelope of Short-Pulse-Width CW Signals

2.2.1. High-Frequency-Oscillating Phenomenon

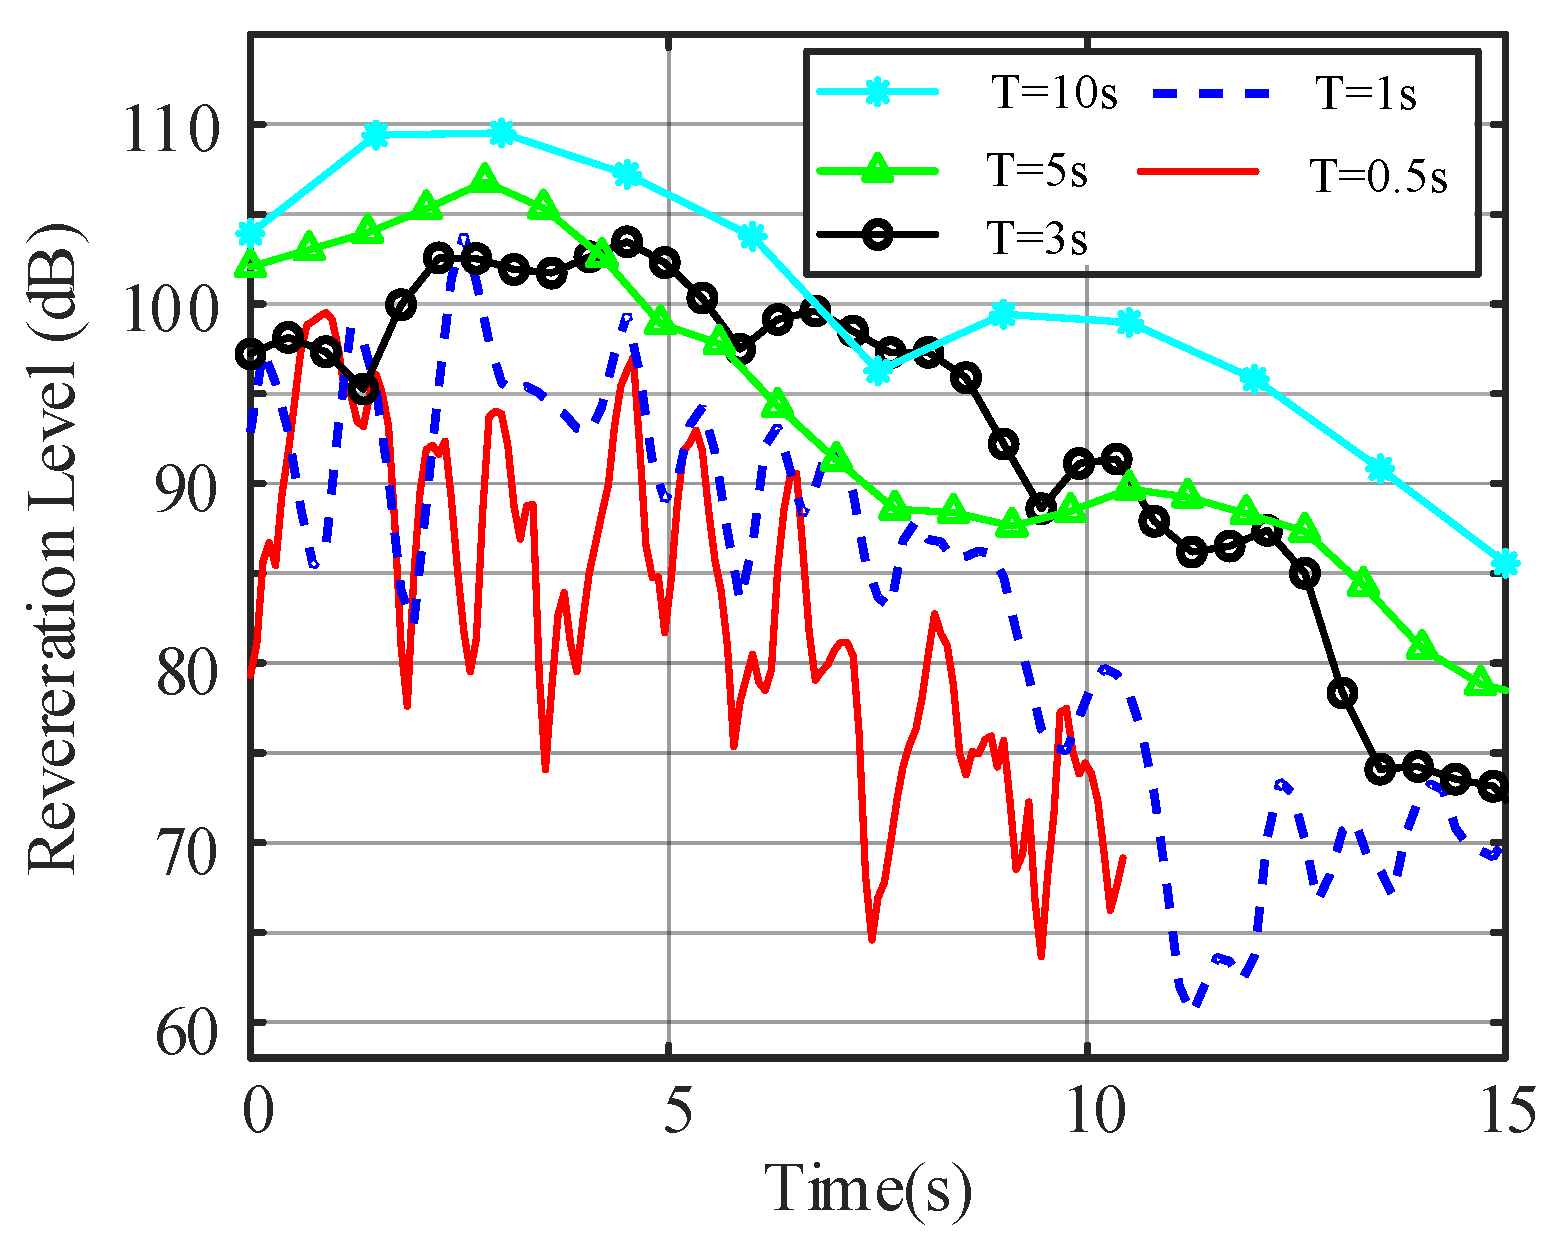
In the Dongjiang Lake trial in July 2023, it was found that the reverberation envelope of the CW signals with a short pulse width experiences high-frequency oscillation. Specifically, the oscillation frequency greater than 1/T (T is the pulse width of the transmitted signal) is taken as the high-frequency component. The reverberation of CW signals with different pulse widths measured at Dongjiang Lake is shown in Figure 4, where the end of the direct wave is the origin point of the x-axis.
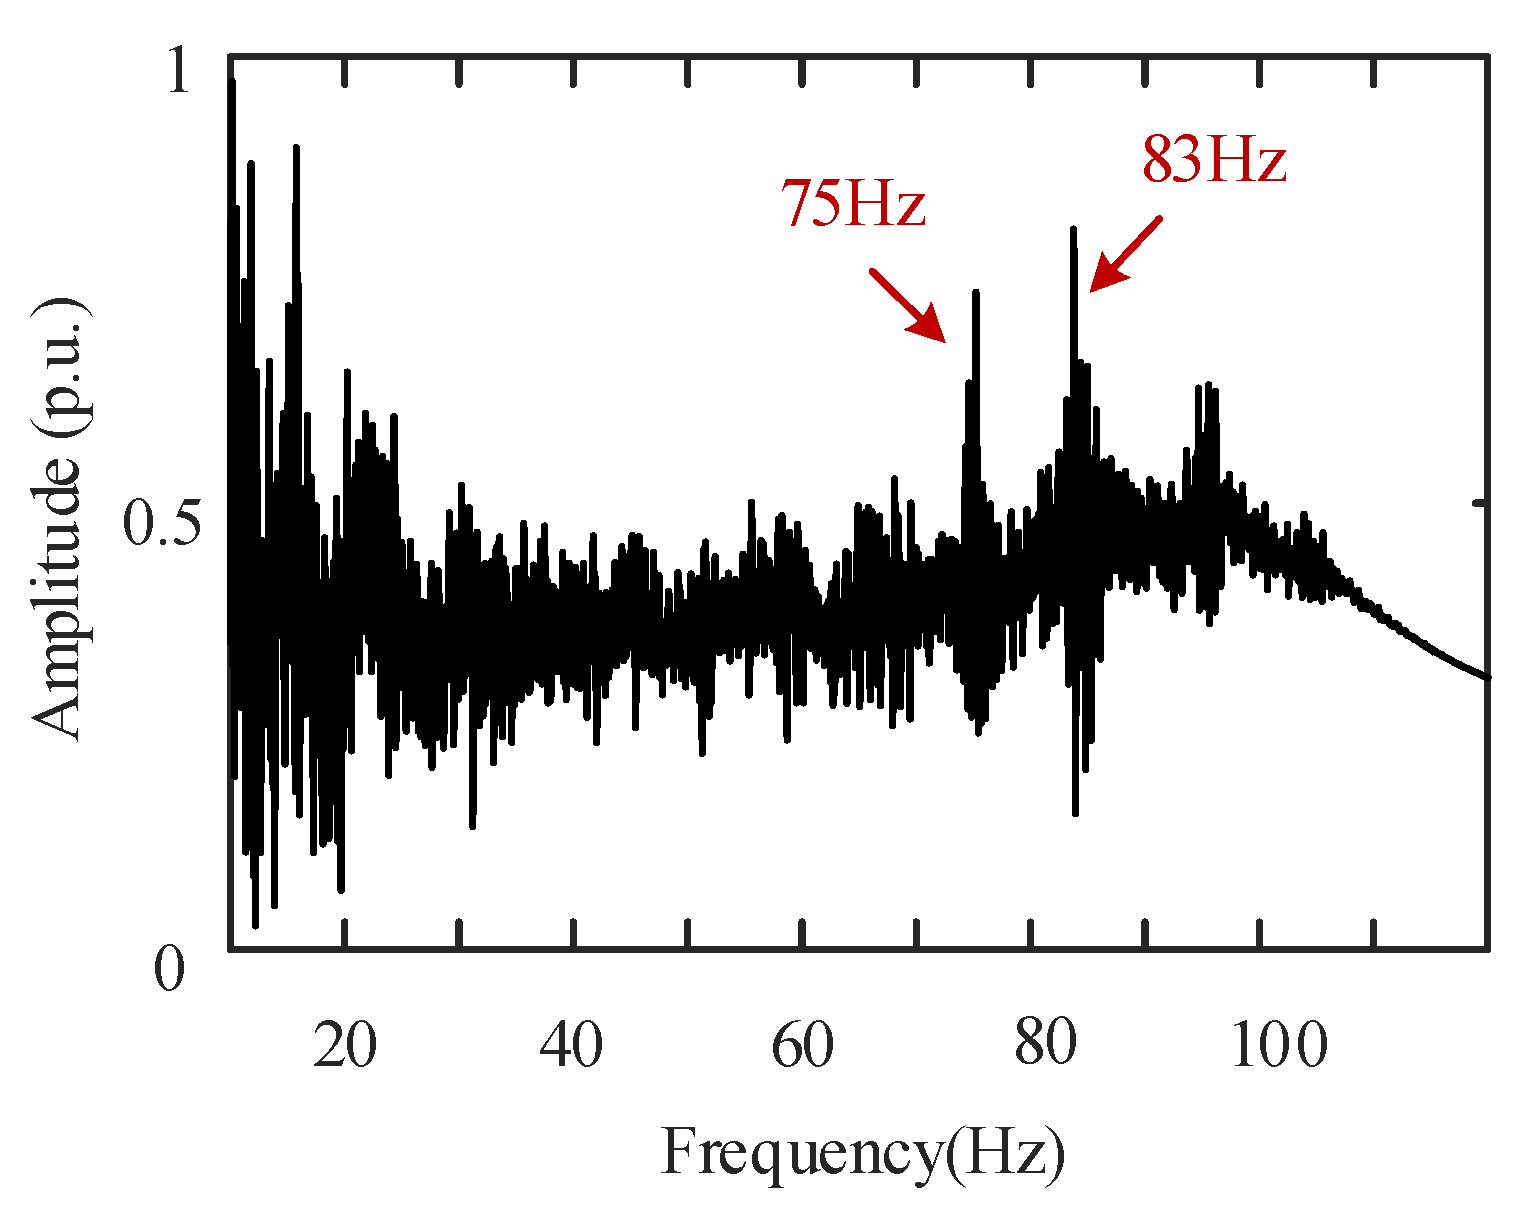
As we can see from Figure 4, the oscillations of the reverberation envelope become more severe as the CW pulse width decreases, and this result is consistent with [14]. Taking the spectrum of the reverberation envelope of the 0.5 s CW as an example in Figure 5, it can be seen that the spectrum is mainly concentrated in the range of [0, 20] Hz, but contains higher frequency components at 75 Hz and 83 Hz, which means that there are high-frequency oscillations in the reverberation envelope of the short-pulse-width CW signal. This high-frequency oscillation makes it difficult to accurately estimate the reverberation background power via CA-CFAR method, and causes a high false alarm rate.

2.2.2. Adequacy Analysis of Traditional CA-CFAR

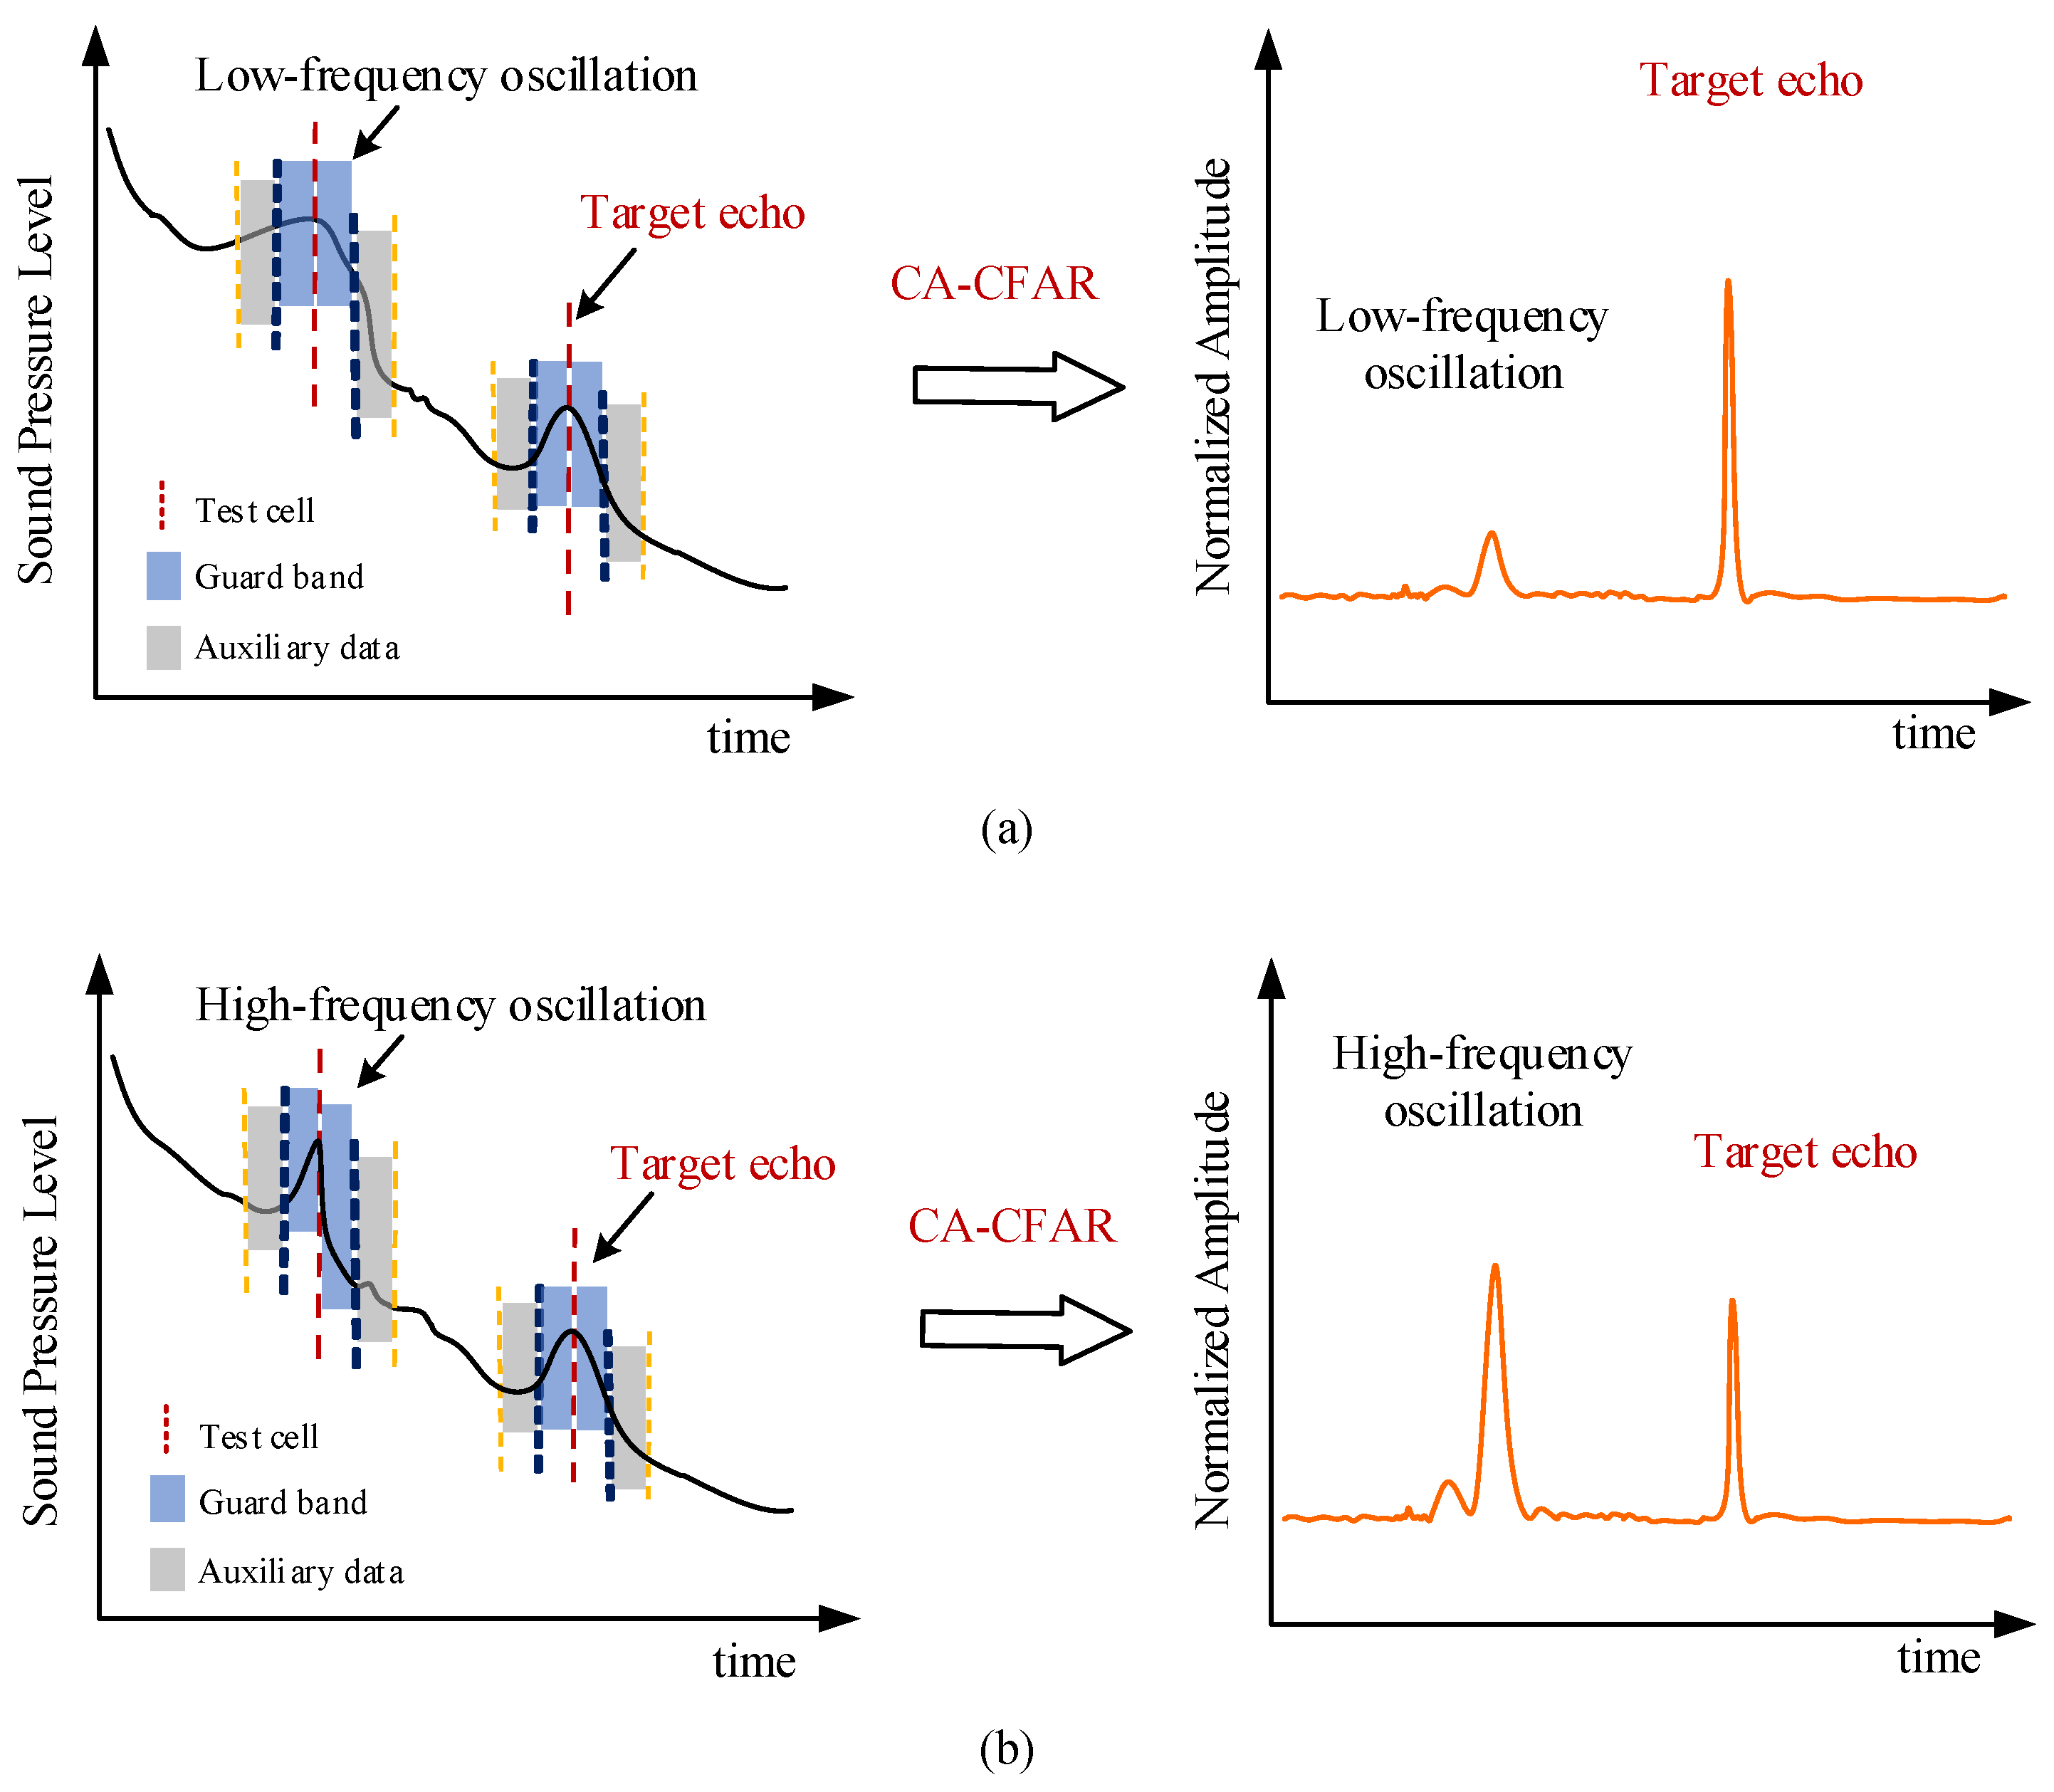
The comparison of the detection performances of CA-CFAR under different reverberation envelope oscillations is shown in Figure 6. As shown in Figure 6a, when the reverberation envelope exhibits low-frequency oscillation (i.e., the oscillation period of the reverberation envelope is greater than the pulse width T of the target echo signal), considering the delay resolution of CW signals, the duration of guard bands on the left and right sides of the test cell for CA-CFAR is 0.6 × T, respectively. The duration of auxiliary data on both sides of the test cell is also set to 0.6 × T. After CA-CFAR processing, it shows good reverberation suppression performance and can effectively detect target echo information. However, when the reverberation envelope exhibits high-frequency oscillation (i.e., the oscillation period of the reverberation envelope is less than the pulse width of the target echo signal), as shown in Figure 6b, its amplitude remains large after CA-CFAR processing, which will result in a higher false alarm rate. Therefore, this paper will focus on mitigating the impact of the high-frequency oscillation of the reverberation envelope on target detection.

3. Modeling of Reverberation Oscillation Characteristics

To suppress the impact of high-frequency oscillations of the reverberation envelope of the short-pulse-width CW signals on target detection, it is necessary to theoretically model the reverberation first, and use the model to analyze the formation mechanism of high-frequency oscillations.
The cell scattering model has been extensively applied in the modeling and analysis of ocean reverberation, and it has been used to study the complex and varied characteristics of ocean reverberation [21,22]. Therefore, this paper selects this model to investigate the mechanism of high-frequency oscillations of the reverberation envelope of short-pulse CW signals. The process of reverberation formation is relatively complex and influenced by various factors. To simplify the modeling process, reverberation modeling based on the cell scattering model employs some assumptions:
(1)
The scattering cells are uniformly distributed within the directional angle range of the receiving array;
(2)
The scattering bodies are distributed on the seabed according to the Gaussian distribution, so the time delay of the scatter echo signals follows a Gaussian distribution;
(3)
The time delay difference of different scattered echo signals is equal, i.e., τ1 = τ2 = … = τN = τ;
(4)
The volume of the scatterer bodies is assumed to be small and the pulse broadening phenomenon during scattering is neglected.
According to the cell scattering model, each cell contains a large number of scattering bodies, and each scattering body generates a backscattered wave in response to the incident sound signal. This paper only considers the case of the monostatic sonar system. Figure 7 depicts a schematic diagram of the cell scattering model, illustrating a scattering cell.
According to the previous assumptions, N represents the number of scattering bodies that contribute at time t, while ri(t) represents the i-th backscattered signal, and tdi is the underwater acoustic transmission time from the transmitter to the ith scatter body, which is also the transmission time from the ith scatter body to the receiver. Here, τi = tdi − tdi−1. In this way, we have
t d i = t d 1 + j = 2 i τ j
The transmitted signal s(t) can be expressed as
s ( t ) = sin ( 2 π f 0 t ) u t
in which u(t) is a rectangular function,
u ( t ) = r e c t ( t / T ) = 1 , | t / T | 1 0 , | t / T | > 1
In (5), T is the pulse width of a CW signal.
Without considering Doppler frequency shift, the reverberation produced by the ith scattering body ri(t) can be depicted as follows:
r i ( t ) = B ( t ) A i sin ( 2 π f 0 t + φ i ) u t 2 t d i
where f0 is the frequency of the transmitted CW signal, φi represents the phase angle of the received reverberation signal, φi (i ∈ [1, N]) follows a uniform distribution, Ai represents the amplitude of the backscattered wave, and B(t) is the decay coefficient of the ocean reverberation signal.
Substitute (3) into (6):
r i ( t ) = B ( t ) A i sin ( 2 π f 0 t + φ i ) u ( t 2 t d 1 2 j = 2 i τ j )
According to the cell scattering model, the received reverberation signal r(t) is
r ( t ) = i = 1 N r i ( t )
If a short-pulse CW signal is transmitted, and τ1 = τ2 = … = τN = τ (0 < τ < T), the received reverberation signal rshort(t) can be described as follows:
r s h o r t ( t ) = i = 1 N B ( t ) A i sin ( 2 π f 0 t + φ i ) u ( t 2 t d 1 2 i τ )
According to (9), the envelope of the reverberation signal rshort(t) can be expressed as
r e n v ( t ) = B ( t ) i = 1 N 1 j = i + 1 N 2 A i A j u ( t 2 t d 1 2 i τ ) u ( t 2 t d 1 2 j τ ) c o s ( φ i φ j ) + i = 1 N A i u ( t 2 t d 1 2 i τ ) 2
As can be seen from (10), the differences of φi do not affect the amplitude frequency characteristic of the renv(t), which is the same as the amplitude frequency characteristic of renv_eq(t),
r e n v _ e q ( t ) = i = 1 N B ( t ) A i u ( t 2 t d 1 2 i τ )
In shallow water, sea-bottom reverberation is the primary background interference, and the main factors influencing seabed scattering strength are seabed sediment and grazing angle. The results of [23,24] indicate that there are differences in scattering strength among different seabed sediments. In practical underwater environments, the properties of sea-bottom sediment remain relatively stable within a certain distance range. Additionally, for the same sediment, the differences in scattering strength are relatively small at grazing angles between 20 and 70 degrees. Thus, the amplitude of each backscattered wave can be regarded as the same, that is, A1 = A2 = … = AN = A. (11) can be transformed as:
r e n v _ e q ( t ) = i = 1 N B ( t ) A u ( t 2 t d 1 2 i τ )
As can be seen in (12), renv_eq(t) is the modulation of B(t) on the window function u(t − 2td1 − 2), where B(t) is the modulating signal, and u(t − 2td1 − 2) serves as the carrier signal. Here, B(t) is proportional to 1/(tq), while q is the backscatter coefficient and generally between 3 and 5, which refers to [25]. The spectrum of B(t) is mainly composed of a DC component. Therefore, the frequency of the reverberation envelope renv_eq is mainly determined by the carrier frequency, that is, it is determined by u(t − 2td1 − 2). Thus, (12) can be simplified as
r e n v _ s i m p ( t ) = A i = 1 N u ( t 2 t d 1 2 i τ )
The spectrum of the renv_simp(t) is represented by R(),
R ( j ω ) = A F r e c t ( j ω ) i = 1 N e j ( 2 t d 1 + 2 i ω τ )
where Frect() is the spectrum function of the rectangular function, and ω is the angular frequency.
According to the time-shift characteristics of Fourier transform, td1 only affects the phase and does not change the amplitude, so the amplitude frequency characteristics of R() are the same as Req()
R e q ( j ω ) = A F r e c t ( j ω ) e j 2 ω τ e j 2 ω τ ( N + 1 ) 1 e j 2 ω τ
By using the Euler formula to expand (15), we can obtain
R e q ( j ω ) = A F r e c t ( j ω ) e j ω τ N + 1 sin ω τ N sin ω τ
From (16), it can be seen that when ω = mπ (m = 1, 2, …),
lim ω 2 m π τ sin ω τ N sin ω τ = N
Thus, when ω = (mπ)/τ, then f = m/(2τ), ejωτ(N+1) = 1, and the amplitude of its spectral function is N times that of AFrect() at the position. As can be seen from Section 2.2, an oscillation frequency greater than 1/T (T is the pulse width of the transmitted signal) is taken as the high-frequency component. According to [18], the value of 2τ for the short-range (≤400 m) reverberation in shallow water is 0.04 s. As the propagation distance increases, the time delay difference will be much less than 0.04 s due to the far-field condition. In lake trials, the pulse width of the transmitting signal is greater than 0.04 s, so m/(2τ) > 1/T, and we can conclude that the high-frequency component of the reverberation envelope is f = m/(2τ).
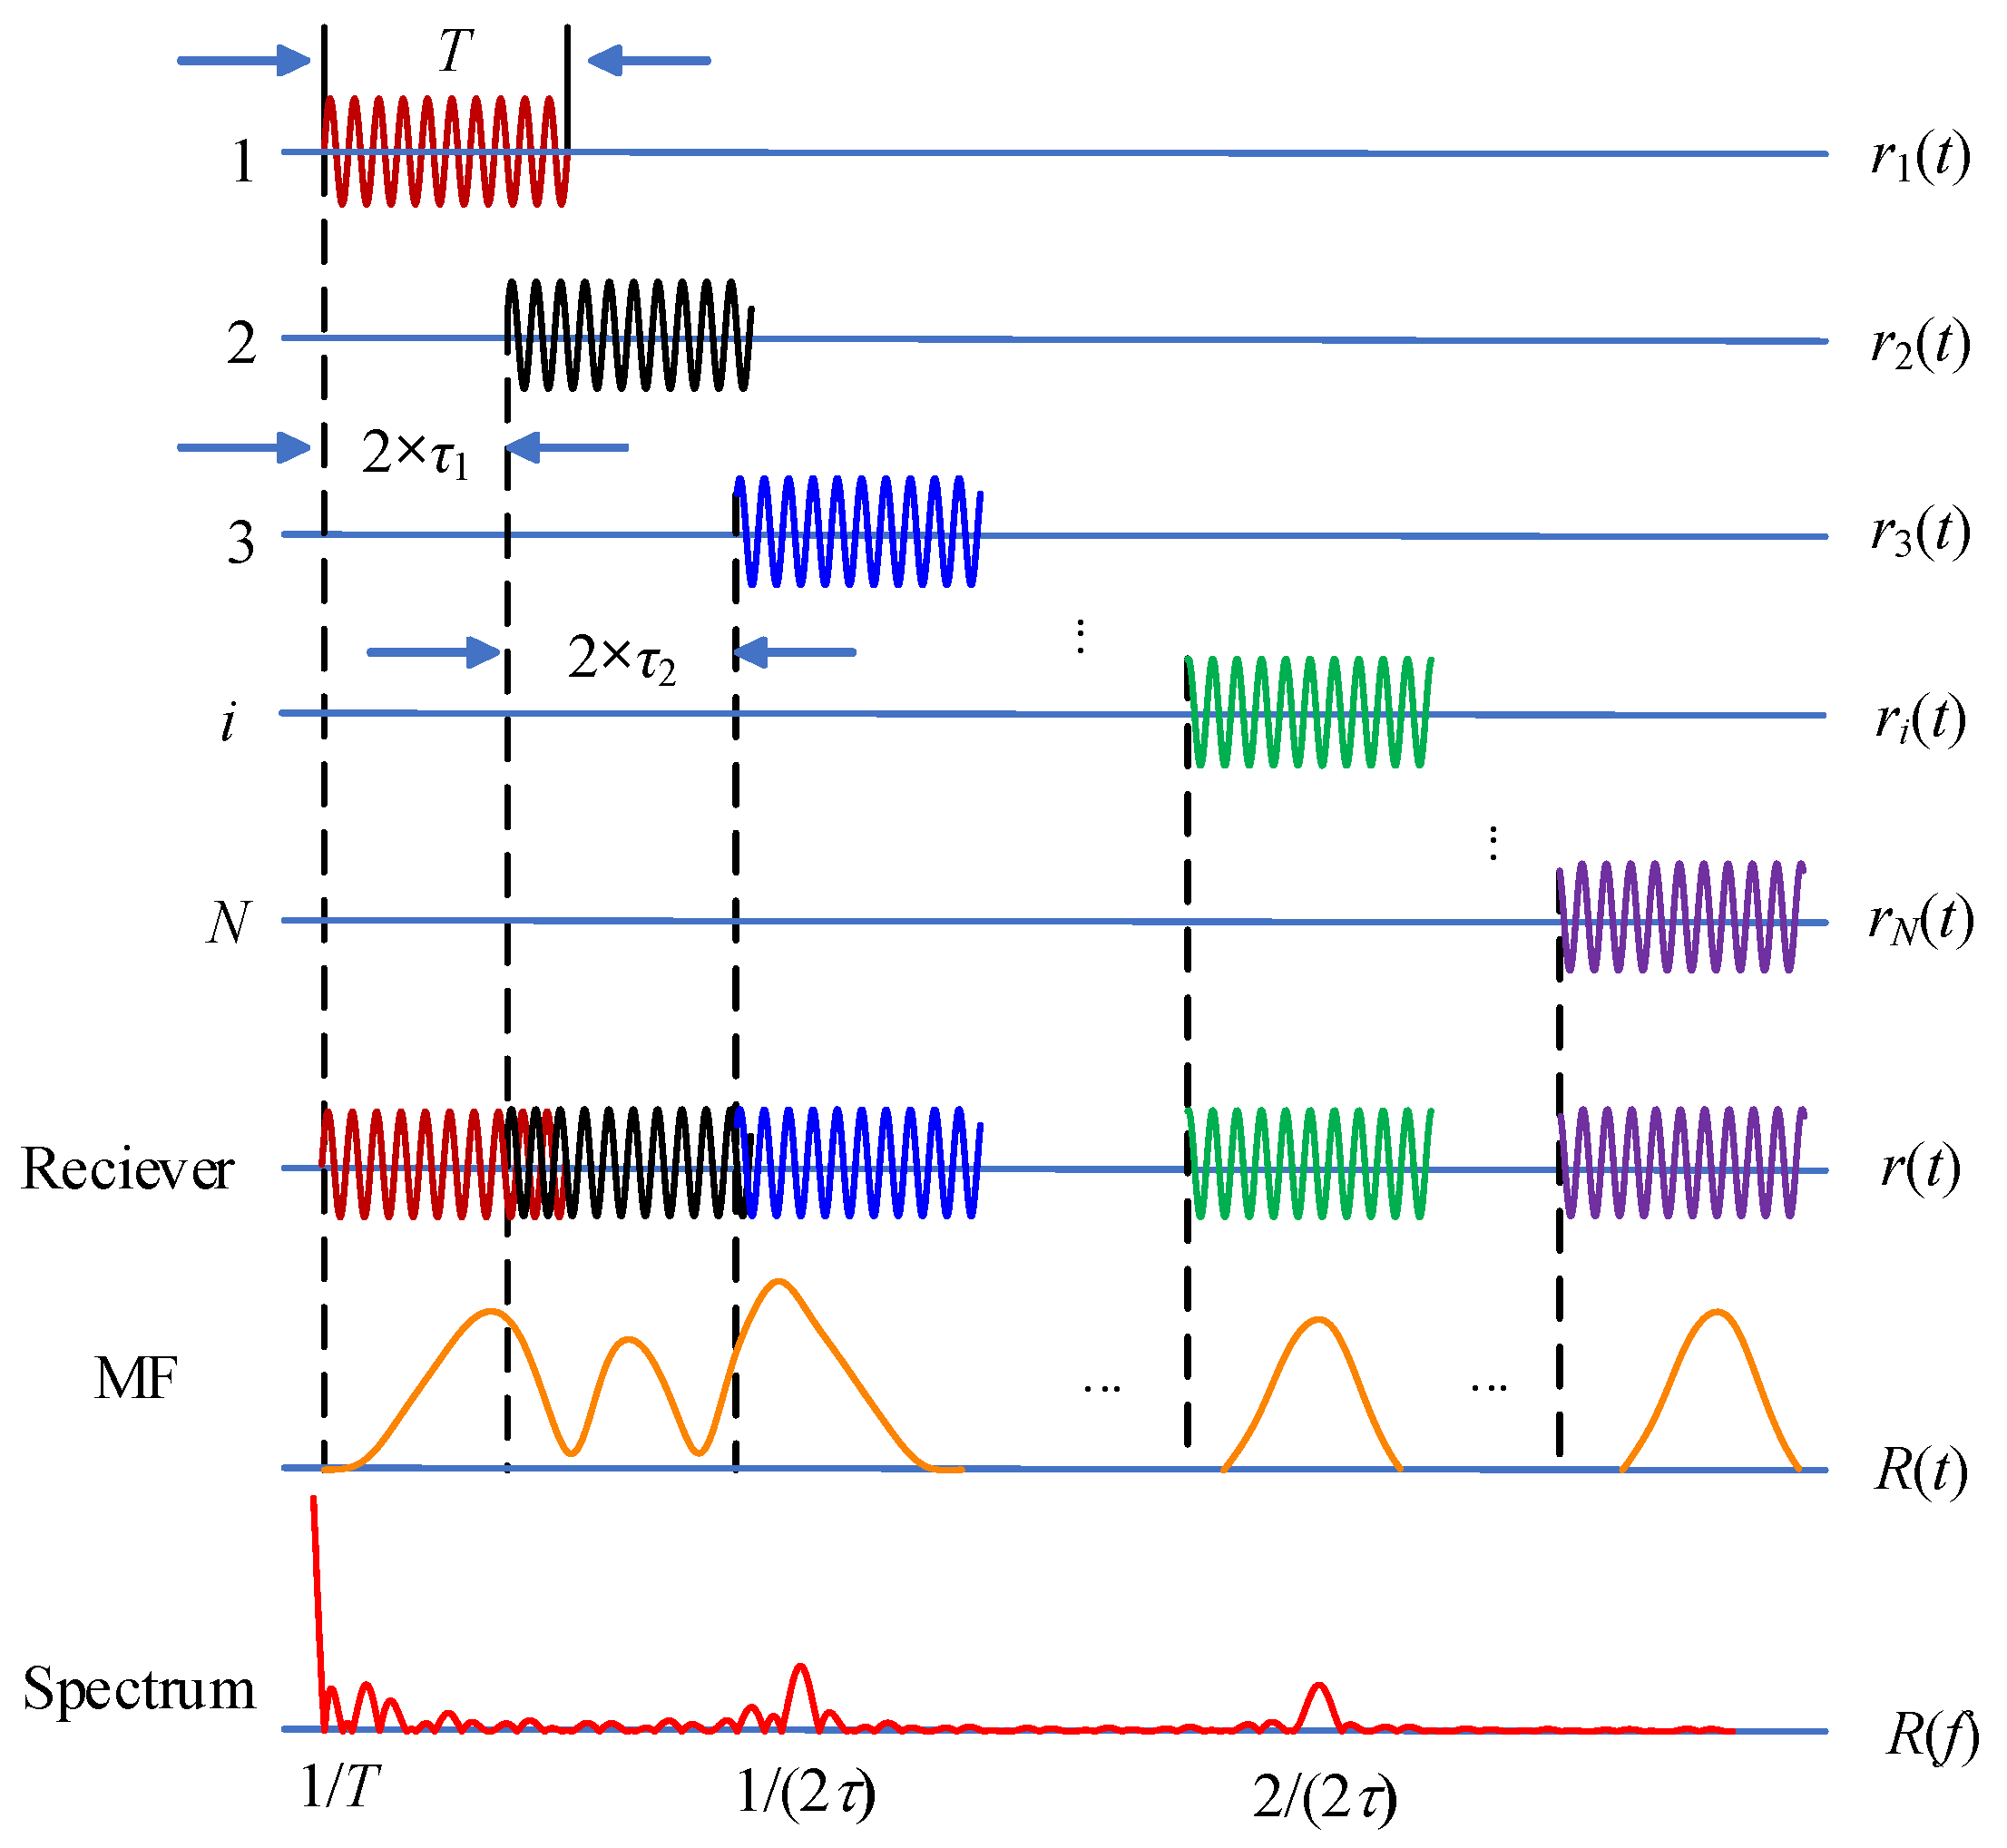
If a short-pulse CW signal is transmitted, the signal received at the receiver will be the superposition of the backscattered waves from these scattering bodies, as shown in Figure 8. It is evident that the output of the match filter exhibits clear oscillation characteristics.

4. Operation Principles of Cascaded Reverberation Suppression Algorithm

In this paper, an α filter is designed to smooth the high-frequency oscillations of the reverberation envelope before applying the traditional CA-CFAR processing. In this section, the working principle of the proposed method is introduced in two parts: the design of α filter, and the logic of the cascaded reverberation suppression algorithm.

4.1. The Design of α Filter

The α filter, also known as first-order recursive low-pass filtering, is used to smooth signals and suppress high-frequency noise. The differential equation of α filter is as follows:
X ^ ( k + 1 ) = α X ( k + 1 ) + ( 1 α ) X ^ ( k )
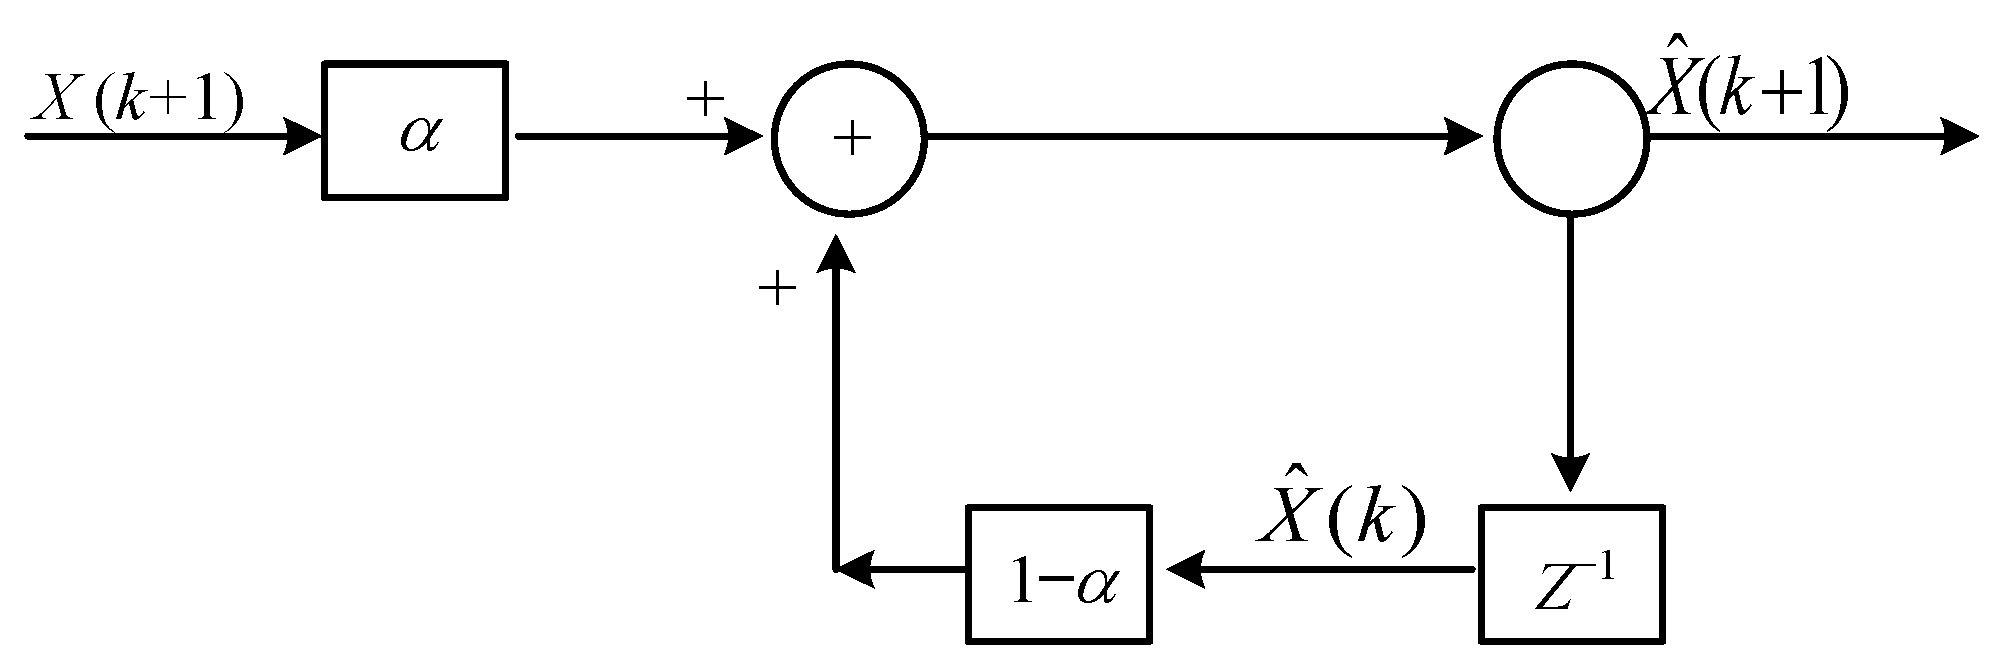
where k represents the kth sampling instant, α is the integral time constant,  X ^  is the estimated value, and X is the measured value. Figure 9 shows the flowchart of the α filter.
According to (18) and Figure 9, it can be seen that, the value of α is crucial to the performance of the α filter, so we need to analyze and design the value of α. Let α = β/(1 + β) and β be the time constant, then (18) can be transformed as
X ^ ( k + 1 ) = 1 1 + β X ^ ( k ) + β 1 + β X ( k + 1 )
Transform (19) into the z-domain as
( 1 + β ) z X ^ ( z ) X ^ ( z ) = β z X ( z )
Let β = Ts/Tα, then α = Ts/(Tα + Ts); Ts is the sampling period, and Tα is the time constant. Now (20) can be represented as
X ^ z = 1 T α z 1 z T s + 1 X ( z )
To further study the value selection of α, (21) is transformed into the s-domain, where, defining z = 1/(1 − s × Ts), we can obtain [26]
X ^ s = 1 T α s + 1 X s
where X(s) is the input of the α filter and  X ^ ( s )  is the output of the α filter.
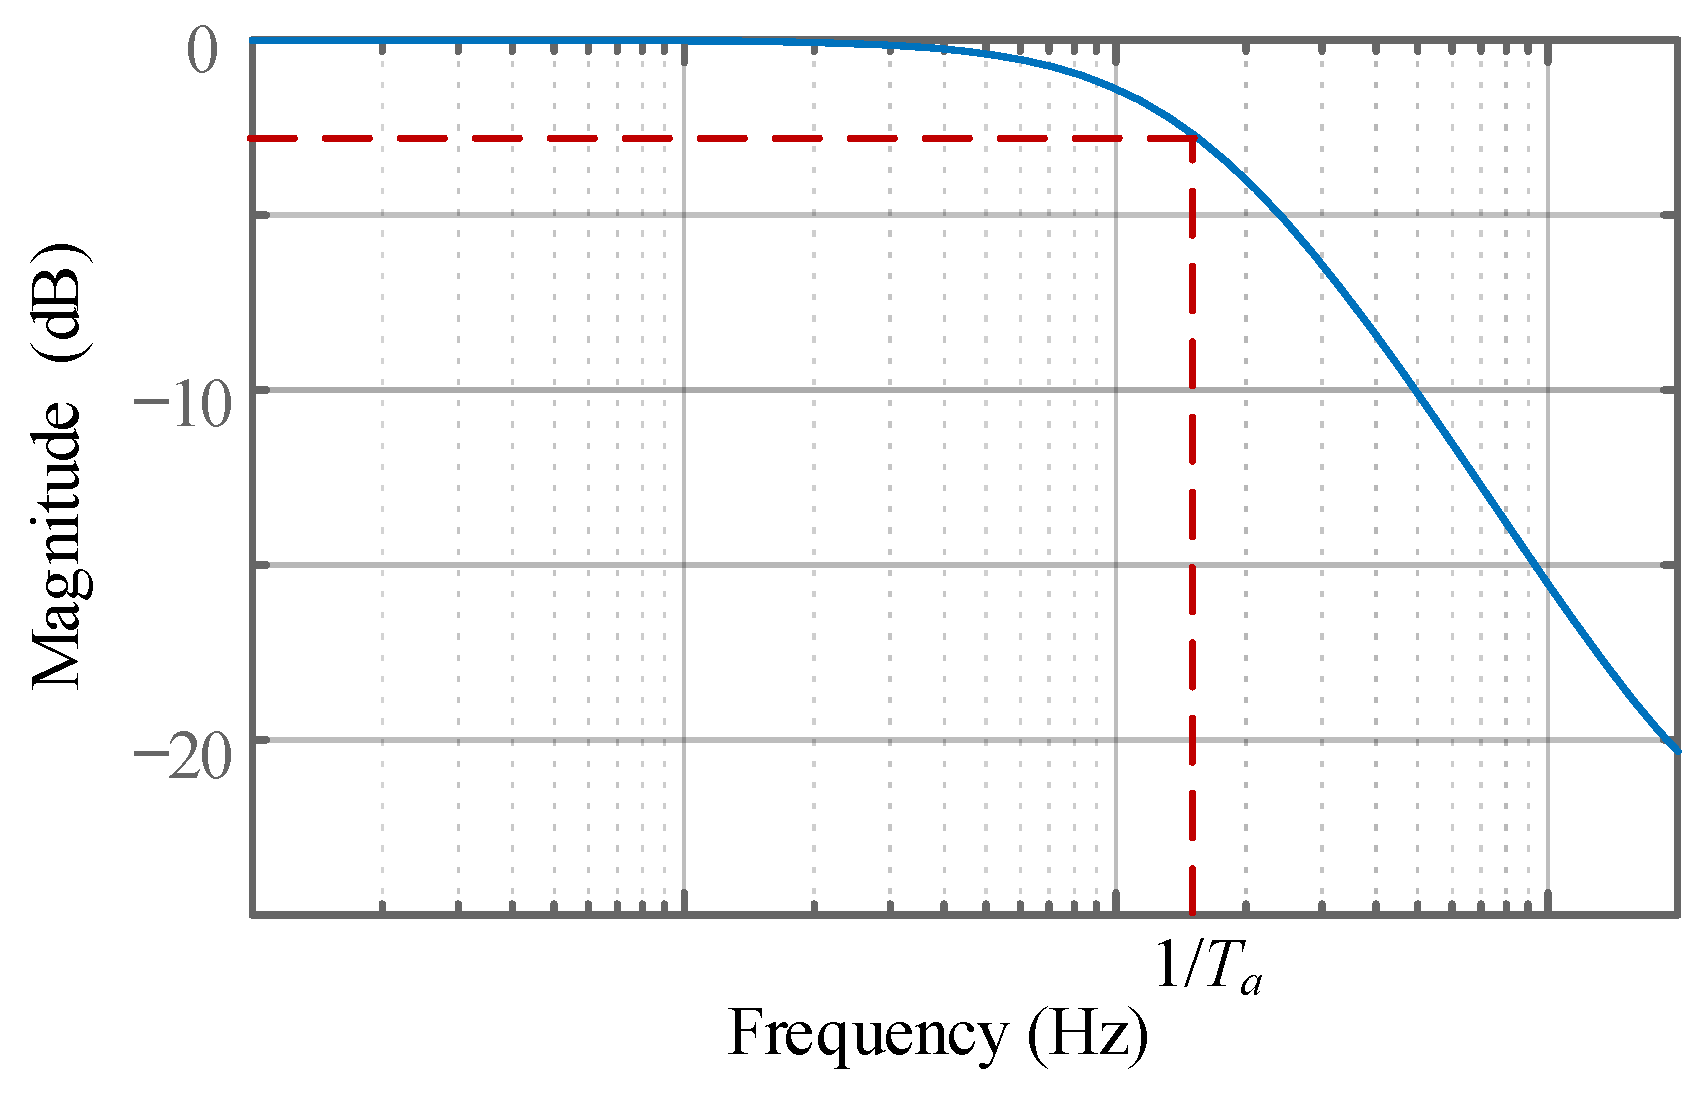
The amplitude-frequency characteristic of (22) is shown in Figure 10. As can be seen in Figure 10, the cutoff frequency of the filter is 1/Tα, which means that signals with frequencies lower than 1/Tα will be filtered out. According to the analysis of Section 2.2 and Section 3, it is imperative to filter out high-frequency oscillations exceeding a frequency of 1/T. Therefore, setting Tα = T can help us meet the filtering requirements.
In conclusion, when α = Ts/(T + Ts), signals with frequencies greater than 1/T will be filtered out. As can be seen in Section 3, the high-frequency component of reverberation envelope oscillation is around m/(2τ). According to [18], the value of 2τ for the short-range (≤400 m) reverberation in shallow water is 0.04 s. As the propagation distance increases, the time delay difference will be much less than 0.04 s due to the far-field condition, resulting in a high-frequency component of reverberation envelope oscillation greater than 25 Hz. In lake trials, the pulse width of the transmitting signal is greater than or equal to 0.05 s, and the frequency components of the target echo signal are mainly concentrated below 20 Hz. Therefore, selecting 1/T as the cutoff frequency can help us meet the requirements.

4.2. The Data Processing Logic Based on the Cascaded Filter

Figure 11 shows the data processing logic based on the cascaded reverberation suppression algorithm α-CA-CFAR. Firstly, an α filter is designed based on the high-frequency oscillation components of the reverberation envelope and pulse width of the transmitting CW signal to filter out the high-frequency oscillations of the reverberation envelope. Subsequently, CA-CFAR is applied to process the filtered result of the α filter and remove low-frequency oscillations of the reverberation envelope. As a result, reverberation is suppressed with the target echo retained. The specific operations are as follows:
  • The data received from the active sonar are processed through beamforming and the MF;
  • The α filter is designed based on the pulse width of the transmitting CW signal, and the result of the MF is passed through the α filter;
  • The auxiliary data length and guard band length of CA-CFAR are designed based on the pulse width of the transmitting CW signal, and the output of the α filter is used as the input of CA-CFAR;
  • The bearing-time record is displayed.

5. Performance Analysis

5.1. Simulation Experiment Test

Firstly, the performance of the proposed α-CA-CFAR method in terms of high-frequency oscillation suppression is compared and analyzed with the traditional CA-CFAR, SO-CFAR, and GO-CFAR methods using simulation data. Then, to further validate the effectiveness of the proposed method, a Monte Carlo numerical simulation study is conducted.

5.1.1. Simulation Comparison

The reverberation is simulated based on the cell scattering model. The maximum number of scatterers that contribute at any given moment is represented as N, which is set as 18, referring to [25]. The range of delay difference τ of different scattered echo signals is 0~0.02 s [18]. Taking CW of 0.2 s as an example, the simulated reverberation signal and its spectrum are shown in Figure 12. As depicted in Figure 12b, the spectrum of the reverberation envelope has an explicit component at 25.9 Hz, 56 Hz, and 78 Hz.
According to the analysis in Section 3, the relationship between these high-frequency oscillations and the delay difference τ of different scattered echo signals is given by m/(2τ) (m = 1, 2, …). Given that the τ in our simulation is set to less than 0.02 s, there should be high-frequency oscillation components near 25 Hz, 50 Hz, and 75 Hz. According to Figure 12b, the simulation results are consistent with the theoretically derived results, demonstrating the validity of theoretical derivation and simulation.
The simulated reverberation signal is processed by CA-CFAR, SO-CFAR, GO-CFAR, and the proposed α-CA-CFAR. Considering the delay resolution of CW signals, the duration of guard bands on the left and right sides of the test cell is 0.6 × T, respectively. The duration of auxiliary data on both sides of the test cell is also 0.6 × T. The processing results are shown in Figure 13, in which the processed signal of each method is normalized based on its maximum value. To intuitively compare the performances of various methods, the time-domain extreme values caused by the reverberation envelop of low-frequency oscillations, high-frequency oscillations and target echo in processed signals, which are processed by CA-CFAR, SO-CFAR, GO-CFAR and α-CA-CFAR, are summarized in Table 1. Furthermore, to quantitatively evaluate the performances of different methods in suppressing reverberation interference, the ratio between the extreme value caused by the target echo and that caused by reverberations is also introduced as a metric in Table 1.
According to Table 1, firstly, after CA-CFAR processing, although low-frequency oscillations can be effectively suppressed, the small difference between the amplitude of the target and that of high-frequency oscillations will make it difficult to distinguish between them. Secondly, after SO-CFAR processing, the amplitude of the target is not the highest, which means that there are severe interference signals. Besides this, the amplitude difference between low-frequency oscillations, high-frequency oscillations, and the target echo is relatively small. This result verifies that the SO-CFAR can increase the detection probability but has a high false alarm rate. Then, through GO-CFAR processing, the amplitudes of both high-frequency and low-frequency oscillations are smaller than that of the target echo, which proves that GO-CFAR can reduce the false alarm rate. However, selecting the greatest average reverberation background power levels on both sides of the test cell as the background power of the test cell can easily lead to missing weak target echoes. It is noticeable that the SO-CFAR and GO-CFAR have unique advantages in increasing target detection or decreasing the false alarm rate caused by low-frequency oscillations of reverberation envelope, but they all achieve a poor performance in suppressing high-frequency oscillations.
By contrast, the results in Table 1 demonstrate that when confronted with high-frequency oscillations, the proposed α-CA-CFAR method successfully achieves a remarkable reduction in oscillation amplitude, with a maximum decrease of approximately 44% compared to traditional methods. Furthermore, analysis reveals that the ratios between the extreme value of the target echo and the extreme values of high-frequency and low-frequency oscillations obtained using our proposed method significantly surpass those of traditional CA-CFAR, SO-CFAR, and GO-CFAR methods. Specifically, in terms of high-frequency oscillation suppression, while the GO-CFAR method achieves the highest ratio of 1.11 among traditional methods, the ratio obtained using our proposed method exceeds this by approximately 64%. This not only validates the superiority of our method in highlighting target echoes, but also demonstrates its effectiveness in significantly mitigating high-frequency oscillation interference, showcasing its reliability in complex environments.

5.1.2. Monte-Carlo Simulations

Target Detection Performance under Strong Non-Steadily-Decay Reverberation Background Interference

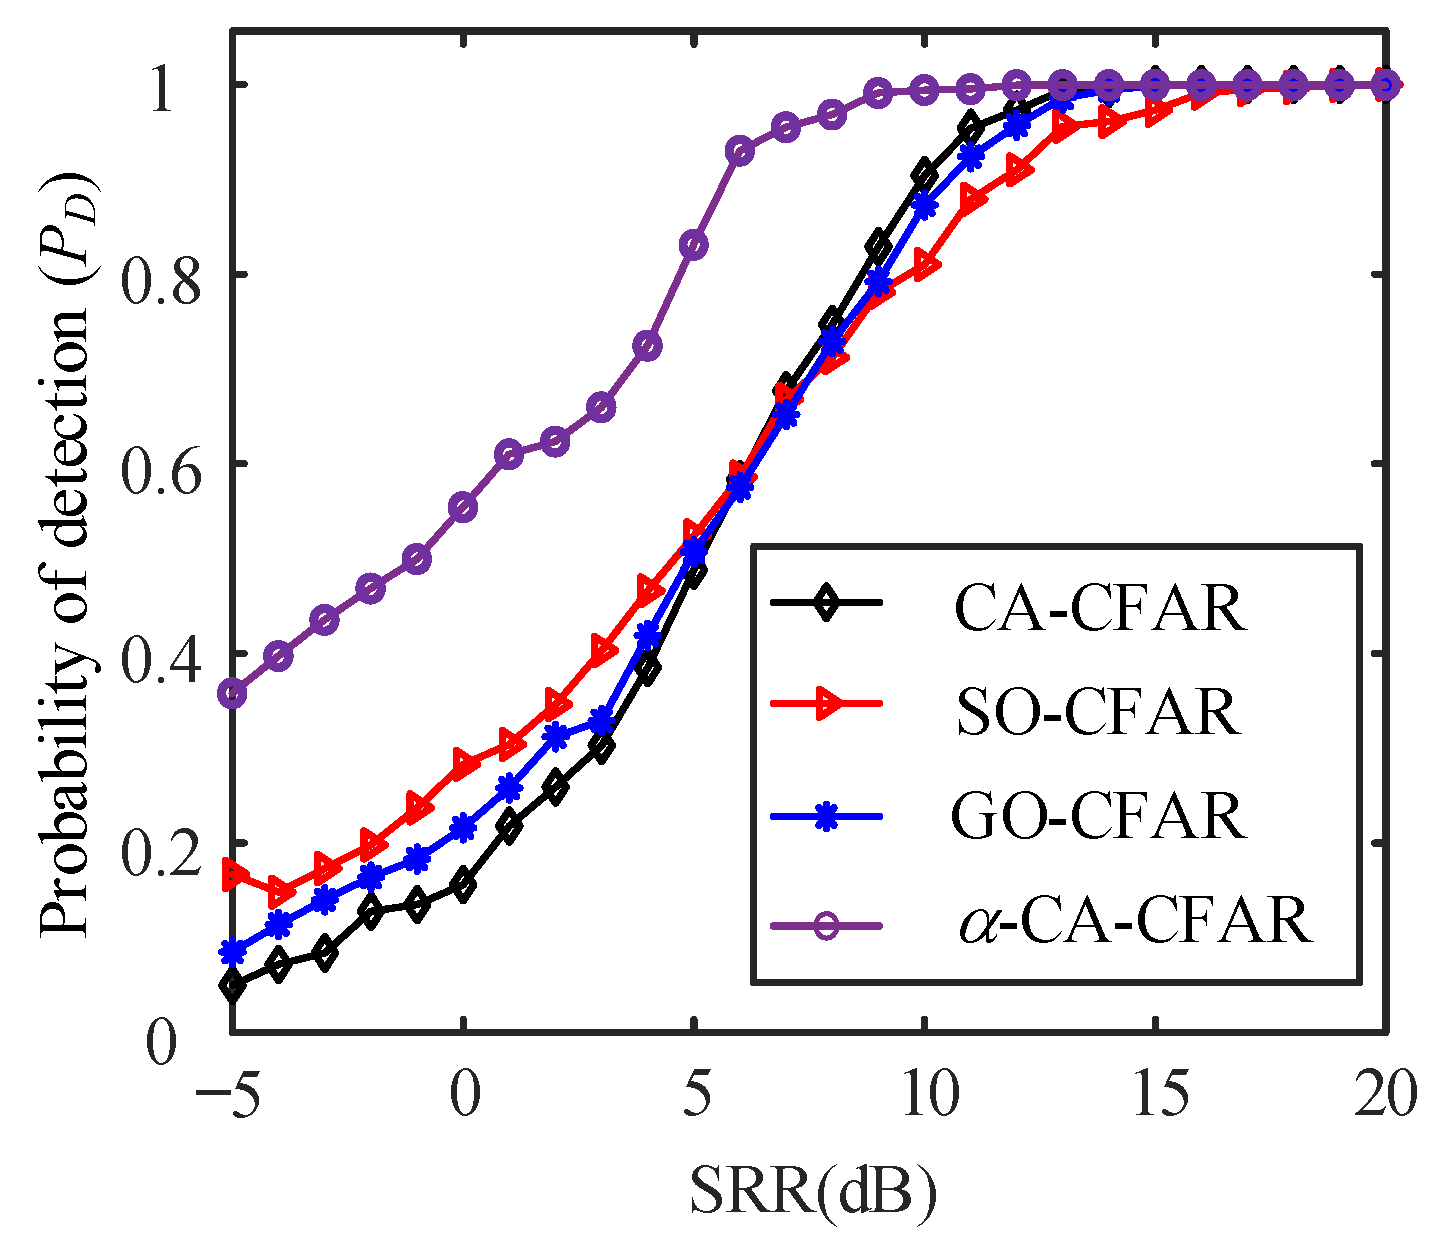
To compare the target detection performance of the proposed α-CA-CFAR with those of the traditional CA-CFAR, SO-CFAR, and GO-CFAR methods under strong non-steadily-decay reverberation background interference, encompassing both high-frequency oscillations and low-frequency oscillations, the Monte Carlo test for each signal-to-reverberation ratio (SRR) is randomly and independently simulated with 1000 iterations, as is shown in Figure 14. Here, the false alarm probability is fixed as 10−3, and the detection threshold is generated based on the length of auxiliary data and the set false alarm probability [27]. In addition, PD represents the probability of detection.
As can be seen from Figure 14, when the signal-to-reverberation ratio (SRR) exceeds 15 dB, all methods exhibit excellent performance. To better evaluate the detection effects of these methods under different conditions, we selected representative SRR levels of −5 dB, 0 dB, 5 dB, 10 dB, and 15 dB, and we have summarized the detection probabilities obtained by these methods in Table 2. As can be seen from Table 2, when the SRR is less than 10 dB, the detection probabilities of traditional methods experience a significant decline. When the SRR is 5 dB, the detection probability of traditional methods generally drops below 55%, but the proposed method remains robust, achieving an 85% detection probability. Furthermore, when the SRR decreases to 0 dB, the advantages of the proposed method become more prominent, with its detection probability more than twice that of traditional methods. It is worth noting that even when the SRR drops to −5 dB, the proposed method can still maintain its leading position, with an improvement in detection probability of more than 20% compared to traditional methods. This is mainly attributed to the limitations of traditional CA-CFAR, SO-CFAR, and GO-CFAR methods in high-frequency-oscillating reverberation envelope environments. They are unable to effectively estimate the reverberation background power, which in turn affects the accuracy of target detection. However, the proposed α-CA-CFAR method has overcome this problem effectively. By effectively suppressing high-frequency oscillations, it has significantly enhanced the probability of target detection, demonstrating higher reliability in complex environments.

False Alarm Suppression Performance against High-Frequency Oscillations of the Reverberation Envelope

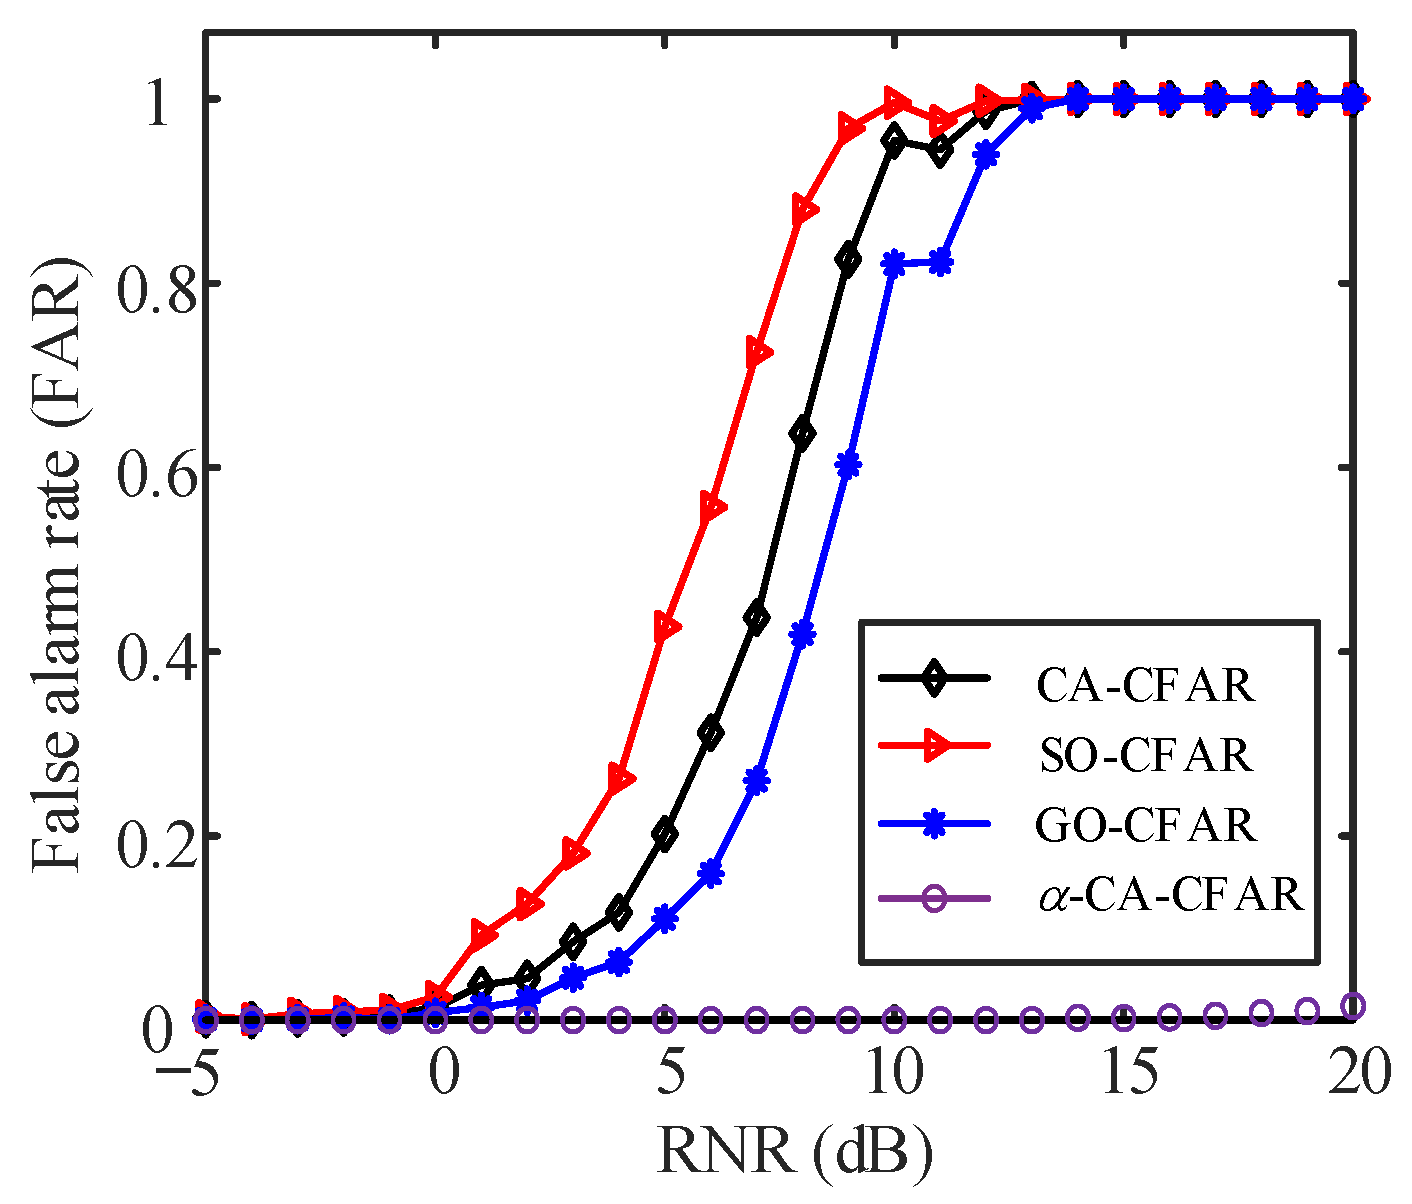
To compare the false alarm suppression performance of the proposed α-CA-CFAR with the traditional CA-CFAR, SO-CFAR, and GO-CFAR methods under high-frequency oscillation interference, Gaussian white noise with different powers is superimposed on the high-frequency oscillations of the reverberation envelope with a fixed power, according to different reverberation-to-noise ratios (RNR). Then, the Monte Carlo test for each RNR is randomly and independently simulated with 1000 iterations, as is shown in Figure 15. The false alarm probability is fixed as 10−3, and the detection threshold is set according to the same rules as in target detection performance. Additionally, FAR represents the false alarm rate.
Representative RNR levels of −5 dB, 0 dB, 5 dB, 10 dB, and 15 dB are selected from Figure 15, and the false alarm rates obtained by the proposed α-CA-CFAR and the traditional CA-CFAR, SO-CFAR, and GO-CFAR methods are summarized in Table 3. It can be observed from Table 3 that when the RNR is greater than 0 dB, the false alarm rate of traditional methods increases significantly, and when it reaches 15 dB, the false alarm rate reaches 1. Moreover, it can be seen that when the RNR is between 0 and 10 dB, SO-CFAR exhibits a significantly high false alarm rate, while GO-CFAR can reduce the false alarm rate to a certain extent. The false alarm rate of CA-CFAR falls between those of SO-CFAR and GO-CFAR. However, the false alarm rate of the proposed method remains close to 0. This is mainly because, with the increase in RNR, the amplitude of high-frequency oscillation is much greater than that of the noise on both sides, which makes it difficult for the traditional methods to estimate the background power based on the data on both sides of the high-frequency oscillation, resulting in a higher false alarm rate. However, the proposed method can effectively suppress the high-frequency oscillation, so the background power estimated based on the data on both sides of the high-frequency oscillation can accurately reflect the current background power at the high-frequency oscillation, and therefore the proposed method has a lower false alarm rate.

5.2. Actual Lake Trials Data Test

The situation of the lake trial is described first. Then, to highlight the advantages of our method, this section compares the proposed α-CA-CFAR method with traditional methods such as CA-CFAR SO-CFAR, and GO-CFAR.

5.2.1. Experimental Conditions

To further verify the feasibility of the proposed method, a 3 km lake trial was carried out in Dongjiang Lake in July 2023. The trial system mainly consisted of an electroacoustic transducer, a transponder, and a hydrophone array, as shown in Figure 16. The system parameters are shown in Table 4.
The transducer is utilized to transmit the detection signal. To simulate the target echo, the transponder is employed (which is a widely accepted method used in sea trials [28]), located approximately 3 km away from the transmitting ship. It is triggered by the received signal and sends a corresponding signal as a response, so as to simulate the reflection effect of the target on the detection signal in the process of underwater active detection. In addition, the transponder ship is fixed by an anchor at the stern. Due to the influence of wind and water flow, the transponder ship will swing around the anchor center. Simultaneously, the hydrophone array receives acoustic signals in real-time, as is shown in Figure 16. In addition to receiving the target echo signals from the transponder’s response, the hydrophone array also picks up reverberation signals reflected by scatterers in the water, the water bottom, and the water surface.

5.2.2. Analysis Results

To verify the applicability of the proposed method, the CW signals with different pulse widths are transmitted, including 0.05 s, 0.1 s, 0.2 s, and 0.5 s. The echo data are processed by the CA-CFAR, SO-CFAR, GO-CFAR, and the proposed α-CA-CFAR. Considering the delay resolution of CW signals, the duration of guard bands on the left and right sides of the test cell is 0.6 × T, respectively. The duration of auxiliary data on both sides of the test cell is also 0.6 × T. The false alarm probability is set to 10−3. The detection threshold is set according to the same rules as in Section 5.1. Any connected component with a power level above this threshold is declared as a target and labeled with a rectangular window.

Trial Results with T = 0.05 s

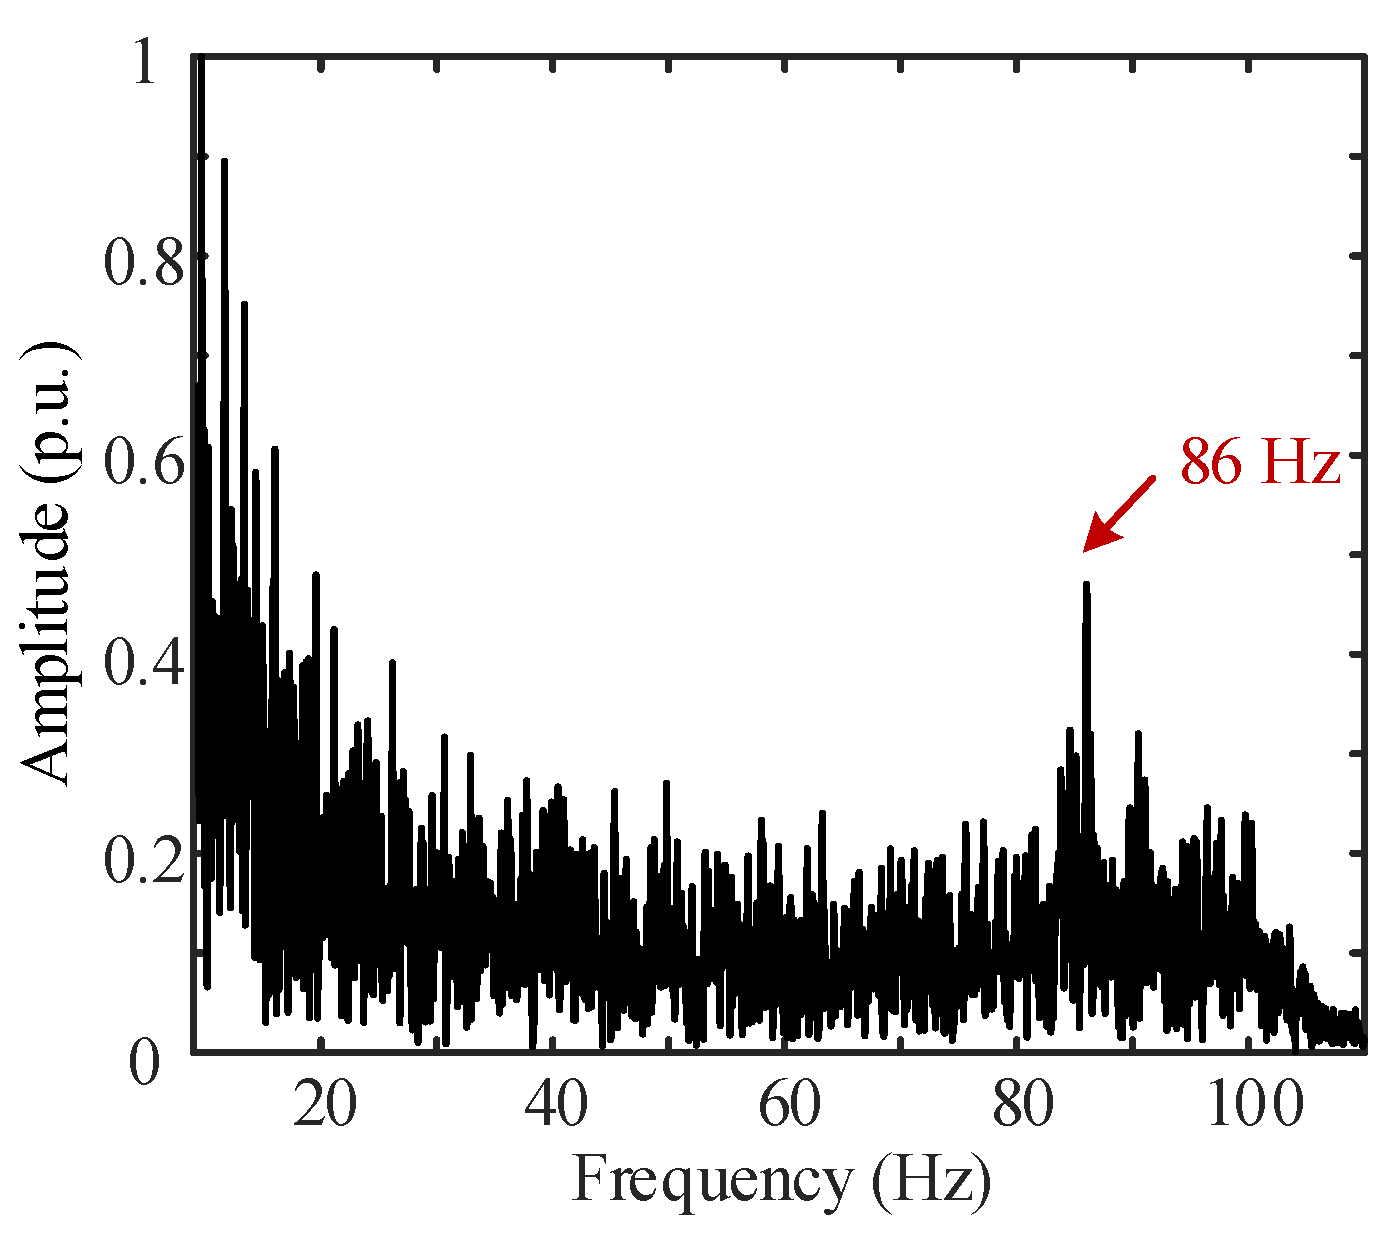
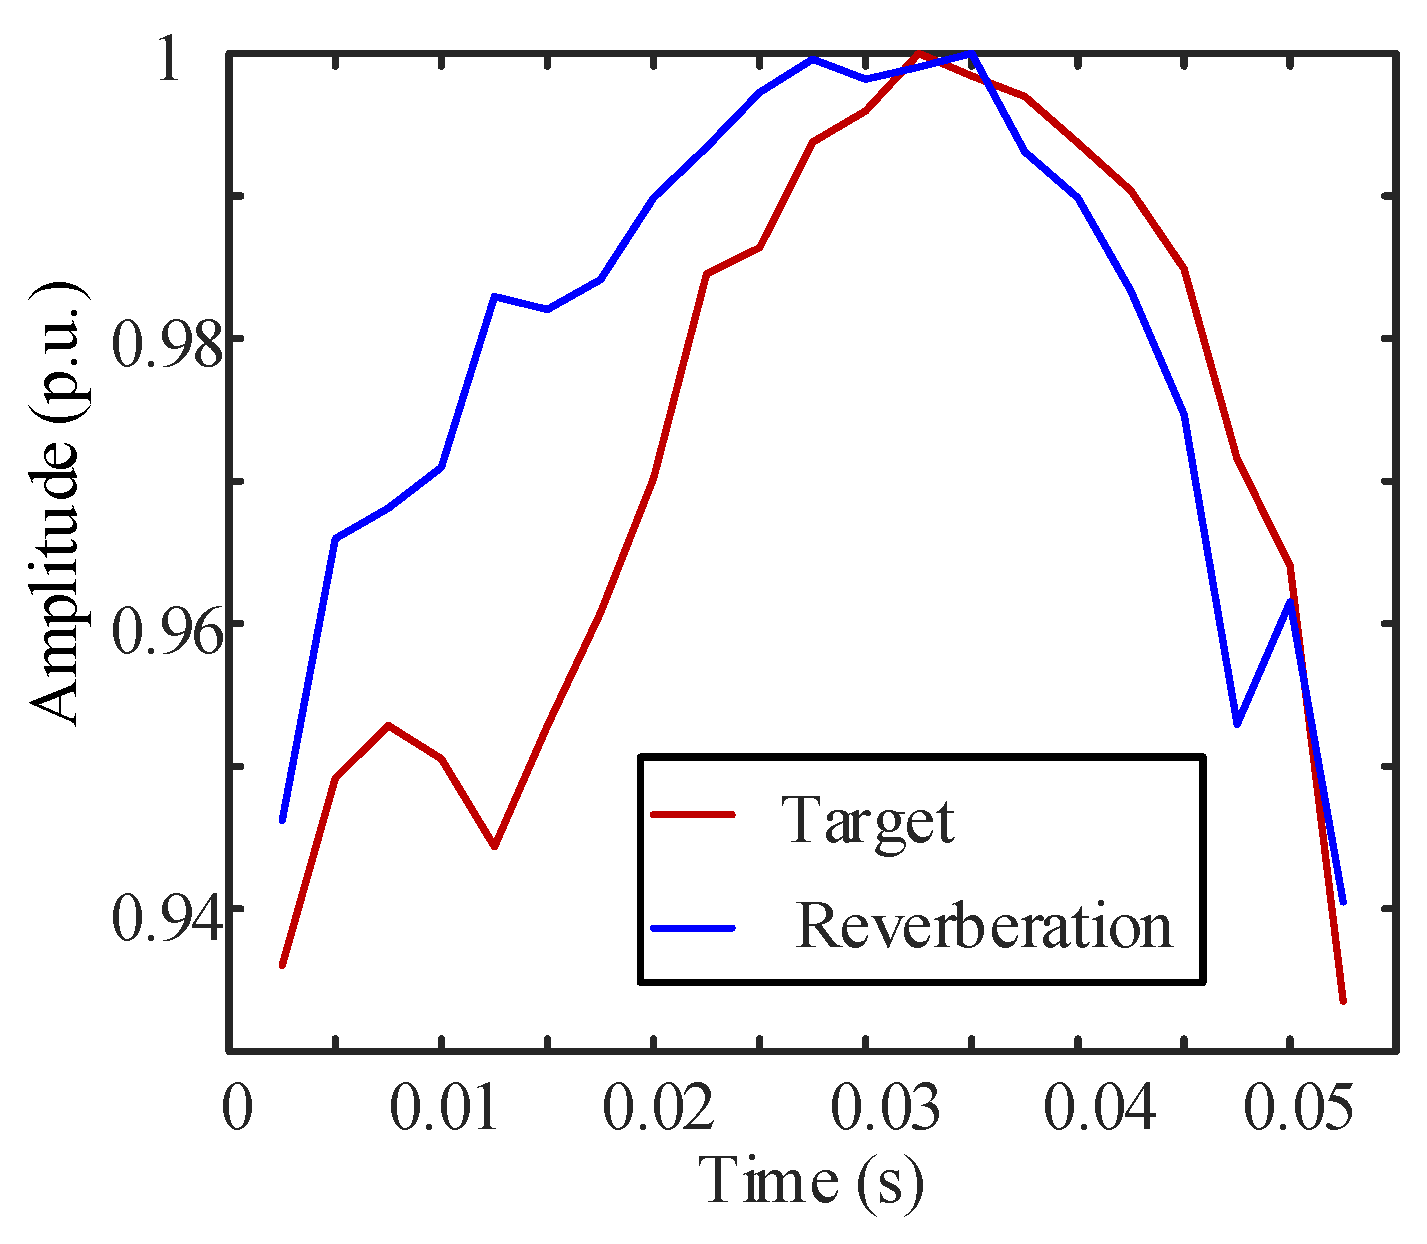
As is shown in Figure 17, despite the traditional CA-CFAR method’s ability to discern the target when transmitting a 0.05 s CW signal, there are numerous interferences. When SO-CFAR processing is adopted, besides the target being detected, the greatest number of false targets arise among all the methods being compared, leading to the most serious false alarm rate. Compared with CA-CFAR and SO-CFAR, GO-CFAR reduces the false alarm rate, but there are still some interferences. It is worth noting that, as shown in Figure 17a–c, interference is consistently observed at the bearing of approximately 53°. Subsequently, through the spectral analysis of the reverberation envelope in this bearing, as is shown in Figure 18, a distinct high-frequency oscillation with a frequency of 86 Hz is identified. This oscillation frequency is higher than 1/T, which is 25 Hz. Hence, it is reasonable to set 1/T as the cutoff frequency of the α filter. As can be seen in Figure 17d, when the proposed α-CA-CFAR method is used, the false alarm rate is significantly reduced compared to the traditional methods, and the background is also relatively clean. In addition, even with the proposed method, there is still interference present in Figure 17d. To further analyze this, a comparison of the waveforms between the two is shown in Figure 19. It can be observed that they share the same time scale and exhibit similar waveform patterns, making it difficult for the proposed α-CA-CFAR method to distinguish between them in this case.

Trial Results with T = 0.1 s

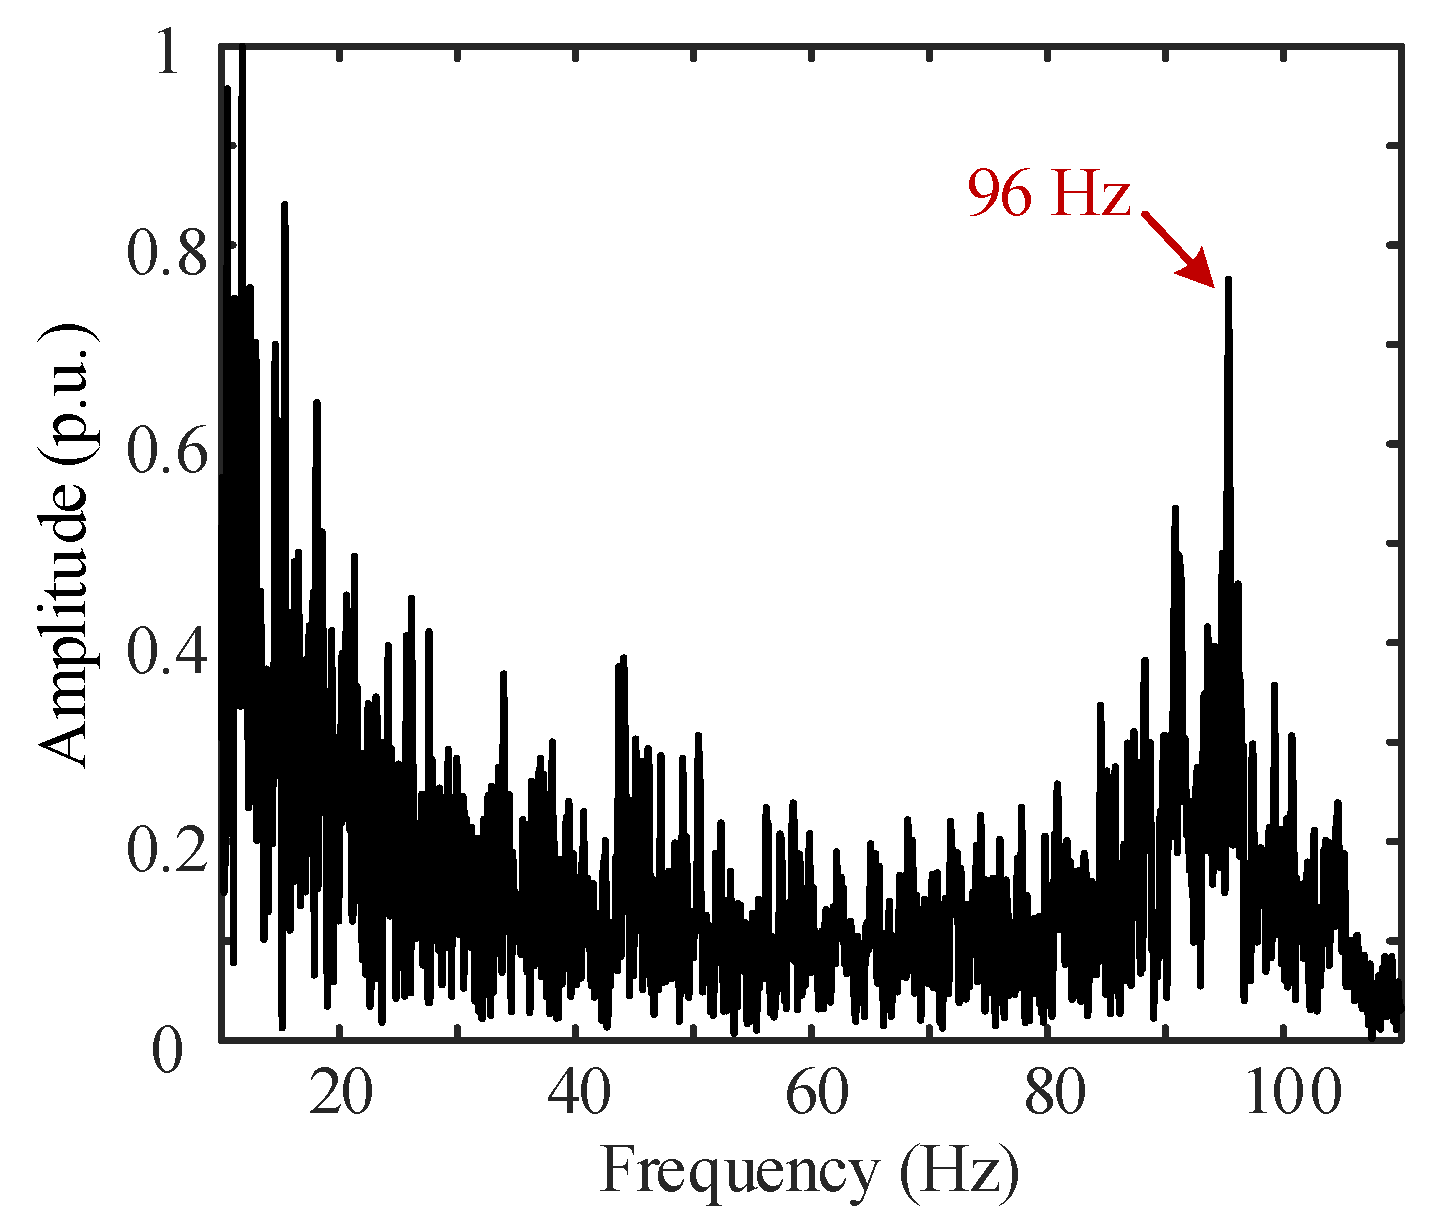
In Figure 20, upon transmitting a 0.1 s CW signal, although the target can be detected after CA-CFAR and SO-CFAR processing, the target energy is not the strongest. In addition, after GO-CFAR processing, due to the relatively weak target echo, it is directly masked by strong interference. The spectral analysis of the reverberation envelope at the bearing of 70° near the target is shown in Figure 21. It is found that there is a strong 96 Hz high-frequency oscillation interference. Therefore, it is reasonable to set the cut-off frequency of the α filter as 10 Hz, according to the conclusion of Section 4. Figure 20d demonstrates that the proposed method effectively detects the target with the strongest energy.

Trial Results with T = 0.2 s

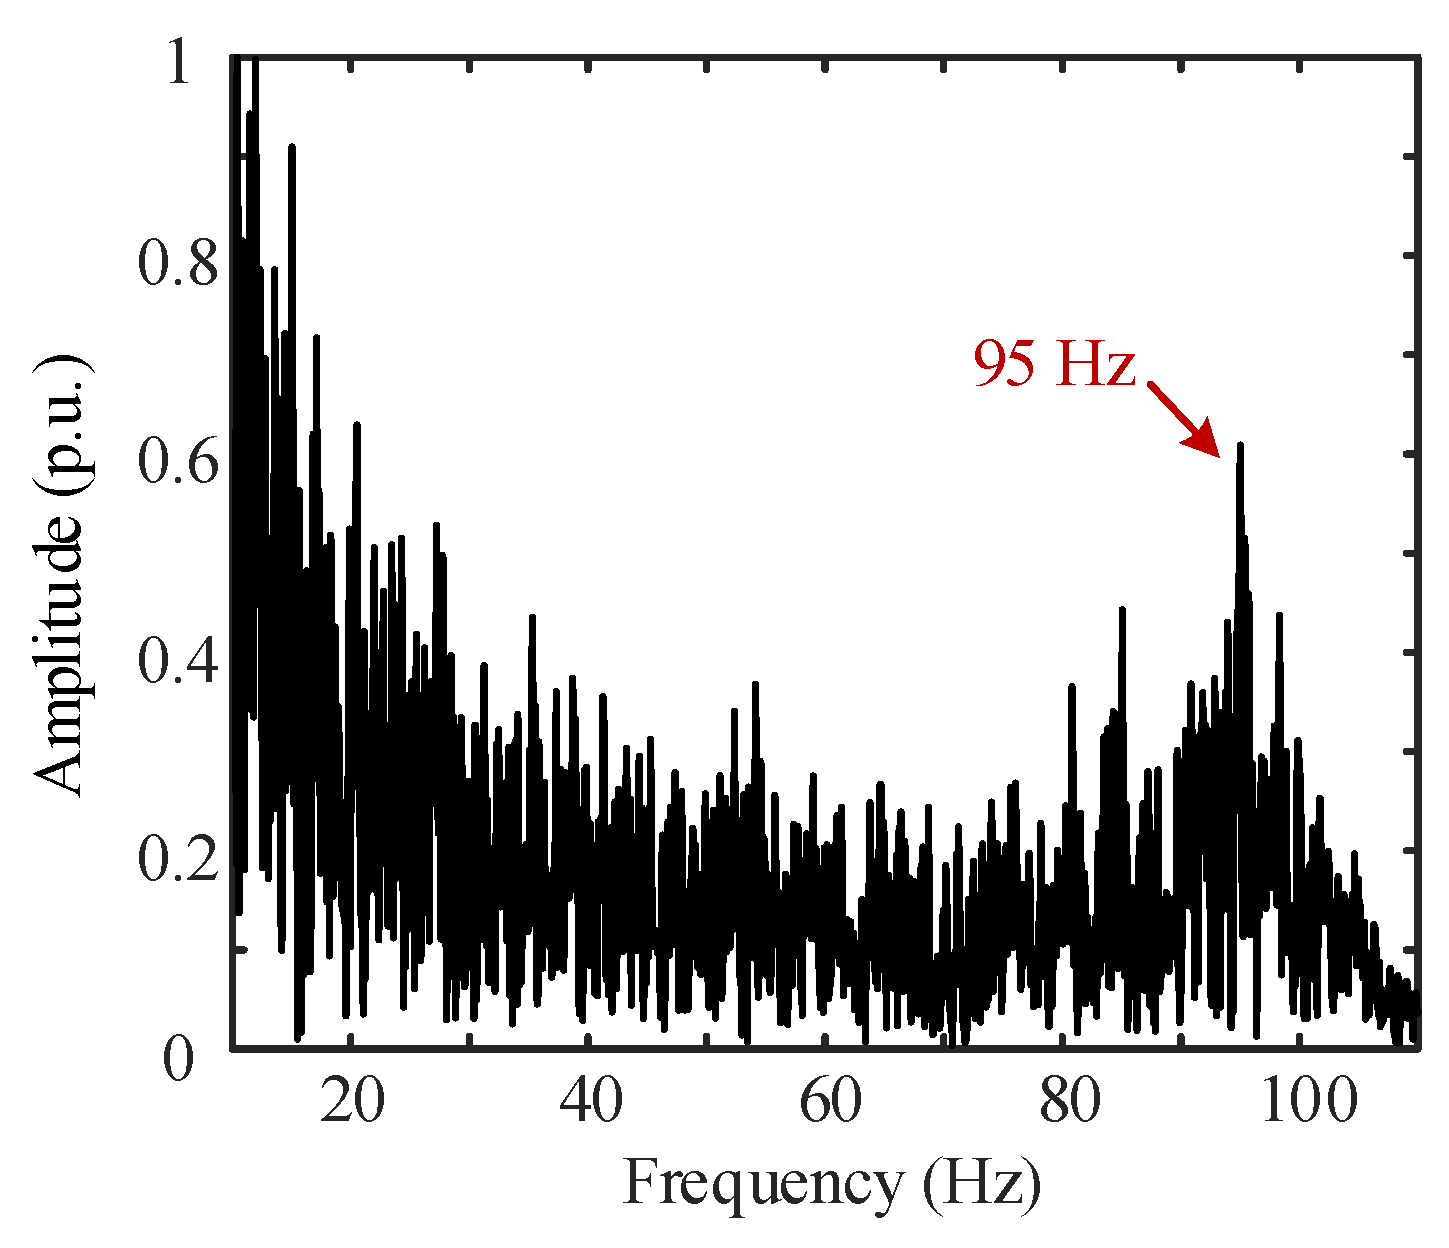
Figure 22 shows that when transmitting a 0.2 s CW signal, the target echo cannot be detected after both CA-CFAR and GO-CFAR processing, and is submerged in strong interference. While the SO-CFAR method can detect the target, there are still many interferences. From Figure 22a–c, it can be observed that there is always interference in the direction of approximately 150°. The spectral analysis of the reverberation envelope at the bearing of 150° is shown in Figure 23, where a strong 95 Hz high-frequency oscillation interference component can be found. Therefore, based on the conclusion of Section 4, it is reasonable to set the cut-off frequency of the α filter as 5 Hz. Figure 22 illustrates that the proposed method not only accurately detects the target but also eliminates other interferences.

Trial Results with T = 0.5 s

Figure 24 shows that although the traditional CA-CFAR, SO-CFAR, and GO-CFAR methods can detect the target when a 0.5 s CW signal is transmitted, there are many strong false target interferences in the background. Performing a spectral analysis on the reverberation envelope at the bearing of 70° near the target, as is shown in Figure 25, reveals the presence of strong 94 Hz high-frequency oscillation interference. Therefore, based on the conclusion in Section 4, it is reasonable to set the cut-off frequency of the α filter as 2 Hz. As can be seen from Figure 24, after adopting the proposed α-CA-CFAR method, the high-frequency oscillation interference can be effectively suppressed, and the target can be accurately detected.
In summary, although SO-CFAR can increase the probability of target detection, there is a high false alarm rate. Compared to SO-CFAR, using GO-CFAR can significantly reduce false alarm rates, but it is difficult to detect weak target echoes. The CA-CFAR has a certain reverberation-suppression ability, but its detection effect is still affected by high-frequency oscillations. The proposed α-CA-CFAR method can effectively suppress the high-frequency oscillation of the reverberation envelope, significantly reducing the false alarm rate. When CA-CFAR fails to detect the target, the proposed method can still detect the target.

6. Discussion

6.1. Analysis of the Causes of High-Frequency Oscillations of the Reverberation Envelope of Short-Pulse-Width CW Signal

6.1.1. Simulated Target Signal and Its Frequency Spectrum Emitted by the Transponder

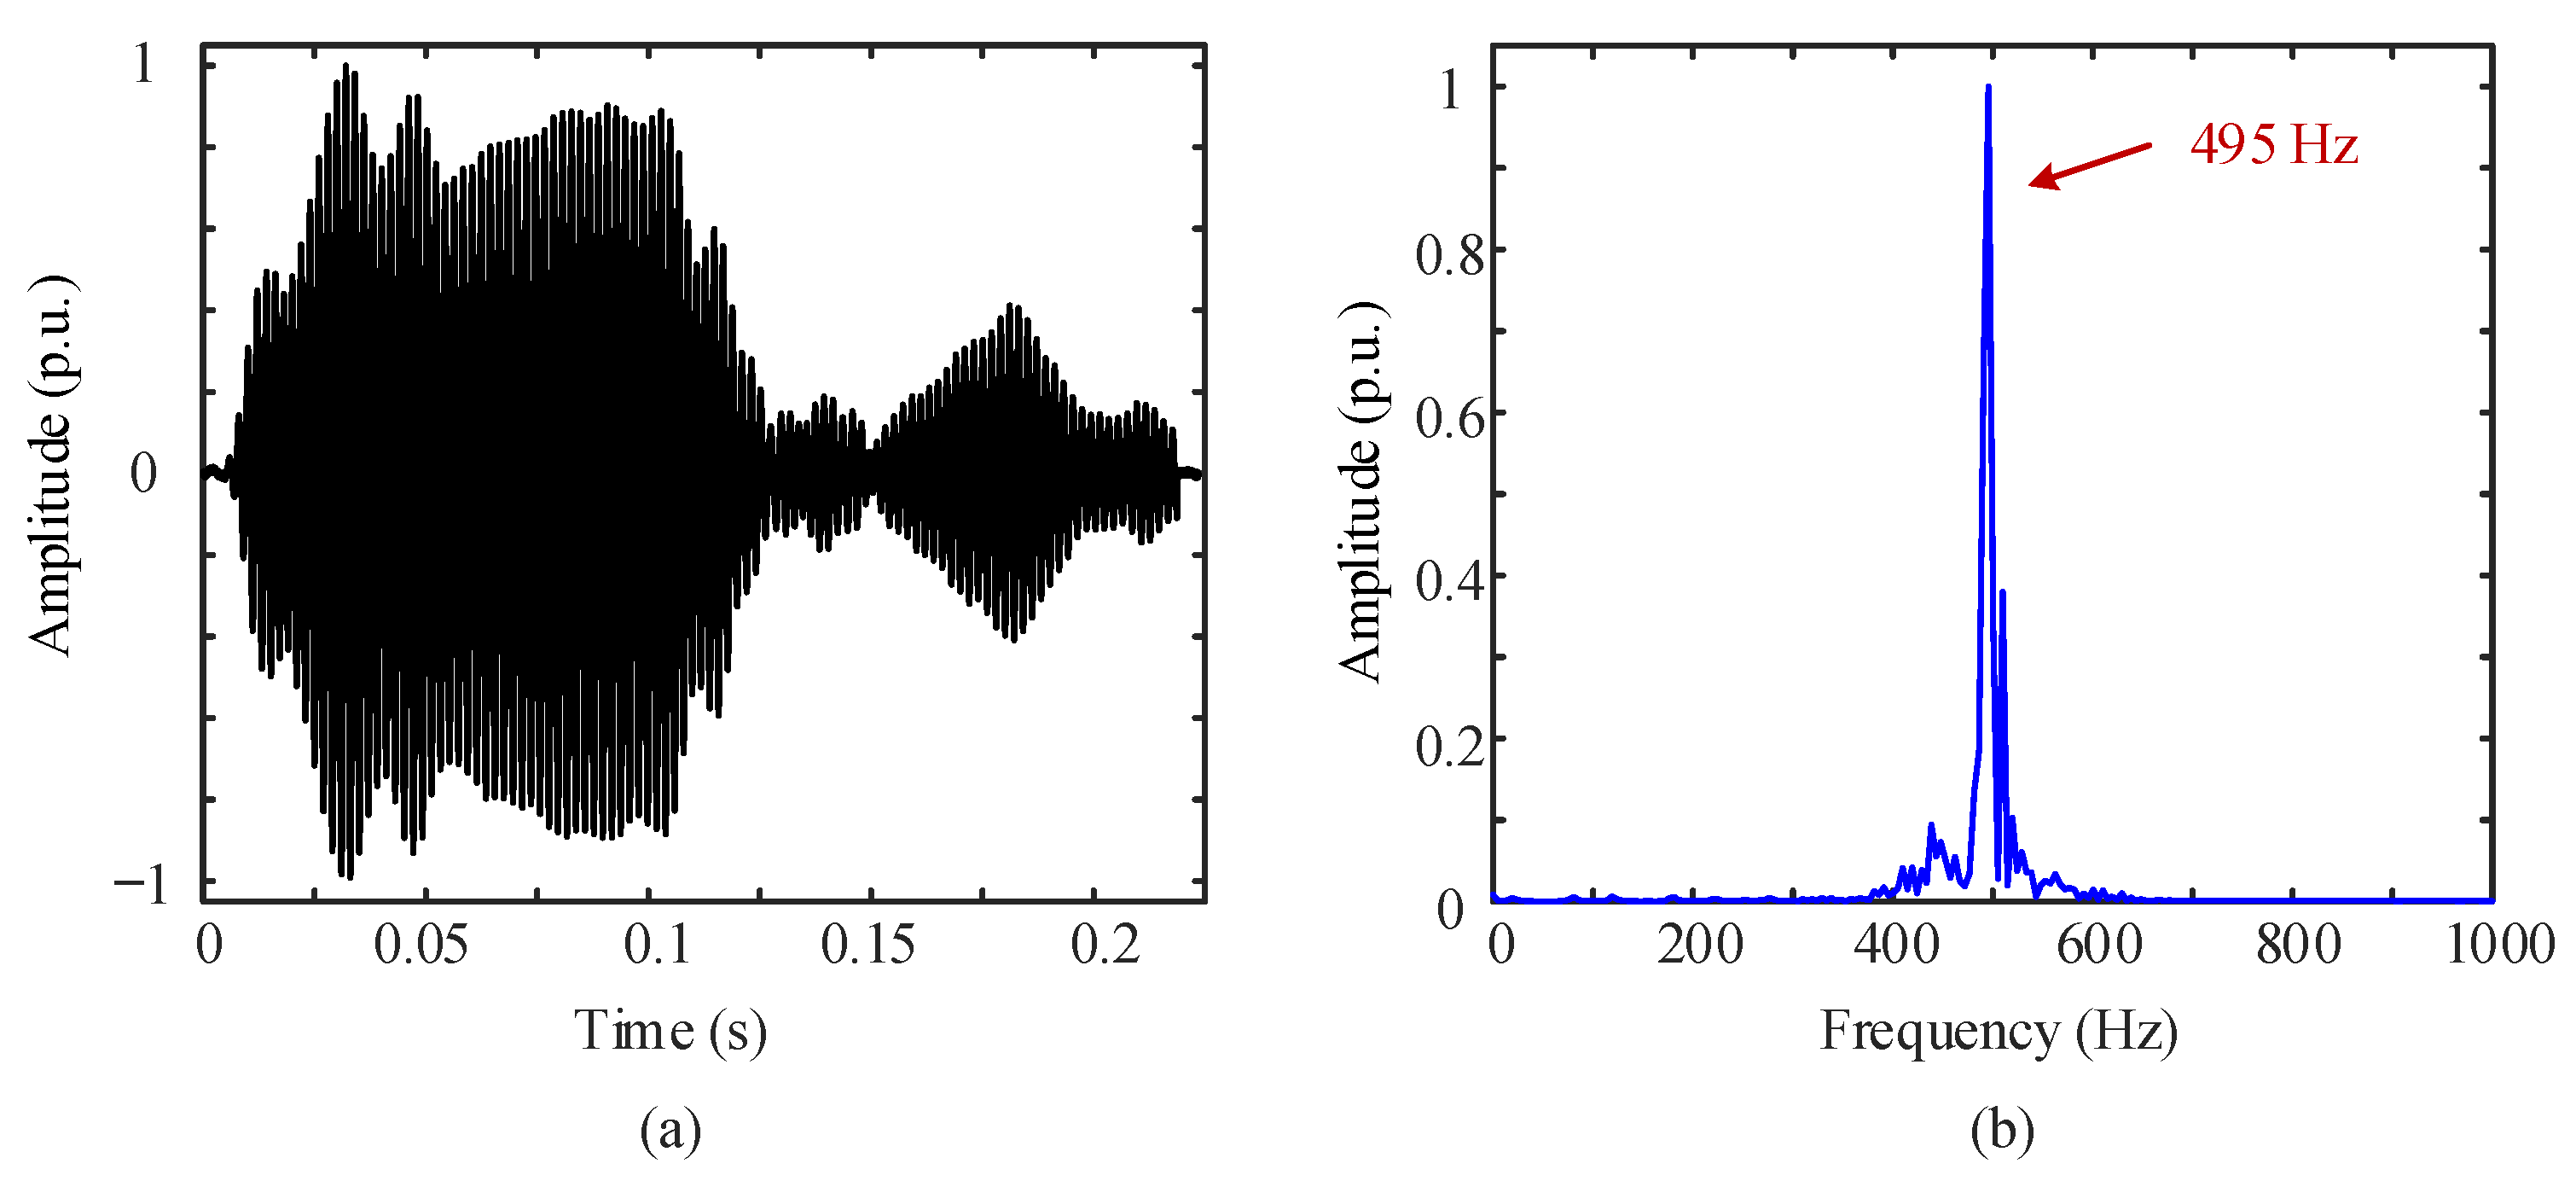
Taking the transmission of a 0.2 s, 495 Hz CW signal during the lake trial as an example, the simulated target signal and its frequency spectrum emitted by the transponder ship are shown in Figure 26. It can be seen that although the waveform of the target echo signal has undergone certain distortion in the time domain compared with the transmitted CW signal, its frequency spectrum is mainly concentrated at 495 Hz, which is consistent with the transmitted signal, and there are no other interfering frequency components. Therefore, it can be concluded that the underwater acoustic propagation environment does not cause high-frequency oscillations.

6.1.2. The Reverberation Envelope and Its Spectrum of the Long-Pulse-Width CW Signals

Figure 4 compares the decay of the reverberation envelope when transmitting CW signals of different pulse widths. As we can see from Figure 4, the oscillations of the reverberation envelope gradually disappear as the CW pulse width increases, and this result is consistent with [14].
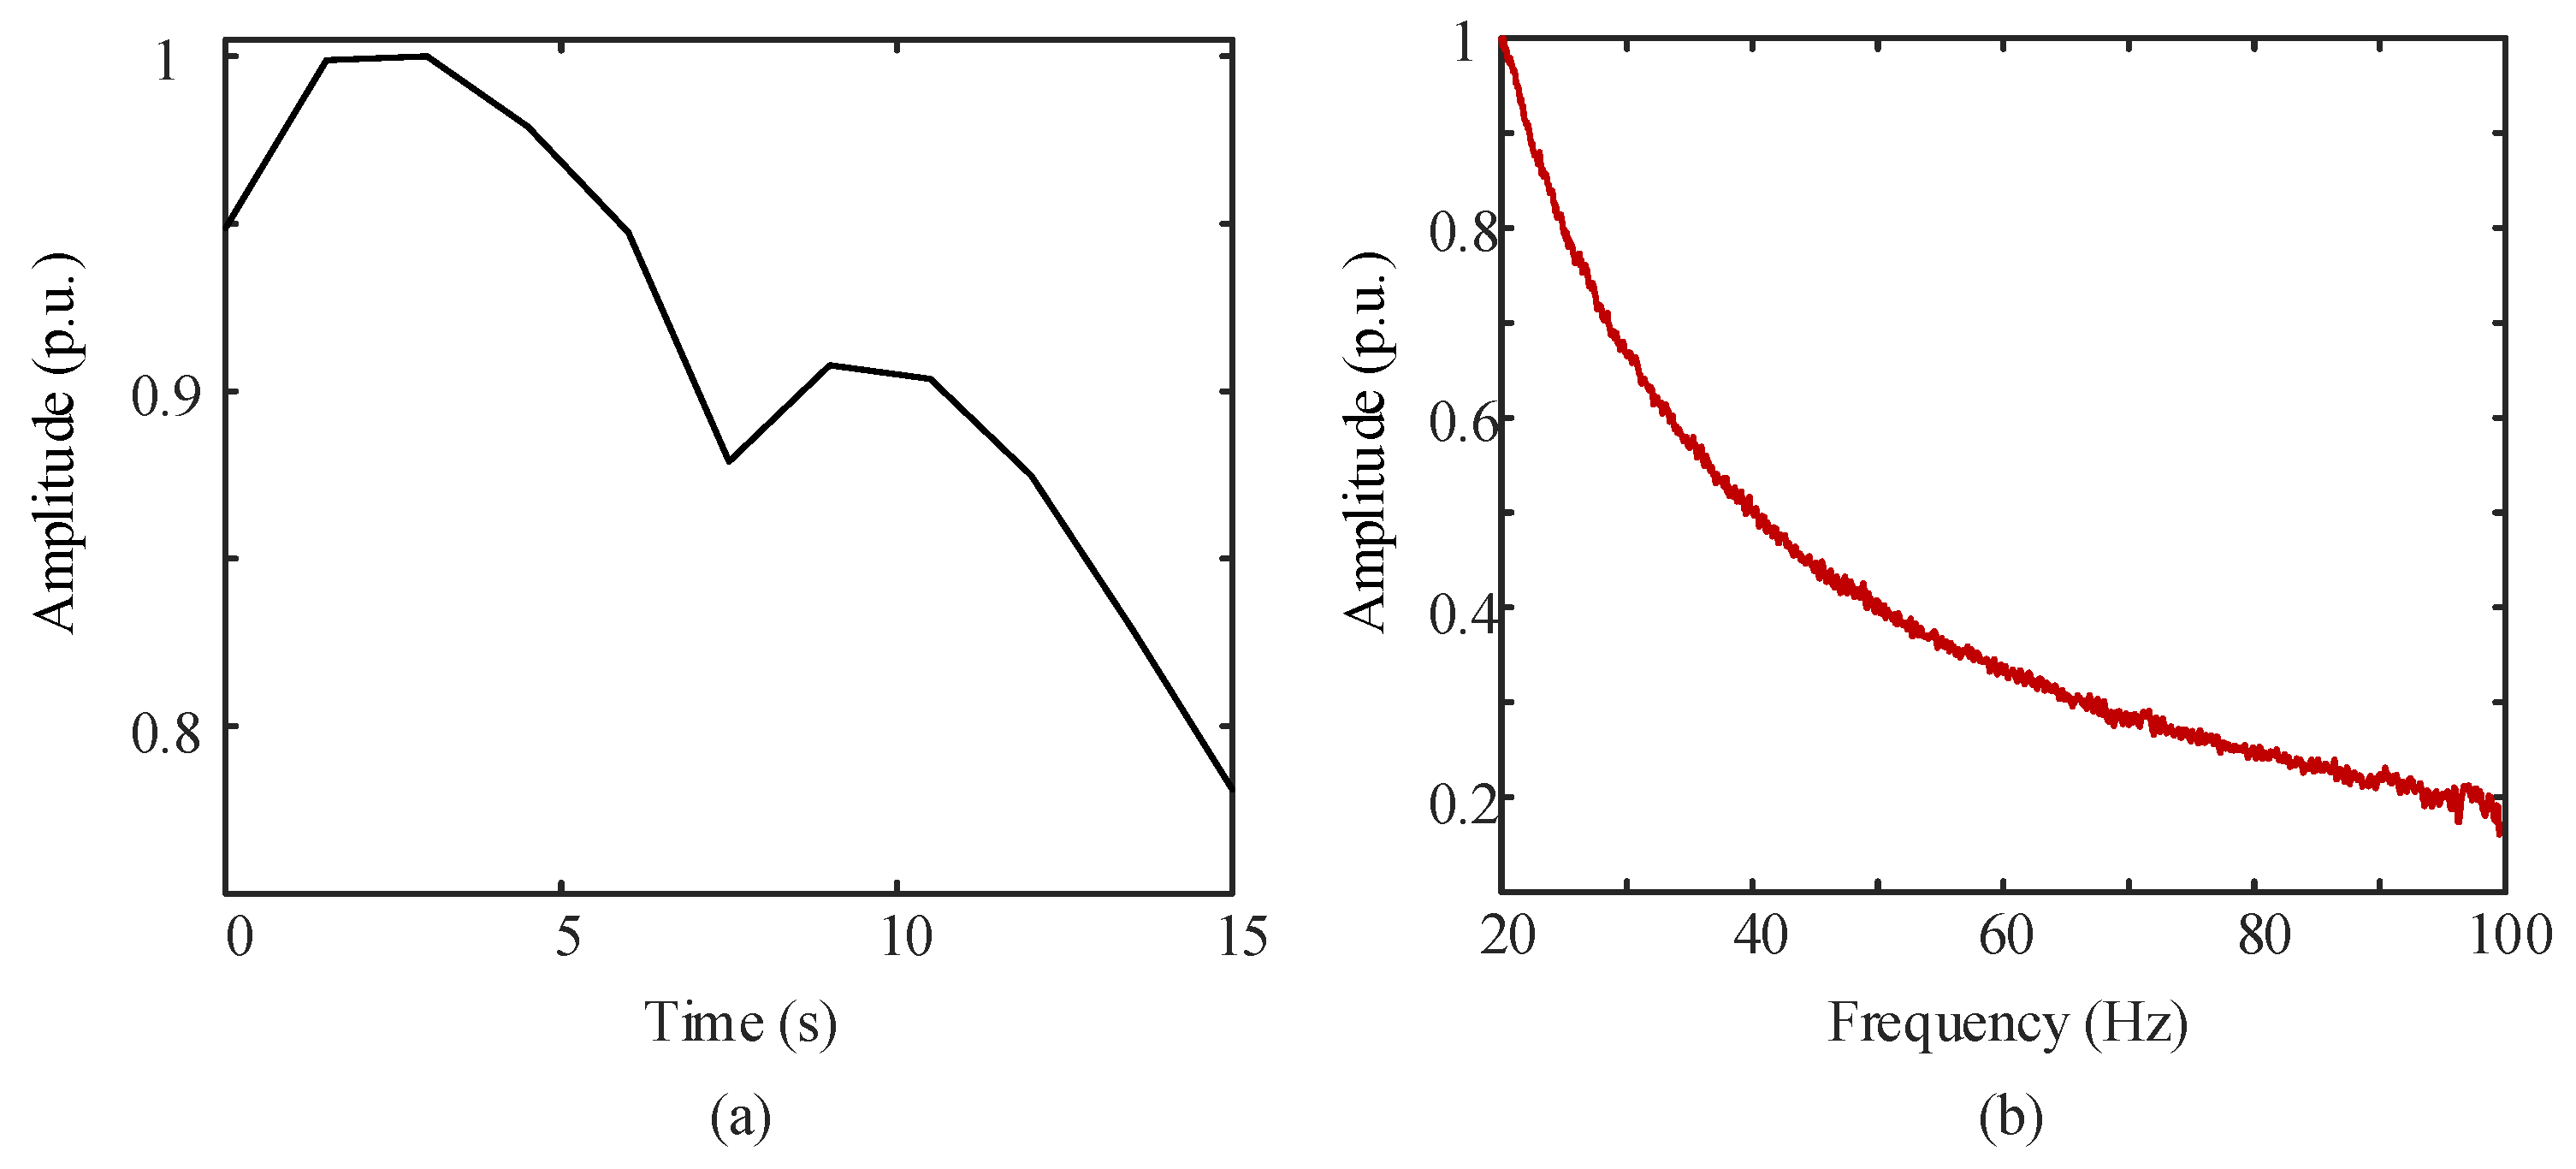
The reverberation envelope generated by transmitting a long-pulse-width CW signal during the lake trial is analyzed. Taking the transmission of a 10 s, 495 Hz CW signal as an example, the generated reverberation envelope and its frequency spectrum are shown in Figure 27. It can be seen that when a 10 s CW signal is transmitted, the reverberation envelope decays relatively steadily over time, and there are no high-frequency oscillation components in its frequency spectrum.
In summary, firstly, the target signal simulated by the transponder does not introduce high-frequency components after the transmitted signal propagates through the underwater acoustic channel. Secondly, when transmitting a CW signal with a long pulse width, there are no high-frequency components in the reverberation envelope. Therefore, the high-frequency oscillation of the reverberation envelope is mainly related to the duration of the transmitted CW, and the shorter the pulse width, the more severe the oscillation phenomenon.

6.2. Analysis of Lake Trial Results

After the lake trial validation in Section 5.2, the traditional CA-CFAR, SO-CFAR, and GO-CFAR methods exhibited a high false alarm rate when transmitting short-pulse-width CW signals, and even failed to detect the target in some cases. The primary reason for this phenomenon lies in the fact that, while traditional methods can effectively suppress low-frequency oscillations, the presence of high-frequency oscillations becomes a bottleneck for their performance. The interference caused by high-frequency oscillations leads to a significant number of misjudgments during the processing of traditional methods, and in some cases, the amplitude of high-frequency oscillations even exceeds the target echo, thus affecting the accuracy of detection.
In contrast, the proposed α-CA-CFAR method can effectively suppress high-frequency oscillations. This measure significantly reduces the false alarm rate and improves the target detection accuracy, fully demonstrating the effectiveness and reliability of the proposed method. However, in the processing results of the proposed method, there still arise some false targets, which cause a certain degree of interference. Therefore, although the proposed method can effectively suppress high-frequency and low-frequency oscillations, it is limited for interference signals with the same time scale as the target echo. To further optimize the performance, the scattering characteristics of the target may need to be considered to further reduce the false alarm rate and improve the detection effect.

7. Conclusions

In this study, the formation mechanism of the high-frequency oscillation characteristics of the reverberation envelope of the short-pulse-width CW signals is analyzed, and an α filter is designed to suppress the oscillation before applying CA-CFAR to suppress low-frequency oscillations. The main conclusions derived are as follows:
(1)
By modeling the formation mechanism of high-frequency oscillations in the reverberation envelope of a short-pulse CW signal, an analysis reveals that the frequency component of the high-frequency oscillations is m/2τ (m = 1, 2, …). Based on this, an α-filter is designed to suppress high-frequency oscillations in the reverberation envelope with frequencies greater than 1/T. Subsequently, the CA-CFAR is applied to suppress low-frequency oscillations in the reverberation envelope with frequencies less than 1/T;
(2)
The underlying factor determining the high-frequency oscillations of the reverberation envelope of short-pulse CW signals is the duration of the transmitted CW. Specifically, the shorter the pulse width, the more severe the oscillation phenomenon becomes;
(3)
Simulation and lake trials confirm the effectiveness of the proposed method. Monte Carlo simulation experiments indicate that, when the SRR is less than 15 dB, the average detection probability of the proposed α-CA-CFAR method is 20% higher compared to CA-CFAR, SO-CFAR, and GO-CFAR methods. The lake trial results demonstrate the method’s strong robustness;
(4)
Although the proposed method can effectively suppress high-frequency and low-frequency oscillations, it is limited for interference signals with the same time scale as the target echo. To further improve the suppression ability of reverberation interference, considering the scattering characteristics of the target and different interference sources, small changes in the temporal variation features used to identify the target echo, such as the temporal amplitude and frequency variations, will be part of our future investigation.

Author Contributions

Conceptualization, Y.C. and S.L.; methodology, Y.C. and S.L.; validation, Y.C. and H.Z.; investigation, J.G. and N.Z.; data curation, H.Z. and N.Z.; writing—original draft, Y.C.; writing—review and editing, S.L.; supervision, J.G. and A.L.; project administration, A.L.; funding acquisition, A.L. All authors have read and agreed to the published version of the manuscript.

Funding

This work was supported by the Natural Science Foundation of China (Grant No. 52127901) and the Science and Technology Innovation Program of Hunan Province (Grant No. 2023RC3128).

Data Availability Statement

The data that support the findings of this study are available on request from the corresponding author. The data are not publicly available due to privacy or ethical restrictions.

Acknowledgments

The authors would like to thank the peer reviewers and editors for their hard work and constructive feedback, which will make a significant contribution to improving the paper.

Conflicts of Interest

The authors declare no conflicts of interest.

References

  1. Jia, H.; Li, X. Underwater reverberation suppression based on non-negative matrix factorization. J. Sound Vib. 2021, 506, 116166. [Google Scholar] [CrossRef]
  2. Chen, D.; Tao, Z. Design of a short pulse width CW signal generator. Mod. Nav. 2012, 3, 190–192. [Google Scholar]
  3. Lee, S.; Lim, J. Reverberation suppression using non-negative matrix factorization to detect low-Doppler target with continuous wave active sonar. EURASIP J. Adv. Signal Process. 2019, 2019, 11. [Google Scholar] [CrossRef]
  4. Hao, P.; Yan, S.; Xu, D.; Shi, B. Active Sonar Constant False Alarm Processing Technology, 1st ed.; Posts & Telecom Press: Beijing, China, 2021; pp. 28–34. [Google Scholar]
  5. Kim, G.; Lee, K.; Lee, S. Linear Frequency Modulated Reverberation Suppression Using Non-Negative Matrix Factorization Methods, Dechirping Transformation and Modulo Operation. IEEE Access 2020, 8, 110720–110737. [Google Scholar] [CrossRef]
  6. Finn, H.M.; Johnson, R.S. Adaptive detection mode with threshold control as a function spatially sampled clutter-level estimates. RCA Rev. 1968, 29, 414–464. [Google Scholar]
  7. Cai, J.; Hu, S.; Jin, Y.; Mo, J.; Yan, T.; Xia, M. A CA-CFAR-Like detector using the Gerschgorin circle theorem for bistatic space based radar. IEEE Trans. Aerosp. Electron. Syst. 2021, 57, 4137–4148. [Google Scholar] [CrossRef]
  8. Trunk, G.V. Range resolution of targets using automatic detectors. IEEE Trans. AES 1978, 14, 750–755. [Google Scholar] [CrossRef]
  9. Hansen, V.G. Constant false alarm rate processing in search radars. In Proceedings of the IEE International Radar, London, UK, 20–23 October 1973; pp. 325–332. [Google Scholar]
  10. Smith, M.E.; Varshney, P.K. Intelligent CFAR processor based on data variability. IEEE Trans. Aerosp. Electron. Syst. 2000, 36, 837–847. [Google Scholar] [CrossRef]
  11. Patel, V.; Madhukar, H.; Ravichandran, S. Variability index constant false alarm rate for marine target detection. In Proceedings of the 2018 Conference on Signal Processing and Communication Engineering Systems (SPACES), Vijayawada, India, 4–5 January 2018; pp. 171–175. [Google Scholar]
  12. Ji, Y.; Liu, A.; Chen, X.; Wang, J.; Yu, C. Target Detection Method for High-Frequency Surface Wave Radar RD Spectrum Based on (VI)CFAR-CNN and Dual-Detection Maps Fusion Compensation. Remote Sens. 2024, 16, 332. [Google Scholar] [CrossRef]
  13. Yang, J.; Tang, D.; Hefner, B.T.; Williams, K.L.; Preston, J.R. Overview of mid-frequency reverberation data acquired during the target and reverberation experiment 2013. IEEE J. Ocean. Eng. 2018, 43, 563–585. [Google Scholar] [CrossRef]
  14. Cole, B.; Davis, J.; Leen, W.; Powers, W.; Hanrahan, J. Coherent bottom reverberation: Modeling and comparisons with at-sea measurements. J. Acoust. Soc. Am. 2004, 116, 1985–1994. [Google Scholar] [CrossRef]
  15. Li, F.; Jin, G.; Zhang, R. The coherent theory and an oscillation phenomenon of the reverberation in shallow water. Sci. China Ser. A. 2000, 30, 560–566. [Google Scholar]
  16. Li, F.; Jin, G.; Zhang, R.; Liu, J.; Guo, L. An oscillation phenomenon of reverberation in the shallow water with a thermocline. J. Sound Vib. 2002, 252, 457–468. [Google Scholar] [CrossRef]
  17. Li, F.; Liu, J.; Li, Z.; Zhang, R. An oscillation phenomenon of low-frequency reverberation in the shallow water and its physical explanation. Sci. China Ser. G 2005, 48, 413–421. [Google Scholar] [CrossRef]
  18. Yin, L.; Wu, J.; Hou, Q. Fluctuation of short-range reverberation in shallow water. J. Appl. Acoust. 2021, 40, 828–832. [Google Scholar]
  19. Yin, L.; Wu, J.; Hou, Q.; Chen, J. A simulation of finite element and analysis of short-range reverberation intensity in shallow water. Tech. Acoust. 2019, 38, 481–483. [Google Scholar]
  20. Choo, Y.; Lee, K.; Hong, W.; Byun, S.-H.; Yang, H. Active underwater target detection using a shallow neural network with spectrogram-based temporal variation features. IEEE J. Ocean. Eng. 2022, 49, 279–293. [Google Scholar] [CrossRef]
  21. Li, Y.; Xu, Y.; Zhou, Z. Analysis of characteristics and research of modeling simulation on marine reverberation. Ship Electron. Eng. 2018, 38, 86–88+182. [Google Scholar]
  22. Jiang, Y.; Luo, Y.; Shi, J. The research on simulation of seabed reverberation model based on multi-beam sounding system. In Proceedings of the 2016 IEEE/OES China Ocean Acoustics (COA), Harbin, China, 9–11 January 2016; pp. 1–5. [Google Scholar]
  23. Holland, C.W.; Smith, C.M.; Lowe, Z.; Dorminy, J. Seabed Observations at the New England Mud Patch: Reflection and Scattering Measurements and Direct Geoacoustic Information. IEEE J. Ocean. Eng. 2022, 47, 578–593. [Google Scholar] [CrossRef]
  24. Luo, J.; Zhu, P.; Zhang, Z.; Chen, Y. Seabed characterization based on the statistical classification using the seabed reflection amplitudes of sub-bottom profiler data. Cont. Shelf Res. 2024, 279, 105293. [Google Scholar] [CrossRef]
  25. Xu, X.; Zhang, Y.; Li, H.; Yang, S. A model of seafloor reverberation simulation. Acta Acust. 1998, 23, 141–148. [Google Scholar]
  26. Yang, Y.; Shao, X.; Shi, Y.; Zhang, W. Back-stepping Robust Control for Flexible Air-breathing Hypersonic Vehicle via α-filter-based Uncertainty and Disturbance Estimator. Int. J. Control Autom. Syst. 2021, 19, 753–766. [Google Scholar] [CrossRef]
  27. Lu, S.; Hu, P.; Ding, F. Robust sonar CFAR detection algorithm in complex non-homogeneous background. Tech. Acoust. 2020, 39, 744–751. [Google Scholar]
  28. Ruppel, C.D.; Weber, T.C.; Staaterman, E.R.; Labak, S.J.; Hart, P.E. Categorizing Active Marine Acoustic Sources Based on Their Potential to Affect Marine Animals. J. Mar. Sci. Eng. 2022, 10, 1278. [Google Scholar] [CrossRef]
Figure 1. Different reverberation backgrounds. (a) Steadily-decay reverberation background. (b) Non-steadily-decay reverberation background.
Remotesensing 16 02949 g001
Figure 2. The performance comparison of SO-CFAR, GO-CFAR and CA-CFAR.
Remotesensing 16 02949 g002
Figure 3. Flow diagram of CA-CFAR.
Remotesensing 16 02949 g003
Figure 4. The oscillations of the reverberation envelope of CW signals with different pulse widths.
Remotesensing 16 02949 g004
Figure 5. The spectrum of the reverberation envelope of 0.5 s CW.
Remotesensing 16 02949 g005
Figure 6. The detection performance comparison of CA-CFAR under different reverberation envelope oscillations. (a) Low-frequency oscillation. (b) High-frequency oscillation.
Remotesensing 16 02949 g006
Figure 7. The cell scattering model.
Remotesensing 16 02949 g007
Figure 8. The form of backscattered waves and the output of match filter.
Remotesensing 16 02949 g008
Figure 9. The flowchart of α filter.
Remotesensing 16 02949 g009
Figure 10. The amplitude frequency characteristic of the α filter.
Remotesensing 16 02949 g010
Figure 11. The logic of the cascaded reverberation suppression method.
Remotesensing 16 02949 g011
Figure 12. The simulated reverberation signal and its spectrum. (a) The reverberation signal containing the target echo. (b) The spectrum of the reverberation envelope.
Remotesensing 16 02949 g012
Figure 13. Processing results of different methods. (a) CA-CFAR. (b) SO-CFAR. (c) GO-CFAR. (d) α-CA-CFAR.
Remotesensing 16 02949 g013
Figure 14. Probability of target detection vs. SRR with CA-CFAR, SO-CFAR, GO-CFAR and α-CA-CFAR.
Remotesensing 16 02949 g014
Figure 15. False alarm rate vs. RNR with CA-CFAR, SO-CFAR, GO-CFAR and α-CA-CFAR.
Remotesensing 16 02949 g015
Figure 16. Schematic diagram of the distribution of the lake trial.
Remotesensing 16 02949 g016
Figure 17. Detection results of different methods for 0.05 s CW. (a) CA-CFAR. (b) SO-CFAR. (c) GO-CFAR. (d) α-CA-CFAR.
Remotesensing 16 02949 g017
Figure 18. The spectrum of the reverberation envelope at the bearing of 53°.
Remotesensing 16 02949 g018
Figure 19. Waveform comparison between target echo and reverberation interference.
Remotesensing 16 02949 g019
Figure 20. Detection results of different methods for 0.1 s CW. (a) CA-CFAR. (b) SO-CFAR. (c) GO-CFAR. (d) α-CA-CFAR.
Remotesensing 16 02949 g020
Figure 21. The spectrum of the reverberation envelope at the bearing of 70° when transmitting a 0.1 s CW signal.
Remotesensing 16 02949 g021
Figure 22. Detection results of different methods for 0.2 s CW. (a) CA-CFAR. (b) SO-CFAR. (c) GO-CFAR. (d) α-CA-CFAR.
Remotesensing 16 02949 g022
Figure 23. The spectrum of the reverberation envelope at the bearing of 150°.
Remotesensing 16 02949 g023
Figure 24. Detection results of different methods for 0.5 s CW. (a) CA-CFAR. (b) SO-CFAR. (c) GO-CFAR. (d) α-CA-CFAR.
Remotesensing 16 02949 g024
Figure 25. The spectrum of the reverberation envelope at the bearing of 70° when transmitting a 0.5 s CW signal.
Remotesensing 16 02949 g025
Figure 26. Simulated target signal and its frequency spectrum emitted by the transponder ship. (a) Simulated target signal. (b) The frequency spectrum of the simulated target signal.
Remotesensing 16 02949 g026
Figure 27. The reverberation envelope and its spectrum of the transmission of a 10 s, 495 Hz CW signal. (a) The reverberation envelope of the transmission of a 10 s, 495 Hz CW signal. (b) The frequency spectrum of the reverberation envelope of the transmission of a 10 s, 495 Hz CW signal.
Remotesensing 16 02949 g027
Table 1. Quantitative comparative results of different reverberation suppression methods.
MethodCA-CFARSO-CFARGO-CFARα-CA-CFAR
Low-frequency oscillation (p.u.)0.780.660.810.66
High-frequency oscillation (p.u.)0.980.890.90.55
Target (p.u.)10.811
Target/Low-frequency oscillation1.281.211.231.52
Target/High-frequency oscillation1.020.821.111.82
Table 2. Detection probabilities of different methods under different SRRs.
SRR\MethodCA-CFARSO-CFARGO-CFARα-CA-CFAR
15 dB10.9730.9991
10 dB0.9040.8100.8730.995
5 dB0.4880.5240.5070.850
0 dB0.1560.2830.2160.575
−5 dB0.050.1670.0850.385
Table 3. False alarm rates of different methods under different RNRs.
RNR\MethodCA-CFARSO-CFARGO-CFARα-CA-CFAR
15 dB1110.023
10 dB0.9520.9900.8270.012
5 dB0.1940.4220.1020.008
0 dB0.0100.0240.0050
−5 dB0000
Table 4. System configuration.
System ParametersParameter Settings
Water depth80 m
Receive distance3 km
Signal frequency495 Hz
Sound source level212 dB
WaveformCW
Pulse width0.05 s/0.1 s/0.2 s/0.5 s
Target strength−20 dB
Source depth40 m
Transponder depth 40 m
Array depth30 m
Array elements16
Array formLine
Disclaimer/Publisher’s Note: The statements, opinions and data contained in all publications are solely those of the individual author(s) and contributor(s) and not of MDPI and/or the editor(s). MDPI and/or the editor(s) disclaim responsibility for any injury to people or property resulting from any ideas, methods, instructions or products referred to in the content.