Article

Extraction of Spatiotemporal Information of Rainfall-Induced Landslides from Remote Sensing

1
Key Laboratory of VGE of Ministry of Education, Nanjing Normal University, Nanjing 210023, China
2
School of Internet of Things, Nanjing University of Posts and Telecommunications, Nanjing 210023, China
*
Author to whom correspondence should be addressed.
Remote Sens. 2024, 16(16), 3089; https://doi.org/10.3390/rs16163089
Submission received: 19 July 2024 / Revised: 12 August 2024 / Accepted: 16 August 2024 / Published: 22 August 2024
(This article belongs to the Special Issue Study on Hydrological Hazards Based on Multi-source Remote Sensing)

Abstract

:
With global climate change and increased human activities, landslides increasingly threaten human safety and property. Precisely extracting large-scale spatiotemporal information on landslides is crucial for risk management. However, existing methods are either locally based or have coarse temporal resolution, which is insufficient for regional analysis. In this study, spatiotemporal information on landslides was extracted using multiple remote sensing data from Emilia, Italy. An automated algorithm for extracting spatial information of landslides was developed with NDVI datasets. Then, we established a landslide prediction model based on a hydrometeorological threshold of three-day soil moisture and three-day accumulated rainfall. Based on this model, the locations and dates of rainfall-induced landslides were identified. Then, we further matched these identified locations with the extracted landslides from remote sensing data and finally determined the occurrence time. This approach was validated with recorded landslides events in Emilia. Despite some temporal clustering, the overall trend matched historical records, accurately reflecting the dynamic impacts of rainfall and soil moisture on landslides. The temporal bias for 87.3% of identified landslides was within seven days. Furthermore, higher rainfall magnitude was associated with better temporal accuracy, validating the effectiveness of the model and the reliability of rainfall as a landslide predictor.

1. Introduction

Landslides are one of the most common and destructive natural disasters worldwide, posing significant threats to people’s lives and property [1]. According to statistics, landslides cause an average of approximately 1000 deaths per year globally and result in direct economic losses of approximately 4 billion US dollars annually [2]. Survey results of geological disasters in 290 counties and cities in China show that landslides account for 51% of all geological disasters. The predominant trigger for landslides is commonly rainfall, with rainfall-induced landslides accounting for approximately 90% of the total [3,4]. Therefore, the extraction of spatiotemporal characteristics of rainfall-induced landslide events is crucial for early warning and disaster mitigation of regional landslides.
With the development of observation technologies, remote sensing data have been widely used in landslide detection. For the extraction of spatial information on landslide events based on remote sensing, bi-temporal change detection with pre- and post-disaster data is an effective approach [5,6]. Specifically, utilizing pre- and post-disaster NDVI data for bi-temporal change detection, combined with other datasets, achieves superior landslide identification results [7,8]. Vegetation disturbance due to landslide events has a significant impact on NDVI values in the affected locations [9]. By analyzing the abrupt short-term decline in NDVI, which indicates vegetation disturbance, rapid landslide detection can be achieved [10]. Ramos-Bernal et al. [11] conducted linear regression (LR), chi-square transformation, and change vector analysis on principal component images and NDVI data to obtain differential change images. They then applied statistical parameter methods and the cut-line method to determine the threshold and identify candidate landslide pixels. Finally, a slope mask was used to classify all candidate landslide pixels as landslide or not. Plank et al. [12] proposed a rapid and fully automated procedure. This procedure calculates NDVI values from optical images before a landslide and the polarization entropy (H-index) from SAR images after the landslide and sets thresholds to detect landslides. Additionally, slope information from digital elevation models generated by TanDEM-X imagery is used to further refine the landslide occurrence areas. Wen et al. [13] proposed an adaptive landslide interval detection (LID) strategy based on time series NDVI from satellite images. This two-stage algorithm extracts local extremum segments from the time series to determine detection intervals and identifies landslides using predefined thresholds. The detection rate for large-scale landslides can reach up to 85%.
Current research on landslide change detection using remote sensing primarily focuses on the extraction of spatial information, including point distribution, extent, and volume, with limited attention to the specific occurrence time of landslides. However, for a comprehensive analysis of the spatiotemporal characteristics of landslides, extracting the temporal information is essential. The occurrence of landslides is closely related to the triggering conditions within a certain period. The lack of landslide timing information will limit our understanding of landslide triggering [14], which is thought to depend on hydrological recharge by the monsoon [15], intense bursts of rainfall [16], or post-seismic regolith disturbances [17]. Determining the temporal information of landslide events directly impacts the accuracy of landslide characteristic analysis [18], especially for landslide predictions and early warning systems. Due to limitations in remote sensing image revisit cycles and cloud cover, the temporal scale of current bi-temporal remote sensing landslide event extraction is often at a monthly scale. This is not conducive to the study of the spatiotemporal distribution characteristics of regional landslides. Given the unique hydrometeorological characteristics of rainfall-induced landslides, a prediction model can be established using pre-event soil moisture and recent rainfall [19,20].
As the most important triggering factor, the relationship between rainfall and landslides has attracted numerous studies [21,22,23]. They have used rainfall threshold models to assess whether and when landslides occur, and this model has been a significant focus of current studies [24,25]. Rainfall thresholds refer to the minimum rainfall required to destabilize a slope. By statistically analyzing rainfall data from historical landslide events, researchers can derive thresholds that predict the likelihood of rainfall-induced landslides, providing a basis for early warning systems [26,27]. By examining the relationships between recent rainfall events and indicators such as rainfall intensity, cumulative rainfall, and rainfall duration, effective rainfall thresholds can be established and applied to landslide prediction models [28,29].
Soil moisture is another important factor that directly relates to the occurrence of landslides. Research indicates that increased soil moisture raises pore water pressure, increases shear stress, and decreases shear strength, potentially triggering landslides [30]. Zhuo et al. [31] assessed the correlation between remote sensing soil moisture products and all landslide events over a 14-year period in the study area. Their findings demonstrated a significant correlation between satellite-derived soil moisture and landslide events, confirming the effectiveness of using soil moisture for landslide prediction.
Because of the importance of rainfall and soil moisture in predicting rainfall-induced landslides, many studies have incorporated these indicators into landslide prediction models. The most common approach is to establish thresholds based on soil moisture and rainfall events, also known as hydrometeorological thresholds [32,33,34]. Generally, when the antecedent soil moisture is high, the amount of rainfall required to trigger a landslide is lower. Conversely, when the antecedent soil moisture is low, landslides are likely to occur only during high-intensity or prolonged rainfall events. Zhao et al. [35] analyzed the probability of landslide occurrence under different soil moisture conditions and various rainfall thresholds based on Bayes’ theorem. They determined the hydrometeorological threshold according to the probability magnitude. Thomas et al. [28,29] analyzed hydrometeorological data before and after the landslide season. They established a two-dimensional threshold based on rainfall over the past three days and soil moisture over the preceding three days. The model performed well in predicting the possible dates and areas of landslide occurrence, especially when historical landslide data are limited, and the duration of landslides is short. Numerous studies on hydrometeorological thresholds have shown that incorporating both soil moisture and rainfall information in landslide prediction is crucial for improving prediction accuracy [36,37,38,39].
Hydrometeorological models are particularly suited as a proxy for determining the timing of rainfall-induced landslides due to the nature of the triggering mechanisms involved. Shallow landslides typically occur in the initial unsaturated soil layers when increased pore water pressure triggers slope failure [32]. Furthermore, hydrometeorological models allow for real-time monitoring and forecasting of rainfall and soil moisture conditions, providing a dynamic tool for assessing the likelihood of landslide occurrence at specific times. This capability is especially valuable in regions with limited geological data, where direct monitoring of landslide activity may not be feasible.
Most studies on landslide change detection using remote sensing data focus on local landslides, which limits their applicability to regional-scale landslide detection. Additionally, although some scholars have proposed hydrometeorological threshold models based on rainfall and soil moisture, they have not integrated these models with remote sensing landslide change detection or applied the models in temporal extraction. As a result, there is a relative lack of research on the extraction of temporal information.
To fill the gap of the temporal extraction of landslides, we proposed an approach by applying hydrometeorological thresholds to identify the temporal information of landslides. Moreover, we developed a method for extracting landslide spatial information at regional scales utilizing multisource remote sensing data. We take the Emilia-Romagna region in Italy as the study area to validate our approaches. These methods are expected to provide and improve the spatial and temporal attributes of rainfall-induced landslide events for regions with no or incomplete landslide records.

2. Study Area and Datasets
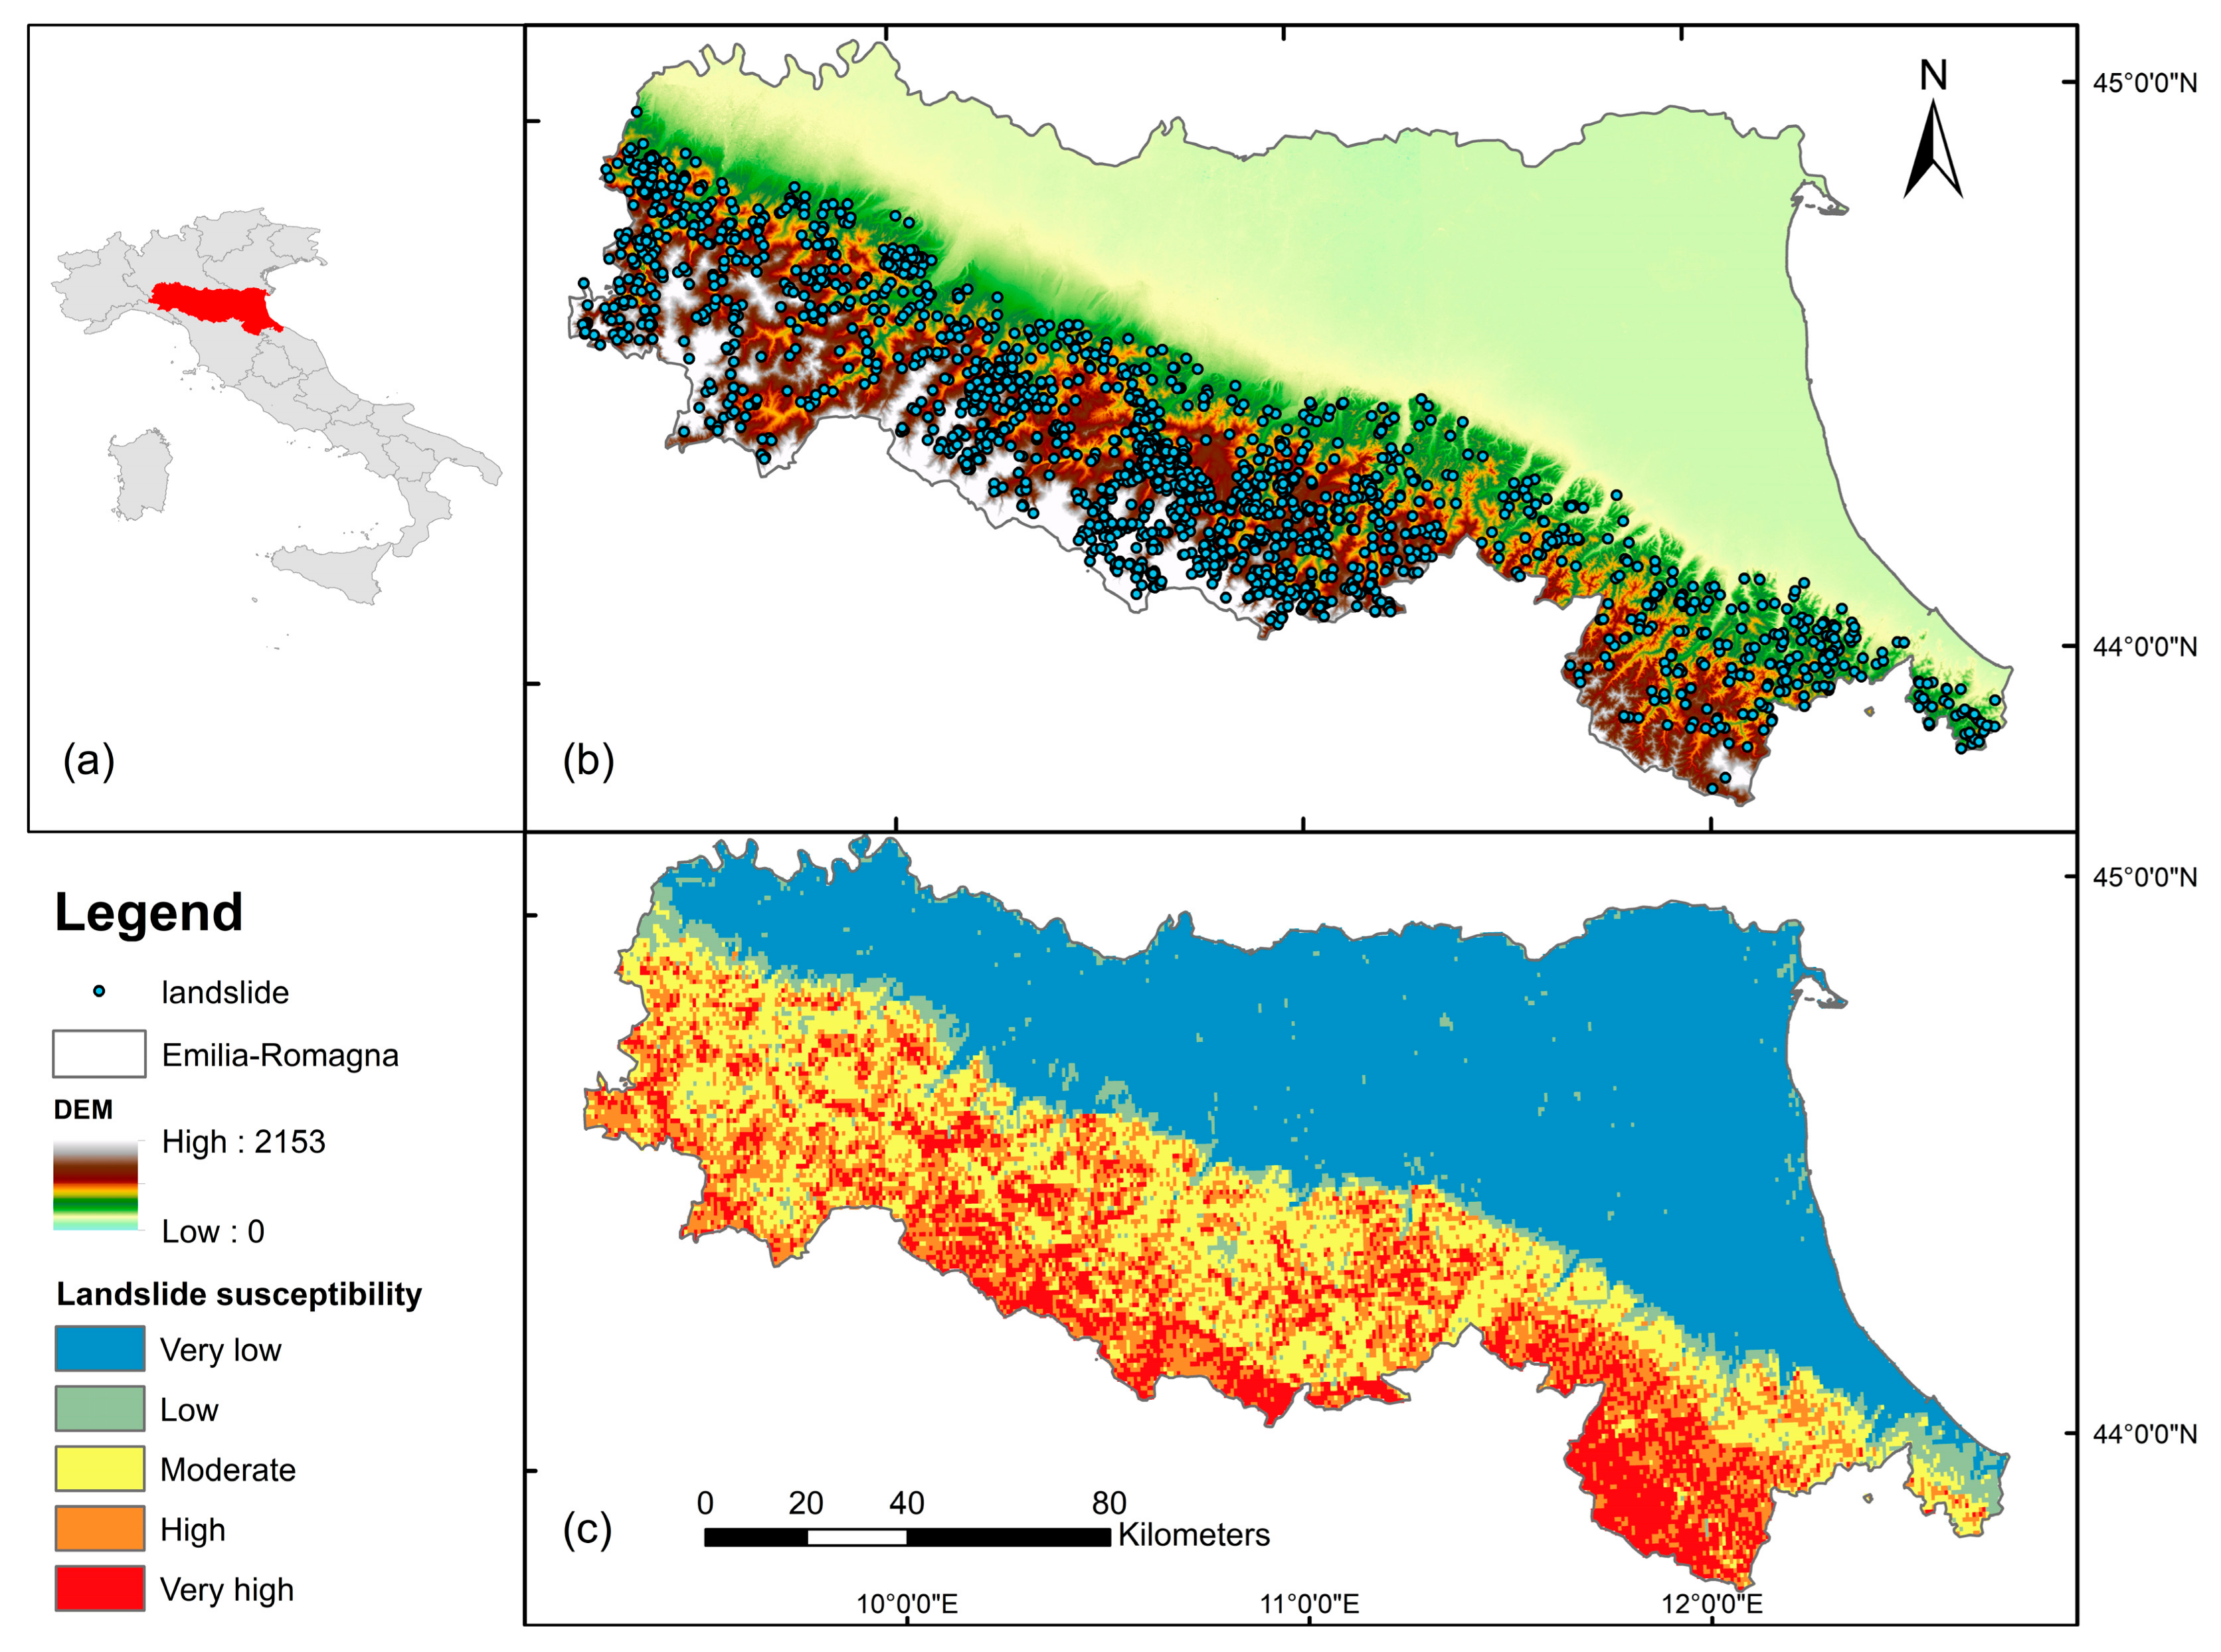
2.1. Study Area

Based on the richness and availability of historical landslide data, this study selects the Emilia-Romagna region in Italy (hereafter referred to as Emilia) as the study area as shown in Figure 1. Emilia is located in northern Italy, with the northern part primarily consisting of plains and the southern and southwestern parts predominantly mountainous, featuring a Mediterranean climate. According to the landslide susceptibility map by Stanley and Kirschbaum [40], the southern mountainous area is particularly prone to a wide variety of landslides, most of which are triggered by rainfall [41]. The northern part of the region is mostly flat and less likely to have landslides. When landslides occur, private and public properties, facilities, and infrastructure are frequently exposed to significant hazards, leading to substantial costs associated with regeneration and remedial works. Berti et al. [42] reported that the cost of such works in Emilia-Romagna reached €130 million over four years from 2008 to 2012. Because of the frequent occurrence of landslides, the region has established a comprehensive landslide monitoring system. The landslide data were collected from Emilia-Romagna Geological Survey, an agency maintaining a catalogue of historical landslides in the Emilia-Romagna region. Currently, this catalogue includes a total of 2062 historical landslide records from 2006 to 2019 (Figure 1). However, most of the landslides in the database are located in relatively flat areas with convenient transportation. There are few records in areas with extreme topographical conditions. Despite this, this catalogue is the most complete and detailed records of landslides in the Emilia-Romagna region [42,43].
The rainfall data used for the study area are sourced from the Emilia Agency for Energy and Environmental Protection, with a total of 150 meteorological stations within the region. Among these, 72 stations are located in the southern mountainous area and provide rainfall records for decades. The continuity of the data facilitates the long-term temporal identification of landslides.

2.2. Multispectral Remote Sensing Imagery Data

Remote sensing-based landslide change detection requires high spatial and temporal resolution of the imagery. Utilizing high-precision, high-temporal resolution global imagery datasets facilitate the extraction of large-scale, long-term landslide events. Currently, the Landsat and Sentinel satellite series cover almost all land areas between 83°N and 83°S latitude, providing rapid access to multispectral remote sensing imagery data for most of the land area in the world. The NDVI index required in this study is the best indicator of vegetation growth status and vegetation cover and is considered an effective measure for monitoring land surface changes at regional or global scales. Its calculation formula involves the near-infrared band and the red band. The resolution of the primary bands (red, green, blue, and near-infrared) in these multispectral images is 30 m for Landsat-8 and 10 m for Sentinel-2, which can reflect the spectral characteristics of small- to medium-sized landslides to a certain extent. Regarding surface cover, clouds, water bodies, and ice/snow have higher reflectance in the visible spectrum than in the near-infrared spectrum, resulting in an NDVI value of less than 0. Rocks and bare soil have similar reflectance in both bands, leading to an NDVI value close to 0. In areas with vegetation cover, the NDVI is greater than 0 and increases as the vegetation density increases. If a landslide occurs, the land cover is expected to change, for example, from grass to bare soil or from forest to rock. Therefore, detecting the change of land cover is an effective way to determine the occurrence of landslides.
The landslide extraction experiment in the Emilia region uses Landsat 8 imagery starting from 2015 and Sentinel-2 imagery starting from 2017, with temporal resolutions of 16 days and 5 days, respectively. The presence of clouds significantly affects multispectral imagery, making cloud removal a critical process in multispectral remote sensing to mitigate cloud interference and enhance data quality. The “QA60” band of Sentinel-2 imagery contains information on clouds and cirrus clouds, while the “QA_PIXEL” band of Landsat-8 imagery includes information on clouds, cirrus clouds, cloud shadows, and snow. These quality bands were utilized in Google Earth Engine (GEE) for cloud-masking functions, thereby reducing or eliminating the impact of these factors on remote sensing imagery [44,45]. After effective screening of the fused dataset, the time interval of the remote sensing imagery dataset is mostly between 10 and 32 days. By integrating the results from Sentinel-2 with those from Landsat-8, the accuracy in terms of the number, area, and timing of the remote sensing landslide event extraction results will be improved, facilitating more precise studies of landslide event identification.

2.3. Soil Moisture Products

In the construction of a hydrometeorological threshold model coupled with remote sensing soil moisture, the choice of remote sensing soil moisture products will directly affect the effectiveness of the model for landslide prediction [46]. With the development of remote sensing technology, satellite-based soil moisture estimates are providing larger number and higher quality of options abundant. Studies have shown that the SMAP L4 product data have good continuity and are generally more suitable for landslide applications compared to other products [47,48]. This study compares three types of SMAP L4 products: the SMAP L4 Enhanced Passive product (SMAP-PE), the SMAP L4 Surface product (SMAP-Sur), and the SMAP L4 Root Zone product (SMAP-RZ). The relevant data involve different remote sensing methods and depths. The detailed parameters of the three products are shown in Table 1.
Considering that shallow landslides typically occur at depths deeper than the uppermost 5 cm, the greater the depth of soil moisture measurement is, the better it can represent the actual hydrologic response that triggers landslides [32]. Therefore, SMAP-RZ data are the most accurate choice for predicting landslides.
In landslide research, soil saturation (Sr) has been used as an indicator of predicting landslide occurrence [49]. Volumetric soil moisture content (θv) refers to the ratio of the volume of water contained in the soil to the total volume of the soil. The relationship among soil saturation rate, volumetric soil moisture content, and maximum volumetric soil moisture content (θv-max) is shown in Equation (1).
S r = θ v θ v - m a x

3. Methods

3.1. Landslide Detection Based on Multisource Remote Sensing Data

In this study, the image regression method is used for landslide change detection. First, it is assumed that there is a linear relationship between the NDVI values of two temporal phases. Using linear regression, the linear expression relationship between the NDVI value (Y) of the latter scene and the NDVI value (X) of the former scene is obtained, as shown in Equation (2). Next, the predicted pixel values (Y_fit) of the latter scene are calculated using the regression function. Then, the predicted values (Y_fit) are subtracted from the original NDVI values (Y) of the latter scene to obtain the regression residual (LR) image for the two temporal phases, as shown in Equation (3). Finally, the change threshold is determined using the appropriate threshold method, thereby extracting the landslide areas [11,50].
Y = a + bX
LR = Y_fit − Y
At this stage, a threshold is set to divide the corresponding area into regions where landslides are likely to occur and regions where they are not. The threshold is primarily determined using statistical methods. Based on the properties of a normal distribution, the mean (μ) and standard deviation (σ) are calculated, and the threshold is set as T = μ ± nσ. According to relevant landslide studies [11], the distribution’s tail of 4.6%(n = 2) is identified as the region where landslides are likely to occur. If the landslide corresponds to a positive change region, the threshold is set as T = μ + 2σ; conversely, if it corresponds to a negative change region, the threshold is set as T = μ − 2σ.
Adjacent candidate landslide pixels form a landslide body, but landslides that are very close may appear discontinuously due to factors such as clouds and cloud shadows, even though they are likely part of the same landslide. To merge nearby landslides and refine their boundary information, a distance threshold can be set. When the boundary distance between landslides is less than this threshold, the landslides are merged. Additionally, in remote sensing change detection, isolated pixels are typically considered as “noise” and should be removed.
After a landslide occurs, the vegetation cover in the landslide area requires a certain amount of time to recover. In this study, if the NDVI value within one month after the landslide is greater than NDVI value during the landslide period (the time interval when the two images used for landslide change detection were taken), the landslide pixel cluster is not considered a landslide and should be removed.

3.2. Determining Landslide Timing Based on Hydrometeorological Thresholds

To extract and identify the timing of rainfall-induced landslide events using a hydrometeorological model, it is necessary to analyze the rainfall that triggers landslides under different soil moisture levels by combining historical landslide data from the study area. Subsequently, hydrometeorological thresholds are established based on the study of hydrometeorological data within the landslide cycle.
The occurrence of rainfall-induced landslides is determined by the combined influence of antecedent soil saturation and antecedent rainfall. As shown in Figure 2, if either cumulative rainfall or soil saturation condition meets the threshold, the landslide is very likely to occur. We compare the hypothetical empirical thresholds in a two-dimensional evaluation space, where the x-axis represents antecedent soil saturation (%) and the y-axis represents recent cumulative rainfall (mm) (Figure 2). Using this method, we screen each day for areas meeting the threshold conditions. If such areas are identified, they need to be compared with the extracted landslides. Within the time interval of the pre- and post-event images corresponding to each extracted landslide, if there is a day when the rainfall or soil saturation meets the threshold and the area corresponding to the threshold covers the landslide, it is considered a rainfall-induced landslide, and this date is the possible occurrence time. If no such conditions are found, it is not considered a rainfall-induced landslide.
However, temporal identification of rainfall-induced landslide events may vary in different scenarios. During a prolonged landslide occurrence period, multiple time intervals or days may meet the conditions for landslide occurrence. The hydrometeorological threshold model may not accurately predict the exact day of occurrence. In such cases, within the preceding n days of the landslide that have rainfall, the day with the highest rain is considered the landslide occurrence day. If there is no rainfall, the day with the highest antecedent soil moisture is determined as the landslide occurrence day.
In this study, 70% of the historical landslide records will be used to establish and calibrate the threshold model, while the remaining 30% will be used to validate the landslide timing identification model. To obtain the optimal hydrometeorological threshold, the calibration of landslide prediction models with different threshold combinations of soil saturation and rainfall will be performed. Within the value range of the relevant data, soil saturation will be iteratively calculated at intervals of 0.5% and short-term pre-landslide rainfall at intervals of 1 mm [51]. According to the optimal values of different accuracy evaluation criteria, one or more hydrometeorological thresholds will be used for model validation to select the best hydrometeorological threshold for extracting rainfall-induced landslide events.

3.3. Model Validation

The confusion matrix classifies the landslide prediction results from hydrometeorological thresholds into three categories: true positive (TP), false positive (FP), and false negative (FN). True positive represents the days when actual landslides were correctly predicted. False positive represents the days when no landslides occurred but were incorrectly predicted. False negative represents the days when landslides occurred but were not correctly predicted. Based on these three categories of landslide prediction results, the true positive rate (TPR), false positive rate (FPR), and Euclidean distance (d) are calculated to evaluate the hydrometeorological threshold model [24,52,53]. A larger TPR and smaller FPR and Euclidean distance indicate that the hydrometeorological threshold model is more effective for landslide prediction. The three evaluation metrics are calculated as follows:
T P R = T P T P + F N × 100 %
F P R = F P F P + T N × 100 %
d = F P R 2 + ( T P R 1 ) 2
The bias of extracting temporal information is analyzed by examining the time error between the identified timing and the historical occurrence of landslides. First, the spatial information of landslides is identified by remote sensing images. Then, for correctly identified landslides in space, the time error between the identified timing by threshold model and the actual occurrence time is further analyzed. For long-term landslide event extraction results, the overall time identification error of landslide events is represented by bias, denoted as n days (n = 1, 2, 3, …, 7). The smaller n means lower identification bias and more accurate temporal identification of landslide events.

4. Results

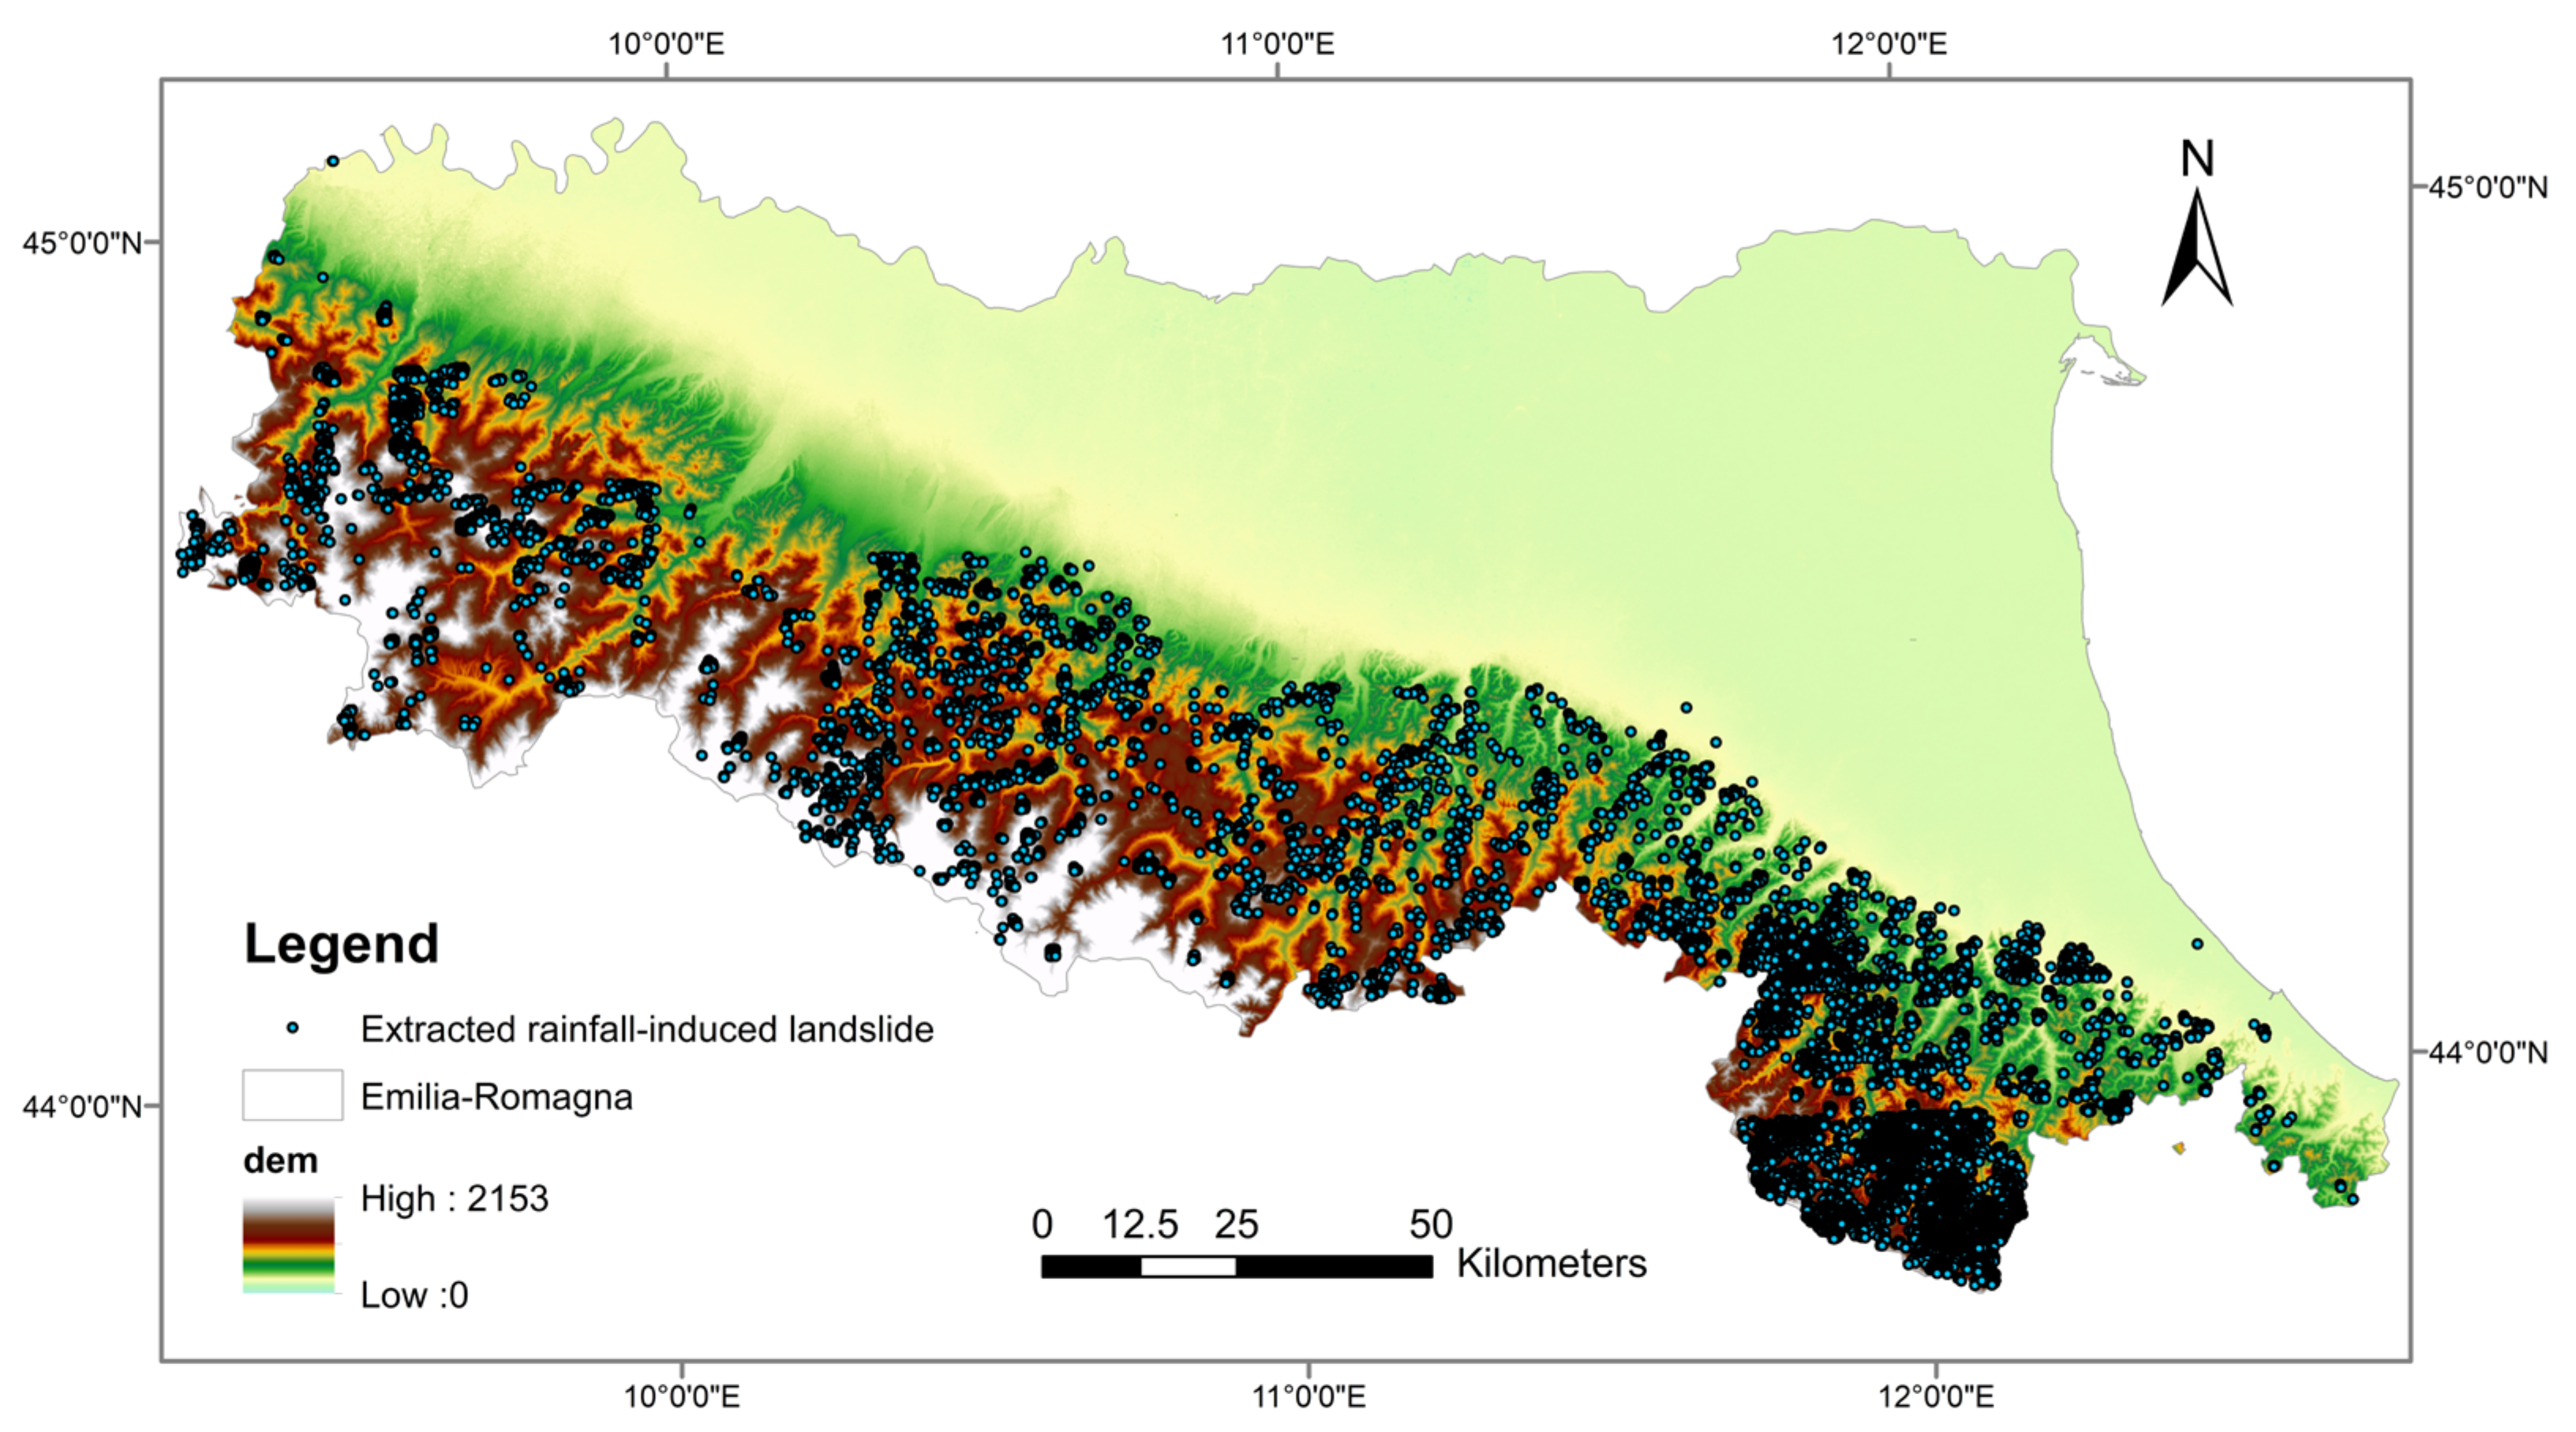
4.1. Identification of Landslide Events and Spatial Distribution

Based on the landslide event spatial location extraction method, this study conducted a long-term extraction of landslide events in the Emilia region from 2016 to 2019. To reduce the interference of seasonal vegetation changes on landslide detection, results with a time interval greater than 60 days were excluded. This approach obtained a time series of landslide events with relatively consistent time intervals. In the Emilia region, a total of 12,783 landslide surfaces were detected using Landsat-8, and 74,683 were detected using Sentinel-2, resulting in a combined total of 84,631 landslide surfaces detected with both datasets. Additionally, 2120 landslide surfaces were detected using both Landsat-8 and Sentinel-2.
The results of remote sensing landslide event extraction using the hydrometeorological threshold model indicate that about 72% of the landslides in the Emilia region from 2016 to 2019 were identified as rainfall-induced landslides. It provides evidence that the primary type of landslide in the region is rainfall induced. Figure 3 shows the monthly distribution of the extracted rainfall-induced landslides, which closely aligns with the monthly distribution of rainfall.
We present the spatial distribution of 16,130 rainfall-induced landslides in Emilia in 2017 in Figure 4, with landslides spread throughout the entire southern mountainous region. It was observed that there is a smaller number of landslides in the southwestern mountainous area. Detailed analysis reveals that the lower number of landslides in this area is primarily due to significant data gaps in the Sentinel-2 imagery (T32TNQ) covering this region. Consequently, the landslide results for this area were mainly extracted from Landsat-8 imagery. This further highlights the decisive role of image resolution and completeness in landslide event extraction results, underscoring the necessity of using multisource remote sensing for landslide event extraction.
An analysis of the slope distribution differences of rainfall-induced landslide events in Emilia shows that the slopes of these events are all above 20°, with most of them distributed between 20° and 30° (Figure 5a). However, this result does not mean that a larger slope (over 40°) is less likely to cause landslide, but the slope in this region is mostly between 20° and 30°. The type of land use for each landslide is determined by calculating the mode of all land use type pixels within the landslide area. The landslides in this region are primarily located in land use types such as grasslands or forests (Figure 5b).

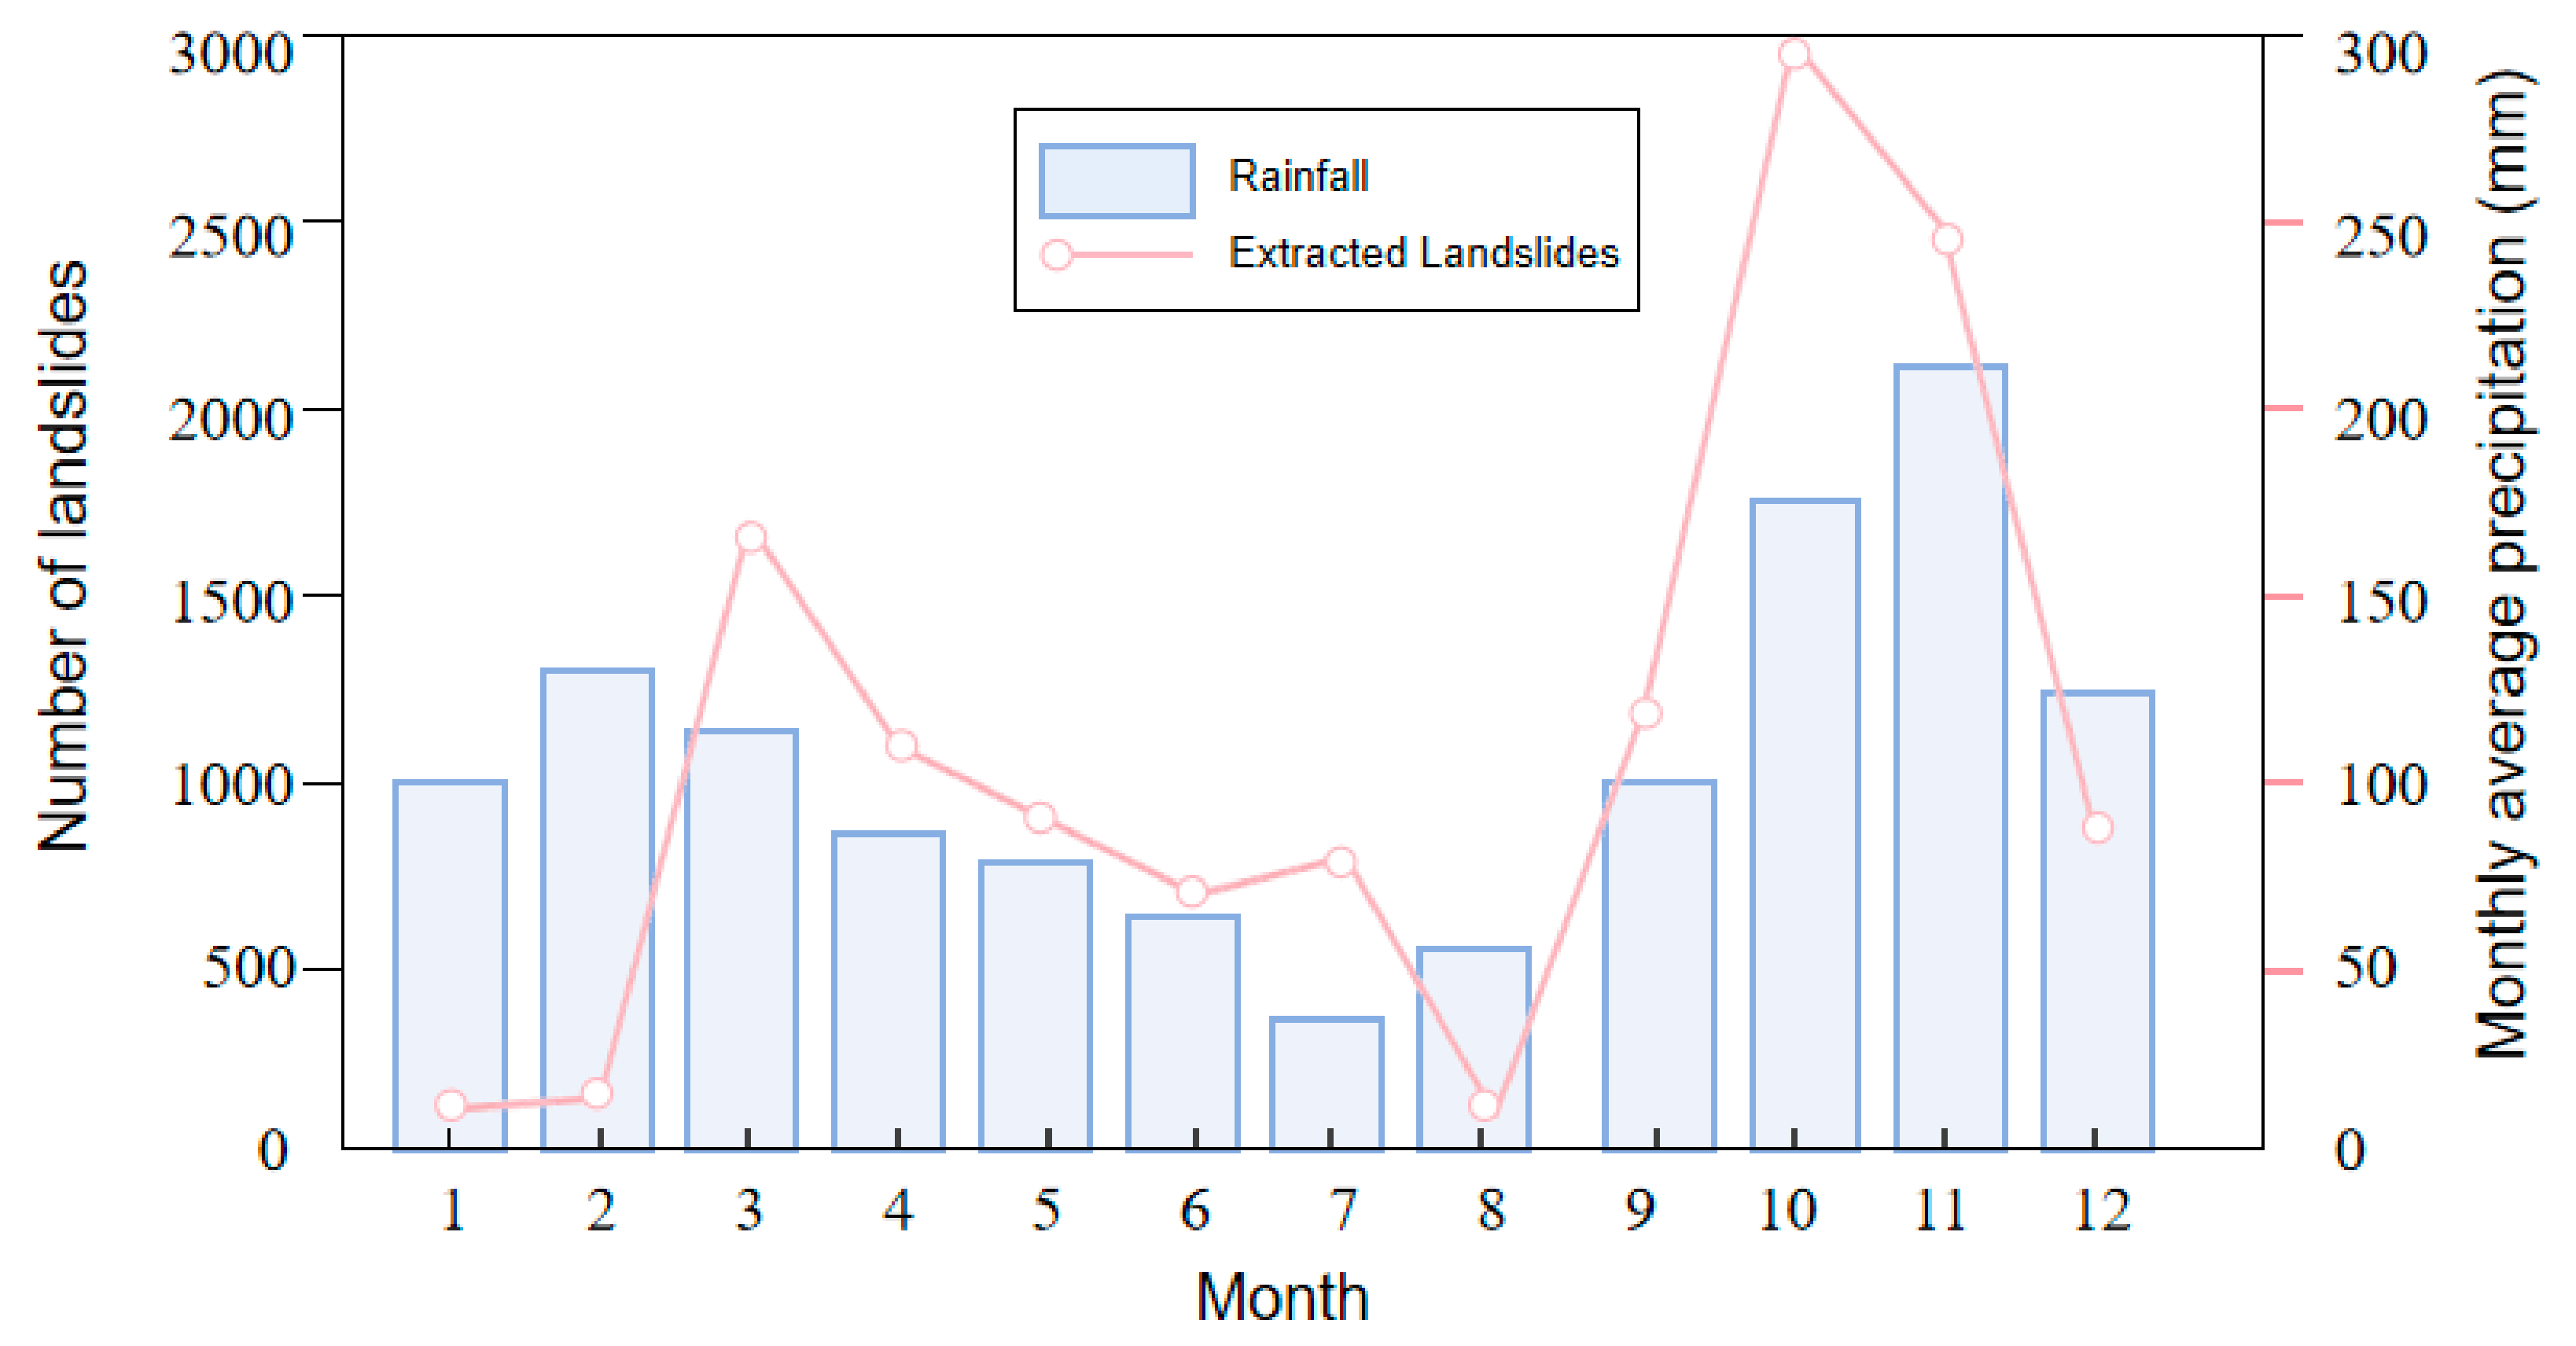
4.2. Temporal Identification of Rainfall-Induced Landslides

Based on daily rainfall data from 72 meteorological stations and SMAP-RZ soil moisture daily data from 2016 to 2019 in the southern Emilia region, this study established a landslide prediction model using hydrometeorological thresholds. Two models of indicators are used for the threshold: Model 1 is the soil saturation of the previous day and recent daily rainfall, and Model 2 is the soil saturation of the recent three-day and the recent three-day cumulative rainfall. Soil saturation values of Model 1 and Model 2 started from a minimum value of 50% and increased at intervals of 0.5% up to a maximum value of 90%. Meanwhile, the daily rainfall of Model 1 started from 0 mm and increased at intervals of 1 mm, reaching up to 35 mm, and the cumulative rainfall of Model 2 started from 5 mm went up to 90 mm. The accuracy evaluation results of historical landslides under the two models of hydrometeorological thresholds were iteratively calculated (see Figure 6). The results indicate that the threshold Model 2 outperforms the other. The hydrometeorological threshold model based on Model 2 can be more effectively applied to the identification and temporal recognition of rainfall-induced landslide events.
Based on data from 2015 to 2017, this study used three indicators, including TPR, FPR and d, to evaluate and select the four optimal threshold combinations. The combinations of soil saturation and rainfall thresholds are: 73.5%—20 mm, 75.5%—19 mm, 75.5%—20 mm, and 78.5%—20 mm. These models were firstly calibrated with 70% of the data as shown in Table 2. These models demonstrated good predictive performance on historical landslide data from 2015 to 2017, with true positive rates exceeding 0.7 and false positive rates below 0.4.
Then, these four threshold combinations were used to establish hydrometeorological threshold models, which were validated using the remaining 30% of data from 2018 to 2019. According to the model validation results (Table 3), the 78.5%—20 mm threshold combination had the highest TPR and the smallest FPR and d, making it the most effective for predicting rainfall-induced landslides. Therefore, the 78.5%—20 mm threshold combination is adopted as the hydrometeorological threshold.
The temporal information of rainfall-induced landslides was extracted based on the above model for the Emilia region, focusing on the period with a frequent occurrence of historical landslides, i.e., from February to March 2018. During this period, the dates and corresponding regions that meeting the hydrometeorological thresholds are shown in Figure 7. However, this may lead to a certain degree of temporal clustering of landslide occurrences due to the temporal resolution of images, resulting in minor discrepancies compared to actual recorded events. The number of slides extracted for each date are shown in Figure 8. Multiple landslide events may be triggered in close temporal proximity due to analogous environmental factors, such as continuous rainfall or peak soil moisture levels. Consequently, the temporal identification results show some landslides occurring on the same day that meet the hydrometeorological threshold model. The analysis of the relationship between daily average rainfall and the number of rainfall-induced landslides, as depicted in our graph, indicates a significant positive correlation. Higher daily average rainfall corresponds to an increased number of landslides. Specifically, when the daily average rainfall exceeds 10 mm, there is a marked increase in the frequency of landslides.

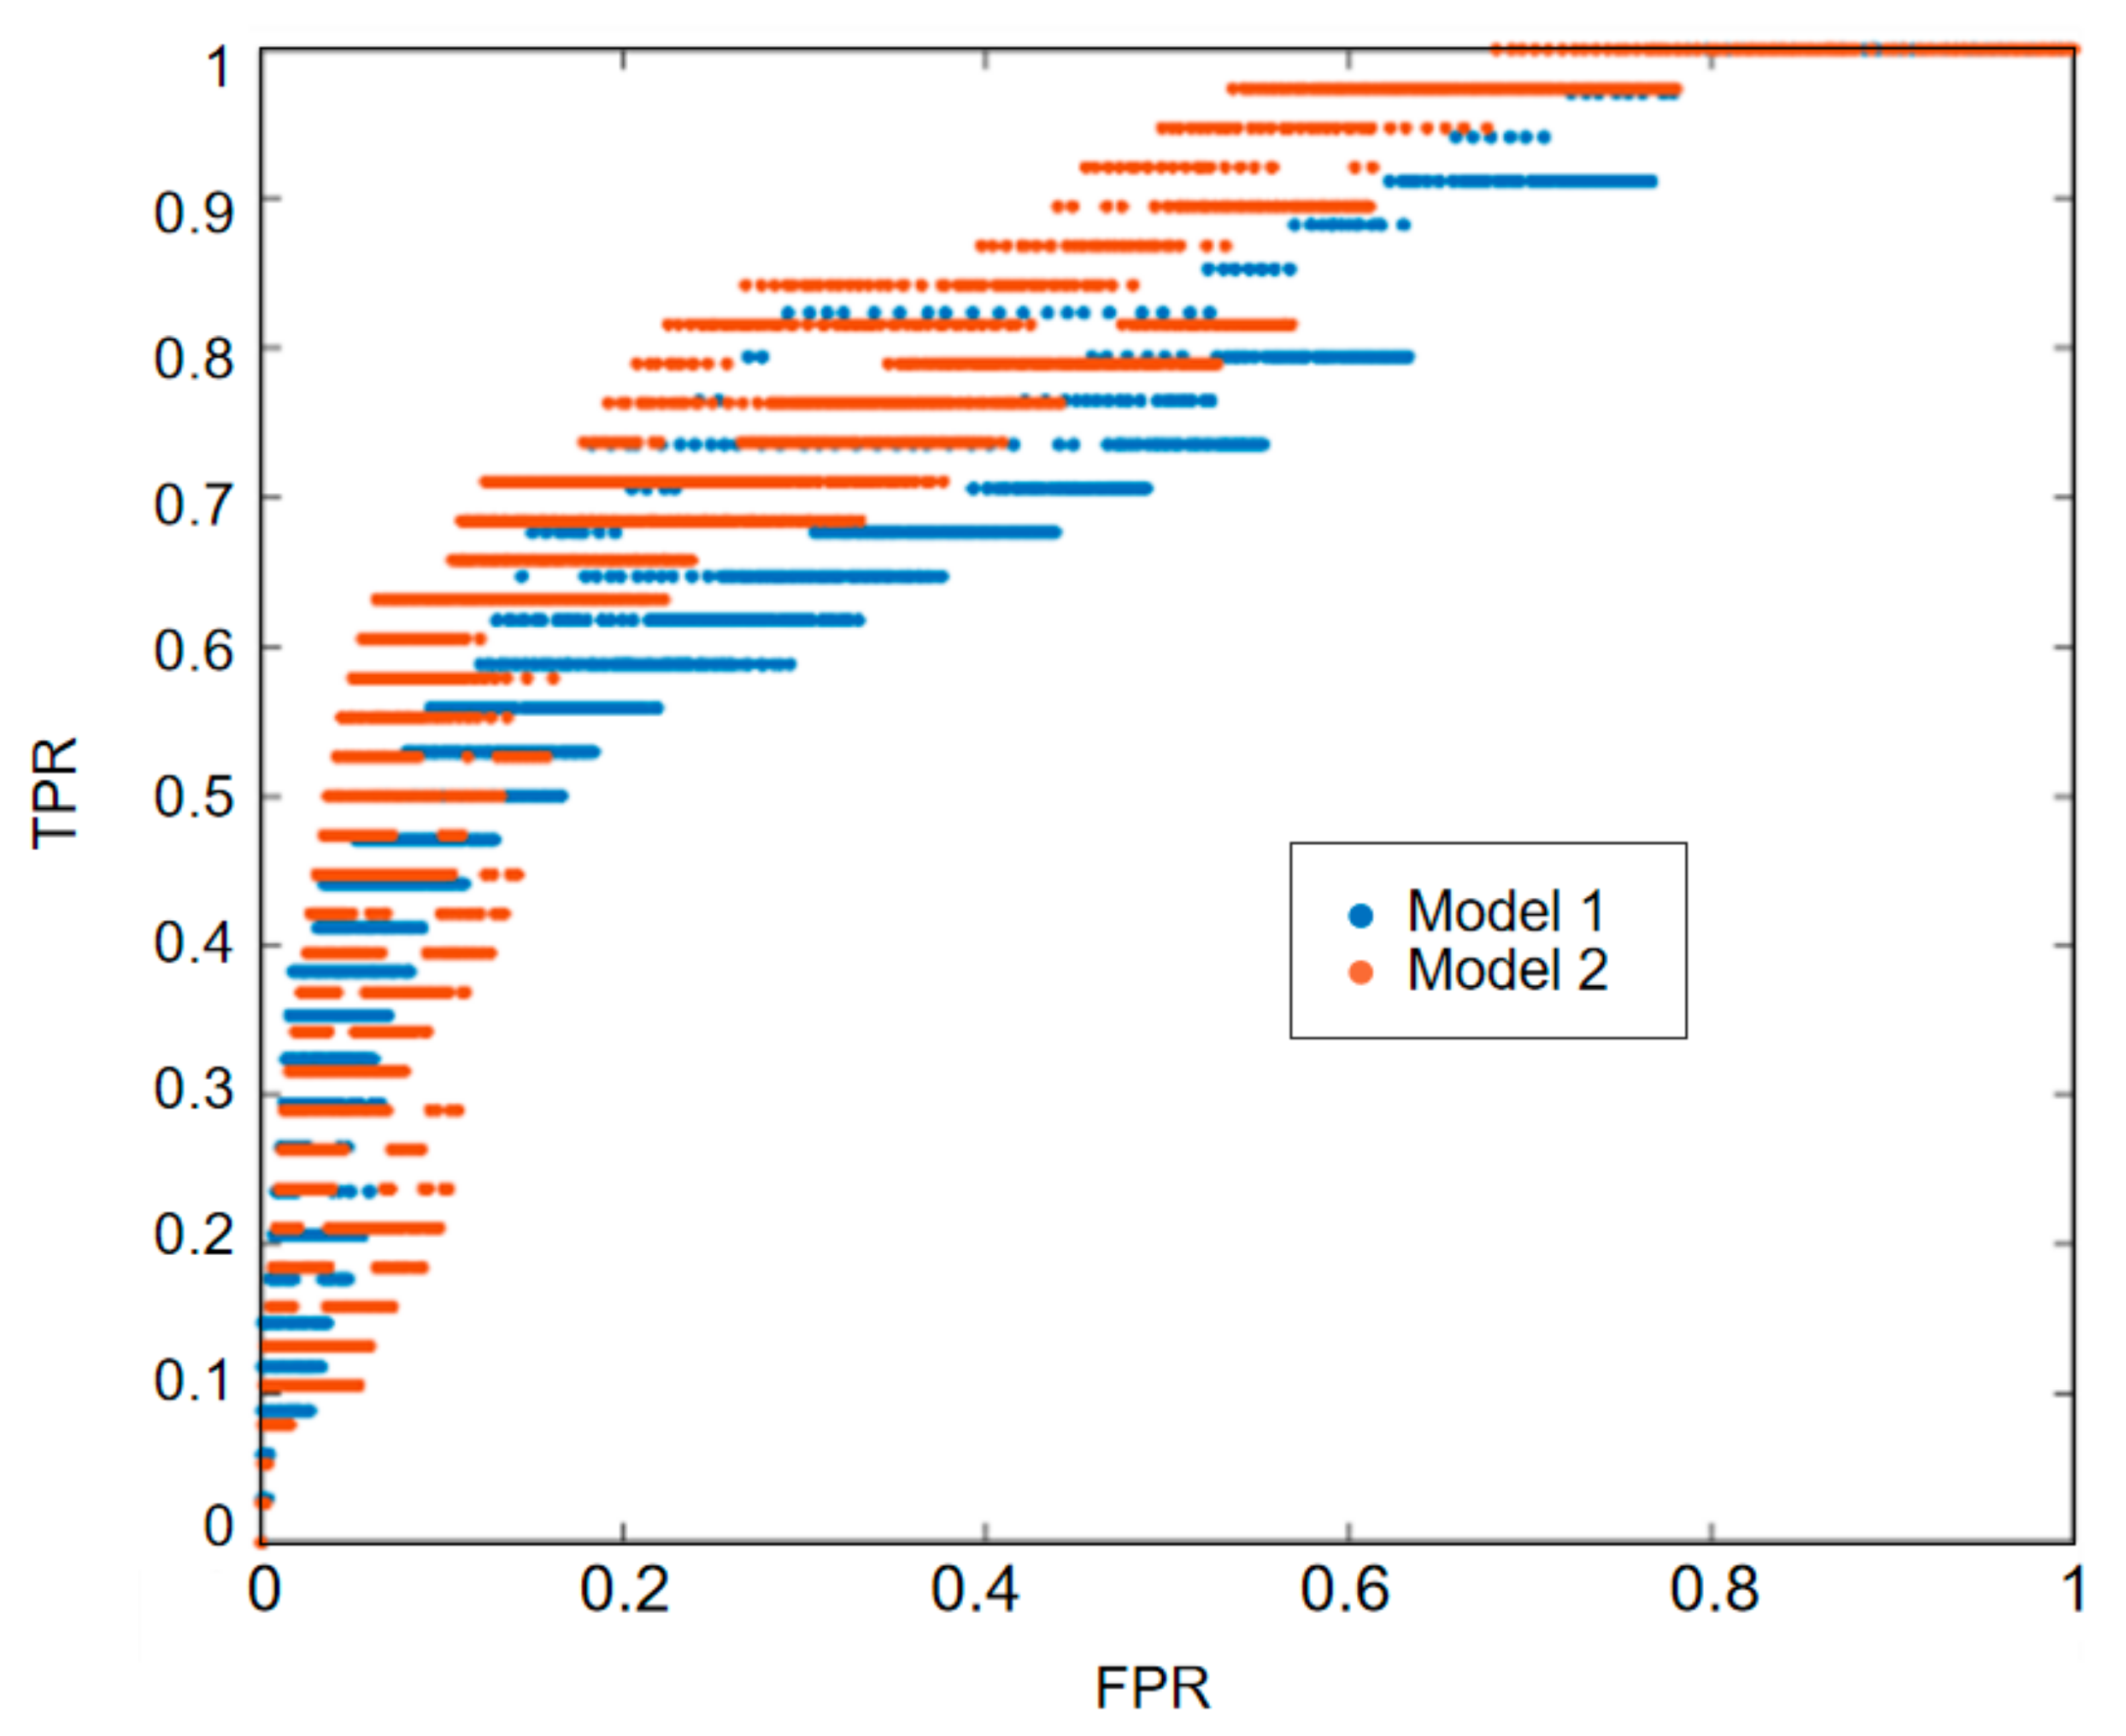
4.3. Accuracy Evaluation

This study calculates the time error between the identified landslides and the recorded landslide occurrence times to evaluate the performance of the temporal identification method based on the hydrometeorological threshold model.
Using the landslide extraction results from February to March 2018 as model validation data, a total of 585 landslide surfaces were extracted within the time frame. The recorded data show that 144 actual landslide events occurred, of which 79 were correctly detected. The number of extracted landslide events exceeds the historical landslide data for three reasons. First, many neighboring landslide events that are likely part of the same landslide were not correctly merged. Second, some historical landslide data were recorded as a single landslide event due to their spatial proximity, causing some extracted landslides to fail to match correctly with the historical records. Third, some historical landslides might not be recorded due to their remote locations or difficult terrain, leading to incomplete data records. For example, in part of experimental area, only three historical landslides were actually recorded, whereas both visual interpretation and remote sensing-based extraction identified more than 30 landslide events.
Based on the hydrometeorological threshold model, all 585 landslide surfaces were identified as rainfall-induced landslides, which aligns with the higher rainfall observed in the region during February and March. For the 79 confirmed rainfall-induced landslides, the specific occurrence times were determined. By comparing these predicted times with historical landslide records, the temporal bias was calculated as shown Figure 9. Specifically, 69 landslides had an accuracy of within seven days, accounting for approximately 87.3% of correctly identified landslides, while 35 landslides were accurately detected with zero-day discrepancy, accounting for approximately 45.6%.
We further plot the time difference of all 79 correctly detected landslides and the corresponding cumulative rainfall in Figure 10. It can be observed that most predicted times is earlier than the recorded time, which aligns with the fact that landslides are often recorded a few days after their actual occurrence. Additionally, by comparing the temporal prediction bias with the cumulative rainfall over the precedent three days, it was found that higher cumulative rainfall corresponds to lower temporal bias. The impact of rainfall on the bias can be understood by observing the exponential term −0.007x in the function. This negative exponential term indicates that as rainfall increases, the bias decreases exponentially. Most of the landslides with a zero-day prediction error had high rainfall in the preceding three days. This not only demonstrates that recent rainfall can effectively serve as an indicator for landslide prediction, but also suggests a certain regularity in the recording of historical landslide data, specifically, that landslides recorded during periods of significant rainfall are more accurately timed.

5. Discussion

We developed an effective approach to extract spatial and temporal information of rainfall-induced landslide based on the multisource remote sensing data from Emilia, Italy. Multisource remote sensing data provide higher temporal resolution of land surface change, allowing improved temporal extraction results. This approach can predict the timing of rainfall-induced landslides, improve the temporal resolution of landslide event extraction and achieve refined extraction of rainfall-induced landslide events. Using multisource remote sensing data, our method, based on hydrometeorological thresholds, offers a simple and promising approach to determine the timing and location of rainfall-induced landslides, especially in regions with insufficient recorded data. While deep learning methods and probability theories [54,55] presented higher model accuracy, but these models often require extensive data and computational resources. This complexity might not be suitable for regional landslide studies where resources are limited.
Although the landslide data used in this study are relatively reliable among the currently available datasets, the limitations of manual landslide monitoring mechanisms make it difficult to ensure data completeness and accuracy. Data deficiencies may affect the effectiveness of related models and methods. Our study is based on the abundant data from local official landslide datasets, which have higher accuracy of the records. The Global Landslide Catalogue is a good alternative data source for regions with limited records. We are not using this dataset is because of significant gaps in coverage for our study area, which could undermine the reliability of our predictions. The soil moisture data used in this study has a relatively coarse spatial resolution. However, it has been demonstrated to be a reliable option for conducting landslide research over large areas [47,48]. Future studies would benefit from using higher resolution soil moisture data, which could improve the precision of predictions.
Meanwhile, although NDVI is currently one of the most effective indicators for detecting landslide changes, it is based on changes in surface vegetation cover. In areas with low or no vegetation cover (such as bare soil landslides and landslides caused by glacier melting), it is difficult to detect landslide occurrences. Therefore, future research is recommended to consider supplementing the study with landslide change detection indicators for areas with unclear vegetation information to improve the accuracy of landslide time extraction.
This study provides a rapid and effective means of extracting landslide temporal information. However, one limitation is that the parameters we optimized are specific to the Emilia-Romagna region. For broader application, these parameters may need adjustment, incorporating new predictors and more precise data to enhance the model’s applicability. During long landslide periods with large image intervals, multiple time intervals or days may meet the landslide occurrence conditions. To address the centralization phenomenon in the temporal recognition of landslide events and improve the model’s robustness, future research could introduce more geographic parameters, such as surface temperature and vegetation cover changes, to enhance its overall applicability and accuracy.
Currently, only very limited regions over the world have records on landslides. However, with the increase in extreme events due to climate change and human activities, it is highly possible to expect more landslides in the future. Therefore, establishing a historical database is crucial for risk management and prevent. The proposed approaches can be potential applied in different regions globally and hopefully more comprehensive studies will be performed in the future.

6. Conclusions

This study conducted research on the extraction and temporal identification of rainfall-induced landslide events using multisource remote sensing data. First, a regional-scale automated landslide event spatial extraction algorithm was established. Second, using historical landslide data and relevant hydrometeorological data, a hydrometeorological threshold model was developed for the identification and temporal recognition of rainfall-induced landslide events. Taking the Emilia-Romagna region in Italy as the study area, the main conclusions of this study are as follows:
  • We proposed an automated algorithm to extract spatial information of landslide events based on multisource remote sensing data. First, this approach optimizes the spatial information extraction method for remote sensing landslide events. Utilizing a bi-temporal NDVI change detection method, it considers both the quantity and area accuracy of landslide event extraction. Then, a regional-scale automated algorithm for extracting spatial information of landslide events was designed on the GEE platform, enabling rapid extraction of landslide event spatial information on a regional scale.
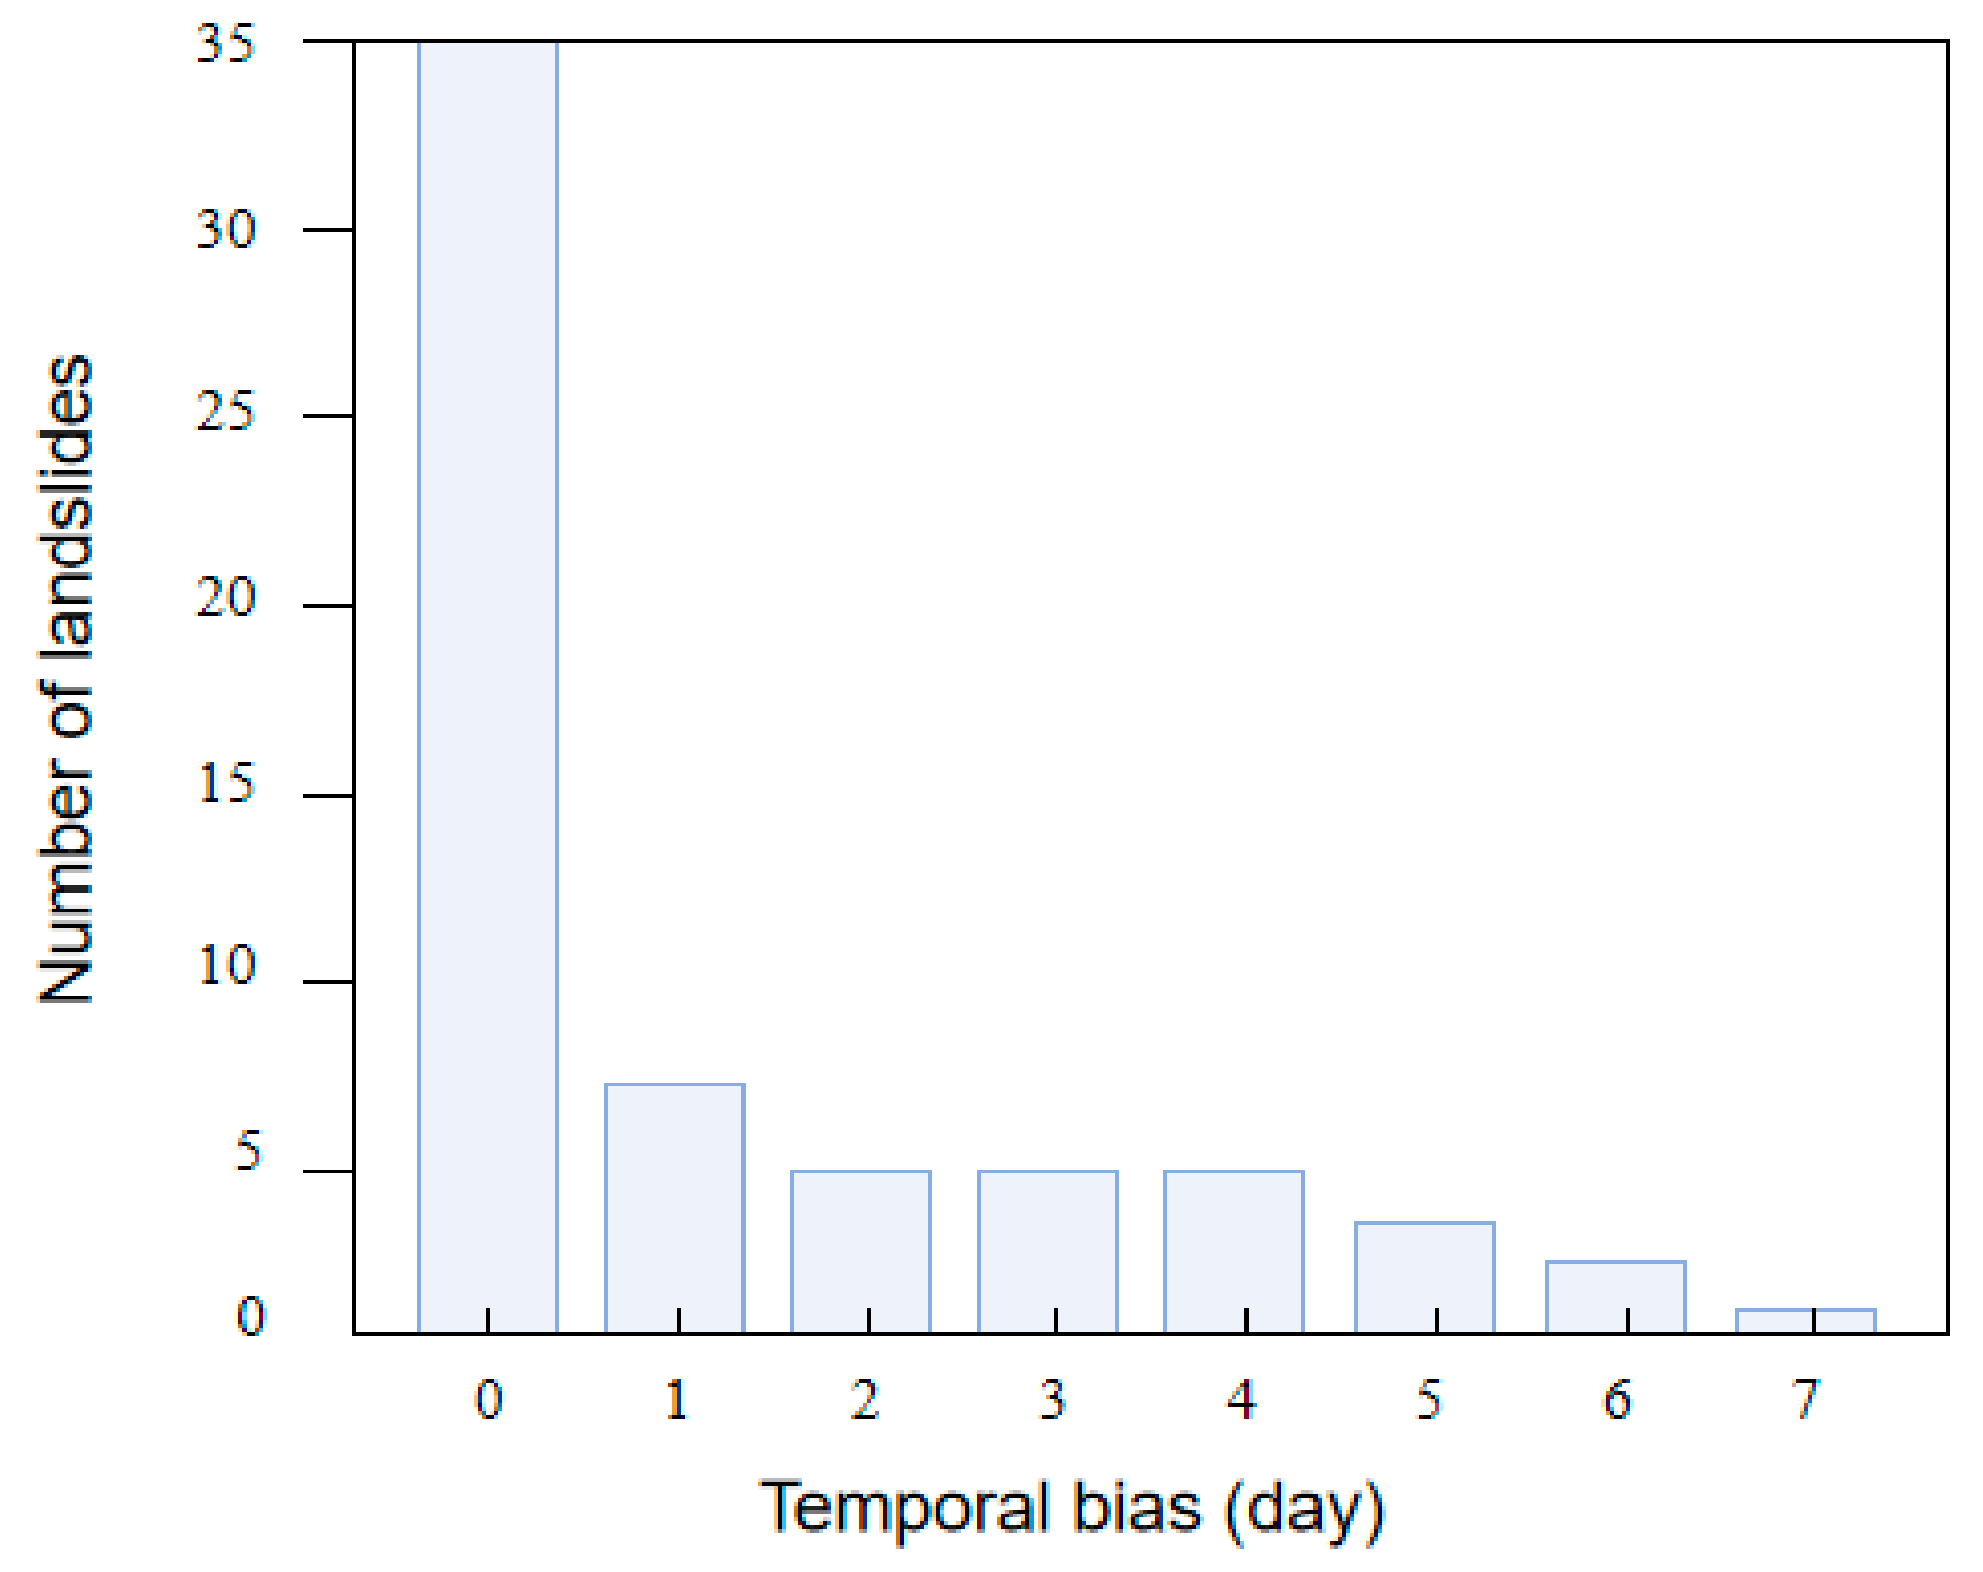
  • We identified temporal information of rainfall-induced landslide events based on hydrometeorological thresholds. First, a hydrometeorological threshold model was developed considering the antecedent soil saturation and recent rainfall, making it effective for landslide prediction. Second, using this method to classify and temporally identify landslide events extracted from remote sensing, 87.3% of the temporal information recognition errors are noted within 7 days. The temporal identification accuracy of regional rainfall-induced landslide events was enhanced. This demonstrates that the method can establish spatiotemporal information of landslides for areas without recorded landslide data.

Author Contributions

Conceptualization, J.Z.; data curation, T.Z.; formal analysis, T.Z. and Y.C.; methodology, S.Z.; software, T.Z. and Y.C.; writing—original draft, T.Z.; writing—review and editing, J.Z. and S.Z. All authors have read and agreed to the published version of the manuscript.

Funding

This research is funded by the National Natural Science Foundation of China (No. 42201020, No. 42371409) and the Natural Science Research of Jiangsu Higher Education Institutions of China (No. 22KJB170002).

Data Availability Statement

Data available upon request.

Conflicts of Interest

The authors declare no conflicts of interest.

References

  1. Bingli, H.; Lijun, S.; Chonglei, Z.; Bo, Z.; Qijun, X. Mobility Characteristics of Rainfall-Triggered Shallow Landslides in a Forest Area in Mengdong, China. Landslides 2024, 21, 2101–2117. [Google Scholar] [CrossRef]
  2. Pradhan, B.; Youssef, A.M. Manifestation of Remote Sensing Data and GIS on Landslide Hazard Analysis Using Spatial-Based Statistical Models. Arab. J. Geosci. 2010, 3, 319–326. [Google Scholar] [CrossRef]
  3. Bessette-Kirton, E.K.; Coe, J.A.; Schulz, W.H.; Cerovski-Darriau, C.; Einbund, M.M. Mobility Characteristics of Debris Slides and Flows Triggered by Hurricane Maria in Puerto Rico. Landslides 2020, 17, 2795–2809. [Google Scholar] [CrossRef]
  4. Qin, M.; Cui, P.; Jiang, Y.; Guo, J.; Zhang, G.; Ramzan, M. Occurrence of Shallow Landslides Triggered by Increased Hydraulic Conductivity Due to Tree Roots. Landslides 2022, 19, 2593–2604. [Google Scholar] [CrossRef]
  5. Joyce, K.E.; Belliss, S.E.; Samsonov, S.V.; McNeill, S.J.; Glassey, P.J. A Review of the Status of Satellite Remote Sensing and Image Processing Techniques for Mapping Natural Hazards and Disasters. Prog. Phys. Geogr. Earth Environ. 2009, 33, 183–207. [Google Scholar] [CrossRef]
  6. Huang, Q.; Wang, C.; Meng, Y.; Chen, J.; Yue, A. Landslide Monitoring Using Change Detection in Multitemporal Optical Imagery. IEEE Geosci. Remote Sens. Lett. 2020, 17, 312–316. [Google Scholar] [CrossRef]
  7. Lin, W.-T.; Chou, W.-C.; Lin, C.-Y.; Huang, P.-H.; Tsai, J.-S. Vegetation Recovery Monitoring and Assessment at Landslides Caused by Earthquake in Central Taiwan. For. Ecol. Manag. 2005, 210, 55–66. [Google Scholar] [CrossRef]
  8. Miura, T.; Nagai, S. Landslide Detection with Himawari-8 Geostationary Satellite Data: A Case Study of a Torrential Rain Event in Kyushu, Japan. Remote Sens. 2020, 12, 1734. [Google Scholar] [CrossRef]
  9. Sajadi, P.; Sang, Y.-F.; Gholamnia, M.; Bonafoni, S.; Brocca, L.; Pradhan, B.; Singh, A. Performance Evaluation of Long NDVI Timeseries from AVHRR, MODIS and Landsat Sensors over Landslide-Prone Locations in Qinghai-Tibetan Plateau. Remote Sens. 2021, 13, 3172. [Google Scholar] [CrossRef]
  10. Yang, W.; Wang, M.; Shi, P. Using MODIS NDVI Time Series to Identify Geographic Patterns of Landslides in Vegetated Regions. IEEE Geosci. Remote Sens. Lett. 2013, 10, 707–710. [Google Scholar] [CrossRef]
  11. Ramos-Bernal, R.; Vázquez-Jiménez, R.; Romero-Calcerrada, R.; Arrogante-Funes, P.; Novillo, C. Evaluation of Unsupervised Change Detection Methods Applied to Landslide Inventory Mapping Using ASTER Imagery. Remote Sens. 2018, 10, 1987. [Google Scholar] [CrossRef]
  12. Plank, S.; Twele, A.; Martinis, S. Landslide Mapping in Vegetated Areas Using Change Detection Based on Optical and Polarimetric SAR Data. Remote Sens. 2016, 8, 307. [Google Scholar] [CrossRef]
  13. Wen, T.-H.; Teo, T.-A. LANDSLIDE INVENTORY MAPPING FROM LANDSAT-8 NDVI TIME SERIES USING ADAPTIVE LANDSLIDE INTERVAL DETECTION. ISPRS Ann. Photogramm. Remote Sens. Spat. Inf. Sci. 2022, V-3–2022, 557–562. [Google Scholar] [CrossRef]
  14. Burrows, K.; Marc, O.; Andermann, C. Retrieval of Monsoon Landslide Timings with Sentinel-1 Reveals the Effects of Earthquakes and Extreme Rainfall. Geophys. Res. Lett. 2023, 50, e2023GL104720. [Google Scholar] [CrossRef]
  15. Illien, L.; Andermann, C.; Sens-Schönfelder, C.; Cook, K.L.; Baidya, K.P.; Adhikari, L.B.; Hovius, N. Subsurface Moisture Regulates Himalayan Groundwater Storage and Discharge. AGU Adv. 2021, 2, e2021AV000398. [Google Scholar] [CrossRef]
  16. Jones, J.N.; Boulton, S.J.; Stokes, M.; Bennett, G.L.; Whitworth, M.R.Z. 30-Year Record of Himalaya Mass-Wasting Reveals Landscape Perturbations by Extreme Events. Nat. Commun. 2021, 12, 6701. [Google Scholar] [CrossRef] [PubMed]
  17. Marc, O.; Sens-Schönfelder, C.; Illien, L.; Meunier, P.; Hobiger, M.; Sawazaki, K.; Rault, C.; Hovius, N. Toward Using Seismic Interferometry to Quantify Landscape Mechanical Variations after Earthquakes. Bull. Seismol. Soc. Am. 2021, 111, 1631–1649. [Google Scholar] [CrossRef]
  18. Ngandam Mfondoum, A.H.; Wokwenmendam Nguet, P.; Mefire Mfondoum, J.V.; Tchindjang, M.; Hakdaoui, S.; Cooper, R.; Gbetkom, P.G.; Penaye, J.; Bekoa, A.; Moudioh, C. Adapting Sudden Landslide Identification Product (SLIP) and Detecting Real-Time Increased Precipitation (DRIP) Algorithms to Map Rainfall-Triggered Landslides in Western Cameroon Highlands (Central-Africa). Geoenviron. Disasters 2021, 8, 17. [Google Scholar] [CrossRef]
  19. Maturidi, A.M.A.M.; Kasim, N.; Taib, K.A.; Azahar, W.N.A.W. Rainfall-Induced Landslide Thresholds Development by Considering Different Rainfall Parameters: A Review. J. Ecol. Eng. 2021, 22, 85–97. [Google Scholar] [CrossRef]
  20. Brunetti, M.T.; Peruccacci, S.; Rossi, M.; Luciani, S.; Valigi, D.; Guzzetti, F. Rainfall Thresholds for the Possible Occurrence of Landslides in Italy. Nat. Hazards Earth Syst. Sci. 2010, 10, 447–458. [Google Scholar] [CrossRef]
  21. Aleotti, P. A Warning System for Rainfall-Induced Shallow Failures. Eng. Geol. 2004, 73, 247–265. [Google Scholar] [CrossRef]
  22. Dahal, R.K.; Hasegawa, S. Representative Rainfall Thresholds for Landslides in the Nepal Himalaya. Geomorphology 2008, 100, 429–443. [Google Scholar] [CrossRef]
  23. Melillo, M.; Brunetti, M.T.; Peruccacci, S.; Gariano, S.L.; Roccati, A.; Guzzetti, F. A Tool for the Automatic Calculation of Rainfall Thresholds for Landslide Occurrence. Environ. Model. Softw. 2018, 105, 230–243. [Google Scholar] [CrossRef]
  24. Lin, M.L.; Jeng, F.S. Characteristics of Hazards Induced by Extremely Heavy Rainfall in Central Taiwan—Typhoon Herb. Eng. Geol. 2000, 58, 191–207. [Google Scholar] [CrossRef]
  25. Segoni, S.; Piciullo, L.; Gariano, S.L. A Review of the Recent Literature on Rainfall Thresholds for Landslide Occurrence. Landslides 2018, 15, 1483–1501. [Google Scholar] [CrossRef]
  26. Rosi, A.; Peternel, T.; Jemec-Auflič, M.; Komac, M.; Segoni, S.; Casagli, N. Rainfall Thresholds for Rainfall-Induced Landslides in Slovenia. Landslides 2016, 13, 1571–1577. [Google Scholar] [CrossRef]
  27. Piciullo, L.; Calvello, M.; Cepeda, J.M. Territorial Early Warning Systems for Rainfall-Induced Landslides. Earth-Sci. Rev. 2018, 179, 228–247. [Google Scholar] [CrossRef]
  28. Melillo, M.; Brunetti, M.T.; Peruccacci, S.; Gariano, S.L.; Guzzetti, F. An Algorithm for the Objective Reconstruction of Rainfall Events Responsible for Landslides. Landslides 2015, 12, 311–320. [Google Scholar] [CrossRef]
  29. Huang, F.; Chen, J.; Liu, W.; Huang, J.; Hong, H.; Chen, W. Regional Rainfall-Induced Landslide Hazard Warning Based on Landslide Susceptibility Mapping and a Critical Rainfall Threshold. Geomorphology 2022, 408, 108236. [Google Scholar] [CrossRef]
  30. Handwerger, A.L.; Huang, M.-H.; Fielding, E.J.; Booth, A.M.; Bürgmann, R. A Shift from Drought to Extreme Rainfall Drives a Stable Landslide to Catastrophic Failure. Sci. Rep. 2019, 9, 1569. [Google Scholar] [CrossRef]
  31. Zhuo, L.; Dai, Q.; Han, D.; Chen, N.; Zhao, B.; Berti, M. Evaluation of Remotely Sensed Soil Moisture for Landslide Hazard Assessment. IEEE J. Sel. Top. Appl. Earth Obs. Remote Sens. 2019, 12, 162–173. [Google Scholar] [CrossRef]
  32. Marino, P.; Peres, D.J.; Cancelliere, A.; Greco, R.; Bogaard, T.A. Soil Moisture Information Can Improve Shallow Landslide Forecasting Using the Hydrometeorological Threshold Approach. Landslides 2020, 17, 2041–2054. [Google Scholar] [CrossRef]
  33. Fusco, F.; Bordoni, M.; Tufano, R.; Vivaldi, V.; Meisina, C.; Valentino, R.; Bittelli, M.; De Vita, P. Hydrological Regimes in Different Slope Environments and Implications on Rainfall Thresholds Triggering Shallow Landslides. Nat. Hazards 2022, 114, 907–939. [Google Scholar] [CrossRef]
  34. Palau, R.M.; Berenguer, M.; Hürlimann, M.; Sempere-Torres, D. Implementation of Hydrometeorological Thresholds for Regional Landslide Warning in Catalonia (NE Spain). Landslides 2023, 20, 2039–2054. [Google Scholar] [CrossRef]
  35. Zhao, B.; Dai, Q.; Han, D.; Dai, H.; Mao, J.; Zhuo, L. Probabilistic Thresholds for Landslides Warning by Integrating Soil Moisture Conditions with Rainfall Thresholds. J. Hydrol. 2019, 574, 276–287. [Google Scholar] [CrossRef]
  36. Brigandì, G.; Aronica, G.T.; Bonaccorso, B.; Gueli, R.; Basile, G. Flood and Landslide Warning Based on Rainfall Thresholds and Soil Moisture Indexes: The HEWS (Hydrohazards Early Warning System) for Sicily. Adv. Geosci. 2017, 44, 79–88. [Google Scholar] [CrossRef]
  37. Valenzuela, P.; Domínguez-Cuesta, M.J.; Mora García, M.A.; Jiménez-Sánchez, M. Rainfall Thresholds for the Triggering of Landslides Considering Previous Soil Moisture Conditions (Asturias, NW Spain). Landslides 2018, 15, 273–282. [Google Scholar] [CrossRef]
  38. Wicki, A.; Lehmann, P.; Hauck, C.; Seneviratne, S.I.; Waldner, P.; Stähli, M. Assessing the Potential of Soil Moisture Measurements for Regional Landslide Early Warning. Landslides 2020, 17, 1881–1896. [Google Scholar] [CrossRef]
  39. Bezak, N.; Jemec Auflič, M.; Mikoš, M. Reanalysis of Soil Moisture Used for Rainfall Thresholds for Rainfall-Induced Landslides: The Italian Case Study. Water 2021, 13, 1977. [Google Scholar] [CrossRef]
  40. Stanley, T.; Kirschbaum, D.B. A Heuristic Approach to Global Landslide Susceptibility Mapping. Nat. Hazards 2017, 87, 145–164. [Google Scholar] [CrossRef]
  41. Martelloni, G.; Segoni, S.; Fanti, R.; Catani, F. Rainfall Thresholds for the Forecasting of Landslide Occurrence at Regional Scale. Landslides 2012, 9, 485–495. [Google Scholar] [CrossRef]
  42. Berti, M.; Martina, M.L.V.; Franceschini, S.; Pignone, S.; Simoni, A.; Pizziolo, M. Probabilistic Rainfall Thresholds for Landslide Occurrence Using a Bayesian Approach. J. Geophys. Res. Earth Surf. 2012, 117, F04006. [Google Scholar] [CrossRef]
  43. Rossi, M.; Witt, A.; Guzzetti, F.; Malamud, B.D.; Peruccacci, S. Analysis of Historical Landslide Time Series in the Emilia-Romagna Region, Northern Italy. Earth Surf. Process. Landf. 2010, 35, 1123–1137. [Google Scholar] [CrossRef]
  44. Peters, S.; Liu, J.; Keppel, G.; Wendleder, A.; Xu, P. Detecting Coseismic Landslides in GEE Using Machine Learning Algorithms on Combined Optical and Radar Imagery. Remote Sens. 2024, 16, 1722. [Google Scholar] [CrossRef]
  45. Prasetya, H.N.E.; Aditama, T.; Sastrawiguna, G.I.; Rizqi, A.F.; Zamroni, A. Analytical Landslides Prone Area by Using Sentinel-2 Satellite Imagery and Geological Data in Google Earth Engine (a Case Study of Cinomati Street, Bantul Regency, Daerah Istimewa Yogyakarta Province, Indonesia). In IOP Conference Series: Earth and Environmental Science; IOP Publishing: Bristol, UK, 2021; Volume 782, p. 022025. [Google Scholar] [CrossRef]
  46. Wicki, A.; Jansson, P.-E.; Lehmann, P.; Hauck, C.; Stähli, M. Simulated or Measured Soil Moisture: Which One Is Adding More Value to Regional Landslide Early Warning? Hydrol. Earth Syst. Sci. 2021, 25, 4585–4610. [Google Scholar] [CrossRef]
  47. Thomas, M.A.; Collins, B.D.; Mirus, B.B. Assessing the Feasibility of Satellite-Based Thresholds for Hydrologically Driven Landsliding. Water Resour. Res. 2019, 55, 9006–9023. [Google Scholar] [CrossRef]
  48. Zhao, B.; Dai, Q.; Zhuo, L.; Zhu, S.; Shen, Q.; Han, D. Assessing the Potential of Different Satellite Soil Moisture Products in Landslide Hazard Assessment. Remote Sens. Environ. 2021, 264, 112583. [Google Scholar] [CrossRef]
  49. Mirus, B.B.; Becker, R.E.; Baum, R.L.; Smith, J.B. Integrating Real-Time Subsurface Hydrologic Monitoring with Empirical Rainfall Thresholds to Improve Landslide Early Warning. Landslides 2018, 15, 1909–1919. [Google Scholar] [CrossRef]
  50. Ridd, M.K.; Liu, J. A Comparison of Four Algorithms for Change Detection in an Urban Environment. Remote Sens. Environ. 1998, 63, 95–100. [Google Scholar] [CrossRef]
  51. Tsai, T.-L.; Chen, H.-F. Effects of Degree of Saturation on Shallow Landslides Triggered by Rainfall. Environ. Earth Sci. 2010, 59, 1285–1295. [Google Scholar] [CrossRef]
  52. Draper, C.S.; Walker, J.P.; Steinle, P.J.; de Jeu, R.A.M.; Holmes, T.R.H. An Evaluation of AMSR–E Derived Soil Moisture over Australia. Remote Sens. Environ. 2009, 113, 703–710. [Google Scholar] [CrossRef]
  53. Prakash, N.; Manconi, A.; Loew, S. Mapping Landslides on EO Data: Performance of Deep Learning Models vs. Traditional Machine Learning Models. Remote Sens. 2020, 12, 346. [Google Scholar] [CrossRef]
  54. Maragaño-Carmona, G.; Fustos Toribio, I.J.; Descote, P.-Y.; Robledo, L.F.; Villalobos, D.; Gatica, G. Rainfall-Induced Landslide Assessment under Different Precipitation Thresholds Using Remote Sensing Data: A Central Andes Case. Water 2023, 15, 2514. [Google Scholar] [CrossRef]
  55. Mondini, A.C.; Guzzetti, F.; Melillo, M. Deep Learning Forecast of Rainfall-Induced Shallow Landslides. Nat. Commun. 2023, 14, 2466. [Google Scholar] [CrossRef]
Figure 1. Overview of the study area and the distribution of recorded landslide data: (a) Location of the study area within Italy; (b) Distribution of recorded landslides along with the latitude and longitude grid within the study area; (c) Landslide susceptibility map of the study area, derived from the global landslide hazard dataset [40].
Remotesensing 16 03089 g001
Figure 2. Schematic of the hydrometeorological threshold model based on antecedent soil moisture and recent rainfall.
Remotesensing 16 03089 g002
Figure 3. Monthly distribution of landslide numbers and average rainfall.
Remotesensing 16 03089 g003
Figure 4. Spatial distribution map of extracted rainfall-induced landslide events in Emilia (2017).
Remotesensing 16 03089 g004
Figure 5. Distribution of landslide events in the Emilia region: (a) Slope distribution; (b) Land use type distribution.
Remotesensing 16 03089 g005
Figure 6. The evaluation results of landslide prediction models under the thresholds of different combinations of soil saturation and rainfall indices.
Remotesensing 16 03089 g006
Figure 7. The dates and corresponding regions that meeting the hydrometeorological thresholds: (a) The blue areas are the regions corresponding to the dates that meet the rainfall threshold conditions; (b) The green areas are the regions corresponding to the dates that meet the soil moisture threshold conditions.
Remotesensing 16 03089 g007aRemotesensing 16 03089 g007b
Figure 8. Time series of landslide identification and its relationship with daily rainfall (February to March 2018).
Remotesensing 16 03089 g008
Figure 9. Bias of rainfall-induced landslide temporal identification.
Remotesensing 16 03089 g009
Figure 10. The relationship between the temporal bias of landslide event extraction results and rainfall from February to March 2018. The positive temporal bias indicates that the predicted time is earlier than the recorded time, while the negative value indicates the opposite.
Remotesensing 16 03089 g010
Table 1. Sensitivity evaluation of soil moisture products for landslide prediction corresponding to historical landslide events in Emilia.
ProductTemporal CoverageTemporal
Resolution
Spatial
Resolution
Soil Depth
SMAP-PE2015 to
present
Daily9 km × 9 km0–5 cm
SMAP-SurEvery 3 h9 km × 9 km0–5 cm
SMAP-RZ0–100 cm
Table 2. The calibration performance of landslide prediction models under the thresholds of four different combinations.
73.5%—20 mm75.5%—19 mm75.5%—20 mm78.5%—20 mm
TPR0.820.700.830.83
FPR0.390.210.320.22
d0.430.370.360.28
Table 3. The validation performance of landslide prediction models under the thresholds of four different combinations.
73.5%—20 mm75.5%—19 mm75.5%—20 mm78.5%—20 mm
TPR0.720.790.840.83
FPR0.210.240.290.21
d0.350.320.330.27
Disclaimer/Publisher’s Note: The statements, opinions and data contained in all publications are solely those of the individual author(s) and contributor(s) and not of MDPI and/or the editor(s). MDPI and/or the editor(s) disclaim responsibility for any injury to people or property resulting from any ideas, methods, instructions or products referred to in the content.

