Abstract
The main purpose of infrared and visible image fusion is to produce a fusion image that incorporates less redundant information while incorporating more complementary information, thereby facilitating subsequent high-level visual tasks. However, obtaining complementary information from different modalities of images is a challenge. Existing fusion methods often consider only relevance and neglect the complementarity of different modalities’ features, leading to the loss of some cross-modal complementary information. To enhance complementary information, it is believed that more comprehensive cross-modal interactions should be provided. Therefore, a fusion network for infrared and visible fusion is proposed, which is based on bilateral cross-feature interaction, termed BCMFIFuse. To obtain features in images of different modalities, we devise a two-stream network. During the feature extraction, a cross-modal feature correction block (CMFC) is introduced, which calibrates the current modality features by leveraging feature correlations from different modalities in both spatial and channel dimensions. Then, a feature fusion block (FFB) is employed to effectively integrate cross-modal information. The FFB aims to explore and integrate the most discriminative features from the infrared and visible image, enabling long-range contextual interactions to enhance global cross-modal features. In addition, to extract more comprehensive multi-scale features, we develop a hybrid pyramid dilated convolution block (HPDCB). Comprehensive experiments on different datasets reveal that our method performs excellently in qualitative, quantitative, and object detection evaluations.
1. Introduction
Image fusion technology can generate high-quality fusion images containing rich detail information by integrating two or more source images [1,2]. This technology covers various image types, including medical image fusion (MIF), multi-exposure image fusion (MEIF), and infrared–visible image fusion (IVIF). The main goal is to provide a clear and comprehensive scene representation to enhance scene understanding. Among them, IVIF is the most widespread and challenging since it requires the effective extraction and combination of cross-modal features from different sensors. The core goal of IVIF is to retain the abundant texture details from the visible image and the salient target from the infrared image [3]. By fusing these two, it can avoid problems caused by the low resolution and noise of infrared images, and simultaneously overcome the limitations of visible images in harsh working environments (such as rain, snow, fog, low illumination, etc.). High-quality fusion images are very helpful for downstream high-level visual tasks, including remote sensing [4], object detection [5], image segmentation [6], and autonomous driving [7].
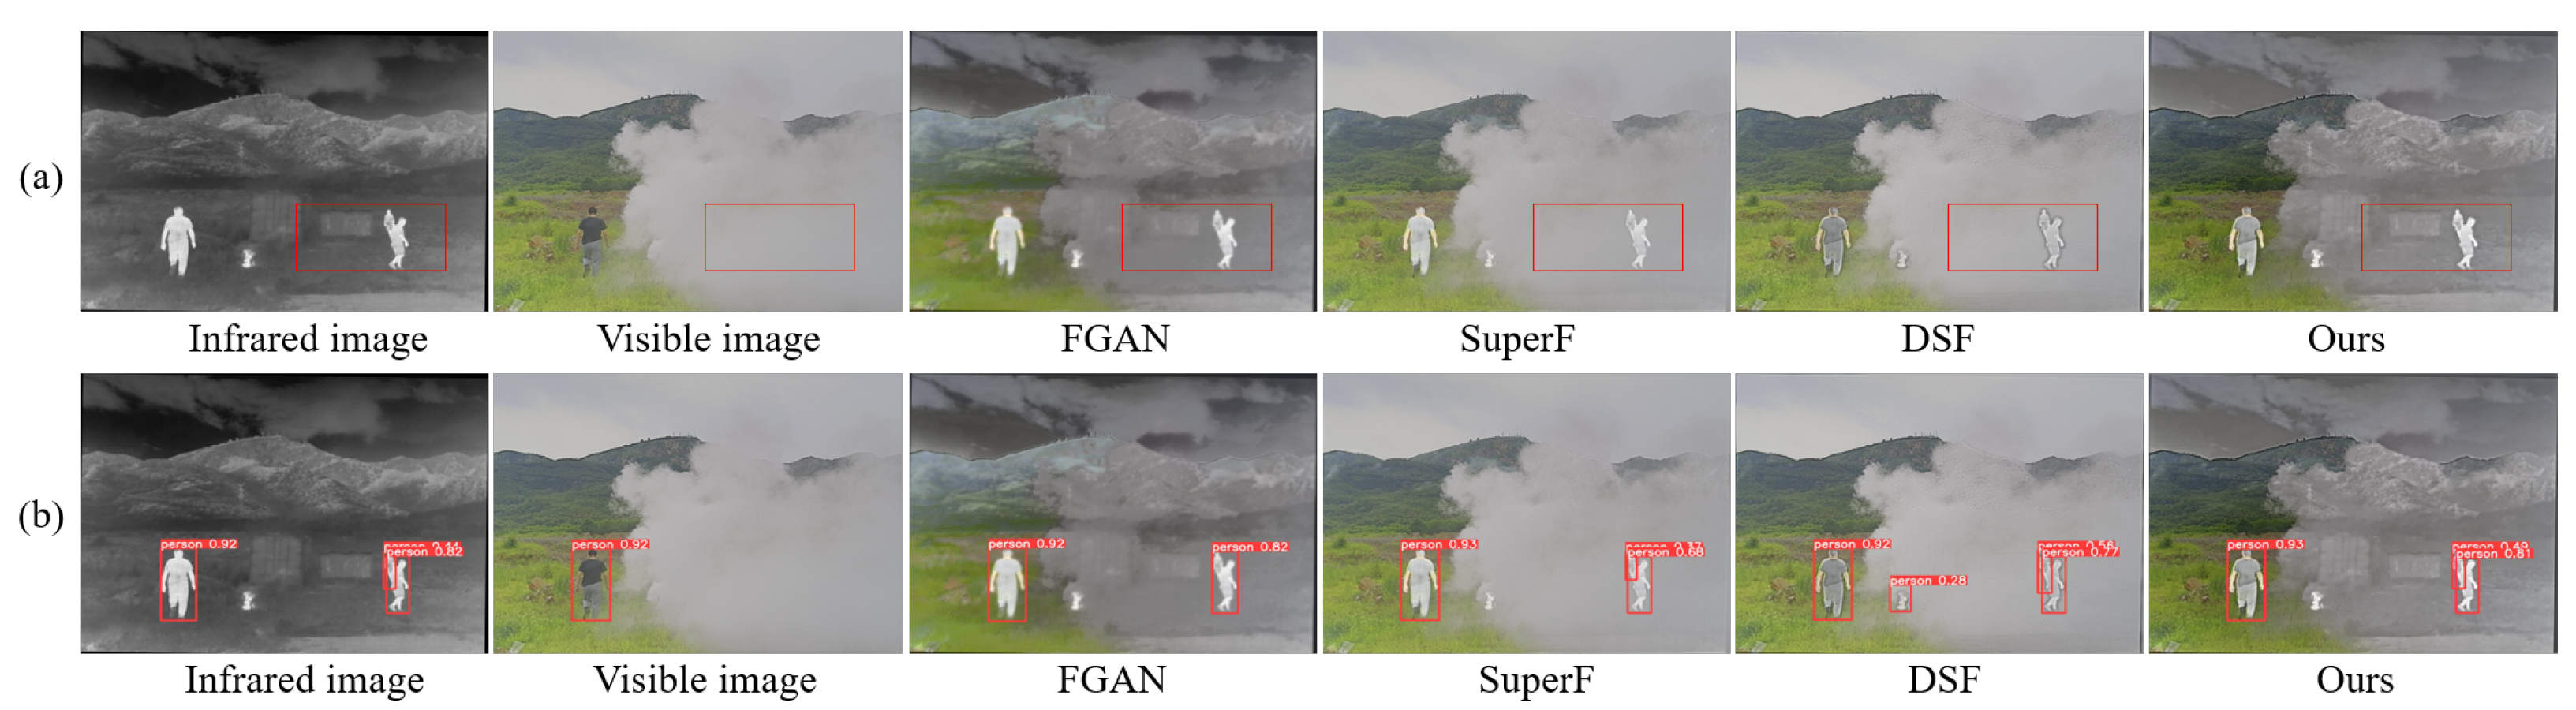
Figure 1 demonstrates the fusion and detection results in a typical smoke scenario. In such conditions, humans and other important targets are often obscured by smoke. Nonetheless, owing to the unique imaging principles inherent to infrared images, they can penetrate smoke and distinctly reveal these targets. As illustrated in Figure 1, the fusion image significantly enhances the visibility of targets in smoky conditions, thereby improving detection accuracy. For target detection, visible images fail to detect critical targets obscured by smoke. The FGAN [8] misses critical target detections, while the DSF [9] results in false detections. SuperF [10] and the proposed method both successfully detected these targets, with our method having higher detection accuracy. This indicates that the proposed method efficiently integrates useful information from infrared and visible images, enhancing subsequent target detection accuracy. IVIF has tremendous potential for applications in remote sensing, especially in monitoring complex environments. For example, in forest fire monitoring, IVIF can help identify fire sources and hotspot areas, clearly showing the location and range of the fire, which is very helpful for decision-makers in formulating more effective rescue plans.

Figure 1.
An example of fusion and object detection: (a) fusion results; (b) detection results. The source images are shown in the first two columns; the fusion and detection results of FGAN, SuperF, DSF, and our method are in the last four columns.
Existing IVIF methods are primarily divided into traditional and deep learning-based methods. Traditional fusion methods encompass methods based on saliency [11], subspace [12], sparse representation (SR) [13], multi-scale transform (MST) [14], and hybrid [15]. Although the above methods obtain satisfactory results, they still have some obvious limitations: (1) These methods depend on manually designed fusion rules that may not comprehensively retain the effective features in the source images, especially as source image complexity increases, necessitating more intricate fusion rules. (2) These methods usually apply uniform feature extraction for images of different modalities, neglecting the differences between modalities, which could cause the loss of some unique modality features in the source images. However, methods based on deep learning exhibit powerful feature extraction capabilities, overcoming inherent deficiencies in traditional methods and garnering attention from numerous scholars. Researchers have developed various models based on deep learning for IVIF, which are generally classified into methods based on the generative adversarial network (GAN) [5,8,16,17], autoencoder (AE) [18,19,20,21], convolutional neural network (CNN) [22,23,24,25], and transformer [26,27].
While the methods mentioned above have achieved satisfactory fusion performance, several issues remain unresolved. Firstly, most of these methods extract features using a single network or two parallel networks, without considering the differences in source image features, thus ignoring the interaction of features from different modalities and losing some important cross-modal information. It possibly affects the fusion performance to a certain extent. For example, DenseFuse [18] and FusionDN [28] use a single network for feature extraction without accounting for the differences between different modalities’ images, which may lead to the loss of some modality-specific information. Secondly, balancing the discrepancies between the fusion image and the source images is difficult because IVIF lacks ground truth. Some researchers have introduced GANs to address this issue, such as FusionGAN [8], DDcGAN [16], and GANMcC [29]. Although GAN-based methods have achieved acceptable fusion results, it is challenging for GAN to effectively utilize the unique information in multi-modal images, and GAN-based methods are difficult to achieve training balance. Finally, they overlook the extraction of diverse features in the source images and may extract some redundant information or miss some important information, thus affecting the fusion performance. For instance, SDNet [30] and PMGI [31] extract features using a single convolution kernel, which has limited receptive fields and may ignore some important features. Considering the extraction of multi-scale features, NestFuse [21] and RFNNest [32] introduce a nested network, which fuses features from different layers using a fusion strategy, but different layers still use a single convolution kernel. However, these methods do not sufficiently account for the inherent characteristics of different modalities, making it challenging to learn diverse feature representations. How to learn diverse feature representation and effectively use the beneficial characteristics of bilateral modality to enhance fusion performance is still a challenge.
To tackle the aforementioned problem, we introduce BCMFIFuse, a network that utilizes bilateral cross-modal feature interaction for IVIF. Firstly, to adequately extract features from infrared and visible images, we construct a two-stream feature extraction network. Given that infrared and visible images pertain to different modalities, we design CMFC to better extract complementary features from these two modalities. CMFC calibrates the current modality features by combining features from different modalities in the channel dimension and spatial dimension. Then, we use FFB to effectively integrate the calibrated features. The FFB is constructed using a cross-attention mechanism to facilitate long-range context information interaction, thereby enhancing global bilateral modality features. Finally, to ensure feature continuity and reduce information loss during transmission, skip connections are utilized between the encoder and decoder. Moreover, to prevent feature loss from using a single convolution kernel, multi-scale feature extraction is essential. Dilated convolution is highly effective in capturing multi-scale features and exploring contextual information. However, regular dilated convolutions detect input features within a square window, which limits their flexibility in capturing diverse features. Simply using a large square dilated convolution window is not an effective solution as it tends to extract redundant features. To tackle this issue, we introduce an HPDCB that integrates rectangular dilated convolutions to collect more diverse and specific contextual information. To capture long-range relationships of isolated areas, we employ a combination of long and narrow kernel shapes in the design of HPDCB. We first employ a long kernel shape with a variable dilation rate along one spatial dimension; then, a narrow kernel shape is employed in the other spatial dimension. The key contributions of the proposed method are outlined below:
- (a)
- A bilateral cross-modal feature interaction-based method for IVIF is suggested. The goal of this method is to provide comprehensive cross-modal interactions and fully leverage the complementary potential of cross-modal features. In addition, we use a hybrid pyramid dilated convolution block (HPDCB) to extract multi-scale features, effectively collect various contextual information, and learn diverse feature representations.
- (b)
- A cross-modal feature correction block (CMFC) is introduced. The module combines the features from different modalities in spatial and channel dimensions to calibrate the current modality features. This enables the two feature extraction branches to better focus on complementary information from both modalities, thereby mitigating uncertainties and noise effects from different modalities and achieving better feature extraction and interaction.
- (c)
- A feature fusion block (FFB) is developed. This module effectively integrates cross-modal features and merges the calibrated features from the CMFC into a single feature for subsequent image reconstruction. This module considers interaction fusion at both the channel and spatial dimensions, which is crucial for the generalization of cross-modal feature combinations.
The remainder of this paper is organized as follows. Section 2 reviews the related work in the field of image fusion. Section 3 describes the proposed method’s framework in detail. Section 4 presents the relevant experiments and results. Finally, Section 5 concludes the main content of this paper and outlines directions for future improvements.
2. Related Works
This section outlines a thorough overview of current IVIF methods, encompassing methods based on traditional and deep learning.
2.1. Traditional Image Fusion Methods
Traditional methods vary based on feature extraction, fusion strategy, and feature reconstruction methods, and are classified as methods based on saliency, subspace, SR, MST, and hybrid. The methods based on SR and MST are the most commonly employed.
Methods based on MST (e.g., discrete wavelet transform (DWT) [33] and Laplace pyramid transform (LAP) [34]) primarily decompose the source images into sub-images of varying scales and orientations. These sub-images are then merged following specific fusion rules, and an inverse transformation is employed to generate fusion images. These methods can preserve the source images with their multi-scale features but may lose some detail information, leading to distortion or edge blur of the fusion image.
Methods based on sparse representation mainly rely on the learning of overcomplete dictionaries and the decomposition algorithm of sparse coefficients. Initially, an overcomplete dictionary is obtained through learning, followed by sparse coding of the input images. The obtained sparse coefficients are then fused using various fusion rules, and the image is finally reconstructed with the dictionary and fusion coefficients. These methods are able to preserve the details and structure of source images, whereas they have high computational complexity. Furthermore, the choice of fusion rules and dictionaries is of utmost importance, as they will affect the fusion results.
2.2. Deep Learning-Based Image Fusion Methods
Generally speaking, methods based on deep learning are mainly divided into four types: fusion methods based on AE, GAN, CNN, and transformer.
2.2.1. AE-Based Fusion Methods
These methods leverage encoder and decoder networks for feature extraction and image reconstruction; then, they apply artificially designed fusion rules for fusing features. Densefuse [18] incorporates dense blocks during the encoding process to effectively extract and utilize features, and reconstruct the fusion image with a decoder. Subsequently, Li et al. [32] introduced a residual architecture-based residual fusion network (RFN) to enhance the performance of image fusion. AUIF [35] is based on the principle of algorithm expansion and decomposes the source images into high- and low-frequency information. In addition, to further enhance the fusion performance, NestFuse [21] integrates an attention mechanism into the model. SEDRFuse [36] developed a symmetric network framework with residual blocks and introduced a feature fusion rule based on attention. Res2Fusion [37] incorporates dense Res2Net into the encoder and develops a dual non-local attention-based fusion strategy. Despite the significant fusion performance achieved by these methods, the necessity for manual formulation of fusion rules greatly limits the fusion performance improvement.
2.2.2. CNN-Based Fusion Methods
To tackle the issues of AE-based fusion methods, a number of CNN-based end-to-end fusion techniques were introduced, yielding impressive fusion results. For instance, the PIAFusion [25] network leverages illumination perception for fusing infrared and visible images. STDFusionNet [24] extracts the background regions from visible images and the target regions from infrared images using semantic segmentation, while network optimization is guided by a new loss function. Notably, the key innovation in these approaches is in the design of the loss function. Long et al. [38] introduced RXDNFuse, which has a relatively innovative network structure and uses an aggregated residual dense network to effectively extract and fuse features. To address various image fusion tasks within a single framework, PMGI [31] is proposed, which emphasizes gradient and intensity ratio preservation, enabling multiple image fusion tasks. Additionally, Zhang et al. [30] introduced SDNet, treating the fusion problem as a task of extracting and reconstructing gradient and intensity information. Xu et al. [28,39] contributed to the field with their general image fusion frameworks, U2Fusion and FusionDN. However, despite the noteworthy results these fusion methods have made, they commonly neglect the modality differences inherent between visible and infrared images. They utilize the same network structure for extracting features from different modalities, which limits their ability to distinguish inherent feature differences between modalities, subsequently restricting their fusion performance.
2.2.3. GAN-Based Fusion Methods
IVIF lacks ground truth; to address this challenge, researchers have introduced GAN. FusionGAN [8] is a new beginning in the field of fusion, marking the official application of GAN in this field. Subsequently, numerous GAN-based fusion methods have emerged. For example, ResNetFusion [40] tackles the problems of target edge blurring and texture detail loss in FusionGAN. This method incorporates target edge enhancement loss and detail loss functions to sharpen target edges and enhance detail information. Furthermore, proposed by Ma et al. [16], DDcGAN contains a generator and dual discriminators, which can train the generator more comprehensively and prevent information loss that could occur with a single discriminator. GANMcC [29] introduces a multi-class constraint, transforming the fusion problem into a simultaneous estimation of multiple distributions and achieving excellent fusion results. TarDAL [5] is a dual adversarial learning network using target perception and applies to image fusion and downstream object detection tasks. GAN-FM, proposed by Zhang et al. [41], involves a full-scale skip-connected generator to leverage multi-scale information during the fusion process. Additionally, many researchers introduced attention mechanisms in their frameworks. For example, AttentionFGAN [42] incorporates multi-scale attention into the generator and the discriminator, significantly enhancing fusion performance. TC-GAN [43] applies squeeze and excitation modules in the generator to better retain important texture details in the fusion images. However, achieving training balance in GAN-based methods still poses a challenge.
2.2.4. Transformer-Based Fusion Methods
Models of this kind employ the multi-head self-attention mechanism, exhibiting remarkable performance in capturing global information and overcoming the limited receptive field issue of CNNs. Thanks to its exceptional ability to explore the global context, the transformer model has excelled in computer vision tasks, giving rise to various fusion methods based on transformer [26,27,44]. For instance, SwinFusion [26] introduces a fusion framework that combines the convolutional neural network and the transformer, enabling the utilization of both local and global information. YDTR [44] captures local important information and crucial contextual detail information by utilizing a dynamic transformer, preserving texture details and salient targets in the source images. However, transformer-based methods, while delivering outstanding performance, also entail significant computational costs.
3. Method
In this section, we describe the framework of the BCMFIFuse, which is a method for IVIF based on bilateral cross-modal feature interaction. First, an outline of the overall architecture of BCMFIFuse is presented. Next, we introduce network structures of hybrid pyramid dilated convolution block (HPDCB), cross-modal feature correction block (CMFC), and feature fusion block (FFB). Finally, we delve into the multiple constraint loss functions employed in the BCMFIFuse network model.
3.1. Overall Architecture
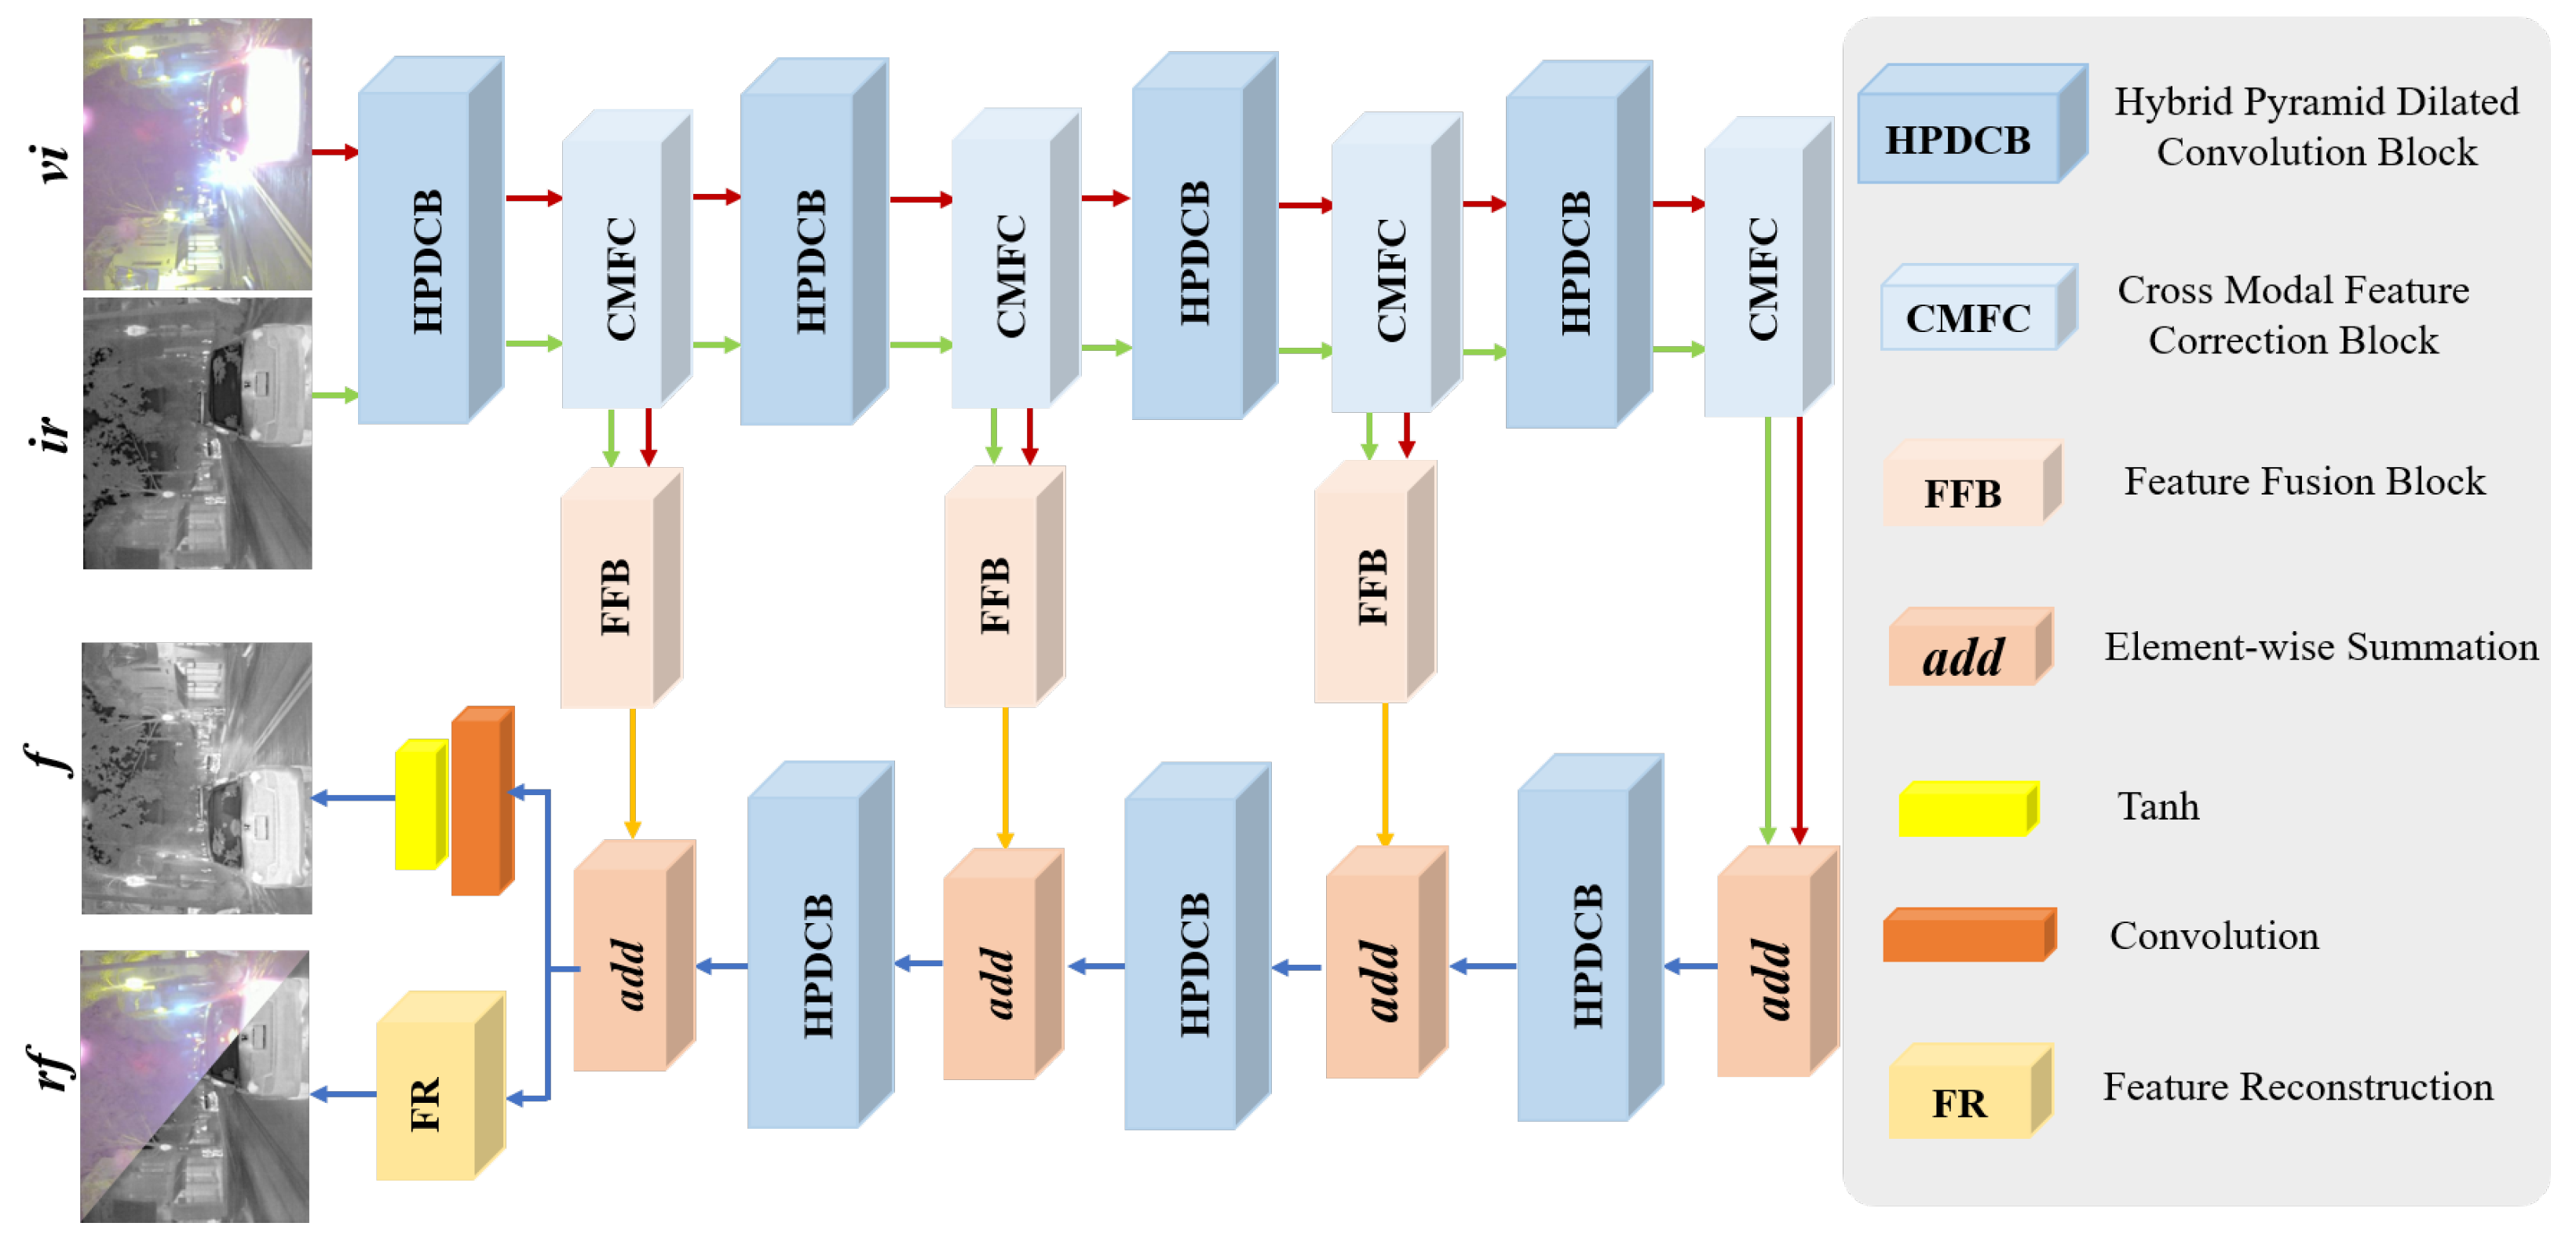
IVIF aims to maintain essential target information in infrared images while simultaneously retaining the abundant texture details in visible images. Extracting and leveraging complementary features from the visible and infrared images remains challenging on account of differences in sensor acquisition and imaging mechanisms. Existing fusion methods suffer from limitations in feature representation, potentially leading to information loss and negatively impacting the fusion results. Therefore, achieving comprehensive cross-modal interaction is crucial for fully leveraging the complementary features from the infrared and visible images. In this study, we propose BCMFIFuse, an IVIF network based on bilateral cross-modal feature interaction. Figure 2 demonstrates the overall framework of BCMFIFuse, which is constructed with a two-stream design for feature extraction from infrared and visible images. The architecture of BCMFIFuse primarily comprises four key components: HPDCB, CMFC, FFB, and FR. We use the HPDCB module to extract comprehensive multi-scale feature information, then employ the CMFC to calibrate the extracted features, and subsequently use the FFB to fuse the calibrated features. Additionally, to ensure feature continuity and reduce information loss during transmission, we implement residual connections between the encoder and decoder. The FR is primarily employed to ensure that the reconstructed visible and infrared images contain complete information.

Figure 2.
The overall network architecture of our method. , , and f refer to visible, infrared, and fusion images, respectively. stands for reconstructed visible and infrared images.
3.2. Hybrid Pyramid Dilated Convolution Block (HPDCB)
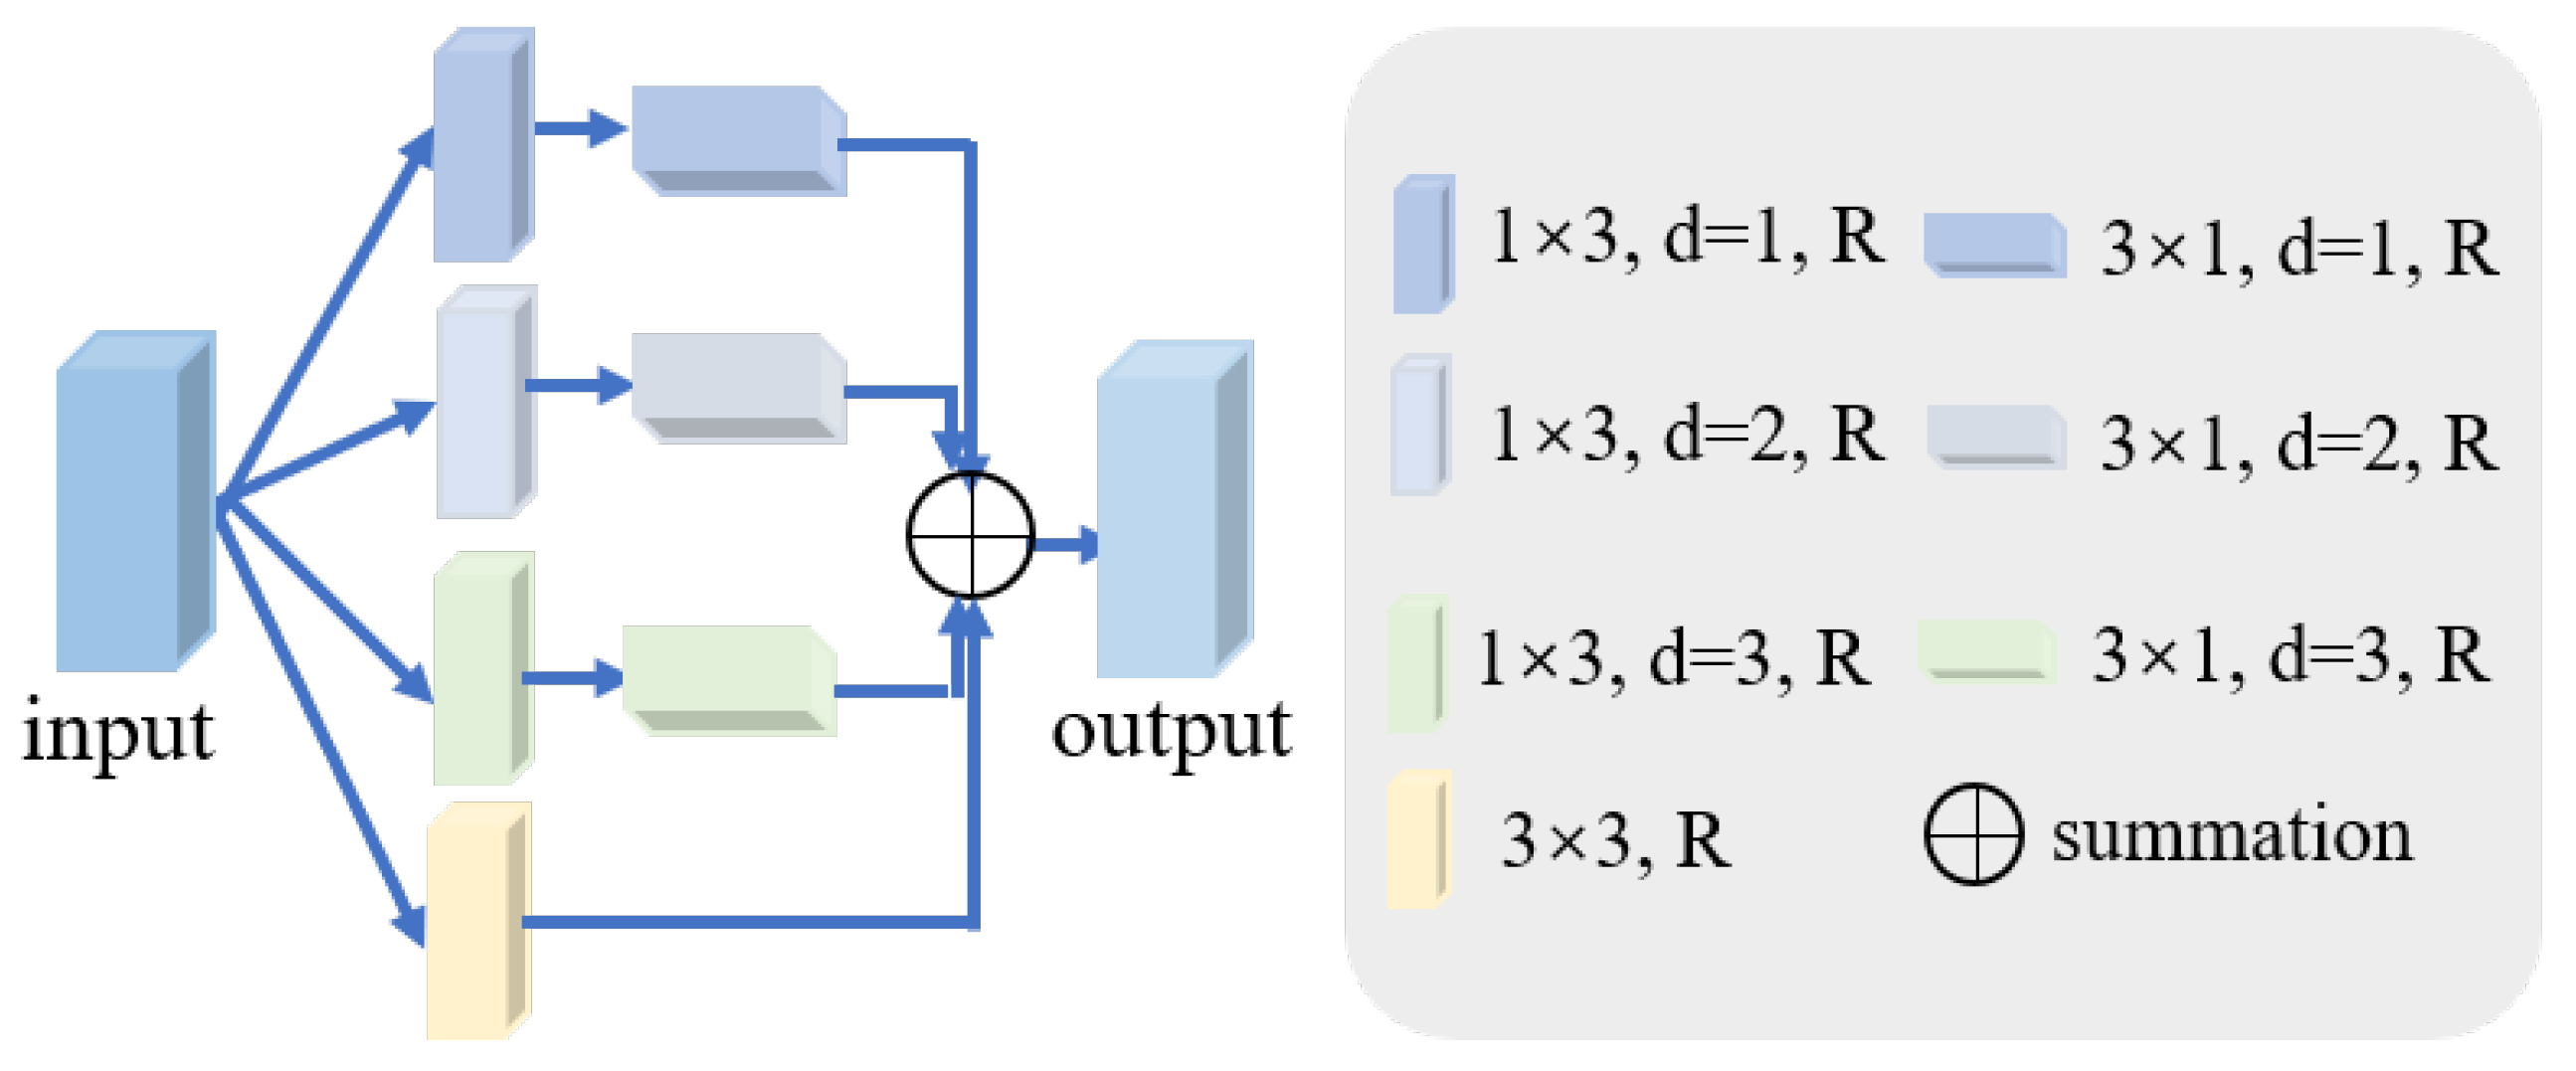
The size and shape of the convolution kernel can affect the features extracted. As the scale changes of the target objects in the dataset may not always be regular, to extract a more comprehensive and richer image feature representation, we need to capture features at different scales. Conventional dilated convolutions mainly detect input features of square windows, which may limit their flexibility in capturing features. Relying solely on large square dilated convolution windows is insufficient to fully tackle this issue and might even lead to the extraction of redundant features. To tackle this issue, we design a module named HPDCB, which aims to obtain more specific and diverse contextual information, as shown in Figure 3. HPDCB is capable of capturing the long-range relationships between isolated areas. During the design phase of HPDCB, rectangular dilated convolution is incorporated into the dilated convolution framework and adopts a method combining long kernel and narrow kernel shapes. First, a long kernel shape with a variable dilation rate along one spatial dimension is deployed; then, a narrow kernel shape is deployed in the other spatial dimension. The process mentioned above can be formulated as follows:
where denotes the input feature, d denotes dilation rate, stands for ReLU activation function, stands for convolution, h is the output feature, and and are the kernel sizes.
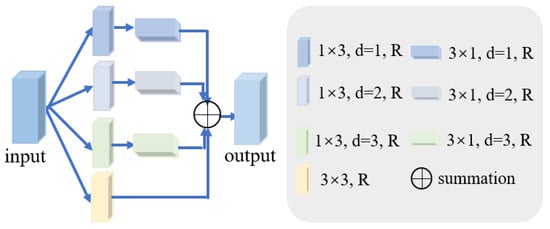
Figure 3.
The hybrid pyramid dilated convolution block (HPDCB). d denotes dilation rate. R stands for ReLU activation function.
3.3. Cross-Modal Feature Correction Block (CMFC)
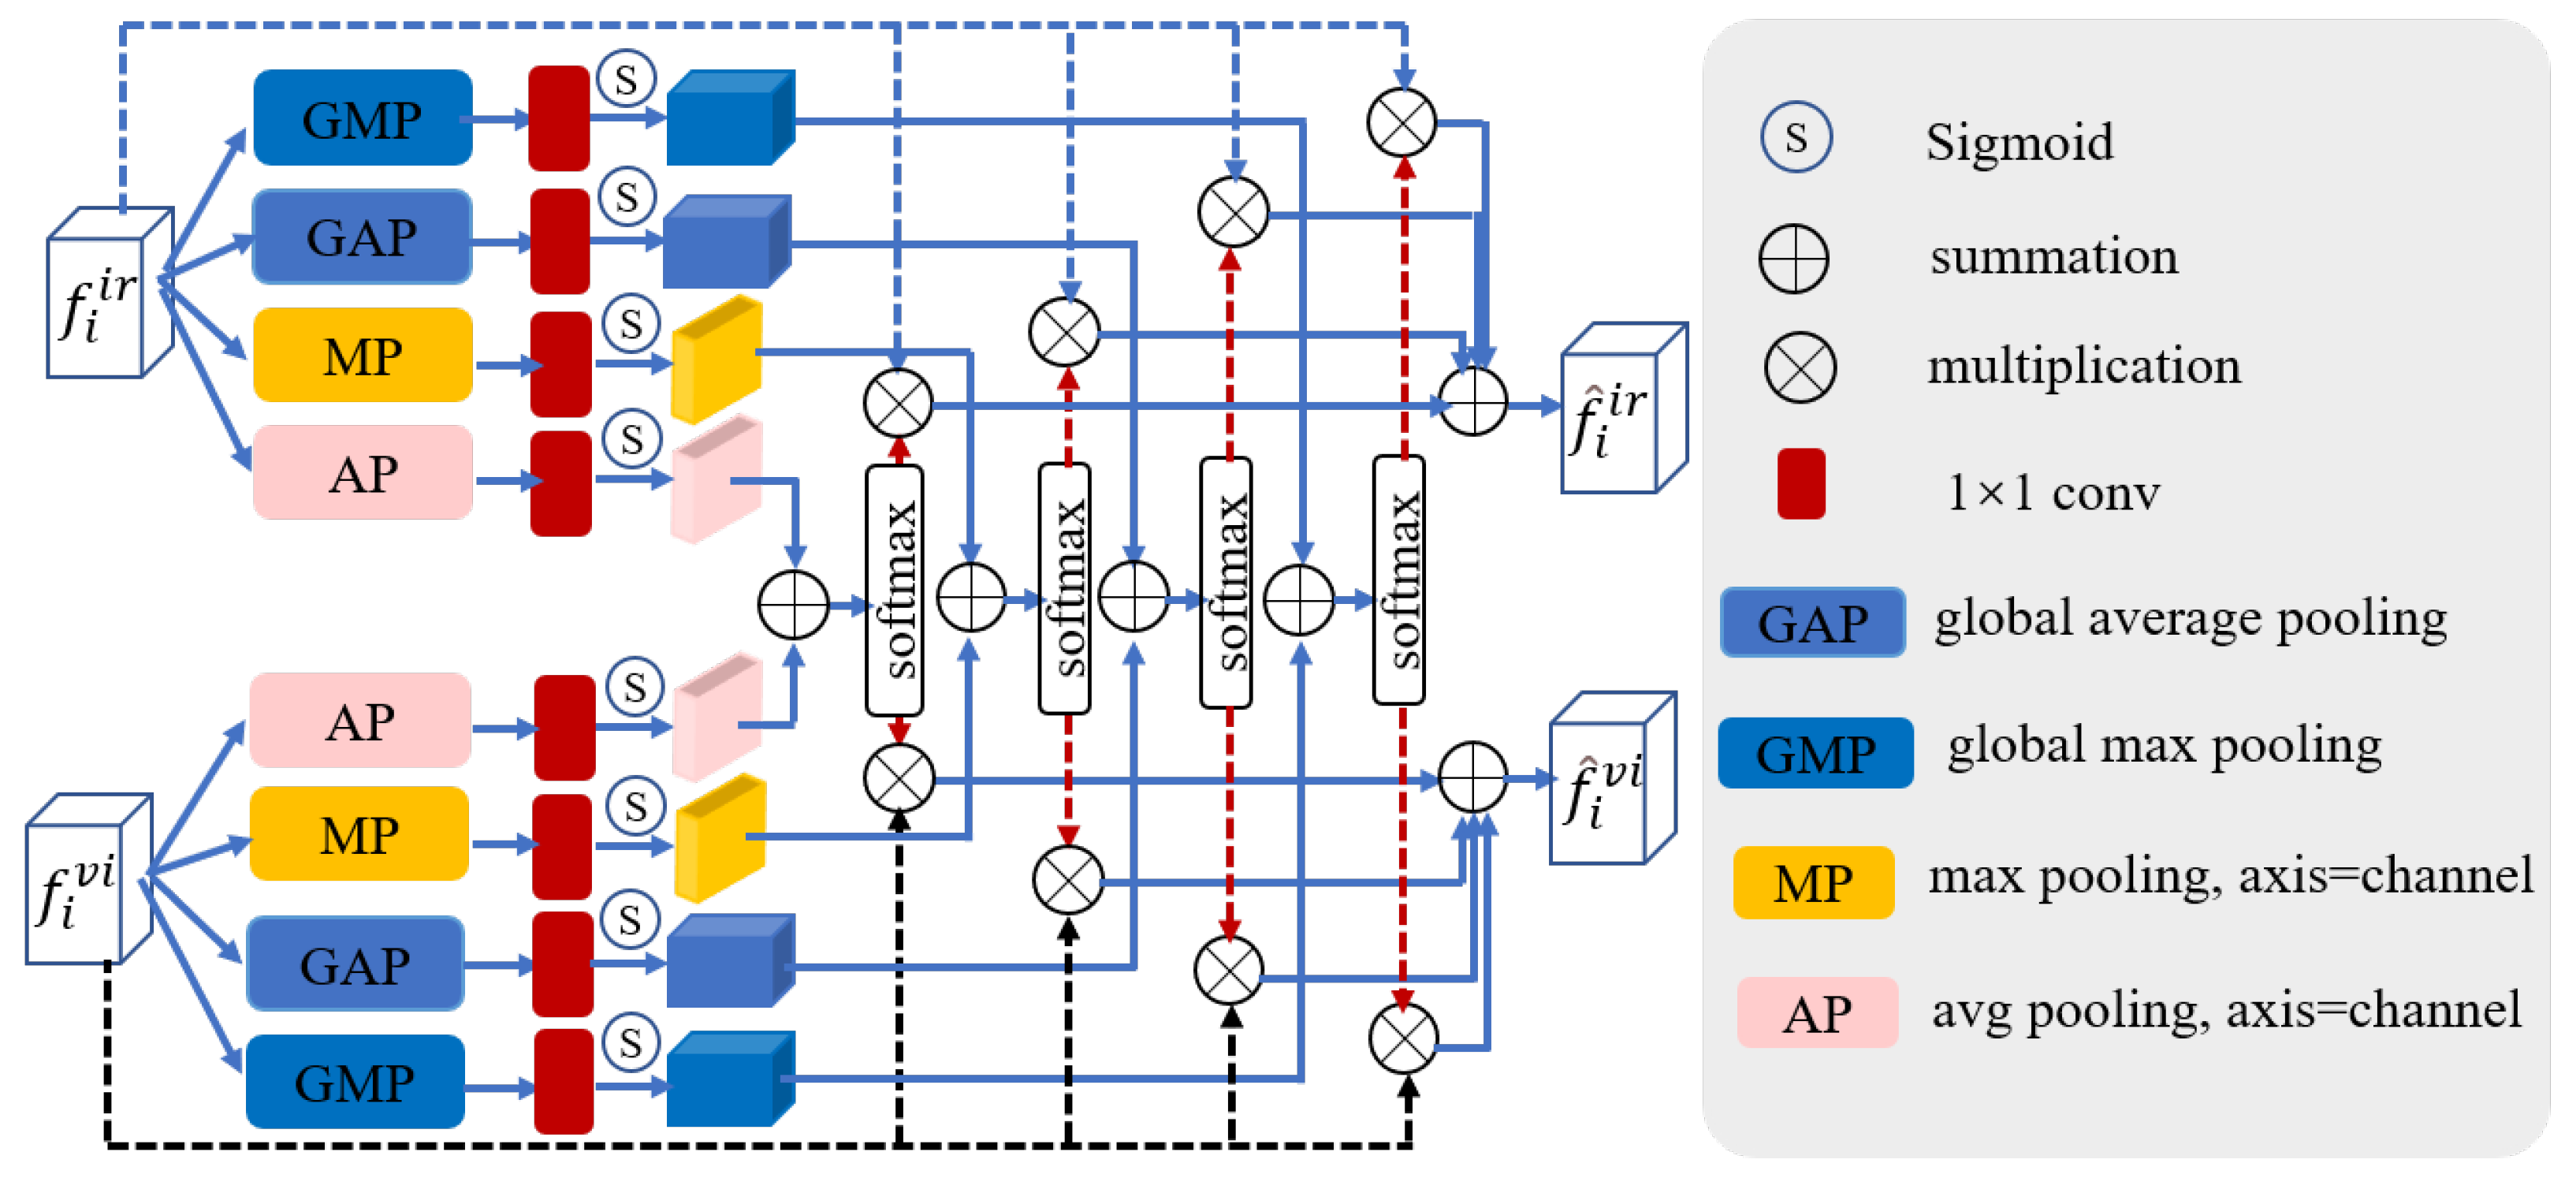
In our work, we construct two parallel branches for extracting features from the visible and infrared images, respectively. As is widely recognized, multimodal images often contain a large amount of noise from different modalities. Nevertheless, infrared and visible images offer complementary information, with the potential for their features to calibrate the noise information pertaining to one another. Therefore, we design CMFC to correct features from different modalities. Figure 4 depicts the structure of CMFC. The calibrated features are then fed into the subsequent phases for further enhancement and refinement of feature extraction. Assuming that the inputs of CMFC are and , the workflow can be expressed as follows:
where stands for convolution, denotes the sigmoid function, and ⊗ represents element-wise multiplication. () signifies the result of the j-th branch at the i-th layer. represents the calibrated features.
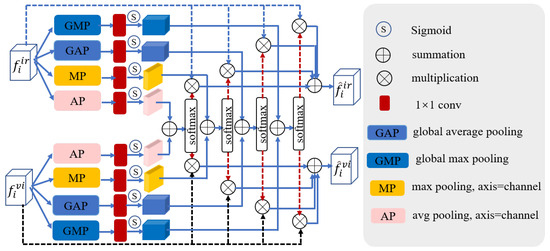
Figure 4.
The cross-modal feature correction block.
3.4. Feature Fusion Block (FFB)
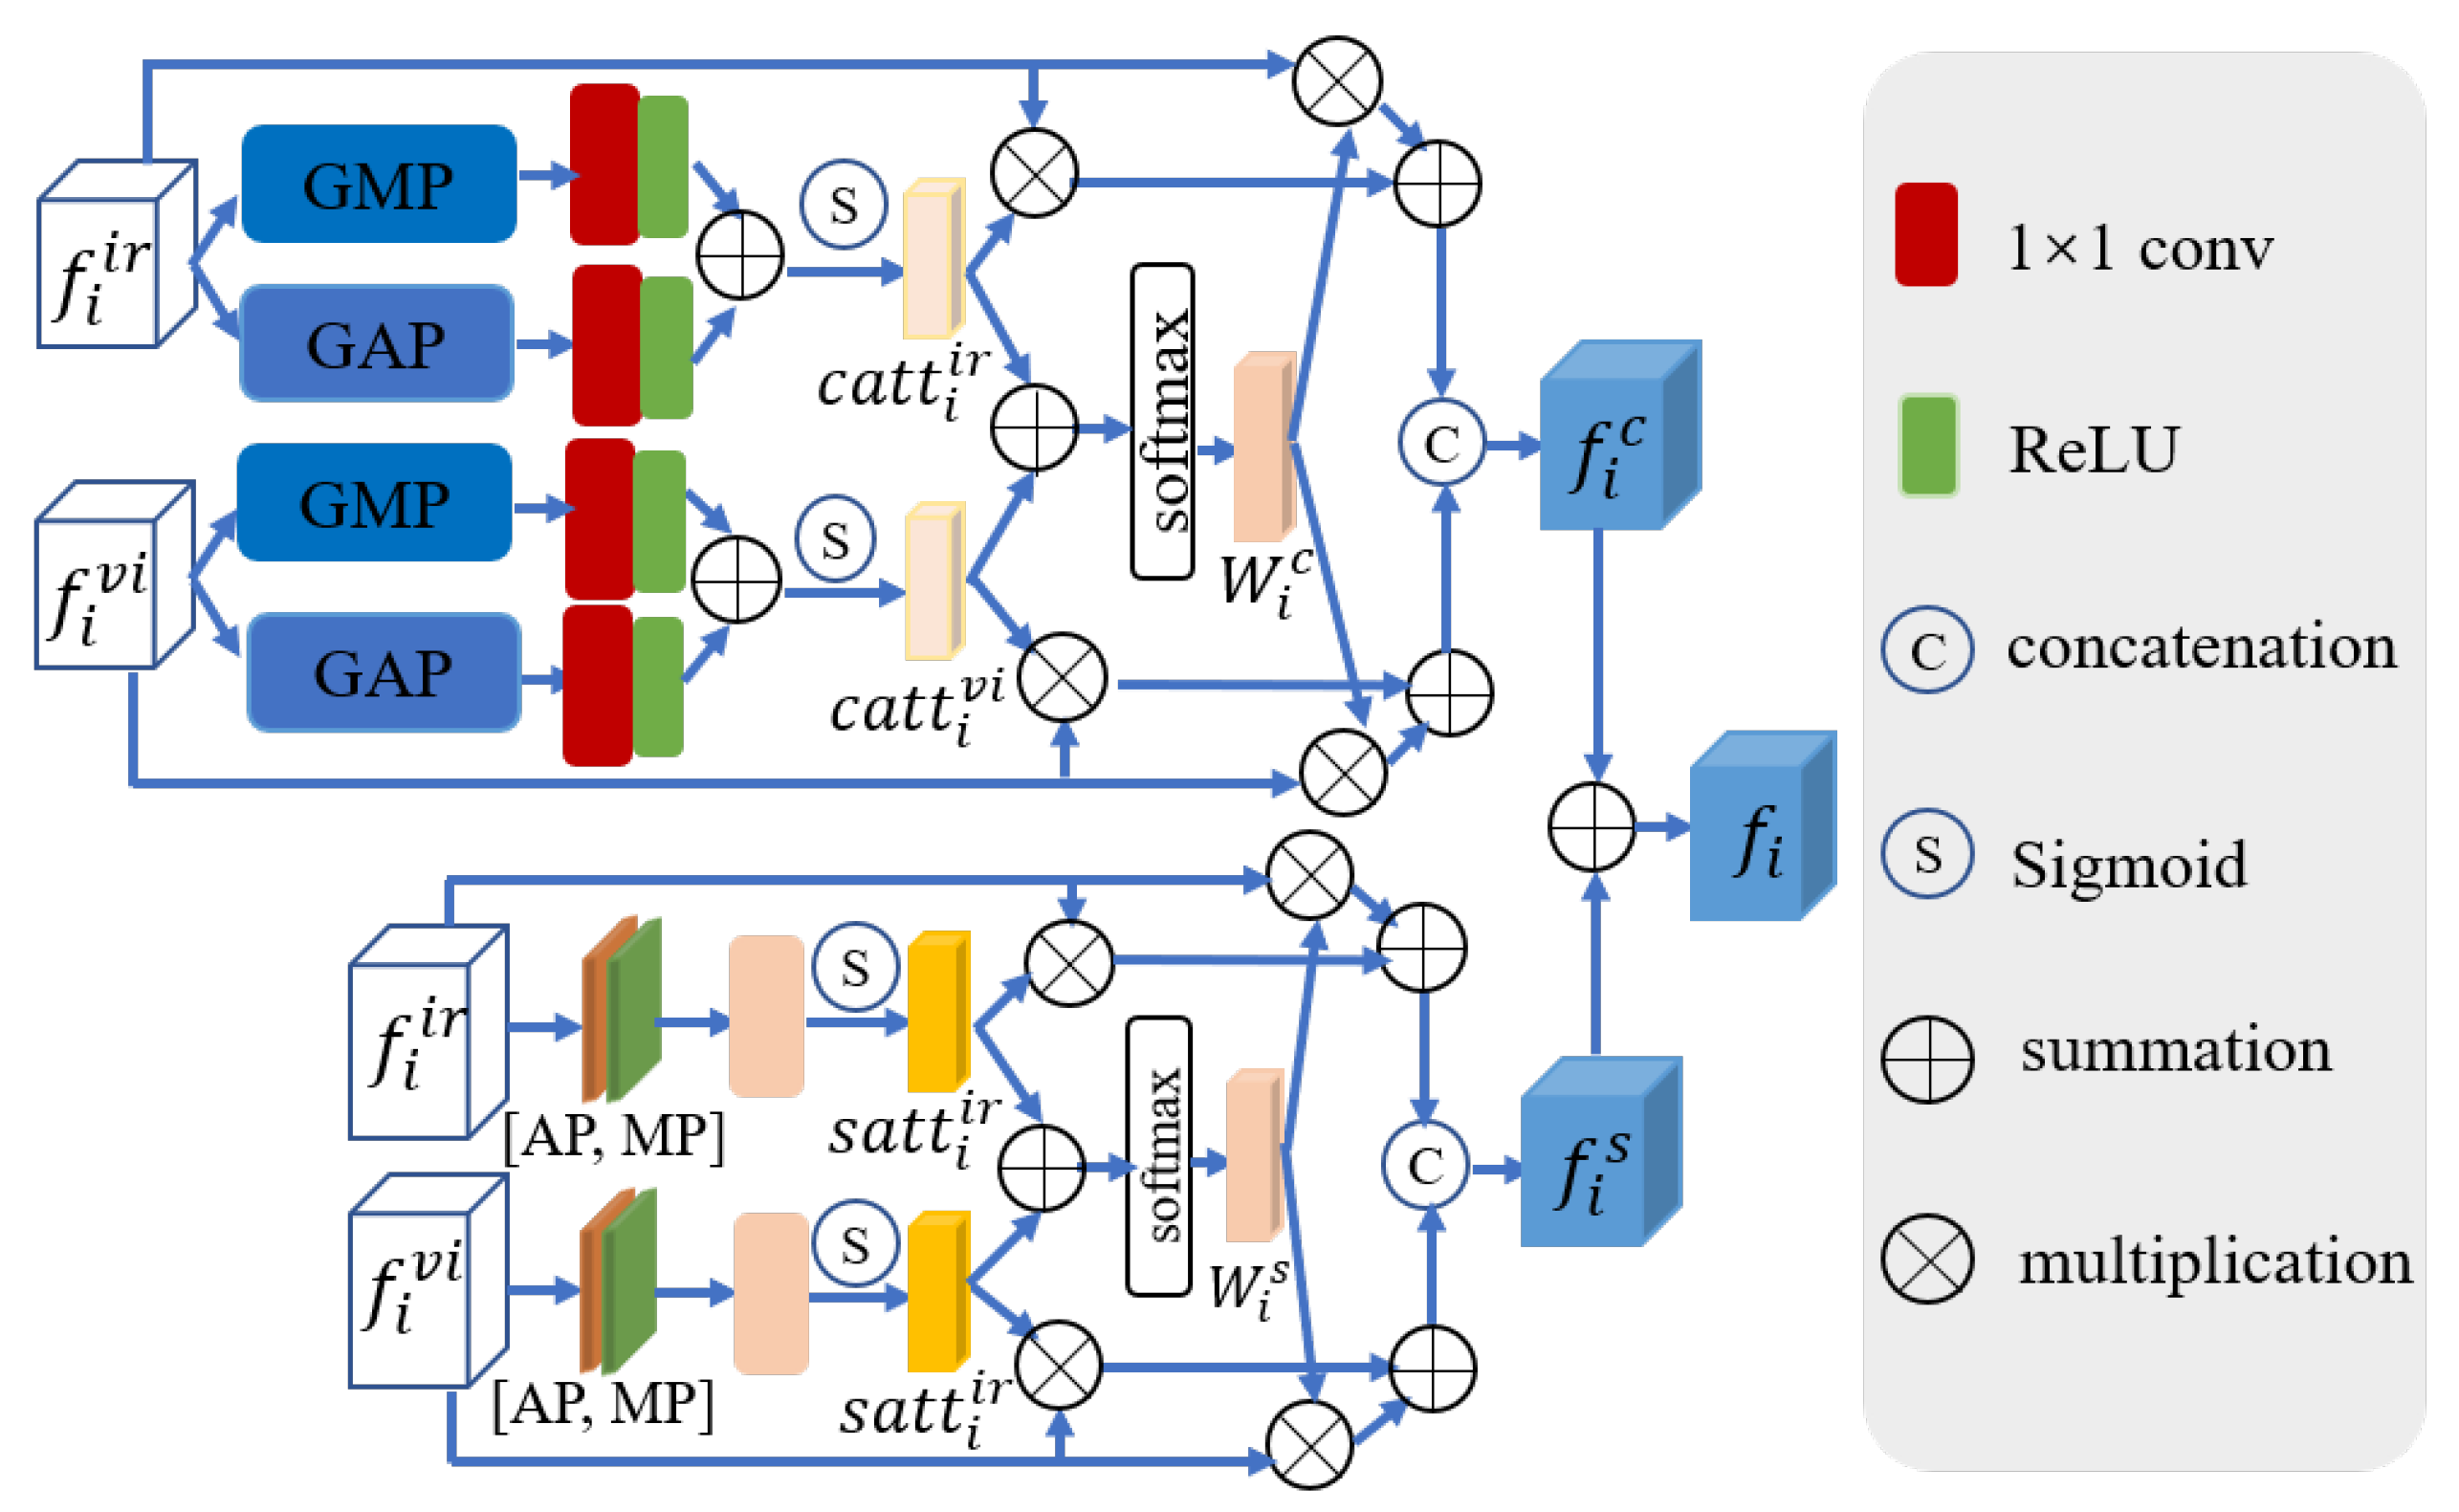
To extract and integrate the most discriminative features in the infrared and visible images, facilitating long-range contextual interaction and enhancing global cross-modal features, we design a feature fusion block (FFB). This module integrates two features calibrated by CMFC into a feature map, which is then added to the output of different levels of the decoder to transform into the ultimate output feature. The framework of FFB is depicted in Figure 5.

Figure 5.
The feature fusion block. and indicate global average pooling and global max pooling. and stand for average pooling and max pooling.
Assuming the i-th HPDCB of the visible and infrared branches generate and , respectively, we first adopt GAP and GMP to obtain global features. Subsequently, after a series of processing, the channel attention weights generated by the infrared and visible branches are obtained. These attention weights are then multiplied with the corresponding input features , aiding the model in suppressing unimportant scene features and emphasizing crucial ones. Following this, the attention weights of these two branches are added; then, the softmax function is employed to acquire the cross-channel attention weight . The multiplication of the input features and weight of the visible and infrared images yields the cross-channel attention output for both modalities. Additionally, and undergo a spatial attention module (composed of MP, AP, convolution, and sigmoid function), producing the spatial attention output for the visible and infrared images. Subsequent operations are similar to the above process (see Figure 5). The final cross-modal fusion feature is acquired by adding the acquired and . The process mentioned above can be formulated as follows:
where is the ReLU activation function and denotes the softmax activation function.
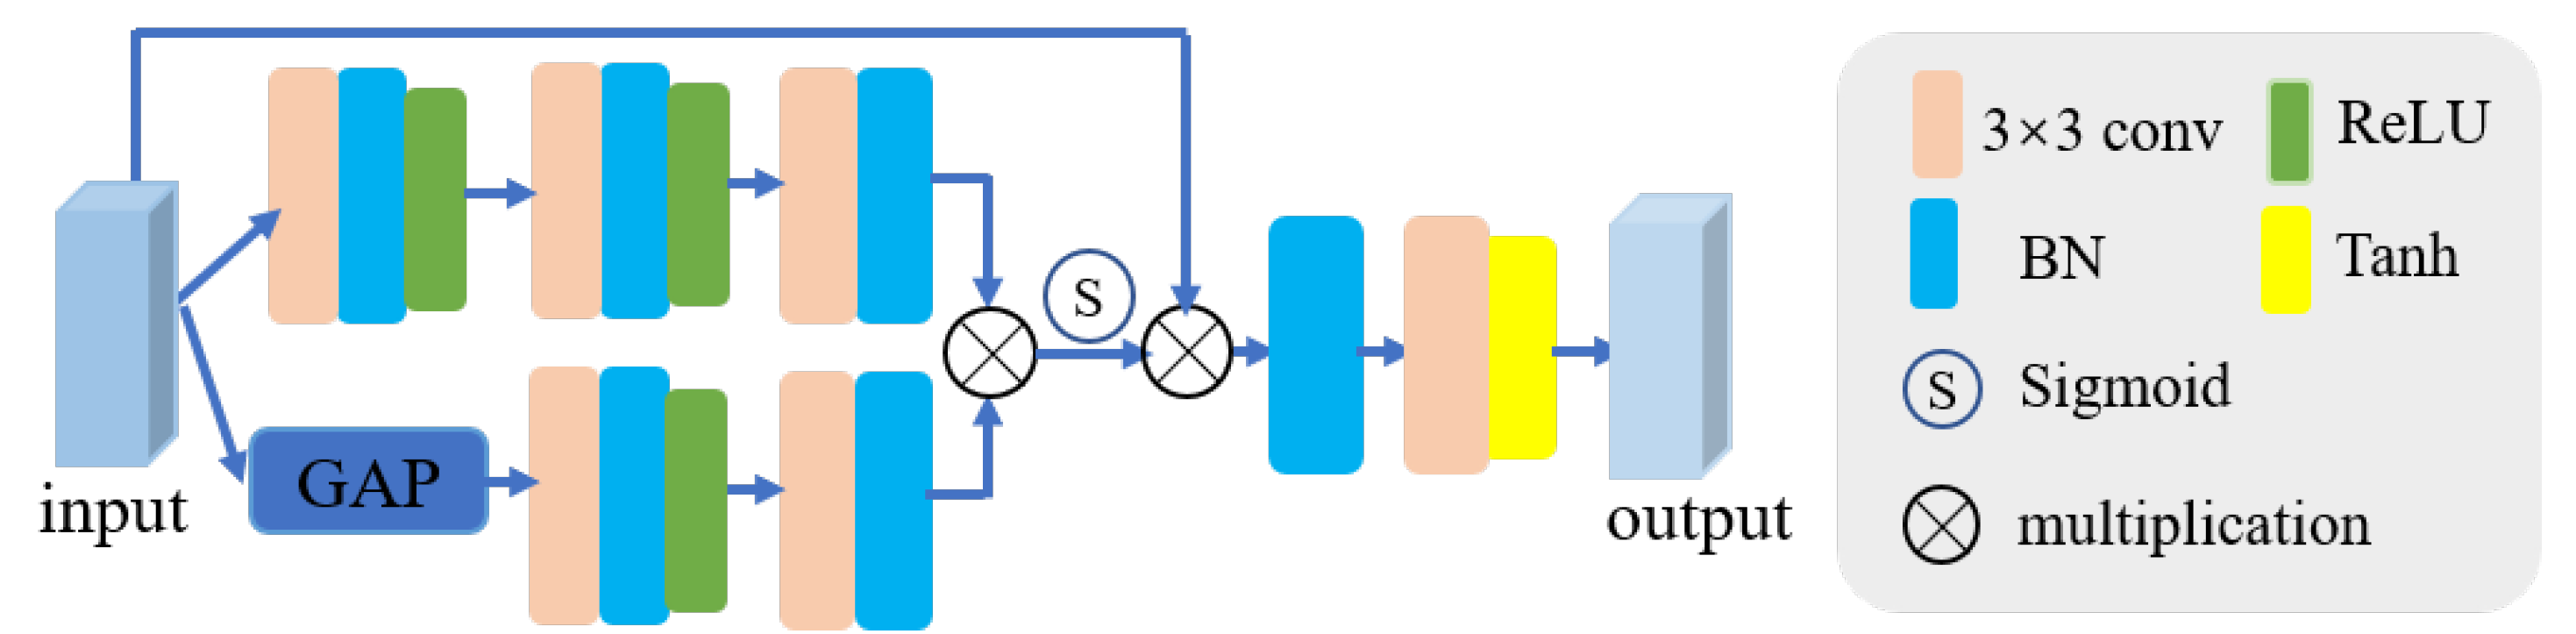
3.5. Feature Reconstruction Module (FR)
To ensure that the reconstructed visible and infrared images incorporate complete information, we designed the FR module. This module aims to constrain the final reconstruction features to contain more comprehensive information by reconstructing the visible and infrared images. Figure 6 depicts the architecture of the FR. Assuming X is the input feature, the workflow of FR can be expressed as follows:
where B denotes batch normalization, stands for convolution with kernel size , stands for ReLU activation function, represent global average pooling, and is Tanh activation function.

Figure 6.
The feature reconstruction module (FR). denotes Batch Normalization. represent global average pooling.
3.6. Loss Function
Designing the loss function is pivotal for model training, as it not only guides the optimization direction of the model but also influences the proportion of various information from the source images preserved in the fusion images. The loss function of the proposed method is formed by five terms: intensity loss (), detail loss (), structural similarity loss (), triplet loss (), and reconstruction loss (). We express the total loss as follows:
where the coefficients , , and are employed to harmonize various loss functions.
To retain important targets in source images, we introduce a saliency-related intensity loss, defined as follows:
where MSE is the mean squared error; , , and stand for the fusion, visible, and infrared image; and denote weighted maps, and ; and S denotes the saliency matrix, which is computed by [45].
To maintain abundant texture details in the fusion images, we incorporate a detail loss, defined as follows:
where and ∇ denote the -norm and Sobel gradient operator; and stand for the element-wise maximum values operation and the absolute operation symbol.
In order to achieve an ideal image that possesses rich texture information, prominent target information, and also retains the overall structure of source images, a modified structural similarity loss [46] is introduced into , defined as follows:
where denotes variance. The use of SSIM provides a metric for quantifying the similarity between two images, where a higher value corresponds to a stronger similarity between the images.
Furthermore, to assist the network in learning more discriminative feature representations and enhance the fusion image quality, we introduce the triplet loss .
where the value of n is 3, representing the count of convolutional blocks involved; denotes the Euclidean distance; ∑ stands for summation operator; and are positive and negative samples; and b represents a parameter and is set to 1.0.
We design an FR module to ensure that the reconstructed source images contain more comprehensive information, thereby optimizing the final fusion result. Accordingly, a reconstruction loss function is introduced, which is defined as follows:
where stands for reconstructed infrared image and denotes reconstructed visible image.
4. Experiments and Results
We evaluate the fusion performance of our method by conducting various comparative experiments in this section. Firstly, comprehensive details are presented regarding the experimental datasets, training details, comparison methods, and metrics for evaluation. Then, the exceptional performance of the proposed method is demonstrated through conducting quantitative and qualitative comparisons on different public datasets. Subsequently, we execute ablation studies on each key module to validate their essentiality. Finally, we conduct fusion efficiency experiments. Furthermore, we extend the experiments to object detection, showing that our method enhances the performance of downstream high-level visual tasks.
4.1. Datasets and Training Details
(1) Datasets. : The dataset [5] contains high-resolution visible and infrared image pairs of various object types and scenes. The image pairs cover four typical types in different seasons, daytime, overcast, and night. In our study, we choose 2720 image pairs from this dataset to form our training set. The diversity of provides convenience for exploring image fusion algorithms.
TNO: The TNO dataset https://figshare.com/articles/TN_Image_Fusion_Dataset/1008029 (accessed on 30 January 2024), which contains multi-band nighttime images depicting military scenarios, is generally applied in the fusion of visible and infrared. We randomly choose 39 image pairs from it to serve as the test set.
RoadScene: The Roadscene dataset https://github.com/hanna-xu/RoadScene (accessed on 30 January 2024) is composed of 221 aligned pairs of visible and infrared images. These image pairs showcase representative traffic scenes, including pedestrians, traffic signs, vehicles, and roads. The dataset has been formed through careful preprocessing and image registration of some of the most representative scenes from the FILR dataset.
LLVIP: Most of the images in the LLVIP dataset [47] are taken in very dark scenes, making it applicable for low-light vision. This dataset can verify the effectiveness of fusion algorithms under low-light conditions.
(2) Training details. In this work, we utilize 2720 image pairs from the dataset for model training. We perform extensive quantitative and qualitative evaluations of our method and comparison methods on the , RoadScene, TNO, and LLVIP datasets. To expand the training data, increase data diversity, and mitigate the risk of overfitting [48], we employ random horizontal flipping during the training phase and resize the images to 352 × 352. During the training process, the parameter update employs the Adam optimizer, with a batch size of 16. The learning rate and training epochs are set to and 100, respectively. The coefficients , , and are determined based on extensive experiments and experience. We employ the PyTorch 1.7 framework to implement our approach and train it on an NVIDIA A100 GPU (NVIDIA, Santa Clara, CA, USA).
4.2. Comparison Methods and Evaluation Metrics
We will assess the fusion images from subjective and objective perspectives to validate the fusion performance of our method. For subjective evaluation, the primary factor is human visual perception. The fusion image’s quality is evaluated by the detail richness and target salience, which inherently entails a certain level of subjectivity. On the other hand, objective evaluation methods rely on quantitative metrics to objectively assess image quality.
Comparison methods. We assess the fusion performance of our method by comparing it with twelve state-of-the-art (SOTA) fusion methods (GTF [49], FGAN [8], STDF [24], SwinF [26], TarDAL [5], SeAF [22], SuperF [10], DIDF [19], BDLF [50], SHIP [51], DSF [9], and TCMoA [52]). To ensure fairness, we adhere to the parameter settings from the original publications by the authors in our comparative experiments, without modifying any other configurations.
Evaluation metrics. Given the deficiency of ground truth in IVIF, it is insufficient to rely solely on subjective visual assessments to evaluate the quality of fusion images, particularly when the two fusion images are nearly indistinguishable visually. To make the results more convincing, we select twelve quantitative metrics to comprehensively and objectively evaluate our method, including the sum of the correlation differences (SCD) [53], correlation coefficient (CC) [54], average gradient (AG) [55], visual information fidelity (VIF) [56], mean square error (MSE) [57], peak signal-to-noise ratio (PSNR) [58], edge information () [59], multi-scale structural similarity (MSSSIM) [60], structural similarity (SSIM) [61], mutual information (based on wavelet feature (), discrete cosine feature (), and pixel feature ()) [62]. Except for MSE, higher values indicate superior fusion performance.
4.3. Comparison Experiment
We proceed with a comprehensive experiment on the dataset to validate the superiority of our method in fusion performance. The following will present both qualitative and quantitative analyses of the results obtained from our method as well as the comparison methods.
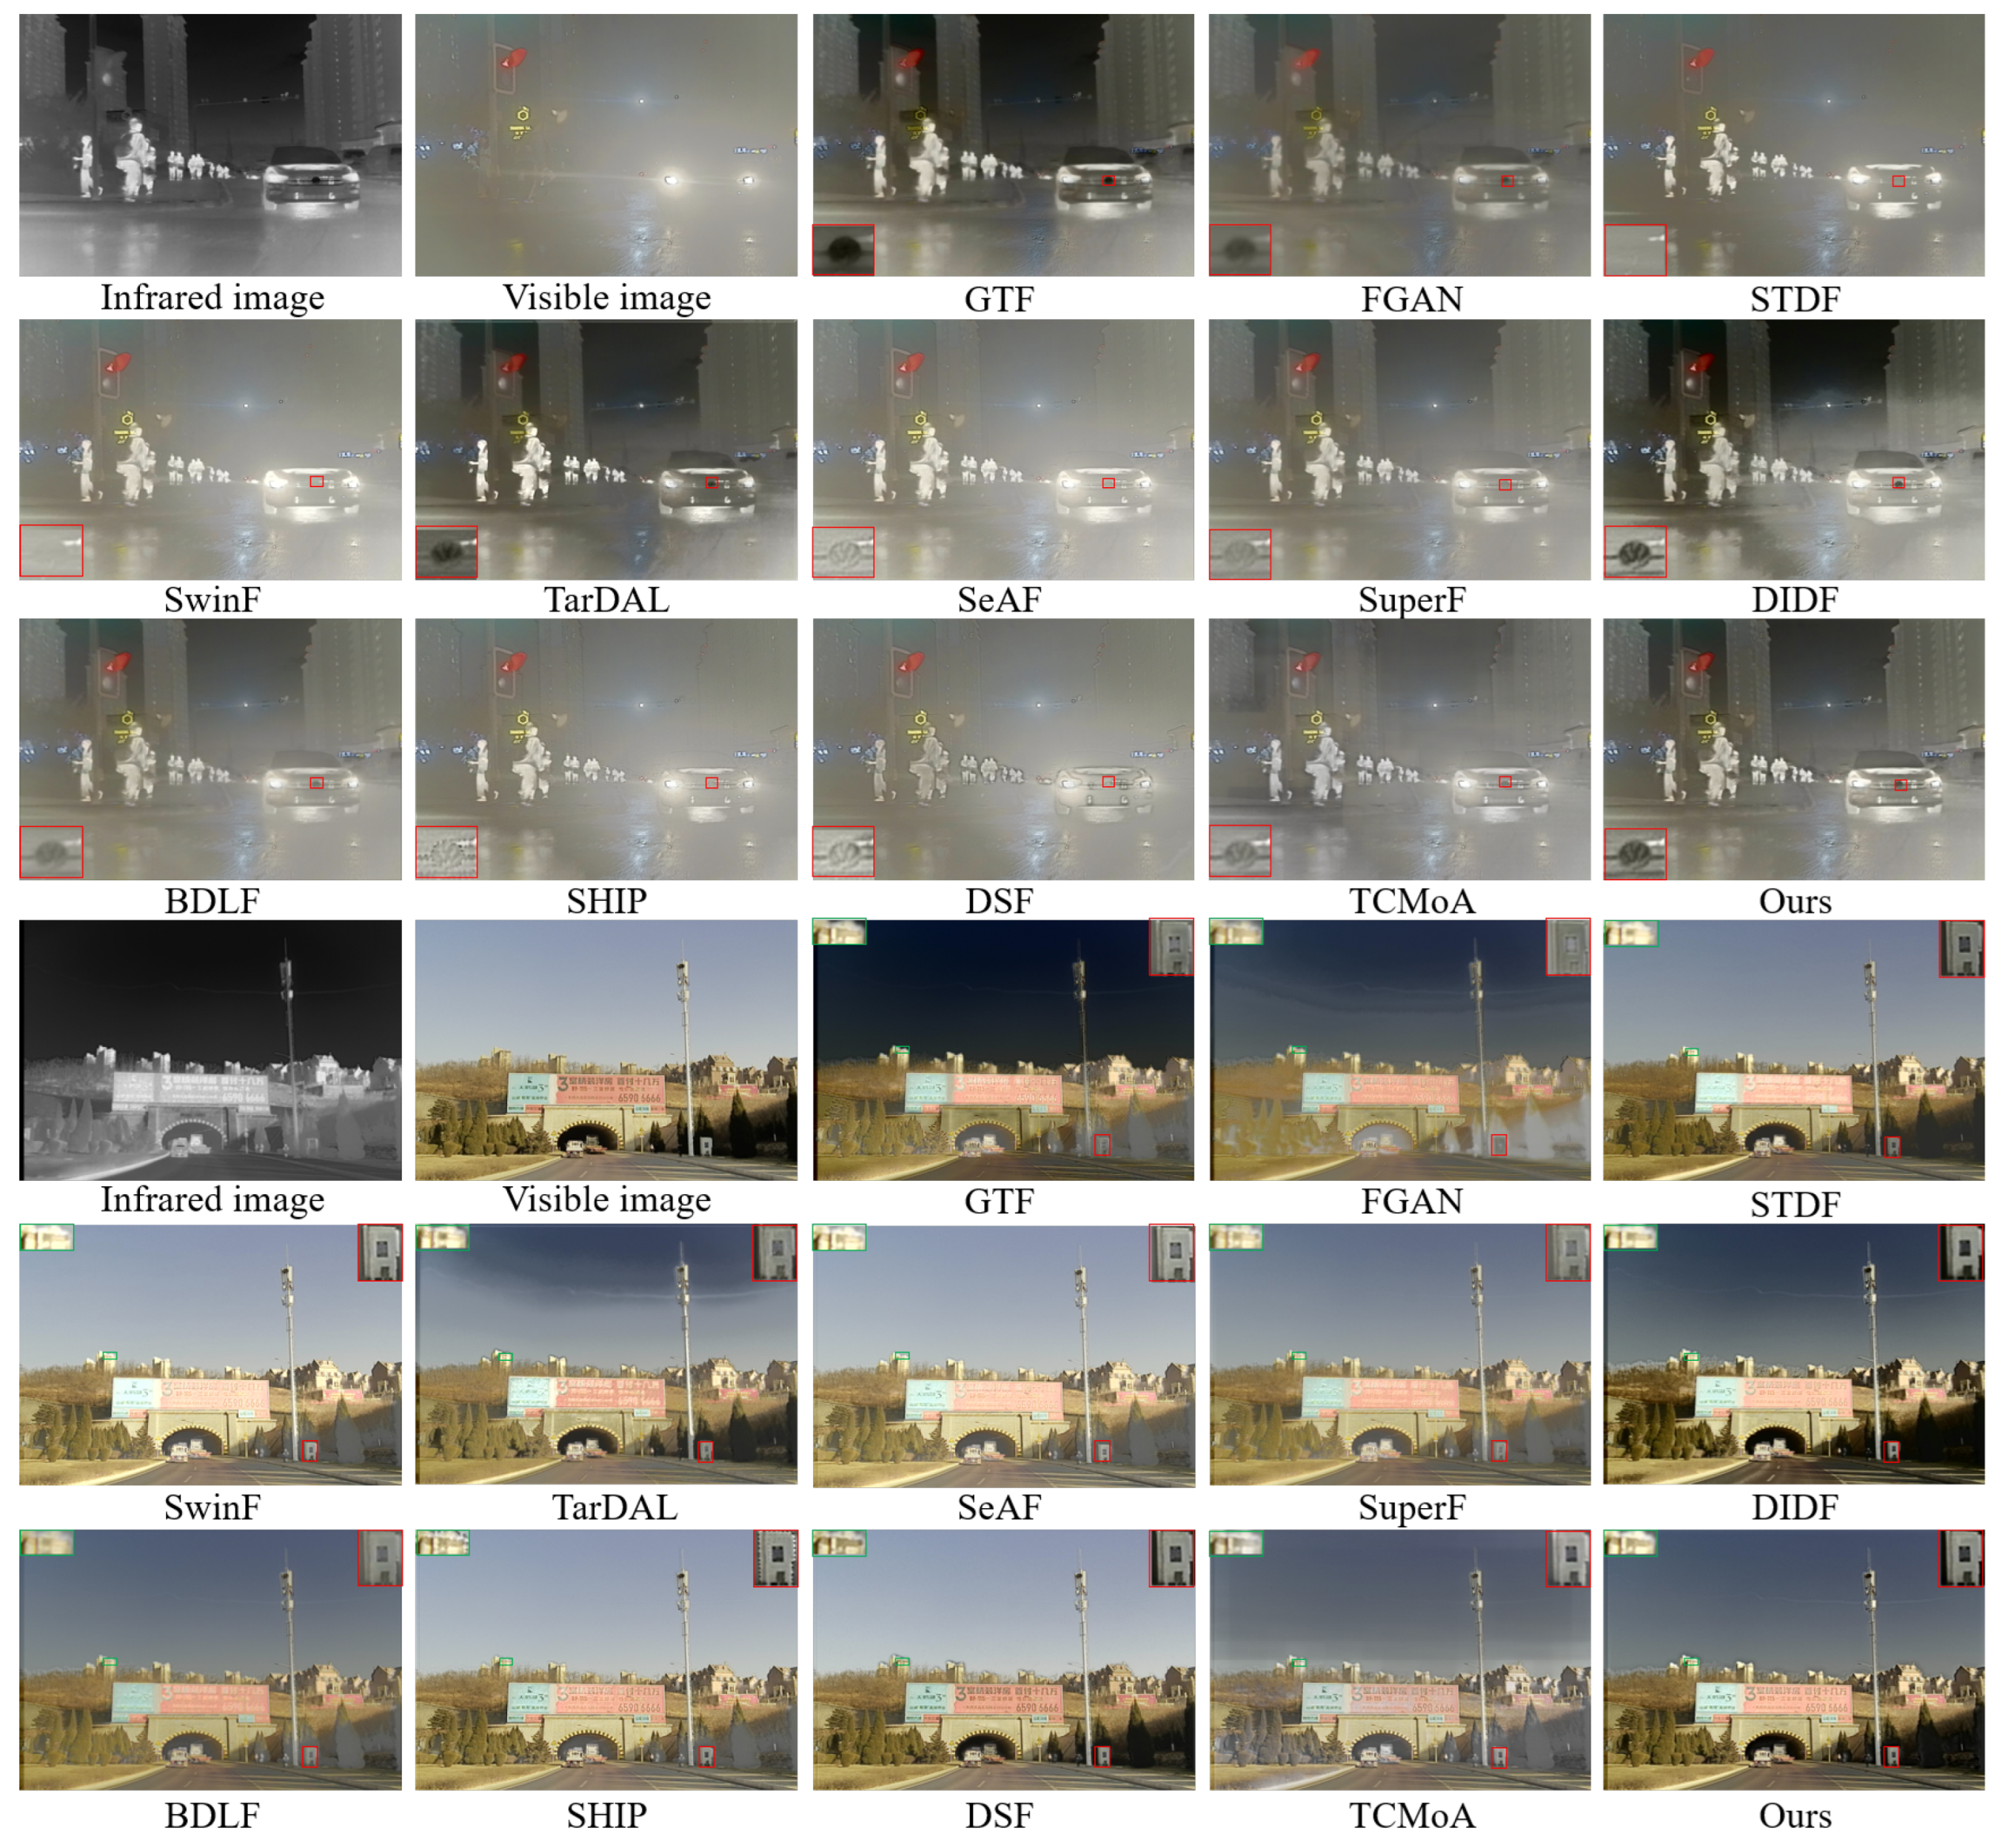
Qualitative analysis. Figure 7 shows two groups of qualitative experimental results from the dataset. In the first group of images, the visible image fails to provide effective scene details due to contamination. For instance, distinguishing the target person and the car logo inside the red box is challenging in the visible image but clear in the infrared image. The fusion images effectively integrate complementary features from visible and infrared images, but present visual differences across different methods. The results of GTF and FGAN tend towards the infrared image, while STDF, SwinF, TarDAL, SeAF, SuperF, DIDF, and BDLF preserve target information from the source image but lack texture detail. SHIP, DSF, and TCMoA retain significant texture detail but overlook contrast information. Remarkably, the proposed method not only performs well in preserving texture details and salient targets but also has superior visual effects. According to the analysis of the results, our method can effectively utilize infrared image information to complement severely contaminated visible images when they fail to provide scene details. This ability is attributed to CFMR and FFB, which calibrate and supplement the complementary features in source images. Furthermore, our method still demonstrates commendable performance under conditions of low illumination and when targets and backgrounds are similar, as illustrated in the second group in Figure 7. Overall, our method provides more thorough scene data and clearer visuals than other comparison methods.

Figure 7.
Qualitative analysis of different methods on the dataset. The regions to focus on are marked with red and green rectangles, with magnified views of these regions presented in the lower-left, upper-left, and upper-right corners.
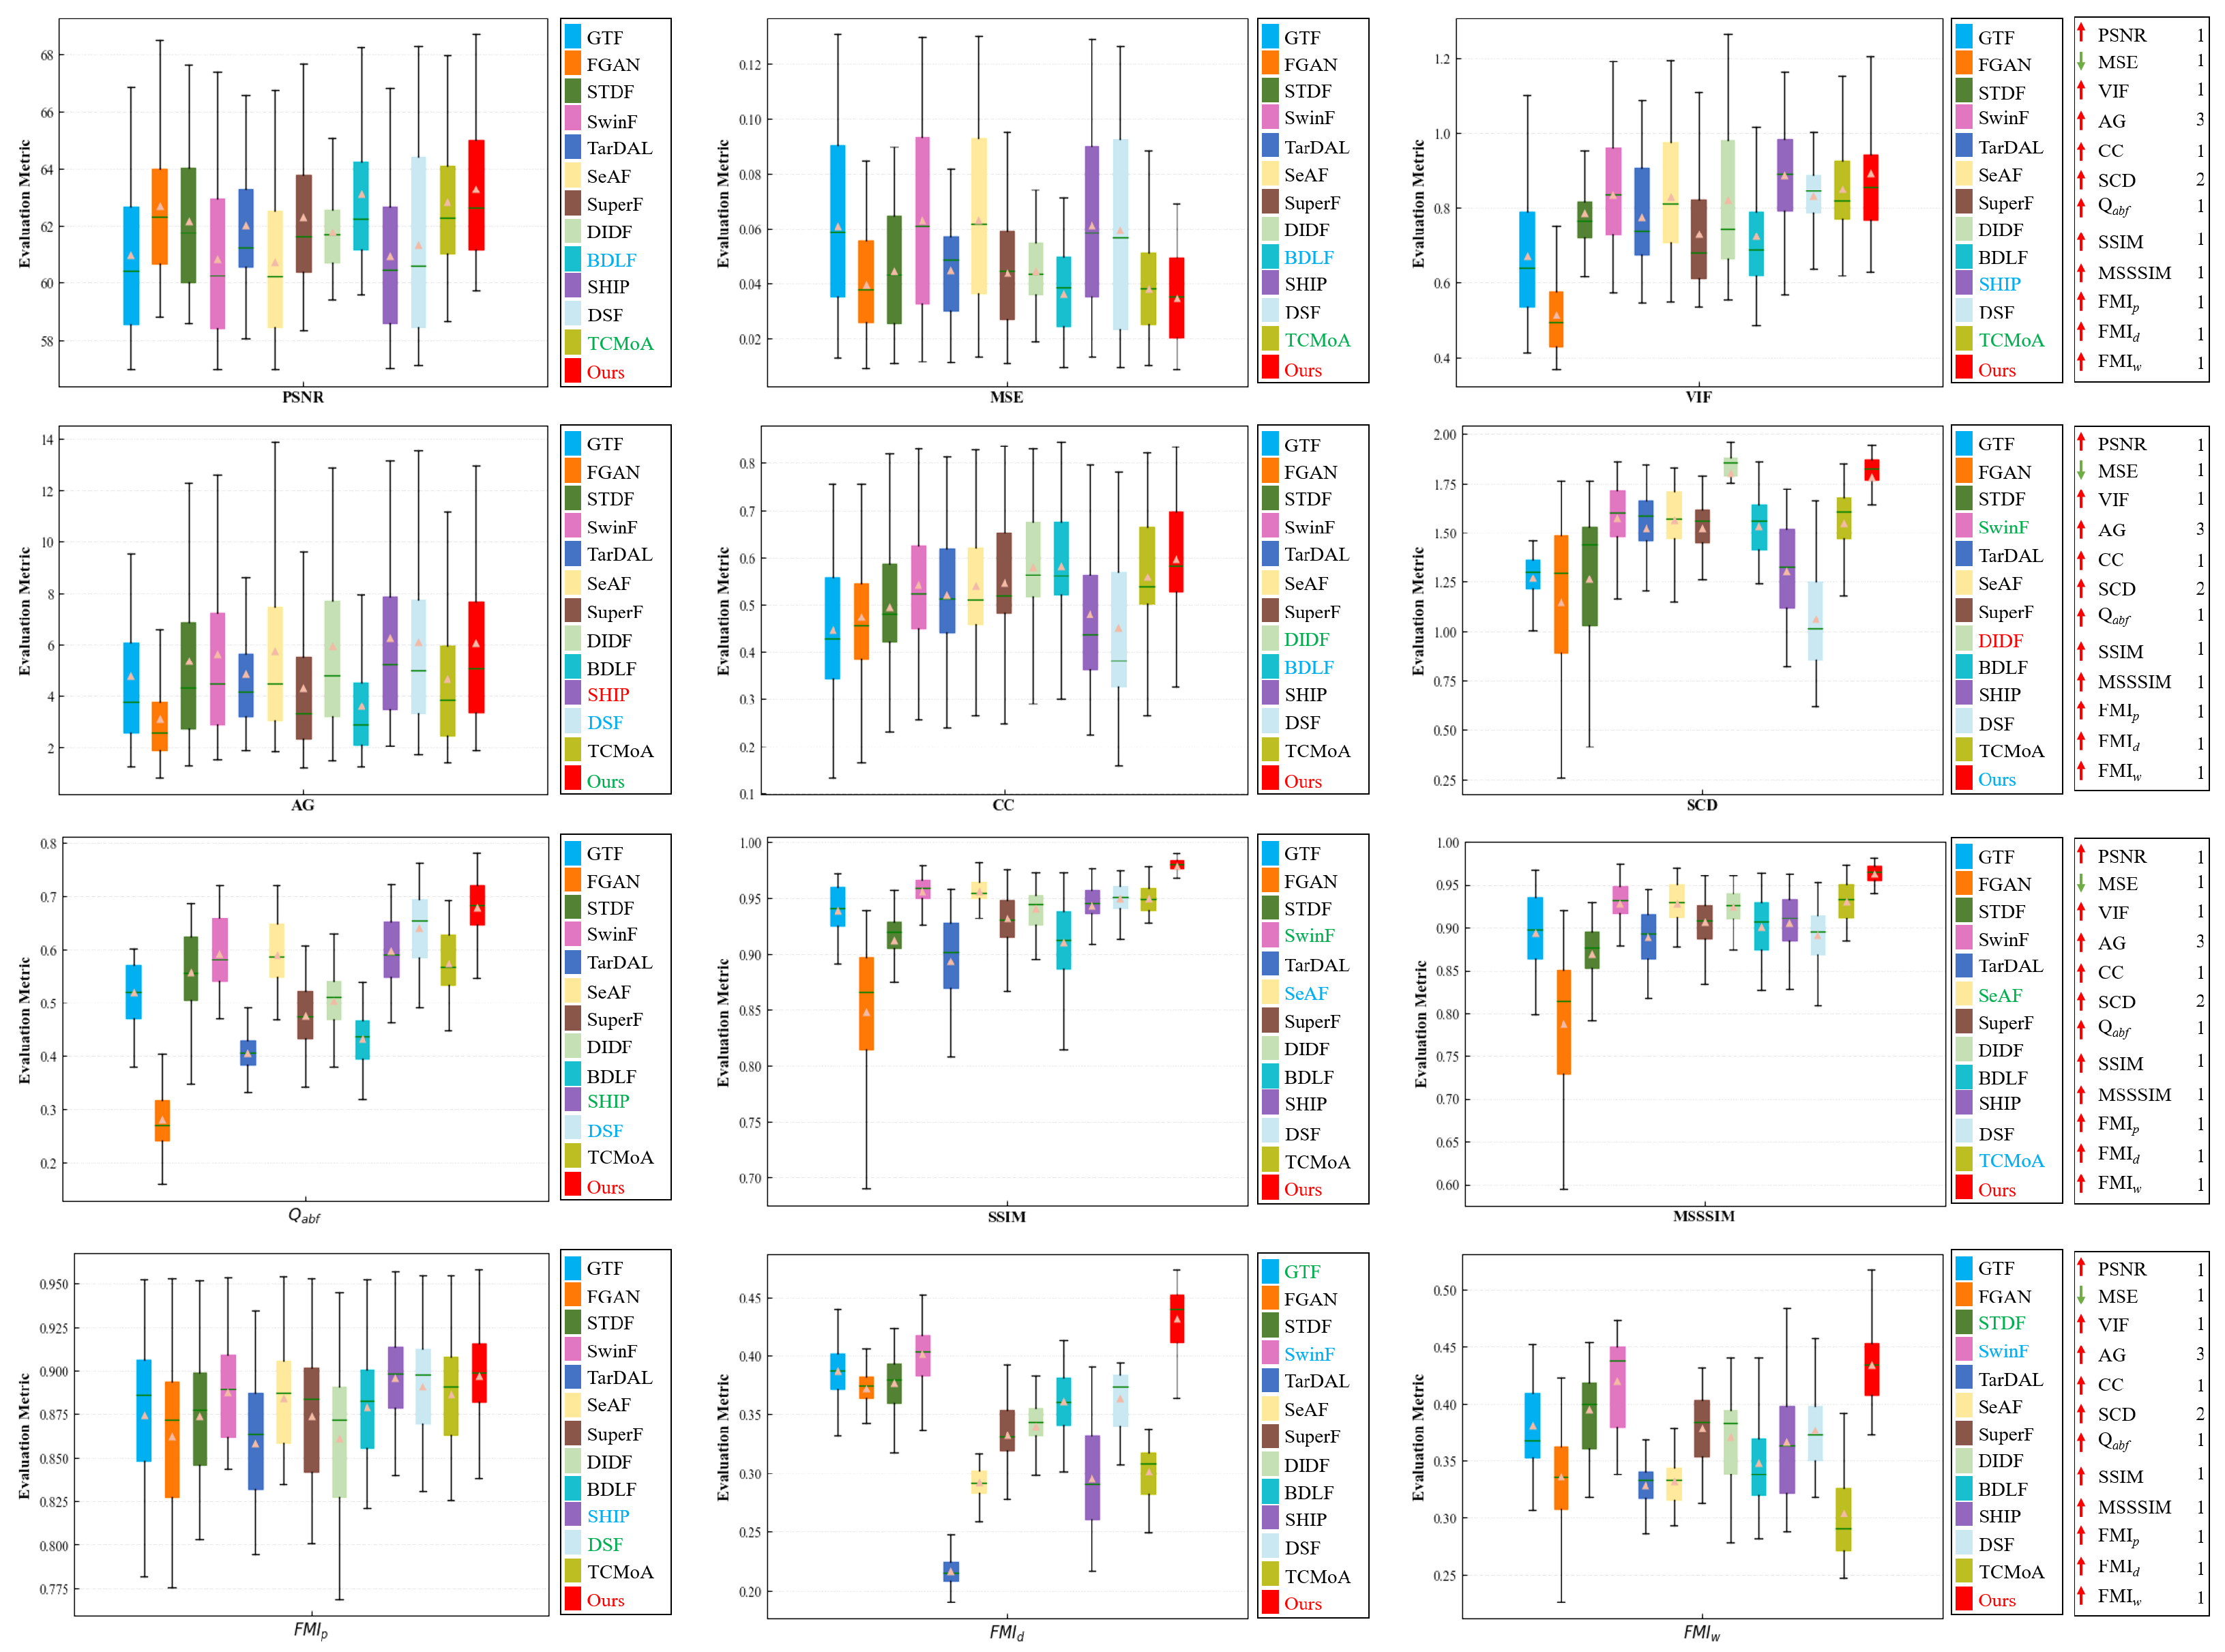
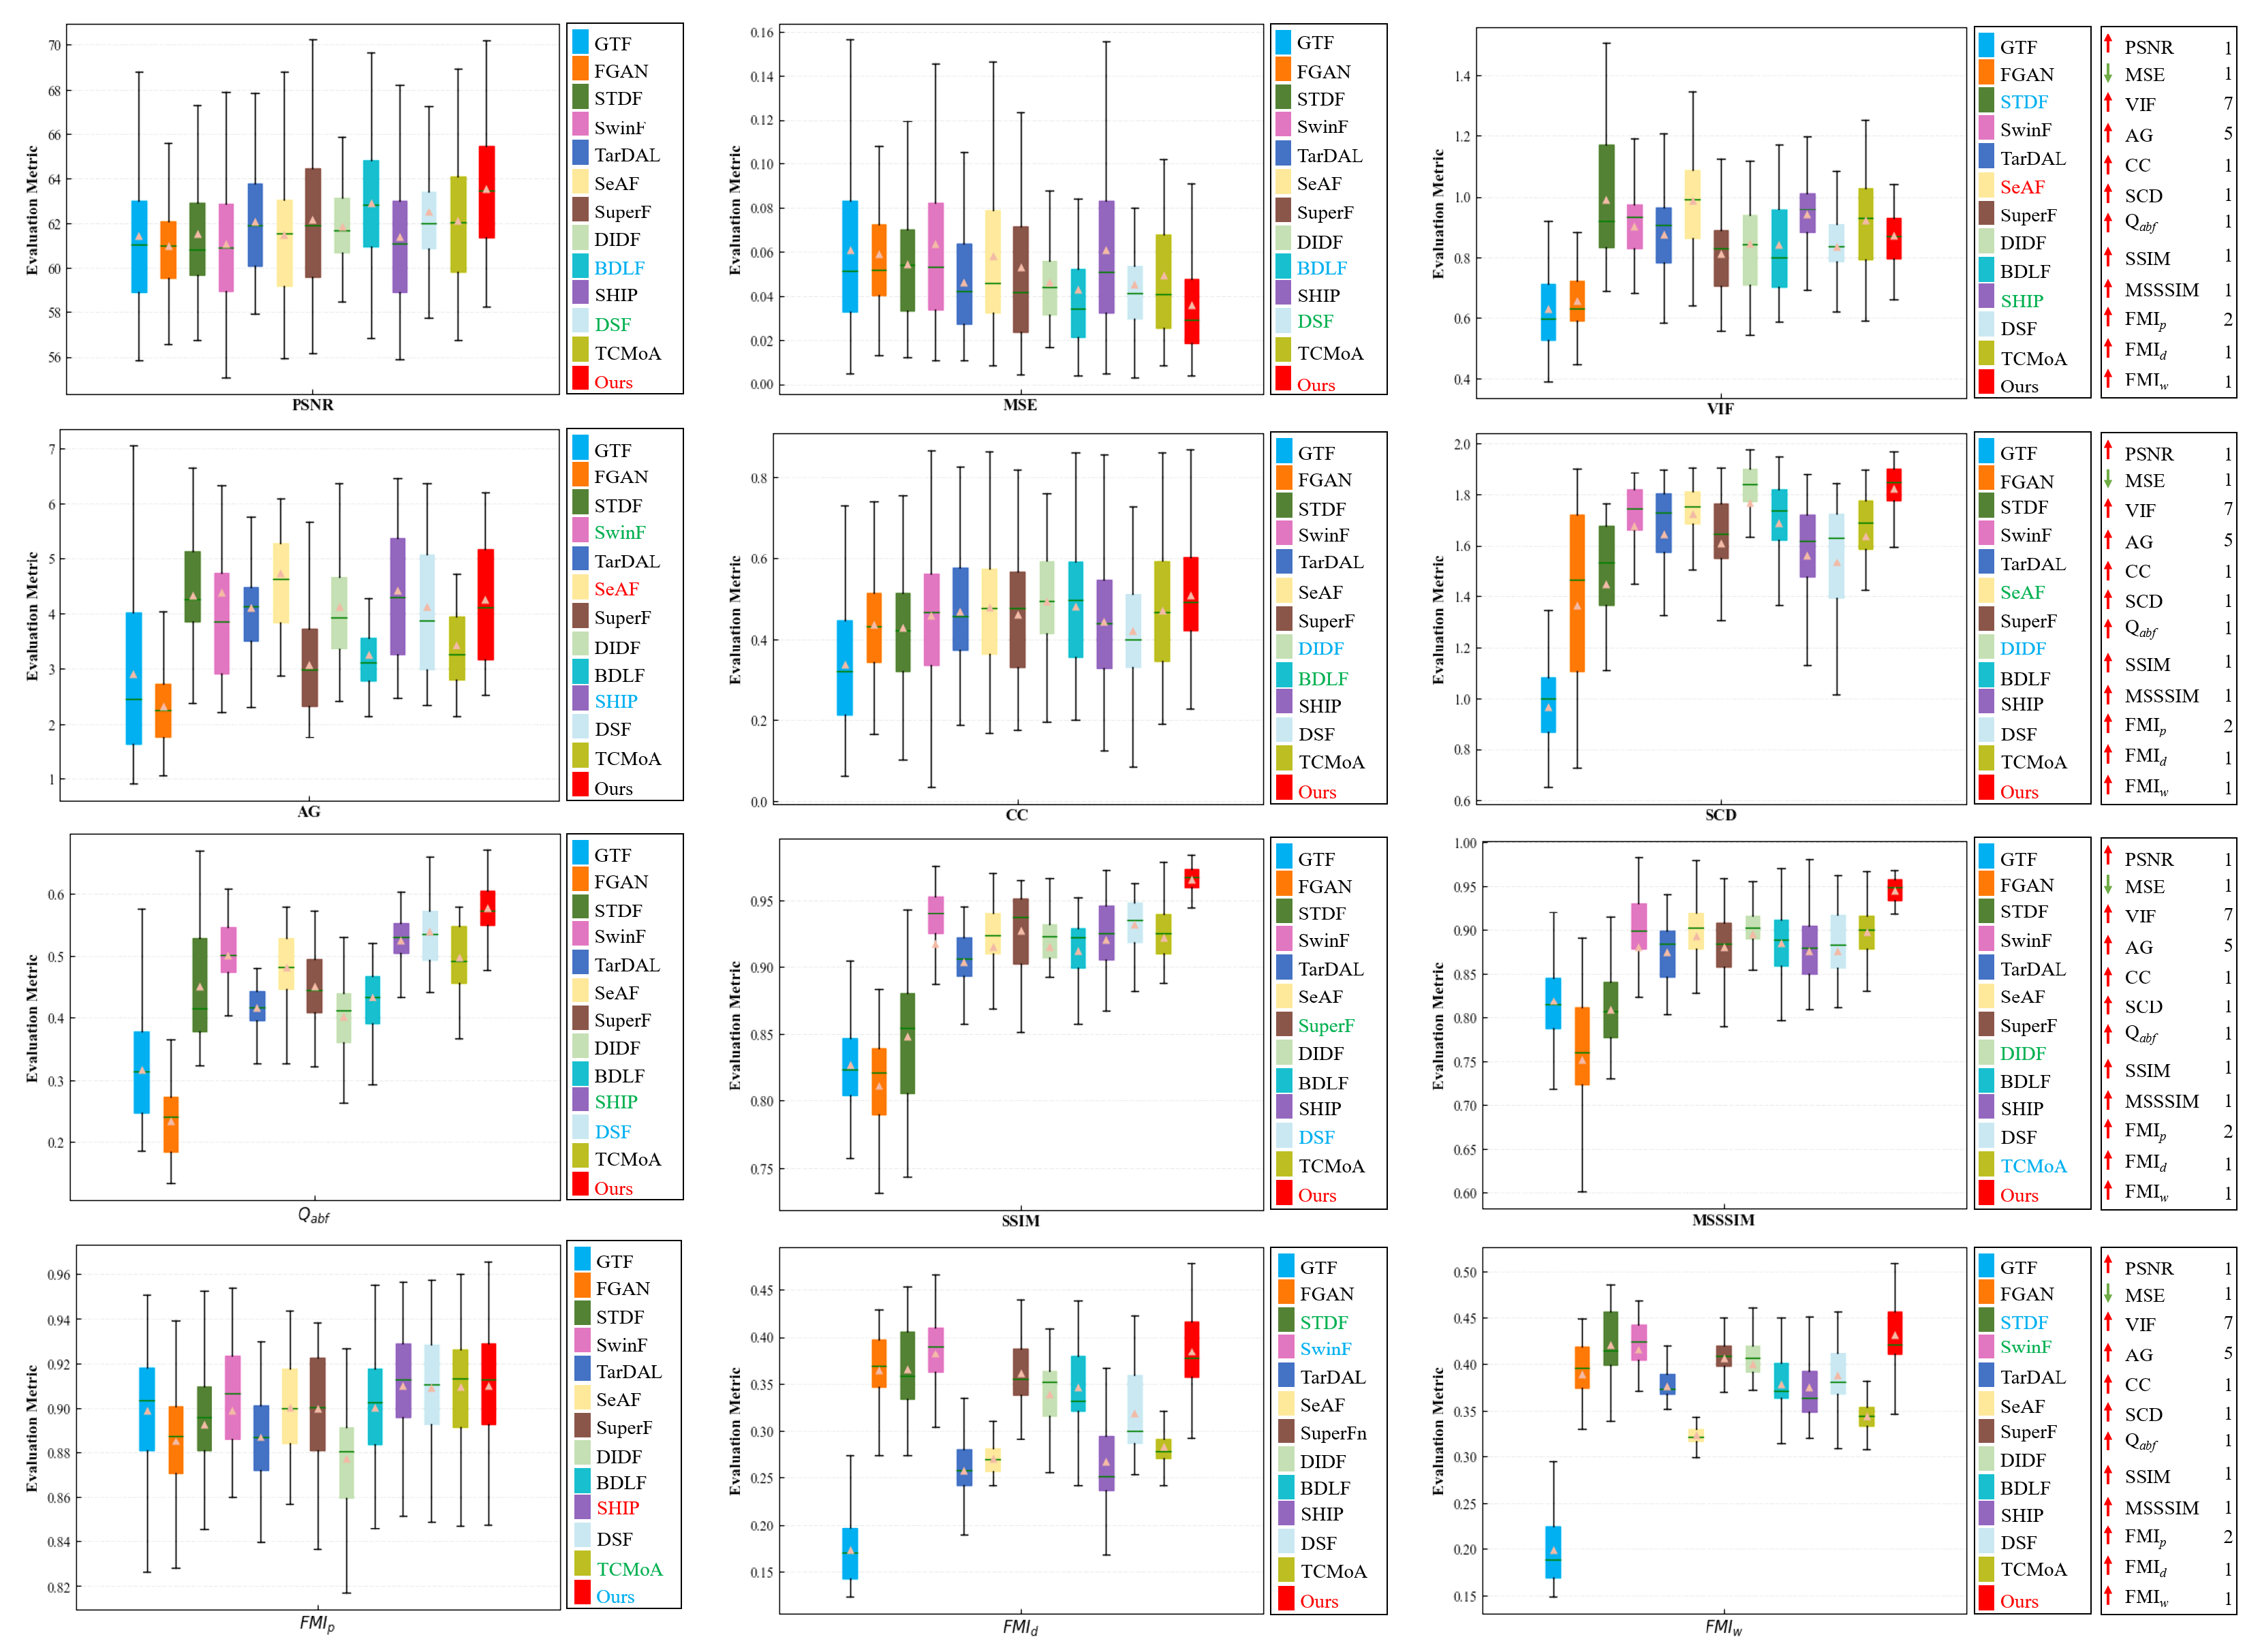
Quantitative analysis. To enhance the credibility of the evaluation results, we conduct a quantitative analysis using twelve evaluation metrics, as illustrated in Figure 8. The testing set comprises 76 image pairs randomly selected from the dataset. To make comparison easier, we rank the mean values of the twelve evaluation metrics for different methods to obtain an average ranking, as indicated in Table 1. According to the ranking results, our method excels over others in metrics such as PSNR, MSE, VIF, CC, , SSIM, MSSSIM, , , and . Regarding SCD, our results outperform all methods except DIDF, and we achieve the third-best in AG. Quantitative analysis demonstrates that our method can ensure the maximum preservation of texture details in visible images while retaining the prominent target in infrared images.
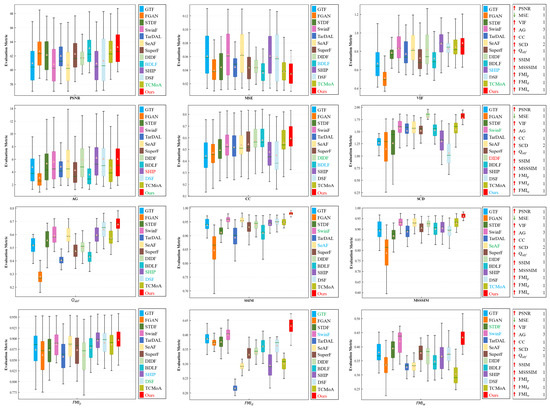
Figure 8.
Quantitative analysis of multiple evaluation metrics on the dataset. Within each box, the green line indicates the median value, and the orange tangle stands for the mean value. Red serves to highlight the best mean value, blue for the second-best, and green for the third-best. The rankings of the proposed method for each metric are displayed on the right.

Table 1.
The ranking results of different metrics on the dataset for different methods. Red serves to highlight the best result, blue for the second-best, and green for the third-best.
4.4. Generalization Experiment
Generalization assessment plays a vital role in evaluating fusion algorithms. We perform comprehensive experiments on the TNO, RoadScene, and LLVIP datasets to additionally validate the generalization and scalability of our method. The following will present a detailed analysis of the qualitative and quantitative experimental results of different methods on these three datasets.
4.4.1. Results on TNO Dataset
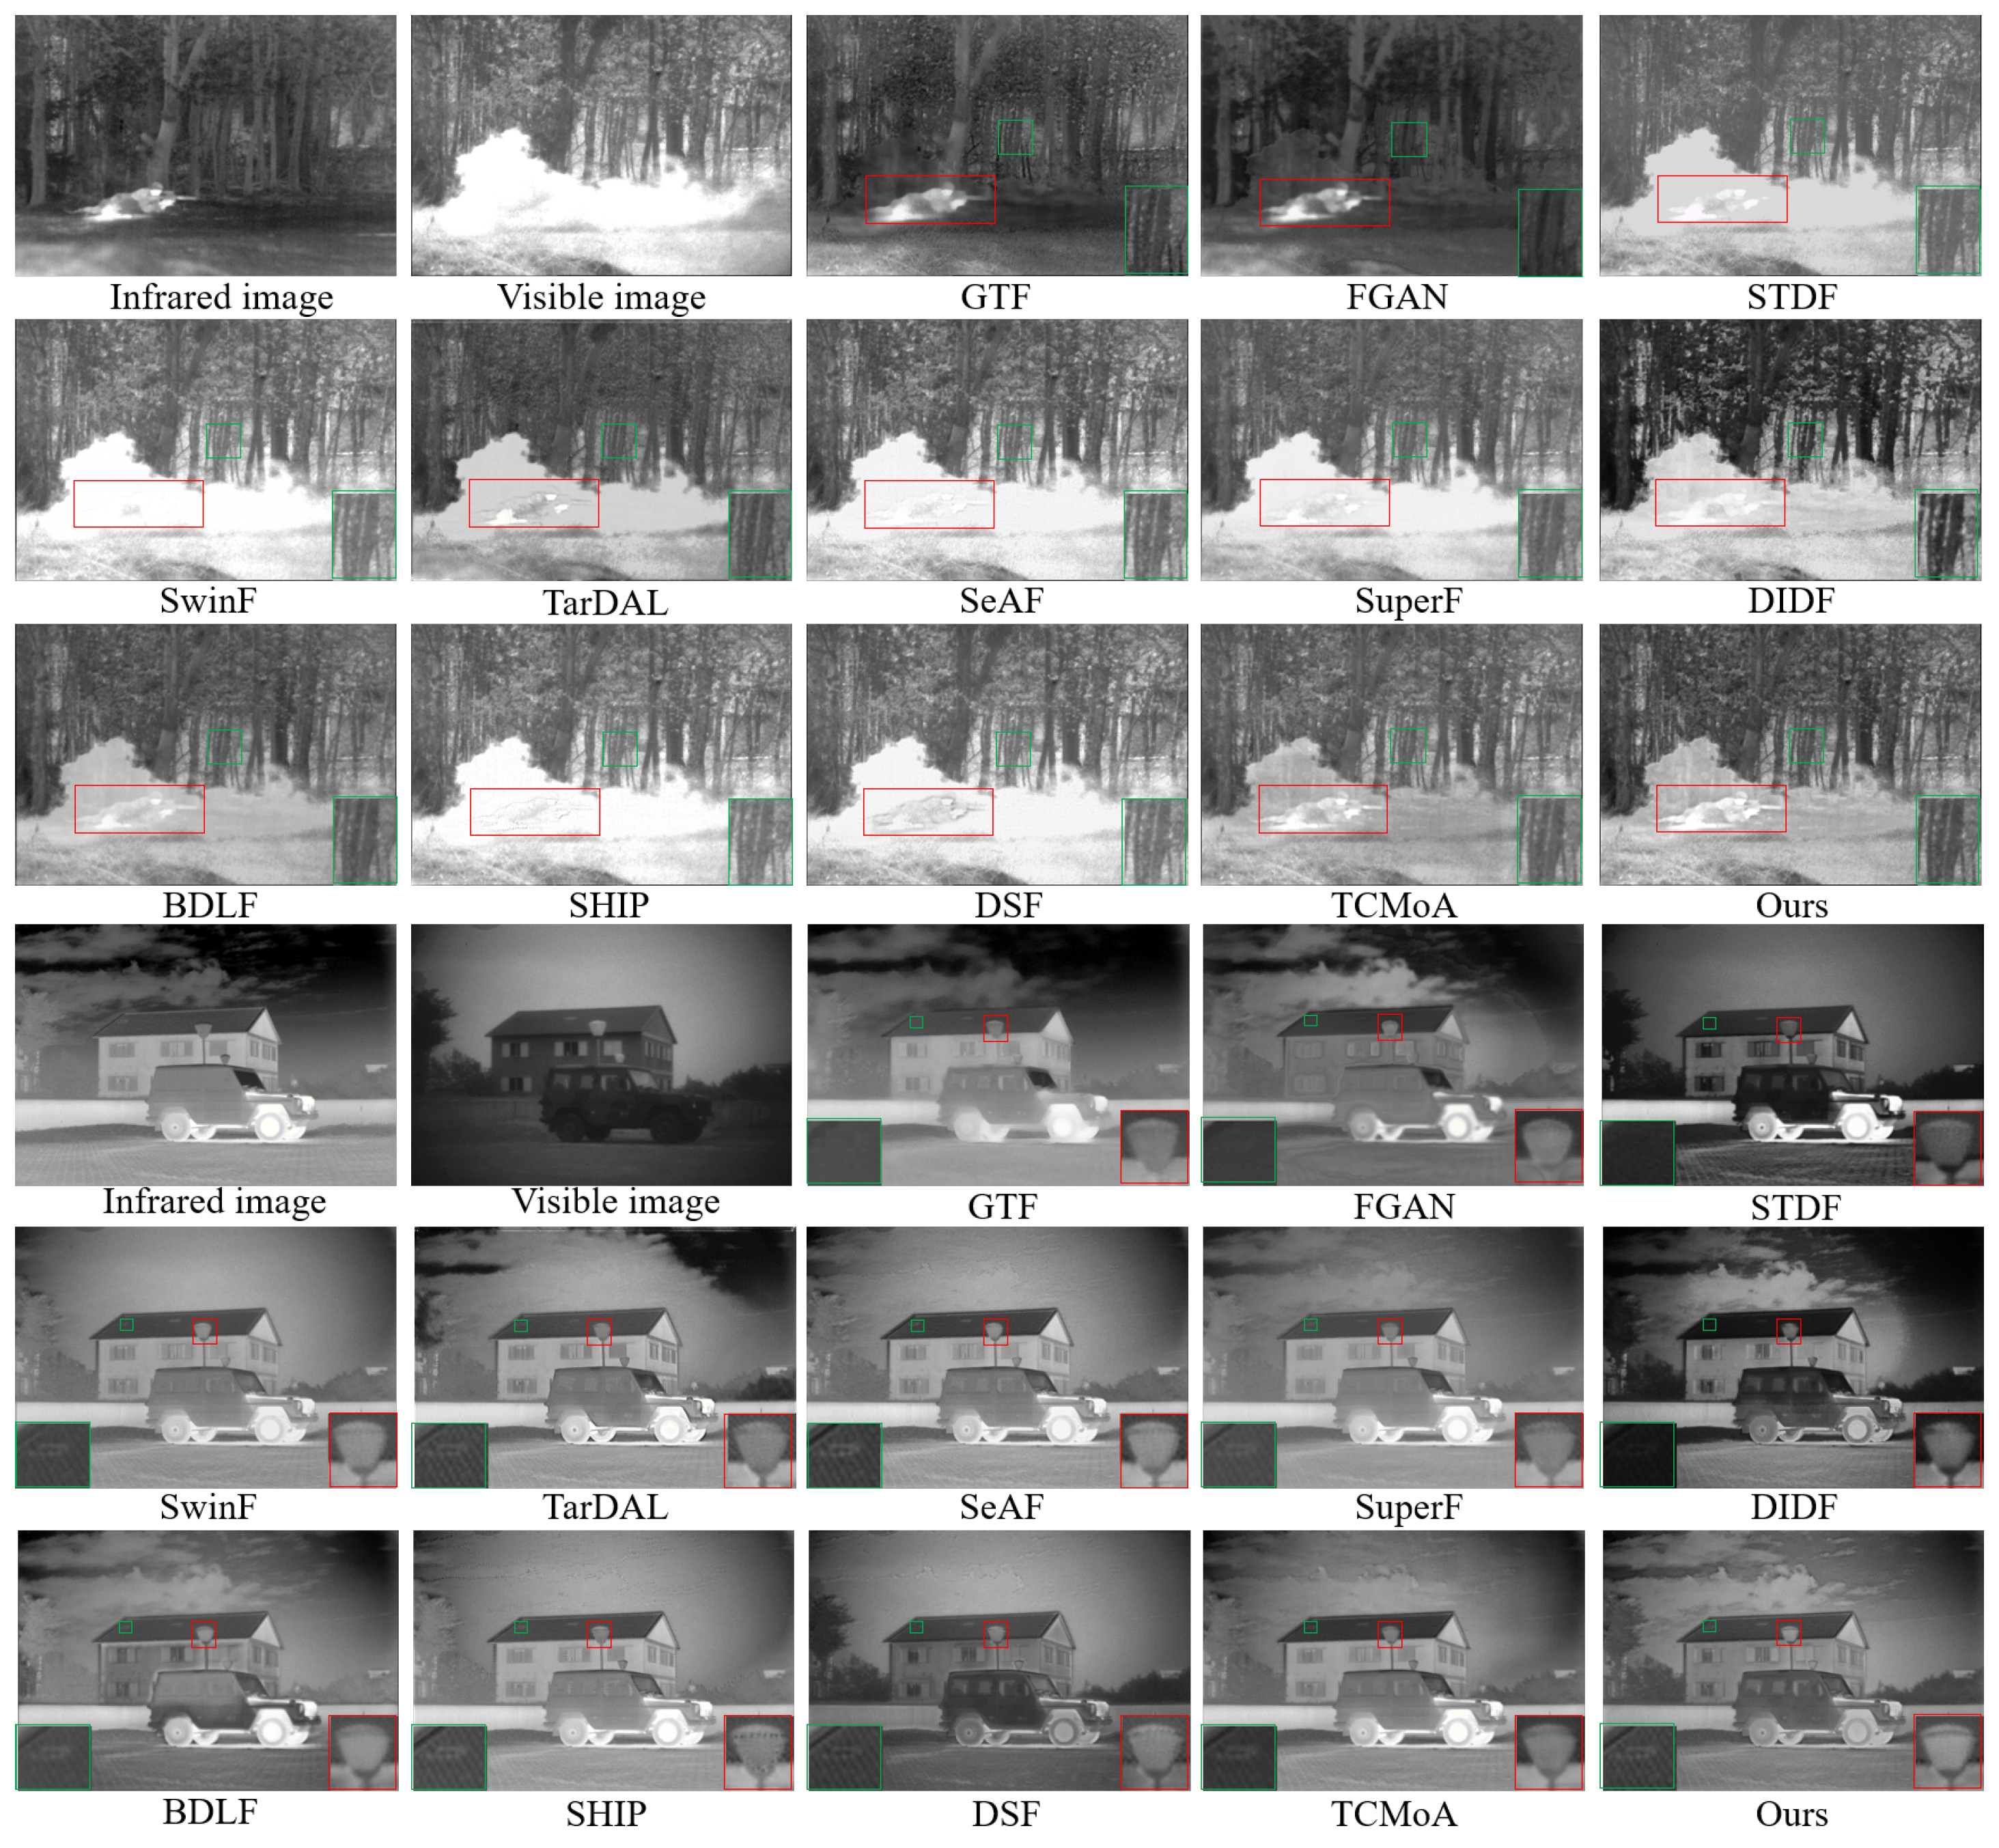
Qualitative analysis. We compare our method against twelve SOTA fusion methods to assess its generalization performance and robustness. Figure 9 presents the fusion results of two representative scenes: one is a smoke scene and the other is a daytime scene with low illumination. To facilitate the observation of the fusion results, we use red and green rectangles to mark some significant targets and texture detail information, respectively, in Figure 9. As observed in Figure 9, all methods can complete the basic fusion task. However, our method exhibits remarkable performance in subjective visual quality and retaining the crucial features in the source image. The fusion images generated by GTF and FGAN tend to infrared images, preserving the significant targets from the infrared images; nevertheless, they fail to integrate the texture detail from the visible images. STDF, SwinF, TarDAL, SeAF, SuperF, DIDF, BDLF, SHIP, and DSF can retain plentiful texture details from the visible images but insufficiently maintain significant targets from the infrared images. TCMoA can maintain the prominent targets from the infrared images and the texture details from the visible images but suffers from low contrast. In comparison, our method has satisfactory visual quality while retaining abundant texture detail from visible images and significant targets from infrared images.
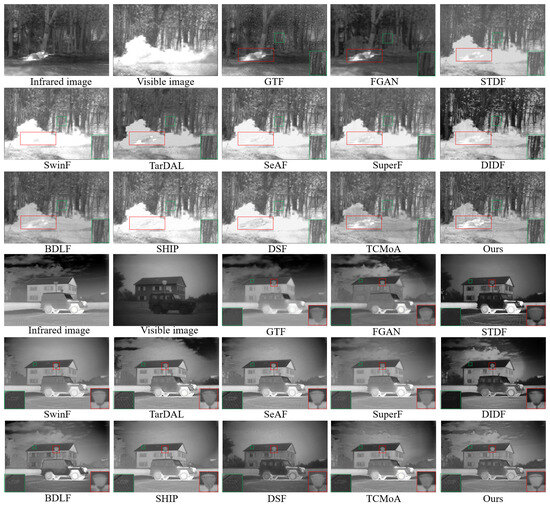
Figure 9.
Qualitative analysis of different methods on the TNO dataset. The regions to focus on are marked with red and green rectangles, with magnified views of these regions presented in the lower-right or lower-left corners.
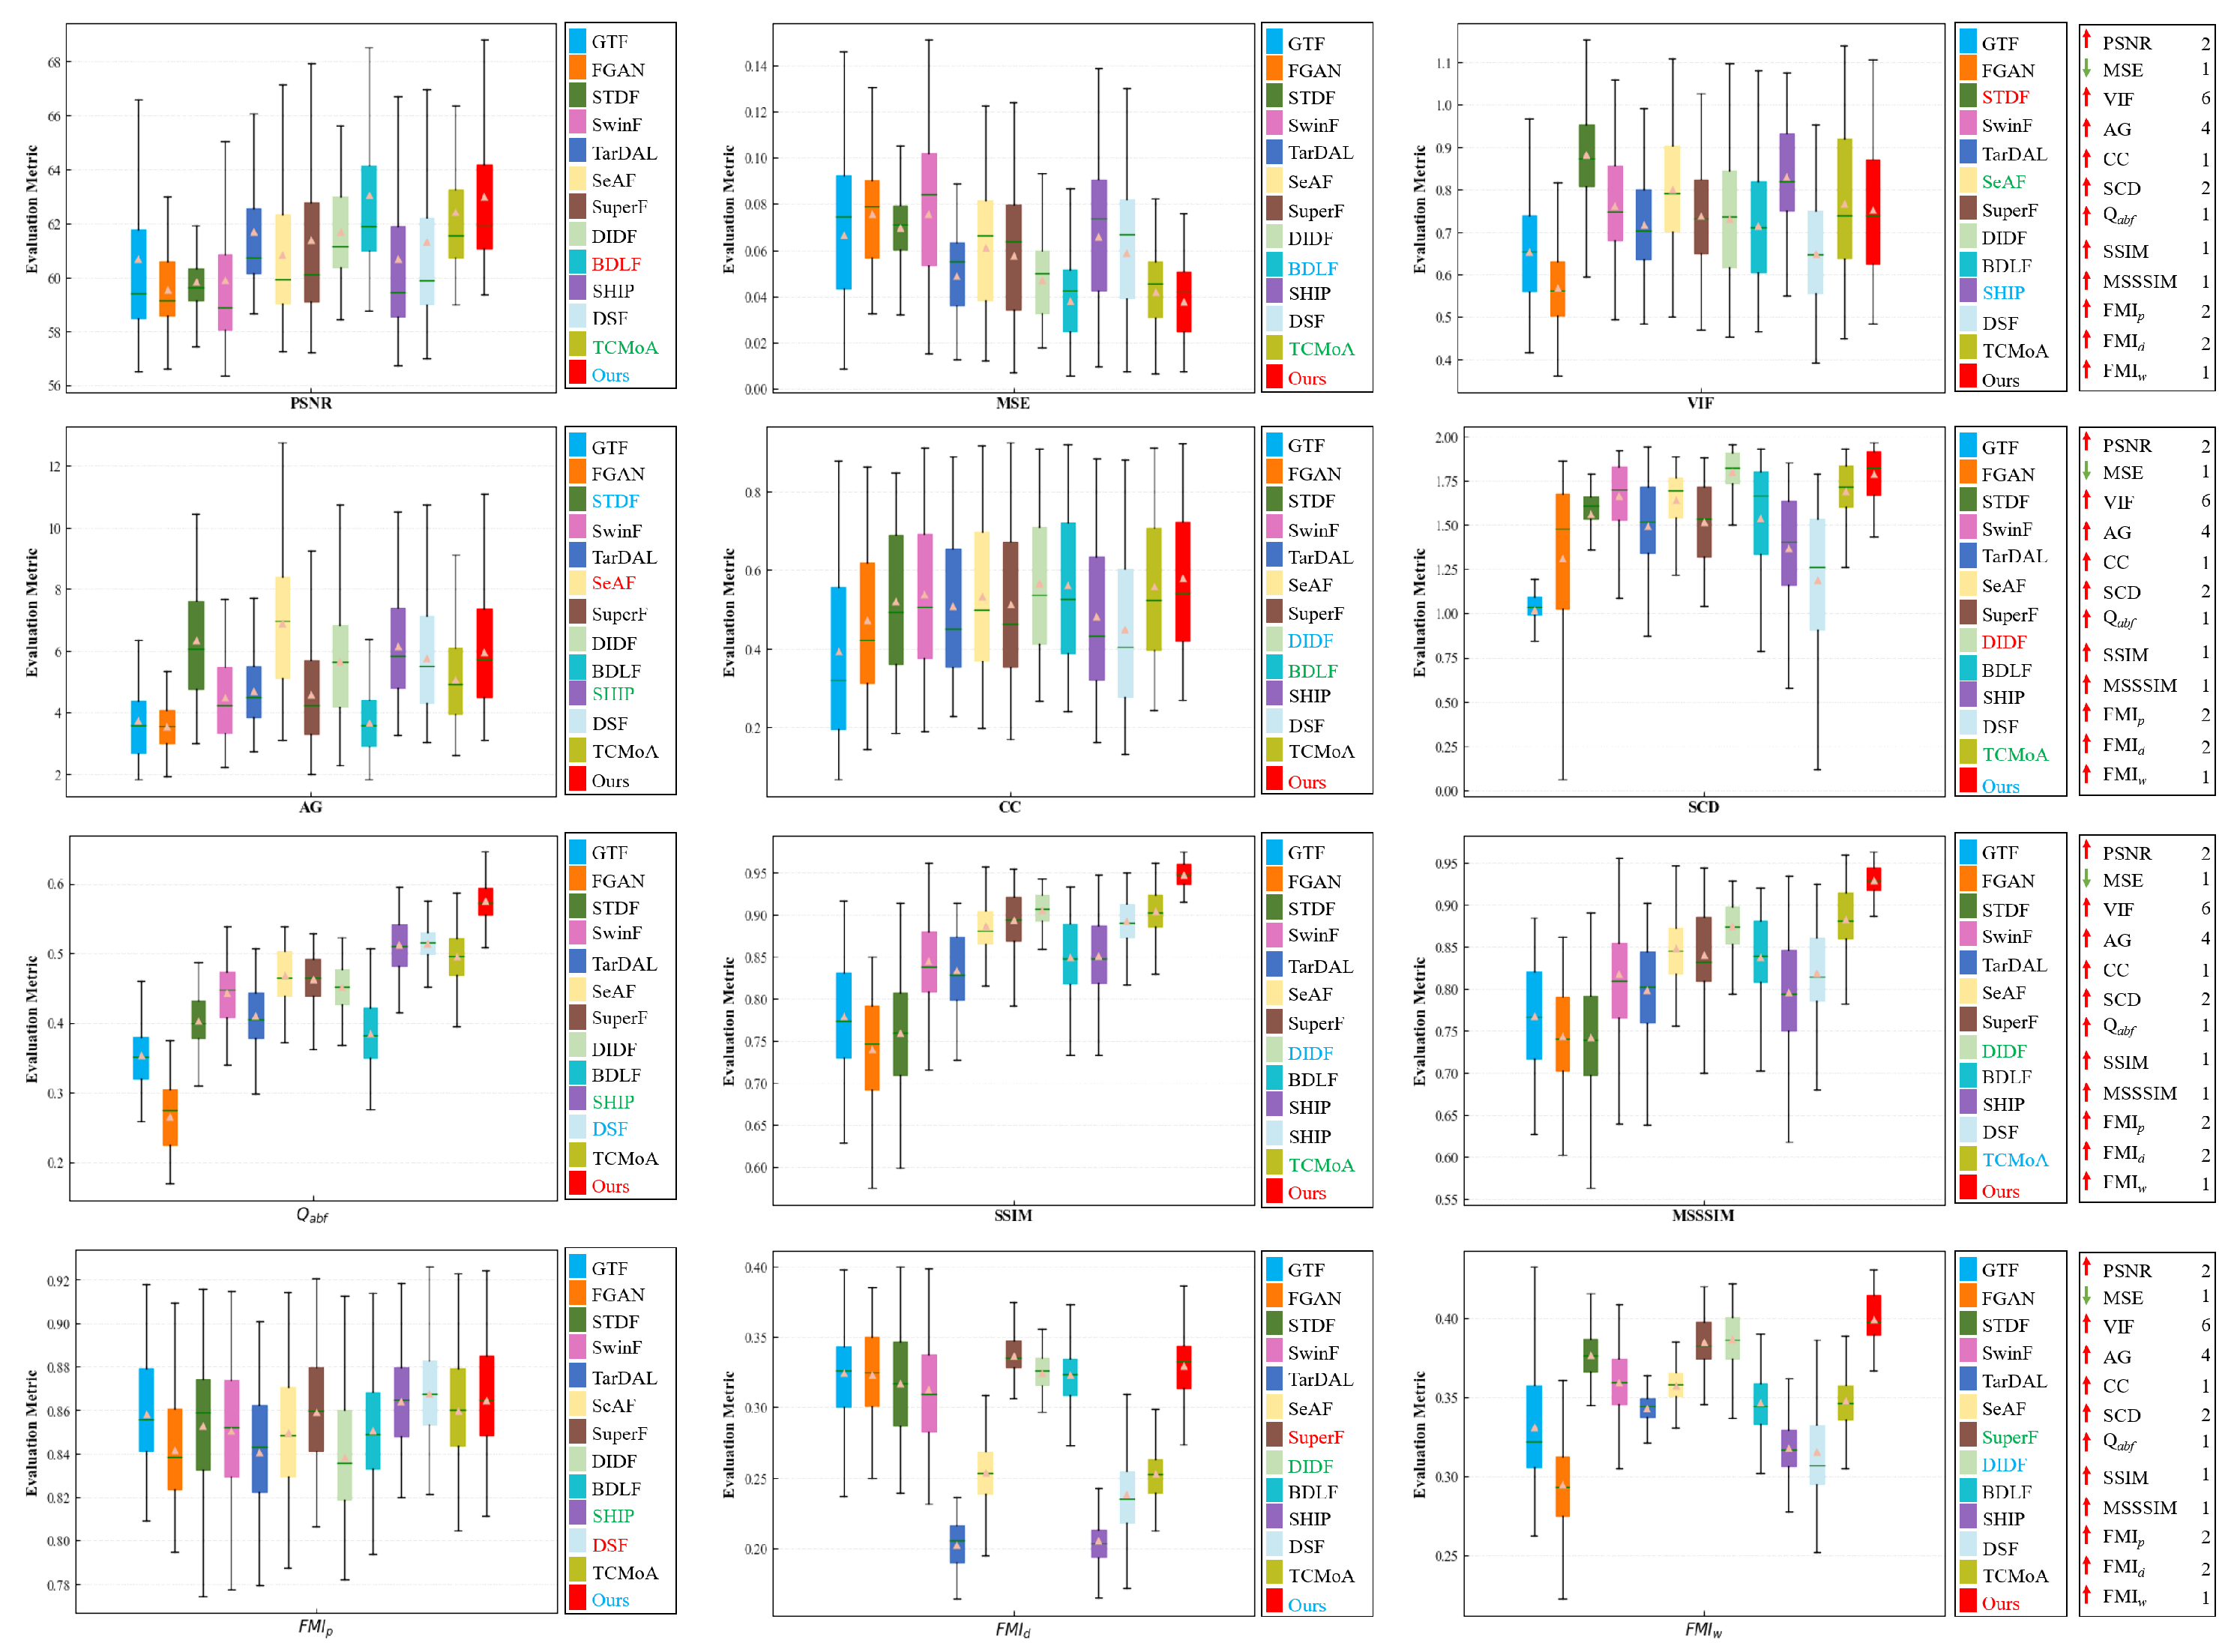
Quantitative analysis. Figure 10 and Table 2 demonstrate the quantitative results of different methods. It is apparent from the results that our method excels over others in terms of PSNR, MSE, CC, SCD, , SSIM, MSSSIM, , and , and ranks second only to MPCF on . The analysis of these metrics indicates that our fusion results are extremely similar to the source images—with low noise, rich details, and high contrast—and demonstrate excellent visual effects.
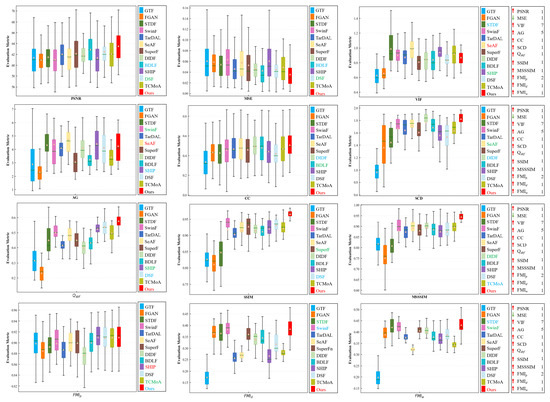
Figure 10.
Quantitative analysis of multiple evaluation metrics on the TNO dataset. Within each box, the green line indicates the median value and the orange tangle stands for the mean value. Red serves to highlight the best mean value, blue for the second-best, and green for the third-best. The rankings of the proposed method for each metric are displayed on the right.
Table 2.
The ranking results of different metrics on the TNO dataset for different methods. Red serves to highlight the best result, blue for the second-best, and green for the third-best.
4.4.2. Results on RoadScene Dataset
Qualitative analysis. IVIF is instrumental in various traffic applications. Therefore, we choose to test twelve SOTA methods and our method on the RoadScene dataset. Figure 11 displays two sets of the most representative image pairs. The first set is a daytime scene and the second is a night scene with strong light illumination. The details of the utility poles are clearly depicted in our fusion results for the first group of images, while in the second group, even the details of a person concealed in darkness are clearly visible from our result. In comparison, the fusion results from GTF and FGAN are relatively blurry and lose important salient target information, such as the person within the green rectangle of the second set. DIDF, BDLF, and DSF suffer from low contrast, while STDF, SwinF, TarDAL, SeAF, and SuperF lose some texture detail information, marked in red rectangles in Figure 11. While SHIP, TCMoA, and our method retain salient target information and sufficient texture details, SHIP and TCMoA still have some artifacts. Generally, our method maintains essential features from the source images while mitigating interference from useless information, conforming to human visual perception.
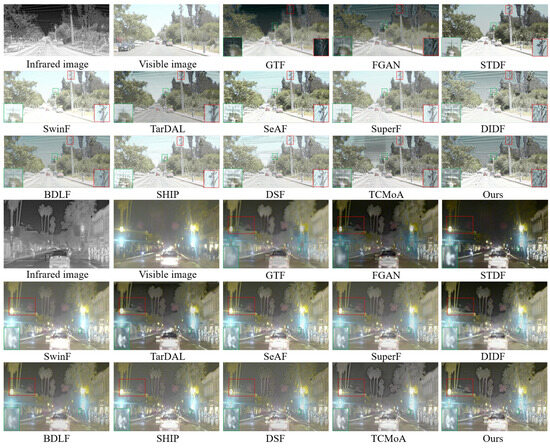
Figure 11.
Qualitative analysis of different methods on the RoadScene dataset. The regions to focus on are marked with red and green rectangles, with magnified views of these regions presented in the lower-left or lower-right corners.
Quantitative analysis. Quantitative analysis was conducted on 110 image pairs randomly selected from the RoadScene dataset. Figure 12 and Table 3 present our quantitative results, which reveal that our method excels in multiple evaluation metrics. Specifically, our method excels in MSE, CC, , SSIM, MSSSIM, and , achieving the highest scores, while ranking second in PSNR, SCD, , and . In general, the proposed method exhibits excellent generalization performance and can still achieve satisfactory fusion results even in environments with small differences between the background and the target and insufficient lighting.
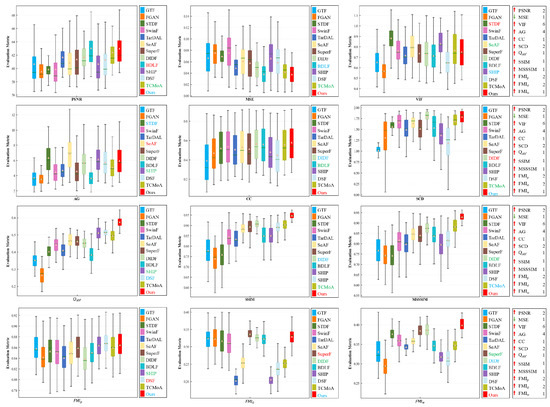
Figure 12.
Quantitative analysis of multiple evaluation metrics on the RoadScene dataset. Within each box, the green line indicates the median value and the orange tangle stands for the mean value. Red serves to highlight the best mean value, blue for the second-best, and green for the third-best. The rankings of the proposed method for each metric are displayed on the right.
Table 3.
The ranking results of different metrics on the RoadScene dataset for different methods. Red serves to highlight the best result, blue for the second-best, and green for the third-best.
4.4.3. Results on LLVIP Dataset
Qualitative analysis. Compared to the fusion of daytime scenes, the low illumination image fusion presents more challenges. When visible images are affected by strong illumination sources and fail to provide sufficient scene information, high-performance fusion methods can effectively utilize infrared images for supplementation. To additionally confirm the superiority of our method, a fusion test on the LLVIP dataset is conducted, with qualitative results depicted in Figure 13. The first group depicts scenes with insufficient illumination at night, while the second group shows nighttime scenes with strong illumination interference. From the displayed results, our method preserves significant targets from the infrared image and the abundant texture details from the visible image while also effectively resisting strong illumination interference to generate high-quality fusion images.
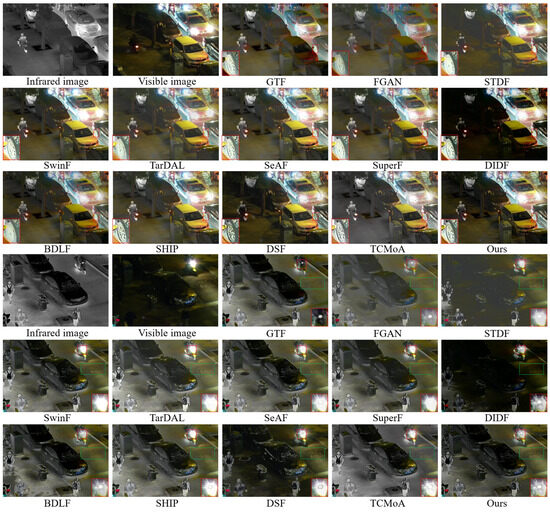
Figure 13.
Qualitative analysis of different methods on the LLVIP dataset. The regions to focus on are marked with red and green rectangles, with magnified views of these regions presented in the lower-left or lower-right corners.
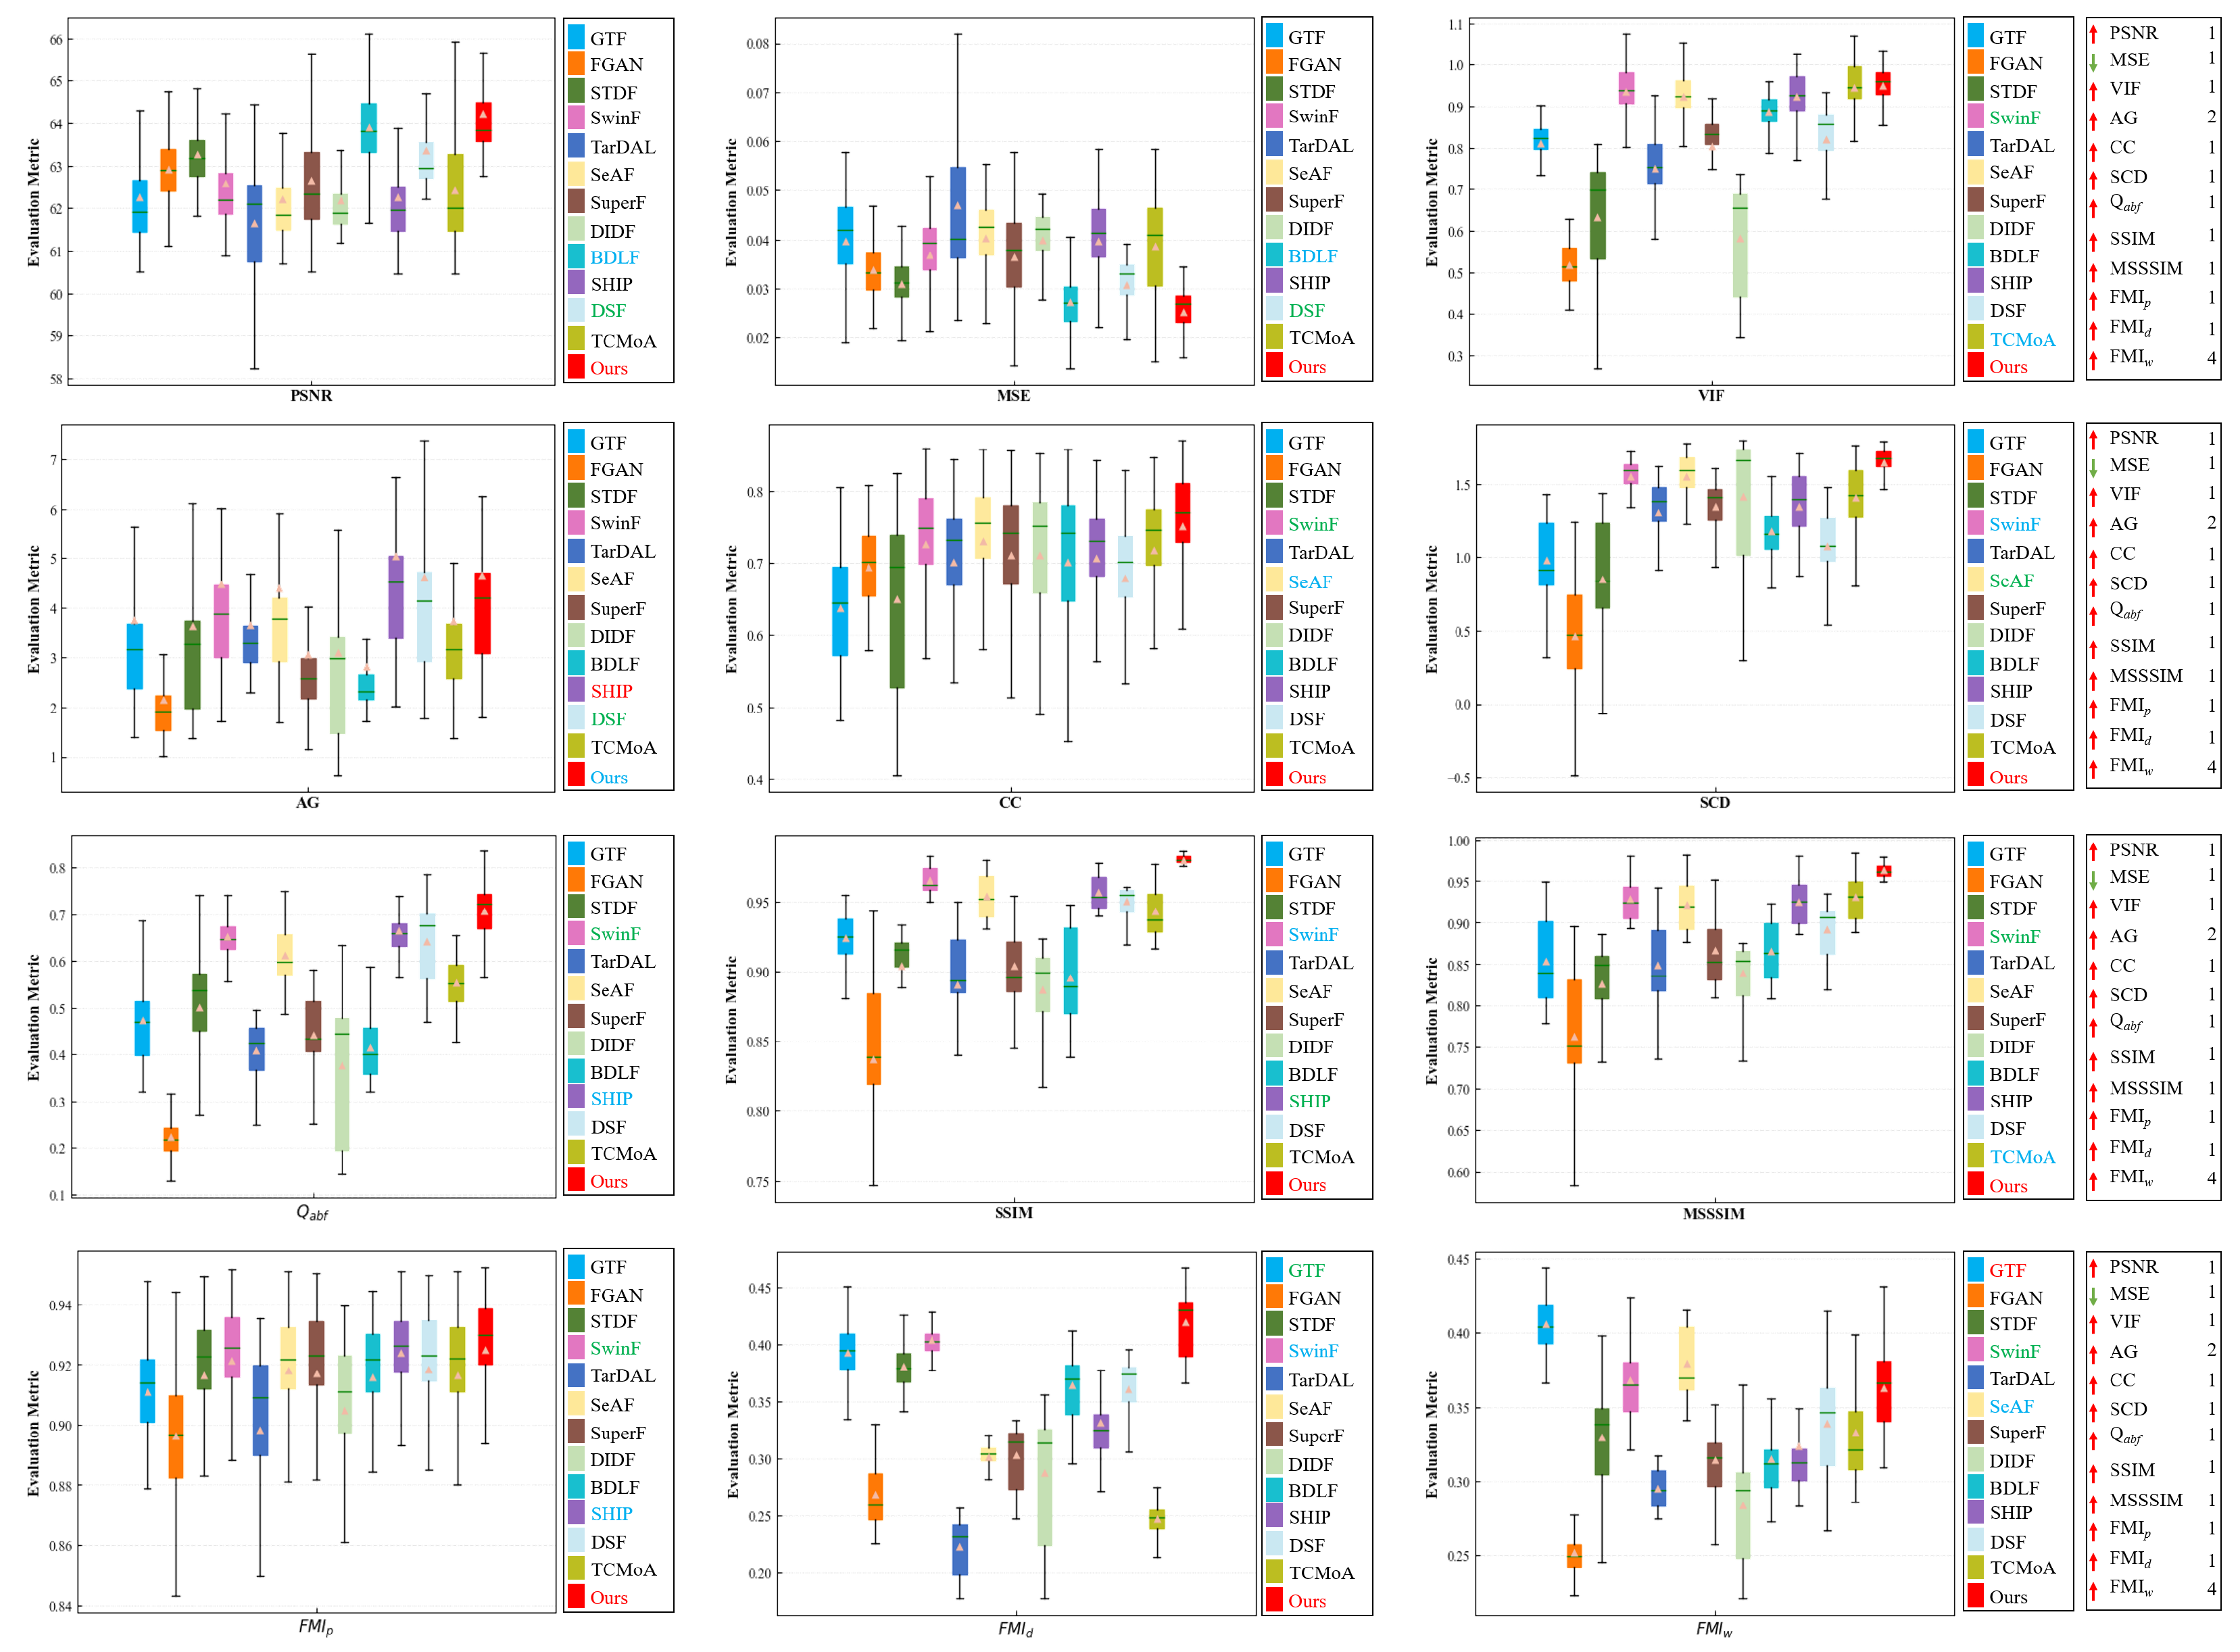
Quantitative analysis. We conduct a quantitative analysis using 96 image pairs randomly selected from the LLVIP dataset. As depicted in Figure 14 and Table 4, the quantitative results demonstrate that our method outperforms others on multiple evaluation metrics. Specifically, it excels in PSNR, MSE, VIF, CC, SCD, , SSIM, MSSSIM, , and . On the AG metric, our method is ranked second. On the metric, our method ranks fourth. Overall, the proposed method exhibits good generalization ability and robustness, efficiently accomplishing image fusion tasks in various complex environments.
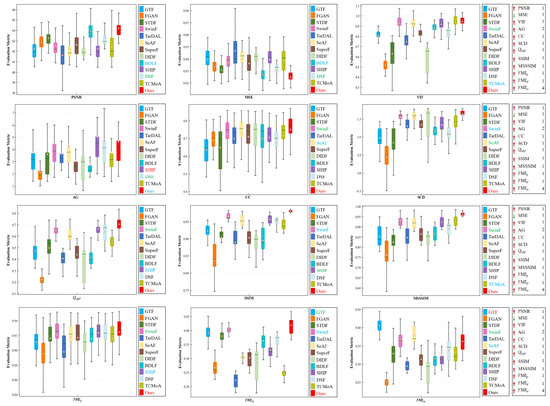
Figure 14.
Quantitative analysis of multiple evaluation metrics on the LLVIP dataset. Within each box, the green line indicates the median value and the orange tangle stands for the mean value. Red serves to highlight the best mean value, blue for the second-best, and green for the third-best. The rankings of the proposed method for each metric are displayed on the right.
Table 4.
The ranking results of different metrics on the LLVIP dataset for different methods. Red serves to highlight the best result, blue for the second-best, and green for the third-best.
4.5. Ablation Experiment
We will evaluate the effectiveness of each module in this section. The proposed method comprises three crucial modules, namely, CMFC, FFB, and HPDCB. In our ablation experiments, we verify different combinations of these modules. Additionally, we perform ablation experiments related to FR and loss.
Quantitative analysis. As detailed in Table 5, seven groups of ablation experiments were executed to assess the necessity of our proposed modules. According to the quantitative indicators from Table 5, our method exhibits excellent performance in VIF, AG, CC, SCD, and , and ranks second in , , and . Overall, every module we proposed contributes to improving the quality of the fusion result.
Table 5.
The quantitative analysis of various modules on the dataset. Red serves to highlight the best result, blue for the second-best, and green for the third-best.
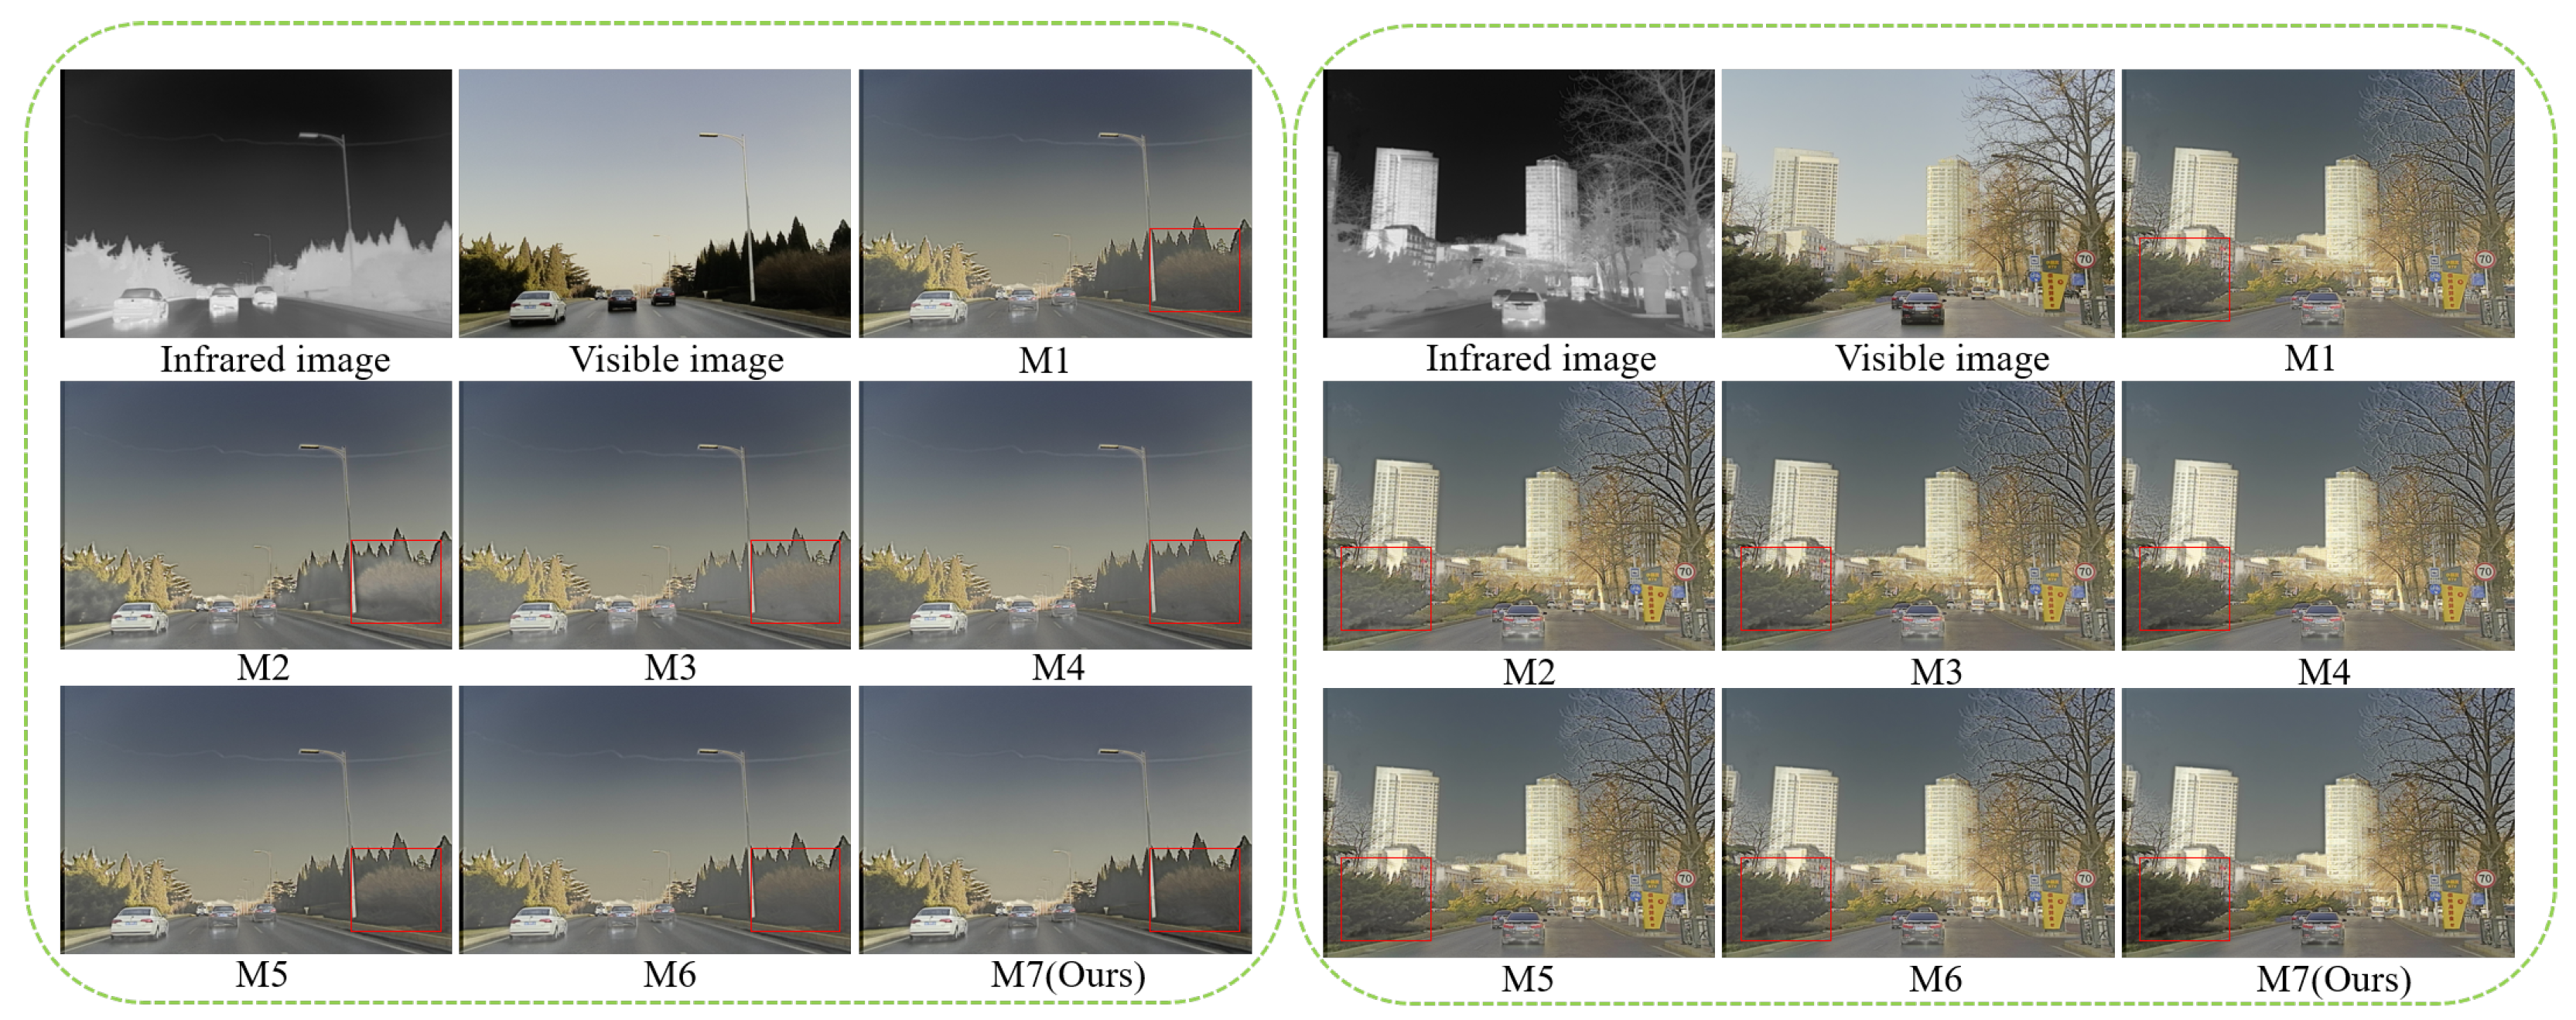
Qualitative analysis. Figure 15 presents the qualitative results of two groups of ablation experiments. It is evident from the displayed results that the fusion results of M1, M2, M3, and M4 exhibit some blurring, while the contrast of M5 and M6 is also lower compared to our method. Generally speaking, our method excels in maintaining high contrast and complete information while also demonstrating excellent clarity compared to other incomplete combination modules.
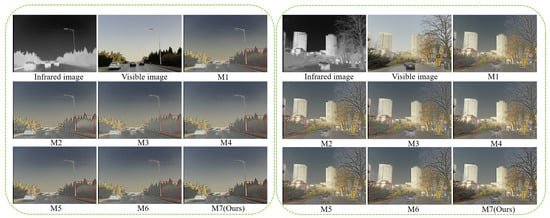
Figure 15.
The qualitative results of ablation experiments.
4.6. Efficiency Comparison
The average runtime of various fusion methods on the TNO dataset is presented in Table 6. We conduct all experiments on the same device to ensure fairness. The result from Table 6 reveals that the proposed method surpasses GTF, FGAN, STDF, SwinF, BDLF, TarDAL, SuperF, DIDF, SHIP, and TCMoA in runtime. Overall, the proposed method demonstrates high fusion efficiency while ensuring fusion performance.
Table 6.
The average runtime of various fusion methods on the TNO dataset.
4.7. Fusion for Object Detection
IVIF lacks ground truth, often necessitating qualitative and quantitative analyses to assess algorithm performance. However, it remains uncertain as to whether fusion images enhance performance in downstream visual tasks (e.g., object detection). To explore this question, experiments were conducted on the dataset. To ensure fairness, we employ the YOLOv5 framework to perform object detection on visible, infrared, and fusion images.
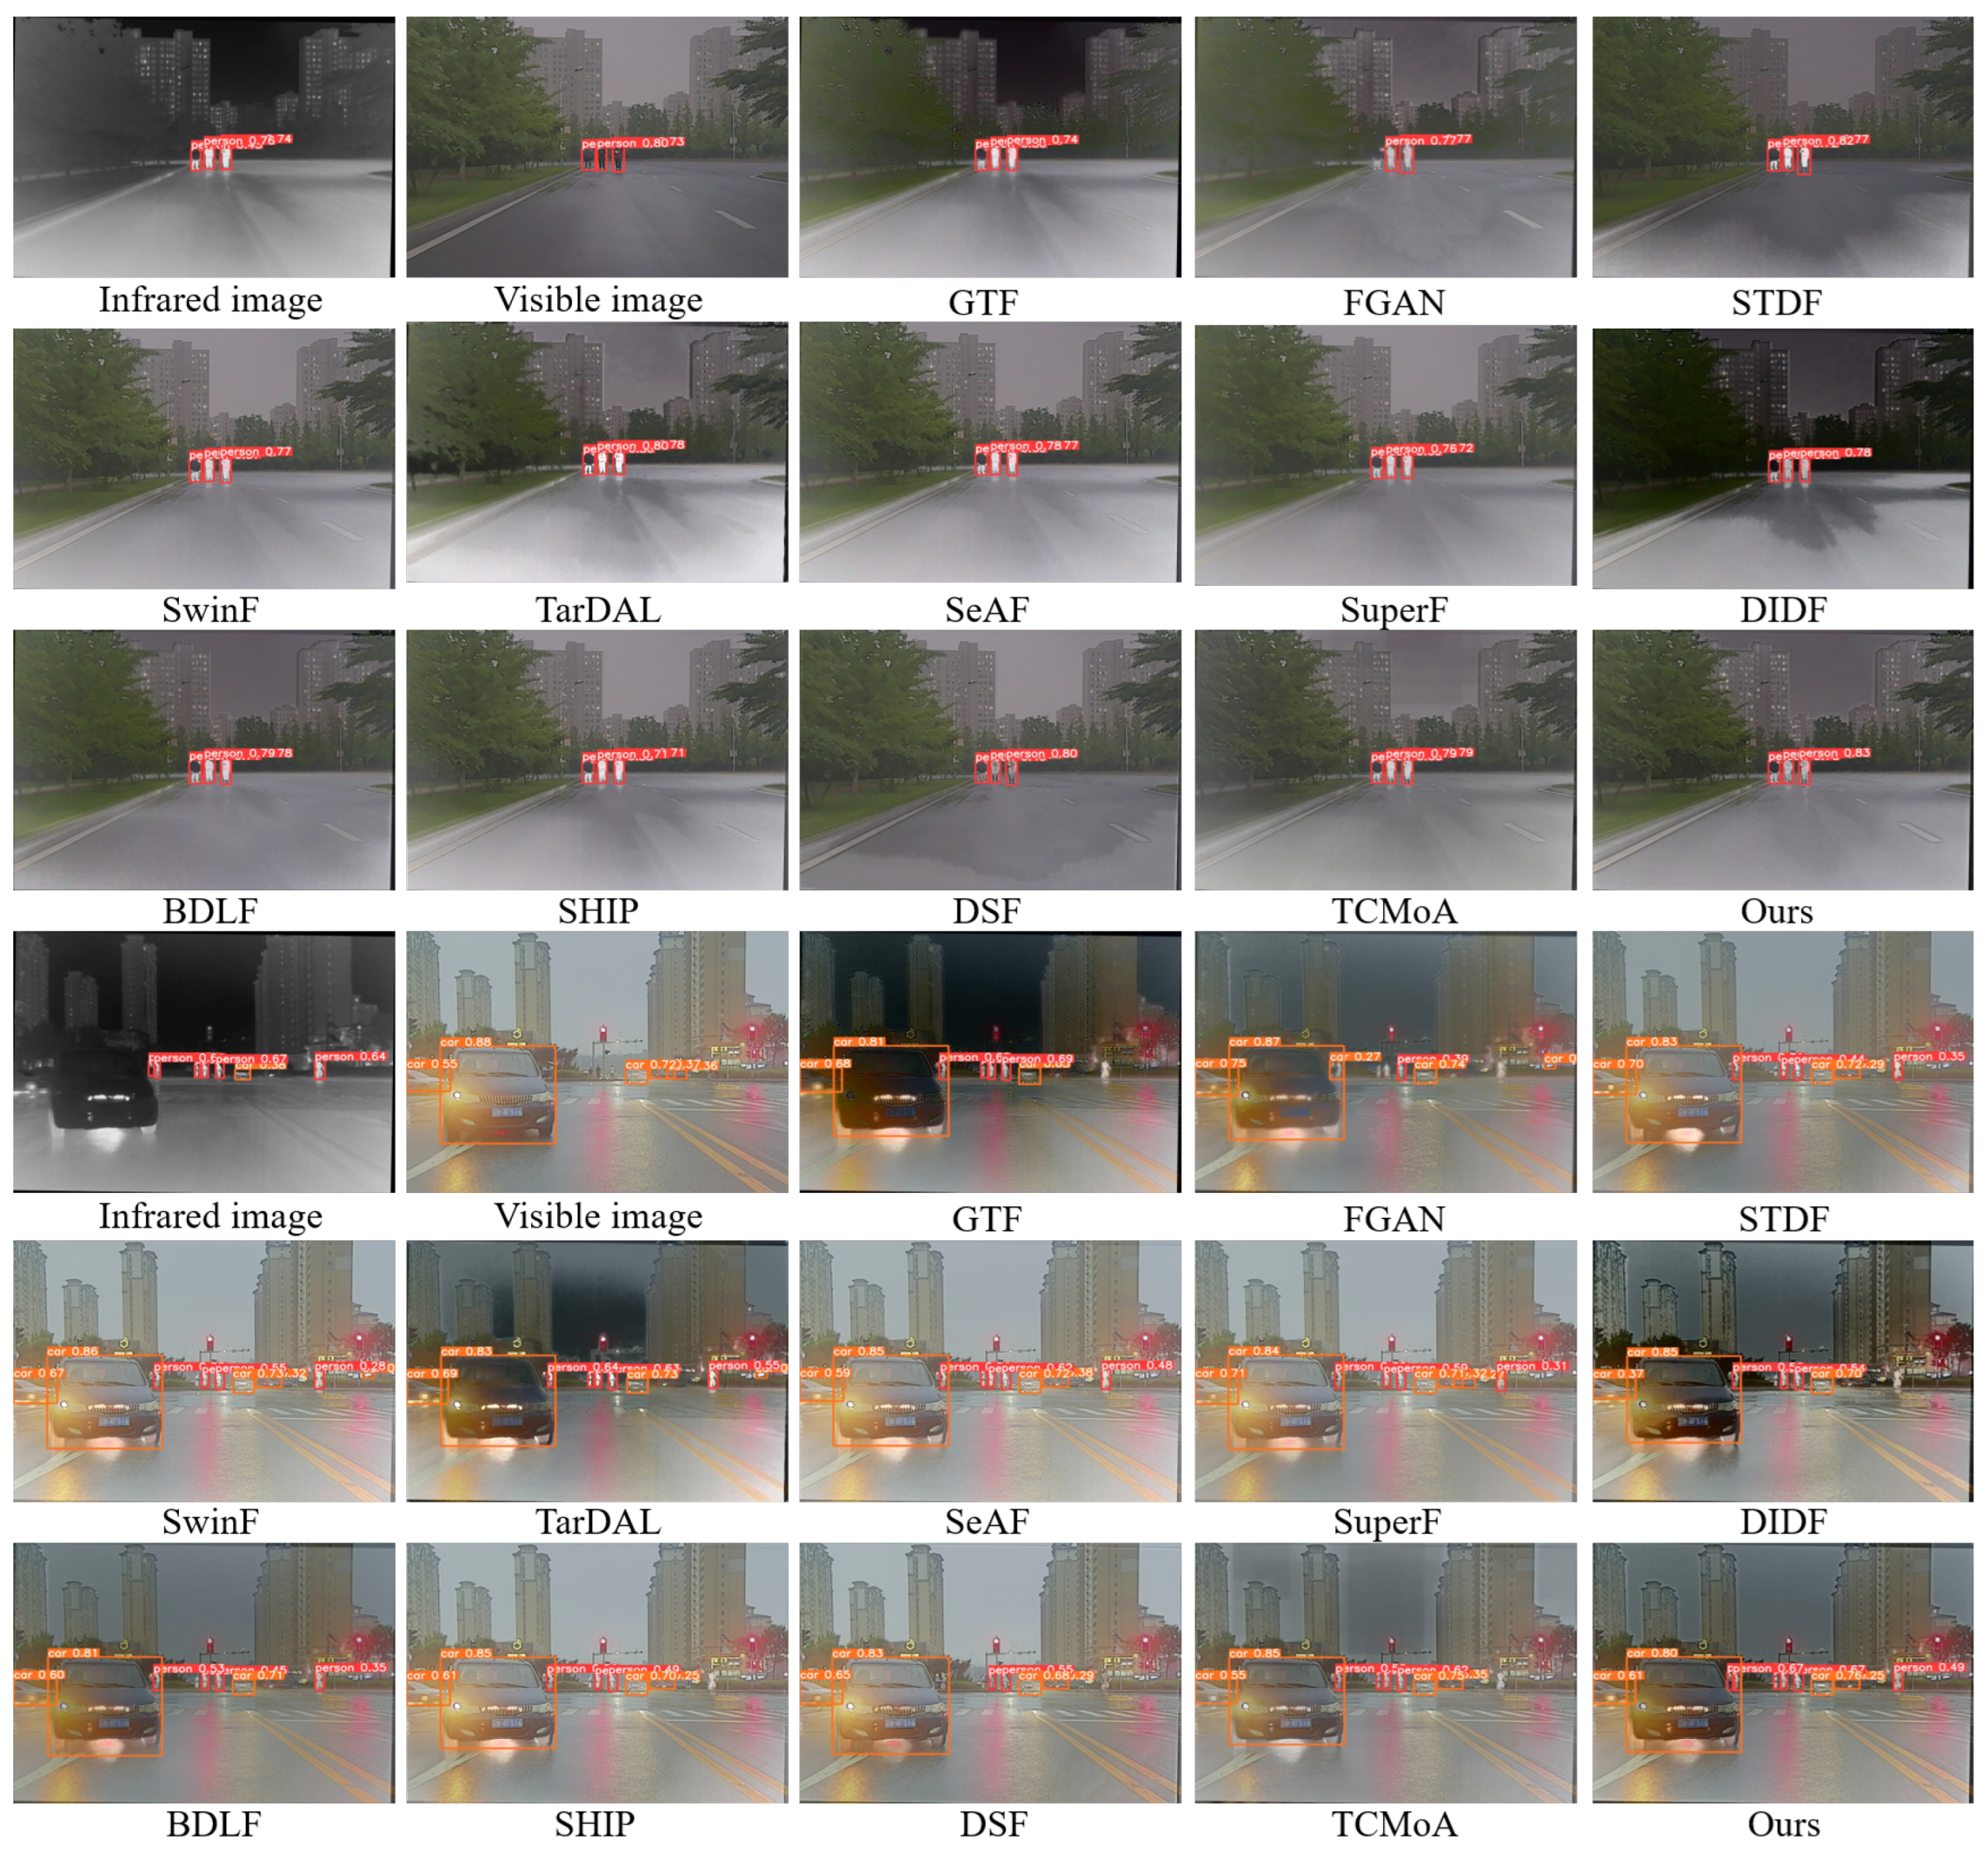
Qualitative analysis. To facilitate the observation of differences in object detection performance between various fusion images and source images, two groups of visualized object detection examples are presented (see Figure 16). In the first scenario, YOLOv5 can accurately detect people in the images. However, the results suggest that our fusion results significantly enhance the image clarity and the prominence of the person, leading to higher detection accuracy compared to other fusion images and the source image. In the second scenario, YOLOv5 loses some important target information, such as people, when detecting the source images and the fusion images from other SOTA methods. Our fusion images detect more comprehensive targets, demonstrating that our method effectively integrates useful information from source images, thereby improving the precision of target detection. Our method achieves higher detection precision relative to the twelve SOTA fusion methods.
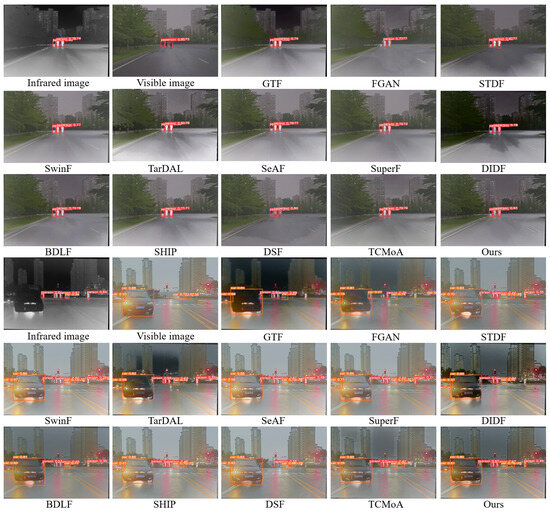
Figure 16.
Visualization of object detection results for different images on the dataset.
Quantitative analysis. As indicated in Table 7, we calculate the average precision for each fusion method to further assess their detection performance. The results demonstrate that our method obtains the best detection accuracy. This further validates that the proposed method positively impacts practical object detection tasks.
Table 7.
The detection precision of different images. Red serves to highlight the best result, blue for the second-best, and green for the third-best. VI and IR represent the visible and infrared images.
5. Conclusions
In this study, we propose BCMFIFuse—a network based on bilateral cross-modal feature interaction for IVIF. Firstly, to effectively extract features from the source image, we construct a dual-stream feature extraction network. Next, a CMFC is introduced to calibrate the features of the current modality to better extract complementary features from different modalities. Subsequently, we employ an FFB to effectively integrate the calibrated features. The FFB is built using a cross-attention mechanism, which can realize long-range contextual interaction, thereby enhancing global bilateral modal features. Finally, to ensure the continuity of features and minimize feature loss during transmission, we use shortcut connections between the encoder and decoder. Additionally, for gathering specific and diversified context information and capturing long-range dependencies in isolated areas, we design an HPDCB. Comparison and generalization experiments on multiple datasets indicate that our method has certain advantages in quantitative and qualitative aspects. Furthermore, the evaluation of object detection performance can also reflect the superiority of our method. In upcoming research, we plan to continue optimizing our algorithm to improve fusion efficiency. Moreover, we consider integrating fusion tasks with other high-level visual tasks or modal information (e.g., text information).
Author Contributions
Design and verify experiments, analyze experimental data, and write and revise the paper, X.G.; supervision, S.L. All authors have read and agreed to the published version of the manuscript.
Funding
This study was supported by the National Natural Science Foundation of China under Grant 62072328.
Data Availability Statement
The dataset can be download from https://github.com/JinyuanLiu-CV/TarDAL. The TNO dataset can be download from https://figshare.com/articles/dataset/TNO_Image_Fusion_Dataset/1008029. The RoadScene dataset can be download from https://github.com/hanna-xu/RoadScene. The LLVIP dataset can be download from https://bupt-ai-cz.github.io/LLVIP/.
Conflicts of Interest
The authors declare no conflicts of interest.
References
- Wang, D.; Liu, J.; Liu, R.; Fan, X. An interactively reinforced paradigm for joint infrared-visible image fusion and saliency object detection. Inf. Fusion 2023, 98, 101828. [Google Scholar] [CrossRef]
- Rao, Y.; Wu, D.; Han, M.; Wang, T.; Yang, Y.; Lei, T.; Xing, L. AT-GAN: A generative adversarial network with attention and transition for infrared and visible image fusion. Inf. Fusion 2023, 92, 336–349. [Google Scholar] [CrossRef]
- Wei, Q.; Liu, Y.; Jiang, X.; Zhang, B.; Su, Q.; Yu, M. DDFNet-A: Attention-Based Dual-Branch Feature Decomposition Fusion Network for Infrared and Visible Image Fusion. Remote Sens. 2024, 16, 1795. [Google Scholar] [CrossRef]
- Liu, W.; Yang, J.; Zhao, J.; Guo, F. A Dual-Domain Super-Resolution Image Fusion Method with SIRV and GALCA Model for PolSAR and Panchromatic Images. IEEE Trans. Geosci. Remote Sens. 2021, 60, 5218814. [Google Scholar] [CrossRef]
- Liu, J.; Fan, X.; Huang, Z.; Wu, G.; Liu, R.; Zhong, W.; Luo, Z. Target-aware dual adversarial learning and a multi-scenario multi-modality benchmark to fuse infrared and visible for object detection. In Proceedings of the IEEE/CVF Conference on Computer Vision and Pattern Recognition (CVPR), New Orleans, LA, USA, 18–24 June 2022; pp. 5802–5811. [Google Scholar]
- Chen, C.; Wang, C.; Liu, B.; He, C.; Cong, L.; Wan, S. Edge intelligence empowered vehicle detection and image segmentation for autonomous vehicles. IEEE Trans. Intell. Transp. Syst. 2023, 24, 13023–13034. [Google Scholar] [CrossRef]
- Zhang, X.; Wang, L.; Zhang, G.; Lan, T.; Zhang, H.; Zhao, L.; Li, J.; Zhu, L.; Liu, H. RI-Fusion: 3D object detection using enhanced point features with range-image fusion for autonomous driving. IEEE Trans. Instrum. Meas. 2022, 72, 5004213. [Google Scholar] [CrossRef]
- Ma, J.; Yu, W.; Liang, P.; Li, C.; Jiang, J. FusionGAN: A generative adversarial network for infrared and visible image fusion. Inf. Fusion 2019, 48, 11–26. [Google Scholar] [CrossRef]
- Liu, K.; Li, M.; Chen, C.; Rao, C.; Zuo, E.; Wang, Y.; Yan, Z.; Wang, B.; Chen, C.; Lv, X. DSFusion: Infrared and visible image fusion method combining detail and scene information. Pattern Recogn. 2024, 154, 110633. [Google Scholar] [CrossRef]
- Tang, L.; Deng, Y.; Ma, Y.; Huang, J.; Ma, J. SuperFusion: A versatile image registration and fusion network with semantic awareness. IEEE/CAA J. Autom. Sin. 2022, 9, 2121–2137. [Google Scholar] [CrossRef]
- Liu, C.H.; Qi, Y.; Ding, W.R. Infrared and visible image fusion method based on saliency detection in sparse domain. Infrared Phys. Technol. 2017, 83, 94–102. [Google Scholar] [CrossRef]
- Xing, Y.; Zhang, Y.; Yang, S.; Zhang, Y. Hyperspectral and multispectral image fusion via variational tensor subspace decomposition. IEEE Geosci. Remote Sens. Lett. 2021, 19, 5001805. [Google Scholar] [CrossRef]
- Zhang, Q.; Liu, Y.; Blum, R.S.; Han, J.; Tao, D. Sparse representation based multi-sensor image fusion for multi-focus and multi-modality images: A review. Inf. Fusion 2018, 40, 57–75. [Google Scholar] [CrossRef]
- Dogra, A.; Goyal, B.; Agrawal, S. From multi-scale decomposition to non-multi-scale decomposition methods: A comprehensive survey of image fusion techniques and its applications. IEEE Access 2017, 5, 16040–16067. [Google Scholar] [CrossRef]
- Yan, L.; Cao, J.; Rizvi, S.; Zhang, K.; Hao, Q.; Cheng, X. Improving the performance of image fusion based on visual saliency weight map combined with CNN. IEEE Access 2020, 8, 59976–59986. [Google Scholar] [CrossRef]
- Ma, J.; Xu, H.; Jiang, J.; Mei, X.; Zhang, X.P. DDcGAN: A dual-discriminator conditional generative adversarial network for multi-resolution image fusion. IEEE Trans. Image Process. 2020, 29, 4980–4995. [Google Scholar] [CrossRef] [PubMed]
- Chang, L.; Huang, Y.; Li, Q.; Zhang, Y.; Liu, L.; Zhou, Q. DUGAN: Infrared and visible image fusion based on dual fusion paths and a U-type discriminator. Neurocomputing 2024, 578, 127391. [Google Scholar] [CrossRef]
- Li, H.; Wu, X.J. DenseFuse: A fusion approach to infrared and visible images. IEEE Trans. Image Process. 2018, 28, 2614–2623. [Google Scholar] [CrossRef] [PubMed]
- Zhao, Z.; Xu, S.; Zhang, C.; Liu, J.; Li, P.; Zhang, J. DIDFuse: Deep image decomposition for infrared and visible image fusion. In Proceedings of the Twenty-Ninth International Conference on International Joint Conferences on Artificial Intelligence, Yokohama, Japan, 7–15 January 2021; pp. 970–976. [Google Scholar]
- Liu, X.; Gao, H.; Miao, Q.; Xi, Y.; Ai, Y.; Gao, D. MFST: Multi-modal feature self-adaptive transformer for infrared and visible image fusion. Remote Sens. 2022, 14, 3233. [Google Scholar] [CrossRef]
- Li, H.; Wu, X.J.; Durrani, T. NestFuse: An infrared and visible image fusion architecture based on nest connection and spatial/channel attention models. IEEE Trans. Instrum. Meas. 2020, 69, 9645–9656. [Google Scholar] [CrossRef]
- Tang, L.; Yuan, J.; Ma, J. Image fusion in the loop of high-level vision tasks: A semantic-aware real-time infrared and visible image fusion network. Inf. Fusion 2022, 82, 28–42. [Google Scholar] [CrossRef]
- Tang, L.; Xiang, X.; Zhang, H.; Gong, M.; Ma, J. DIVFusion: Darkness-free infrared and visible image fusion. Inf. Fusion 2023, 91, 477–493. [Google Scholar] [CrossRef]
- Ma, J.; Tang, L.; Xu, M.; Zhang, H.; Xiao, G. STDFusionNet: An infrared and visible image fusion network based on salient target detection. IEEE Trans. Instrum. Meas. 2021, 70, 5009513. [Google Scholar] [CrossRef]
- Tang, L.; Yuan, J.; Zhang, H.; Jiang, X.; Ma, J. PIAFusion: A progressive infrared and visible image fusion network based on illumination aware. Inf. Fusion 2022, 83, 79–92. [Google Scholar] [CrossRef]
- Ma, J.; Tang, L.; Fan, F.; Huang, J.; Mei, X.; Ma, Y. SwinFusion: Cross-domain long-range learning for general image fusion via swin transformer. IEEE/CAA J. Autom. Sin. 2022, 9, 1200–1217. [Google Scholar] [CrossRef]
- Wang, Z.; Chen, Y.; Shao, W.; Li, H.; Zhang, L. SwinFuse: A residual swin transformer fusion network for infrared and visible images. IEEE Trans. Instrum. Meas. 2022, 71, 5016412. [Google Scholar] [CrossRef]
- Xu, H.; Ma, J.; Le, Z.; Jiang, J.; Guo, X. FusionDN: A unified densely connected network for image fusion. Proc. AAAI Conf. Artif. Intell. 2020, 34, 12484–12491. [Google Scholar] [CrossRef]
- Ma, J.; Zhang, H.; Shao, Z.; Liang, P.; Xu, H. GANMcC: A generative adversarial network with multiclassification constraints for infrared and visible image fusion. IEEE Trans. Instrum. Meas. 2020, 70, 5005014. [Google Scholar] [CrossRef]
- Zhang, H.; Ma, J. SDNet: A versatile squeeze-and-decomposition network for real-time image fusion. Int. J. Comput. Vis. 2021, 129, 2761–2785. [Google Scholar] [CrossRef]
- Zhang, H.; Xu, H.; Xiao, Y.; Guo, X.; Ma, J. Rethinking the image fusion: A fast unified image fusion network based on proportional maintenance of gradient and intensity. Proc. AAAI Conf. Artif. Intell. 2020, 34, 12797–12804. [Google Scholar] [CrossRef]
- Li, H.; Wu, X.J.; Kittler, J. RFN-Nest: An end-to-end residual fusion network for infrared and visible images. Inf. Fusion 2021, 73, 72–86. [Google Scholar] [CrossRef]
- Pu, T.; Ni, G. Contrast-based image fusion using the discrete wavelet transform. Opt. Eng. 2000, 39, 2075–2082. [Google Scholar] [CrossRef]
- Zhao, W.; Xu, Z.; Zhao, J. Gradient entropy metric and p-laplace diffusion constraint-based algorithm for noisy multispectral image fusion. Inf. Fusion 2016, 27, 138–149. [Google Scholar] [CrossRef]
- Zhao, Z.; Xu, S.; Zhang, C.; Liu, J.; Zhang, J. Efficient and interpretable infrared and visible image fusion via algorithm unrolling. arXiv 2020, arXiv:2005.05896. [Google Scholar]
- Jian, L.; Yang, X.; Liu, Z.; Jeon, G.; Gao, M.; Chisholm, D. SEDRFuse: A symmetric encoder–decoder with residual block network for infrared and visible image fusion. IEEE Trans. Instrum. Meas. 2020, 70, 5002215. [Google Scholar] [CrossRef]
- Wang, Z.; Wu, Y.; Wang, J.; Xu, J.; Shao, W. Res2Fusion: Infrared and visible image fusion based on dense Res2net and double nonlocal attention models. IEEE Trans. Instrum. Meas. 2022, 71, 5005012. [Google Scholar] [CrossRef]
- Long, Y.; Jia, H.; Zhong, Y.; Jiang, Y.; Jia, Y. RXDNFuse: A aggregated residual dense network for infrared and visible image fusion. Inf. Fusion 2021, 69, 128–141. [Google Scholar] [CrossRef]
- Xu, H.; Ma, J.; Jiang, J.; Guo, X.; Ling, H. U2Fusion: A unified unsupervised image fusion network. IEEE Trans. Pattern Anal. Mach. Intell. 2020, 44, 502–518. [Google Scholar] [CrossRef] [PubMed]
- Ma, J.; Liang, P.; Yu, W.; Chen, C.; Guo, X.; Wu, J.; Jiang, J. Infrared and visible image fusion via detail preserving adversarial learning. Inf. Fusion 2020, 54, 85–98. [Google Scholar] [CrossRef]
- Zhang, H.; Yuan, J.; Tian, X.; Ma, J. GAN-FM: Infrared and visible image fusion using GAN with full-scale skip connection and dual Markovian discriminators. IEEE Trans. Comput. Imaging 2021, 7, 1134–1147. [Google Scholar] [CrossRef]
- Li, J.; Huo, H.; Li, C.; Wang, R.; Feng, Q. AttentionFGAN: Infrared and visible image fusion using attention-based generative adversarial networks. IEEE Trans. Multimed. 2020, 23, 1383–1396. [Google Scholar] [CrossRef]
- Yang, Y.; Liu, J.; Huang, S.; Wan, W.; Wen, W.; Guan, J. Infrared and visible image fusion via texture conditional generative adversarial network. IEEE Trans. Circuits Syst. Video Technol. 2021, 31, 4771–4783. [Google Scholar] [CrossRef]
- Tang, W.; He, F.; Liu, Y. YDTR: Infrared and Visible Image Fusion via Y-shape Dynamic Transformer. IEEE Trans. Multimed. 2022, 25, 5413–5428. [Google Scholar] [CrossRef]
- Ghosh, S.; Gavaskar, R.G.; Chaudhury, K.N. Saliency guided image detail enhancement. In Proceedings of the 2019 National Conference on Communications (NCC), Bangalore, India, 20–23 February 2019; pp. 1–6. [Google Scholar]
- Rao, D.; Xu, T.; Wu, X.-J. TGFuse: An infrared and visible image fusion approach based on transformer and generative adversarial network. IEEE Trans. Image Process. 2023, 1–12. [Google Scholar] [CrossRef] [PubMed]
- Jia, X.; Zhu, C.; Li, M.; Tang, W.; Zhou, W. LLVIP: A visible-infrared paired dataset for low-light vision. In Proceedings of the IEEE/CVF International Conference on Computer Vision, Montreal, QC, Canada, 10–17 October 2021; pp. 3496–3504. [Google Scholar]
- Li, L.; Xia, Z.; Han, H.; He, G.; Roli, F.; Feng, X. Infrared and visible image fusion using a shallow CNN and structural similarity constraint. IET Image Process. 2020, 14, 3562–3571. [Google Scholar] [CrossRef]
- Ma, J.; Chen, C.; Li, C.; Huang, J. Infrared and visible image fusion via gradient transfer and total variation minimization. Inf. Fusion 2016, 31, 100–109. [Google Scholar] [CrossRef]
- Liu, Z.; Liu, J.; Wu, G.; Ma, L.; Fan, X.; Liu, R. Bi-level dynamic learning for jointly multi-modality image fusion and beyond. arXiv 2023, arXiv:2305.06720. [Google Scholar]
- Zheng, N.; Zhou, M.; Huang, J.; Hou, J.; Li, H.; Xu, Y.; Zhao, F. Probing Synergistic High-Order Interaction in Infrared and Visible Image Fusion. In Proceedings of the IEEE/CVF Conference on Computer Vision and Pattern Recognition, Seattle, WA, USA, 17–21 June 2024; pp. 26384–26395. [Google Scholar]
- Zhu, P.; Sun, Y.; Cao, B.; Hu, Q. Task-customized mixture of adapters for general image fusion. In Proceedings of the IEEE/CVF Conference on Computer Vision and Pattern Recognition, Seattle, WA, USA, 17–21 June 2024; pp. 7099–7108. [Google Scholar]
- Aslantas, V.; Bendes, E. A new image quality metric for image fusion: The sum of the correlations of differences. AEU-Int. J. Electron. C 2015, 69, 1890–1896. [Google Scholar] [CrossRef]
- Deshmukh, M.; Bhosale, U. Image fusion and image quality assessment of fused images. Int. J. Image Process. (IJIP) 2010, 4, 484. [Google Scholar]
- Zhao, W.; Wang, D.; Lu, H. Multi-focus image fusion with a natural enhancement via a joint multi-level deeply supervised convolutional neural network. IEEE Trans. Circuits Syst. Video Technol. 2018, 29, 1102–1115. [Google Scholar] [CrossRef]
- Zhang, X.; Ye, P.; Xiao, G. VIFB: A visible and infrared image fusion benchmark. In Proceedings of the IEEE/CVF Conference on Computer Vision and Pattern Recognition Workshops, Seattle, WA, USA, 14–19 June 2020; pp. 104–105. [Google Scholar]
- Ma, J.; Ma, Y.; Li, C. Infrared and visible image fusion methods and applications: A survey. Inf. Fusion 2019, 45, 153–178. [Google Scholar] [CrossRef]
- Poobathy, D.; Chezian, R.M. Edge detection operators: Peak signal to noise ratio based comparison. Int. J. Image Graph. Signal Process. 2014, 10, 55–61. [Google Scholar] [CrossRef]
- Petrovic, V.; Xydeas, C. Objective image fusion performance characterisation. In Proceedings of the Tenth IEEE International Conference on Computer Vision, Beijing, China, 17–21 October 2005; Volume 1, pp. 1866–1871. [Google Scholar]
- Wang, Z.; Simoncelli, E.P.; Bovik, A.C. Multiscale structural similarity for image quality assessment. In Proceedings of the Thrity-Seventh Asilomar Conference on Signals, Systems & Computers, Pacific Grove, CA, USA, 9–12 November 2003; Volume 2, pp. 1398–1402. [Google Scholar]
- Wang, Z.; Bovik, A.C.; Sheikh, H.R.; Simoncelli, E.P. Image quality assessment: From error visibility to structural similarity. IEEE Trans. Image Process. 2004, 13, 600–612. [Google Scholar] [CrossRef] [PubMed]
- Haghighat, M.B.A.; Aghagolzadeh, A.; Seyedarabi, H. A non-reference image fusion metric based on mutual information of image features. Comput. Electr. Eng. 2011, 37, 744–756. [Google Scholar] [CrossRef]


Disclaimer/Publisher’s Note: The statements, opinions and data contained in all publications are solely those of the individual author(s) and contributor(s) and not of MDPI and/or the editor(s). MDPI and/or the editor(s) disclaim responsibility for any injury to people or property resulting from any ideas, methods, instructions or products referred to in the content. |
© 2024 by the authors. Licensee MDPI, Basel, Switzerland. This article is an open access article distributed under the terms and conditions of the Creative Commons Attribution (CC BY) license (https://creativecommons.org/licenses/by/4.0/).