
Deep-Seated Landslide and Rockfalls Threatening the Village of Pietracamela in Central Italy: Deciphering Phenomena from Interferometric Synthetic Aperture Radar and Point Cloud Analysis

 , , , ,
Abstract
:1. Introduction
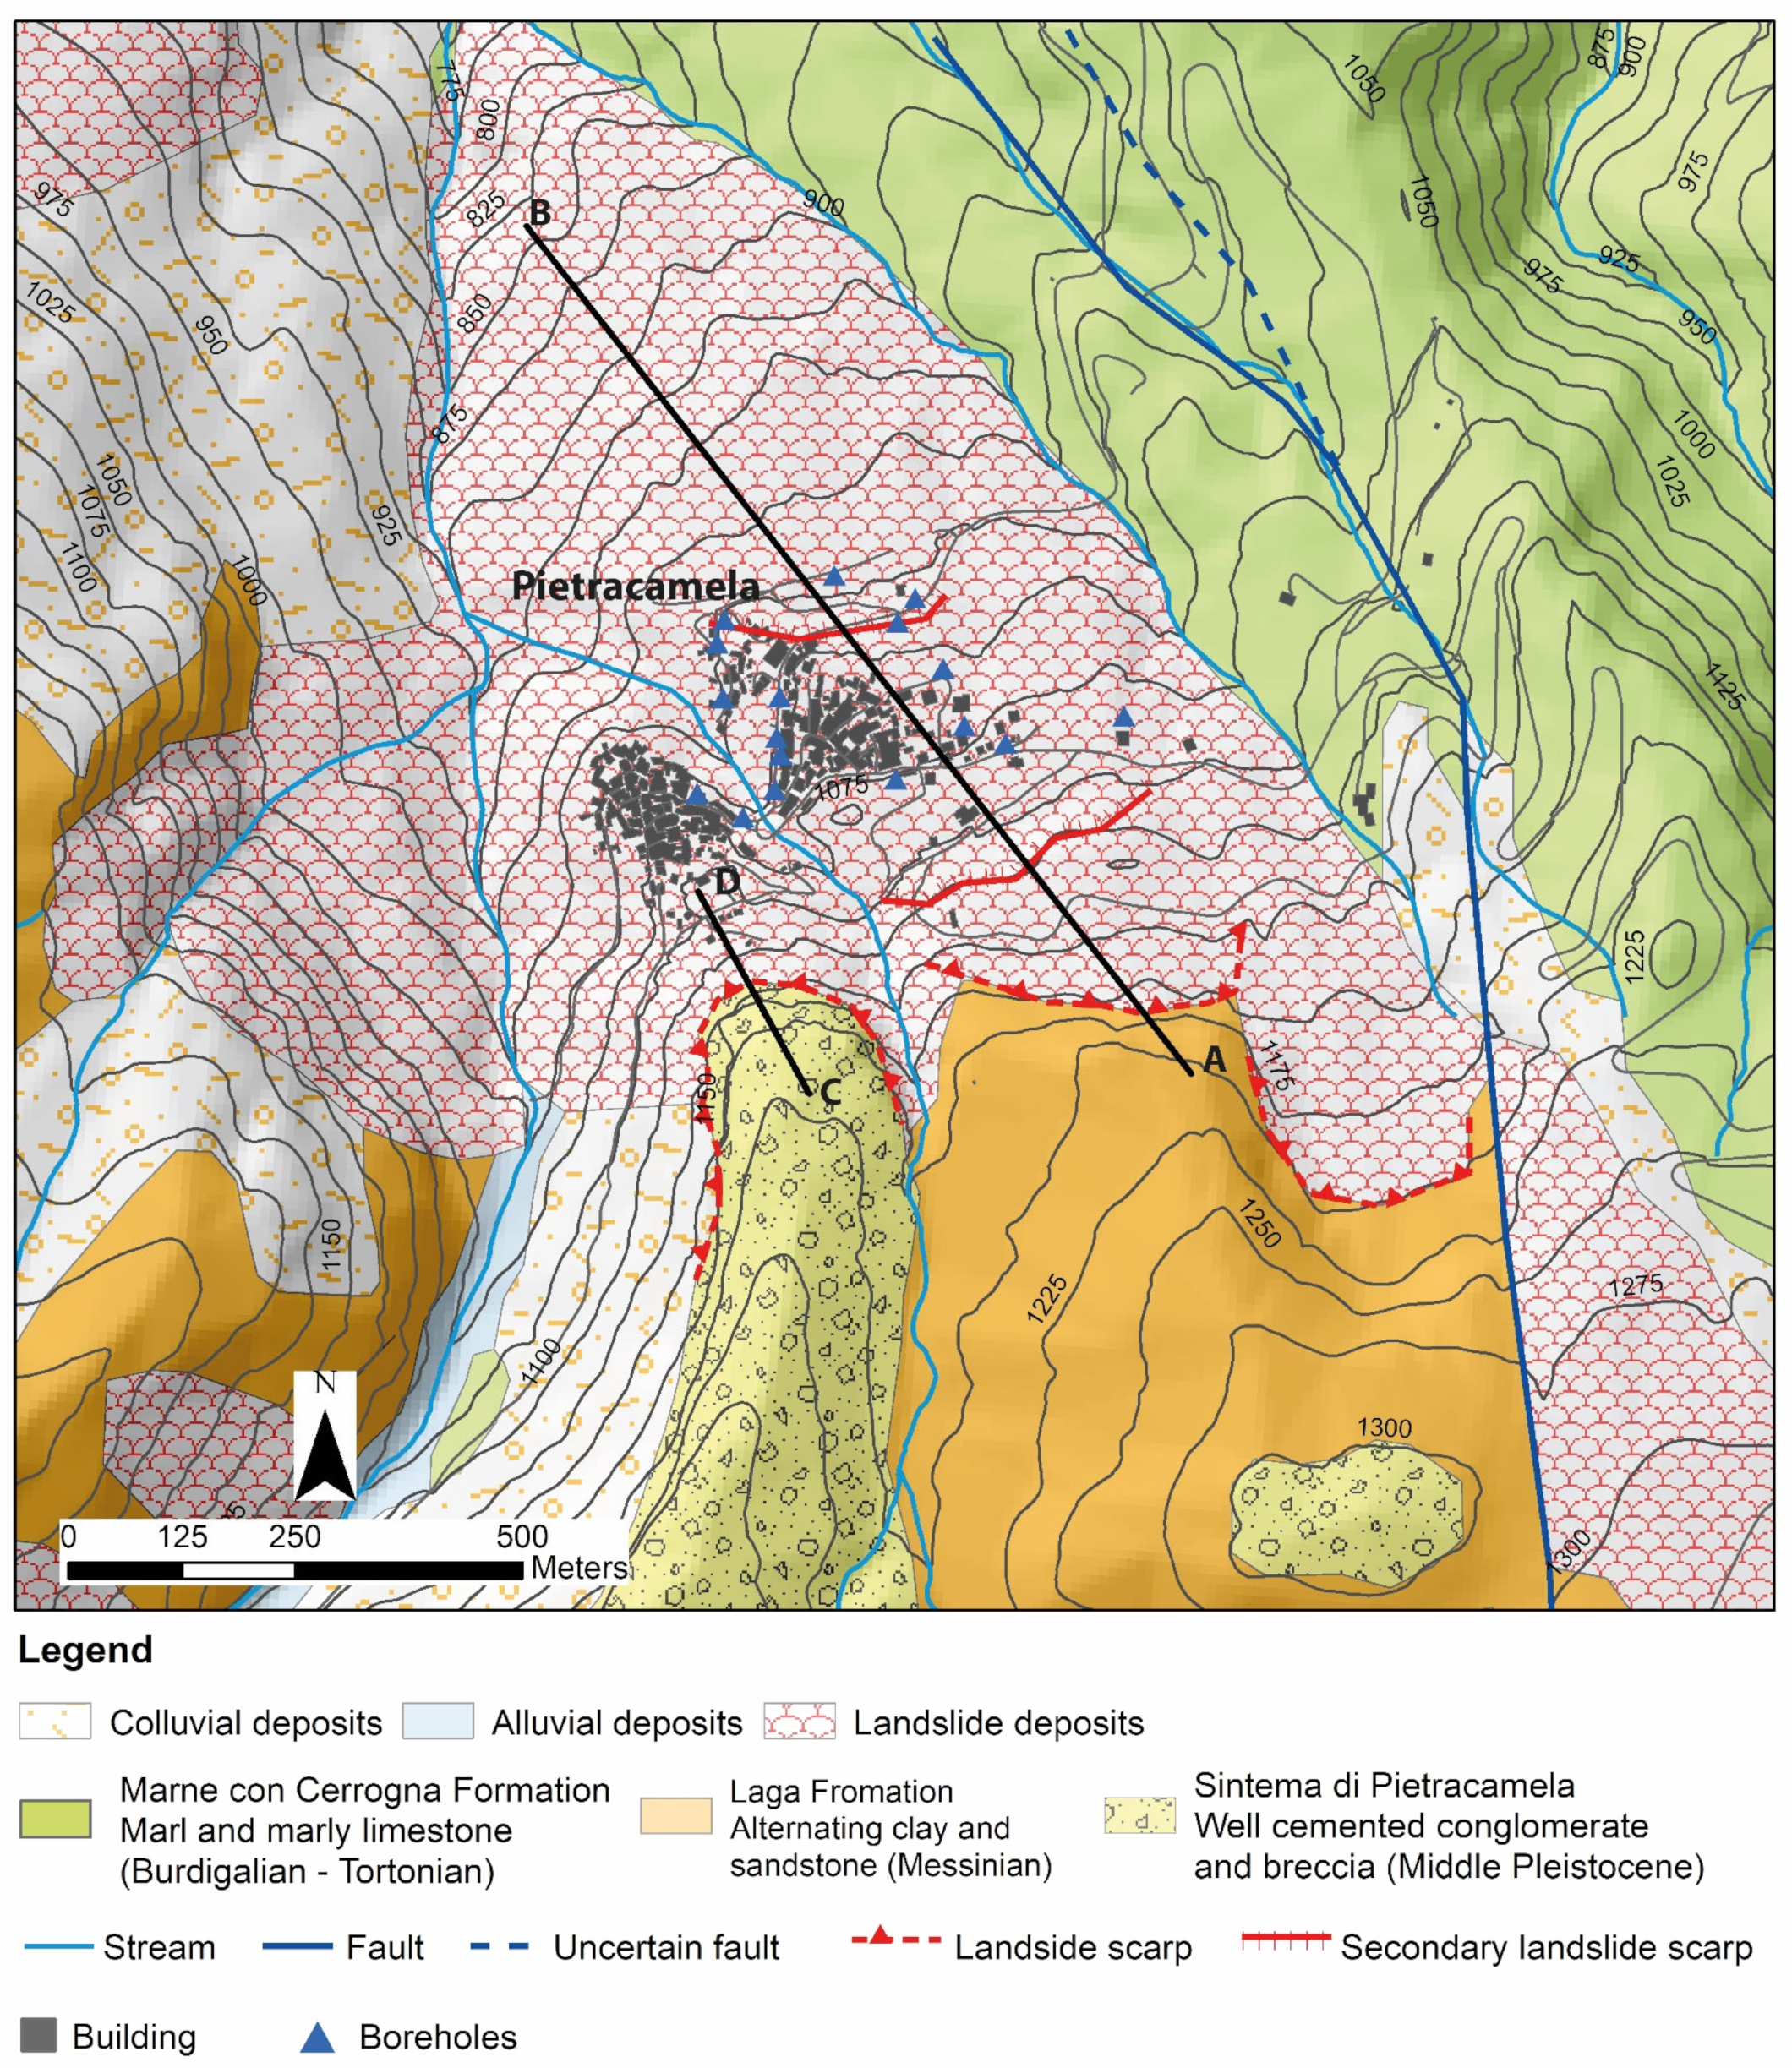
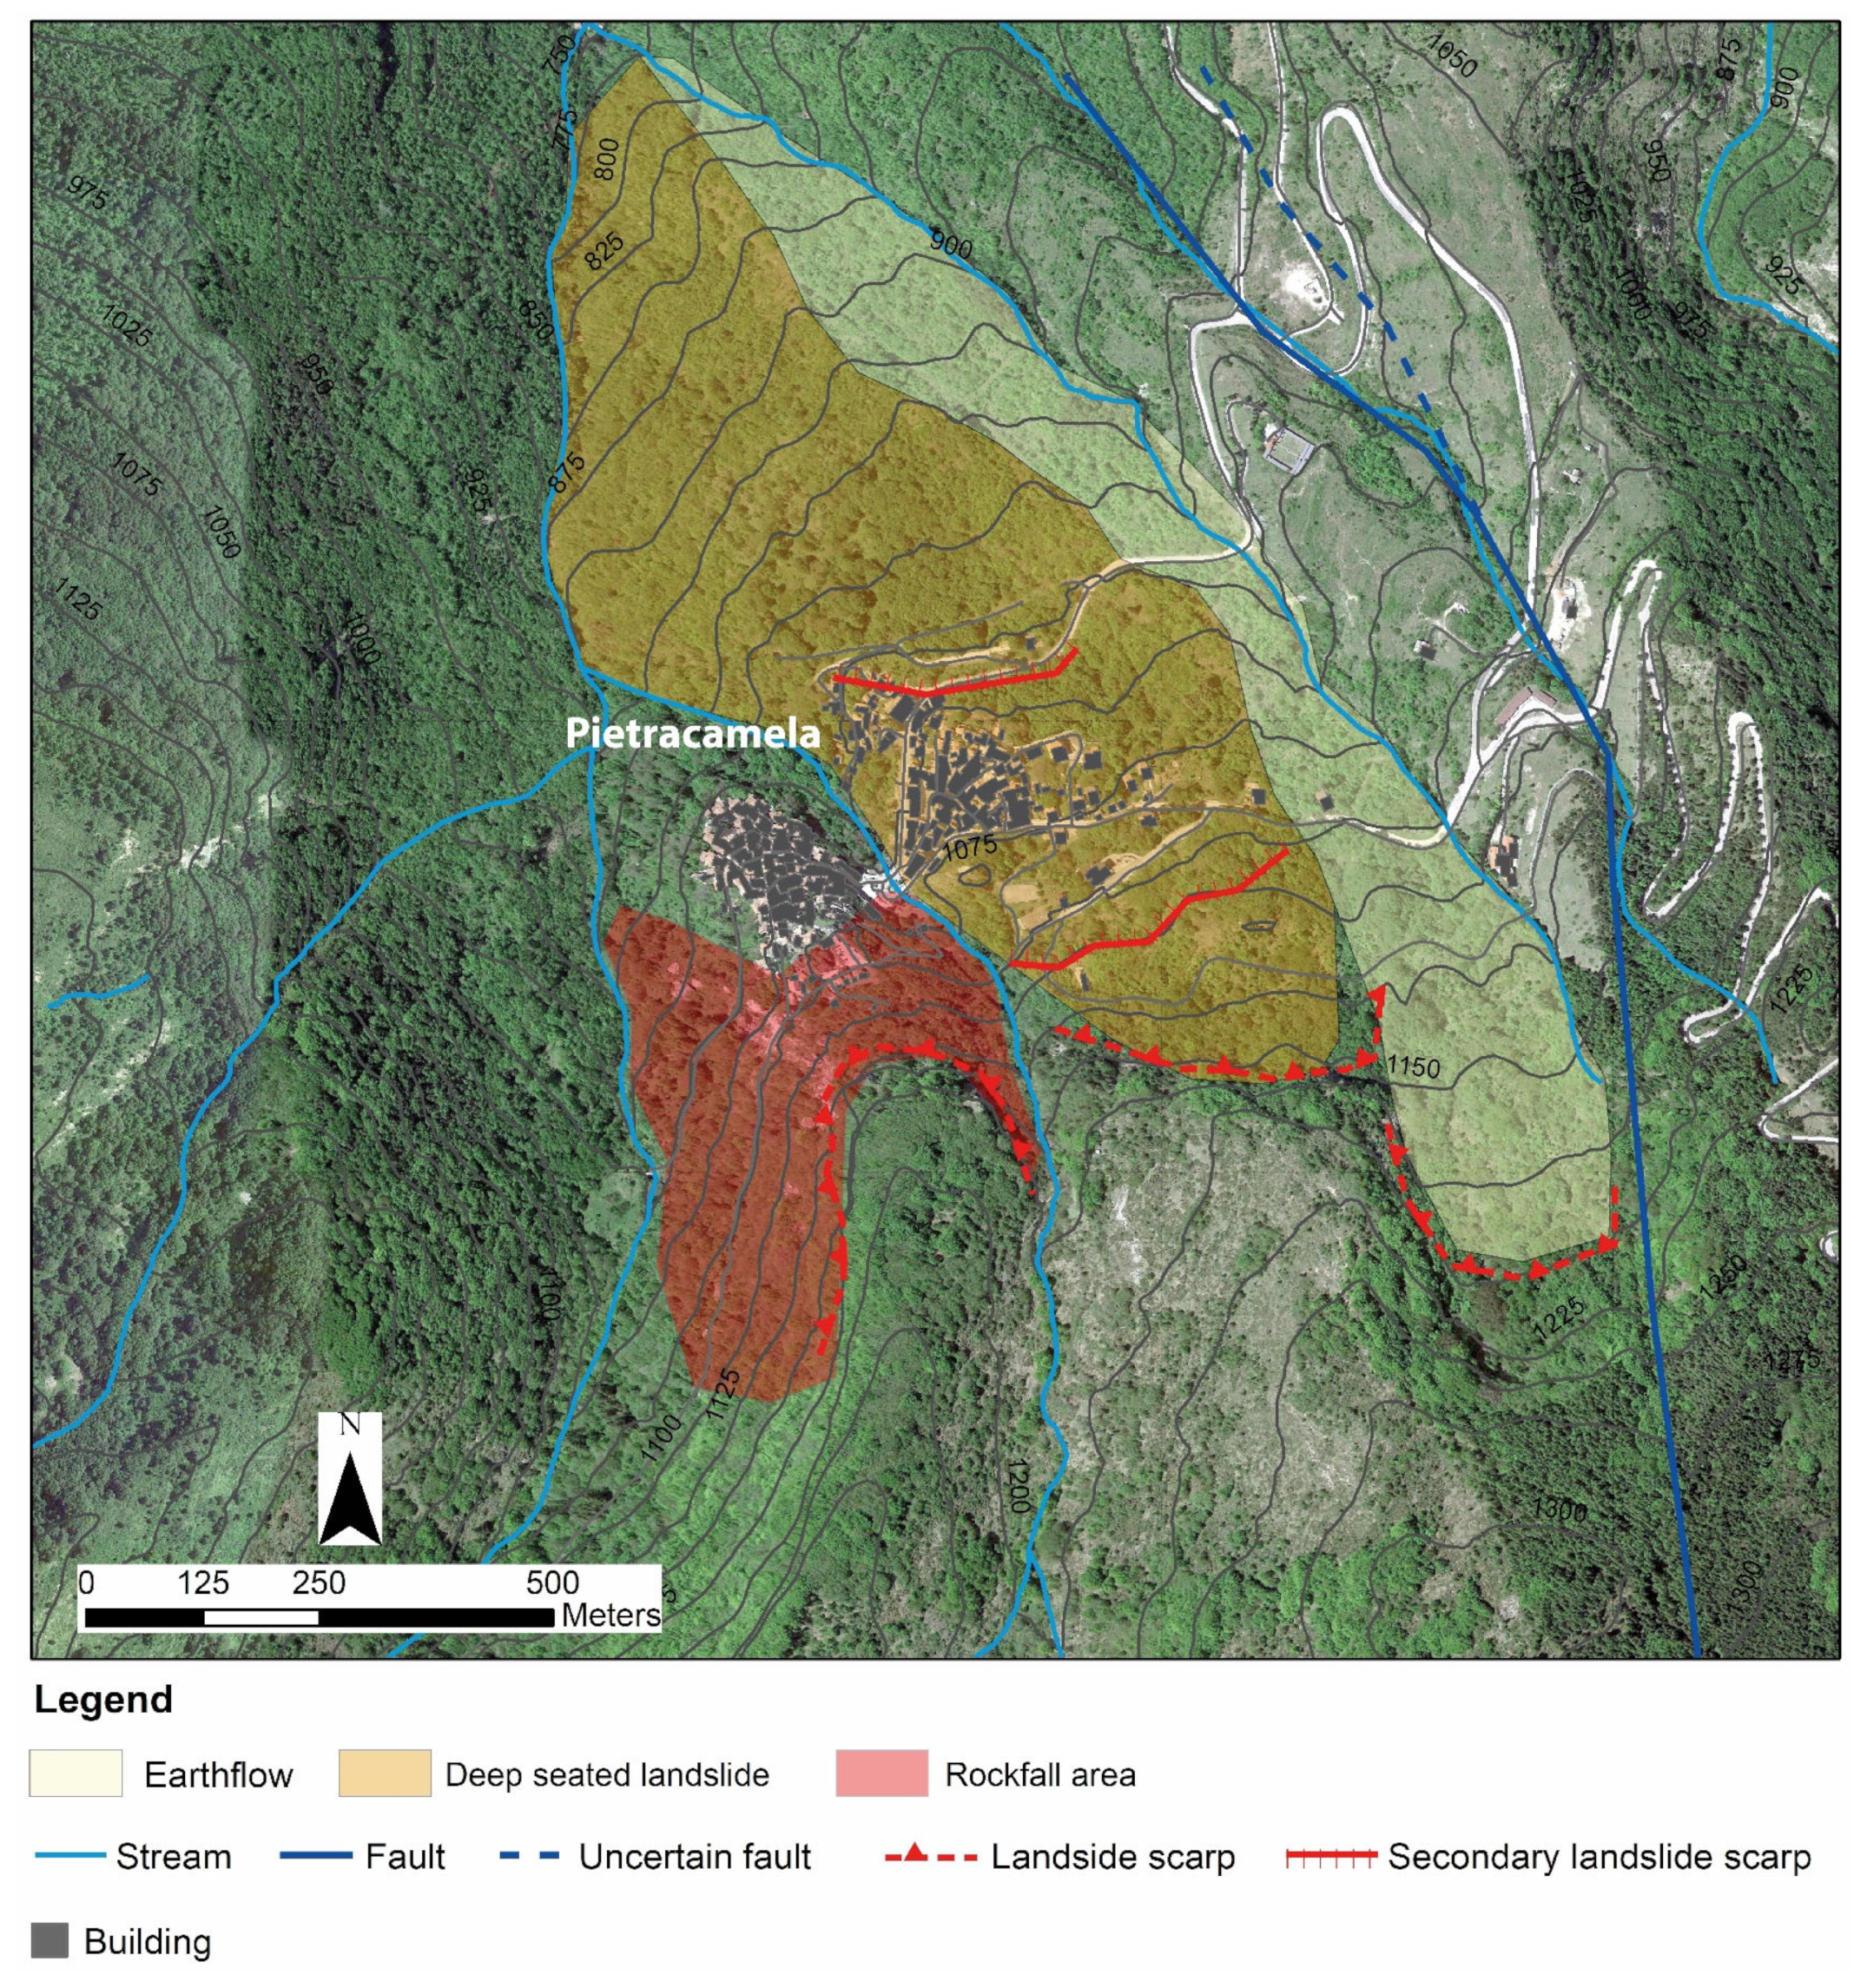
2. Study Area
3. Materials and Methods
3.1. Field Borehole Analysis
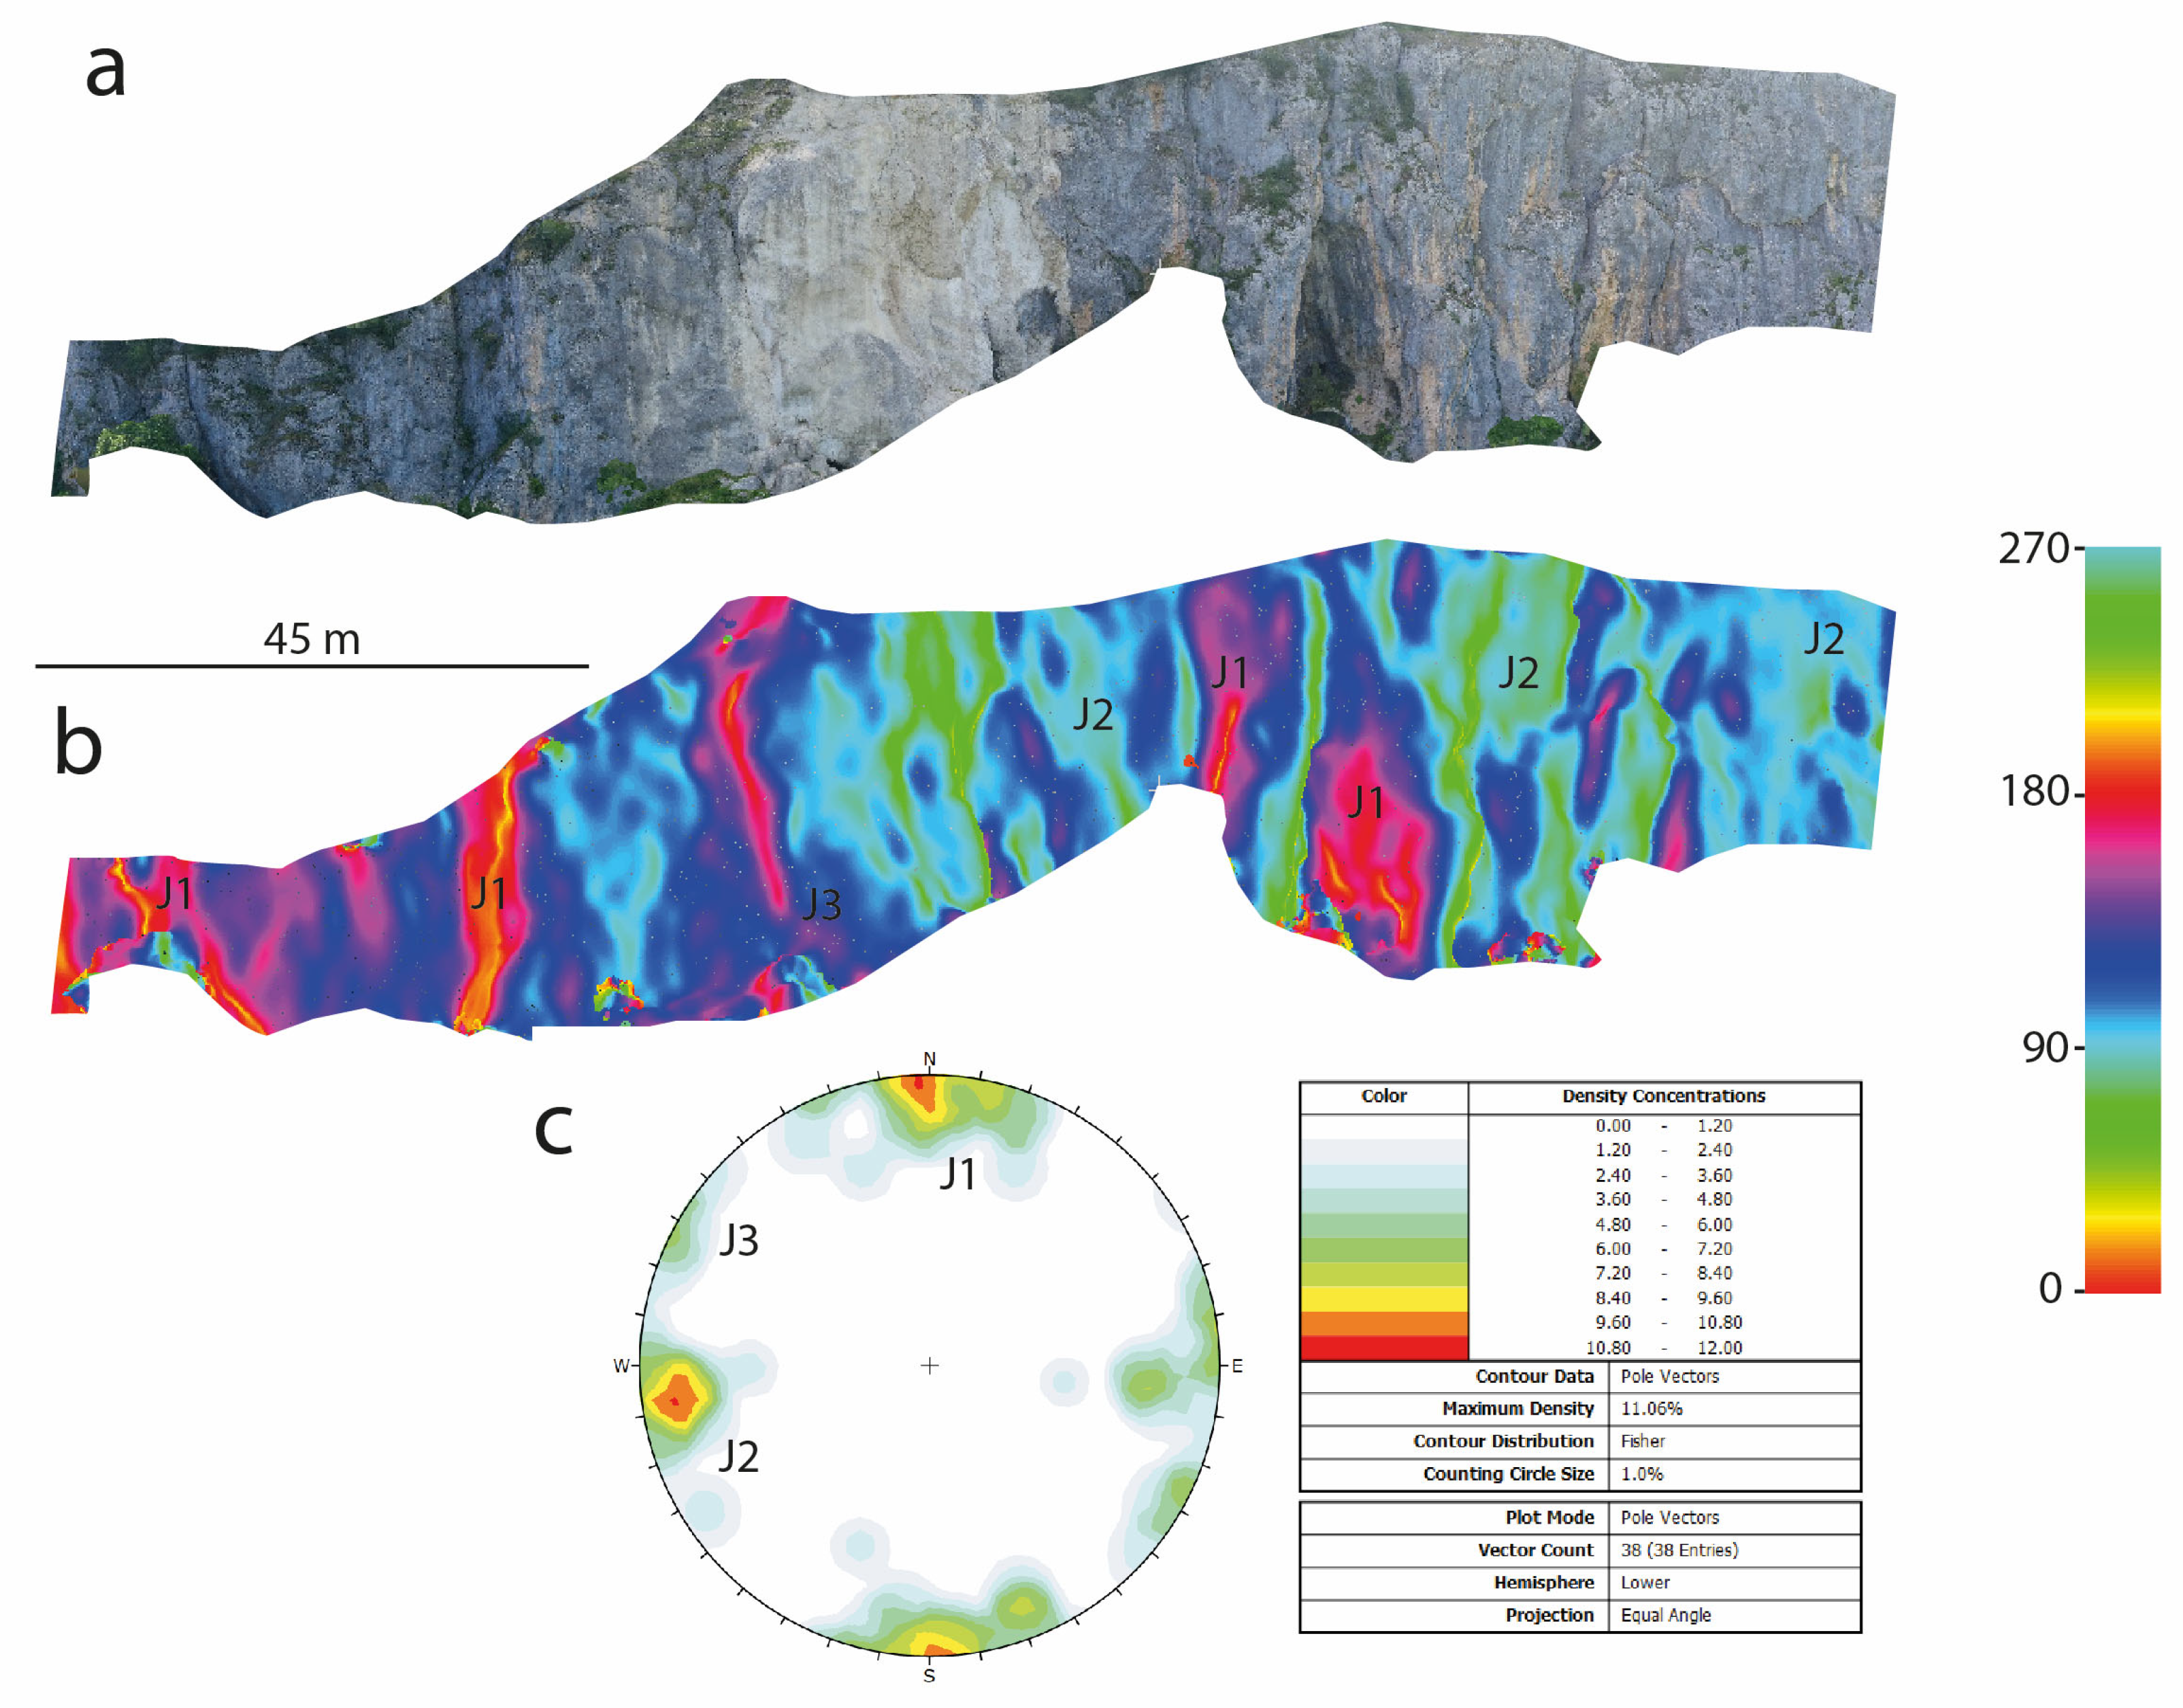
3.2. UAV Surveys and Geomechanical Analyses
3.3. DInSAR
- Analysis of displacements from 1992 to 2014 was undertaken through the C and X-band interferometric data acquired from the ERS1/2, ENVISAT, and COSMO-SkyMed constellations, available within the Not-ordinary Plan of Environmental Remote Sensing (Piano Straordinario di Telerilevamento Ambientale, PST-A in Italian) [33,34,35,36], funded by the Italian Ministry of the Environment (MoE);
- The observation window for displacement rates has then been extended up to 2019 (with a gap from 2014 to 2016) through an additional 195 SAR images from the SENTINEL-1 acquired in the framework of the COPERNICUS project of ESA. To ensure continuity with respect to previous data (available in descending geometry), only descending images have been processed. Such processing has been carried out by SUBSIDENCE (v. 28.3.0) software, which implements the Coherent Pixel Technique—Temporal Phase Coherence (CPT-TPC) approach and was developed at the Remote Sensing Laboratory (RSLab) of the Universitat Politecnica de Catalunya of Barcelona. CPT-TPC has been used to obtain ground displacements from satellite radar images. A detailed description of the whole algorithm can be found in Mora et al. [37] and Iglesias et al. [38].
4. Results
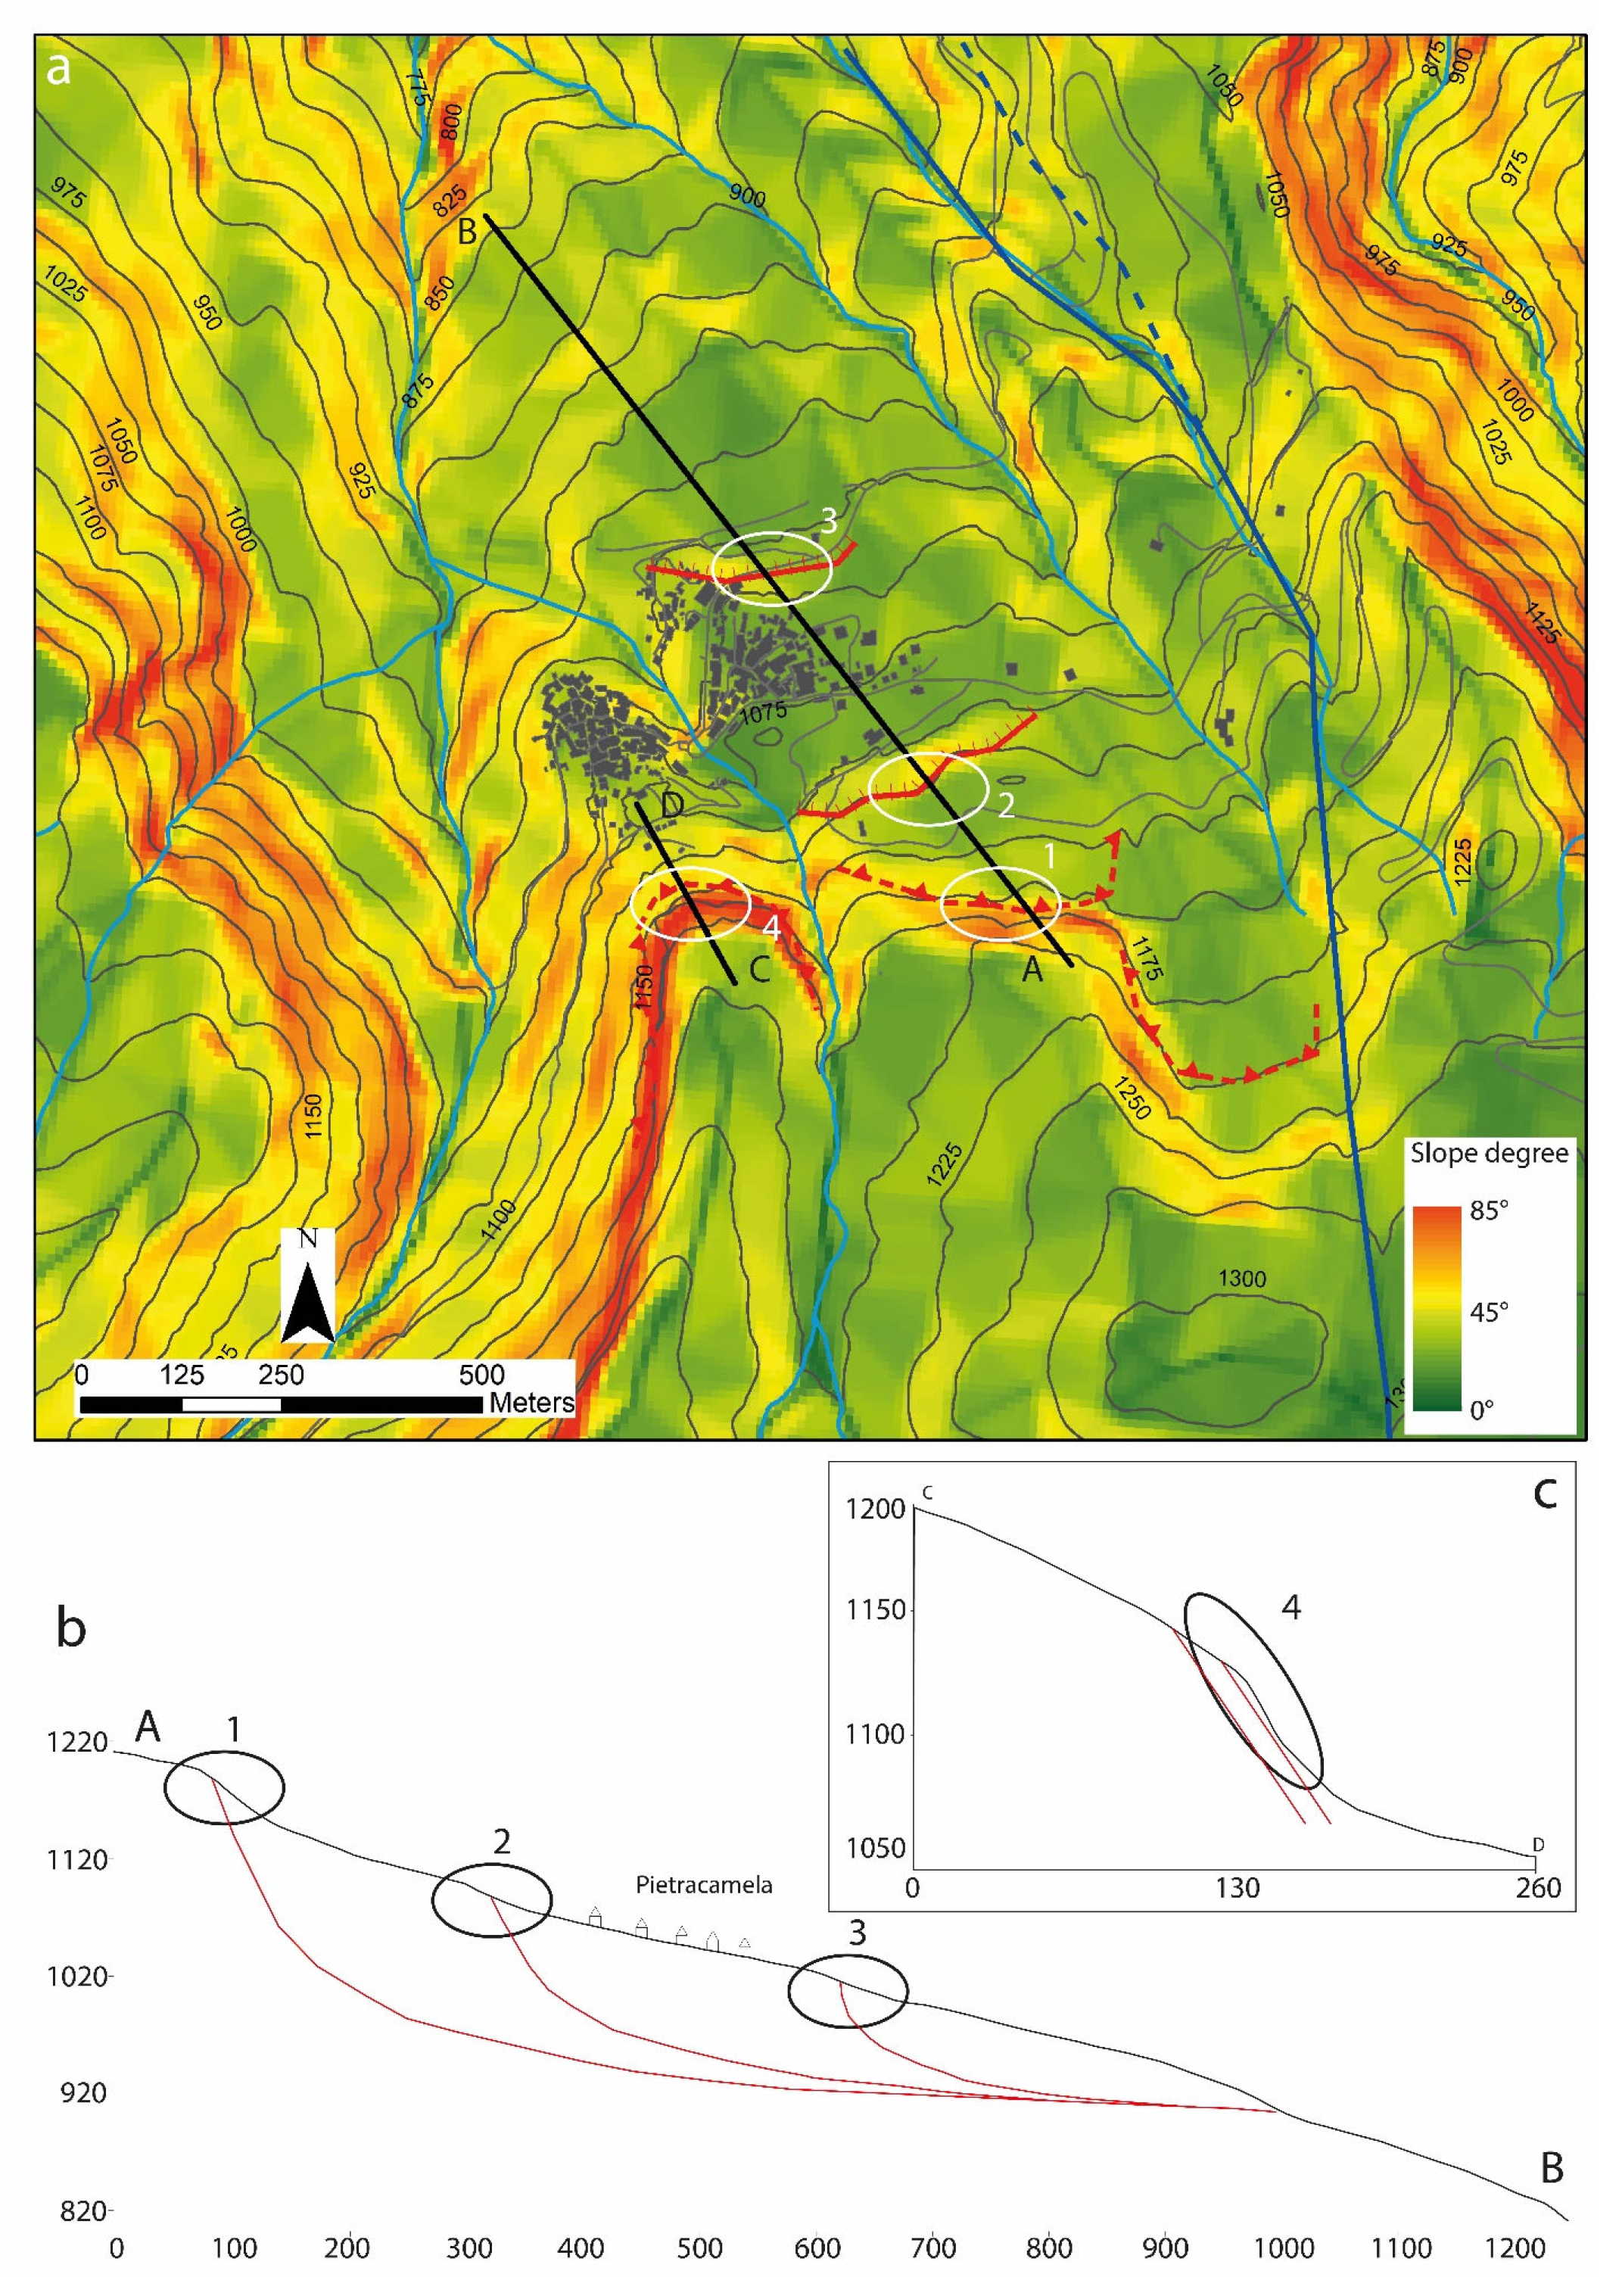
4.1. Boreholes Data and Thematic Maps Interpretation
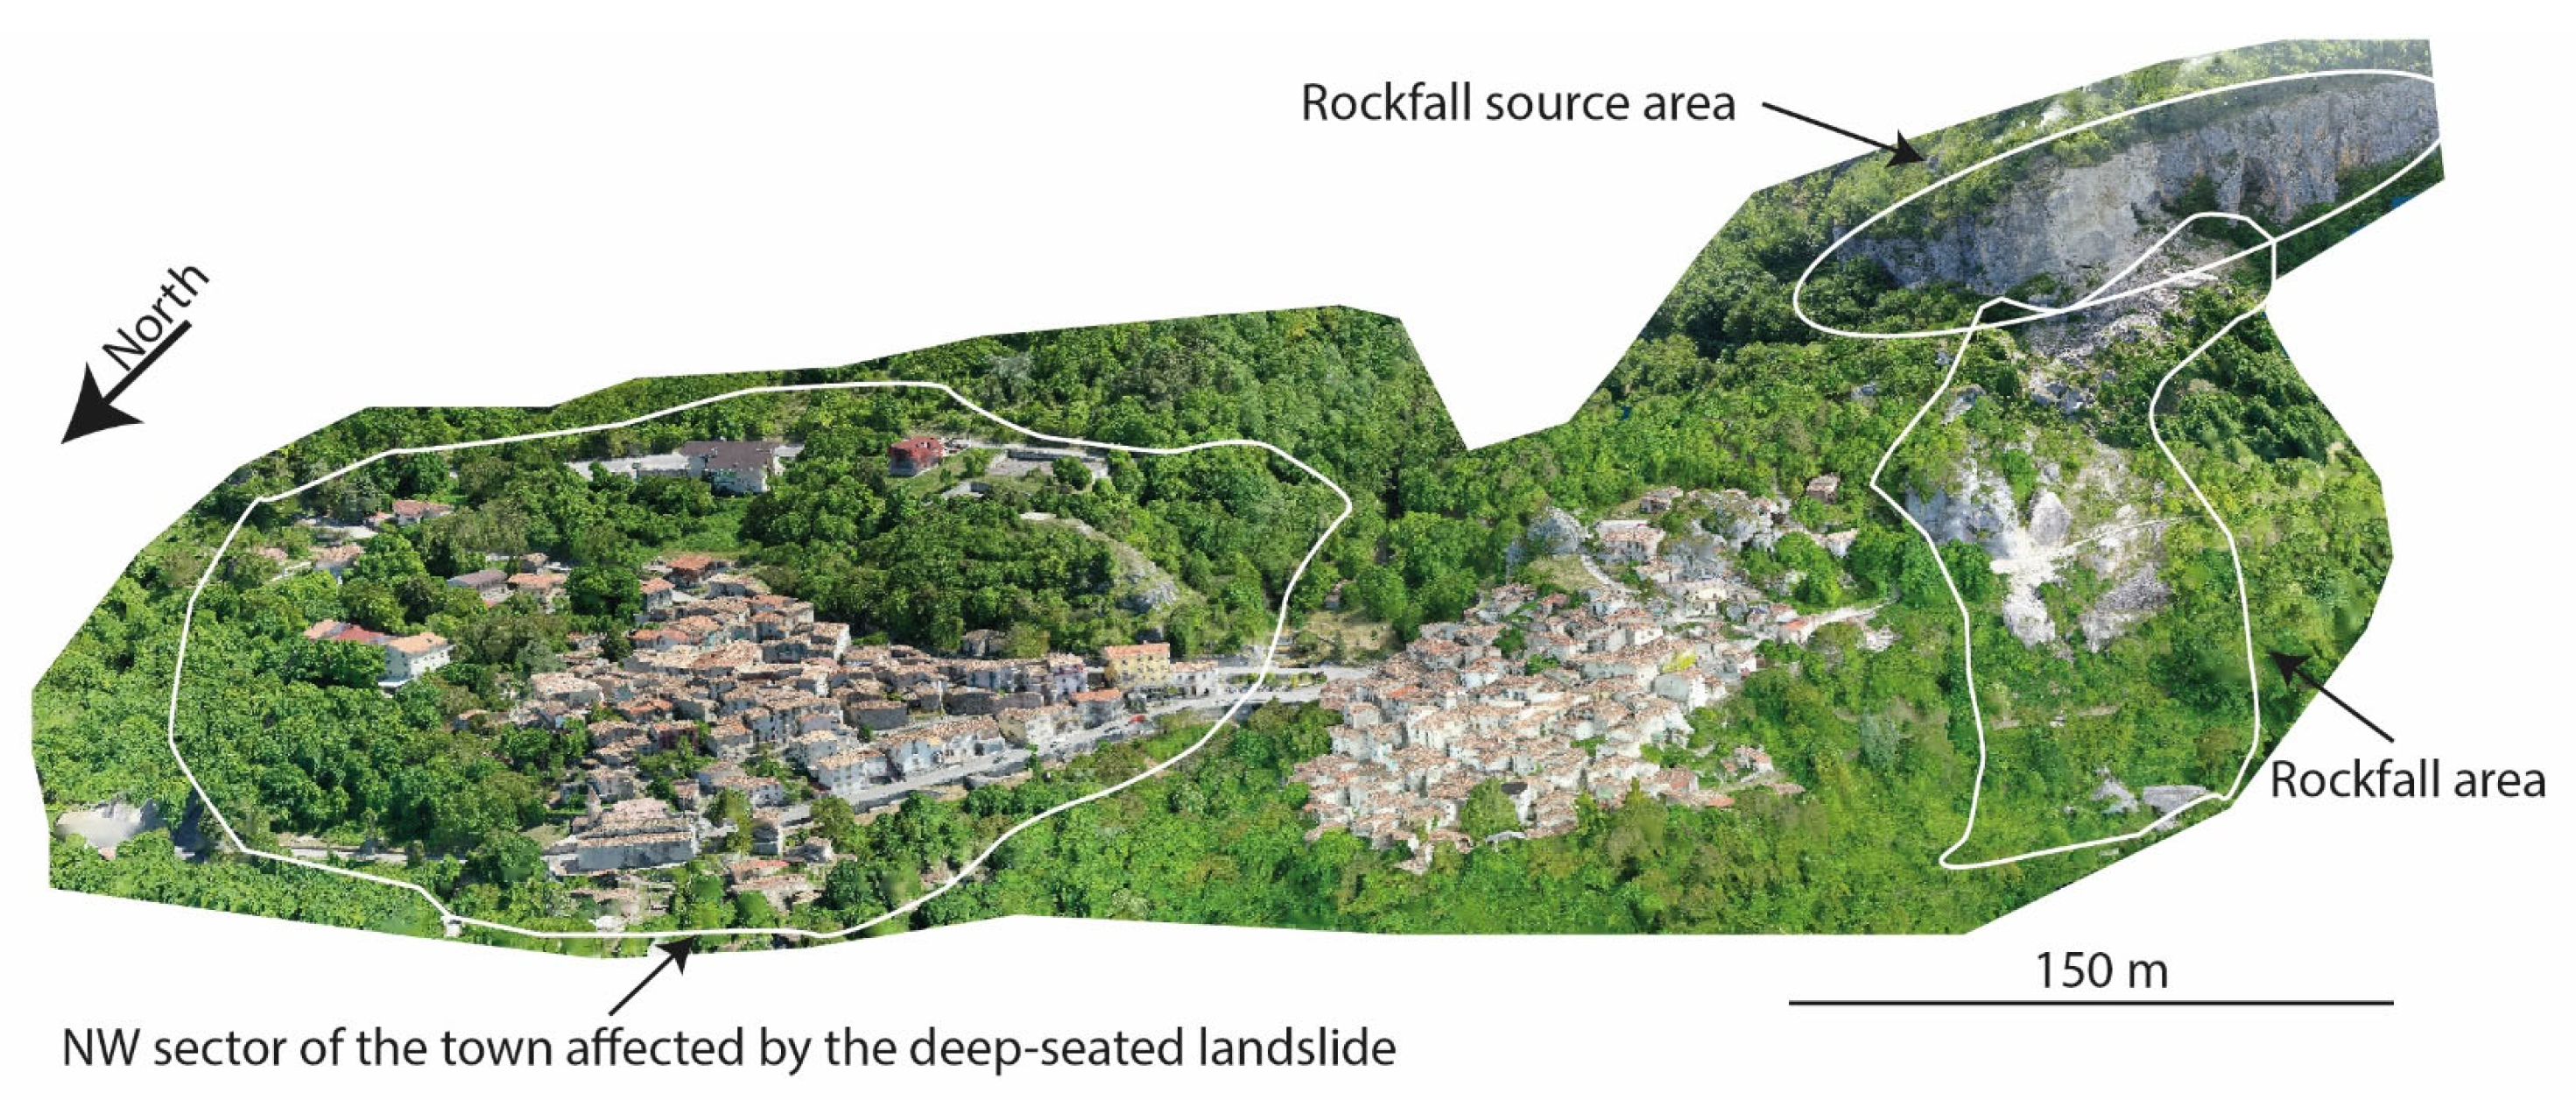
4.2. UAV and Geomechanical Analysis
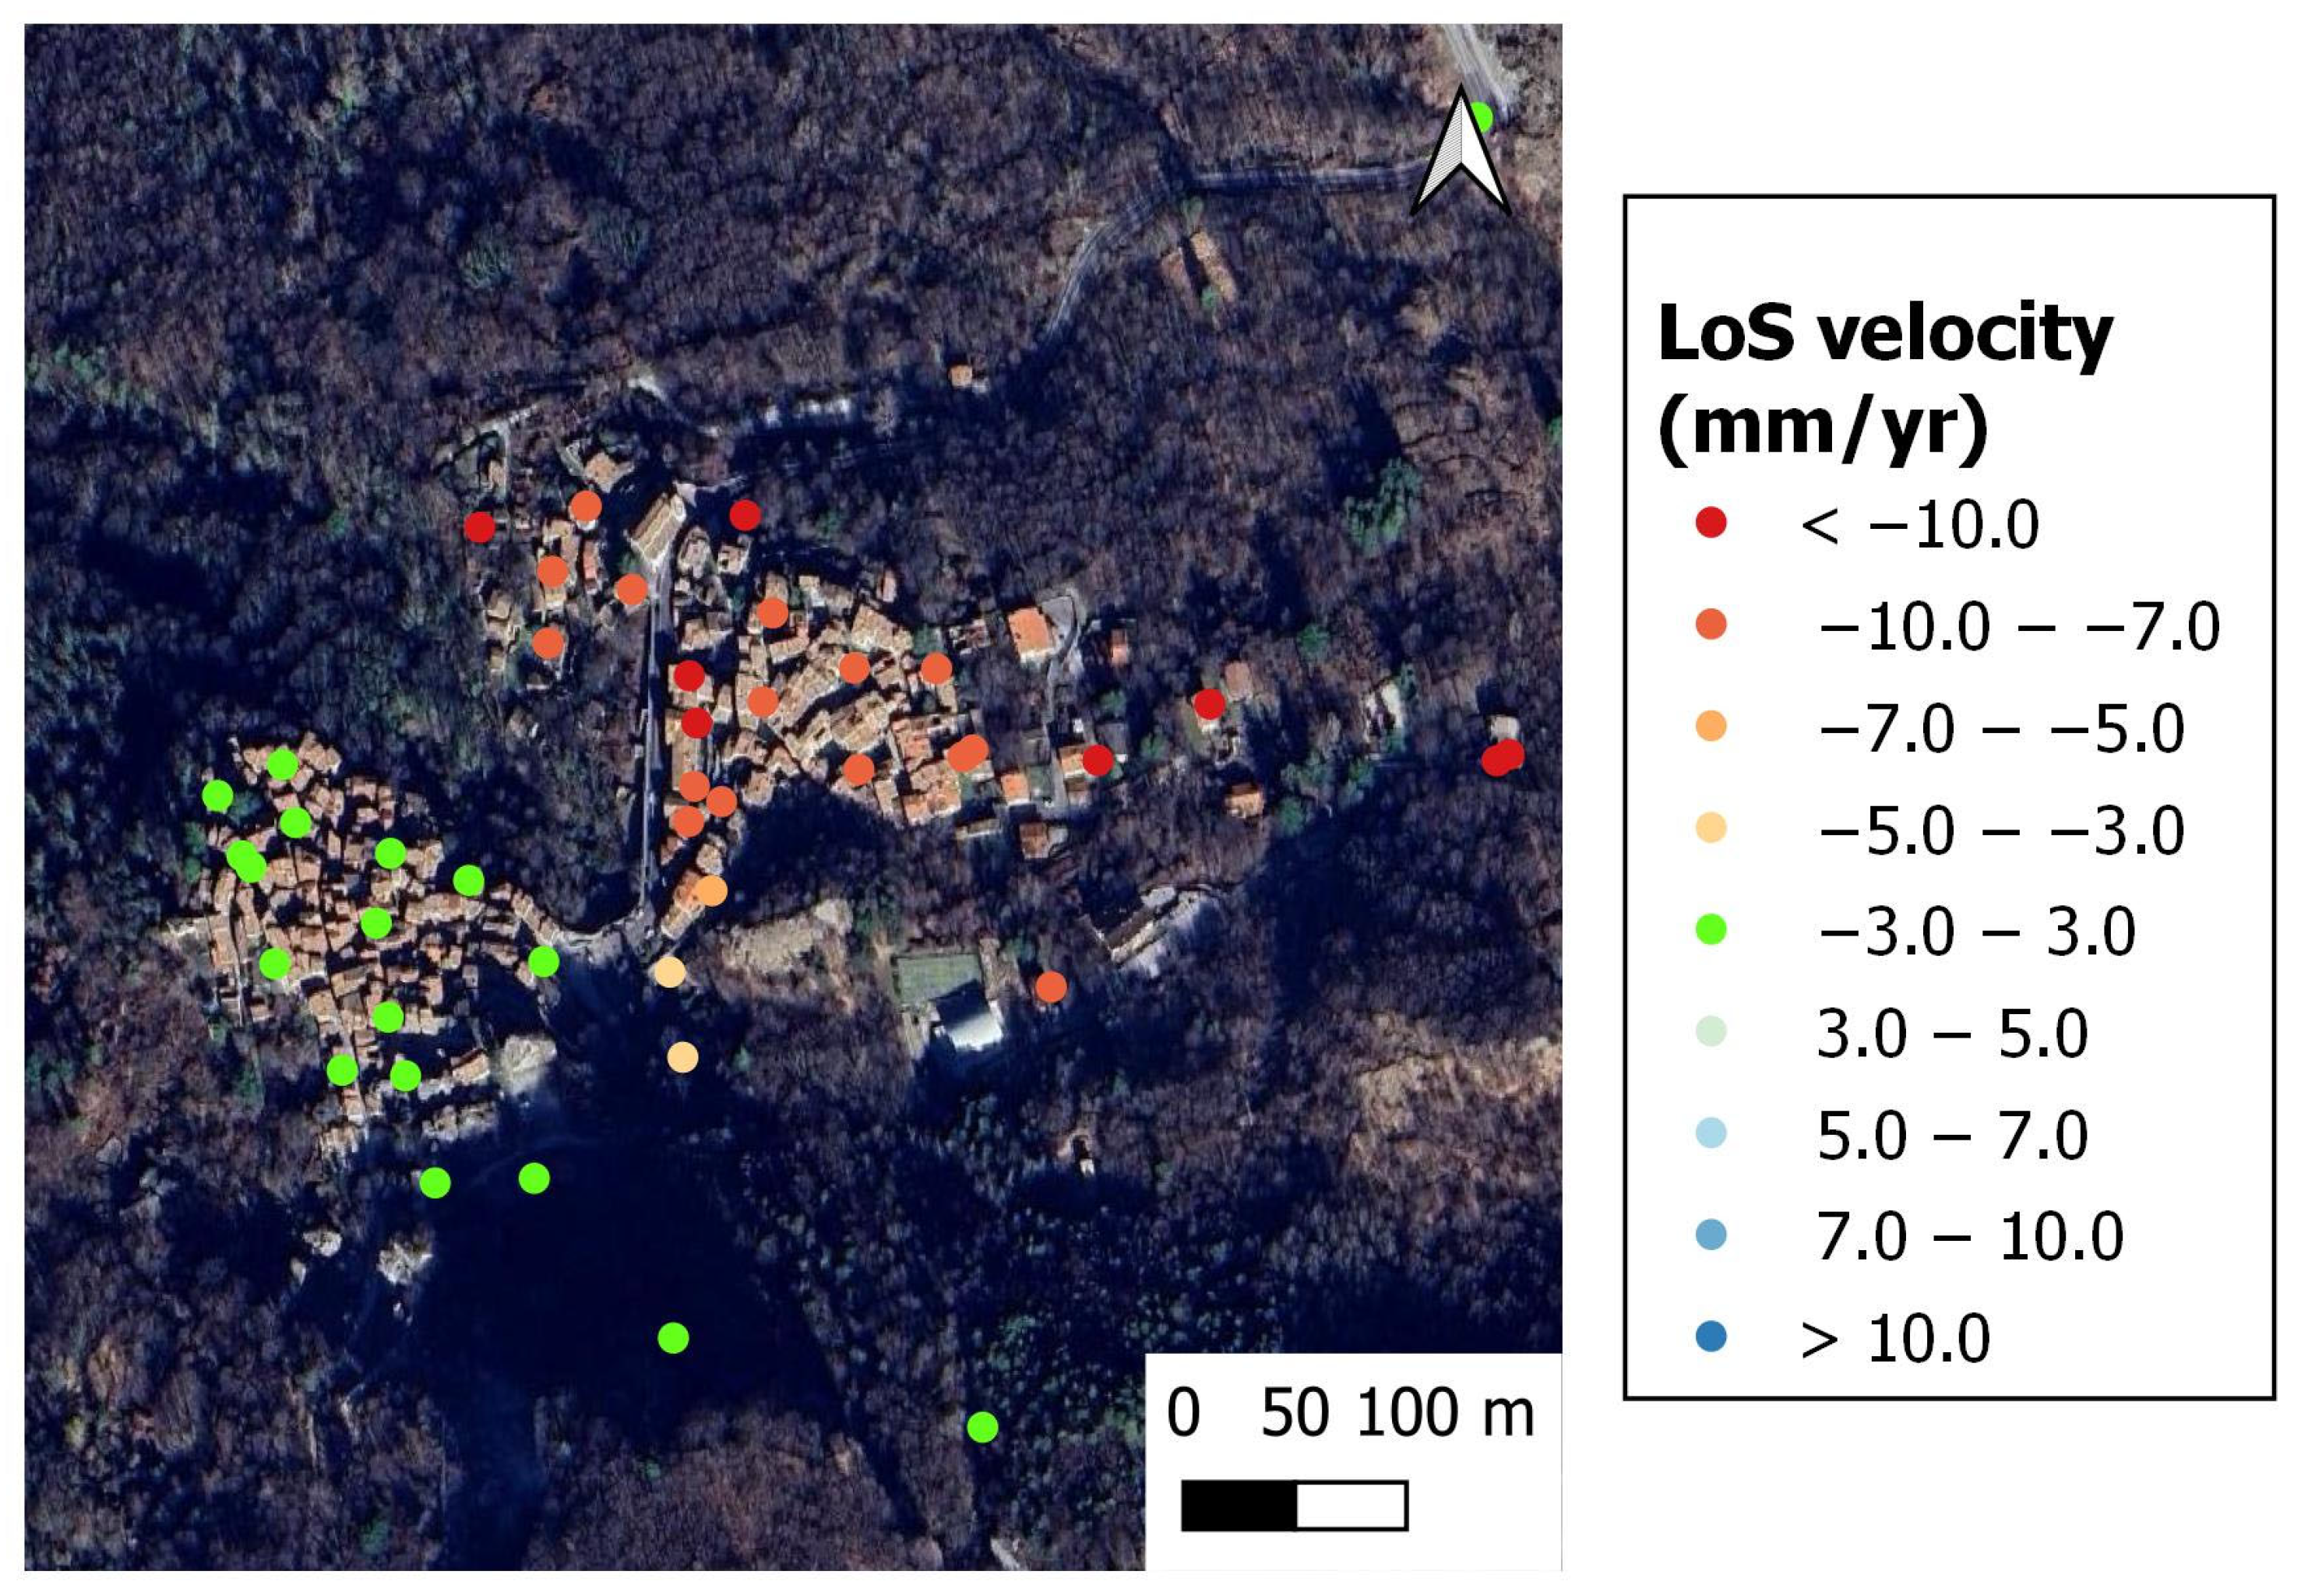
4.3. DInSAR Analysis
5. Discussion
6. Conclusions
Author Contributions
Funding
Data Availability Statement
Acknowledgments
Conflicts of Interest
References
- Glade, T.; Crozier, M.J. The Nature of Landslide Hazard Impact. In Landslide Hazard and Risk; Glade, T., Anderson, M.G., Crozier, M.J., Eds.; John Wiley & Sons, Ltd.: Hoboken, NJ, USA, 2005; pp. 43–74. [Google Scholar]
- Booth, A.M.; Lamb, M.P.; Avouac, J.P.; Delacourt, C. Landslide velocity, thickness, and rheology from remote sensing: La Clapière landslide, France. Geophys. Res. Lett. 2013, 40, 4299–4304. [Google Scholar] [CrossRef]
- Hungr, O.; Leroueil, S.; Picarelli, L. The Varnes classification of landslide types, an update. Landslides 2014, 11, 167–194. [Google Scholar] [CrossRef]
- Guerriero, L.; Bertello, L.; Cardozo, N.; Berti, M.; Grelle, G.; Revellino, P. Unsteady sediment discharge in earth flows: A case study from the Mount Pizzuto earth flow, southern Italy. Geomorphology 2017, 295, 260–284. [Google Scholar] [CrossRef]
- De Vita, P.; Carratù, M.T.; La Barbera, G.; Santoro, S. Kinematics and geological constraints of the slow-moving Pisciotta rock slide (southern Italy). Geomorphology 2013, 201, 415–429. [Google Scholar] [CrossRef]
- Pappalardo, G.; Mineo, S.; Angrisani, A.C.; Di Martire, D.; Calcaterra, D. Combining field data with infrared thermography and DInSAR surveys to evaluate the activity of landslides: The case study of Randazzo Landslide (NE Sicily). Landslides 2018, 15, 2173–2193. [Google Scholar] [CrossRef]
- Guerriero, L.; Prinzi, E.P.; Calcaterra, D.; Ciarcia, S.; Di Martire, D.; Guadagno, F.M.; Ruzza, G.; Revellino, P. Kinematics and geologic control of the deep-seated landslide affecting the historic center of Buonalbergo, southern Italy. Geomorphology 2021, 394, 107961. [Google Scholar] [CrossRef]
- He, L.; Coggan, J.; Francioni, M.; Eyre, M. Maximizing impacts of remote sensing surveys in slope stability—A novel method to incorporate discontinuities into machine learning landslide prediction. ISPRS Int. J. Geo-Inf. 2021, 10, 232. [Google Scholar] [CrossRef]
- Caliò, D.; Mineo, S.; Pappalardo, G. Digital Rock Mass Analysis for the Evaluation of Rockfall Magnitude at Poorly Accessible Cliffs. Remote Sens. 2023, 15, 1515. [Google Scholar] [CrossRef]
- Mammoliti, E.; Pepi, A.; Fronzi, D.; Morelli, S.; Volatili, T.; Tazioli, A.; Francioni, M. 3D Discrete Fracture Network Modelling from UAV Imagery Coupled with Tracer Tests to Assess Fracture Conductivity in an Unstable Rock Slope: Implications for Rockfall Phenomena. Remote Sens. 2023, 15, 1222. [Google Scholar] [CrossRef]
- Markus, S.J.; Wartman, J.; Olsen, M.; Darrow, M.M. Lidar-Derived Rockfall Inventory—An Analysis of the Geomorphic Evolution of Rock Slopes and Modifying the Rockfall Activity Index (RAI). Remote Sens. 2023, 15, 4223. [Google Scholar] [CrossRef]
- Morelli, S.; Bonì, R.; De Donatis, M.; Marino, L.; Pappafico, G.F.; Francioni, M. A Low-Cost and Fast Operational Procedure to Identify Potential Slope Instabilities in Cultural Heritage Sites. Remote Sens. 2023, 15, 5574. [Google Scholar] [CrossRef]
- Brückl, E.; Brunner, F.K.; Kraus, K. Kinematics of a deep-seated landslide derived from photogrammetric, GPS and geophysical data. Eng. Geol. 2006, 88, 149–159. [Google Scholar] [CrossRef]
- Frattini, P.; Crosta, G.B.; Rossini, M.; Allievi, J. Activity and kinematic behaviour of deep-seated landslides from PS-InSAR displacement rate measurements. Landslides 2018, 15, 1053–1070. [Google Scholar] [CrossRef]
- Di Martire, D.; Novellino, A.; Ramondini, M.; Calcaterra, D. A-Differential Synthetic Aperture Radar Interferometry analysis of a Deep Seated Gravitational Slope Deformation occurring at Bisaccia (Italy). Sci. Total Environ. 2016, 550, 556–573. [Google Scholar] [CrossRef]
- Guerriero, L.; Di Martire, D.; Calcaterra, D.; Francioni, M. Digital image correlation of google earth images for earth’s surface displacement estimation. Remote Sens. 2020, 12, 3518. [Google Scholar] [CrossRef]
- Notti, D.; Wrzesniak, A.; Dematteis, N.; Lollino, P.; Fazio, N.L.; Zucca, F.; Giordan, D. A multidisciplinary investigation of deep-seated landslide reactivation triggered by an extreme rainfall event: A case study of the Monesi di Mendatica landslide, Ligurian Alps. Landslides 2021, 18, 2341–2365. [Google Scholar] [CrossRef]
- Samsonov, S.V.; Blais-Stevens, A. Estimating volume of large slow-moving deep-seated landslides in northern Canada from DInSAR-derived 2D and constrained 3D deformation rates. Remote Sens. Environ. 2024, 305, 114049. [Google Scholar] [CrossRef]
- Stead, D.; Wolter, A. A critical review of rock slope failure mechanisms: The importance of structural geology. J. Struct. Geol. 2015, 74, 1–23. [Google Scholar] [CrossRef]
- Lacasse, S.; Nadim, F. Landslide risk assessment and mitigation strategy. In Landslides—Disaster Risk Reduction; Springer: Berlin/Heidelberg, Germany, 2009; pp. 31–61. [Google Scholar]
- Popescu, M.E.; Sasahara, K. Engineering Measures for Landslide Disaster Mitigation. In Landslides—Disaster Risk Reduction; Sassa, K., Canuti, P., Eds.; Springer: Berlin/Heidelberg, Germany, 2009. [Google Scholar]
- Galve, J.P.; Cevasco, A.; Brandolini, P.; Soldati, M. Assessment of shallow landslide risk mitigation measures based on land use planning through probabilistic modelling. Landslides 2015, 12, 101–114. [Google Scholar] [CrossRef]
- Centamore, E.; Nisio, S.; Prestininzi, A.; Scarascia Mugnozza, G. Evoluzione morfodinamica e fenomeni franosi nel settore periadriatico dell’Abruzzo Settentrionale. Studi Geol. Camerti 1997, 14, 9–27. [Google Scholar]
- Centamore, E.; Cantalamessa, G.; Micarelli, A.; Potetti, M.; Berti, D.; Bigi, S.; Morelli, C.; Ridolfi, M. Stratigrafia e analisi di facies dei depositi del Miocene e del Pliocene inferiore dell’avanfossa marchigiano-abruzzese e delle zone limitrofe. Studi Geol. Camerti 1992, 2, 125–131. [Google Scholar]
- D’agostino, N.; Chamot-Rooke, N.; Funiciello, R.; Jolivet, L.; Speranza, F. The role of preexisting thrust faults and topography on the styles of extension in the Gran Sasso range (Central Italy). Tectonophysics 1998, 292, 229–254. [Google Scholar] [CrossRef]
- Calamita, F.; Adamoli, L.; Scisciani, V.; Ben M’Barek, M.; Pelorosso, M. Il sistema a thrust del Gran Sasso d’Italia (Appennino Centrale). Studi Geol. Camerti Nuova Ser. 2002, 1, 19–32. [Google Scholar]
- D’alessandro, L.; De Sisti, G.; D’orefice, M.; Pecci, M.; Ventura, M. Geomorphology of the summit area of the Gran Sasso d’Italia (Abruzzo, Italy). Geogr. Fis. Din. Quat. 2003, 26, 125–141. [Google Scholar]
- Boncio, P.; Lavecchia, G.; Pace, B. Defining a model of 3D seismogenic sources for seismic hazard assessment applications: The case of central Apennines (Italy). J. Seism. 2004, 8, 407–425. [Google Scholar] [CrossRef]
- Calamita, F.; Patruno, S.; Pomposo, G.; Tavarnelli, E. Geometria e cinematica delle anticlinali dell’Appennino centrale esterno: Il ruolo delle faglie dirette giurassiche. Rend. Della Soc. Geol. Ital. 2007, 4, 167–169. [Google Scholar]
- Pecci, M.; D’Aquila, P. Geomorphological features and cartography of the Gran Sasso d’Italia massif between Corno Grande-Corno Piccolo and Pizzo Intermesoli. Geogr. Fis. Dinam. Quat. 2011, 34, 127–143. [Google Scholar]
- Gabriel, A.K.; Goldstein, R.M.; Zebker, H.A. Mapping small elevation changes over large areas: Differential radar interferometry. J. Geophys. Res. 1989, 94, 9183–9191. [Google Scholar] [CrossRef]
- Ferretti, A.; Prati, C.; Rocca, F. Permanent Scatteres in SAR Interferometry. IEEE Trans. Geosci. Remote Sens. 2001, 39, 8–20. [Google Scholar] [CrossRef]
- Sacco, P.; Battagliere, M.L.; Daraio, M.G.; Coletta, A. The COSMO-SkyMed constellation monitoring of the Italian territory: The Map Italy project. In Proceedings of the 66th International Astronautical Congress (IAC), Jerusalem, Israel, 12–16 October 2015; pp. 12–16. [Google Scholar]
- Barra, A.; Monserrat, O.; Mazzanti, P.; Esposito, C.; Crosetto, M.; Scarascia Mugnozza, G. First insights on the potential of Sentinel-1 for landslides detection. Geomat. Nat. Hazard Risk 2016, 7, 1874–1883. [Google Scholar] [CrossRef]
- Costantini, M.; Ferretti, A.; Minati, F.; Falco, S.; Trillo, F.; Colombo, D.; Novali, F.; Malvarosa, F.; Mammone, C.; Vecchioli, F.; et al. Analysis of surface deformations over the whole Italian territory by interferometric processing of ERS, Envisat and COSMOSkyMed radar data. Remote Sens. Environ. 2017, 202, 250–275. [Google Scholar] [CrossRef]
- Di Martire, D.; Paci, M.; Confuorto, P.; Costabile, S.; Guastaferro, F.; Verta, A.; Calcaterra, D. A nation-wide system for landslide mapping and risk management in Italy: The second Not-ordinary Plan of Environmental Remote Sensing. Int. J. Appl. Earth Obs. Geoinf. 2017, 63, 143–157. [Google Scholar] [CrossRef]
- Mora, O.; Mallorqui, J.; Broquetas, A. Linear and nonlinear terrain deformation maps from a reduced set of interferometric sar images. IEEE Trans. Geosci. Remote Sens. 2003, 41, 2243–2253. [Google Scholar] [CrossRef]
- Iglesias, R.; Mallorqui, J.J.; Monells, D.; López-Martínez, C.; Fabregas, X.; Aguasca, A.; Gili, J.A.; Corominas, J. PSI deformation map retrieval by means of temporal sublook coherence on reduced sets of SAR images. Remote Sens. 2015, 7, 530–563. [Google Scholar] [CrossRef]
- Alexander, D.; Formichi, R. Tectonic causes of landslides. Earth Surf. Process. Landf. 1993, 18, 311–338. [Google Scholar] [CrossRef]
- Larsen, I.; Montgomery, D. Landslide erosion coupled to tectonics and river incision. Nat. Geosci. 2012, 5, 468–473. [Google Scholar] [CrossRef]
- Lebourg, T.; Binet, S.; Tric, E.; Jomard, H.; El Bedoui, S. Geophysical survey to estimate the 3D sliding surface and the 4D evolution of the water pressure on part of a deep seated landslide. Terra Nova 2015, 17, 399–406. [Google Scholar] [CrossRef]
- Chang, K.T.; Huang, H.C. Three-dimensional analysis of a deep-seated landslide in central Taiwan. Environ. Earth Sci. 2015, 74, 1379–1390. [Google Scholar] [CrossRef]
- Carlini, M.; Chelli, A.; Vescovi, P.; Artoni, A.; Clemenzi, L.; Tellini, C.; Torelli, L. Tectonic control on the development and distribution of large landslides in the Northern Apennines (Italy). Geomorphology 2016, 253, 425–437. [Google Scholar] [CrossRef]
- Francioni, M.; Stead, D.; Clague, J.J.; Westin, A. Identification and analysis of large Paleo-Landslides at Mount Burnaby, British Columbia. Environ. Eng. Geosci. 2018, 24, 221–235. [Google Scholar] [CrossRef]


| Set | Dip | Dip Direction |
|---|---|---|
| J1 | 88 | 179 |
| J2 | 88 | 087 |
| J3 | 89 | 300 |
Disclaimer/Publisher’s Note: The statements, opinions and data contained in all publications are solely those of the individual author(s) and contributor(s) and not of MDPI and/or the editor(s). MDPI and/or the editor(s) disclaim responsibility for any injury to people or property resulting from any ideas, methods, instructions or products referred to in the content. |
© 2024 by the authors. Licensee MDPI, Basel, Switzerland. This article is an open access article distributed under the terms and conditions of the Creative Commons Attribution (CC BY) license (https://creativecommons.org/licenses/by/4.0/).
Share and Cite
Francioni, M.; Calcaterra, D.; Di Martire, D.; Guerriero, L.; Scarascia Mugnozza, G.; Sciarra, N. Deep-Seated Landslide and Rockfalls Threatening the Village of Pietracamela in Central Italy: Deciphering Phenomena from Interferometric Synthetic Aperture Radar and Point Cloud Analysis. Remote Sens. 2024, 16, 3151. https://doi.org/10.3390/rs16173151
Francioni M, Calcaterra D, Di Martire D, Guerriero L, Scarascia Mugnozza G, Sciarra N. Deep-Seated Landslide and Rockfalls Threatening the Village of Pietracamela in Central Italy: Deciphering Phenomena from Interferometric Synthetic Aperture Radar and Point Cloud Analysis. Remote Sensing. 2024; 16(17):3151. https://doi.org/10.3390/rs16173151
Chicago/Turabian StyleFrancioni, Mirko, Domenico Calcaterra, Diego Di Martire, Luigi Guerriero, Gabriele Scarascia Mugnozza, and Nicola Sciarra. 2024. "Deep-Seated Landslide and Rockfalls Threatening the Village of Pietracamela in Central Italy: Deciphering Phenomena from Interferometric Synthetic Aperture Radar and Point Cloud Analysis" Remote Sensing 16, no. 17: 3151. https://doi.org/10.3390/rs16173151