

Analysing Temporal Evolution of OpenStreetMap Waterways Completeness in a Mountain Region of Portugal


Abstract
:1. Introduction
2. Materials and Methods
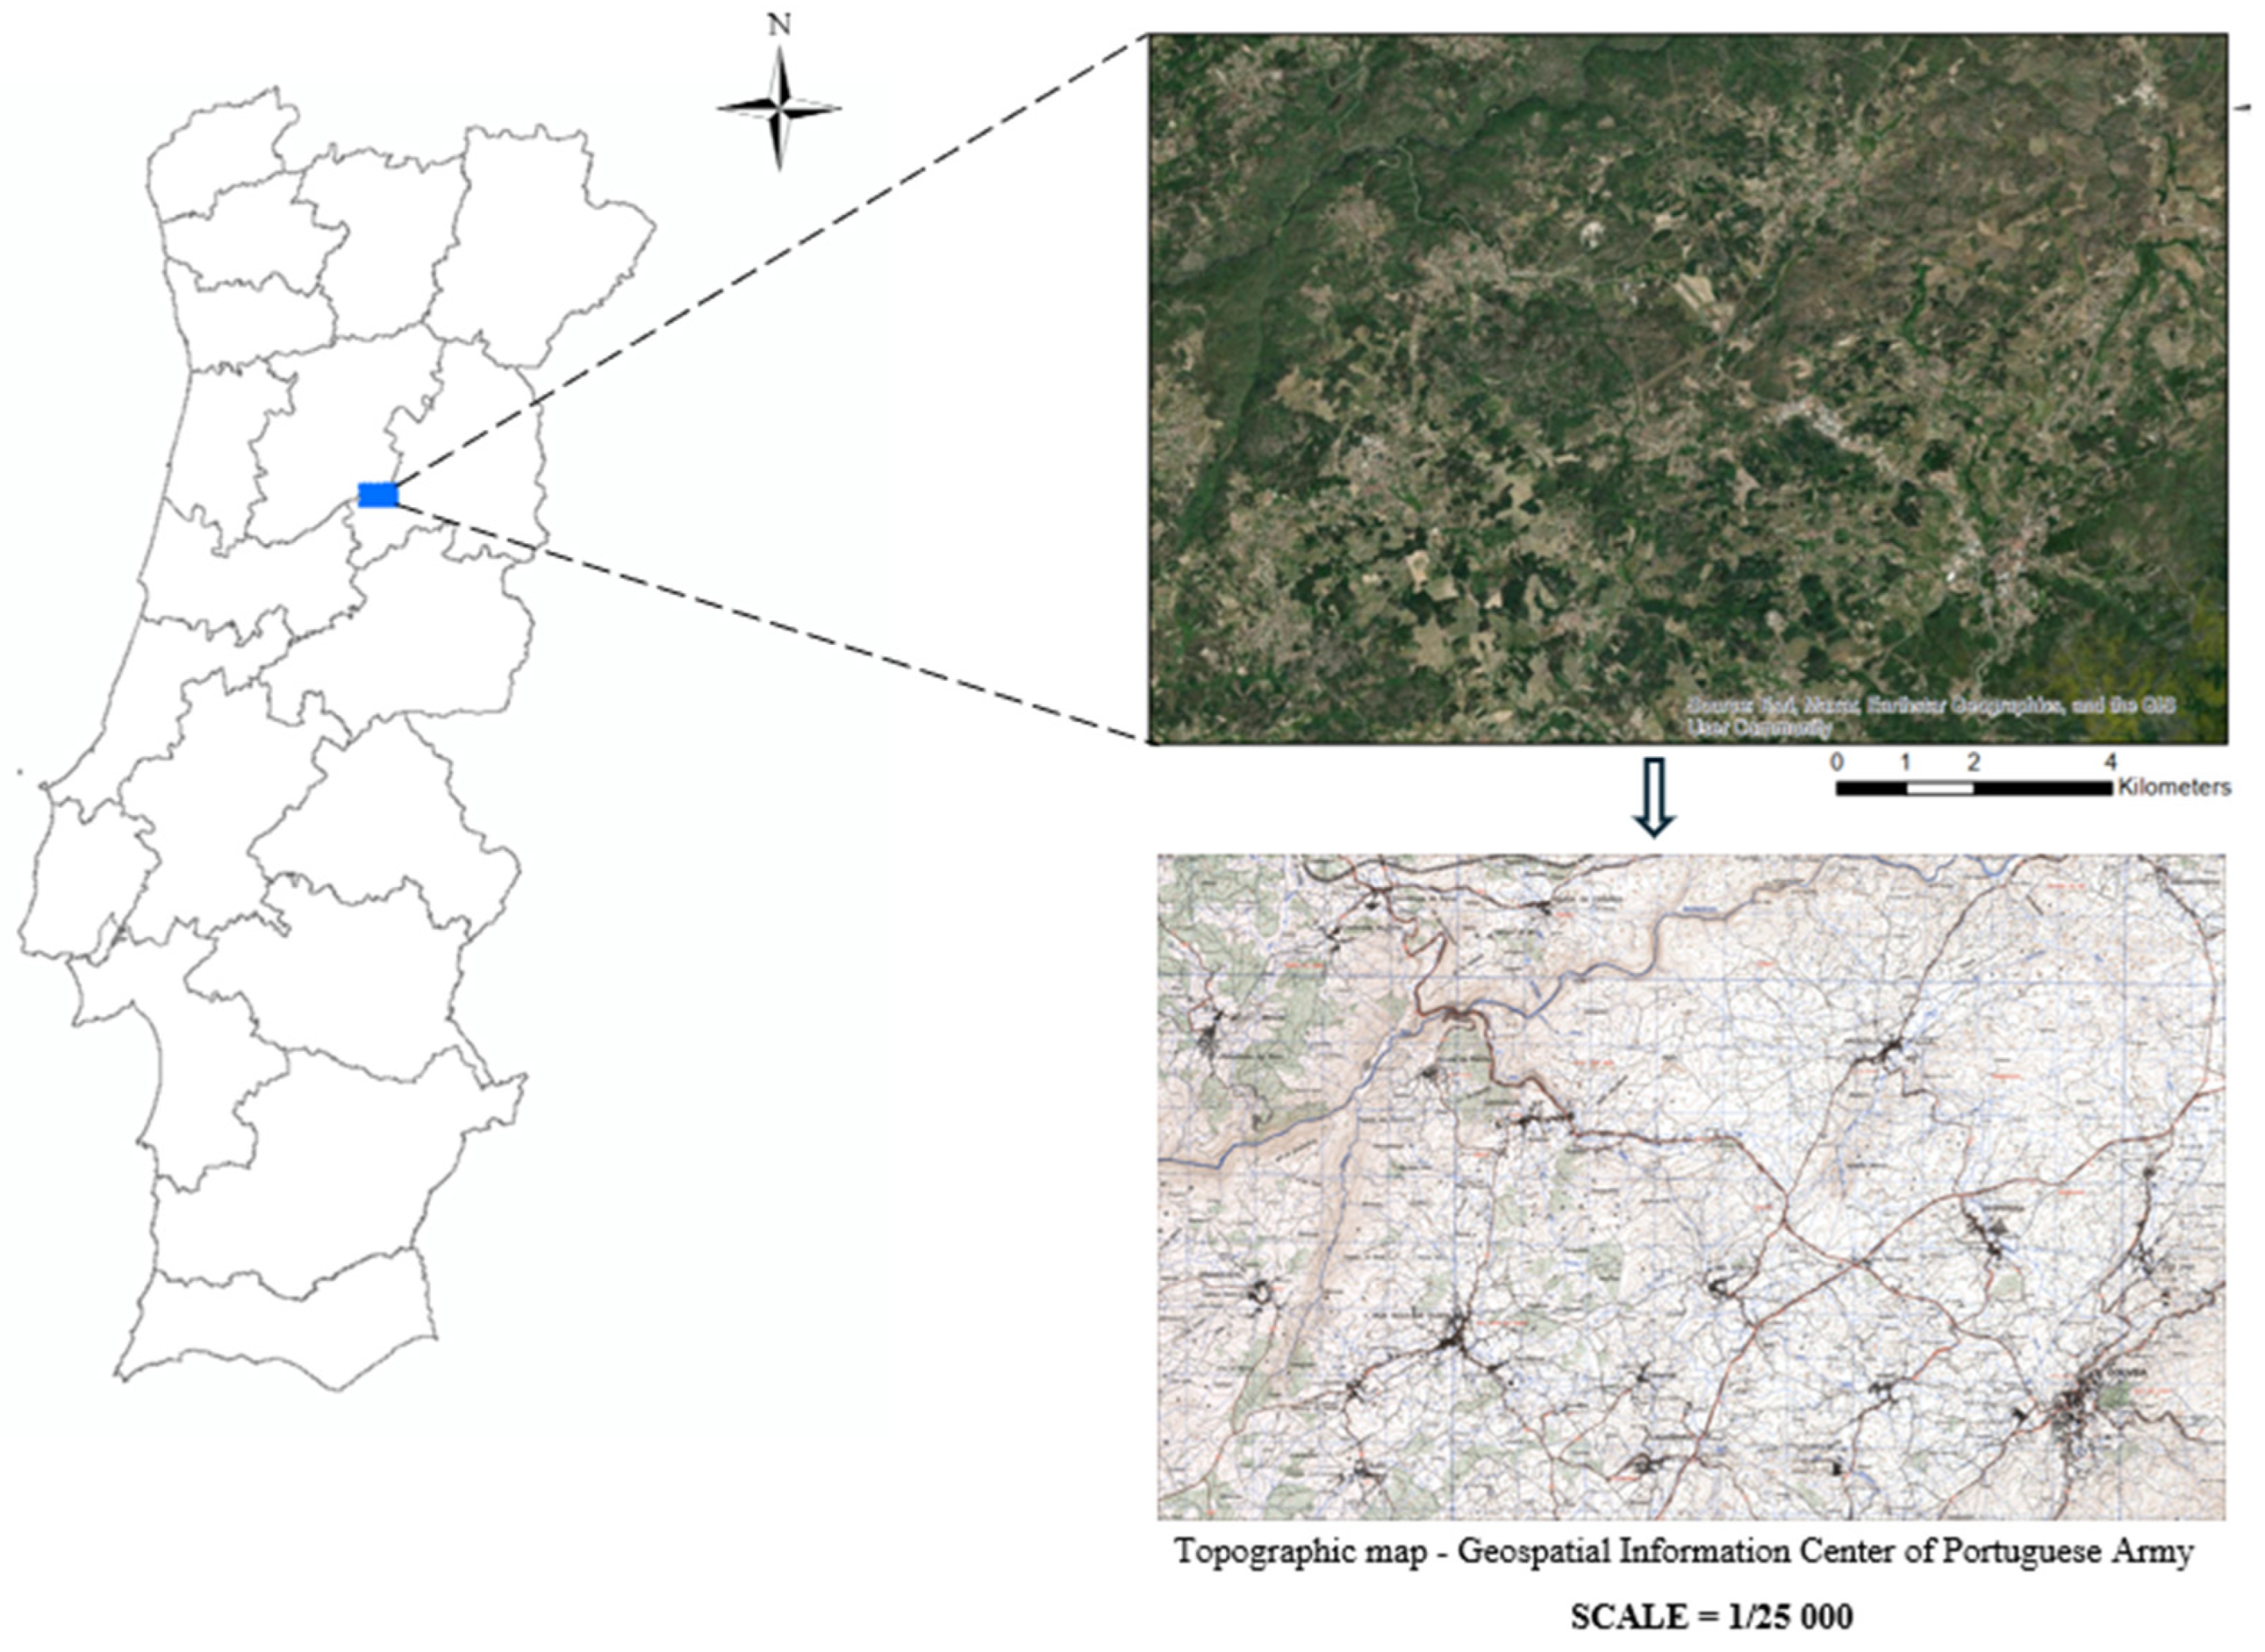
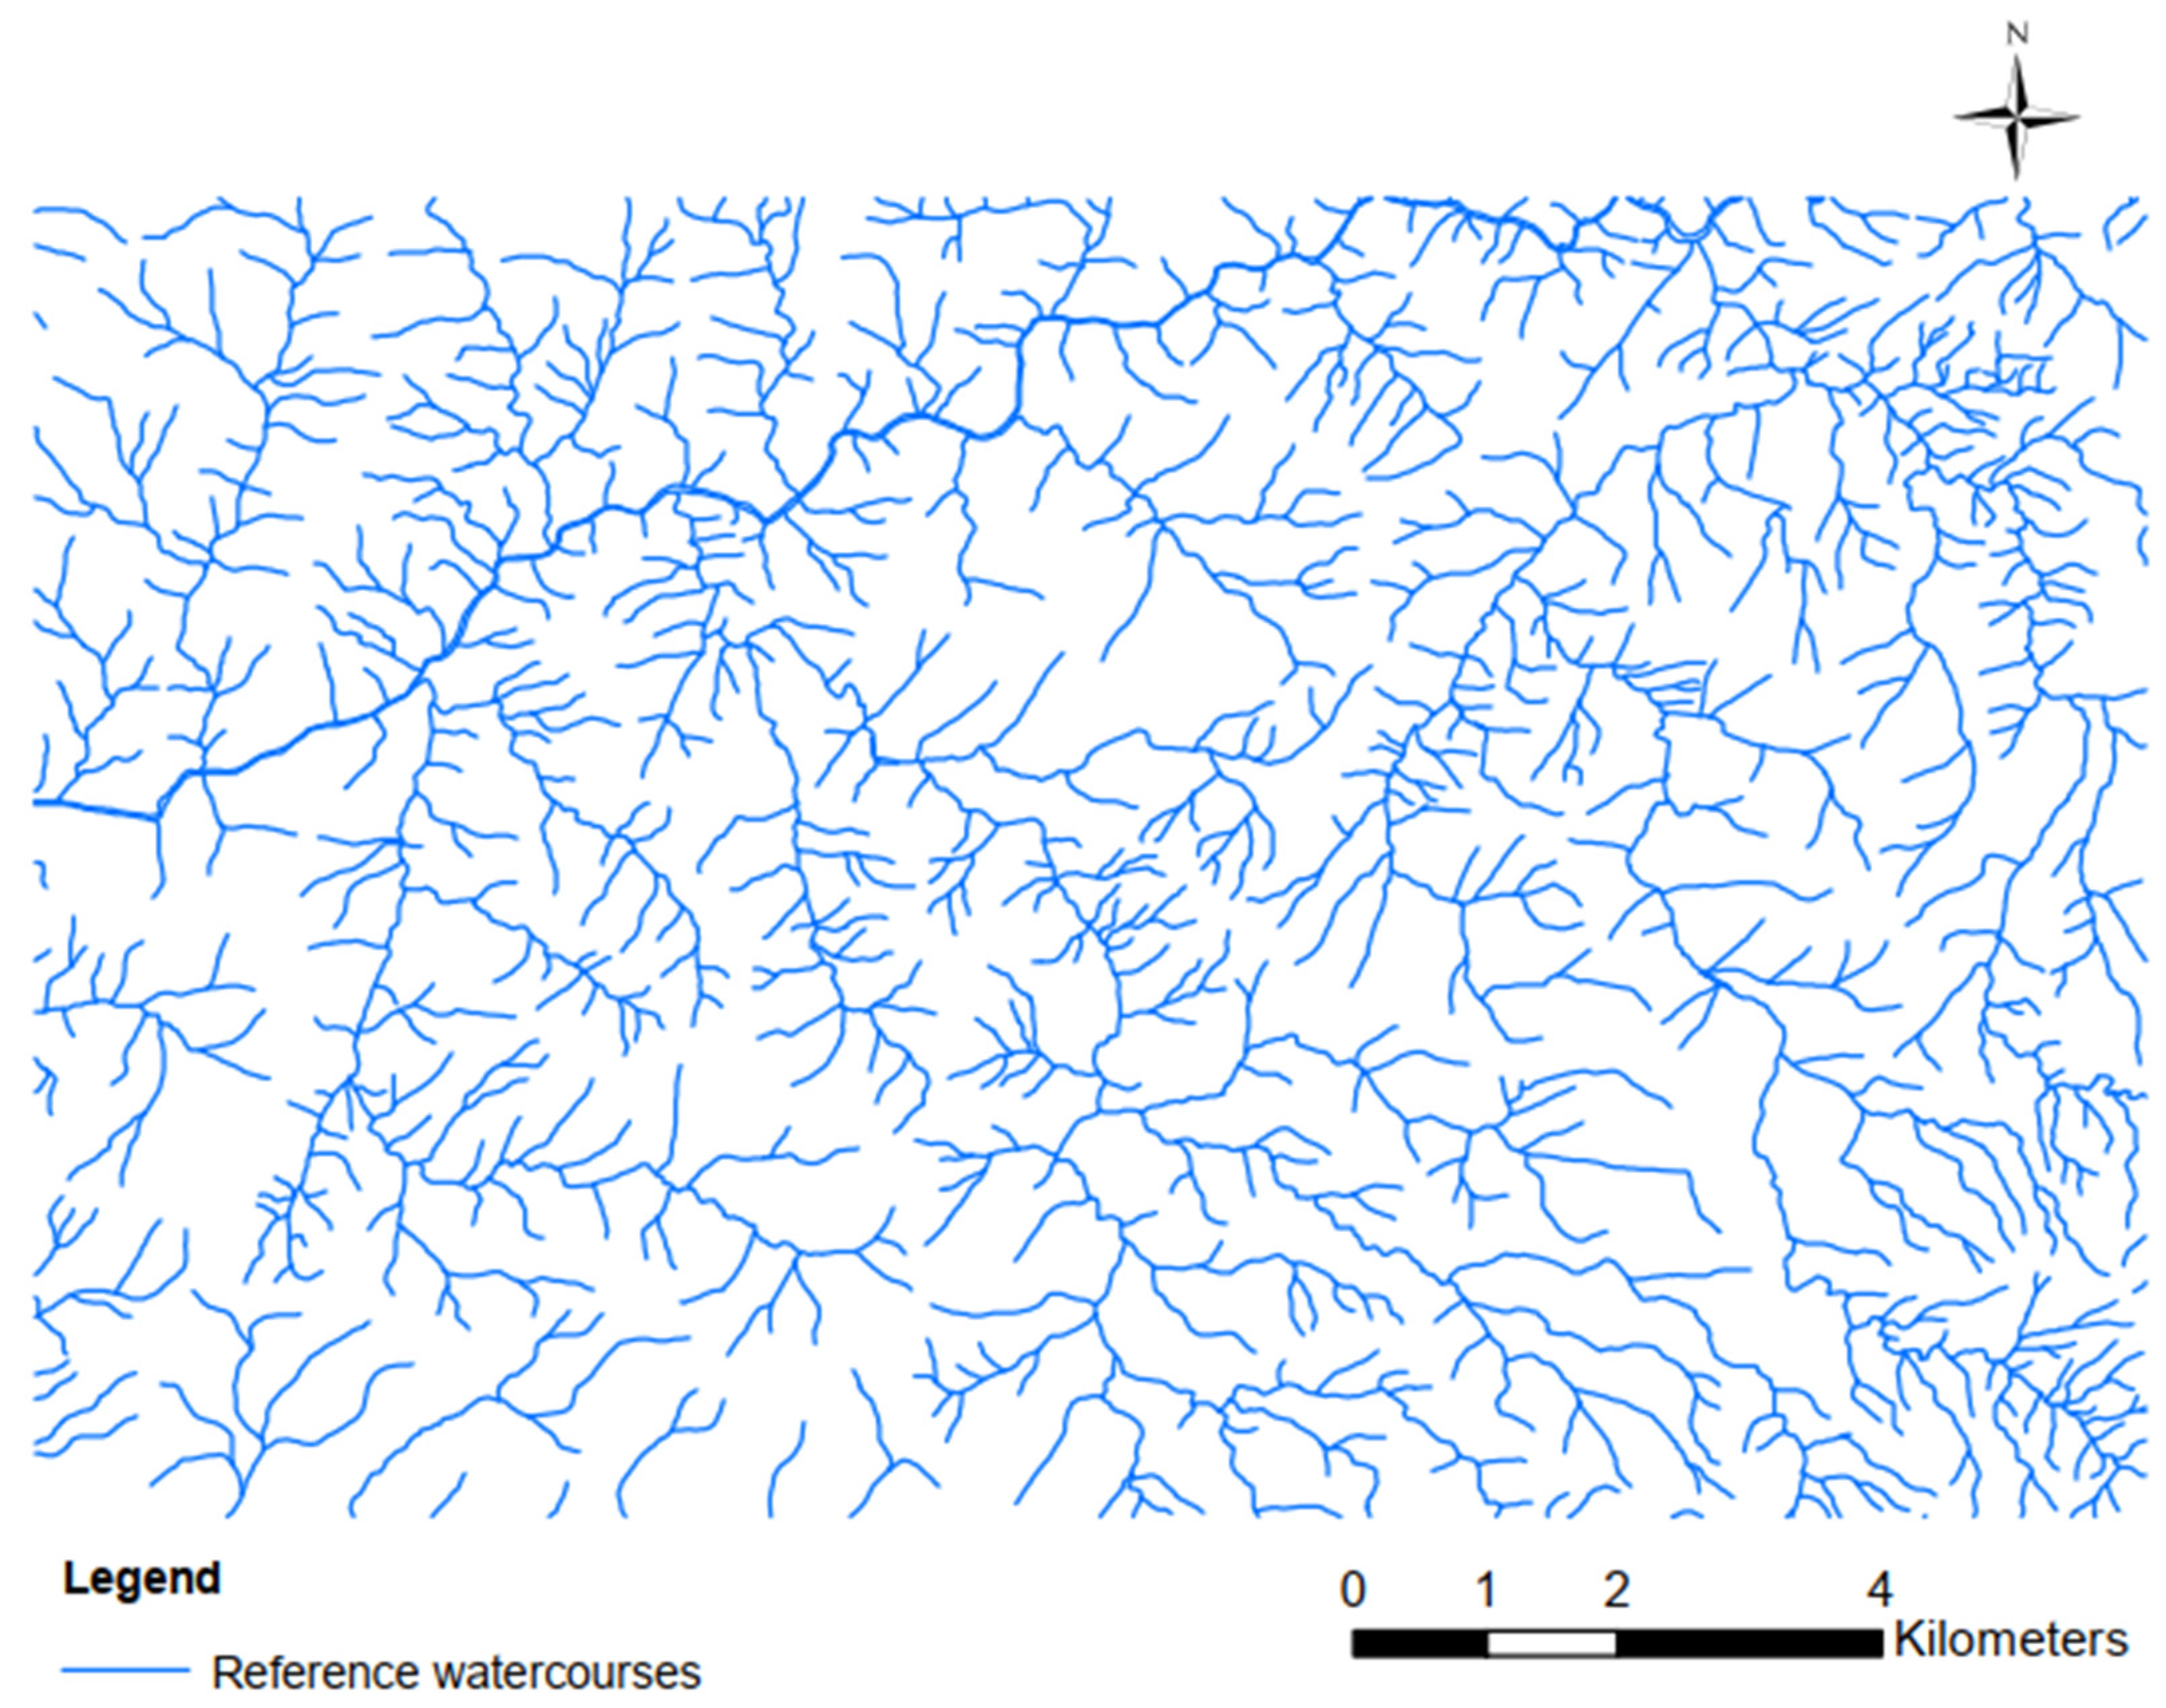
2.1. Data and Study Area
2.2. Methodology
3. Results Analysis and Discussion
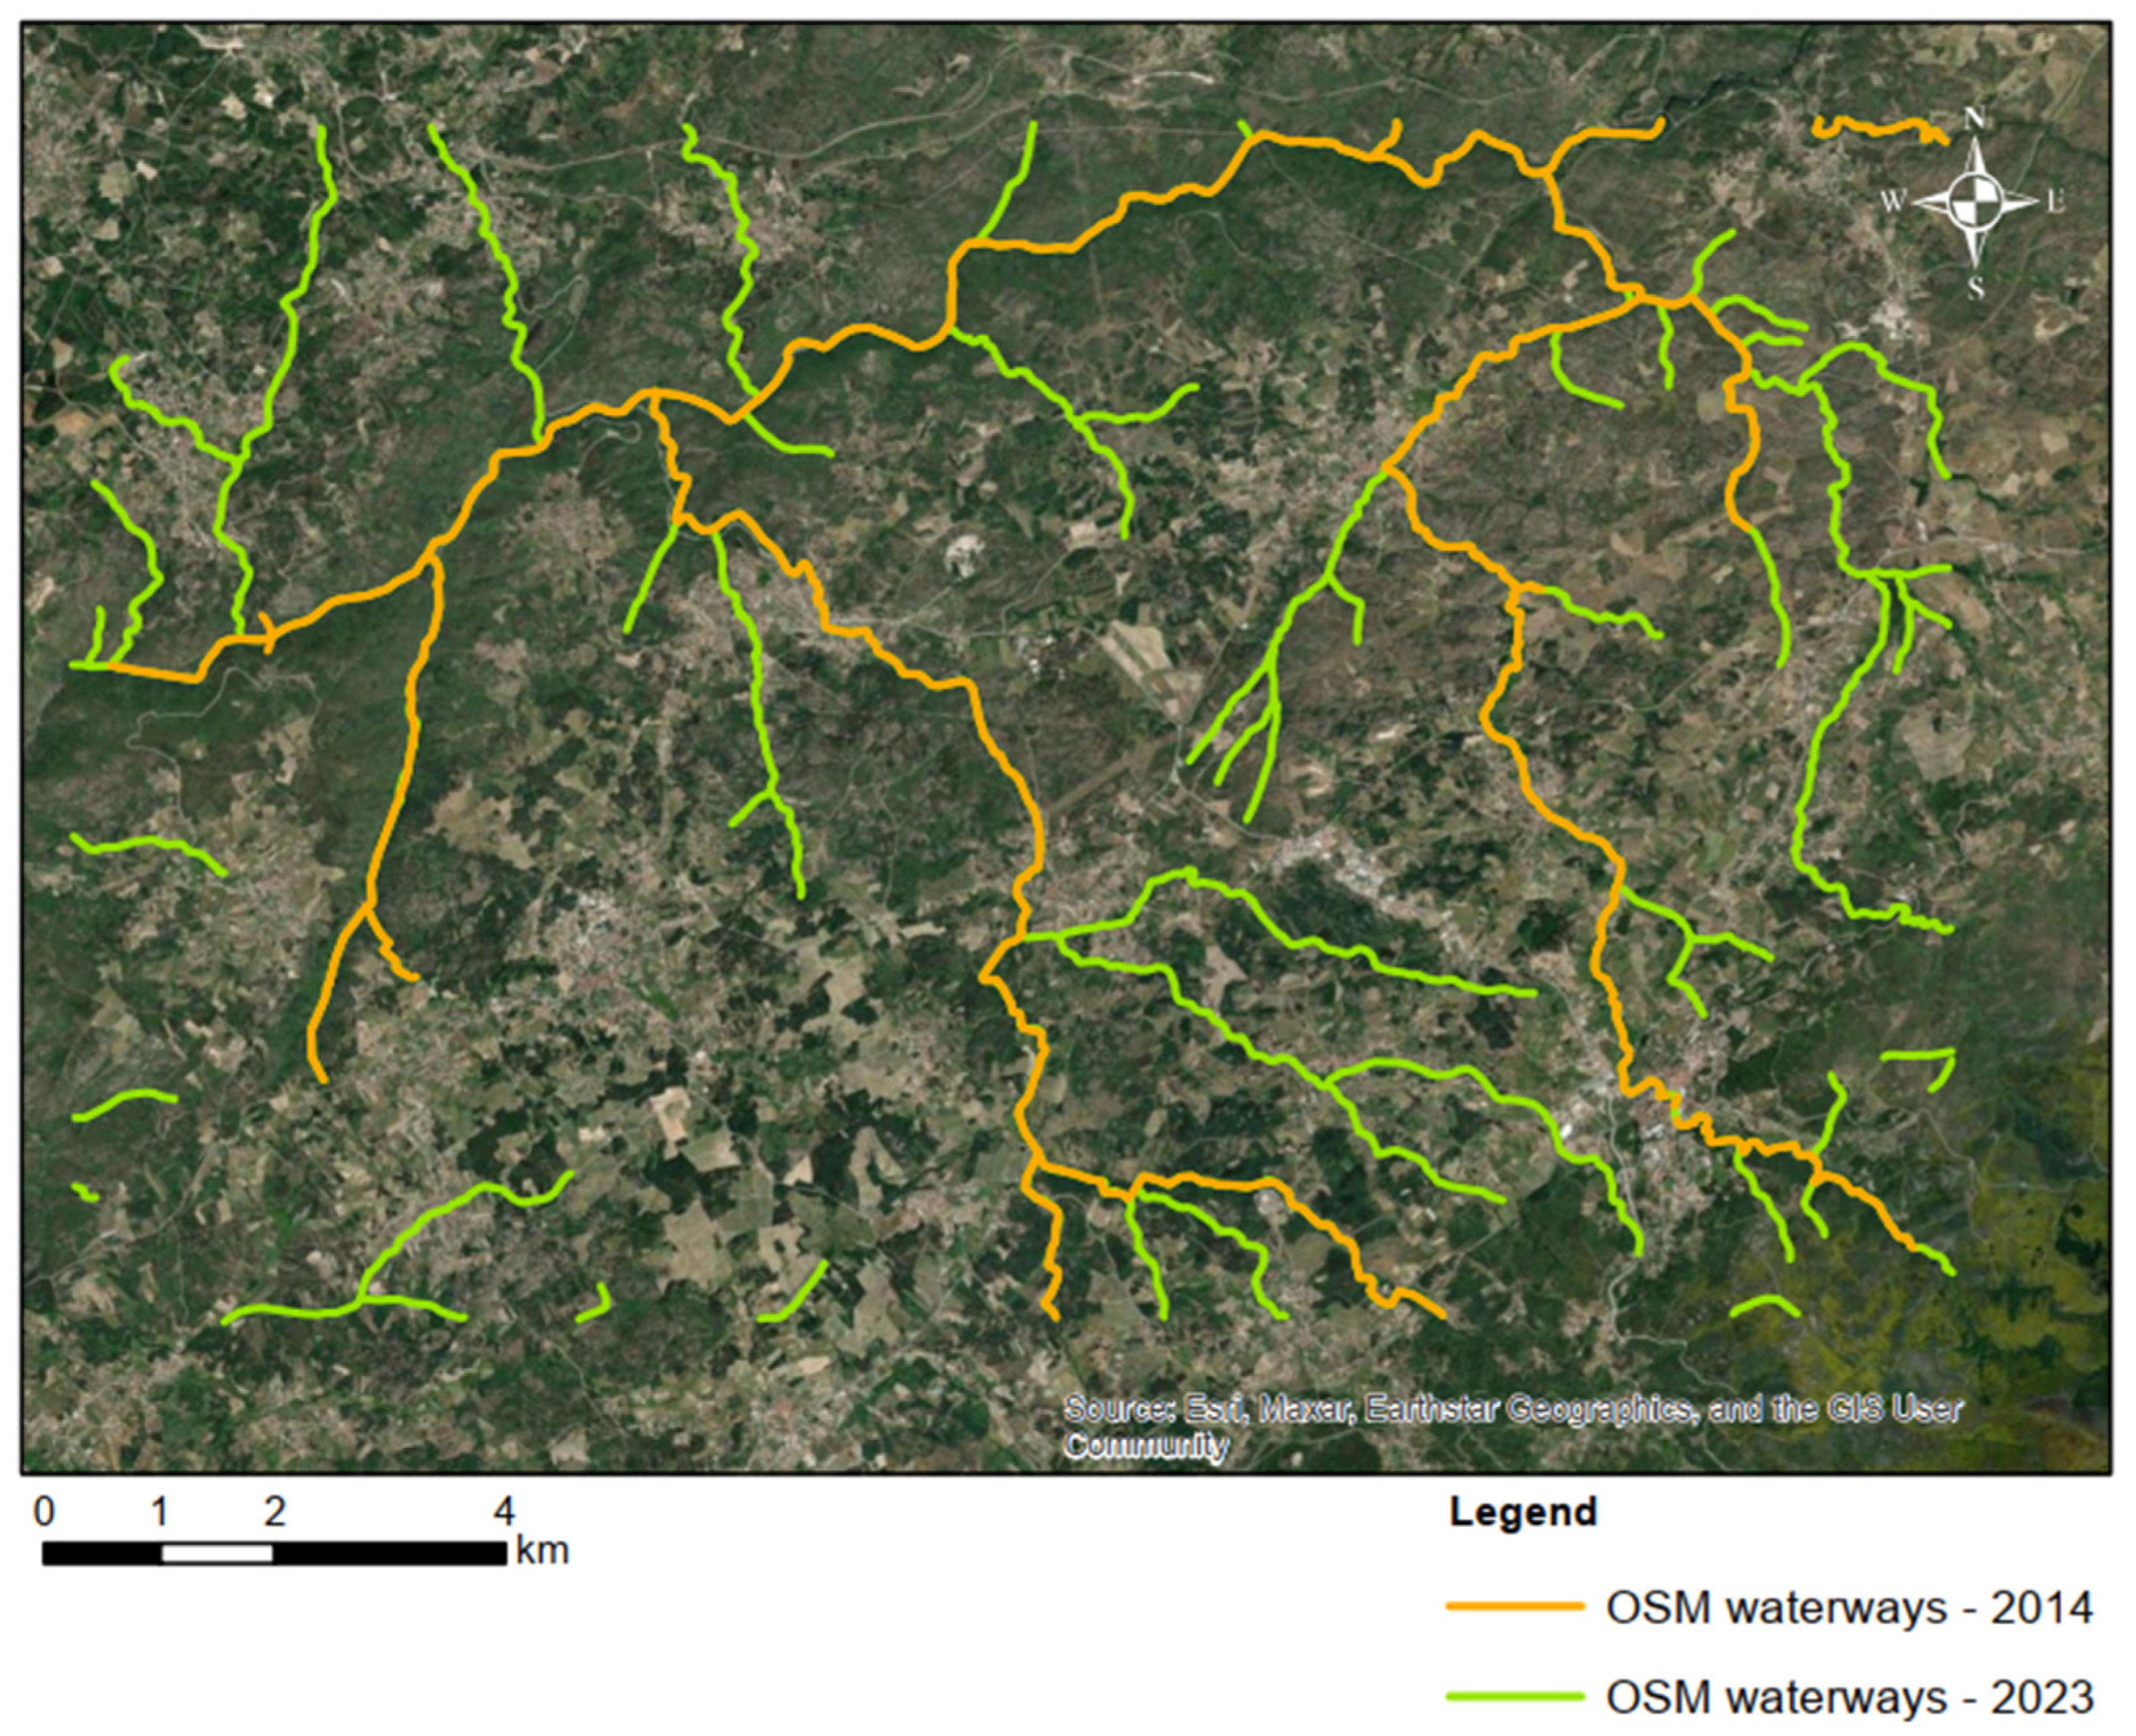
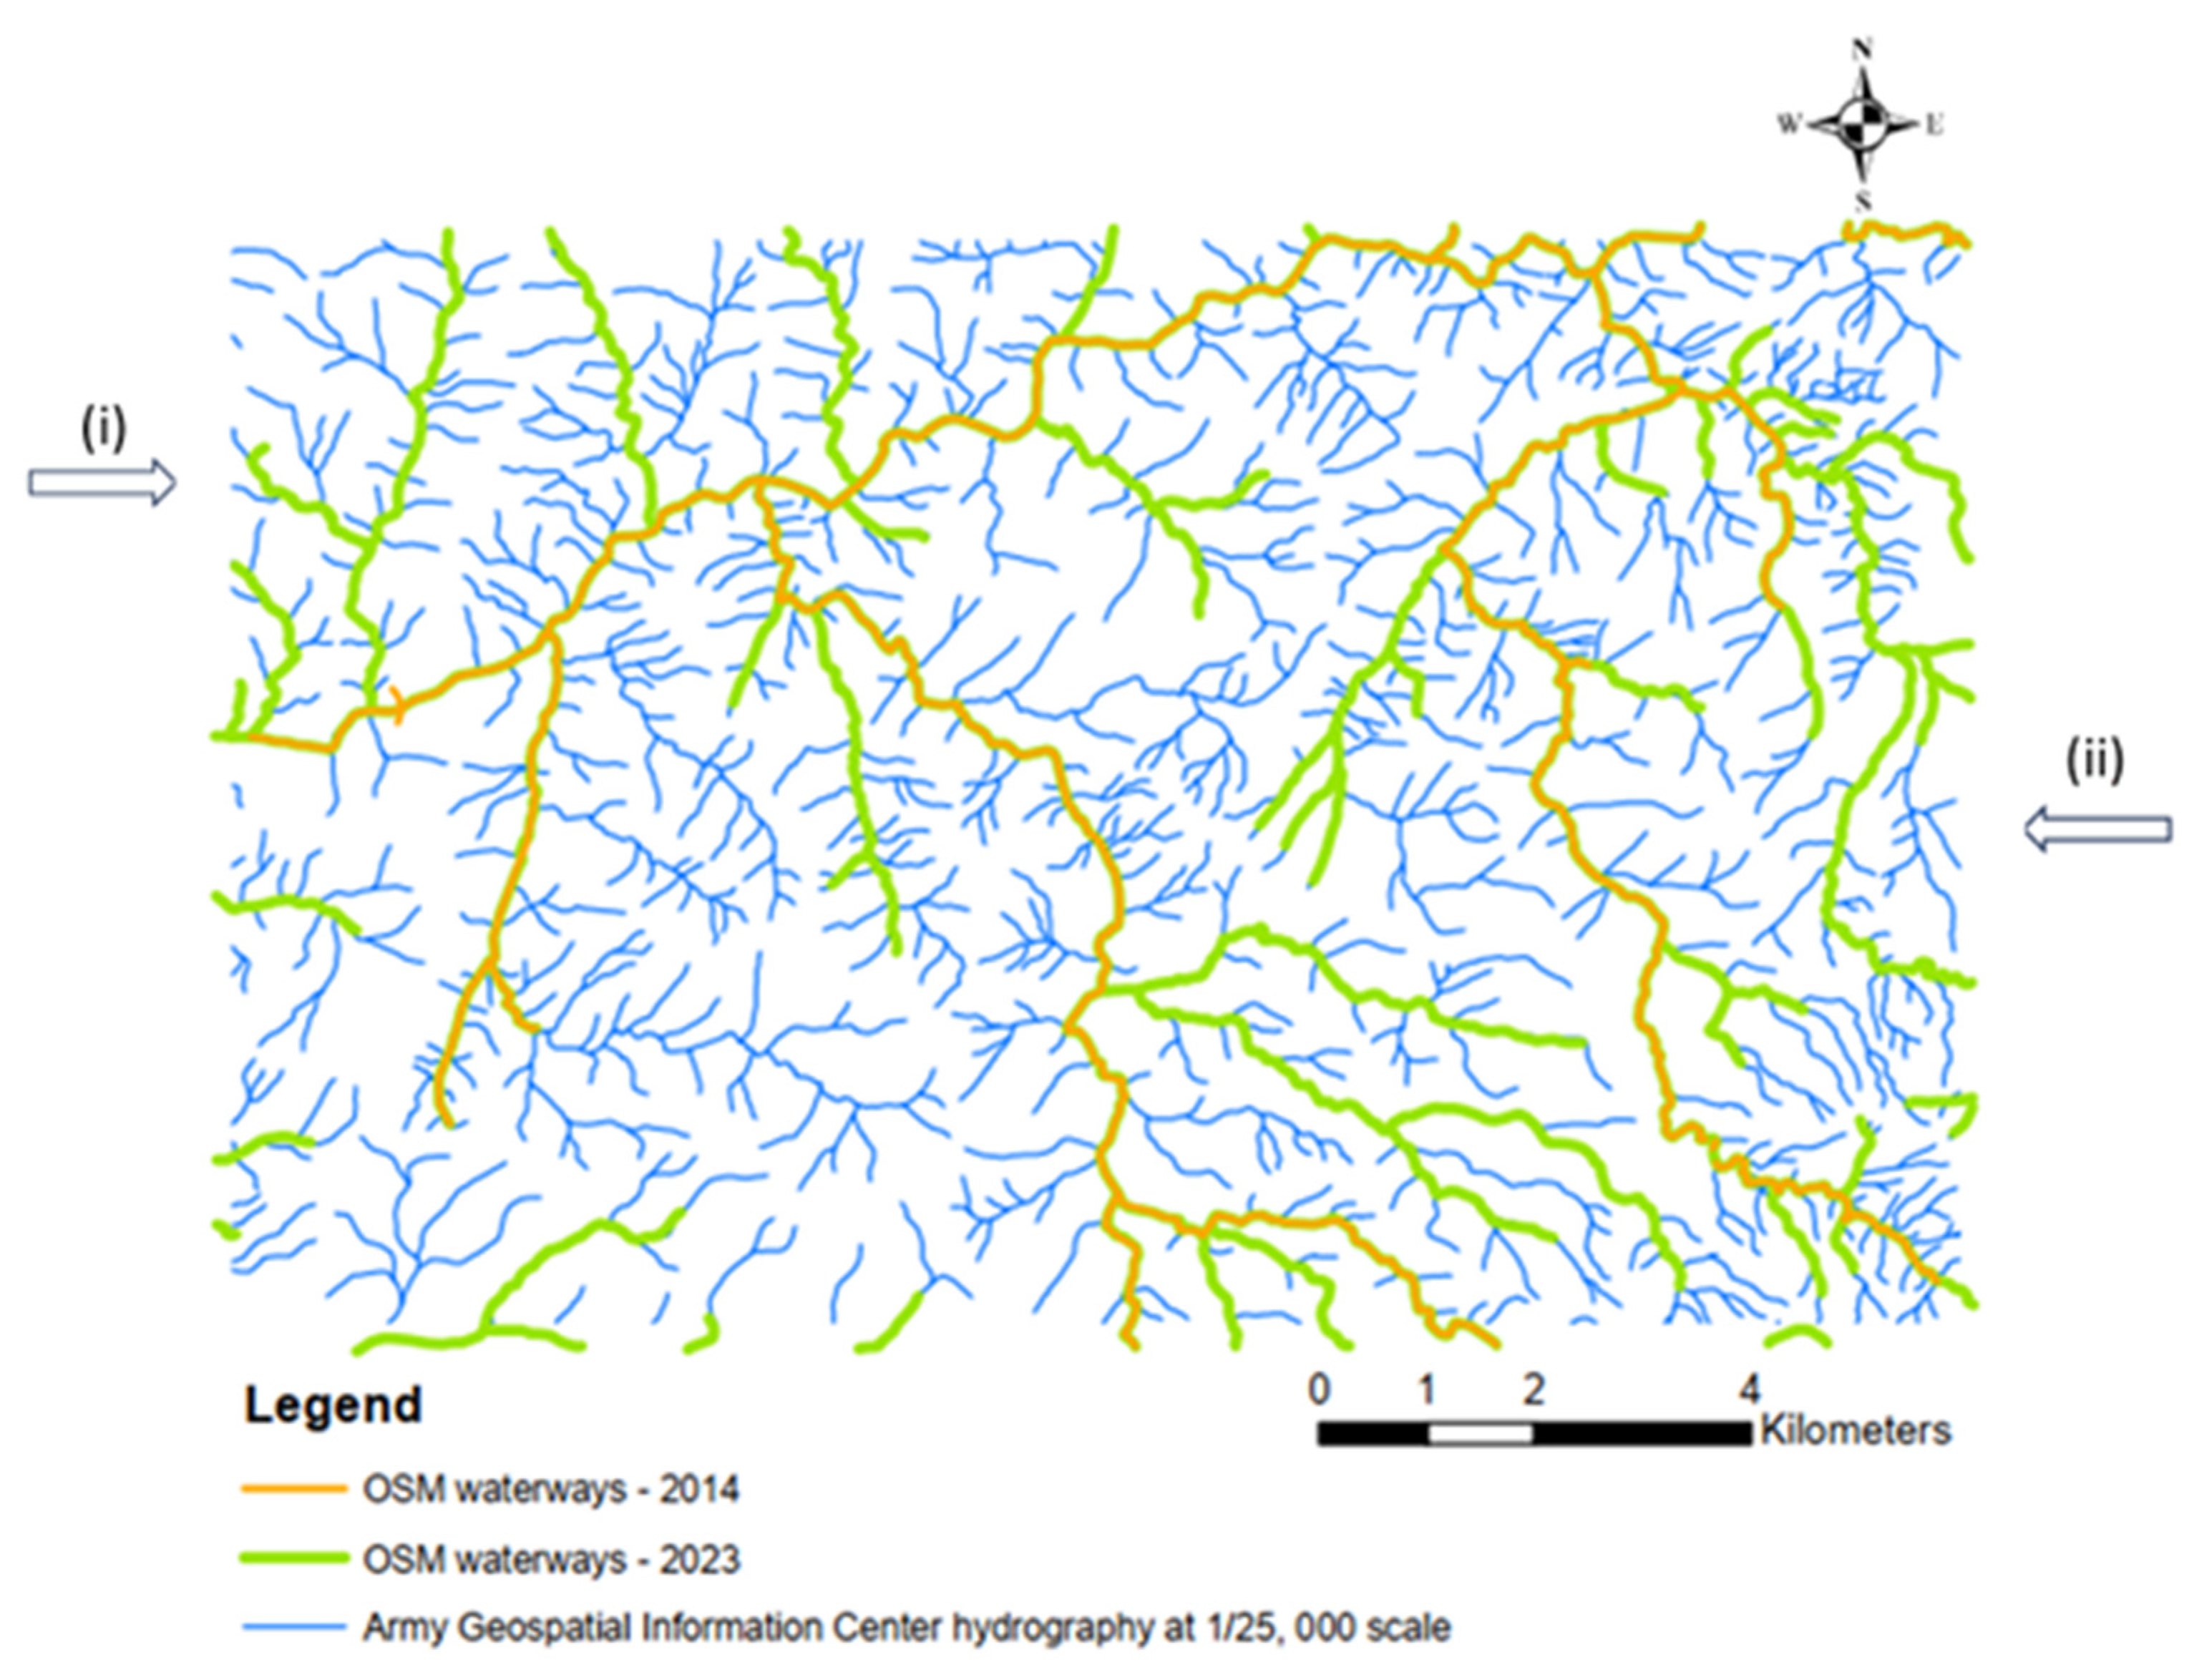
3.1. Entire Study Area
- (i)
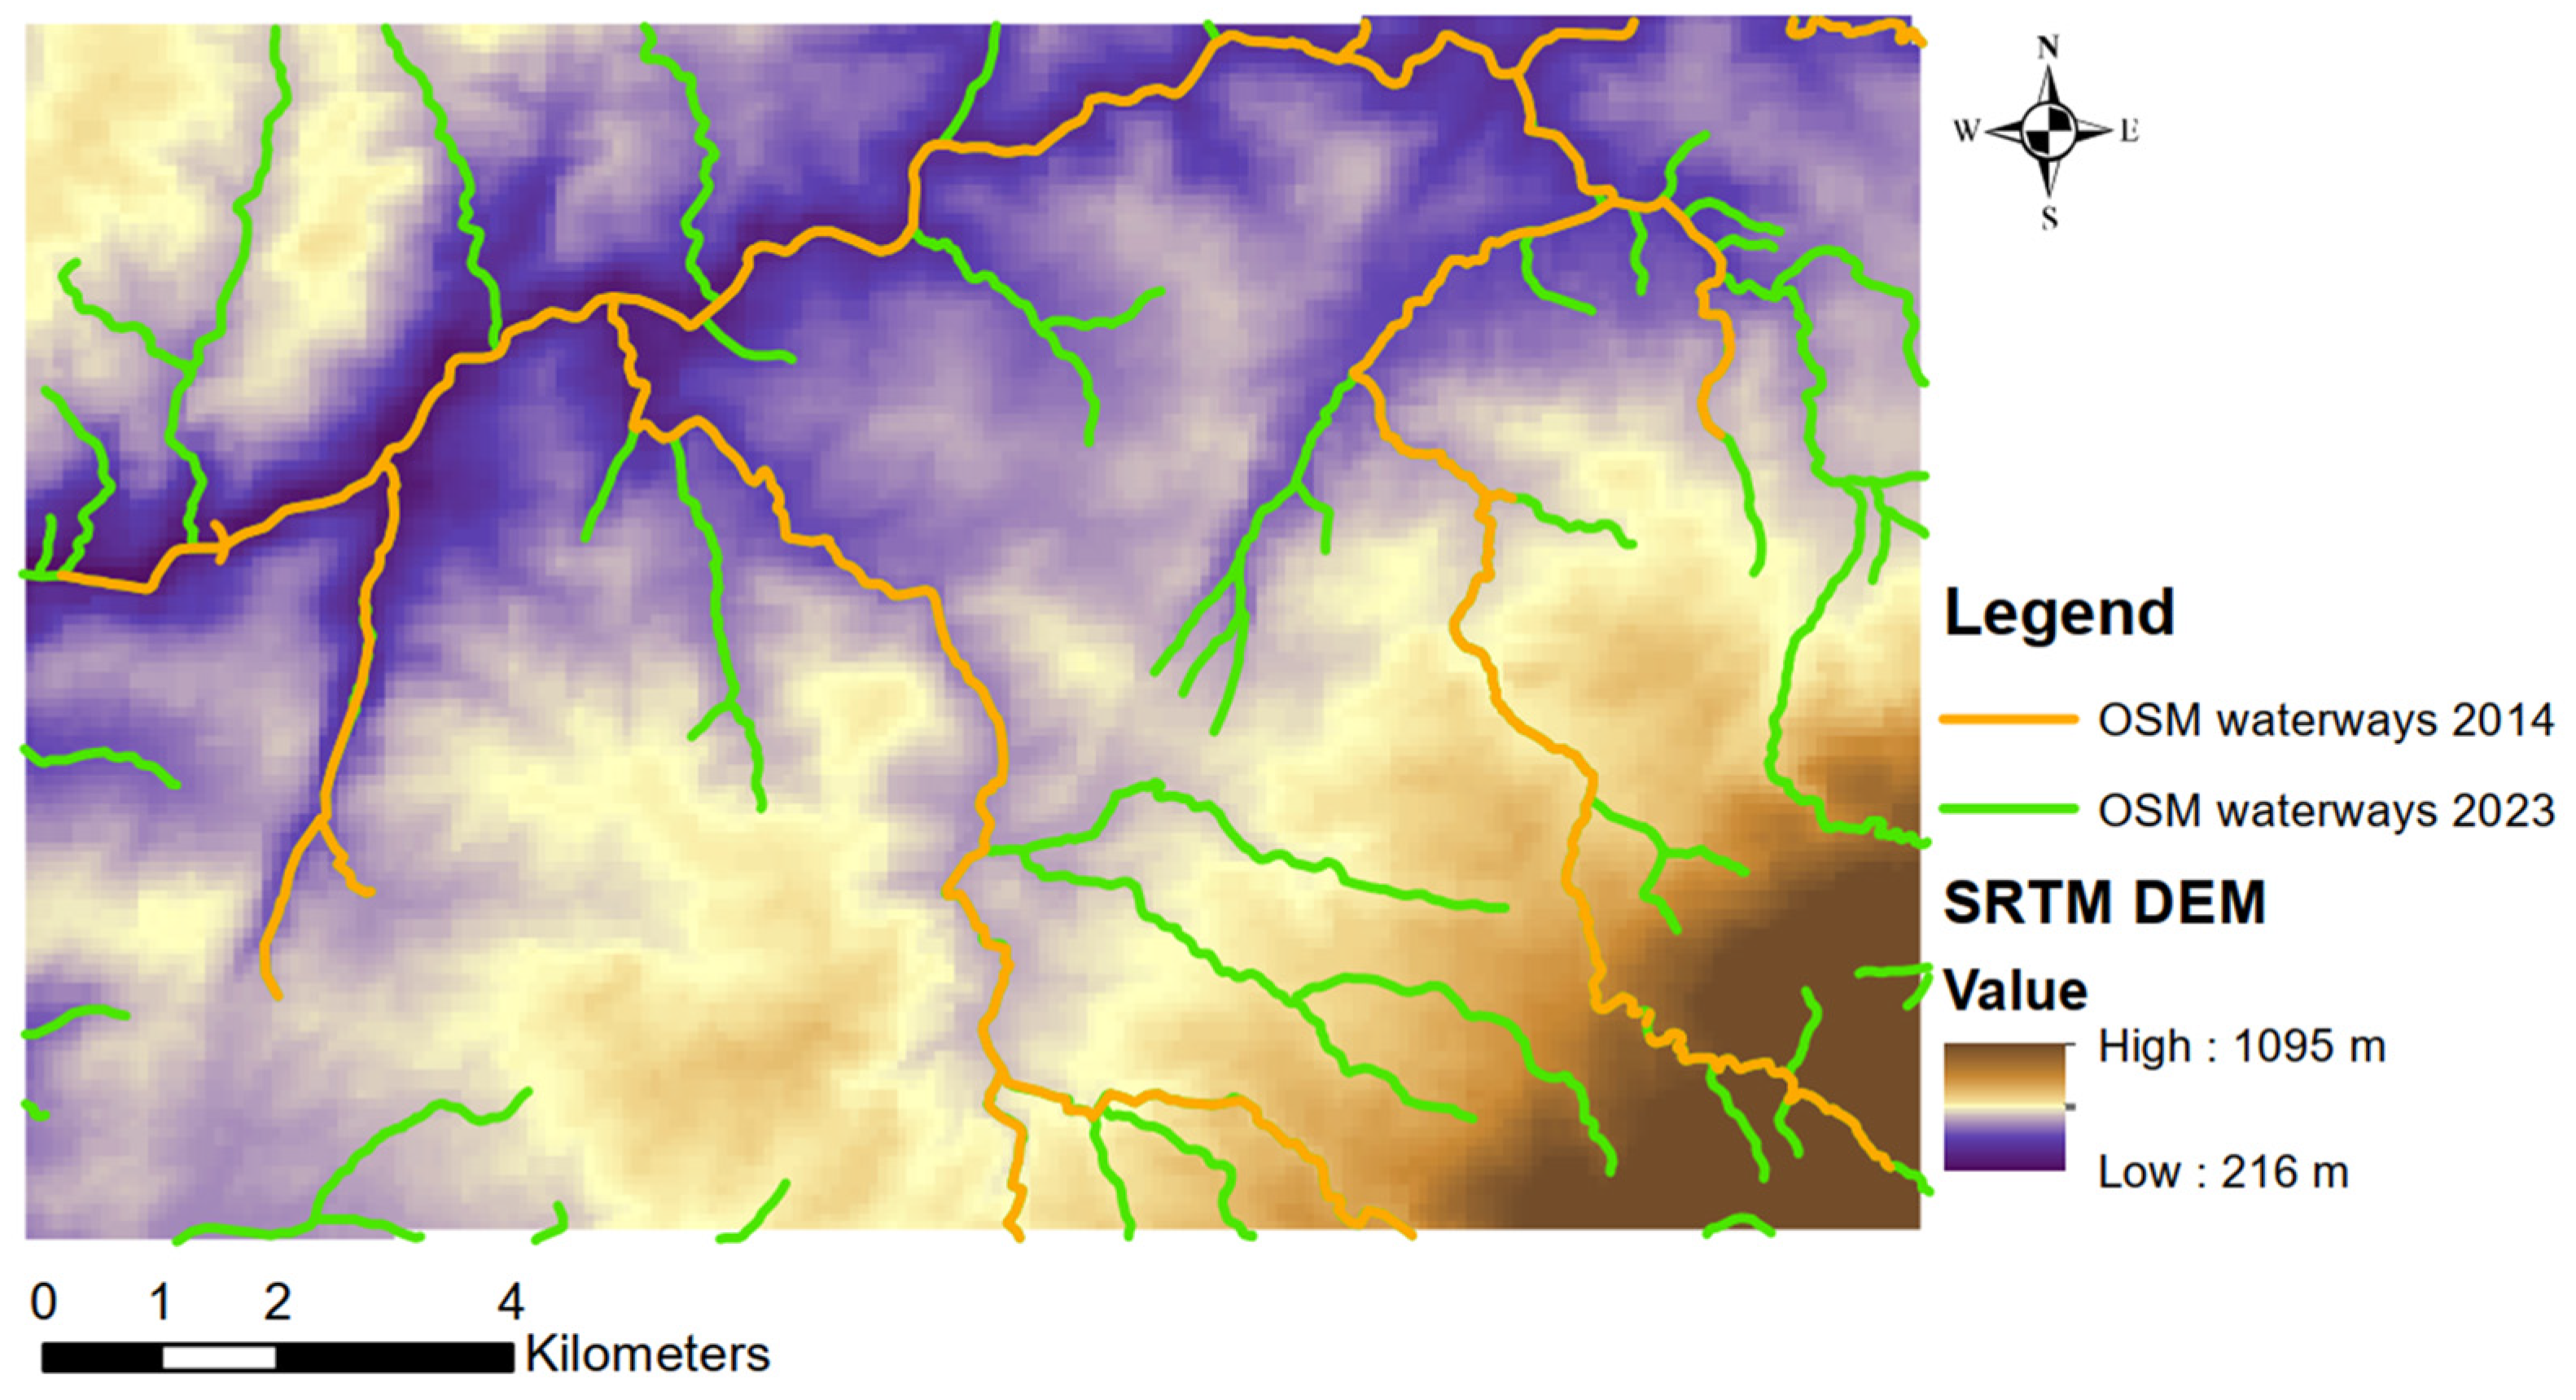
- Elevation
- (ii)
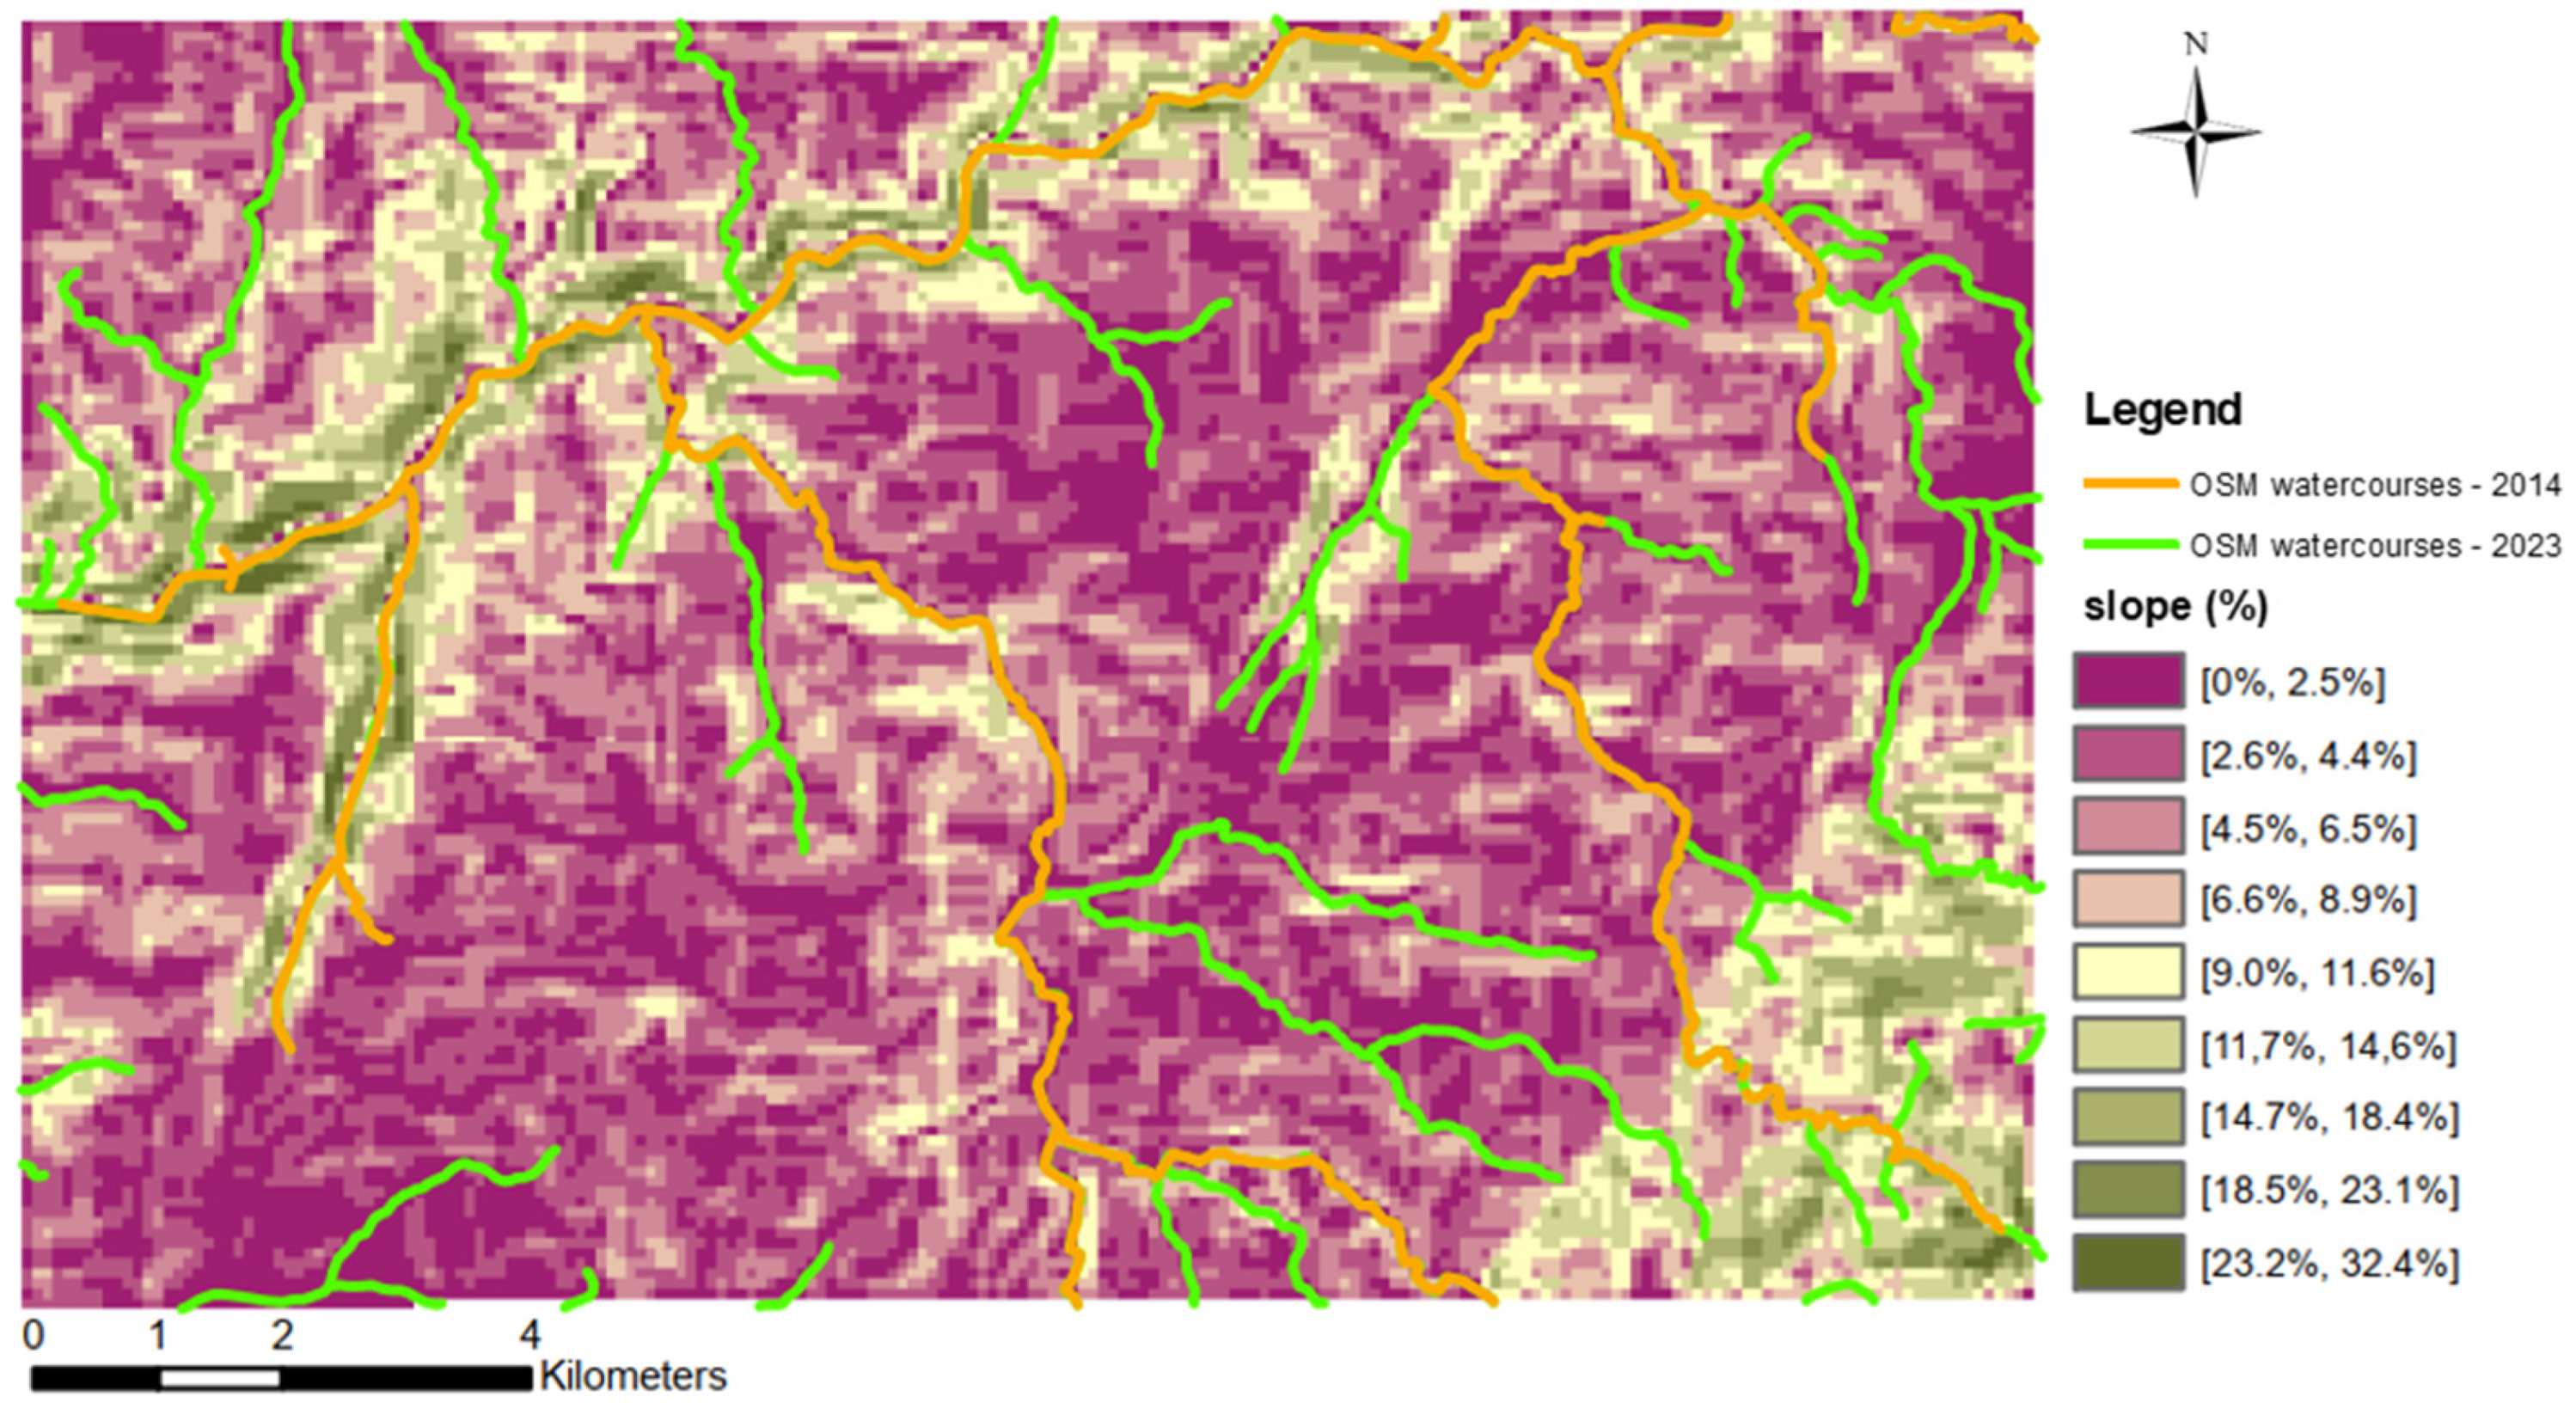
- Slope
- (iii)
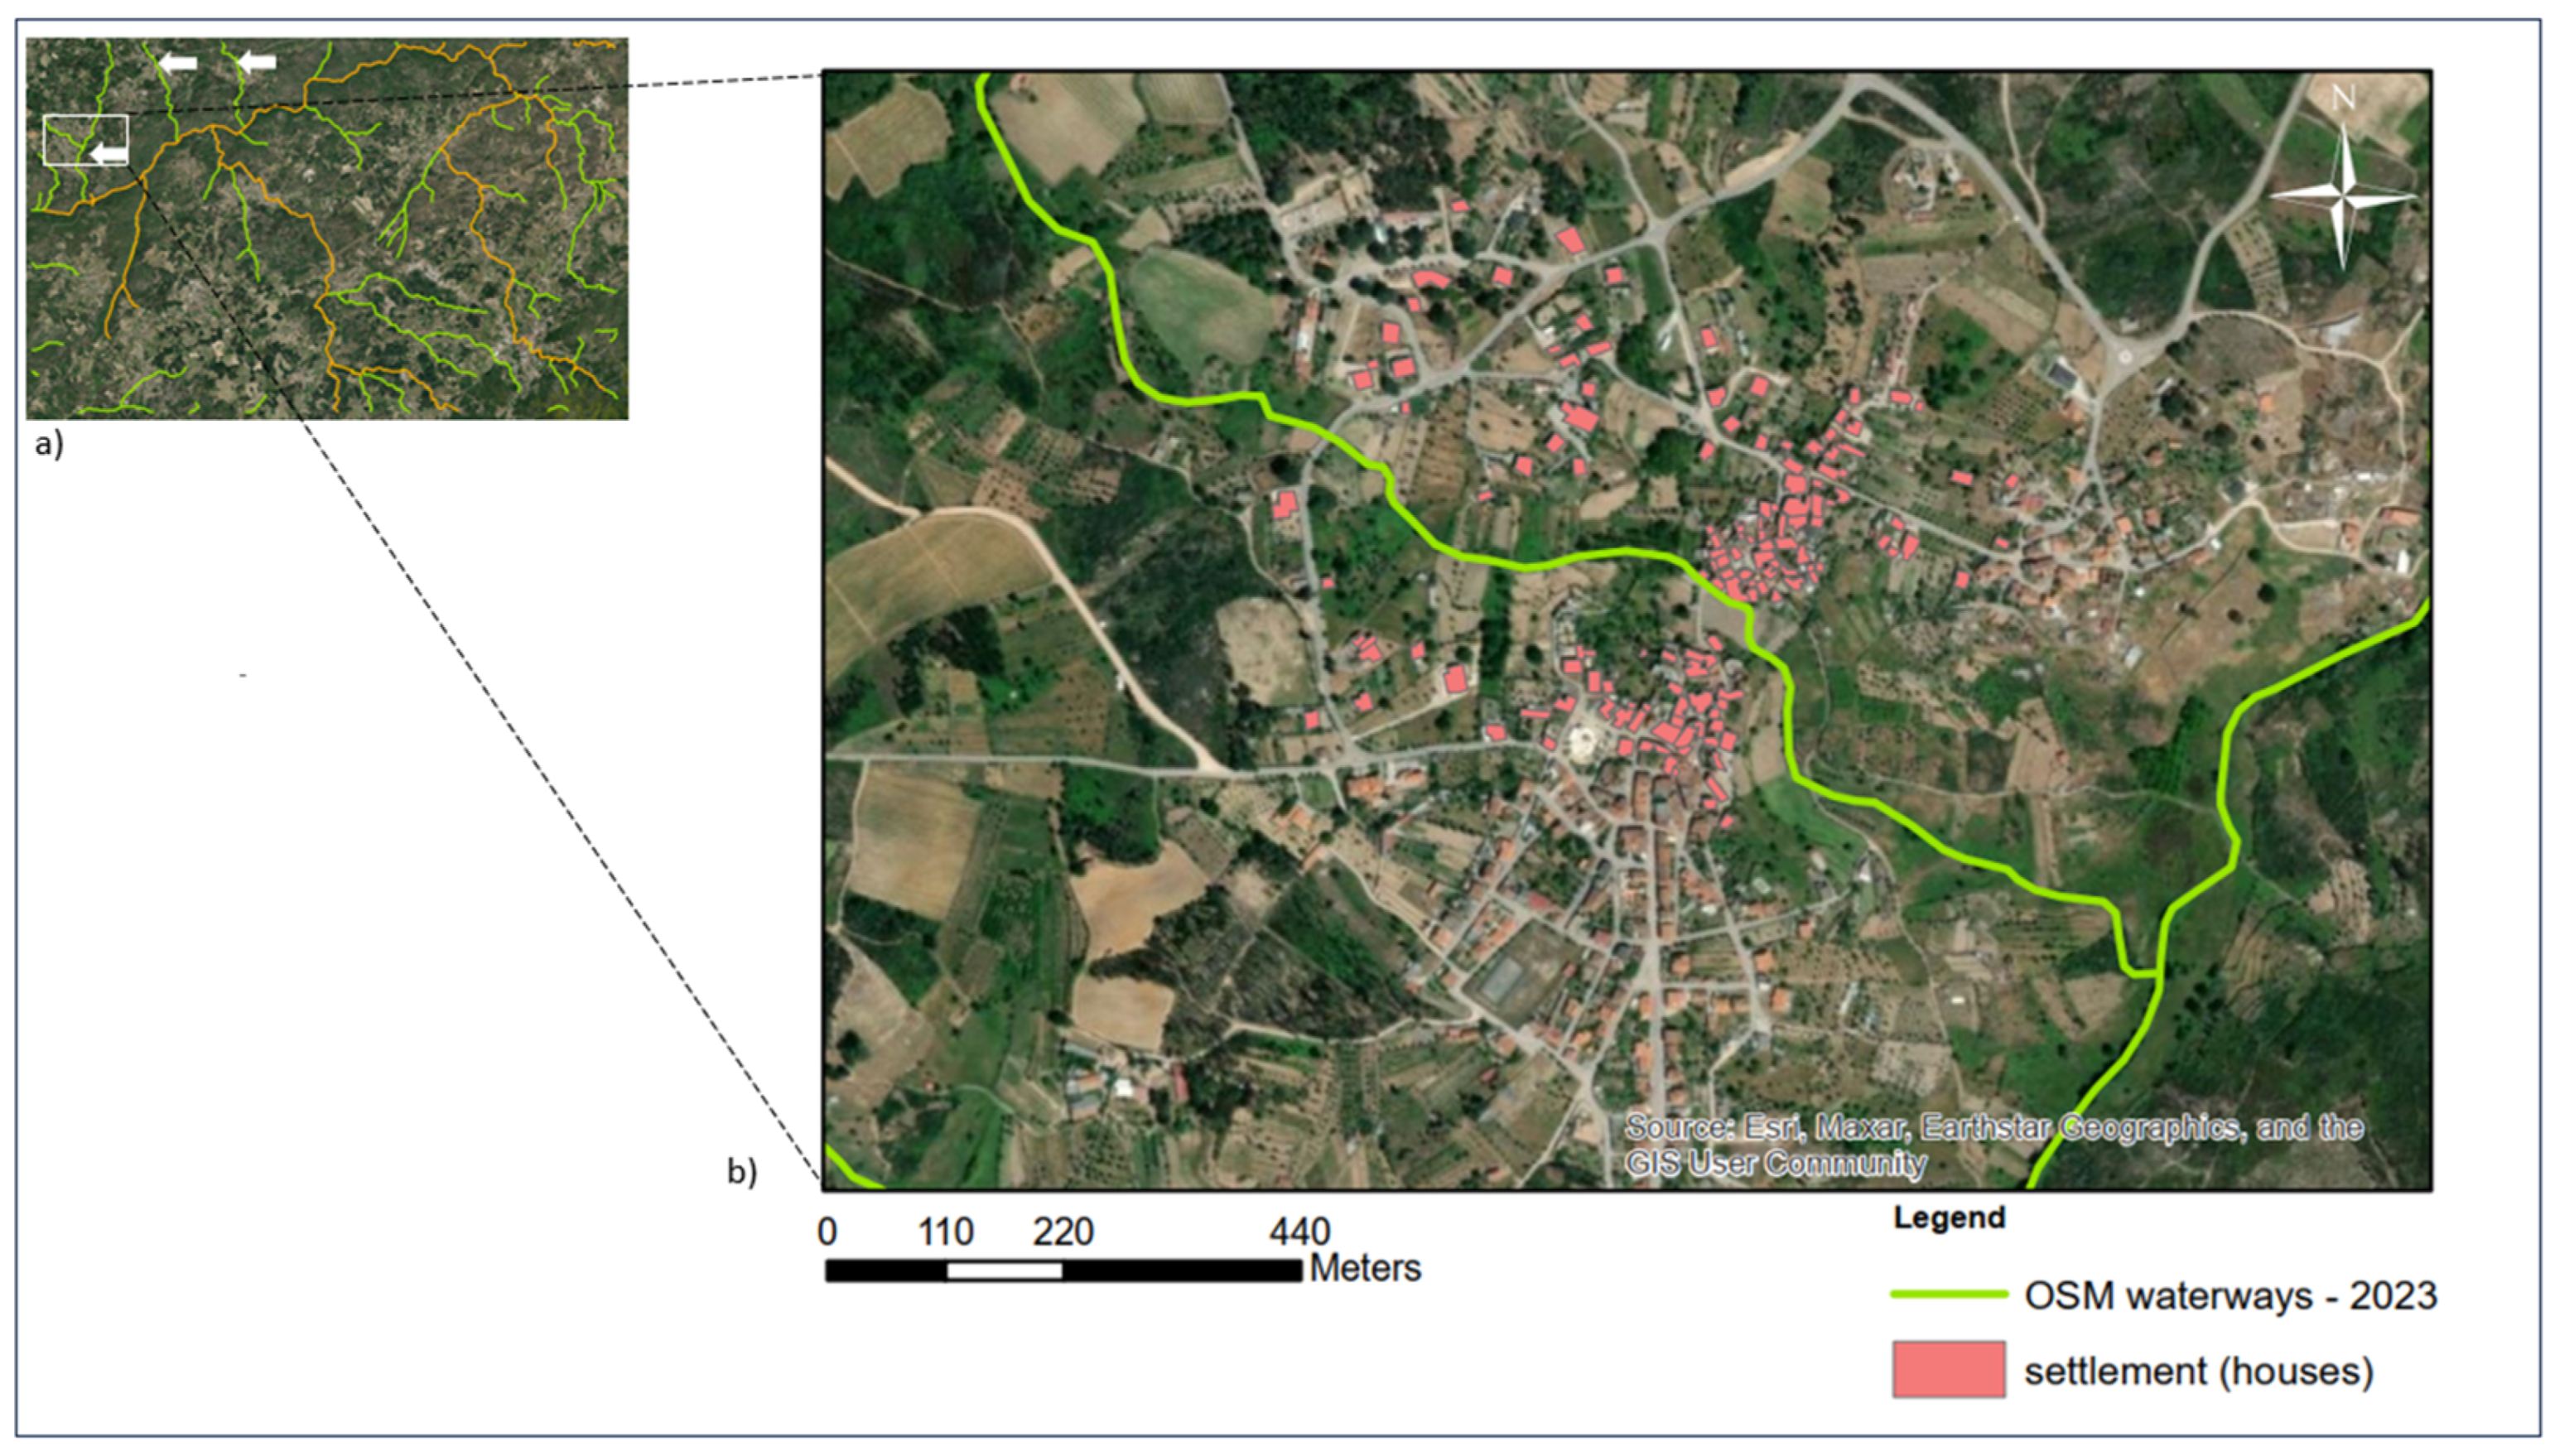
- Settlements
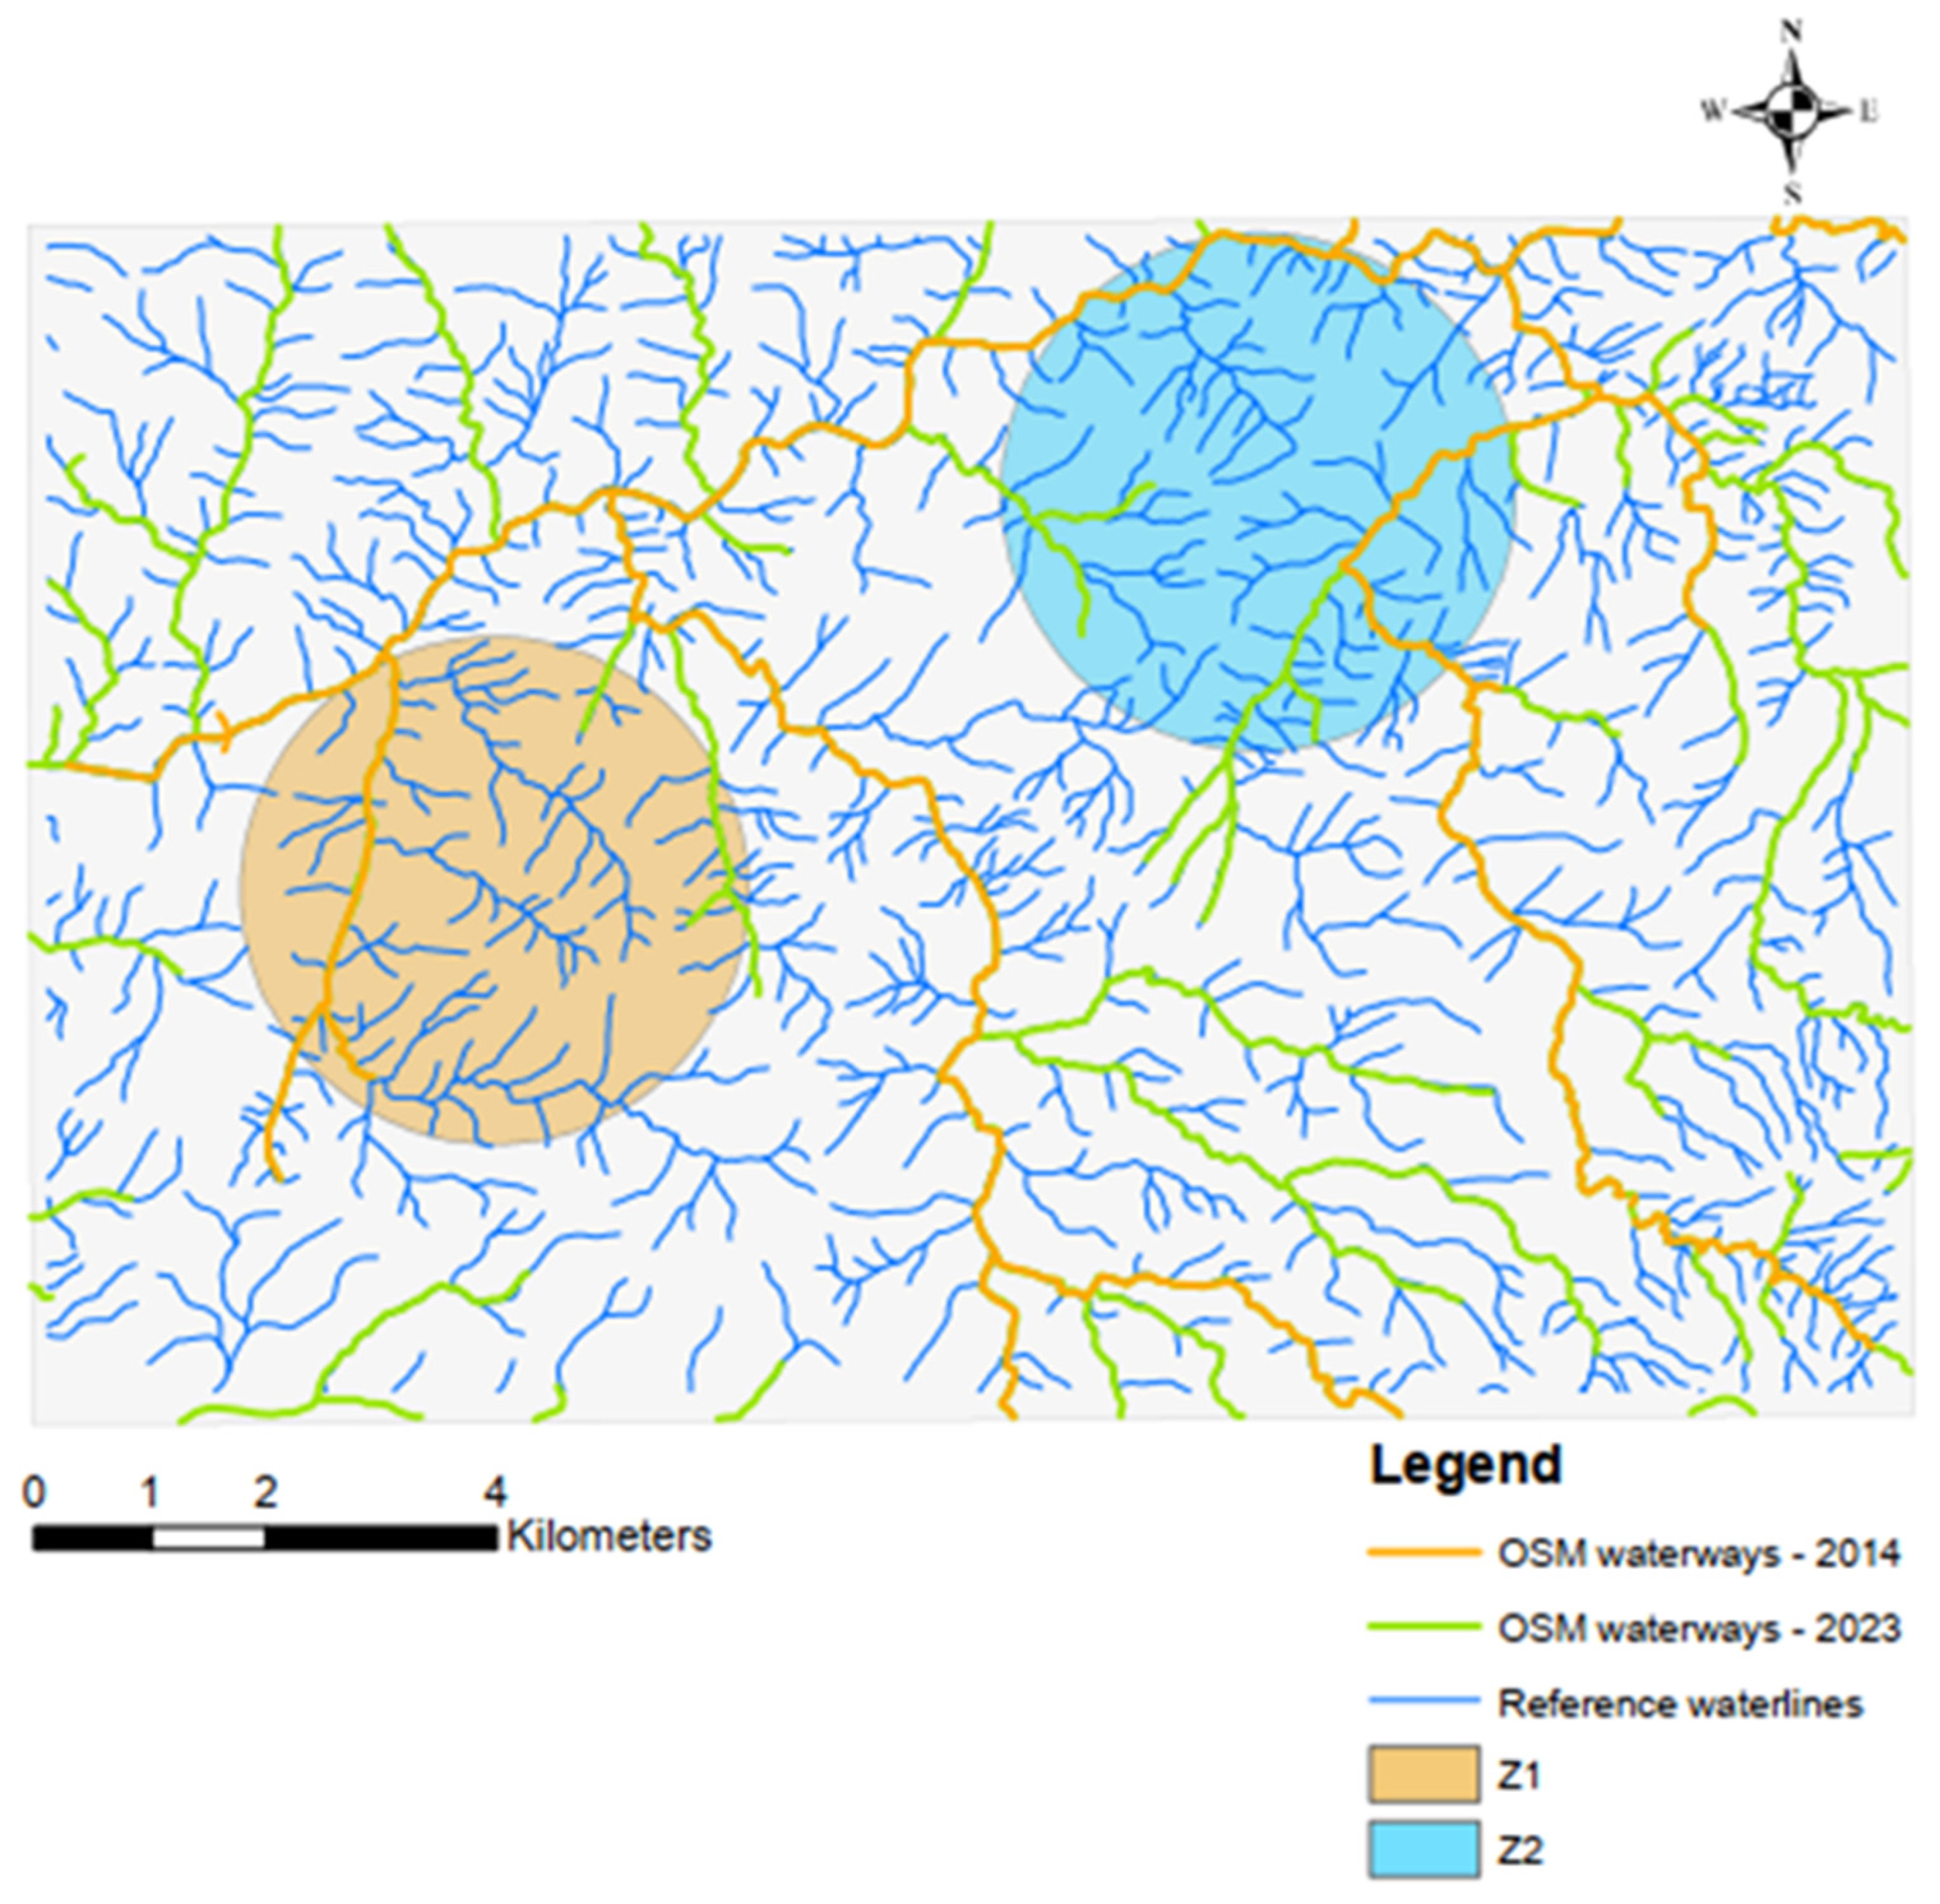
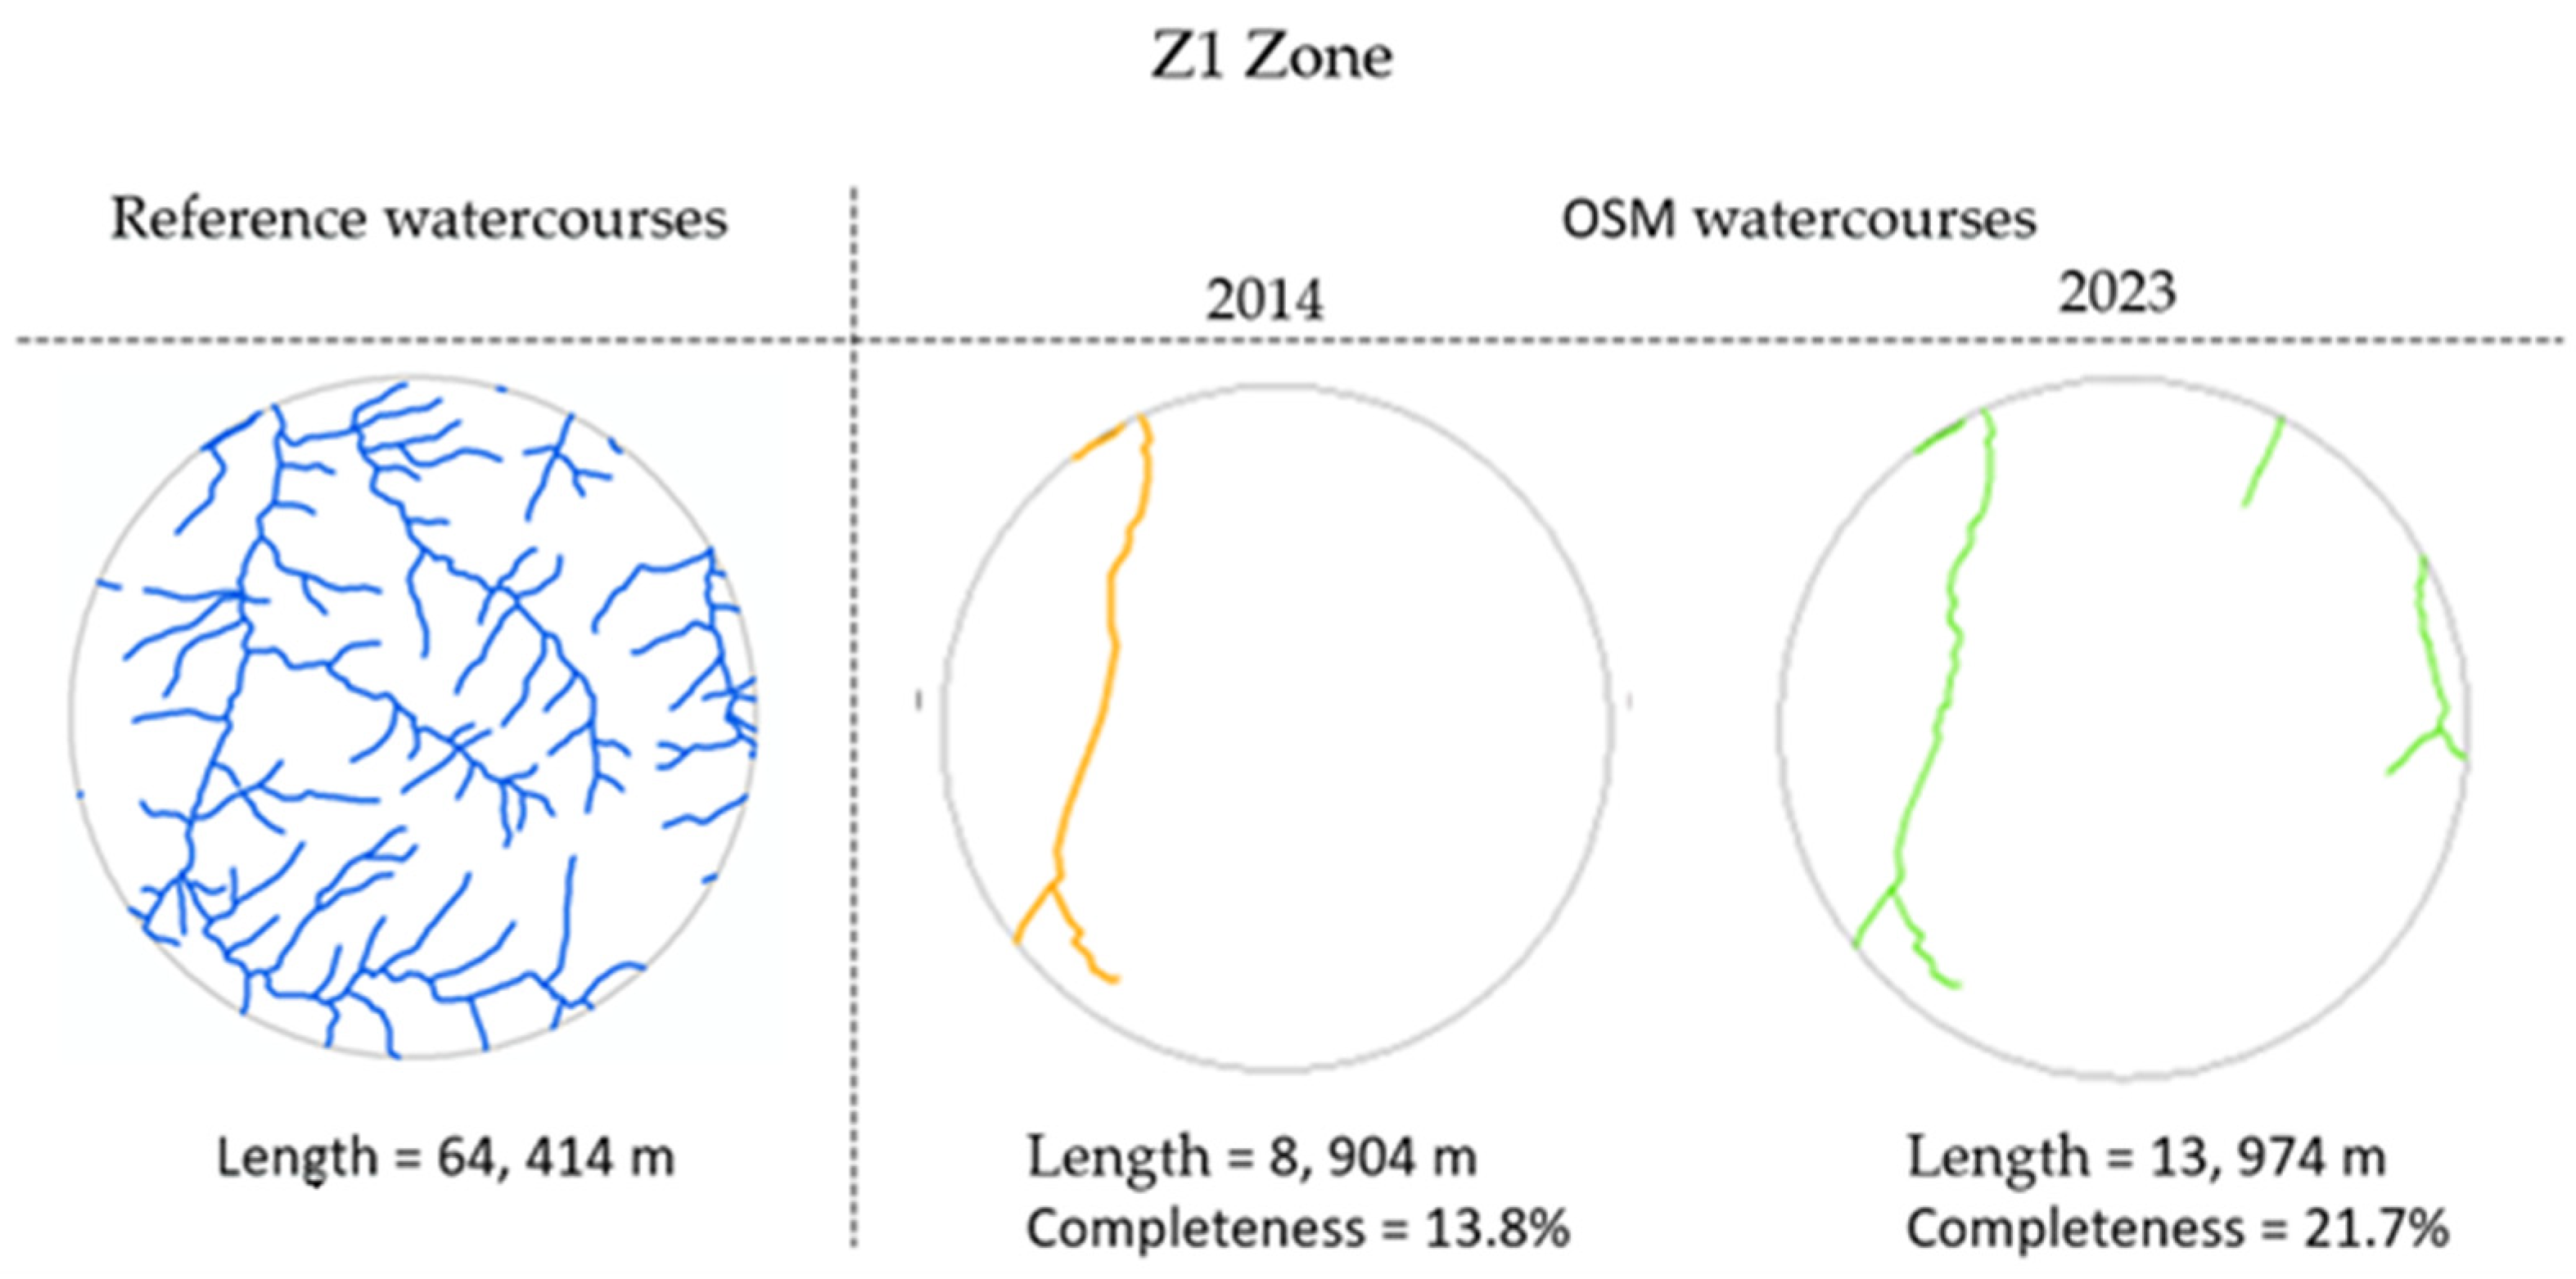
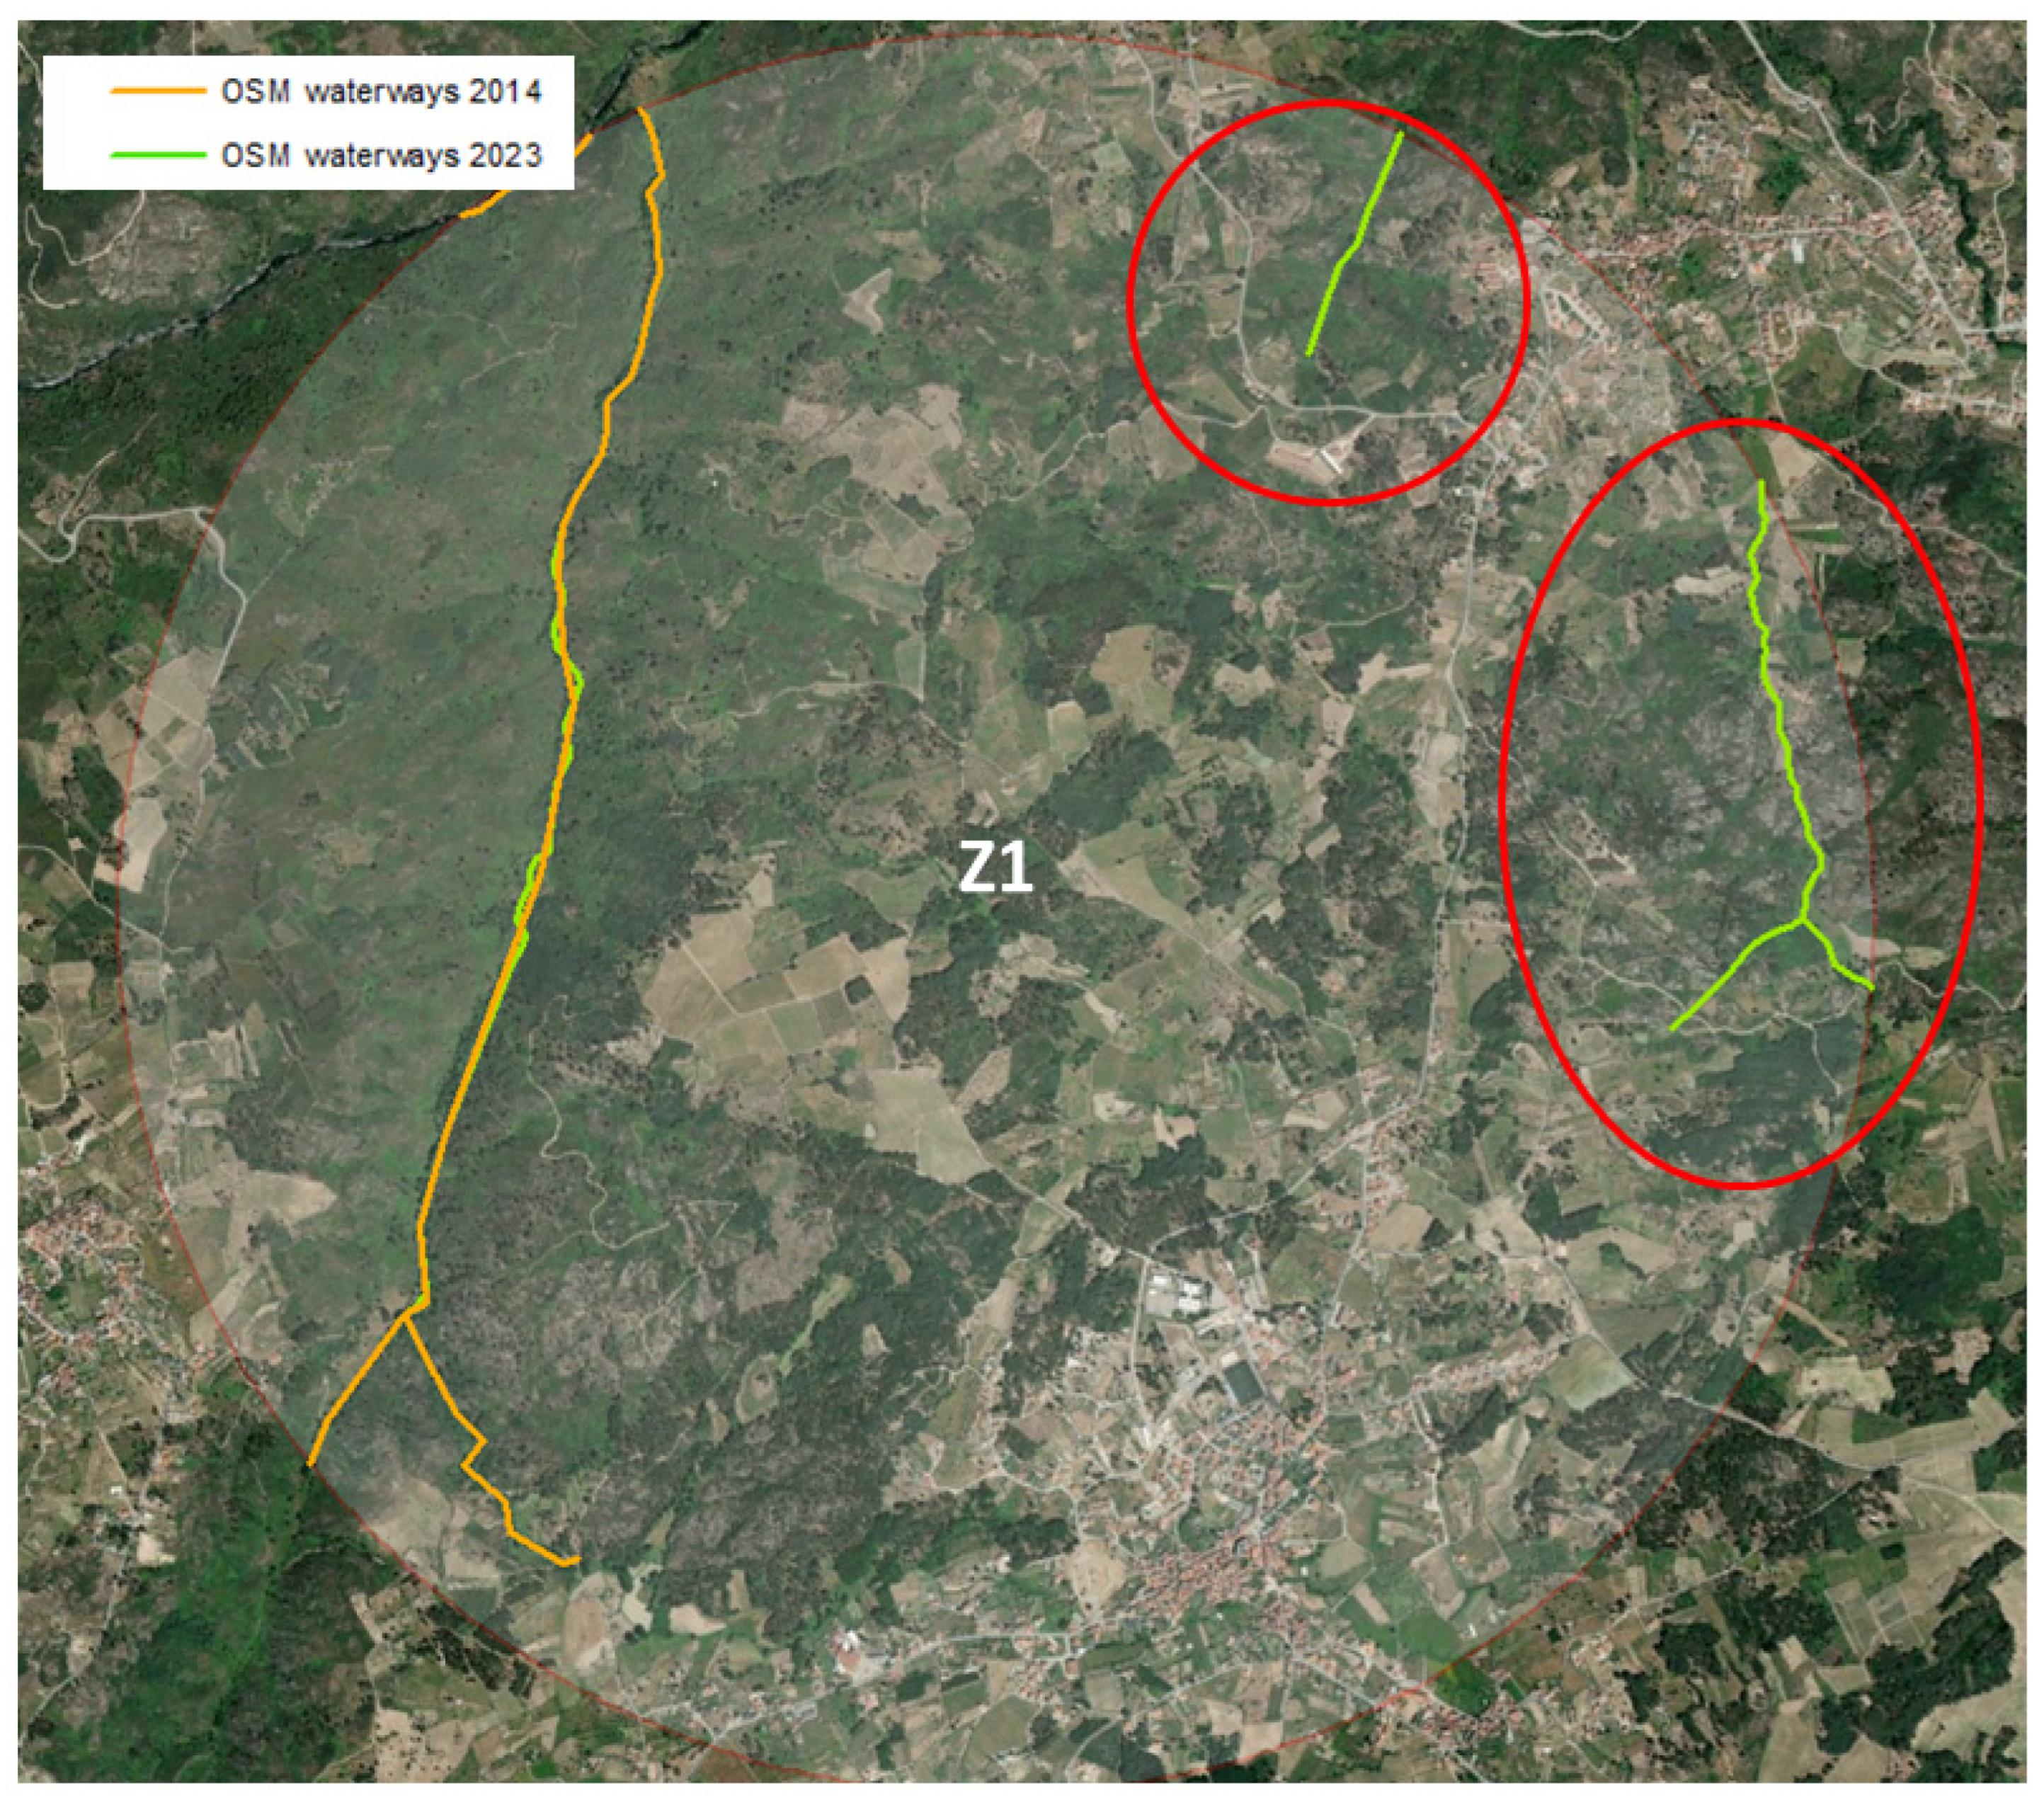
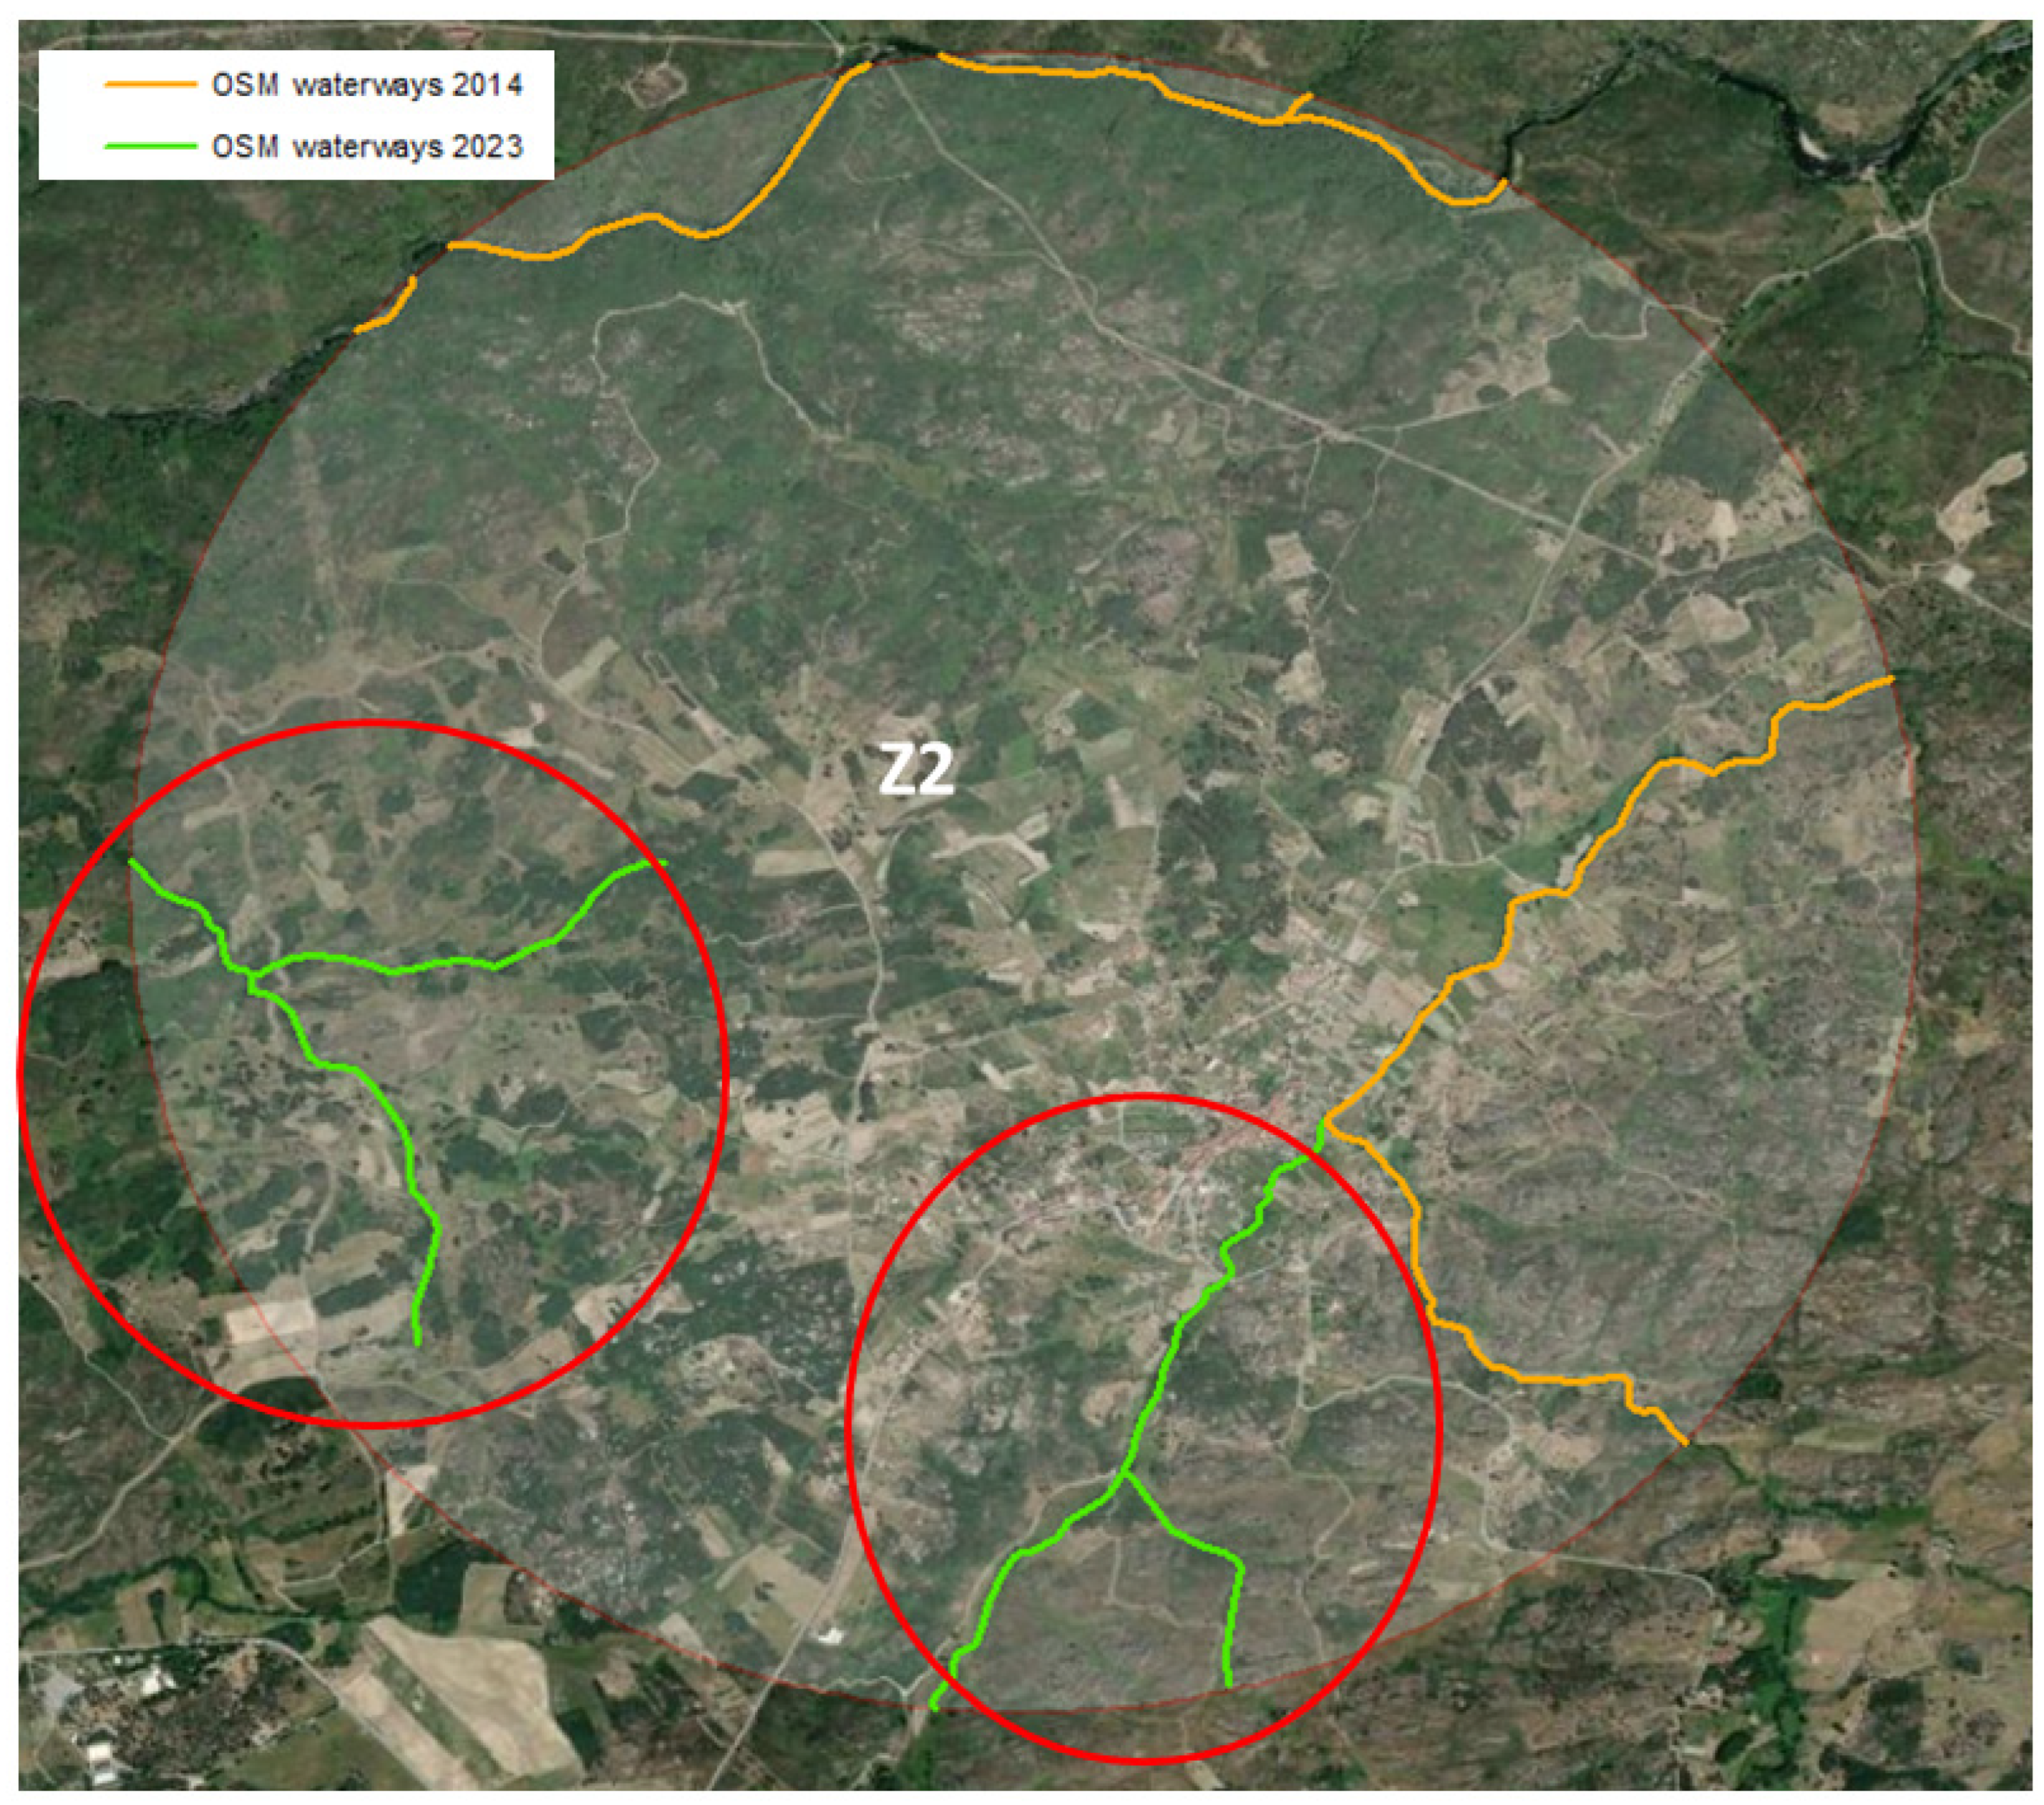
3.2. Z1 and Z2 Zones
4. Conclusions
Author Contributions
Funding
Data Availability Statement
Acknowledgments
Conflicts of Interest
References
- Bao, L.; Lv, X.; Yao, J. Water Extraction in SAR Images Using Features Analysis and Dual-Threshold Graph Cut Model. Remote Sens. 2021, 13, 3465. [Google Scholar] [CrossRef]
- Jiang, H.; Feng, M.; Zhu, Y.; Lu, N.; Huang, J.; Xiao, T. An Automated Method for Extracting Rivers and Lakes from Landsat Imagery. Remote Sens. 2014, 6, 5067–5089. Available online: www.mdpi.com/journal/remotesensing (accessed on 29 May 2024). [CrossRef]
- Al-Bakri, M.; Fairbairn, D. Assessing the accuracy of ‘Crowdsourced’ data and its integration with official spatial datasets. In Proceedings of the Accuracy 2010 Symposium, Leicester, UK, 20–23 July 2010; pp. 317–320. [Google Scholar]
- Biljecki, F.; Chow, Y.S.; Lee, K. Quality of crowdsourced geospatial building information: A global assessment of OpenStreetMap attributes. Build. Environ. 2023, 237, 110295. [Google Scholar] [CrossRef]
- Girres, J.F.; Touya, G. Quality assessment of the french OpenStreetMap dataset. Trans. GIS 2010, 14, 435–459. [Google Scholar] [CrossRef]
- ISO 19157; Geographic Information–Data Quality. ISO: Geneva, Switzerland, 2013; 146p.
- Barrington-Leigh, C.; Millard-Ball, A. The world’s user-generated road map is more than 80% complete. PLoS ONE 2017, 12, e0180698. [Google Scholar] [CrossRef] [PubMed]
- Goodchild, M.F. Geographic Information Systems and Science: Today and tomorrow. Ann. GIS–Taylor Fr. 2009, 15, 3–9. [Google Scholar] [CrossRef]
- Chen, Y.; Wei, Z. Assessing completeness of global airport data in OSM. Advances in Cartography and GIScience of the International Cartographic Association. In Proceedings of the 31st International Cartographic Conference (ICC 2023), Cape Town, South Africa, 13–18 August 2023. [Google Scholar]
- Hecht, R.; Kunze, C.; Hahmann, S. Measuring Completeness of Building Footprints in OpenStreetMap over Space and Time. ISPRS Int. J. Geo-Inf. 2013, 2, 1066–1091. [Google Scholar] [CrossRef]
- Brovelli, M.A.; Zamboni, G.A. New Method for the Assessment of Spatial Accuracy and Completeness of OpenStreetMap Building Footprints. ISPRS Int. J. Geo-Inf. 2018, 7, 289. [Google Scholar] [CrossRef]
- Ullah, T.; Lautenbach, S.; Herfort, B.; Reinmuth, M.; Schorlemmer, D. Assessing Completeness of OpenStreetMap Building Footprints Using MapSwipe. Int. J. Geoinf. 2023, 12, 143. [Google Scholar] [CrossRef]
- Herfort, B.; Lautenbach, A.; Albuquerque, J.P.; Anderson, J.; Zipf, A. A spatio-temporal analysis investigating completeness and inequalities of global urban building data in OpenStreetMap. Nat. Commun. 2023, 14, 3985. [Google Scholar] [CrossRef]
- Yeboah, G.; Porto de Albuquerque, J.; Troilo, R.; Tregonning, G.; Perera, S.; Ahmed, S.A.K.S.; Ajisola, M.; Alam, O.; Aujla, N.; Azam, S.I.; et al. Analysis of OpenStreetMap Data Quality at Different Stages of a Participatory Mapping Process: Evidence from Slums in Africa and Asia. ISPRS Int. J. Geo-Inf. 2021, 10, 265. [Google Scholar] [CrossRef]
- Neis, P.; Zielstra, D.; Zipf, A. The Street Network Evolution of Crowdsourced Maps: OpenStreetMap in Germany 2007–2011. Future Internet 2012, 4, 1–21. [Google Scholar] [CrossRef]
- Jackson, S.P.; Mullen, W.; Agouris, P.; Crooks, A.; Croitoru, A.; Stefanidis, A. Assessing Completeness and Spatial Error of Features in Volunteered Geographic Information. ISPRS–Int. J. Geo-Inf. 2013, 2, 507–530. [Google Scholar] [CrossRef]
- Brückner, J.; Schott, M.; Zipf, A.; Lautenbach, S. Assessing shop completeness in OpenStreetMap for two federal states in Germany. AGILE GIScience Ser. 2021, 2, 20. [Google Scholar] [CrossRef]
- Wang, S.; Zhou, Q.; Tian, Y. Understanding Completeness and DiversityPatterns of OSM-Based Land-Use and Land Cover Dataset in China. ISPRS–Int. J. Geo-Inf. 2020, 9, 531. [Google Scholar] [CrossRef]
- Barron, C.; Neis, P.; Zipf¸, A. A Comprehensive Framework for Intrinsic OpenStreetMap Quality Analysis. Trans. GIS 2014, 6, 877–895. [Google Scholar] [CrossRef]
- Sampaio, T.V.M.; Rocha, J. On the Quality of the drainage network cartographic representation. Ecol. Indic. 2022, 143, 109350. [Google Scholar] [CrossRef]
- Afonso, A.; Lopes, J.; Dias, R. Controlo de Qualidade Posicional da Cartografia Militar do IGeoE em ETRS89. Report of IGeoE 2010, 5p. Available online: http://www.igeoe.pt/downloads/file2_pt.pdf (accessed on 30 May 2024).
- Herfort, B.; Lautenbach, S.; Porto de Albuquerque, J.; Anderson, J.; Zipf, A. The evolution of humanitarian mapping within the OpenStreetMap community. Sci. Rep. 2021, 11, 3037. [Google Scholar] [CrossRef]
- Herfort, B.; Lautenbach, S.; de Albuquerque, J.P.; Anderson, J.; Zipf, A. Investigating the digital divide in OpenStreetMap: Spatio-temporal analysis of inequalities in global urban building completeness. Res. Sq. 2022; preprint. [Google Scholar] [CrossRef]
- Quattrone, G.; Mashhadi, A.; Capra, L. Mind the map: The impact of culture and economic affluence on crowd-mapping behaviours. In Proceedings of the 17th ACM Conference on Computer Supported Cooperative Work & Social Computing-CSCW ‘14, Baltimore, MD, USA, 15–19 February 2014; ACM Press: Baltimore, MD, USA, 2014; pp. 934–944. [Google Scholar]
- Zhou, Q.; Zhang, Y.; Chang, K.; Brovelli, M.A. Assessing OSM building completeness for almost 13,000 cities globally. Int. J. Digit. Earth 2022, 15, 2400–2421. [Google Scholar] [CrossRef]
- Borkowska, S.; Bielecka, E.; Pokonieczny, K. OpenStreetMap–building data completeness visualization in terms of “Fitness for purpose”. Adv. Geod. Geoinf. 2023, 72, 2023. [Google Scholar] [CrossRef]
- Zhang, Y.; Zhou, Q.; Brovelli, M.A.; Li, W. Assessing OSM Building Completeness Using Population Data. Int. J. Geogr. Inf. Sci. 2022, 36, 1443–1466. [Google Scholar] [CrossRef]


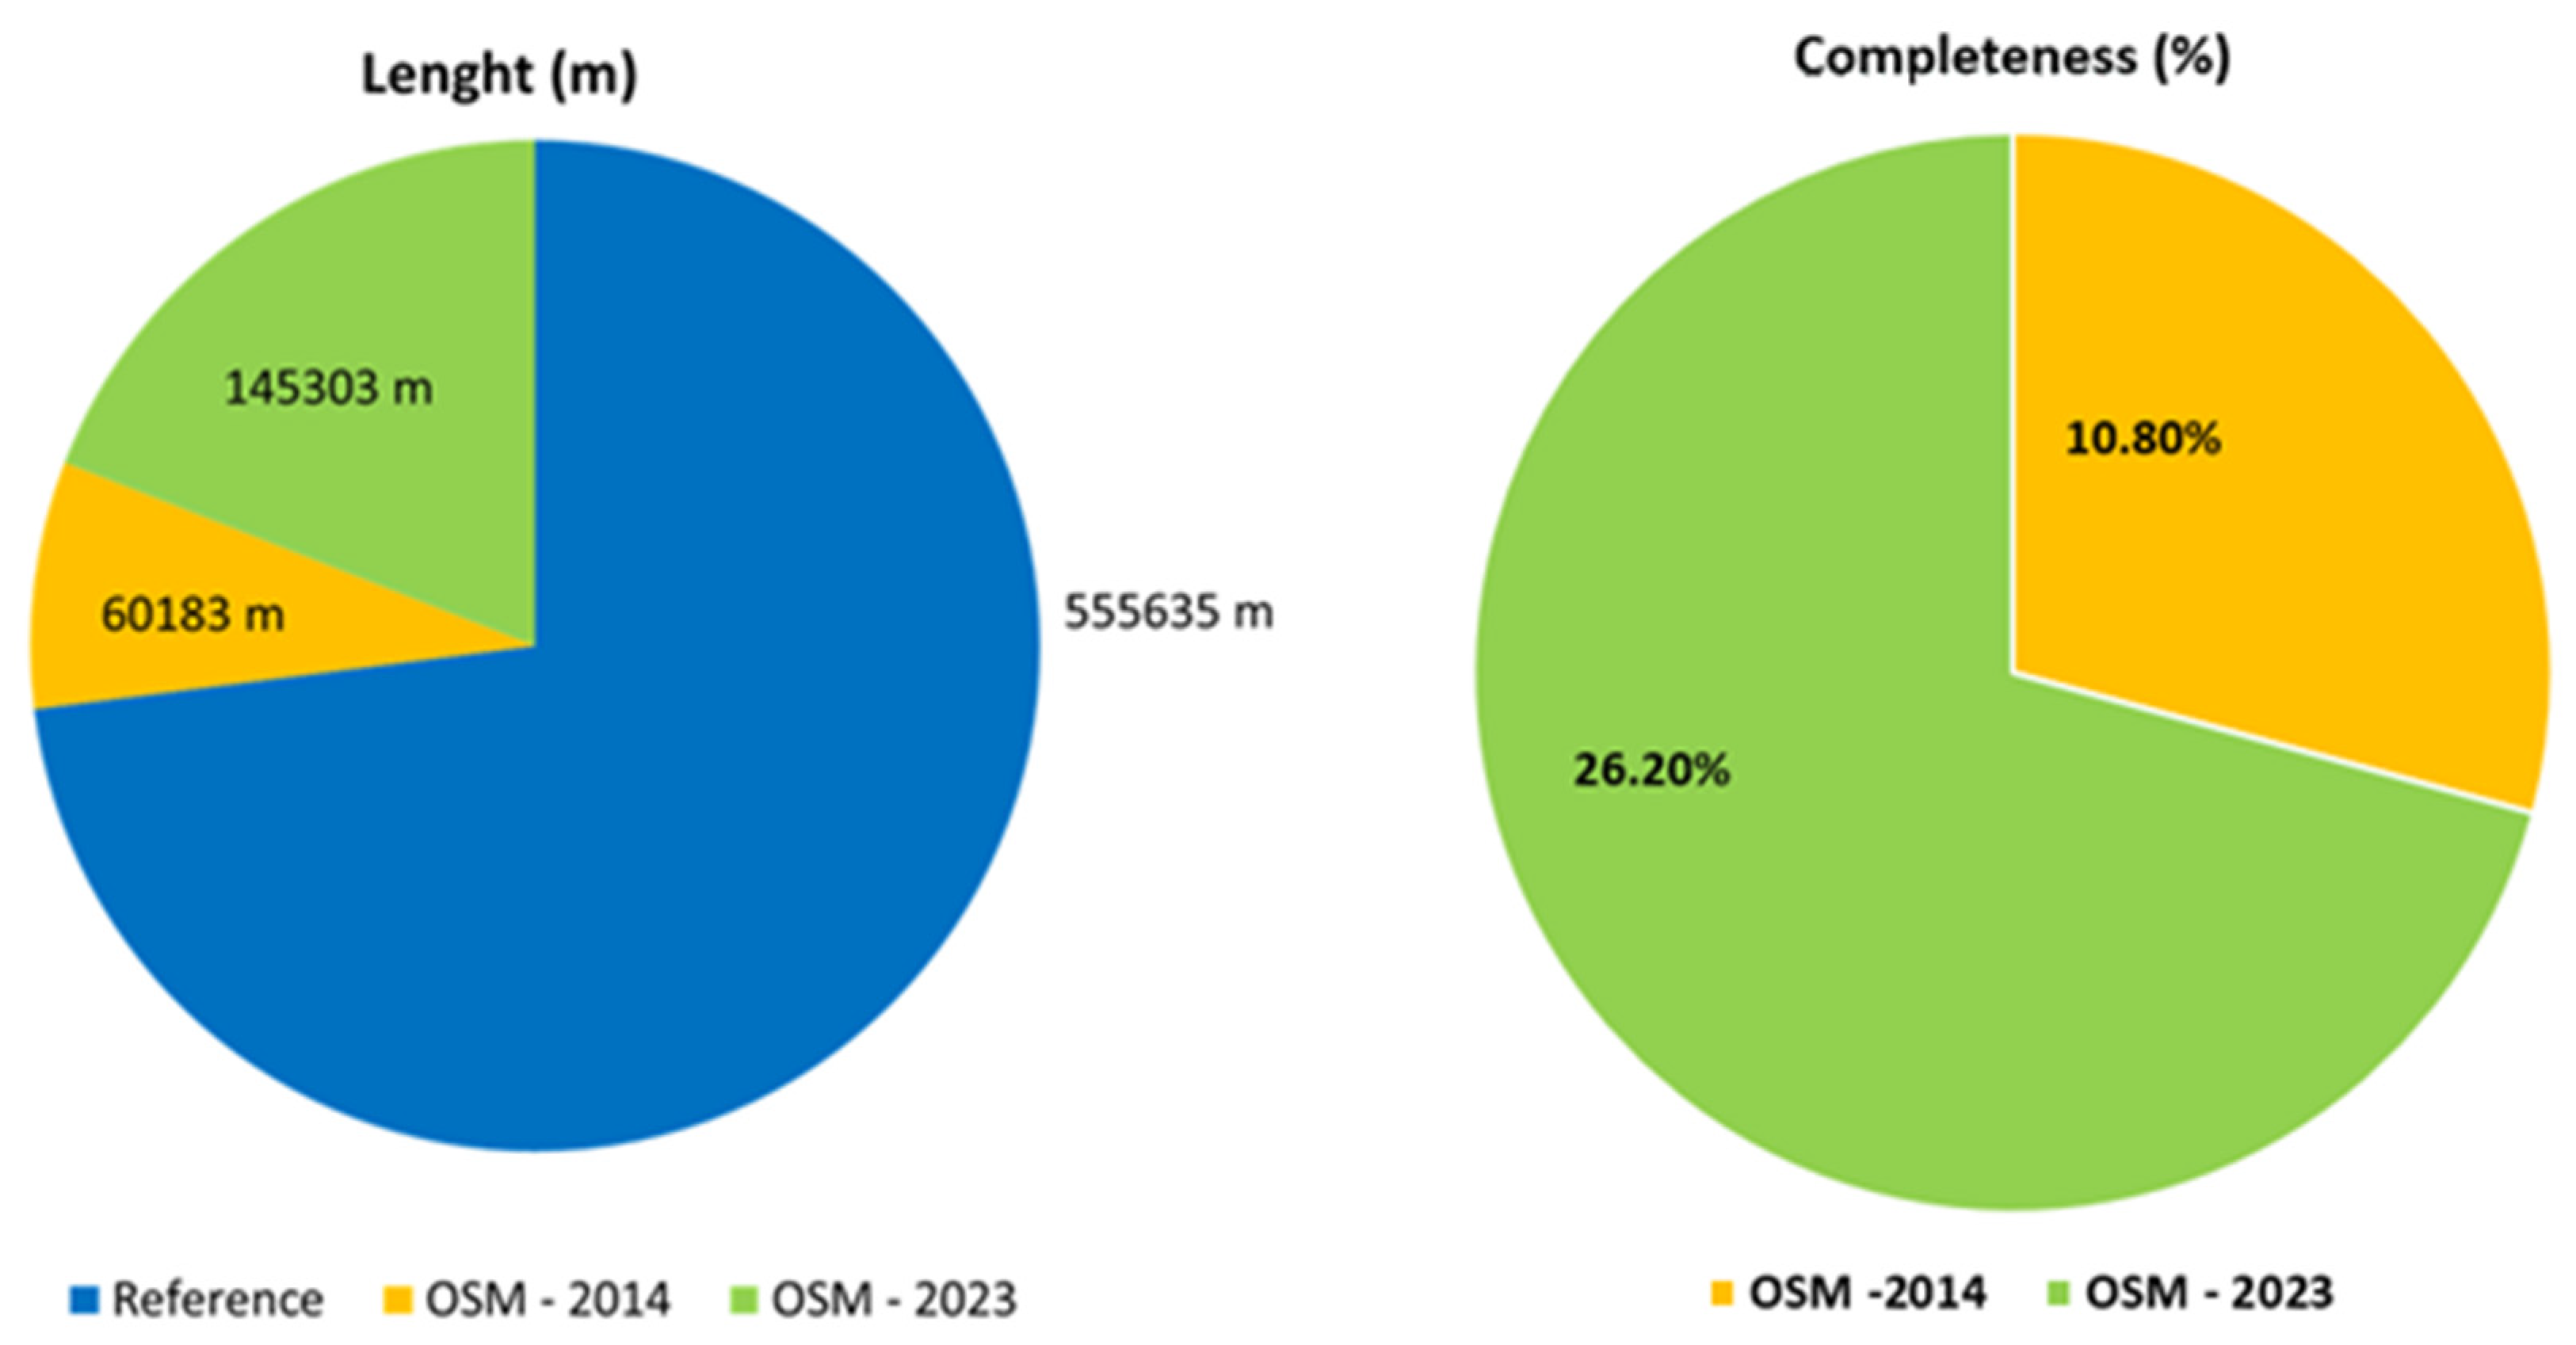
| Watercourses | Total Length (m) | Completeness (%) | Number. of Rivers | Number of Streams |
|---|---|---|---|---|
| Reference | 555,635 | |||
| OSM-2014 | 60,183 | 10.8 | 7 | 8 |
| OSM-2023 | 145,303 | 26.2 | 9 | 72 |
| Watercourses | Total Length (m) | Completeness (%) | Number of Rivers | Number of Streams |
|---|---|---|---|---|
| Reference | 64,414 | |||
| OSM-2014 | 8,904 | 13.8 | 1 | 2 |
| OSM-2023 | 13,974 | 21.7 | 1 | 5 |
| Watercourses | Total Length (m) | Completeness (%) | Number of Rivers | Number of Streams |
|---|---|---|---|---|
| Reference | 69,784 | |||
| OSM-2014 | 12,527 | 18.0 | 1 | 2 |
| OSM-2023 | 22,037 | 31.6 | 3 | 6 |
Disclaimer/Publisher’s Note: The statements, opinions and data contained in all publications are solely those of the individual author(s) and contributor(s) and not of MDPI and/or the editor(s). MDPI and/or the editor(s) disclaim responsibility for any injury to people or property resulting from any ideas, methods, instructions or products referred to in the content. |
© 2024 by the authors. Licensee MDPI, Basel, Switzerland. This article is an open access article distributed under the terms and conditions of the Creative Commons Attribution (CC BY) license (https://creativecommons.org/licenses/by/4.0/).
Share and Cite
Monteiro, E.S.V.; Patrício, G.R. Analysing Temporal Evolution of OpenStreetMap Waterways Completeness in a Mountain Region of Portugal. Remote Sens. 2024, 16, 3159. https://doi.org/10.3390/rs16173159
Monteiro ESV, Patrício GR. Analysing Temporal Evolution of OpenStreetMap Waterways Completeness in a Mountain Region of Portugal. Remote Sensing. 2024; 16(17):3159. https://doi.org/10.3390/rs16173159
Chicago/Turabian StyleMonteiro, Elisabete S. Veiga, and Glória Rodrigues Patrício. 2024. "Analysing Temporal Evolution of OpenStreetMap Waterways Completeness in a Mountain Region of Portugal" Remote Sensing 16, no. 17: 3159. https://doi.org/10.3390/rs16173159