Article

The Influences of Indian Monsoon Phases on Aerosol Distribution and Composition over India

by
Pathan Imran Khan
1,
Devanaboyina Venkata Ratnam
1,*,
Perumal Prasad
2,
Shaik Darga Saheb
3,
Jonathan H. Jiang
4,
Ghouse Basha
5,
Pangaluru Kishore
6 and
Chanabasanagouda S. Patil
3
1
Department of Electronics and Communications Engineering, Koneru Lakshmaiah Education Foundation, Guntur 522502, India
2
Indian Institute of Tropical Meteorology (IITM), Ministry of Earth Sciences (MoES), Pune 411008, India
3
India Meteorological Department, Bengaluru 560001, India
4
Jet Propulsion Laboratory, California Institute of Technology, Pasadena, CA 91109, USA
5
National Atmospheric Research Laboratory, Department of Space, Gadanki 517112, India
6
Regato, Rancho Santa Margarita, CA 92688, USA
*
Author to whom correspondence should be addressed.
Remote Sens. 2024, 16(17), 3171; https://doi.org/10.3390/rs16173171
Submission received: 10 July 2024 / Revised: 9 August 2024 / Accepted: 11 August 2024 / Published: 27 August 2024

Abstract

:
This study investigates the impacts of summer monsoon activity on aerosols over the Indian region. We analyze the variability of aerosols during active and break monsoon phases, as well as strong and weak monsoon years, using data from the Moderate Resolution Imaging Spectroradiometer (MODIS) and Cloud–Aerosol Lidar and Infrared Pathfinder Satellite Observations (CALIPSO). Our findings show a clear distinction in aerosol distribution between active and break phases. During active phases, the Aerosol Optical Depth (AOD) and aerosol extinction are lower across the Indian region, while break phases are associated with higher AOD and extinction. Furthermore, we observed a significant increase in AOD over Central India during strong monsoon years, compared to weak monsoon years. Utilizing the vertical feature mask (VFM) data from CALIPSO, we identified polluted dust and dusty marine aerosols as the dominant types during both active/break phases and strong/weak monsoon years. Notably, the contributions of these pollutants are significantly higher during break phases compared to during active phases. Our analysis also reveals a shift in the origin of these aerosol masses. During active phases, the majority originate from the Arabian Sea; in contrast, break phases are associated with a higher contribution from the African region.

1. Introduction

Atmospheric aerosols significantly impact the Earth’s climate. They directly affect the climate system by scattering and absorbing incoming solar radiation. Indirectly, they act as cloud condensation nuclei (CCN) and ice nuclei (IN), influencing the formation and properties of clouds [1,2]. The Indian monsoon region is known for its high concentration of aerosols. These aerosols significantly influence the monsoon’s hydrological cycle through various mechanisms. Changes in Indian monsoon rainfall can be linked to the overall heating or cooling effects caused by aerosols, known as aerosol radiative forcing. Anthropogenic aerosols, primarily located in the Northern Hemisphere, can dim sunlight. This dimming effect (slow response) disrupts monsoon circulation patterns by altering north–south temperature gradients and wind patterns, ultimately leading to reduced rainfall over India [3,4]. Fast responses are short-term fluctuations in monsoon rainfall linked to specific aerosol types. Dust and black carbon (BC) aerosols can absorb atmospheric radiation during the pre-monsoon season. This absorption enhances north–south surface temperature or pressure gradients, triggering the earlier onset and intensification of monsoon rainfall, as explained by the elevated heat pump hypothesis [5,6,7,8]. These contrasting long-term and short-term effects can occur simultaneously. This interplay adds significant complexity to understanding the hydrological cycle of the Indian Summer Monsoon (ISM) system.
The Indian Summer Monsoon (ISM) system is one of the most critical weather patterns globally. It significantly impacts water resources, agriculture, the economy, and the ecological balance of the Indian subcontinent [9]. The ISM system and its associated rainfall over India (ISMR) exhibit significant variability across space and time. This variability ranges from short-term fluctuations within a season (intra-seasonal) to variations between seasons (inter-seasonal), between years (interannual), and even across decades (decadal). Several factors contribute to this variability, including local weather patterns, large-scale climate forces, and complex interactions among land, ocean, and atmosphere [10,11]. One key aspect of the ISMR’s intra-seasonal variability is the alternation between active and break spells. Active spells bring significant rainfall, while break spells are characterized by minimal precipitation. These fluctuations are linked to changes in the seasonal trough, a region of low pressure that influences convective activity, and the presence of regional atmospheric aerosols [12,13]. Numerous studies have investigated the impact of aerosols on Indian monsoon rainfall, highlighting their role in modifying clouds and precipitation patterns [14,15,16,17,18]. Interestingly, there is a two-way interaction: precipitation can also affect aerosol emissions, transport, and removal through wet scavenging [19,20,21].
In this study, we explored the aerosol variability during different phases of the Indian monsoon season, i.e., during active–break spells and strong–weak monsoon periods in India. The structure of this paper is as follows: Section 2 describes the data used in this study, Section 3 presents the results, and Section 4 provides a summary and conclusions.

2. Data Sets

2.1. Moderate Resolution Imaging Spectrometer (MODIS)

The Moderate Resolution Imaging Spectroradiometer (MODIS) on NASA’s TERRA satellite provides daily global aerosol data. MODIS measures the sunlight reflected by Earth’s surface across 36 spectral bands, ranging from the visible to thermal infrared wavelengths [22]. To retrieve aerosol optical properties over land and ocean, scientists primarily use the two following algorithms: Dark Target and Deep Blue [23,24]. In this study, we have used MODIS-Terra merged Dark Target (DT) and Deep Blue (DB) AOD at 550 nm for the land and ocean C6.1 Level 3 monthly AOD [25]. Studies also reported that combined DT and DB products accurately capture the exact aerosol changes and are recommended for aerosol studies at a global scale [26].

2.2. Cloud–Aerosol Lidar and Infrared Pathfinder Satellite Observations (CALIPSO)

The CALIPSO mission, a collaborative effort between NASA and the French space agency (CNES), was launched in 2006 and studies the vertical distribution of clouds and aerosols and their impacts on Earth’s climate and air quality [27]. The CALIPSO spacecraft orbits Earth at an altitude of 705 km (438 miles) in a sun-synchronous polar orbit. It crosses the equator at approximately 1:30 p.m. local solar time (ascending node) and revisits any given location every 16 days. The spacecraft carries three key instruments: Cloud–Aerosol Lidar with Orthogonal Polarization (CALIOP): this two-wavelength (532 nm and 1064 nm) lidar that provides backscatter profiles at both wavelengths, with two polarization components (parallel and perpendicular) at 532 nm; its measurements help to identify the locations and vertical extents of aerosols. Imaging Infrared Radiometer (IIR): this instrument measures infrared radiation. Wide Field-of-view Camera (WFC): this camera takes visible-light images. For this study, we utilized CALIPSO Level 2 products (version 4.10). Specifically, we used the data on total attenuated backscatter (km−1 sr−1) at 532 nm, the vertical feature mask, and aerosol subtypes. These data allow us to pinpoint the locations and vertical extents of aerosols along CALIPSO’s flight path.
Furthermore, we have classified the active and break spells, based on rainfall data, obtained over Central India, as mentioned by Rajeevan et al., (2010) [13]. We have estimated strong and weak monsoon years based on gridded IMD rainfall data in the grid (5–30°N, 70–95°E). We have also conducted detrend analysis of the rainfall data in the grid and identified the strong and weak monsoon years. Strong and weak monsoon years were selected when the mean rainfall levels were above and below 1 standard deviation in the detrend analysis [28].

2.3. HYSPLIT

We employed the HYSPLIT (Hybrid Single-particle Lagrangian Integrated Trajectory) model, a popular tool developed by NOAA ARL (https://www.ready.noaa.gov/HYSPLIT.php, accessed on 5 January 2024), to identify potential source regions contributing aerosols to the core monsoon region. In this study, we modeled backward air mass trajectories for the monsoon seasons (2002–2018). These trajectories traced the movement of air masses over five days, starting at an altitude of 500 m above ground level in the core monsoon region.

3. Results and Discussion

3.1. Seasonal Variations in AOD

Understanding the spatial and seasonal variability of Aerosol Optical Depth (AOD) over India is crucial to examining its relationship with different monsoon phases. Figure 1 presents the seasonal climatology of AOD, derived from MODIS data, for the period from 2001 to 2018. The spatial distribution of AOD reveals distinct variations across seasons. The monsoon season exhibits the highest AOD across the entire region, followed by the pre-monsoon season. Winter experiences the lowest aerosol loading. Northern India observes the highest AOD (0.6–0.7) during winter, particularly in the eastern and western Indo-Gangetic Plain (IGP). This is likely due to cold surface conditions and abundant local emissions that condense water vapor, forming dense fog and haze. In contrast, the southern and central parts of India exhibit comparatively lower AOD levels (0.1–0.2). Aerosol loading over adjacent oceanic regions is likely attributed to transport by surface winds. During the monsoon season, AOD is dominant (>0.6) over the Arabian Sea, western India, and the IGP. This may be due to the large-scale transport of aerosols from eastern Pakistan and the Thar Desert through the IGP to the Bay of Bengal. Interestingly, central India consistently exhibits high AOD values (around 0.3–0.5) irrespective of the season. Ratnam et al. (2021) [29] attributed this significant increase in aerosol concentration to enhanced fire emissions. Therefore, the observed high AOD over central India can be a combined effect of increased fire activity and long-range transport. Pre-monsoon AOD is somewhat influenced by surface moisture content. The Intertropical Convergence Zone (ITCZ) movement leads to intense surface heating, triggering local fire activity. This phenomena, particularly prevalent in northern India and adjoining oceans, contribute to moderate or high AOD levels (0.4–0.6). The post-monsoon season marks the transition between the wet and dry seasons in India. By the end of the monsoon season, aerosol loading begins to rise, peaking during the post-monsoon season, especially over the eastern IGP (Punjab and Haryana). This increase is likely due to open agricultural stubble burning practices, common during this season, with emissions transported across northern India [30]. Seasonal variations in aerosols are strongly influenced by regional and local meteorological conditions, aerosol emission rates, and atmospheric factors such as rainfall, biomass burning, dust events, wind patterns, and more (Vadrevu et al., 2012) [31].

3.2. Variability of AOD during Active and Break Spells, Vertical Distribution from CALIPSO Data, Types, and Sources (HYPLIT Model)

Given that aerosols can linger in the atmosphere for about a week, we analyze how AOD varies during active and break spells of the ISM season. Figure 2 illustrates the AOD distribution over India during these phases. During active phases, high AOD is concentrated over the northwest and central India, along with adjoining Pakistan and the Arabian Sea. This seems counterintuitive, as active phases are characterized by frequent rain, which would remove aerosols through wet scavenging (rainout or washout). However, low-level jets and the tropical easterly jet stream, contributes to the observed AOD, which persistently transport aerosols over the Indian region during active phases (as noted by Ratnam et al., 2018 [32] and Prasad et al., 2019 [33]). The active monsoon is dominated by a strong low-pressure system near the surface (monsoon heat low), intensifying heating and trapping aerosols above the boundary layer. During break phases, the AOD increases substantially over the core monsoon region (mainly the IGP and central India) and decreases significantly over the northern Arabian Sea. Interestingly, southern India exhibits consistently low AOD (<0.2) during both the active and break phases, suggesting a cleaner environment compared to other regions. The transition from moist, convective circulation during active phases to drier, hot-tower circulation during break phases over central India (the core monsoon region) is a key driver of AOD variations (as explained by Rajeevan et al., 2010 [13]). While some rainout of aerosols occurs, prevailing meteorological winds also transport large quantities of aerosol particles from the Arabian Sea toward central India [34]. It is important to note that the contrasting AOD levels between active and break spells do not directly translate to radiative forcing impacts. The types of aerosols play significant roles in how they affect Earth’s energy balance [35].
Figure 3 provides further evidence of aerosol build up during active and break phases of the ISM season using data from the CALIPSO satellite. This figure shows the climatological mean profile of extinction coefficients (a measure of how strongly light is absorbed or scattered by aerosols) at 0.532 μm wavelength from 2006 to 2018. The vertical distribution of aerosols reveals a clear difference between active and break phases. During break phases, aerosols reach higher altitudes compared to during active phases. The mean extinction coefficient near the surface is higher during break phases (around 0.4 ± 0.32 km−1) compared to during active phases (around 0.3 ± 0.24 km−1). These values decrease rapidly with altitude, reaching below 0.1 km−1 at 5 km for both phases. Interestingly, both phases exhibit small peaks in the extinction coefficient (around 0.2–0.4 km−1) at 6–8 km. These peaks likely indicate the presence of non-spherical aerosols at these altitudes. Ratnam et al. (2018) [32] suggest that wet scavenging (removal of aerosols by rain) can occur even at higher altitudes. However, during active phases with frequent rainfall and low-level jet (LLJ) activity, continuous aerosol transport counteracts this scavenging, leading to a persistent presence of aerosols at higher altitudes. This highlights the monsoon’s role as a “cleaning detergent” through rainout (aerosols acting as cloud condensation nuclei) and washout (removal by rain). In contrast, break phases lack significant rainfall. Prevailing upward winds during these periods can potentially lift aerosols transported from the Arabian Sea to even higher altitudes, as suggested by Prasad et al. (2019) [33]. This phenomenon supports the notion of the ISM system acting as both a “pollution pump” and “purifier”, as described by Lelieveld et al. (2018) [36]. The varying magnitudes of extinction coefficients could be linked to the dominance of different aerosol types during active and break phases. Similar findings regarding the vertical distribution of aerosols during the summer monsoon season have been reported for Dehradun (mean extinction coefficient of 0.29 ± 0.07 km−1 at 1–3 km) [37] and the broader Indian mainland (mean extinction coefficients of around 0.3 km−1 at 0–3 km and 0.3 km−1 at 3–6 km altitudes) [38].
In addition to analyzing vertical aerosol distribution, we investigated the dominant aerosol types during active and break phases using long-term CALIPSO observations over the monsoon core region. Figure 4a,b illustrate the prevalence levels of different aerosol types during active and break phases, respectively. CALIPSO identifies seven aerosol subtypes: polluted dust (PD), polluted continental (PC), elevated smoke (SM), dusty marine (DM), dust (DT), clear marine (CM), and clear continental (CC) aerosols. During the active phase, polluted dust (29%), dusty marine (26%), dust (15%), and elevated smoke (14%) aerosols are the dominant types (Figure 4a). This suggests a mixture of transported coarse-mode dust and continental smoke aerosols. Break phases are characterized by the dominance of polluted dust (43%), dusty marine (36%), and dust (11%) aerosols (Figure 4b). Polluted dust is likely comprised of dust mixed with urban pollution or smoke from biomass burning, making it highly absorbent [39,40]. The increases in polluted dust and dusty marine aerosols during break phases might be due to intense heating over central India, causing winds to advect these particles toward the observation site. Observational and modeling studies have shown that dust aerosols play crucial roles in influencing Indian Summer Monsoon Rainfall (ISMR) patterns and the hydrological cycle at various spatial and temporal scales, primarily through aerosol radiative effects (Ramanathan et al., 2001) [41].
Thus, our analysis suggests that long-range transport and meteorological factors are primarily influence the dust and marine aerosols. To understand the variations in aerosol types, we examined 5-day isentropic air mass back-trajectories arriving at the receptor site (core monsoon region) at an altitude of 500 m above ground level (AGML) during active and break phases. Figure 5 illustrates these trajectories. The figure reveals a distinct change in the average air mass pathways (also known as clusters, which represent the mean trajectories for groups originating from specific geographic regions). During the active phase, approximately 94% of the air mass reaching the receptor site originates from the Arabian Sea. The remaining 6% comes from the continental eastern–central part of India. This explains the dominance of smoke aerosols (14%) observed during this phase. In contrast, the break phase is characterized by air masses originating primarily from the African continent. These air masses, containing mineral dust, are transported by lower-level southwesterly winds. As a result, the aerosol types during break phases are influenced by a combination of land and ocean properties. It is important to note that dust transported from remote sources, like the Middle East and Africa, dominates the Indian region throughout the year. Dust emissions can significantly alter the spatial distribution of simulated rainfall over the Indian subcontinent, as shown by Debnath et al. (2023) [42].

3.3. Variability of AOD during Strong and Week Monsoon Years, Vertical Distribution from CALIPSO Data, Types, and Sources (HYPLIT Model)

We investigated how AOD varied between strong and weak monsoon years over India from 2001 to 2018 (results shown in Figure 6). Interestingly, the spatial distribution of AOD appears similar in both strong and weak monsoon years (Figure 6a,b). However, the magnitude of AOD differs significantly (Figure 6c). Weak monsoon years exhibit higher aerosol loading compared to strong monsoon years. This difference may be due to several factors. During weak monsoon years, a combination of factors could contribute to higher AOD, such as increased transport of dust aerosols from western regions and enhanced local anthropogenic emissions. Conversely, strong monsoon years likely experience lower AOD due to efficient wet scavenging of aerosols by excess rainfall [43]. A previous study by Bhattacharya et al. (2017) [44] suggests that weak monsoon years are characterized by higher cloud liquid water content and lower rainfall. Since aerosols can act as cloud condensation nuclei, this phenomenon, along with the trapping of dust aerosols above the planetary boundary layer (PBL) in dry conditions (increasing their lifetime), could contribute to higher AOD during weak monsoon periods. The most significant difference in AOD is observed over central India (AOD at 550 nm, ranging from 0 to 0.2). This might be attributed to dominant local biomass burning emissions, as these regions are known for frequent forest fires and crop residue burning (Shaik et al., 2022) [45].
To understand the vertical distribution of aerosols during strong and weak monsoon years over the core monsoon region, we analyzed climatological mean profiles of aerosol extinction coefficients, derived from CALIPSO observations. Each mean profile incorporates over 1000 individual profiles for strong and weak monsoon periods (Figure 7a,b). The vertical distribution of aerosols is primarily confined below 3 km. However, the extinction coefficients extend to considerably higher altitudes in strong and weak monsoon years, reaching up to 8 km. The relative standard deviation of the extinction coefficient is observed to be between 50% and 100% at lower altitudes (0–1.5 km). This value increases at higher altitudes, indicating greater temporal variability in aerosol concentration at those levels. The mean extinction coefficient values are similar for strong and weak monsoon years (around 0.19 km−1) near the surface (up to 500 m). Beyond 500 m and up to 5 km, the values decrease sharply to around 0.1 km−1 during both periods. The Indian subcontinent experiences significant spatial and temporal variations in different aerosol types. These variations can substantially impact the vertical distribution of aerosols and atmospheric heating rates. To quantify the contributions of different aerosol types during strong and weak monsoon periods, we estimated their percentages based on CALIPSO VFM data (Figure 8a,b). Dust aerosols are the dominant type throughout the atmospheric column (over 70%) in both strong and weak monsoon years. However, the specific contributions differ slightly, as follows: strong monsoon: dust (43%), polluted dust (31%); weak monsoon: dust (38%), polluted dust (35%)
To gain a deeper understanding of aerosol origins, we performed a 5-day back-trajectory analysis over the core monsoon region during strong and weak monsoon phases (Figure 9). This analysis considers a starting altitude corresponding to the mean elevation level of 500 m. The figure reveals that 70–80% of the air mass reaching the receptor site originates from the African deserts (Somalia) and travels through the Arabian Sea before reaching central India. This explains the observed heterogeneity of dust aerosols in central India during monsoon seasons (as seen in Figure 8). Consistent with previous studies, our analysis highlights the significant role of the long-range transport of dust aerosols from Africa to the Indian region.

4. Summary and Conclusions

This study investigated the spatial and vertical distribution of aerosols over the Indian region during the different monsoon phases, using satellite observations from MODIS and CALIPSO. The analysis focused on investigating variability within the monsoon season and examining differences between strong and weak monsoon years, as well as active and break phases. The main key findings are summarized below:
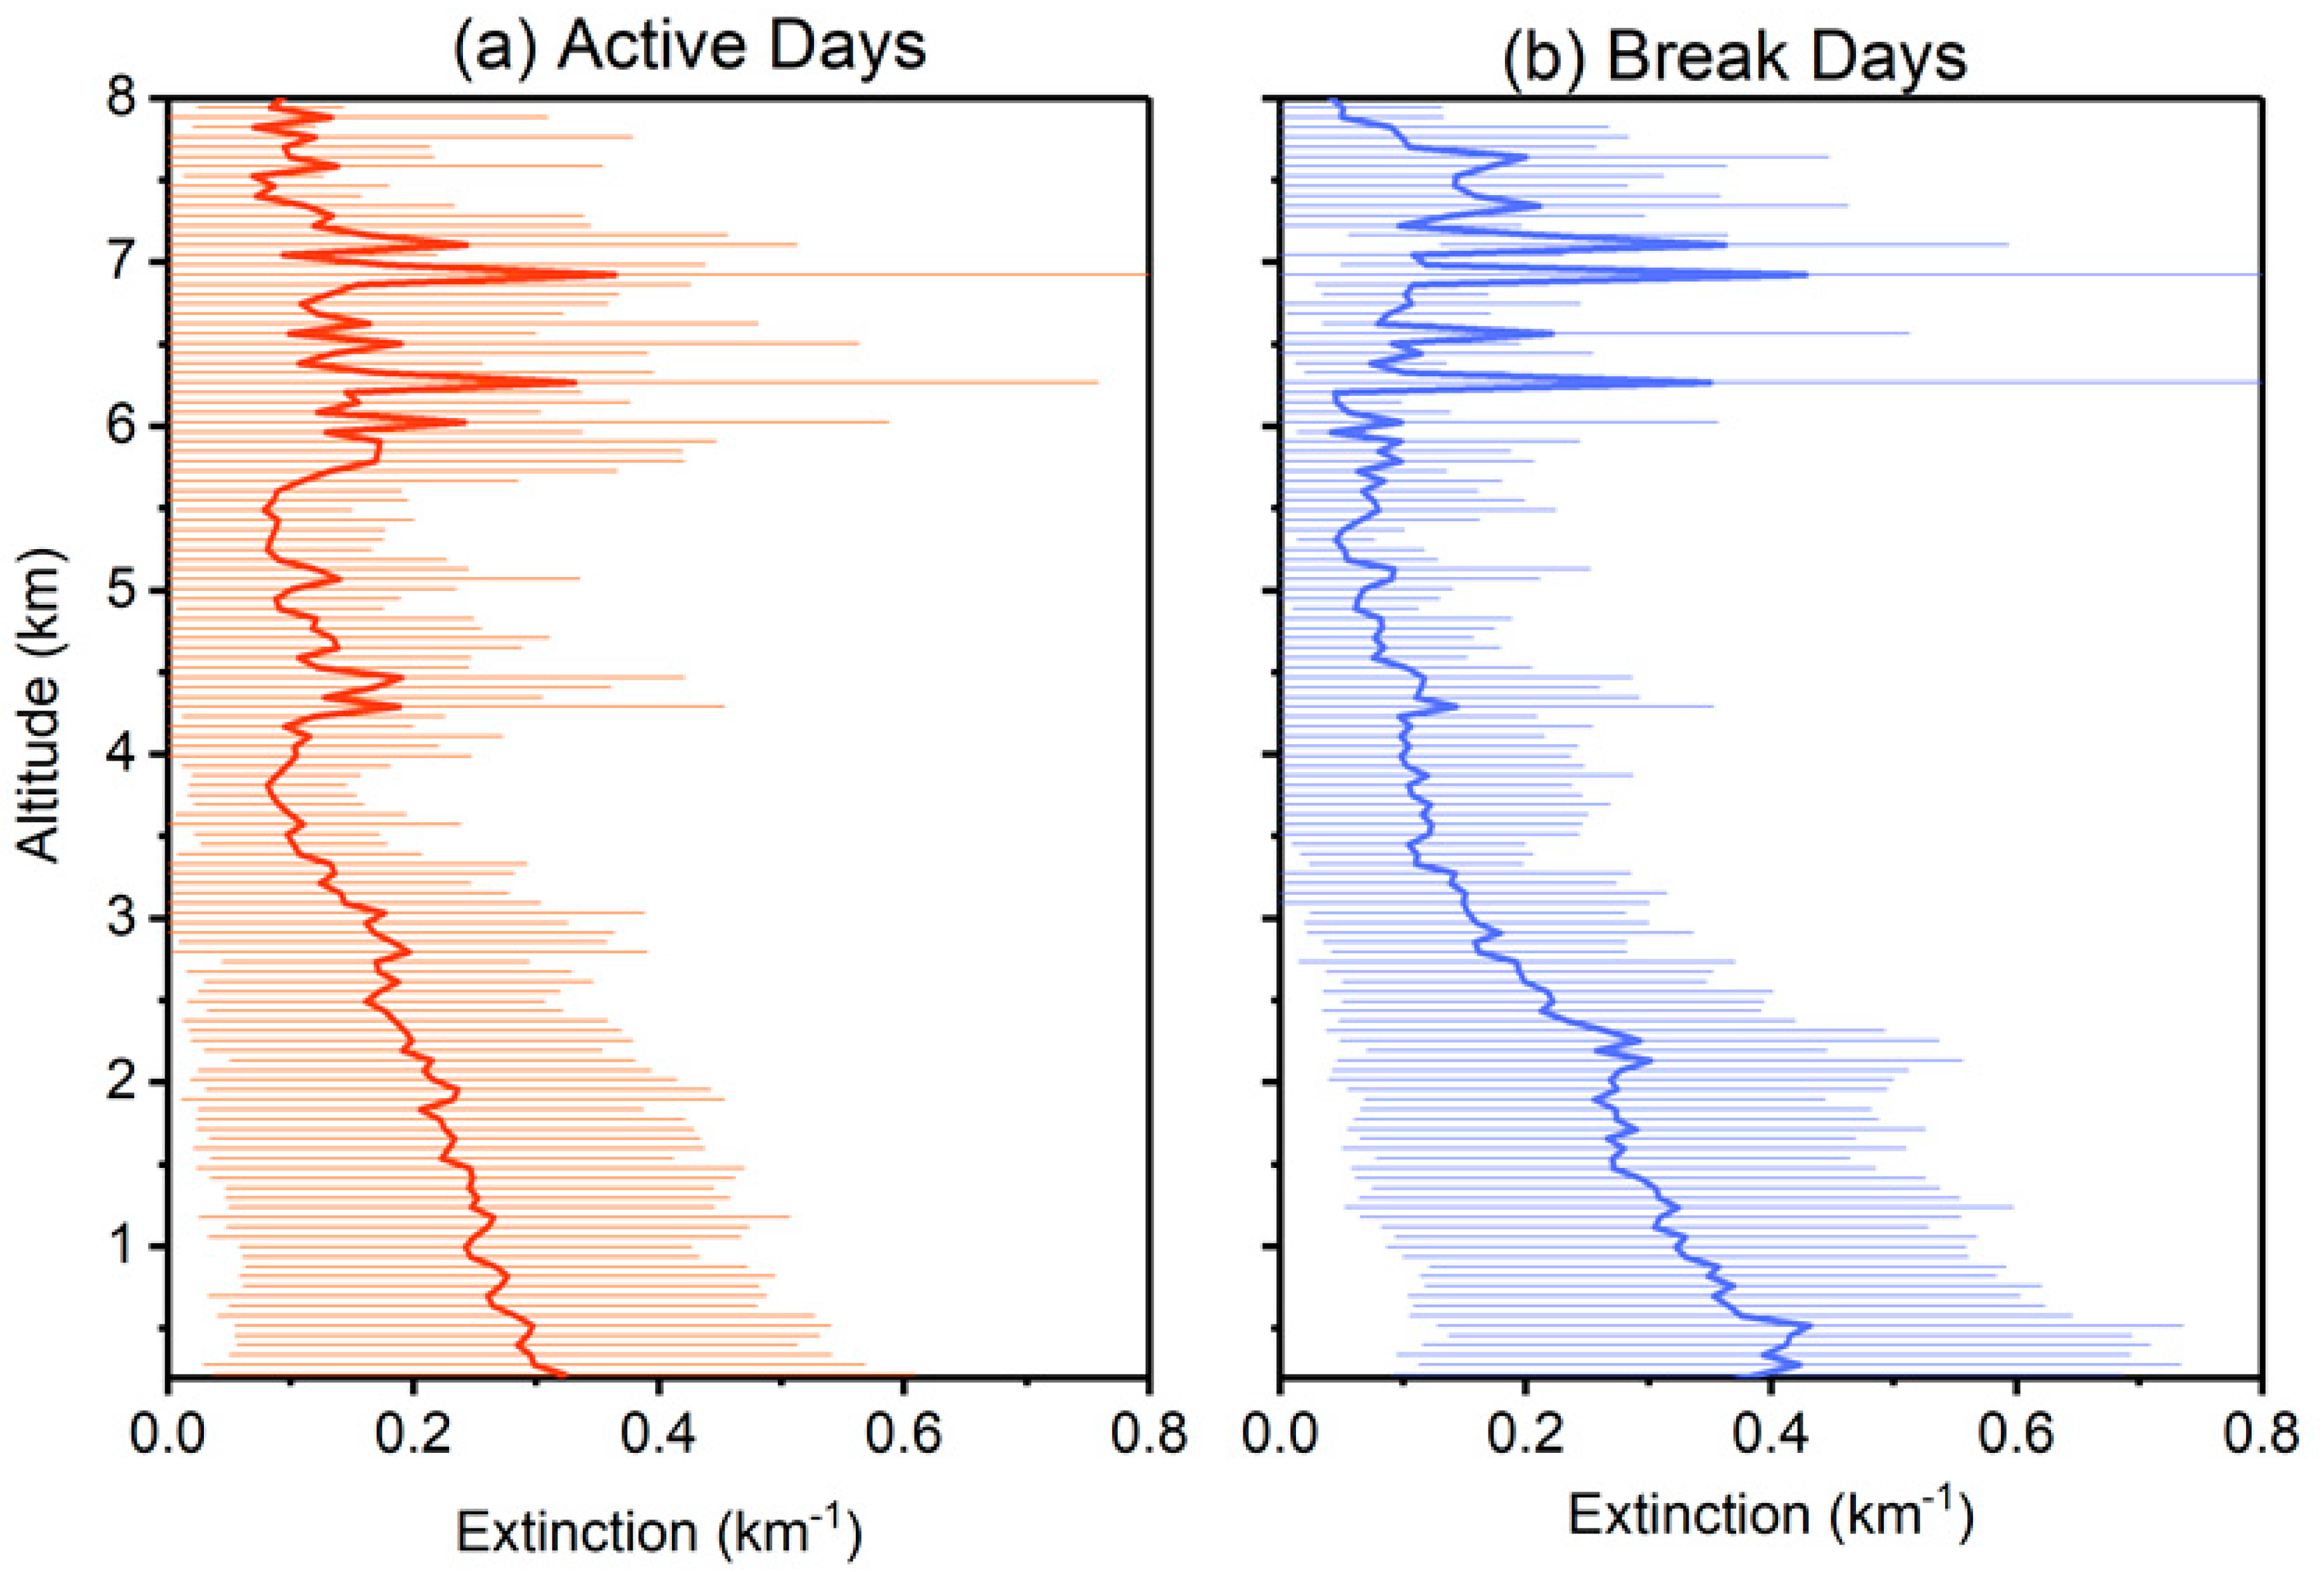
  • Over the Indian region, aerosol distribution exhibits clear differences between strong and weak monsoon years, as well as between active and break days. During active monsoon phases (with higher rainfall), lower AOD and aerosol extinction are observed. This can be attributed to increased removal of aerosols by the washout and rainout processes, leading to a shorter atmospheric lifespan for these particles. Conversely, break days (associated with drier conditions) experience higher AOD and aerosol extinction, due to the buildup of aerosols with longer atmospheric lifetime in the absence of significant rainfall.
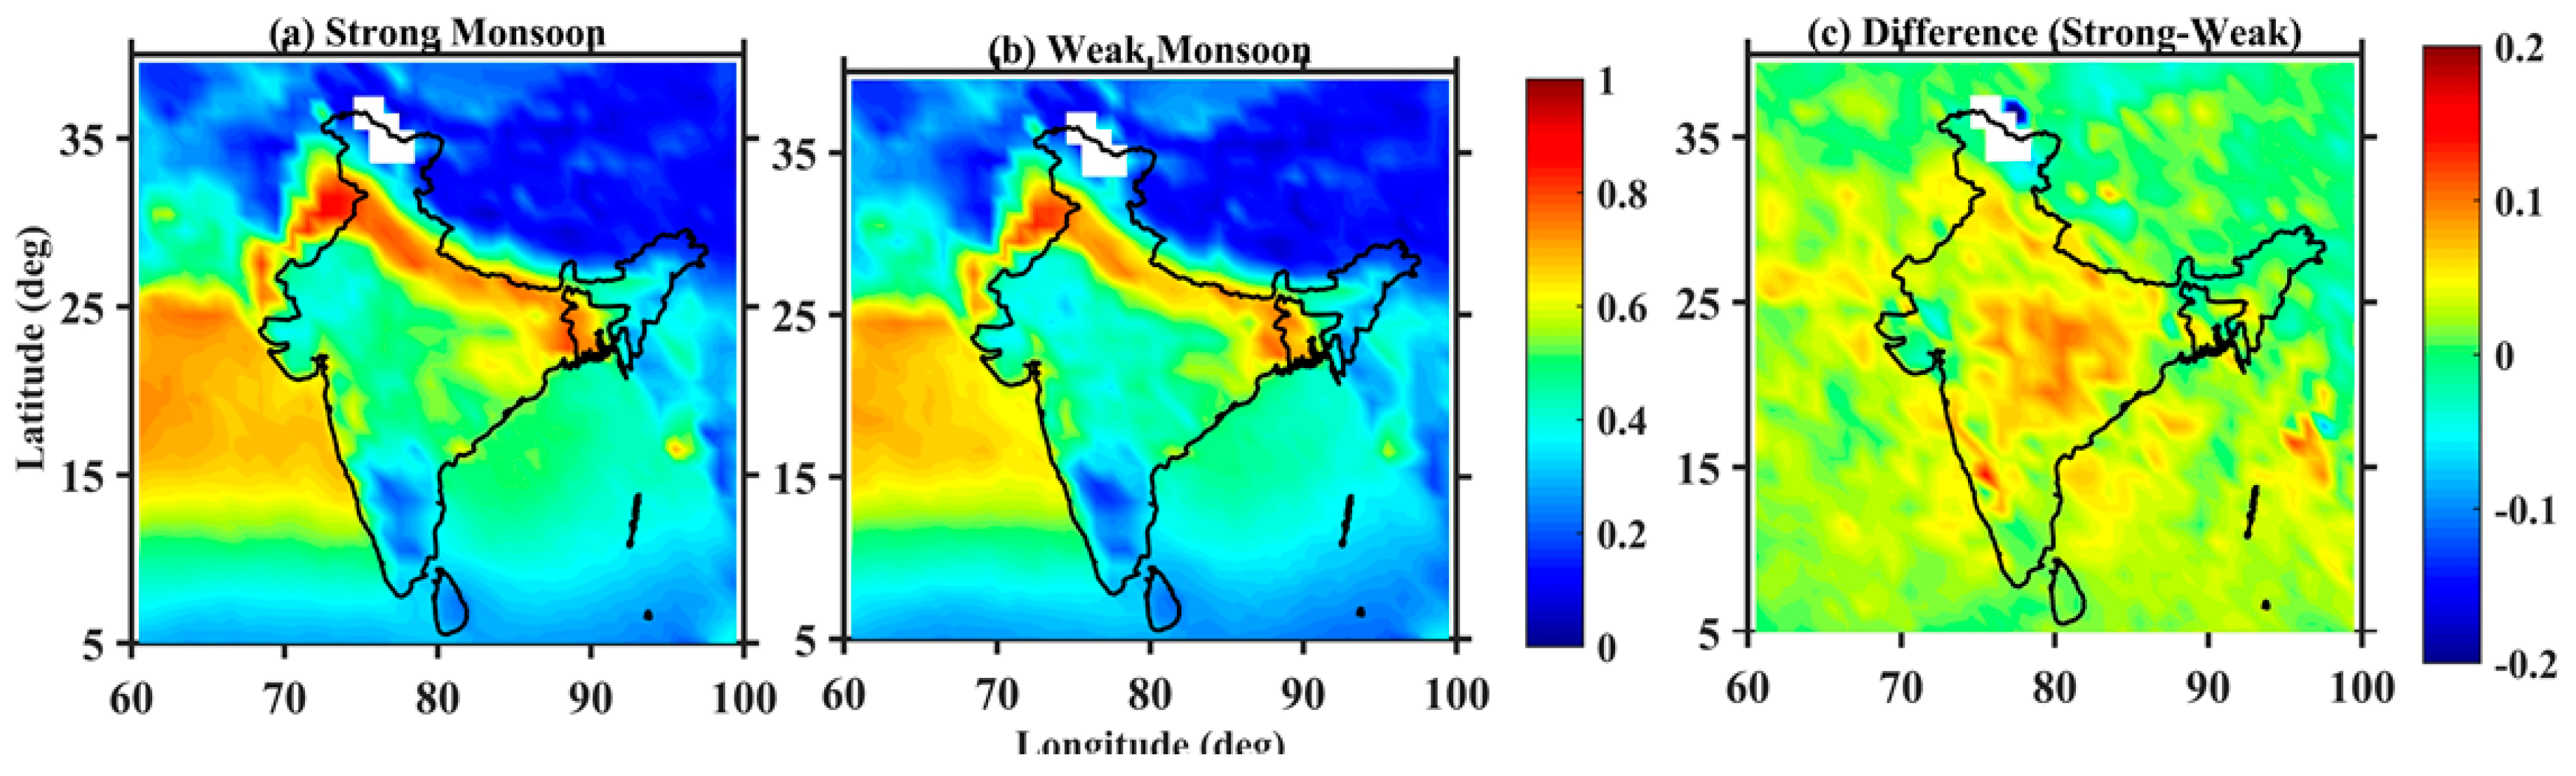
  • Interestingly, the strong association between columnar AOD and aerosol extinction was observed during break and active days and was less evident during strong and weak monsoon years. Additionally, strong monsoon years have shown significant increases in AOD, particularly in Central India. This phenomenon might be explained by the presence of prolonged and intense dry spells (breaks) during these years, leading to a substantial rise in the aerosol burden across the Indian region.
  • CALIPSO VFM measurements revealed distinct aerosol compositions during active and break phases. During active phases, polluted dust (29%), dusty marine (26%), dust (15%), and elevated smoke (14%) aerosols were the dominant types. In contrast, the break phase was dominated by polluted dust (43%) and dusty marine (36%) aerosols, with a lower contribution from dust (11%). Interestingly, the compositions during strong and weak monsoon years differed from the active–break pattern. Here, dust and polluted dust aerosols were the primary contributors, with 43% and 31% during strong monsoons, and 38% and 35% during weak monsoons, respectively.
  • HYSPLIT trajectory analysis revealed that, during the active phase, a significant portion of the air mass reaching the receptor site originated from the Arabian Sea (approximately 94%). A smaller fraction (6%) originated from the continental region of east–central India. In contrast, during the break phase, the air masses primarily originated from the African continent, transporting mineral dust through lower-level southwesterly winds. This shift in air mass origin influences the aerosol composition, reflecting the combined properties of both land and ocean sources during the break phase.
  • This study emphasizes the critical role of aerosol distribution in influencing Indian Summer Monsoon rainfall patterns, with variations observed between strong and weak monsoon years, as well as active and break days. The findings suggest that regional rainfall variability is likely linked to two key factors: (1) the transport of aerosols from different source regions and (2) the relative contribution of absorbing and scattering aerosol types within the overall aerosol population.

Author Contributions

Conceptualization, P.I.K.; methodology, G.B. and J.H.J.; software, P.K.; validation, P.P.; formal analysis, S.D.S.; investigation, G.B.; resources, P.K.; data curation, P.I.K. and P.I.K.; supervision, D.V.R. and J.H.J.; writing—original draft, G.B.; writing—review and editing, D.V.R.; review and editing, C.S.P. All authors have read and agreed to the published version of the manuscript.

Funding

This work was supported by the KL University, Guntur.

Data Availability Statement

Publicly available satellite datasets were analyzed in this study. These datasets can be found here: MODIS and CLAIPSO websites.

Acknowledgments

Author J.H.J. acknowledges the support by the Jet Propulsion Laboratory, California Institute of Technology, under contract with NASA. P.I.K. acknowledges the K.L. University for providing necessary support to carry out this work.

Conflicts of Interest

The authors declare no conflicts of interest.

References

  1. Hansen, J.; Sato, M.; Ruedy, R. Radiative forcing and climate response. J. Geophys. Res. 1997, 102, 6831–6864. [Google Scholar] [CrossRef]
  2. Albrecht, B.A. Aerosols, Cloud Microphysics, and Fractional Cloudiness. Science 1989, 245, 1227–1230. [Google Scholar] [CrossRef]
  3. Ganguly, D.; Rasch, P.J.; Wang, H.; Yoon, J.H. Fast and slow responses of the South Asian monsoon system to anthropogenic aerosols. Geophys. Res. Lett. 2012, 39, 1–5. [Google Scholar] [CrossRef]
  4. Ramanathan, V.; Carmichael, G. Global and regional climate changes due to black carbon. Nat. Geosci. 2008, 1, 221–227. [Google Scholar] [CrossRef]
  5. Ramanathan, V.; Chung, C.; Kim, D.; Bettge, T.; Buja, L.; Kiehl, J.T.; Washington, W.M.; Fu, Q.; Sikka, D.R.; Wild, M. Atmospheric brown clouds: Impacts on South Asian climate and hydrological cycle. Proc. Natl. Acad. Sci. USA 2005, 102, 5326–5333. [Google Scholar] [CrossRef] [PubMed]
  6. Lau, K.M.; Kim, K.M. Observational relationships between aerosol and Asian monsoon rainfall, and circulation. Geophys. Res. Lett. 2006, 33, 1–5. [Google Scholar] [CrossRef]
  7. Vinoj, V.; Rasch, P.J.; Wang, H.; Yoon, J.H.; Ma, P.L.; Landu, K.; Singh, B. Short-term modulation of Indian summer monsoon rainfall by West Asian dust. Nat. Geosci. 2014, 7, 308–313. [Google Scholar] [CrossRef]
  8. Shaik, D.S.; Kant, Y.; Mitra, D.; Babu, S.S. Assessment of aerosol characteristics and radiative forcing over northwest himalayan region. IEEE J. Sel. Top. Appl. Earth Obs. Remote Sens. 2017, 10, 5314–5321. [Google Scholar] [CrossRef]
  9. Gadgil, S.; Gadgil, S. The Indian monsoon, GDP and agriculture. Econ. Political Wkly. 2006, 41, 4887–4895. [Google Scholar]
  10. Mishra, V.; Smoliak, B.V.; Lettenmaier, D.P.; Wallace, J.M. A prominent pattern of year-to-year variability in Indian Summer Monsoon Rainfall. Proc. Natl. Acad. Sci. USA 2012, 109, 7213–7217. [Google Scholar] [CrossRef]
  11. Goswami, B.N.; Ajaya Mohan, R.S. Intraseasonal oscillations and interannual variability of the Indian summer monsoon. J. Clim. 2001, 14, 1180–1198. [Google Scholar] [CrossRef]
  12. Rajeevan, M.; Gadgil, S.; Bhate, J. Active and break spells of the indian summer monsoon. J. Earth Syst. Sci. 2010, 119, 229–247. [Google Scholar] [CrossRef]
  13. Dave, P.; Bhushan, M.; Venkataraman, C. Aerosols cause intraseasonal short-term suppression of Indian monsoon rainfall. Sci. Rep. 2017, 7, 1–12. [Google Scholar] [CrossRef]
  14. Sarangi, C.; Kanawade, V.P.; Tripathi, S.N.; Thomas, A.; Ganguly, D. Aerosol-induced intensification of cooling effect of clouds during Indian summer monsoon. Nat. Commun. 2018, 9, 5314–5321. [Google Scholar] [CrossRef] [PubMed]
  15. Sanap, S.D.; Pandithurai, G. The effect of absorbing aerosols on Indian monsoon circulation and rainfall: A review. Atmos. Res. 2015, 164–165, 318–327. [Google Scholar] [CrossRef]
  16. Harikishan, G.; Padmakumari, B.; Maheskumar, R.S.; Kulkarni, J.R. Radiative effect of dust aerosols on cloud microphysics and meso-scale dynamics during monsoon breaks over Arabian sea. Atmos. Environ. 2015, 105, 22–31. [Google Scholar] [CrossRef]
  17. Vinoj, V.; Satheesh, S.K.; Babu, S.S.; Moorthy, K.K. Large aerosol optical depths observed at an urban location in southern India associated with rain-deficit summer monsoon season. Ann. Geophys. 2014, 22, 3073–3077. [Google Scholar] [CrossRef]
  18. Surendran, S.; Ajay Anand, K.V.; Ravindran, S.; Rajendran, K. Exacerbation of Indian Summer Monsoon Breaks by the Indirect Effect of Regional Dust Aerosols. Geophys. Res. Lett. 2022, 49, e2022GL101106. [Google Scholar] [CrossRef]
  19. Isokääntä, S.; Kim, P.; Mikkonen, S.; Kühn, T.; Kokkola, H.; Yli-Juuti, T.; Heikkinen, L.; Luoma, K.; Petäjä, T.; Kipling, Z.; et al. The effect of clouds and precipitation on the aerosol concentrations and composition in a boreal forest environment. Atmos. Chem. Phys. 2022, 22, 11823–11843. [Google Scholar] [CrossRef]
  20. Wilcox, E.M.; Ramanathan, V. The impact of observed precipitation upon the transport of aerosols from South Asia. Tellus B Chem. Phys. Meteorol. 2004, 56, 435. [Google Scholar] [CrossRef]
  21. Basha, G.; Ratnam, M.V.; Jiang, J.H.; Kishore, P.; Babu, S.R. Influence of Indian Summer Monsoon on Tropopause, Trace Gases and Aerosols in Asian Summer Monsoon Anticyclone Observed by COSMIC, MLS and CALIPSO. Remote Sens. Artic. 2021, 13, 3486. [Google Scholar] [CrossRef]
  22. Salomonson, V.V.; Barnes, W.; Masuoka, E.J. Introduction to MODIS and an overview of associated activities. Earth Sci. Satell. Remote Sens. 2006, 1, 12–32. [Google Scholar] [CrossRef]
  23. Sayer, A.M.; Hsu, N.C.; Lee, J.; Kim, W.V.; Dutcher, S.T. Validation, stability, and consistency of MODIS Collection 6.1 and VIIRS Version 1 Deep Blue aerosol data over land. J. Geophys. Res. Atmos. 2019, 124, 4658–4688. [Google Scholar] [CrossRef]
  24. Remer, L.A.; Mattoo, S.; Levy, R.C.; Munchak, L.A. MODIS 3 km aerosol product: Algorithm and global perspective. Atmos. Meas. Tech. 2013, 6, 1829–1844. [Google Scholar] [CrossRef]
  25. Levy, R.C.; Mattoo, S.; Munchak, L.A.; Remer, L.A.; Sayer, A.M.; Patadia, F.; Hsu, N.C. The Collection 6 MODIS aerosol products over land and ocean. Atmos. Meas. Tech. 2013, 6, 2989–3034. [Google Scholar] [CrossRef]
  26. Wei, J.; Li, Z.; Peng, Y.; Sun, L. MODIS Collection 6.1 aerosol optical depth products over land and ocean: Validation and comparison. Atmos. Environ. 2019, 201, 428–440. [Google Scholar] [CrossRef]
  27. Winker, D.M.; Hostetler, C.A.; Vaughan, M.A.; Omar, A.H. CALIOP Algorithm Theoretical Basis Document Part 1: CALIOP Instrument, and Algorithms Overview CALIOP Algorithm Theoretical Basis Document Part 1: CALIOP Instrument, and Algorithms Overview. 2006. [Google Scholar]
  28. Basha, G.; Ratnam, M.V.; Kishore, P. Asian summer monsoon anticyclone: Trends and variability. Atmos. Chem. Phys. 2020, 20, 6789–6801. [Google Scholar] [CrossRef]
  29. Ratnam, M.V.; Prasad, P.; Akhil Raj, S.T.; Roja Raman, M.; Basha, G. Changing patterns in aerosol vertical distribution over South and East Asia. Sci. Rep. 2021, 11, 308. [Google Scholar] [CrossRef]
  30. Pandithurai, G.; Dipu, S.; Dani, K.K.; Tiwari, S.; Bisht, D.S.; Devara, P.C.S.; Pinker, R.T. Aerosol radiative forcing during dust events over New Delhi, India. J. Geophys. Res. Atmos. 2008, 113, 1–13. [Google Scholar] [CrossRef]
  31. Kumar, M.; Parmar, K.S.; Kumar, D.B.; Mhawish, A.; Broday, D.M.; Mall, R.K.; Banerjee, T. Long-term aerosol climatology over Indo-Gangetic Plain: Trend, prediction and potential source fields. Atmos. Environ. 2018, 180, 37–50. [Google Scholar] [CrossRef]
  32. Madineni, V.R.; Atmospheric, N.; Prasad, P.; Mekalathur, R.R.; Rao, S.V.B. Role of dynamics on the formation and maintenance of the elevated aerosol layer during monsoon season over south-east peninsular India Role of dynamics on the formation and maintenance of the elevated aerosol layer during monsoon season over south-east peninsular India. Atmos. Environ. 2018, 188, 43–49. [Google Scholar] [CrossRef]
  33. Prasad, P.; Raman, M.R.; Ratnam, M.V.; Ravikiran, V.; Madhavan, B.L.; Rao, S.V.B. Noc-turnal, seasonal and intra-annual variability of tropospheric aerosols observed usingground-based and space-borne lidars over a tropical location of India. Atmos. Environ. 2019, 213, 185–198. [Google Scholar] [CrossRef]
  34. Prijith, S.S.; Suresh Babu, S.; Lakshmi, N.B.; Satheesh, S.K.; Krishna Moorthy, K. Meridional gradients in aerosol vertical distribution over Indian Mainland: Observations and model simulations. Atmos. Environ. 2016, 125, 337–345. [Google Scholar] [CrossRef]
  35. Srivastava, A.K.; Ji, B.; Singh, A.; Singh, V.; Bisht, D.S.; Tiwari, S.; Srivastava, M.K. Implications of different aerosol species to direct radiative forcing and atmospheric heating rate. Atmos. Environ. 2020, 241, 117820. [Google Scholar] [CrossRef]
  36. Lelieveld, J.; Bourtsoukidis, E.; Brühl, C.; Fischer, H.; Fuchs, H.; Harder, H.; Hofzumahaus, A.; Holland, F.; Marno, D.; Neumaier, M.; et al. The south Asian monsoon-Pollution pump and purifier. Science 2018, 61, 270–273. [Google Scholar] [CrossRef]
  37. Dumka, U.C.; Saheb, S.D.; Kaskaoutis, D.G.; Kant, Y.; Mitra, D. Columnar aerosol characteristics and radiative forcing over the Doon Valley in the Shivalik range of northwestern Himalayas. Environ. Sci. Pollut. Res. 2016, 23, 25467–25484. [Google Scholar] [CrossRef] [PubMed]
  38. Mehta, M.; Khushboo, R.; Raj, R.; Singh, N. Spaceborne observations of aerosol vertical distribution over Indian mainland (2009–2018). Atmos. Environ. 2021, 244, 117902. [Google Scholar] [CrossRef]
  39. Kim, M.H.; Omar, A.H.; Tackett, J.L.; Vaughan, M.A.; Winker, D.M.; Trepte, C.R.; Hu, Y.; Liu, Z.; Poole, L.R.; Pitts, M.C.; et al. The CALIPSO version 4 automated aerosol classification and lidar ratio selection algorithm. Atmos. Meas. Tech. 2018, 11, 6107–6135. [Google Scholar] [CrossRef]
  40. Kant, Y.; Shaik, D.S.; Mitra, D.; Chandola, H.C.; Babu, S.S.; Chauhan, P. Black carbon aerosol quantification over north-west Himalayas: Seasonal heterogeneity, source apportionment and radiative forcing. Environ. Pollut. 2020, 257, 113446. [Google Scholar] [CrossRef]
  41. Ramanathan, V.C.P.J.; Crutzen, P.J.; Kiehl, J.T.; Rosenfeld, D. Aerosols, climate, and the hydrological cycle. Science 2001, 294, 2119–2124. [Google Scholar] [CrossRef]
  42. Debnath, S.; Govardhan, G.; Saha, S.K.; Hazra, A.; Pohkrel, S.; Jena, C.; Kumar, R.; Ghude, S.D. Impact of dust aerosols on the Indian Summer Monsoon Rainfall on intra-seasonal time-scale. Atmos. Environ. 2023, 305, 119802. [Google Scholar] [CrossRef]
  43. Sajani, S.; Moorthy, K.K.; Rajendran, K.; Nanjundiah, R.S. Monsoon sensitivity to aerosol direct radiative forcing. J. Earth Syst. Sci. 2012, 121, 867–889. [Google Scholar] [CrossRef]
  44. Bhattacharya, A.; Chakraborty, A.; Venugopal, V. Role of aerosols in modulating cloud properties during active–break cycle of Indian summer monsoon. Clim. Dyn. 2017, 49, 2131–2145. [Google Scholar] [CrossRef]
  45. Shaik, D.S.; Kant, Y.; Sateesh, M.; Sharma, V.; Rawat, D.S.; Chandola, H.C. Spatio-temporal variation of biomass burning fires over Indian region using satellite data. In Atmospheric Remote Sensing: Principles and Applications; Elsevier: Amsterdam, The Netherlands, 2022; pp. 121–138. [Google Scholar] [CrossRef]
Figure 1. Seasonal variability of Aerosol Optical Depth (AOD), observed using MODIS and averaged from 2001 to 2018: (a) winter (DJF), (b) pre-monsoon (MAM), (c) monsoon (JJA), and (d) post-monsoon (SON) seasons.
Remotesensing 16 03171 g001
Figure 2. Spatial variability of AOD during (a) active and (b) break spells of Indian monsoon season.
Remotesensing 16 03171 g002
Figure 3. Vertical variability of aerosol extinction, obtained from CALIPSO observations and averaged, from 2006 to 2018, for (a) active and (b) break days.
Remotesensing 16 03171 g003
Figure 4. Aerosol types, obtained from CALIPSO vertical feature mask (VFM), during (a) active days (b) break days. Pie chart representing the percentages (%) of total aerosol sub-types observed between 0 and 8 km during (c) active days (d) break days over Indian region.
Remotesensing 16 03171 g004
Figure 5. HYSPLIT 5-day backward mean trajectories during (a) active and (b) break days from 2001 to 2018.
Remotesensing 16 03171 g005
Figure 6. Spatial variability of AOD during (a) strong monsoon and (b) weak monsoon years, and (c) differences between weak and strong monsoon years.
Remotesensing 16 03171 g006
Figure 7. Vertical variability of aerosol extinction, obtained from CALIPSO observations and averaged, from 2006 to 2018 for (a) strong monsoon and (b) weak monsoon years.
Remotesensing 16 03171 g007
Figure 8. Aerosol types obtained from CALIPSO vertical feature mask (VFM) during (a) strong monsoon and (b) weak monsoon years. Pie chart representing the percentages (%) of total aerosol sub-types observed between 0 and 8 km during (c) strong monsoon and (d) weak monsoon years over Indian region.
Remotesensing 16 03171 g008
Figure 9. HYSPLIT 5-days backward mean trajectories during (a) strong monsoon (b) weak monsoon during 2001–2020.
Remotesensing 16 03171 g009
Disclaimer/Publisher’s Note: The statements, opinions and data contained in all publications are solely those of the individual author(s) and contributor(s) and not of MDPI and/or the editor(s). MDPI and/or the editor(s) disclaim responsibility for any injury to people or property resulting from any ideas, methods, instructions or products referred to in the content.

