Article

South-to-North Water Diversion Halting Long-Lived Subsidence in Tianjin, North China Plain

1
Hebei Cangzhou Groundwater and Land Subsidence National Observation and Research Station, Cangzhou 061000, China
2
School of Geospatial Engineering and Science, Sun Yat-sen University, Zhuhai 519082, China
3
China Institute of Geo-Environment Monitoring, Beijing 100081, China
4
Faculty of Geosciences and Engineering, Southwest Jiaotong University, Chengdu 611756, China
*
Author to whom correspondence should be addressed.
Remote Sens. 2024, 16(17), 3213; https://doi.org/10.3390/rs16173213
Submission received: 20 July 2024 / Revised: 24 August 2024 / Accepted: 27 August 2024 / Published: 30 August 2024

Abstract

:
The South-to-North Water Diversion Project in China is the world’s largest water transfer project, aiming to address water shortages in northern China by channeling water from the water-rich southern regions. Water resources in Tianjin have long been in severe deficit, with excessive groundwater extraction causing significant surface subsidence, negatively impacting urban infrastructure and economic development. As a result, Tianjin has become a key beneficiary of this water diversion project. To investigate the current situation of surface subsidence, we obtained the vertical displacement time series from 21 GNSS stations across Tianjin from 2011 to 2021 and analyzed overall subsidence changes and rehabilitation status. Results indicate that no clear surface subsidence was observed in the northern regions of Tianjin due to groundwater extraction mainly in unconfined aquifers. The southwestern region experienced the most significant surface subsidence due to overexploitation of deep groundwater, with peak cumulative subsidence exceeding 600 mm during the study period. The central, eastern, and southeastern coastal regions also faced severe surface subsidence with cumulative amounts ranging from 100 mm to 400 mm. The alleviation of subsidence predominantly benefits from continuous water supply from the South to North Water Diversion Project, which resulted in most stations significantly slowing down or even stabilizing their settlement rates after 2018. Therefore, the South-to-North Water Diversion Project plays a crucial role in addressing the persistent water resource shortage and mitigating long-term surface subsidence in Tianjin by ensuring a continuous water supply and significantly reducing the need for groundwater extraction. Our findings indicate positive measures, such as water diversion projects and water management policies, can serve as valuable references for other regions around the world facing similar water scarcity and groundwater overexploitation.

1. Introduction

Land subsidence is one of the most prevalent geological hazard factors affecting the sustainable socio-economic development in China [1,2]. It is characterized by uneven distribution, slow subsidence rate, long duration, and widespread impact area. Severe land subsidence poses significant threats to various aspects, including the natural geological environment, urban infrastructure, road and rail transportation, and the development of underground spaces [3]. These damages are irreparable and permanent. Urban surface deformation is influenced by natural factors to some extent, but it is primarily caused by human activities related to urban development and construction [4]. Excessive groundwater extraction is one leading cause of frequent subsidence in Chinese cities. In China, many cities rely heavily on groundwater, with the national annual groundwater extraction volume exceeding 2.5 billion cubic meters. The North China Plain region, represented by Tianjin, Beijing, and Hebei, is characterized by extremely high groundwater usage rates [5,6,7,8]. Groundwater usage in this region accounts for over 70% of urban freshwater consumption [9,10]. With the acceleration of urban construction and economic development, these areas have witnessed severe land subsidence and soil structure damage due to excessive groundwater extraction and improper utilization [11]. Using various geodetic methods, such as GRACE [12,13], InSAR [14,15], and GNSS [12,16], the groundwater changes and surface deformation characteristics of the North China Plain have been quantified. These studies have detected extensive groundwater level decline and severe ground subsidence in the North China Plain in recent years.
Tianjin is one of the earliest and most severely affected cities by land subsidence in China, primarily due to its prolonged extensive groundwater extraction practices [17,18,19]. The extensive groundwater extraction has resulted in severe land subsidence in the region, particularly during the period from 1960 to 1995, with the maximum subsidence rate reaching −7.2 mm/yr [20]. To optimize water resource allocation and address the issue of excessive groundwater extraction, China has implemented the South-to-North Water Diversion Project [21]. The purpose of the project is to transfer surplus water resources from the south to water-scarce regions in the north [22]. The Middle Route of the South-to-North Water Diversion Project, initiated in December 2014, is the principal water supply project for Tianjin and the entire North China Plain [23]. Drawing water from the Danjiangkou Reservoir, the project supplies water through Hebei, Henan, Beijing, and Tianjin, significantly alleviating water scarcity issues in these regions [24,25]. The supplied water has met a substantial portion of Tianjin’s water needs, including filling reservoirs, recharging aquifers, and replacing urban groundwater extraction. As a result, it has significantly improved the stability of Tianjin’s aquifers and reduced subsidence. With the water supply from the Middle Route of the South-to-North Water Diversion Project, Tianjin commenced comprehensive water source conversion projects in 2015, followed by the implementation of a groundwater pressure relief plan in 2018 [26]. This plan strongly promoted comprehensive management of groundwater over-extraction by implementing measures such as increasing water-use efficiency across industries, diversifying water sources, improving water supply management, and establishing strict water use controls. By the end of 2020, Tianjin’s annual groundwater extraction had decreased to 300 million cubic meters, representing a 70% reduction from its historical peak. Due to proactive policy regulation and macroeconomic control, Tianjin’s groundwater resources have seen significant improvement, leading to a slowdown in subsidence rates [10,26].
The implementation of the Middle Route of the South-to-North Water Diversion Project played a crucial role in alleviating land subsidence in Tianjin. Therefore, accurately understanding the situation of land subsidence in Tianjin is essential for comprehending groundwater dynamics and land subsidence mechanisms. Global Navigation Satellite Systems (GNSS) can measure surface deformation with millimeter-level accuracy, providing an important means for precisely monitoring land deformation. GNSS is widely used in studying land subsidence caused by groundwater changes in various regions. In this study, we obtained vertical displacement time series data from 21 GNSS stations in Tianjin and utilized existing loading products to remove other hydrological and non-hydrological loading effects, aiming to obtain the vertical displacement caused by groundwater changes. By comprehensively analyzing the responses of various loads, this study aims to understand the changes and restoration levels of land subsidence after the implementation of this water diversion project, which is of great significance for the governance of groundwater extraction in Tianjin and the study of hydrogeological characteristics.

2. Study Area and Datasets

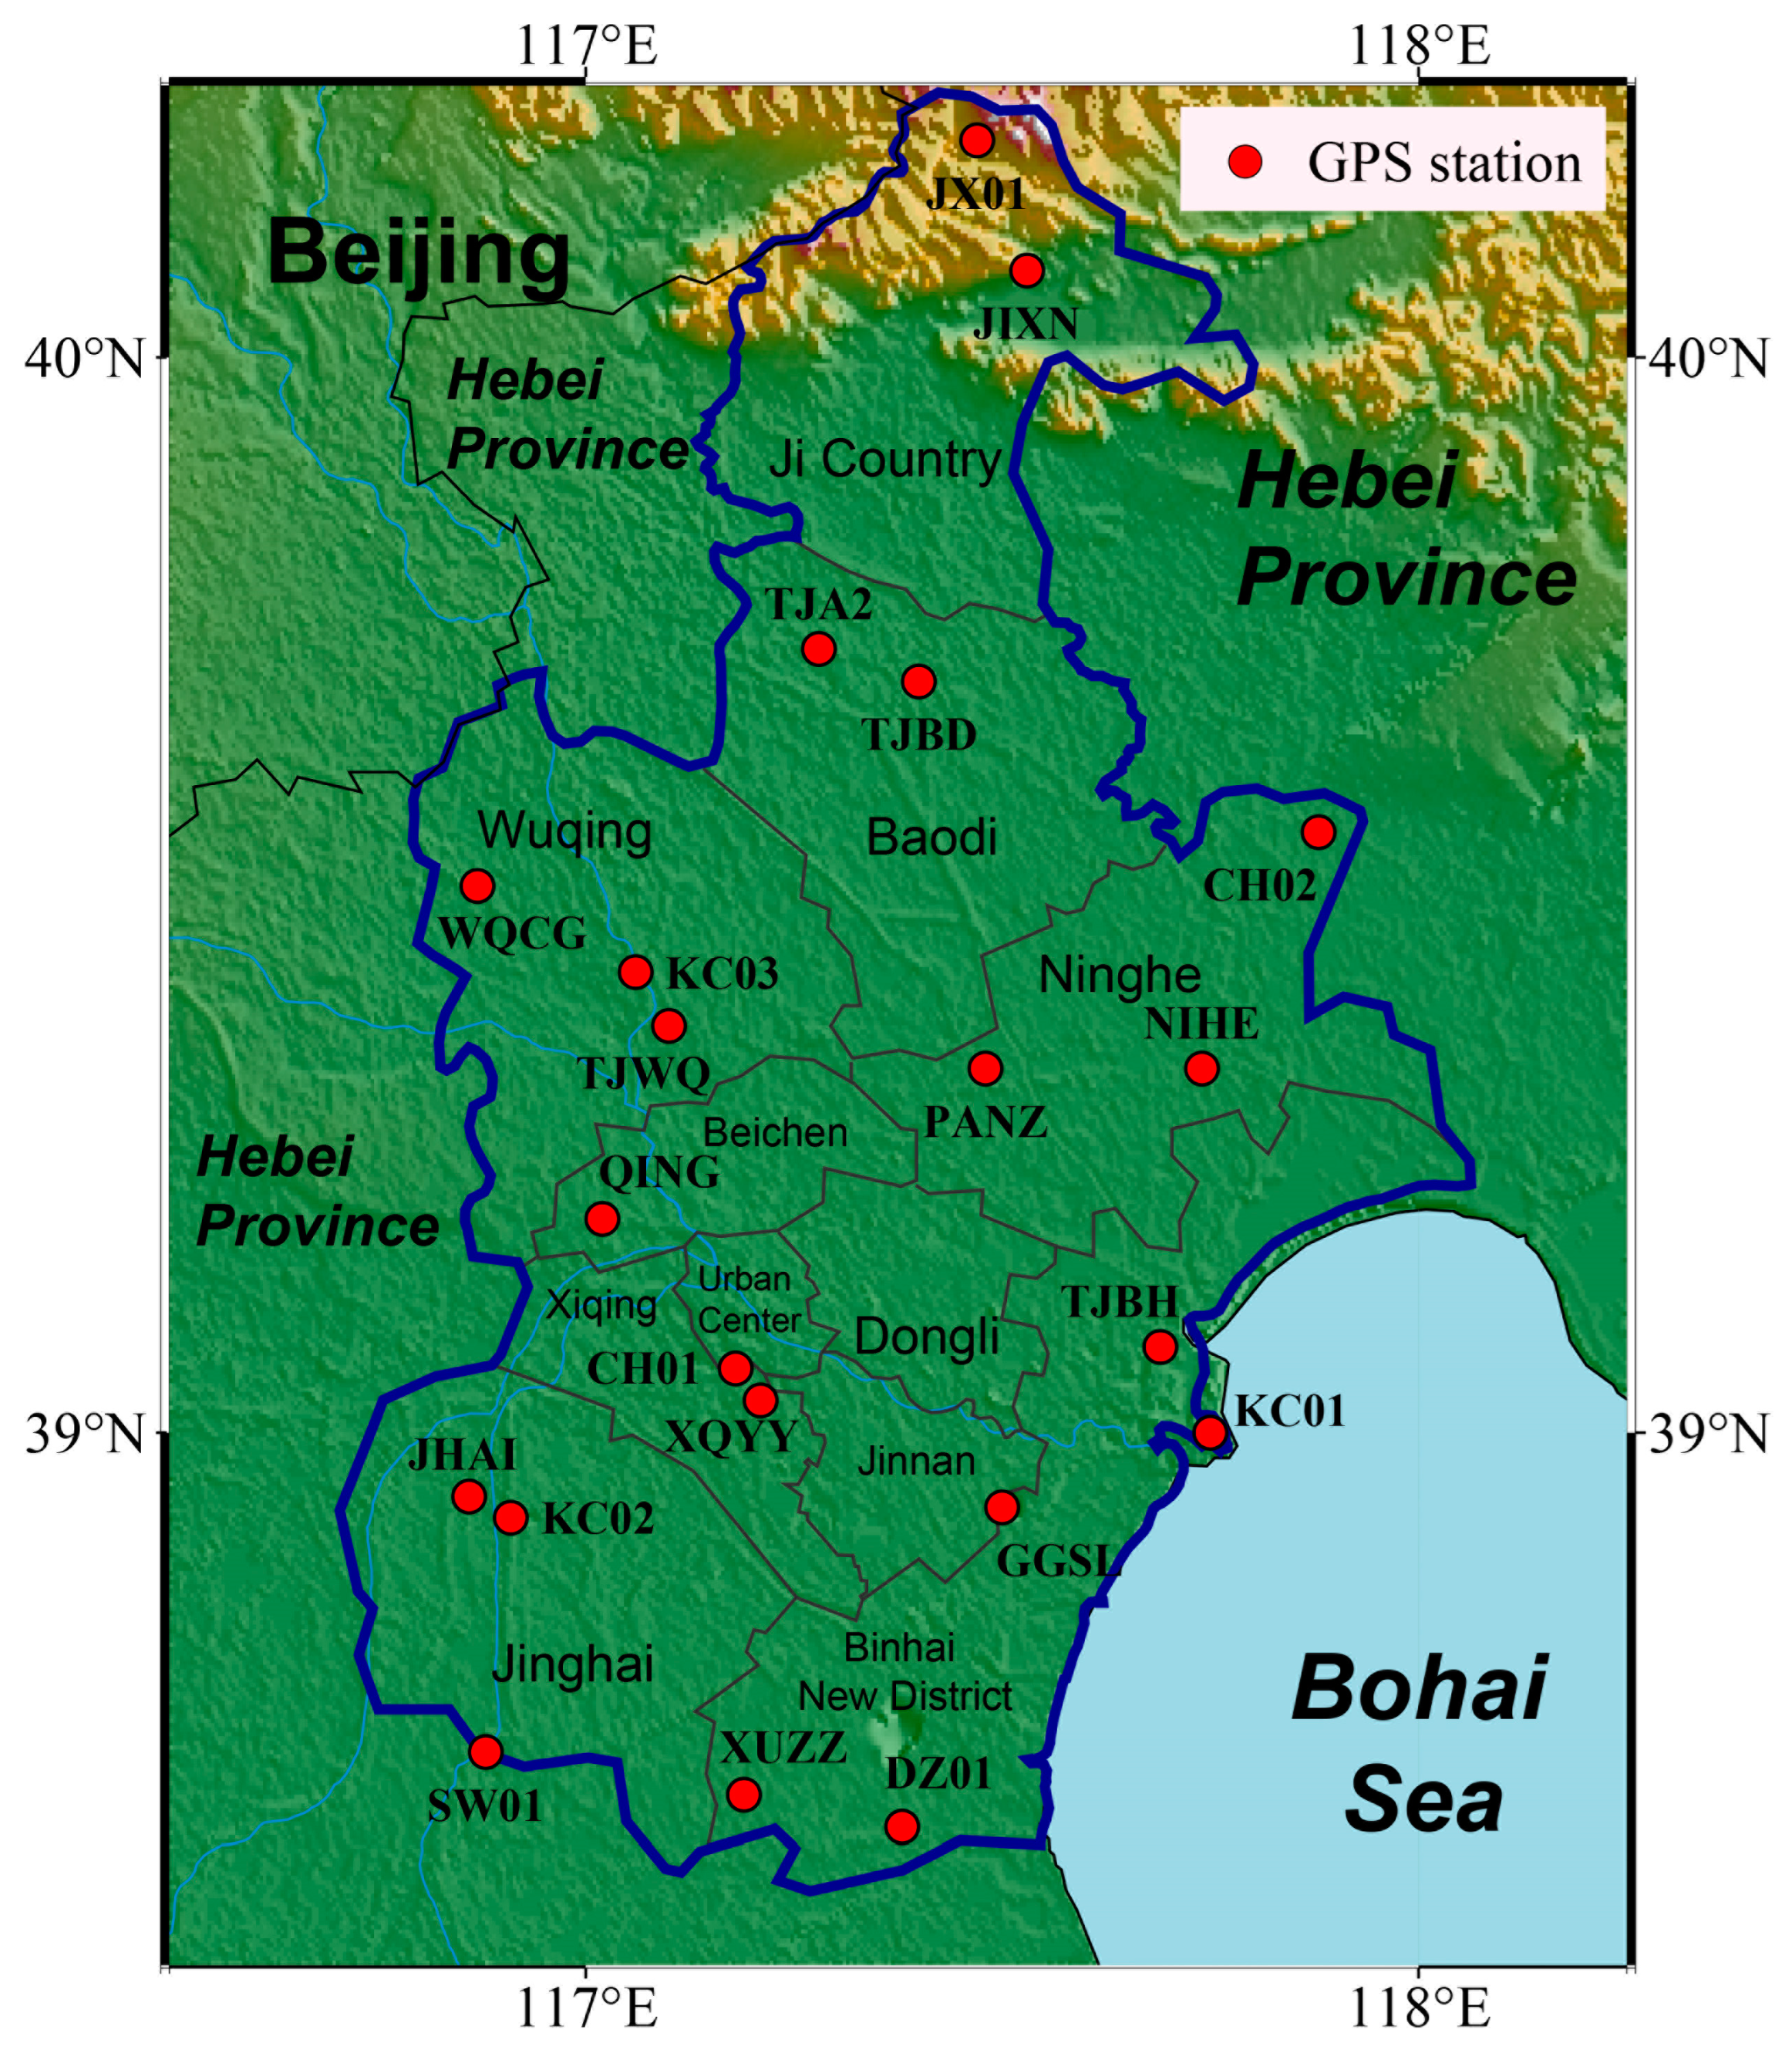
2.1. Geographical Background of Study Area

Tianjin, located between 38°30′N and 40°30′N latitude and from 116°30′E to 118°30′E longitude, is situated to the east of the Bohai Sea, at the northeastern margin of the North China Plain. It includes the Central Urban District, Binhai District, Dongli District, Xiqing District, Jinnan District, Beichen District, Wuqing District, Baodi District, Jinghai District, Ninghe District, and Ji Country (Figure 1). The total area of Tianjin municipality is approximately 12,000 square kilometers, with mountainous regions accounting for 6.4% of this area [27]. The terrain is primarily flat, consisting mostly of low-lying plains. Tianjin is in the warm temperate zone and has a monsoon climate, characterized by hot, humid summers and cold, dry winters, with an average annual precipitation of around 550 mm. Due to severe water scarcity in Tianjin, groundwater extraction has become one of the vital means for obtaining water resources to meet the demands of industries, agriculture, municipal usage, and other purposes in the region.
The aquifers in Tianjin mainly consist of gravel and clay, vertically divided into four aquifer units based on geological and hydrogeological conditions, including a shallow aquifer (the first aquifer unit) and three deep confined aquifer units (the second, third, and fourth aquifer units) [28,29]. Throughout Tianjin’s history of groundwater extraction, the first aquifer unit has been less affected, maintaining relatively good storage capacity due to recharge from precipitation. The middle two aquifer units typically serve as the primary targets for groundwater extraction. As these aquifers mainly consist of gravel, fine sand, and clay deposits, a decline in groundwater levels can lead to significant land subsidence and potential excessive consolidation of sediment layers [14]. Excessive groundwater exploitation has led to severe land subsidence issues in Tianjin. Fortunately, in recent years, a series of groundwater management measures have been implemented to address the over-pumping. Therefore, it is essential to evaluate the effectiveness of these measures by assessing the current land subsidence status in the Tianjin area.

2.2. GNSS Vertical Position Time Series

In this study, we employed the GNSS vertical displacement time series data from 2011 to 2021, obtained from 21 GNSS stations in the Tianjin region provided by the First Monitoring Center of China Earthquake Administration [30]. These stations are evenly distributed in our study region to assist in our analysis of land subsidence variations in different areas. The GNSS data are processed with the open-source GAMIT/GLOBK10.71 software [31] using orbit and clock products from the International GNSS Service (IGS). The IGS absolute antenna phase center model is used to correct phase delay errors for both satellite and ground antennas. First-order ionospheric delays are mitigated through the use of ionosphere-free linear combinations. The effects of solid Earth tides, polar tides, and ocean tidal loading are corrected using the IERS03 model and the FES2004 model, respectively. The final GNSS coordinate time series are referenced to the ITRF2014 framework. These GNSS vertical displacement measurements have an accuracy of approximately 7–8 mm, which is sufficient for monitoring poroelastic-plastic deformations caused by groundwater variations. Moreover, these subsidence signals are typically large enough to be detected with high reliability at this level of precision.

2.3. Tianjin Water Resources Bulletin

The water resources data used for the water resources survey and reservoir dynamics analysis are reported in the annual Tianjin Water Resources Bulletin. This bulletin is compiled by the Tianjin Water Affairs Bureau (https://swj.tj.gov.cn/, accessed on 19 August 2024). We collected water resources data, including total groundwater resources, groundwater supply, and precipitation from 2011 to 2021, to analyze the correlation between ground subsidence mitigation trends and groundwater resource changes before and after the implementation of the South-to-North Water Diversion Project.

3. Methodology

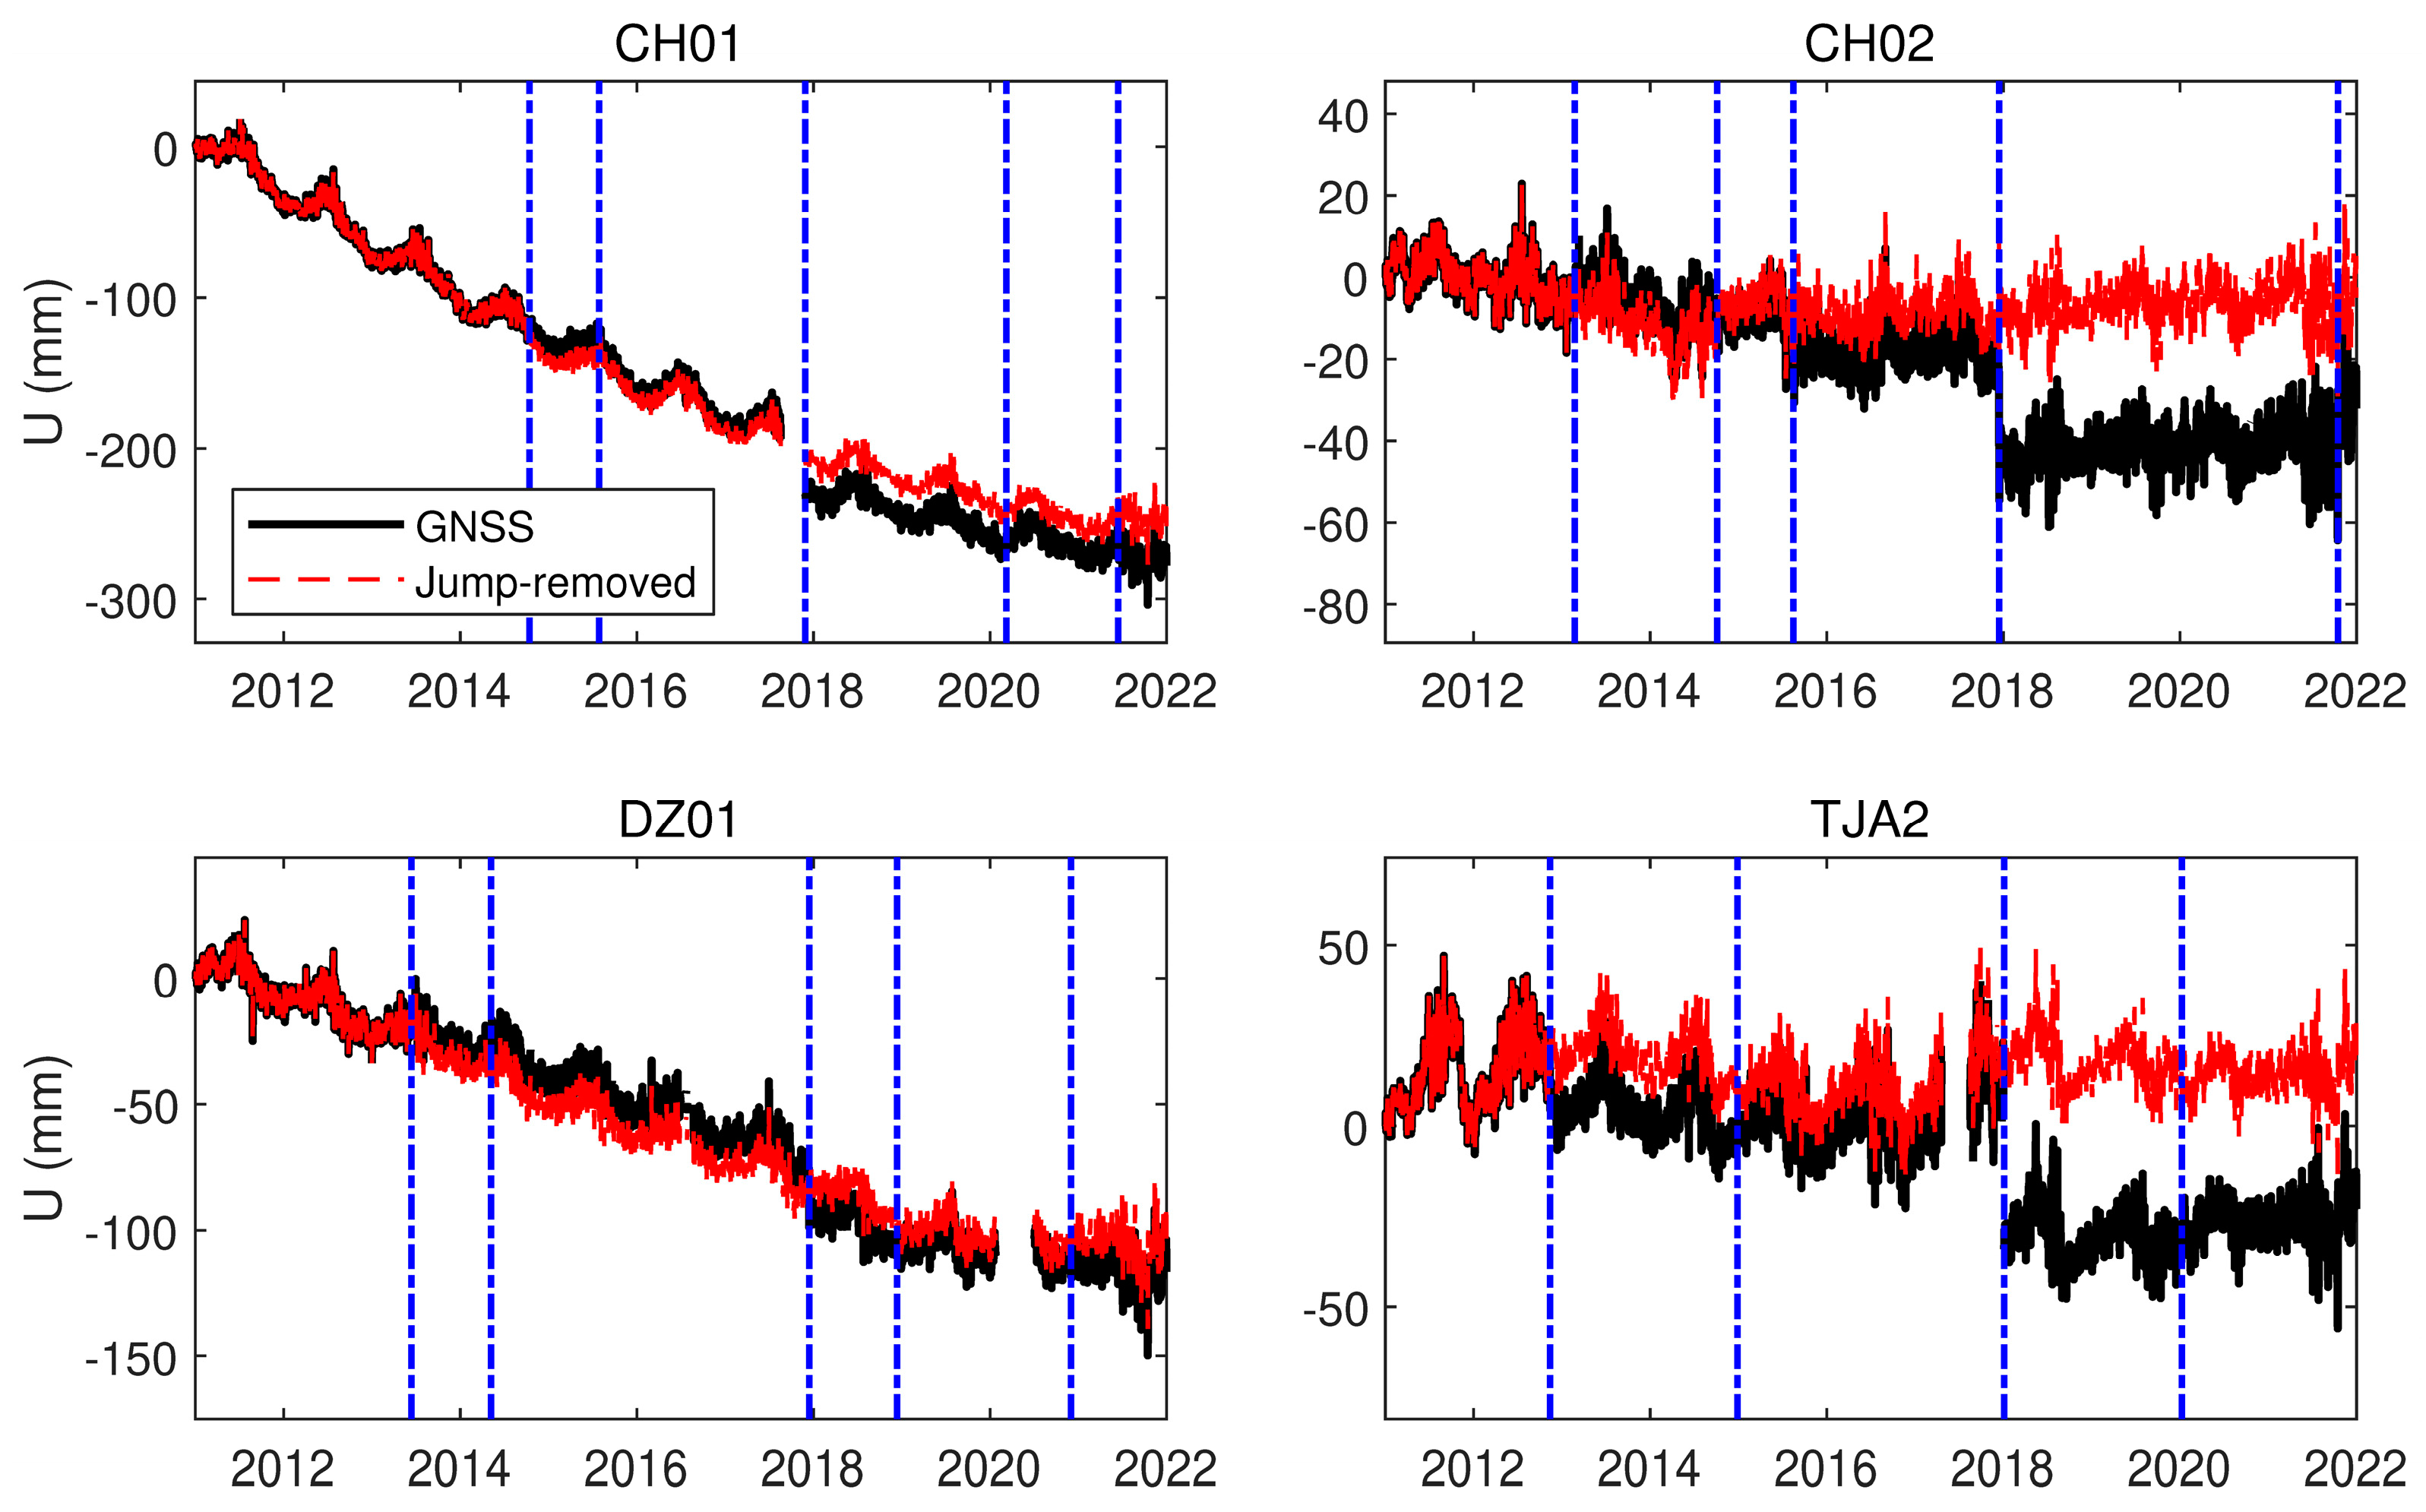
3.1. Correcting Jumps in GNSS Data with Variable Rates

In our study, missing entries in the GNSS vertical displacement data are not interpolated. Due to events such as earthquakes and antenna replacements, some GNSS displacement time series exhibited anomalous jumps. To address these irregularities in GNSS time series with variable rates, we employed a tool designed for change detection within unequally spaced and non-stationary time series, named the Jumps upon Spectrum and Trend (JUST) [32]. The JUST tool is highly effective for estimating trends and seasonal components in both equidistant and non-equidistant time series, accounting for observational uncertainties and measurement errors. Built on the foundations of least-squares spectral analysis (LSSA) and anti-leakage LSSA (ALLSSA), JUST excels at detecting jumps in the trend component of time series. This makes it particularly well-suited for scenarios manifested as jumps in a time series with changing rates. In our study, we utilized the default parameter settings to address jumps in the GNSS vertical displacement time series [32,33]. Figure 2 presents the results for four GNSS stations (CH01, CH02, DZ01, and TJA2) that exhibited significant jumps. For example, five jumps were detected at CH01, with the maximum jump of 26.7 mm. The results indicate that the GNSS vertical displacement time series, after applying the JUST method to handle jumps, exhibits a more continuous change pattern.

3.2. Implementing the Well-Modeled Corrections

To accurately capture the long-term surface subsidence changes in Tianjin resulting from excessive groundwater extraction, it is necessary to remove some unconcerned but well-modeled signals from the GNSS displacement signals [34]. In this study, four types of well-modeled environmental loading products were considered for corrections, including non-tidal atmospheric loading (NTAL) and non-tidal oceanic loading (NTOL) displacement signals, sea-level loading (SLEL) effects, and hydrological loading (HYDL) effects. In addition, the contributions from glacier isostatic adjustments (GIA) have also been deducted. These model-predicted values are directly subtracted from the time series after removing the jumps.
To eliminate the effects of well-modeled environmental loads, deformation products under the reference framework of the Earth’s Center of Figure (CF) provided by the Geo Forschungs Zentrum (GFZ) in Potsdam are utilized in this study [35]. These displacements are calculated based on the load Green’s function method. Figure 3 shows the annual amplitudes of vertical deformation corresponding to four loading models at GNSS stations. The annual displacement amplitudes of NTAL at the 21 GNSS stations range from 4.9 mm to 5.4 mm (Figure 3a). The results of NTOL are significantly lower in magnitude compared to NTAL, with annual displacement amplitudes ranging from 0.3 mm to 0.8 mm (Figure 3b). Across the 21 stations, the annual displacement amplitudes of HYDL range from 1.6 mm to 1.8 mm (Figure 3c). The impact of SLEL is relatively lower than the above-mentioned three types of loads, with a maximum of 0.4 mm (Figure 3d).
The GIA effect typically results in continuous crustal uplift or subsidence. When studying surface subsidence due to long-term groundwater extraction, the influence of GIA should be removed. Vertical predictions from the post-glacial rebound effect were removed by using the ICE-6G_D model in our study [36,37]. We analyze the displacement response to GIA for the 21 stations by calculating long-term rates and cumulative deformation, as shown in Figure 4. Due to the large spatial scale of the GIA effect, the differences in GIA effects for each station are minor. All GNSS stations in Tianjin experienced an uplift due to the influence of GIA. The long-term rates caused by GIA are roughly between 0.43 mm/yr and 0.45 mm/yr. From 2011 to 2021, the cumulative vertical deformations caused by GIA range from 4.7 mm to 5 mm.

3.3. Modeling GNSS Position Time Series

The analysis of the GNSS vertical displacement time series is crucial for understanding the patterns of land deformation driven by groundwater dynamics [38]. We employ the functional model in Equation (1) and utilize the least squares fitting method to estimate parameters such as long-term motion, acceleration signal, seasonal periodic changes, and residuals from the time series [39,40]. The equation is as follows:
y t m = y 0 + a t m + b t m 2 + i = 1 2 M i × sin 2 i π t m + N i × cos 2 i π t m + ε t m
where y(tm) is the instantaneous position of the time tm; y0 is the initial position of the site; a represents the linear velocity; b represents the acceleration; Mi and Ni represent the amplitude of the periodic term (i = 1 refers to the annual term, while i = 2 refers to the semi-annual term); and ε(tm) is the random noise. The step signals are not included here, as it was previously corrected using the JUST method. In this study, we employed the quadratic fitting method to extract seasonal variation components, as the long-term subsidence trend is not linear. When calculating linear subsidence rates for different periods using piecewise least squares fitting, the coefficient for the quadratic term was set to zero.

4. Results and Analysis

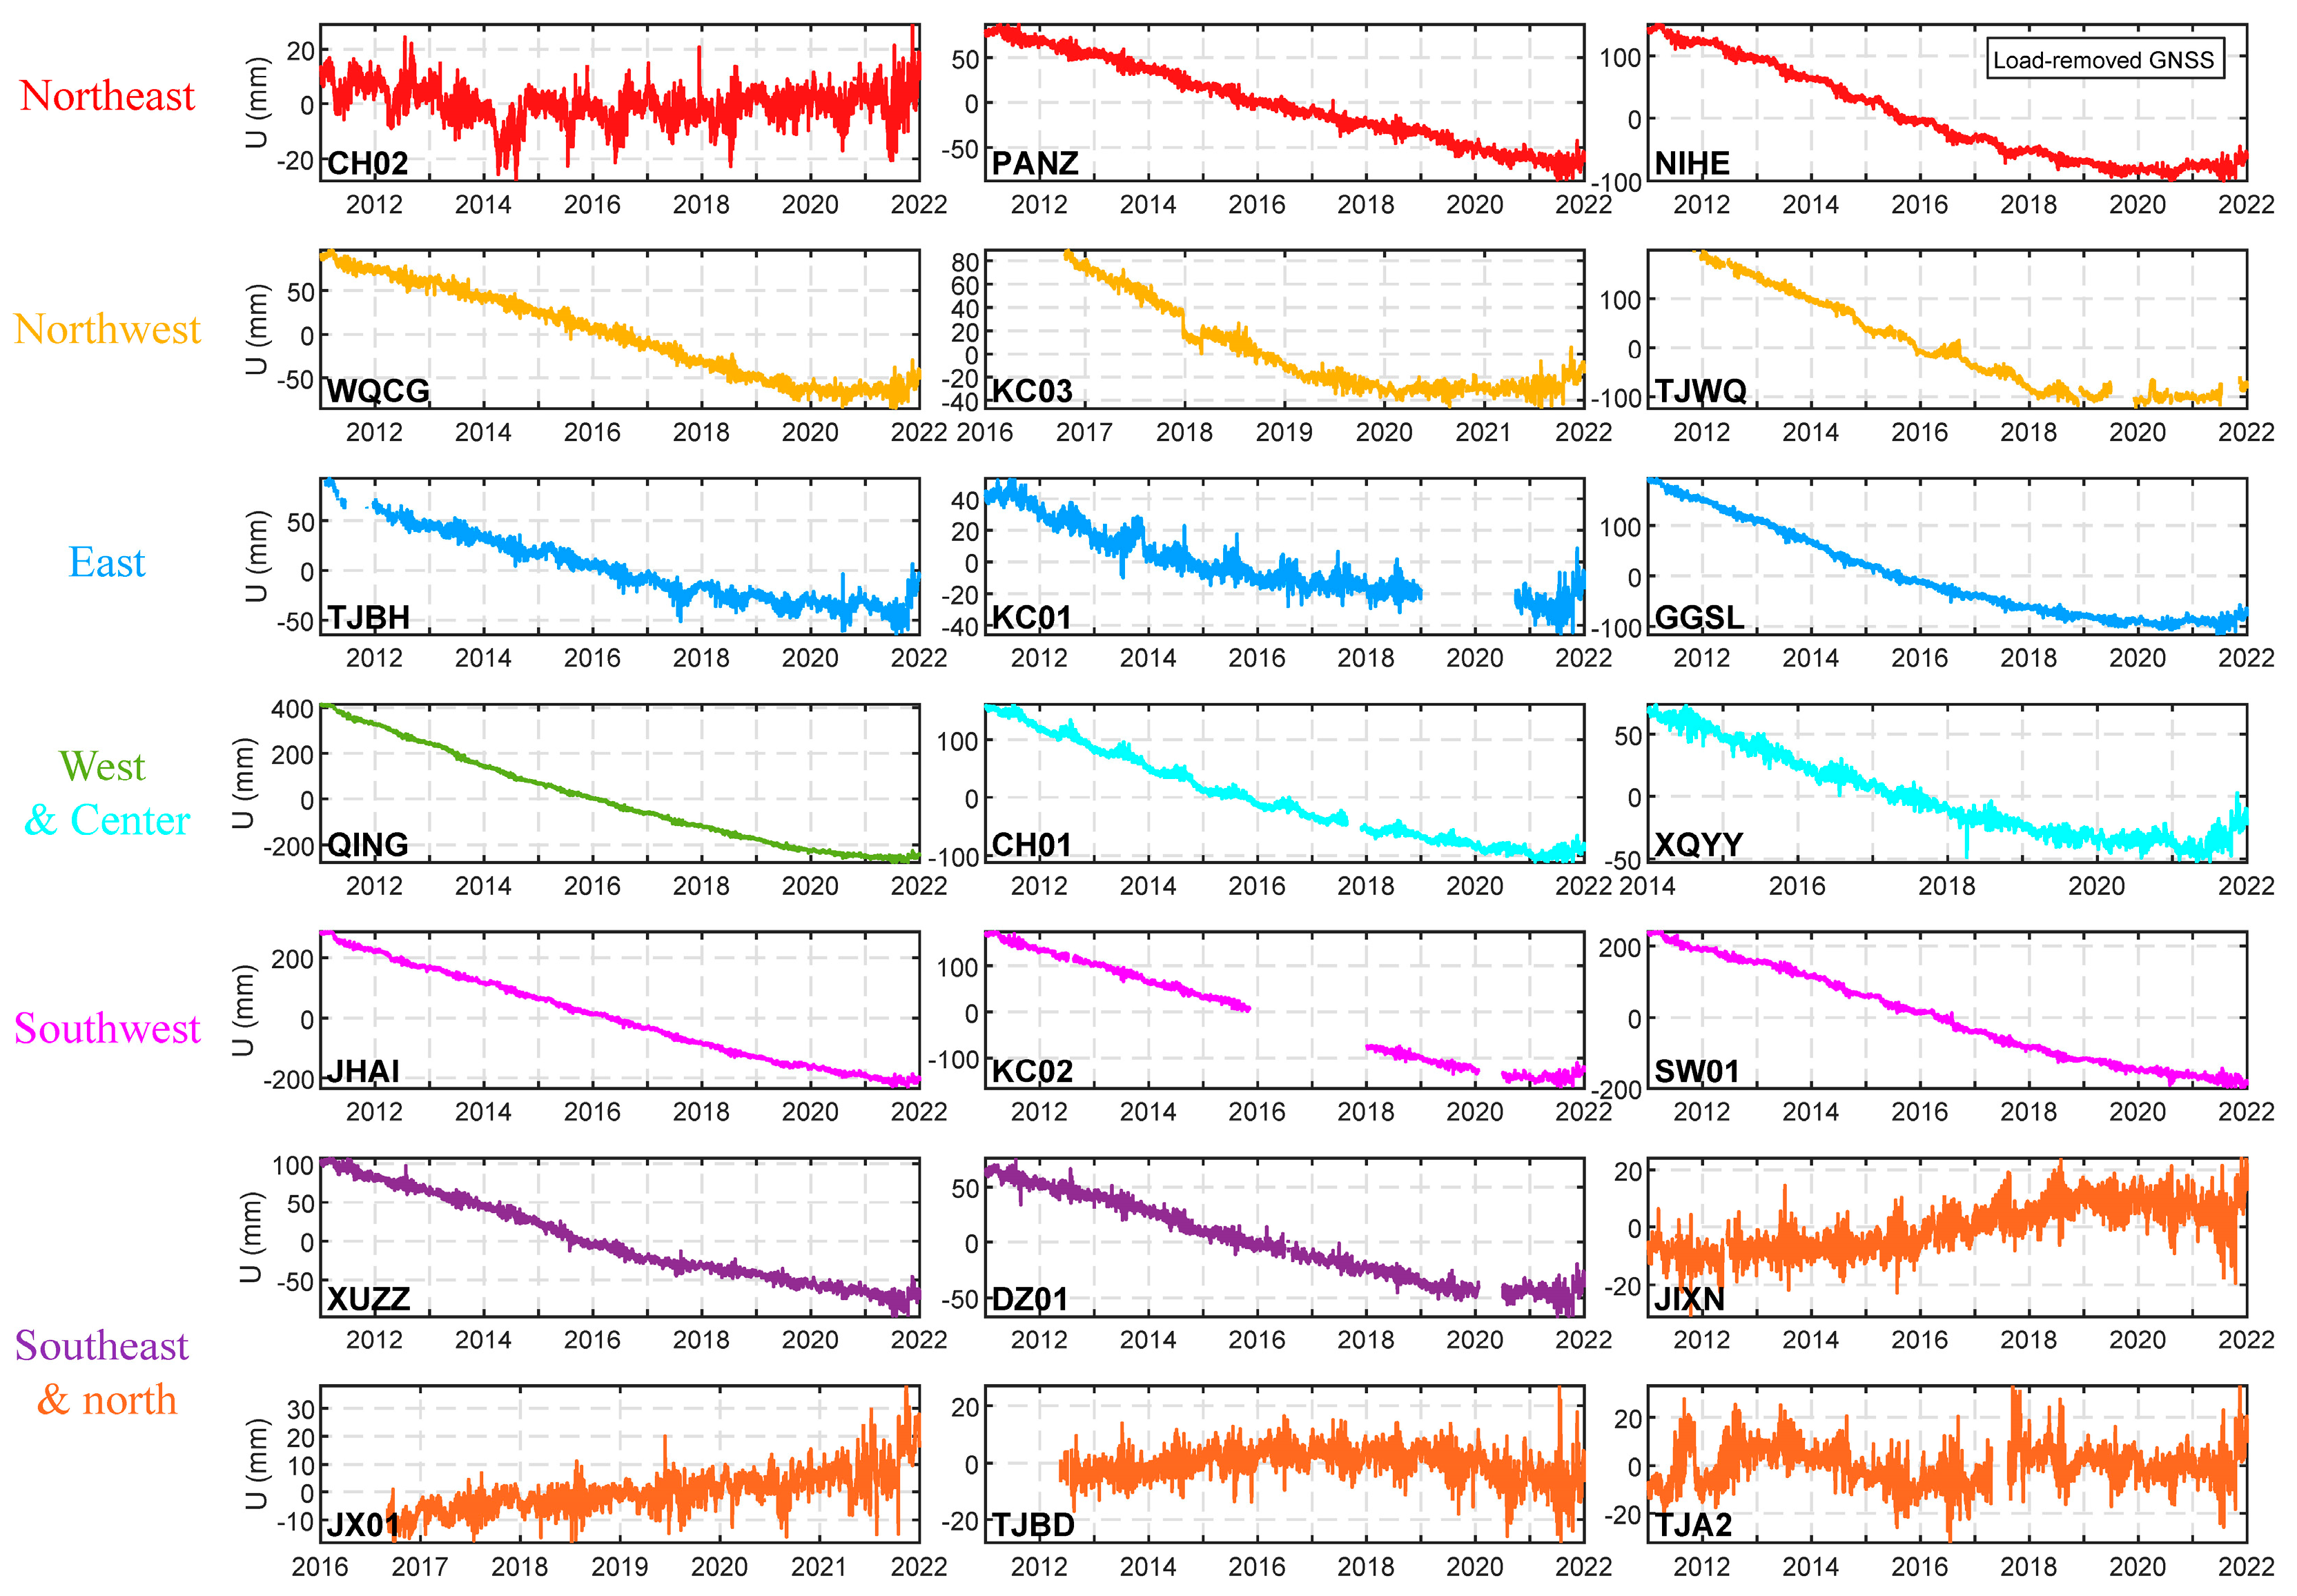
4.1. Crustal Subsidence from GNSS Time Series

To further analyze the vertical deformation across different geographical locations in Tianjin, we present the GNSS vertical displacement time series of 21 stations after applying model corrections in Figure 5. The corrected GNSS time series primarily reflect deformations due to groundwater storage changes. Note that these time series have not been interpolated, and three stations started recording at different times. For example, JX01 and KC03 began recording in late 2016, while XQYY data are available from early 2014. The results indicate that the vertical deformation measured by GNSS does not exhibit subsidence trends at five stations, including CH02, JIXN, JX01, TJA2, and TJBD. Upon examining the geographical locations of these stations, we find that they are situated in northern and northeastern Tianjin, far from industrial and commercial areas. Due to lower population density and groundwater usage compared to other areas, groundwater variations in these regions have not resulted in noticeable subsidence [41]. Although groundwater extraction in Ji County and Baodi District in northern Tianjin is also intense, there is no significant land subsidence due to groundwater extraction mainly in unconfined aquifers [17]. With the ongoing water supply from the South-to-North Water Diversion Project, groundwater in the northern unconfined aquifers can rapidly recover, and some stations in these areas even have a slight uplift due to increased pore pressure, which certainly benefits from gradually decreasing groundwater extraction and abundant rainfall recharge as well, e.g., the record flooding in Northern China in 2021.
In contrast to the above-mentioned stations, the vertical deformation at other stations exhibits non-linear trend changes. In northwestern Tianjin, WQCG, KC03, and TJWQ illustrate land subsidence and show subsidence displacements ranging from 120 mm to 300 mm during the study period. In the central urban area, the CH01 and XQYY stations show total subsidence of 100–200 mm, reflecting that groundwater extraction leads to significant subsidence in the central city [12,26,42]. In western Tianjin, the most severe subsidence is observed at the QING station in Beichen District, indicating that the severe ground subsidence due to groundwater extraction occurred in both western Tianjin and the central city. These findings have been corroborated by previous studies using multi-source observation data [12,26,42]. Stations such as KC02, JHAI, SW01 (located in the southwestern Jinghai District) and XUZZ, DZ01 (located in the southern Binhai New Area) also show notable land subsidence, ranging between 100 mm and 400 mm. In eastern and northeastern Tianjin, the GGLS and NIHE stations display moderate subsidence, showing subsidence around 200 mm. Other stations such as KC01, PANZ, and TJBH exhibit similar behavior, with subsidence magnitudes around 70–140 mm, indicating that groundwater variations in this region cause subsidence at levels between those of the northern and southwestern regions. Interestingly, a noticeable mitigation of subsidence at severely subsiding stations was observed. Stations like GGSL, NIHE, WQCG, and QING significantly slowed down around 2018 and kept markedly steady from 2020 on. This is mainly due to the continuous water supply from the South-to-North Water Diversion Project, which reduces groundwater exploitation [26]. While groundwater levels rise, surface subsidence tends to stabilize because past overexploitation has diminished the water storage capacity and elasticity of deep confined aquifers [26].
In summary, ground subsidence in Tianjin is primarily concentrated in the central, southwestern, and southeastern regions, showing displacements ranging from 200 mm to over 400 mm. Conversely, subsidence in the northern and some eastern regions is relatively minor, with subsidence displacements of only a few tens of millimeters. This suggests that groundwater variations have a relatively small impact on subsidence in these areas. Our research uncovers the evolution history and current state of surface subsidence in Tianjin, emphasizing the importance of localized monitoring and targeted interventions to address ongoing subsidence issues in specific areas.

4.2. Spatial Distribution of Cumulative Subsidence

To demonstrate the spatial differences in subsidence across various GNSS stations, the accumulated displacements and rates recorded by 17 stations with relatively complete time series are shown in Figure 6. The study results indicate that most sites in Tianjin experienced subsidence during the observation period. However, no significant surface subsidence was observed at three stations in northern Tianjin (CH02, JIXN, TJA2). Groundwater extraction in northern Tianjin primarily took place in the unconfined aquifers [26], which allows for rapid replenishment by water transferred from the south and rainfall during wetter years.
The results of the remaining GNSS stations reveal that the accumulated subsidence from the southern part of Ninghe District and Wuqing District southward to the coastal areas at the southernmost tip of Tianjin ranges from approximately −500 mm to −100 mm over the 11 years. Furthermore, individual stations have recorded surface subsidence exceeding −600 mm. The uneven regional subsidence formed subsidence funnels, whose expansion and deepening can lead to the deformation of infrastructure (such as buildings and underground pipelines) and even ground collapses. According to the spatial distribution of cumulative subsidence shown in Figure 6, we can find significant differences in the magnitude of subsidence at three sites (QING, SW01, and NIHE) compared with surrounding stations, corresponding to the Xiqing, Ninghe (Tanggu), and Jinghai subsidence funnels found by previous studies [43,44]. Among these three subsidence funnels, the most severe deformation area is recorded at QING, encompassing parts of Wuqing District, Beichen District, Xiqing District, and the urban center of Tianjin. QING displays a cumulative subsidence of −663 mm, significantly higher than the −431 mm observed at SW01 and the −208 mm observed at NIHE in the other two subsidence funnels, indicating a relatively strong impact from groundwater extraction. In these areas, industrial and agricultural activities are intense, leading to excessive groundwater extraction and severe land subsidence [26]. These permanent, irreversible inelastic deformations occurred as gravel, fine sand, and clay deposits compacted when pore water pressure dropped below the preconsolidation head in the primary aquifers [10].
To provide a clearer depiction of variations in subsidence across different stations, we conducted linear trend analyses for all stations based on Equation (1). The linear subsidence rates (in mm/yr) derived from least squares fitting within the study period are denoted by white font in Figure 6. The subsidence rates of GNSS stations in Wuqing District (WQCG) and southern Ninghe District (PANZ, NIHE) range from −23.0 to −14.4 mm/yr, indicating more severe land subsidence in these northwestern and northeastern areas than that in the northern regions. The western and southwestern areas, including Beichen, Xiqing, and Jinghai Districts, and the central urban area, experience the most severe subsidence, with rates from −60.0 to −20.0 mm/yr. The maximum rate at QING station is −63.8 mm/yr from 2011 to 2021, which records the highest subsidence rate nearly three times higher than surrounding sites like WQCG (−16.0 mm/yr) and CH01 (−24.0 mm/yr), suggesting a severe subsidence funnel due to extensive groundwater extraction. The NIHE station in southern Ninghe District shows a rate of −23.0 mm/yr, higher than adjacent stations CH02 and PANZ, indicating local subsidence funnels in northeastern Tianjin. Stations like DZ01, TJBH, and KC01 along the coast of Binhai New Area show low subsidence rates, which is due to the fact that the eastern and southeastern parts of Tianjin are close to the ocean and have fewer available fresh groundwater resources, so the amount of groundwater extraction in these areas is relatively small. For example, the eastern KC01 station has a subsidence rate of −6.3 mm/yr, lower than the surrounding subsidence. The SW01 station in southwestern Jinghai District records a rate of −41.3 mm/yr, significantly higher than KC02 and XUZZ, highlighting a significant subsidence funnel in the southwest. The results indicate significant subsidence areas in the west and southwest of Tianjin. Although the eastern subsidence rate is not very high, the larger subsidence of the NIHE site still suggests a potential subsidence funnel.

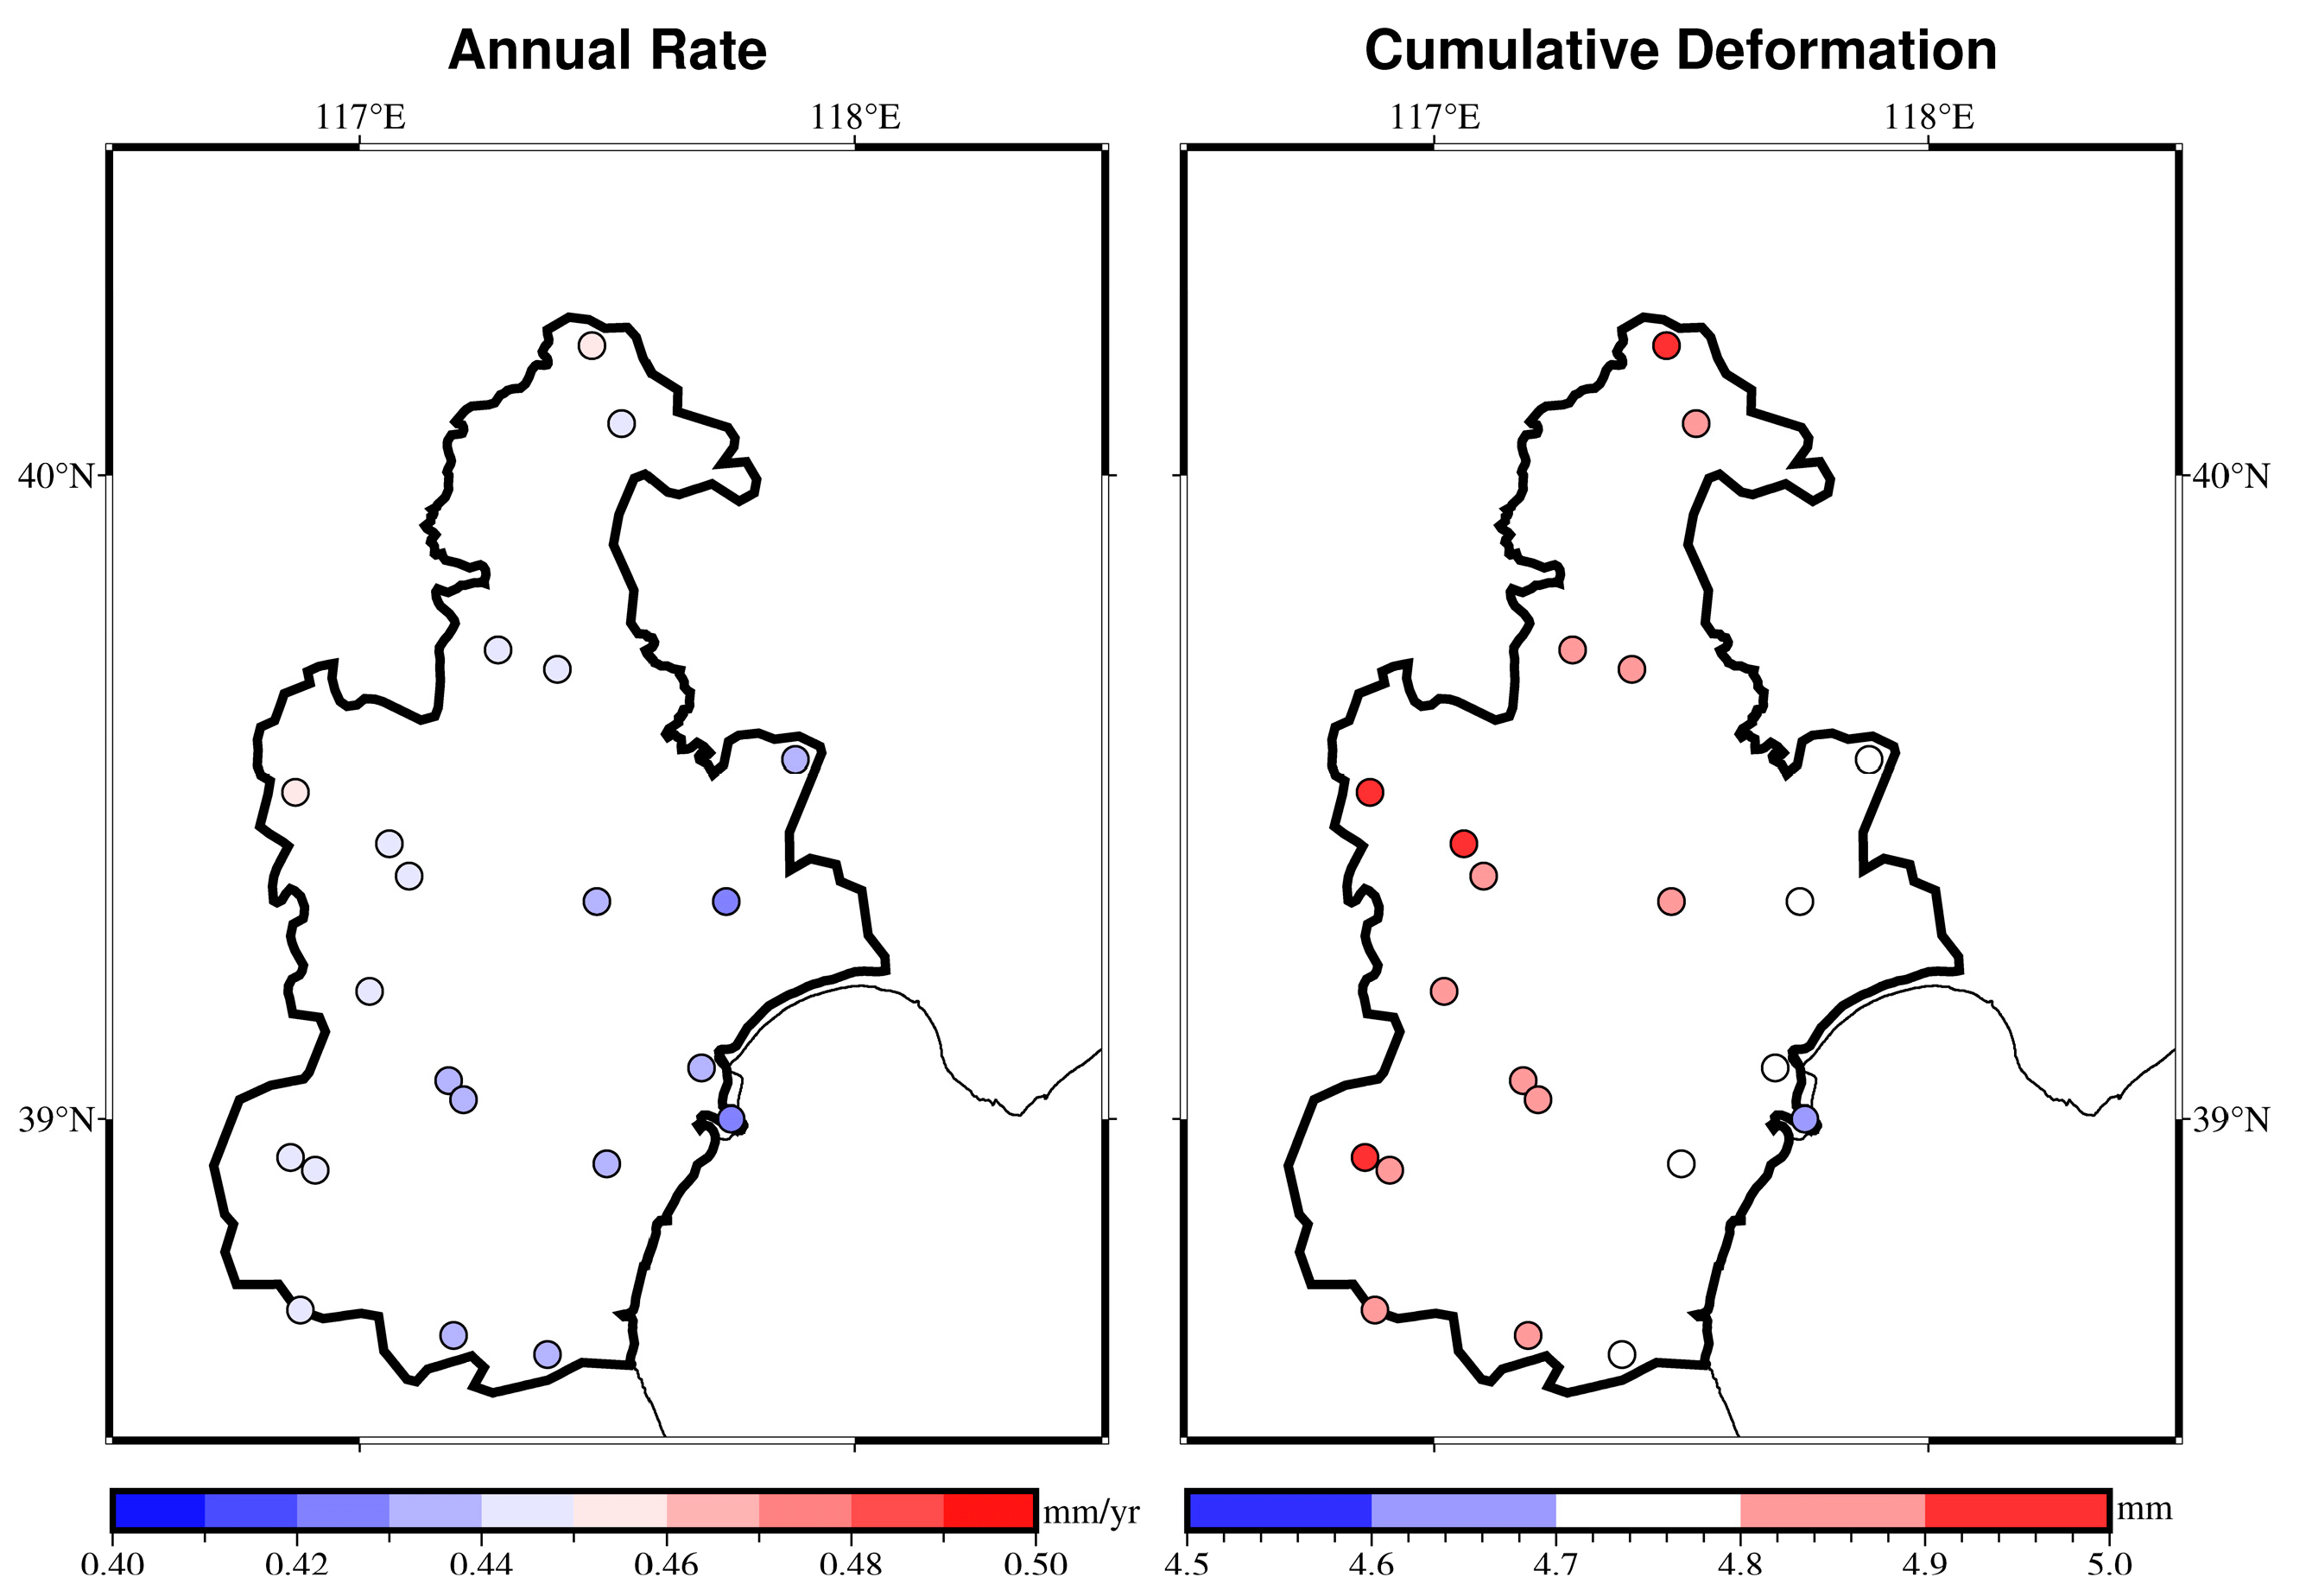
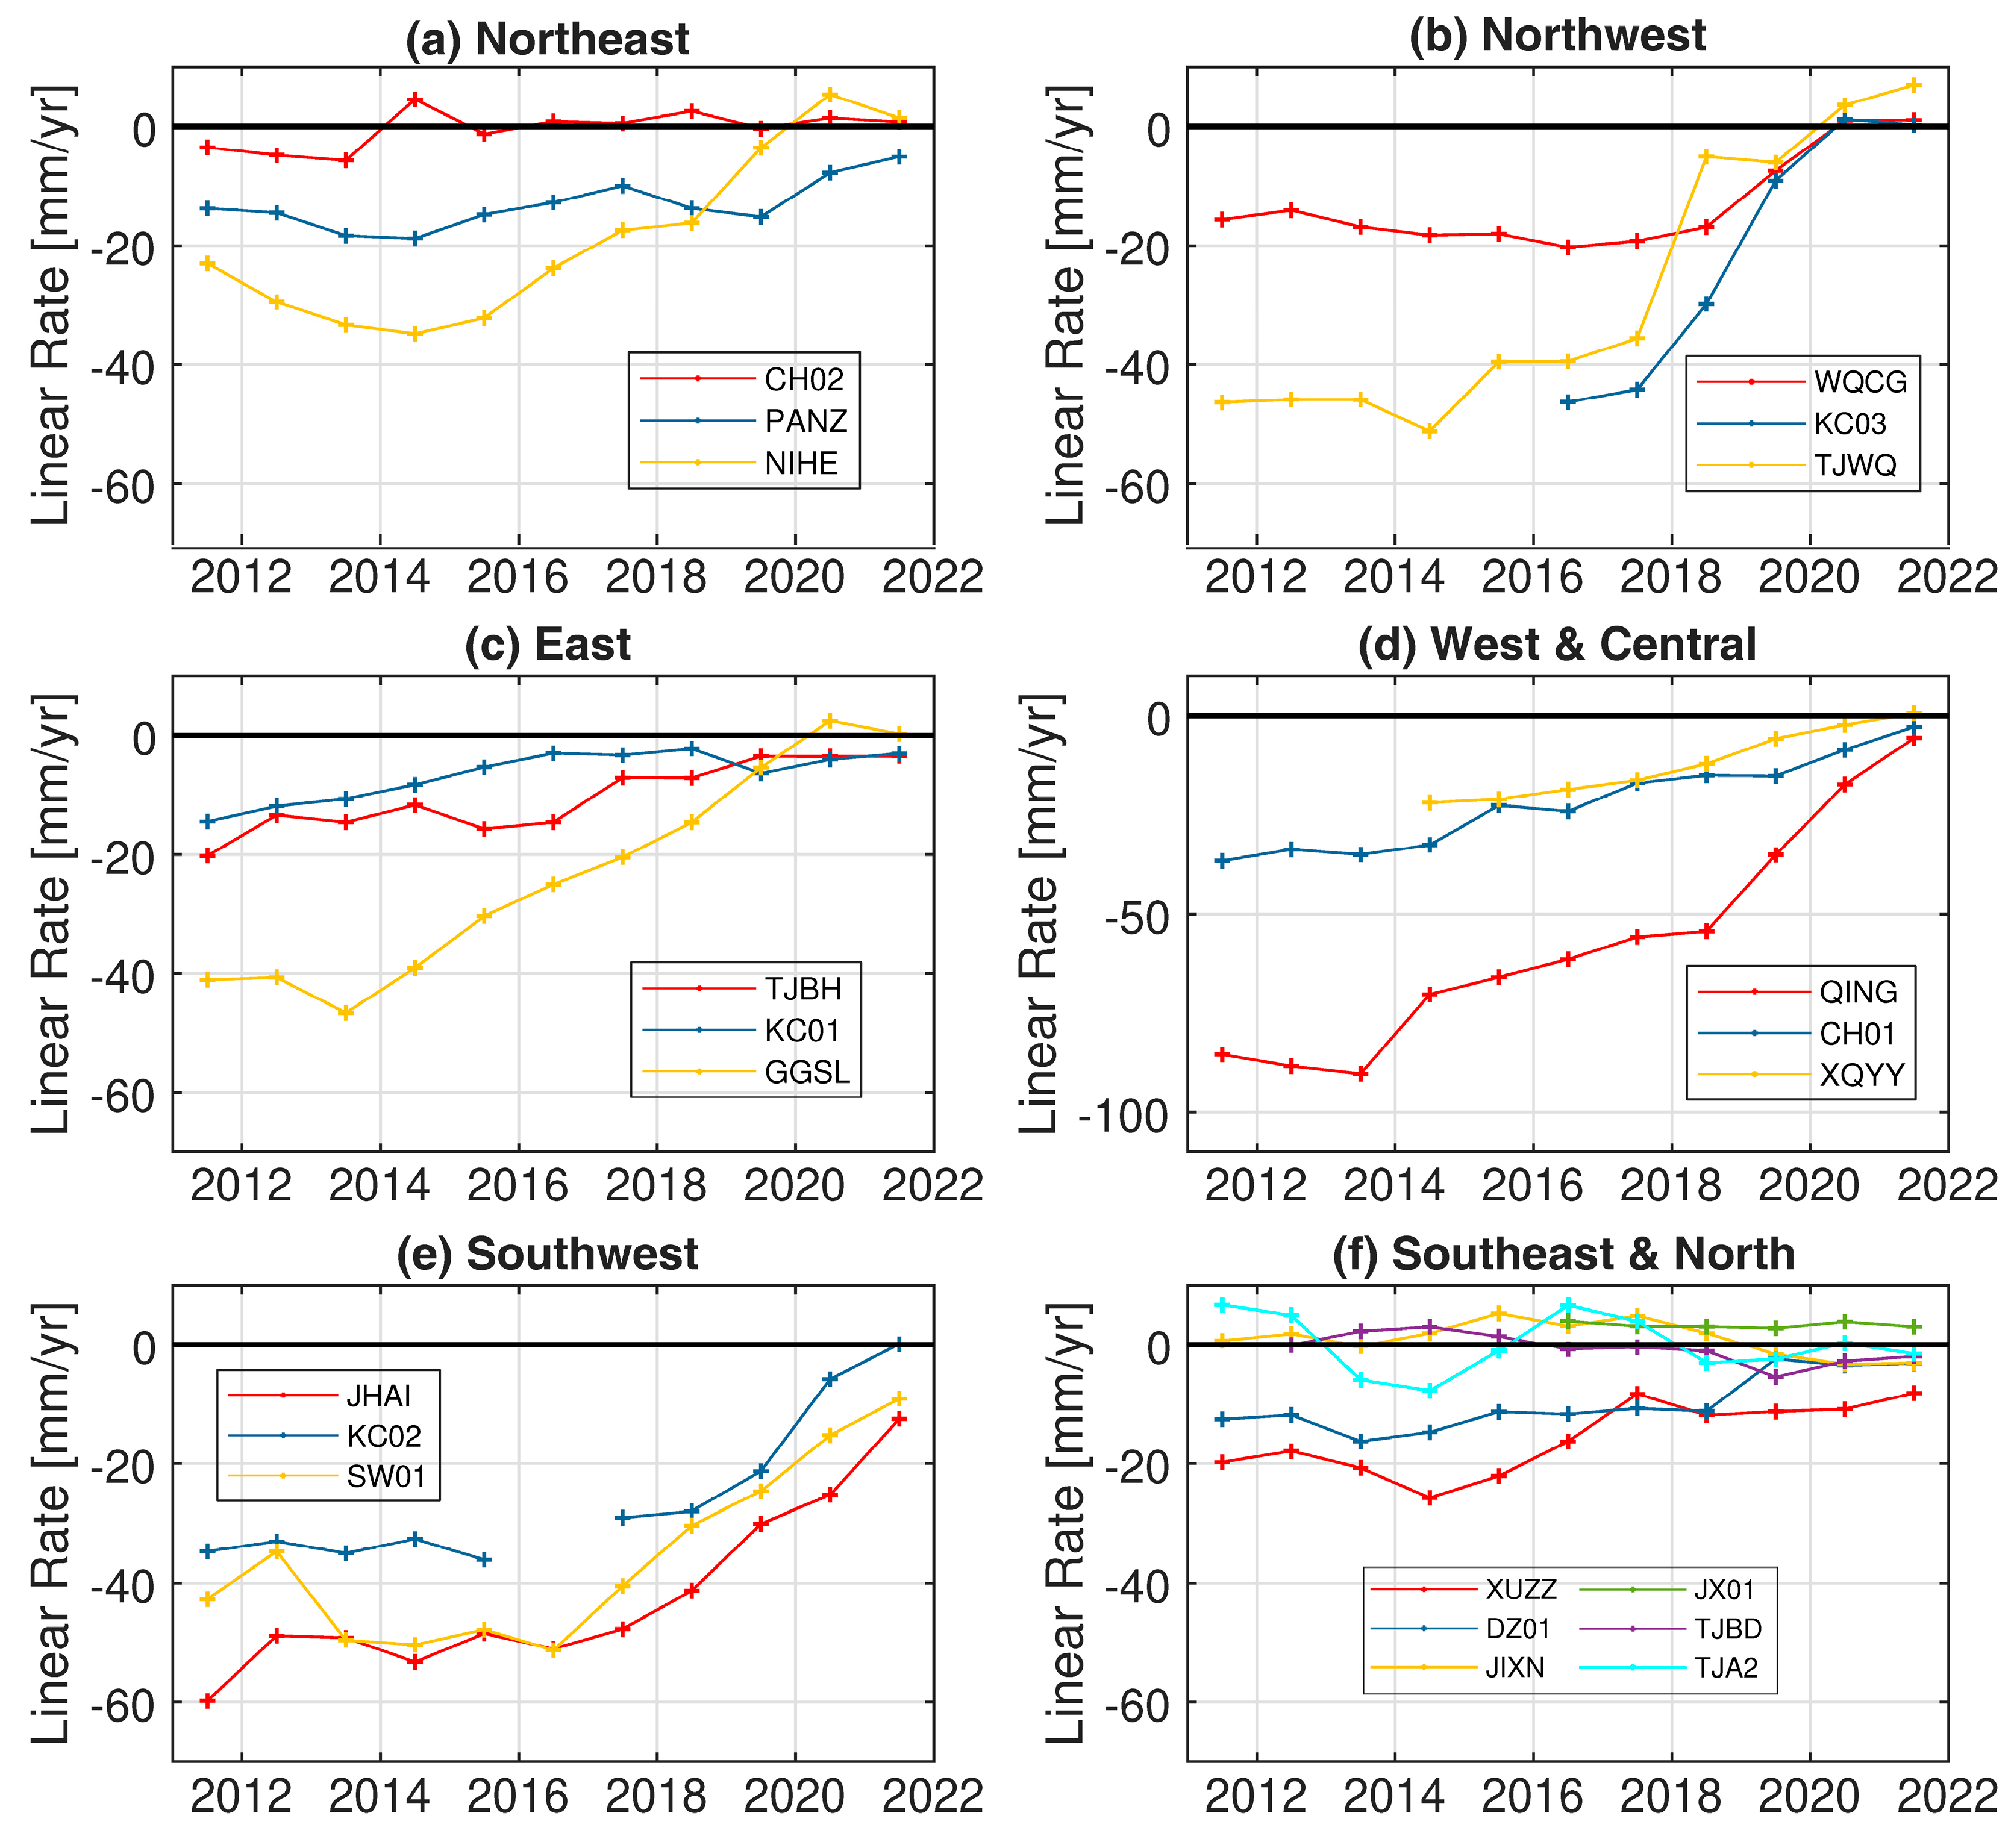
4.3. Deformation Rates during Different Periods

We calculate the subsidence rates at nine critical GNSS stations in Tianjin (CH01, DZ01, JHAI, NIHE, PANZ, QING, SW01, TJBH, and WQCG) in Figure 7. These stations were chosen to assess the impacts of the initiation of the Middle Route of the South-to-North Water Diversion Project (December 2014) on subsidence rates. The analysis shows slowing subsidence rates across these stations, particularly after 2018.
Only the subsidence rates at CH01 and QING stations showed a significant decline from 2011–2014 to 2015–2018, with changes of 12 mm/yr and 24 mm/yr, respectively, while the other stations experienced little or no slowdown. Possible reasons for this phenomenon include (1) continued groundwater extraction during the early stages of the water diversion project; (2) a long recovery time for groundwater replenishment in deep aquifers; and (3) the lag effect of deformation relative to groundwater levels explained by the physical consolidation mechanism [45,46,47]. Since 2018, the subsidence in most regions of Tianjin has been significantly alleviated. In the northeastern regions, surface subsidence has been significantly mitigated in most areas. The subsidence rates of NIHE and TJBH stations after 2018 significantly decreased to ~4 mm/yr. In comparison, the PANZ showed a modest change of subsidence rate of 2.9 mm/yr between 2011–2014 and 2018–2021, suggesting a smaller impact of the project in the area. In the central and western regions, the stations (CH01 and QING) reduction in subsidence rates exceeded 20 mm/yr, especially at QING, where the reduction reached 52 mm/yr. This may be attributed to the urban management policies and the water gains from the South-to-North Water Diversion Project, which can provide stronger help for the serious over-exploitation of groundwater [48]. In the northwestern regions, the WQCG station experienced an initial increase in subsidence rate after the water diversion but decreased to −7.2 mm/yr after 2018, showing a change of 11.9 mm/yr. It indicates that although the short-term effects of the water diversion project were limited, the long-term impact of the project significantly curbed subsidence issues in Wuqing. In the southwestern regions, the surface subsidence was effectively alleviated, with subsidence rate changes of 19 mm/yr and 17 mm/yr at JHAI and SW01 stations, respectively. The southeast region showed the smallest change rate, with the change at the DZ01 station being 8.2 mm/yr. Interestingly, the subsidence rate at station SW01 in 2015–2018 slightly increased compared with that in 2011–2014. It is very likely due to that a continuous drought period (2013–2014) intensified the exploitation of groundwater in the southwest region, as evidenced by Water Resources Bulletin data that will be discussed in Section 5.3.
The South-to-North Water Diversion Project has caused varying impacts on subsidence rates across Tianjin. Meanwhile, auxiliary comprehensive groundwater management policies in Tianjin (2018) have also played a positive role in groundwater restoration. Overall, subsidence rates have generally slowed down after 2018, but the mitigation effects differ significantly across the northeastern, central, western, and southwestern southeastern regions. The western regions show the most substantial recovery, followed by the central and southwestern regions, while the southeastern region exhibits more moderate mitigation effects. These findings underscore the importance of continuing targeted interventions and enhancing groundwater management to effectively address and mitigate subsidence issues. For example, it is necessary to improve groundwater management policies in the PANZ and SW01 station-located areas, where the subsidence rate is still relatively obvious by the end of 2021, to improve local aquifer health.

5. Discussion

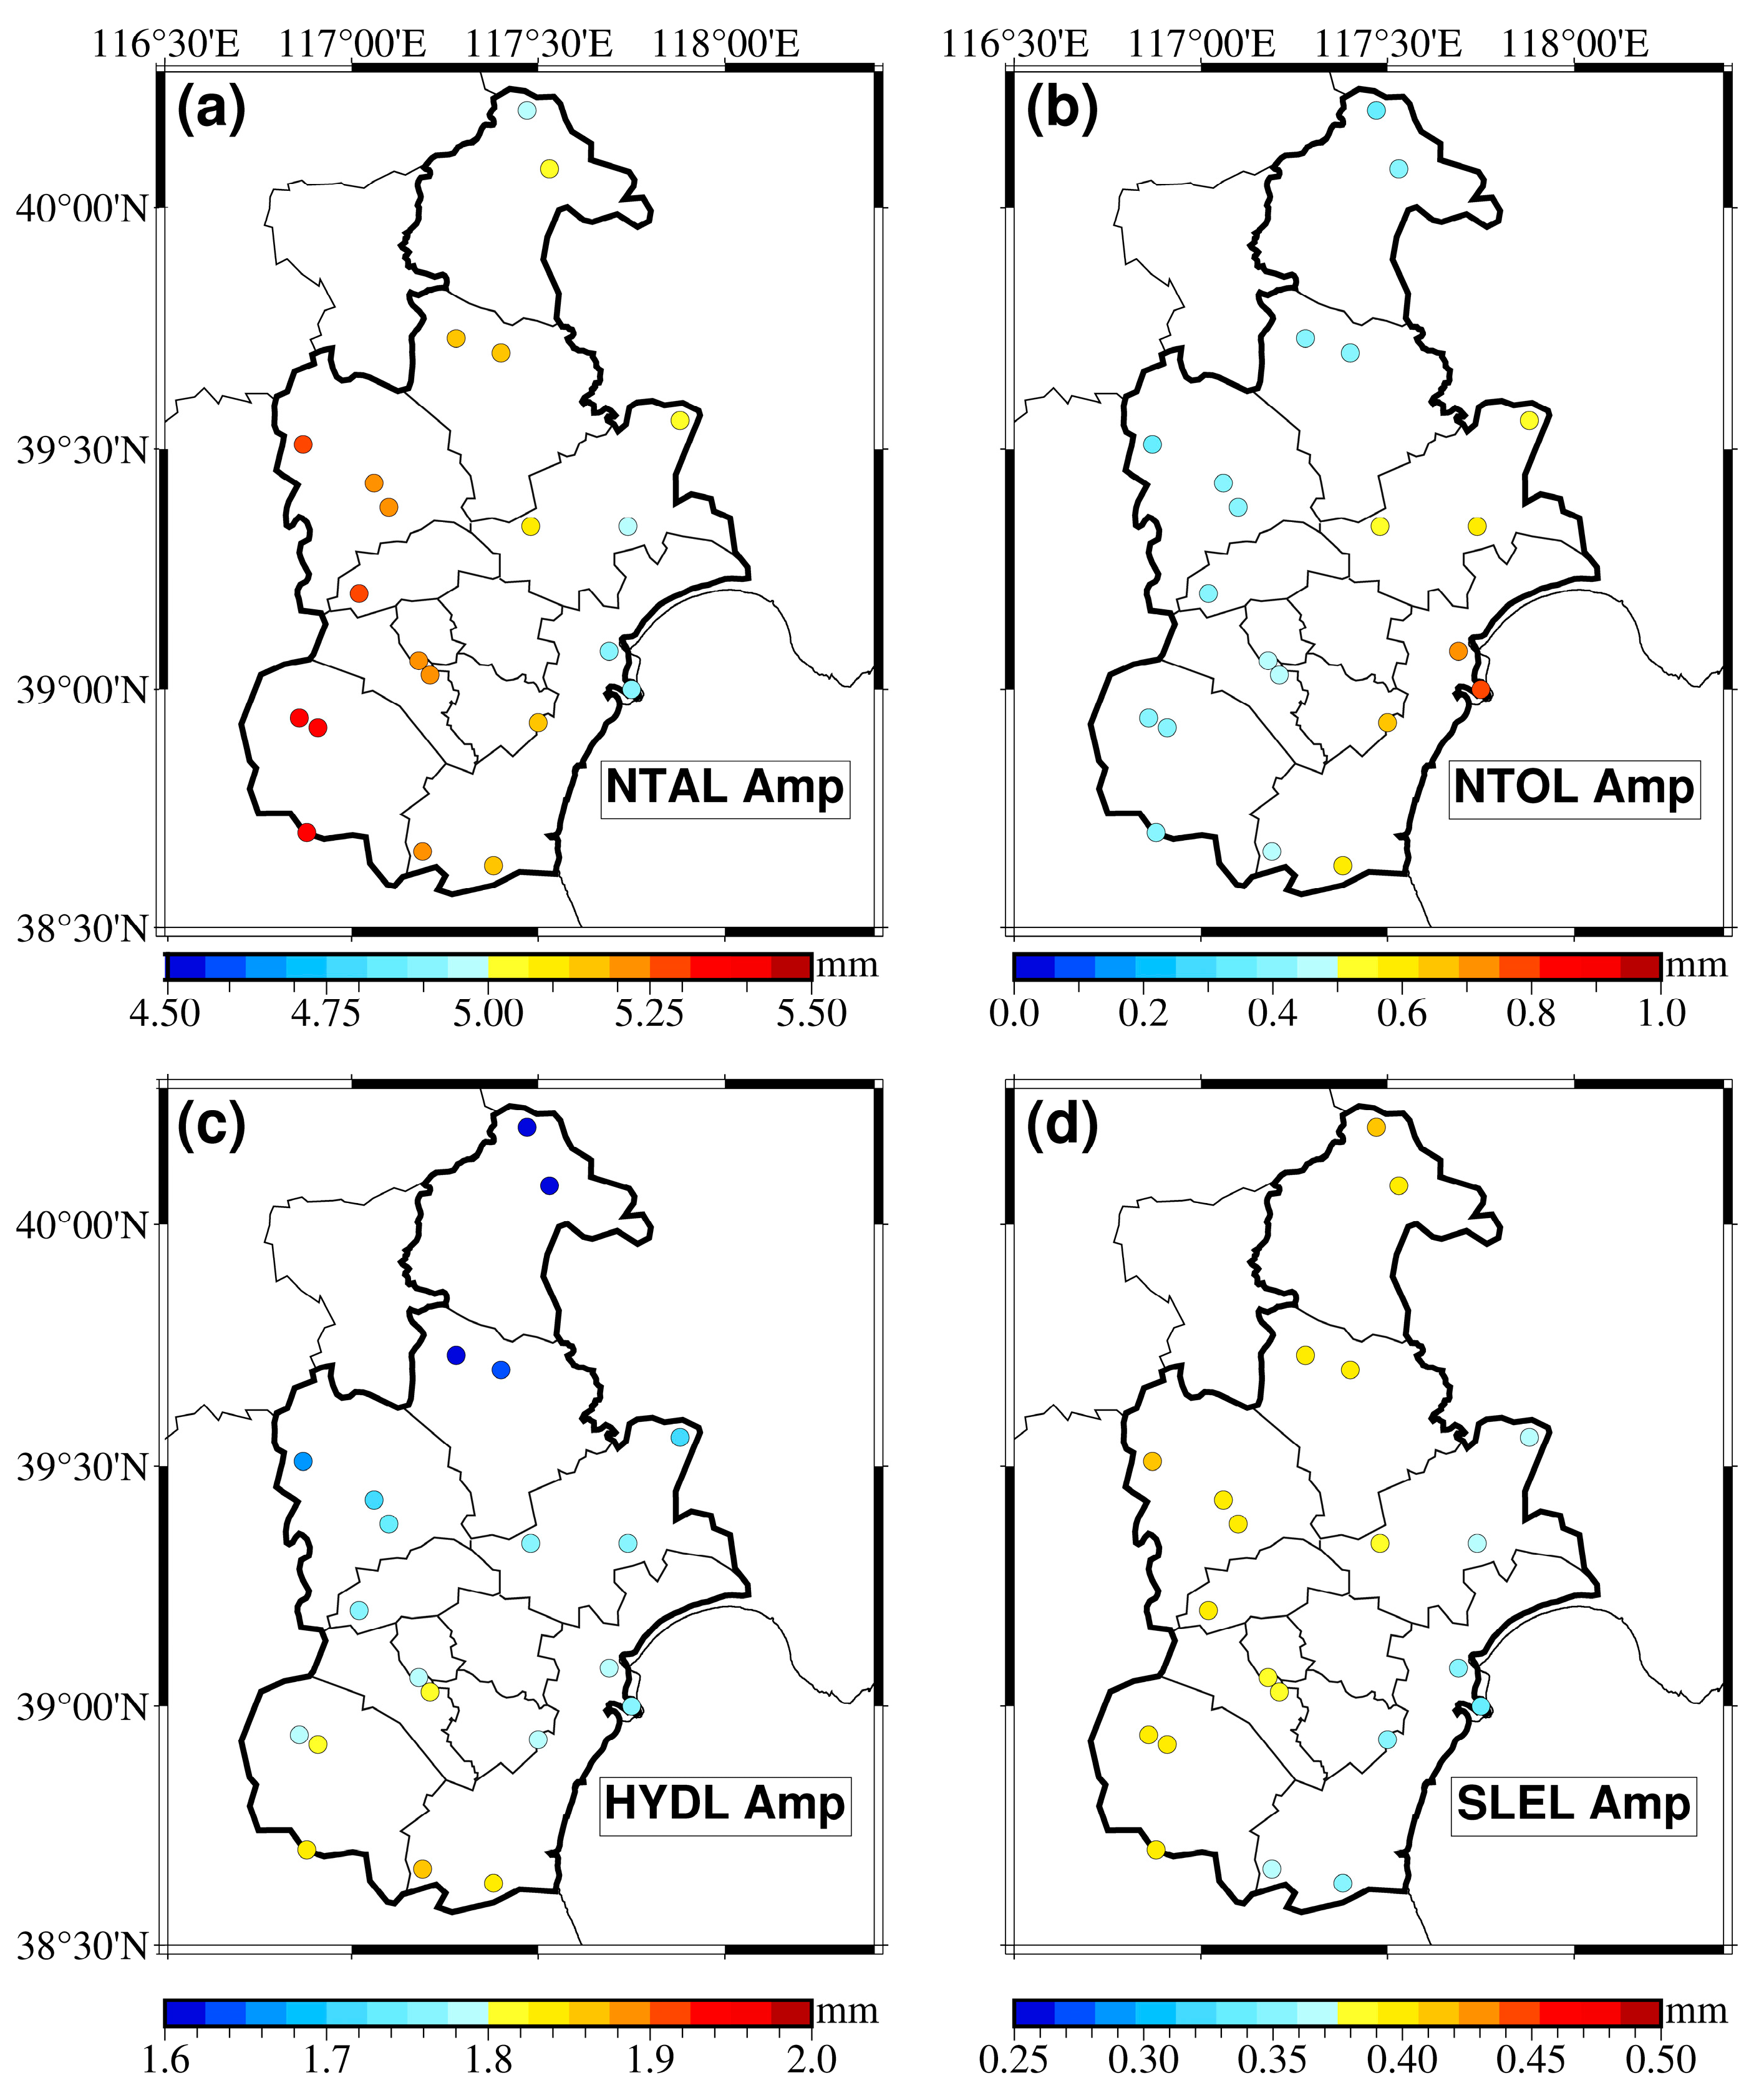
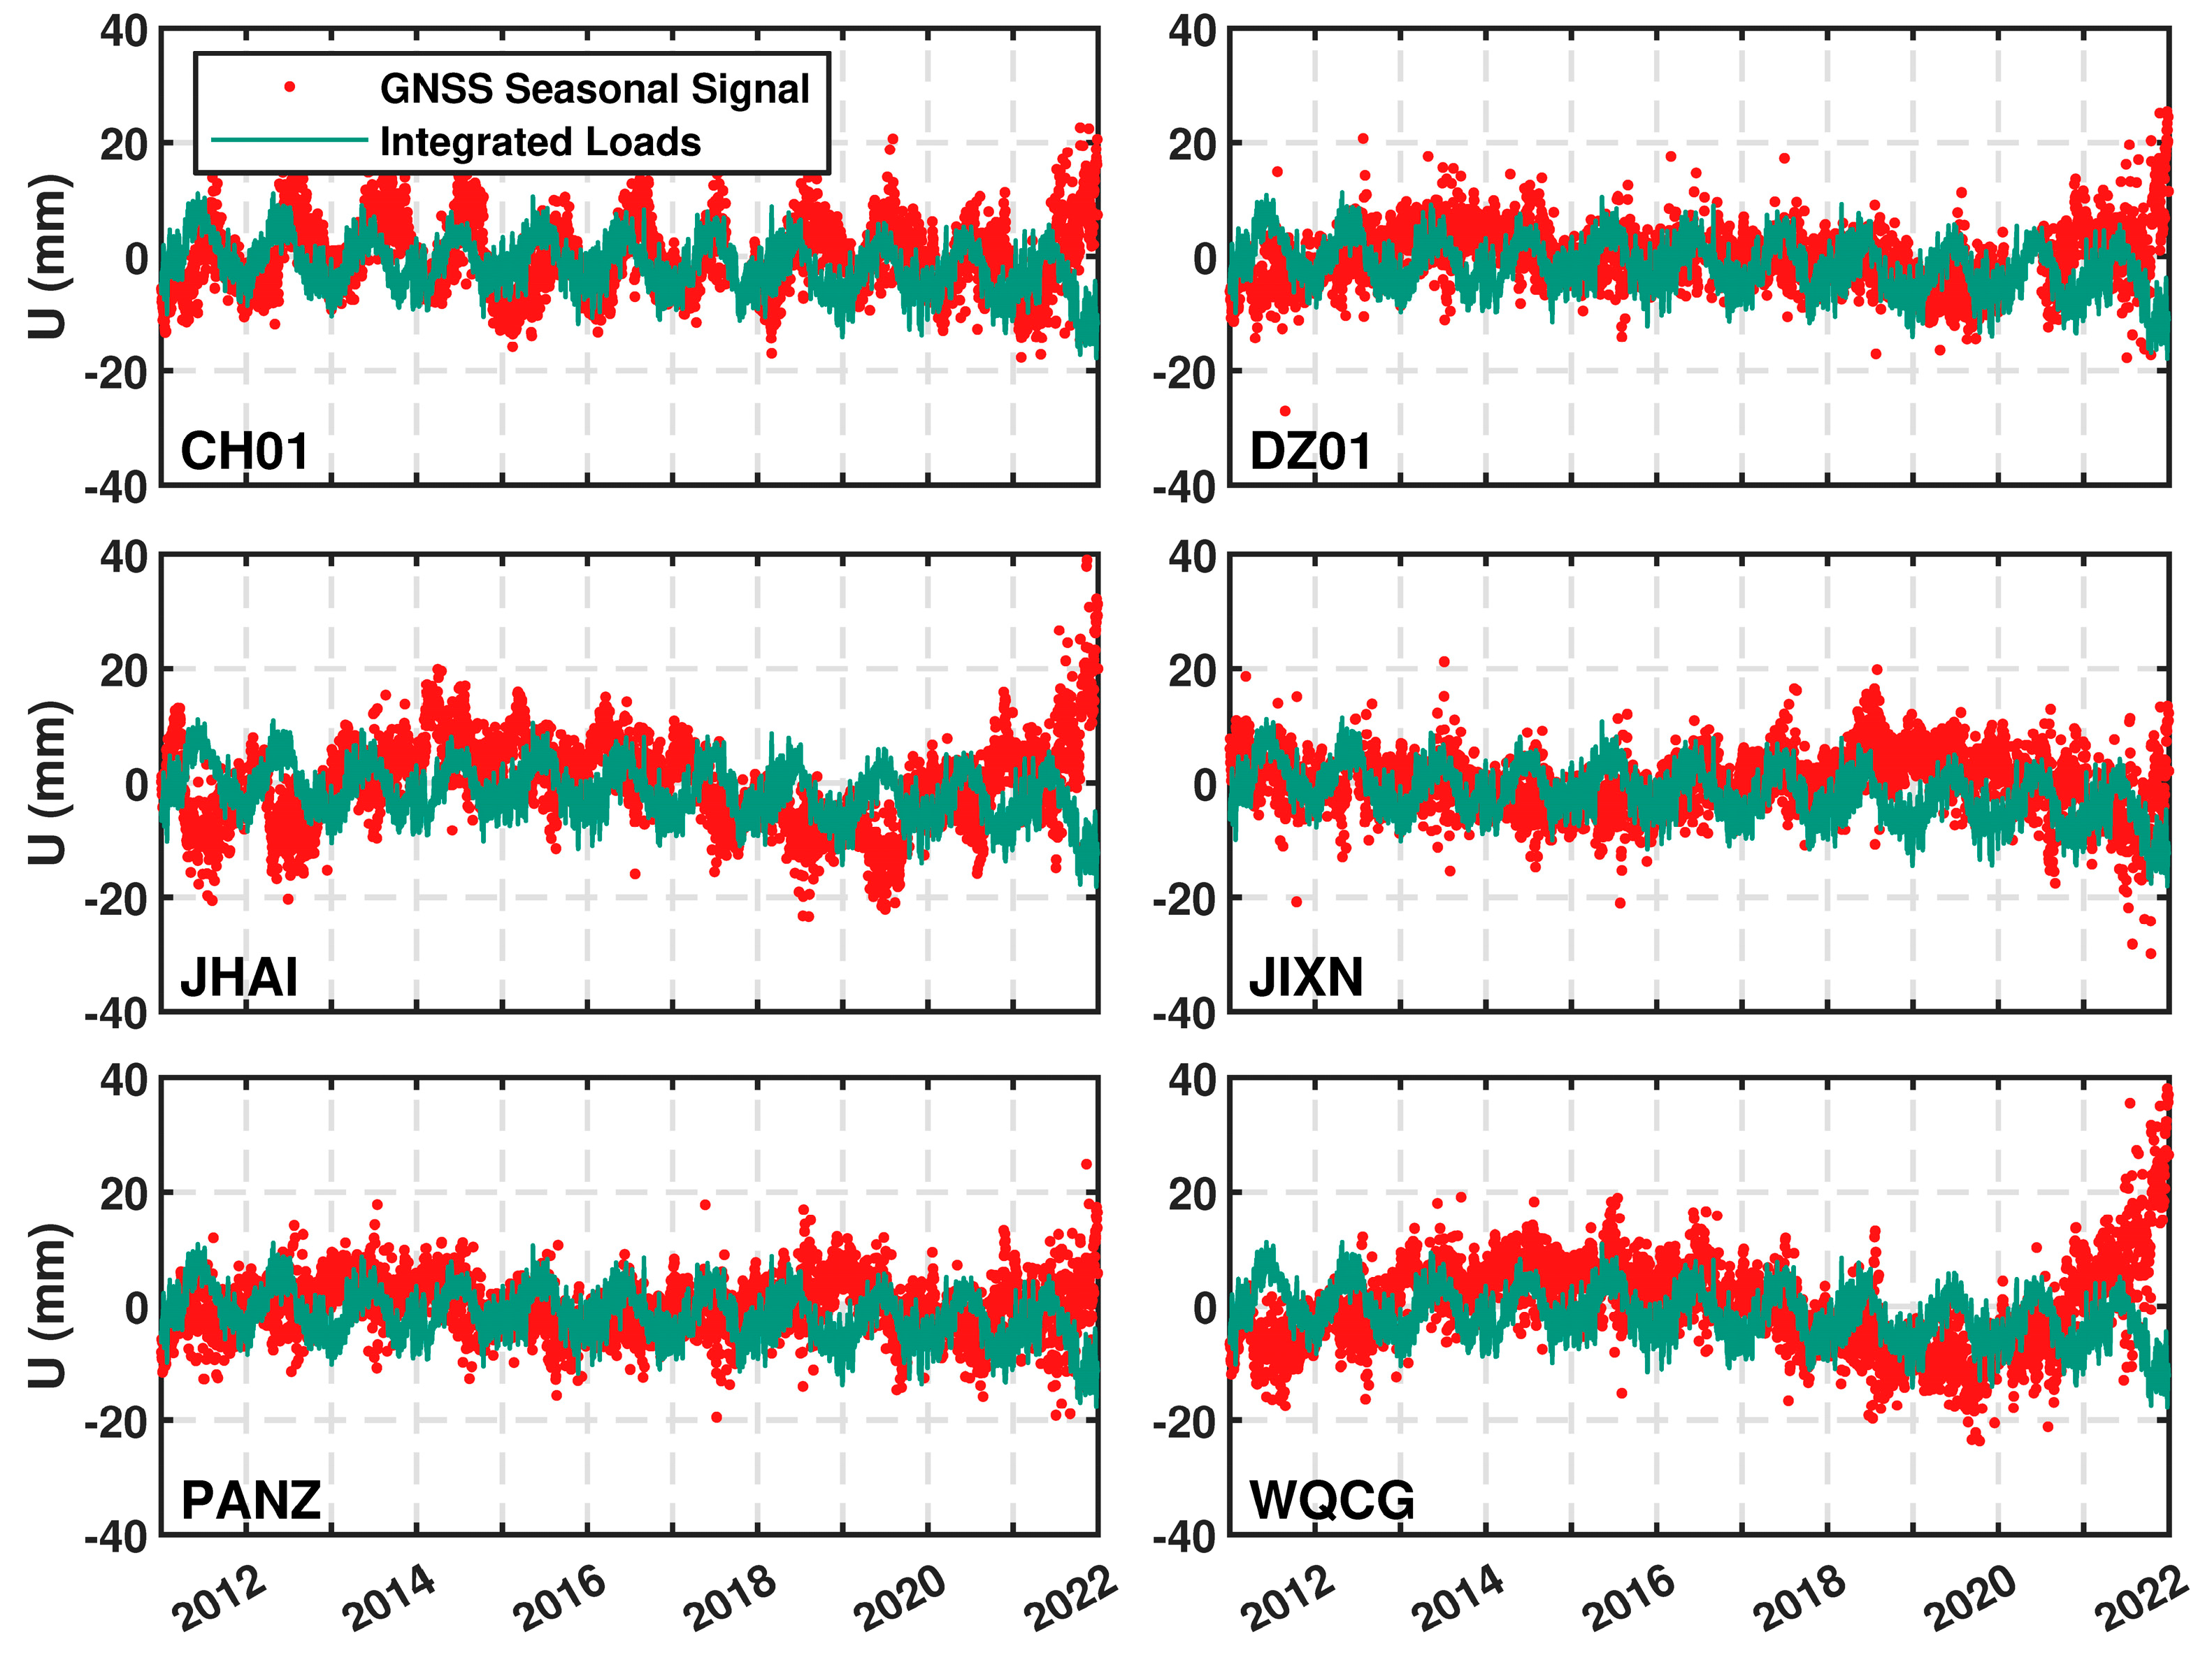
5.1. Impact of Model Predictions on Seasonal Deformation

We analyzed the vertical displacement time series from six GNSS stations (CH01, DZ01, JHAI, JIXN, PANZ, and WQCG) with fewer missing data in Tianjin and investigated the impact of other loadings on the estimation of seasonal deformation caused by groundwater. The deformation of the GIA model is not considered in the integrated loading displacement, because it features a linear trend. The GNSS seasonal signals were extracted based on least squares regression. A comparison of the annual amplitudes of corrected GNSS seasonal signals and integrated load signals at these stations demonstrates the substantial influence of load models on seasonal deformation (Figure 8). For instance, in the central regions, the CH01 station shows the amplitudes of uncorrected GNSS data, and the integrated load model are 8.7 mm and 4.7 mm, respectively. When the load model predictions are deducted, the annual amplitude of the GNSS seasonal signal decreases to 5.9 mm. In the southeastern and southwestern regions, the DZ01 and JHAI stations exhibit the integrated load model’s annual amplitudes of 4.6 mm and 3.3 mm, respectively. The corrected GNSS seasonal signal of the DZ01 station has an annual amplitude of only 0.1 mm, which demonstrates the significant response of the surface to the integrated load. These findings highlight the significant impact of load models on seasonal signals in both the southern coastal region and the heavily subsiding southwestern region of Tianjin. This trend is also observed at the JIXN station, despite its minimal surface subsidence. Further evidence for this finding is provided by the analysis of data from the PANZ and WQCG stations, which are near the JIXN station. In northwestern and northeastern regions, the PANZ and WQCG stations show that the annual amplitude of the corrected GNSS seasonal signal are 1.1 mm and 0.8 mm. In contrast, the integrated load model of those two stations shows annual amplitudes of 4.5 mm and 4.7 mm, respectively.
Therefore, the impact of NTAL, NTOL, SLEL, and HYDL on seasonal deformation caused by groundwater is generally significant. Ignoring these load signals in the analysis may lead to a substantial overestimation or underestimation of groundwater-induced seasonal deformation, thereby affecting the estimation of an aquifer’s hydrogeological parameters, such as elastic skeletal storage coefficients. This underscores the importance of considering and removing the effects of load signals in both surface deformation signal analysis and aquifer model construction to ensure the accuracy and reliability of the results.

5.2. Attribution Analysis of Weakened Subsidence in Different Regions

We analyzed the annual linear rates of ground movement across various regions in Tianjin. Initially, we applied least squares regression (see Section 3.3) to the data, isolating and removing the seasonal component of the jump- and model-corrected time series. To minimize high-frequency noise in the residual time series, we implemented a 4-degree Butterworth filter. Finally, we recalculated the annual linear rates using a two-year sliding window to ensure robust estimates. Figure 9 provides a detailed illustration of the linear rate variations across these 21 stations. Note that the black horizontal lines in Figure 9 mark the boundary between positive (uplift) and negative (subsidence) rates. The results reveal that all stations (except JIXN, TJBD, and TJA2 in Figure 9f) with long-term subsidence experienced a slowdown in subsidence rates in recent years.
Three stations in the northeastern part of Tianjin recorded a deceleration in ground subsidence. Station NIHE features a significant settlement reduction compared to the other two stations (PANZ and CH02). Specifically, Station CH02, located in an area with no significant settlement [10], experienced a subtle transition from weak subsidence (−4 mm/yr) to approximate stability (~0 mm/yr) (Figure 9a). This change is primarily attributed to the poroelastic expansion resulting from groundwater recharge, in accordance with Terzaghi’s effective stress principle [49]. The rapid decline in subsidence rates, particularly for the northwestern stations KC03 and TJWQ (Figure 9b), indicates significant benefits from the South-to-North Water Diversion Project. Moreover, the rates at these two stations are nearing zero after early 2020, indicating that groundwater levels have stabilized and ground subsidence has ceased. In the eastern area (Figure 9c), the initial subsidence rate at coastline stations TJBH and KC01 was relatively minor (<−20 mm/yr), likely due to the limited groundwater availability in coastal regions. In contrast, the inland station GGSL experienced significant subsidence in the early stages. By 2020, all three stations in eastern Tianjin stabilized, indicating local groundwater exploitation had been effectively addressed. A significant subsidence funnel has formed in the central-western region as a result of extensive agricultural irrigation and industrial water use. Notably, at the center of the funnel, the QING station experienced a subsidence rate of approximately −85 mm/yr at the beginning of 2011 (Figure 9d). The subsidence rate at QING has decreased more rapidly than at CH01 and XQYY, especially after 2018. It suggests that the water diversion project is gradually reducing reliance on groundwater for water supply, allowing deep groundwater to slowly replenish. Previous studies have shown that deep groundwater levels began to rebound around 2018 [26]. The southwestern region also exhibits distinct subsidence but is weaker than the western QING station. All three stations (JHAI, SW01, and KC02) exhibited high subsidence rates before the implementation of the water diversion project but showed a slight or nearly zero subsidence rate by the end of our study period (Figure 9e). According to previous studies [26], groundwater levels in the southwest region began to rise around 2020, leading to a significant reduction in surface subsidence thereafter. This aligns with hydrogeological principles, which indicate that surface deformation typically lags behind changes in groundwater levels [10,46,50]. The four northern stations (JIXN, JX01, TJBD, and TJA2) exhibit only minor rate changes (Figure 9f), which are associated with shallow groundwater discharge and recharge in unconfined aquifers in the northern region [26].
In general, these findings align with previous studies, which have demonstrated widespread groundwater recharge due to the continuous water supply from the South-to-North Water Diversion Project [10,26]. Although the groundwater level has risen, the land has experienced permanent and irreversible subsidence. This is attributed to the over-extraction of the confined aquifer, resulting in a permanent reduction in porosity and the inability to restore the original water volume, consistent with the consolidation behavior of the aquifer [45,46,47,50].

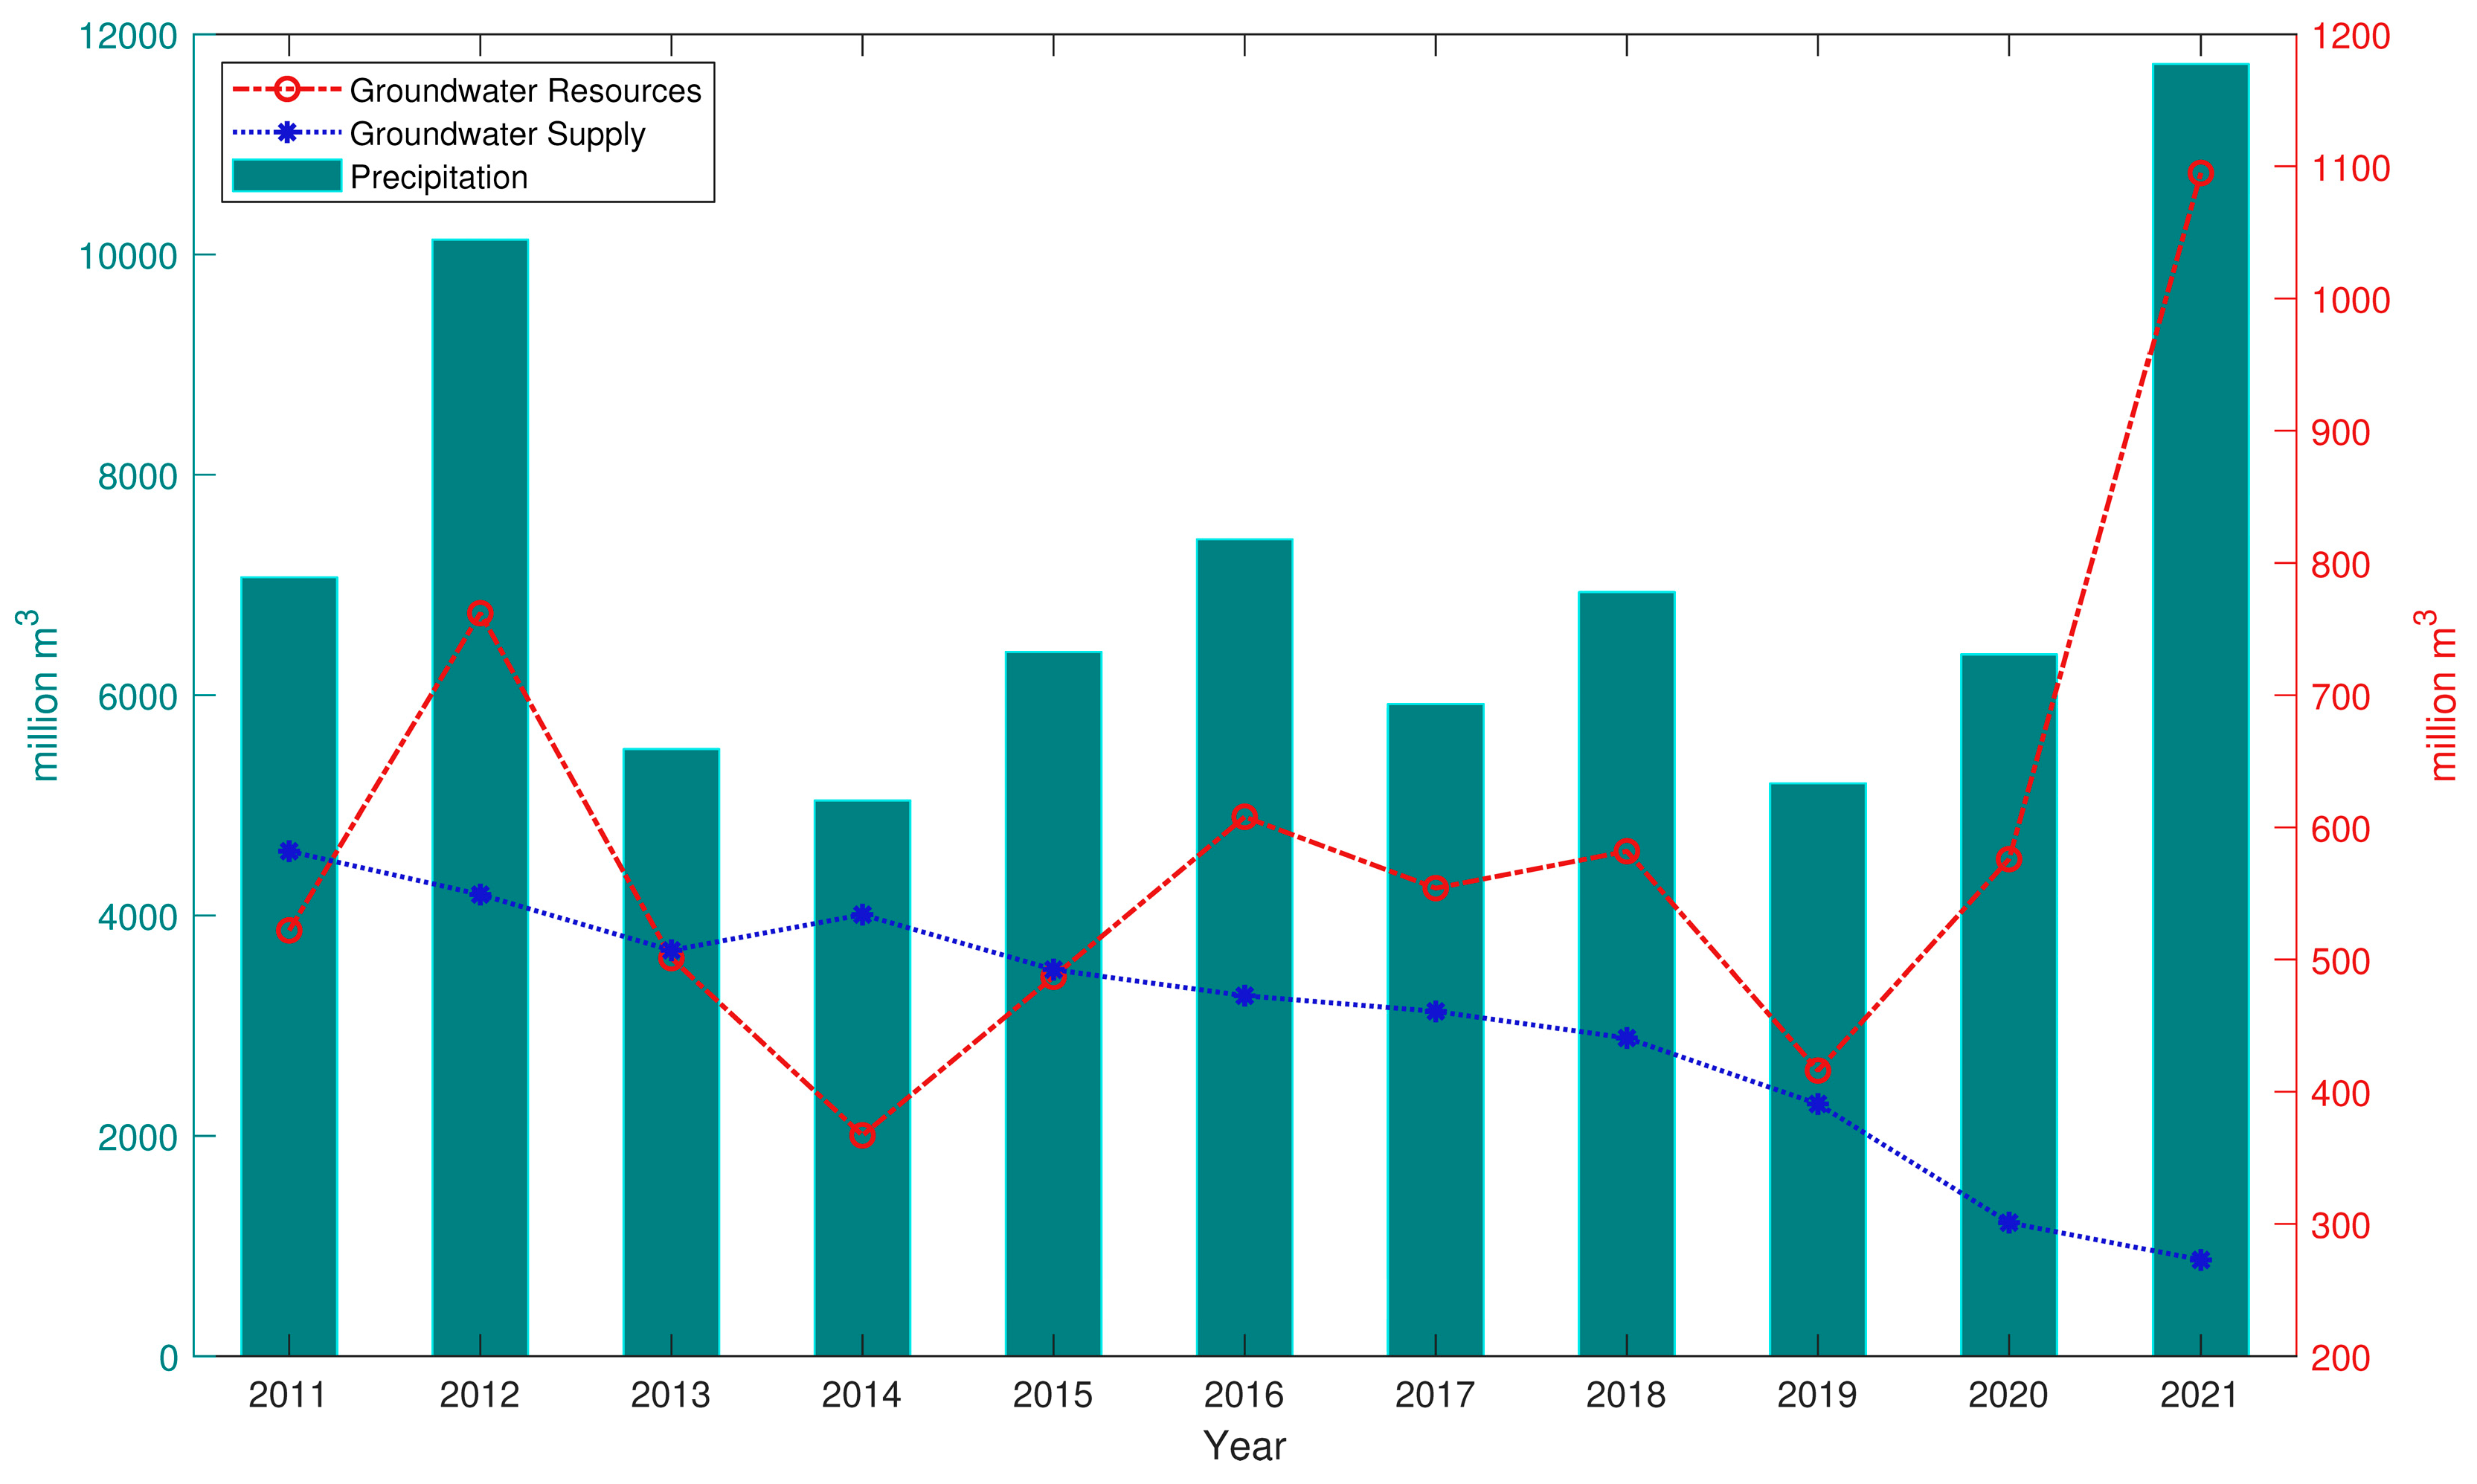
5.3. Relationship between Groundwater Resources and Subsidence

The alleviation of subsidence areas in Tianjin is largely attributed to the continuous water supply from the South to North Water Diversion Project, as evidenced in numerous studies [10,26]. The annual groundwater resource volume and supply volume from 2011 to 2021 are shown in Figure 10 to investigate the relationship between groundwater resources and surface subsidence. From 2011 to 2015, there was a significant gap between groundwater resource volume and supply volume, with the resource volume being lower than the supply volume in all years except 2012 (a heavy rainstorm that had a significant impact on Beijing, Tianjin, and Hebei occurred in that year). After peaking in 2012, the groundwater resource volume showed a declining trend, while the supply volume remained relatively stable, between 500 and 600 million cubic meters. During this period, most stations (NIHE, TJWQ, GGSL, SW01, JHAI, QING, XUZZ, DZ01, and TJA2) exhibited increased subsidence rates, reflecting the issue of land subsidence caused by excessive groundwater extraction. Since 2015, the implementation of the South-to-North Water Diversion Project significantly recharged the groundwater resource situation in Tianjin. The groundwater resource volume began to recover, reaching another peak in 2016, while the supply volume remained relatively stable with a slight decline. During this period, the subsidence trends at most stations are moderated or stabilized. For example, the subsidence at NIHE mitigated, and the rates at QING slowed down, indicating the positive impact of the water diversion project in supplementing groundwater resources and mitigating land subsidence. From 2018 to 2021, the settlement rate of most stations has significantly slowed down or even stabilized, due to the continuous water supply from this project and reduced groundwater supply after the implementation of the comprehensive groundwater over-extraction control plan in Tianjin. Notably, the total groundwater resources in Tianjin showed a significant decline in 2019. According to the Tianjin Water Resources Bulletin, the city’s rainfall in 2019 was approximately 24% below the multi-year average, categorizing it as a relatively dry year. However, there was no additional depletion of groundwater resources despite this reduction. By the end of 2020, the annual groundwater extraction volume had decreased from 1.038 billion cubic meters in the early 1980s to 301 million cubic meters, with the area of severely over-extracted groundwater reduced by 393 km2. The overall deep groundwater level in the city showed stability and an upward trend [51]. The groundwater resource volume increased significantly after 2019, peaking at 1000 million cubic meters in 2021, while the supply volume showed a decreasing trend, indicating controlled and optimized groundwater usage.
Therefore, the South-to-North Water Diversion Project, which ensures a continuous water supply and significantly reduces the need for groundwater extraction, plays a crucial role in mitigating surface subsidence in Tianjin. Moreover, the implementation of a comprehensive groundwater over-extraction control plan in 2018 has also positively contributed to curbing excessive groundwater exploitation. Starting around 2020, as the long-term supply of groundwater resources significantly increased while expenditures decreased, some stations in the subsidence areas of Tianjin exhibited a slight uplift trend. This indicates that these management measures, including initiatives like water diversion projects and water management policies, have successfully ensured the sustainable use of groundwater and prevented further land subsidence.

6. Conclusions

This study analyzes vertical displacement time series from 21 GNSS stations in Tianjin, isolating deformations attributable to HYDL, SLEL, NTAL, NTOL, and GIA to approximate ground deformations primarily induced by groundwater changes. The evolution history and current state of surface subsidence in Tianjin were uncovered, and attribution analysis of weakened subsidence in different regions was implemented.
Most regions have undergone notable surface subsidence, except for northern Tianjin. No obvious surface subsidence is found in the northern regions, due to groundwater extraction mainly in unconfined aquifers. In contrast, deep groundwater overexploitation in other regions has led to irreversible, non-elastic permanent settlement. Most stations in other areas recorded cumulative subsidence exceeding 100 mm, with the most severe case being over 600 mm at the QING station. After the implementation of the South to North Water Diversion Project in 2014, surface subsidence in affected areas has been alleviated to varying degrees, with most GNSS stations showing significant mitigation around 2018. This delayed relief of surface subsidence has close relations with the time history of groundwater recharge and the lag effect of ground subsidence. The central-western and northwestern parts of Tianjin manifest the fastest recovery from subsidence. Stations such as KC03 and QING have reduced their annual subsidence rates by more than 60 mm/yr. Although subsidence rates are decreasing in the southwest region, significant subsidence is still occurring, with station rates ranging from −20 mm/yr to −40 mm/yr. Surface subsidence in the central, eastern, and southern coastal regions has been effectively alleviated, with the ground remaining stable and showing no further subsidence. Despite the rise in groundwater levels, the land has undergone permanent and irreversible subsidence due to over-extraction of the confined aquifer.
Our findings highlight the critical role of the South-to-North Water Diversion Project in alleviating the chronic water shortage and mitigating long-term surface subsidence in Tianjin. By ensuring a steady water supply, this project significantly reduces the reliance on groundwater extraction. Such initiatives, along with effective water management policies, offer valuable insights for other regions worldwide that are grappling with similar challenges of water scarcity and groundwater overexploitation. In conclusion, this study demonstrates substantial progress in mitigating subsidence in Tianjin and underscores the importance of continued enhancements in groundwater management policies. Ongoing monitoring is crucial for ensuring long-term stability and sustainable development. Future efforts should prioritize sustainable resource management and more effective strategies for preventing subsidence.

Author Contributions

Conceptualization, Z.J.; formal analysis, Z.J., K.Q., M.T. and X.Y.; funding acquisition, Z.J., J.Z. and H.G.; methodology, K.Q.; supervision, Z.J.; writing—original draft, K.Q.; writing—review and editing, Z.J., J.Z., H.G., M.T., X.Y. and J.L. All authors have read and agreed to the published version of the manuscript.

Funding

This research is supported by the Open Fund of Hebei Cangzhou Groundwater and Land Subsidence National Observation and Research Station (No. CGLOS-2023-01).

Data Availability Statement

The GNSS position time series are sourced from the First Monitoring and Application Center, China Earthquake Administration (https://www.eqdsc.com/index.html, accessed by personal communication on 8 June 2022).

Acknowledgments

The JUST software is available at https://geodesy.noaa.gov/gps-toolbox/JUST.shtml. Some figures are generated by using the Generic Mapping Tools (V6.4) software [52].

Conflicts of Interest

The authors declare no conflicts of interest.

References

  1. Feng, W.; Shum, C.; Zhong, M.; Pan, Y. Groundwater Storage Changes in China from Satellite Gravity: An Overview. Remote Sens. 2018, 10, 674. [Google Scholar] [CrossRef]
  2. Jia, X.; O’Connor, D.; Hou, D.; Jin, Y.; Li, G.; Zheng, C.; Ok, Y.S.; Tsang, D.C.W.; Luo, J. Groundwater depletion and contamination: Spatial distribution of groundwater resources sustainability in China. Sci. Total Environ. 2019, 672, 551–562. [Google Scholar] [CrossRef]
  3. Gorelick, S.M.; Zheng, C. Global change and the groundwater management challenge. Water Resour. Res. 2015, 51, 3031–3051. [Google Scholar] [CrossRef]
  4. Li, H.; Hou, E. Groundwater dynamic response mechanism and quantity vulnerability assessment under the influence of human activities. Environ. Sci. Pollut. Res. Int. 2020, 27, 22046–22064. [Google Scholar] [CrossRef]
  5. Feng, W.; Zhong, M.; Lemoine, J.M.; Biancale, R.; Hsu, H.T.; Xia, J. Evaluation of groundwater depletion in North China using the Gravity Recovery and Climate Experiment (GRACE) data and ground-based measurements. Water Resour. Res. 2013, 49, 2110–2118. [Google Scholar] [CrossRef]
  6. Hu, X.; Shi, L.; Zeng, J.; Yang, J.; Zha, Y.; Yao, Y.; Cao, G. Estimation of actual irrigation amount and its impact on groundwater depletion: A case study in the Hebei Plain, China. J. Hydrol. 2016, 543, 433–449. [Google Scholar] [CrossRef]
  7. Du, Z.; Ge, L.; Ng, A.H.-M.; Lian, X.; Zhu, Q.; Horgan, F.G.; Zhang, Q. Analysis of the impact of the South-to-North water diversion project on water balance and land subsidence in Beijing, China between 2007 and 2020. J. Hydrol. 2021, 603, 126990. [Google Scholar] [CrossRef]
  8. Yu, L.; Ling, M.; Chen, F.; Ding, Y.; Lv, C. Practices of groundwater over-exploitation control in Hebei Province. Water Policy 2020, 22, 591–601. [Google Scholar] [CrossRef]
  9. Guo, H.; Zhang, Z.; Cheng, G.; Li, W.; Li, T.; Jiao, J.J. Groundwater-derived land subsidence in the North China Plain. Environ. Earth Sci. 2015, 74, 1415–1427. [Google Scholar] [CrossRef]
  10. Yu, X.; Wang, G.; Hu, X.; Liu, Y.; Bao, Y. Land Subsidence in Tianjin, China: Before and after the South-to-North Water Diversion. Remote Sens. 2023, 15, 1647. [Google Scholar] [CrossRef]
  11. Gong, H.; Pan, Y.; Zheng, L.; Li, X.; Zhu, L.; Zhang, C.; Huang, Z.; Li, Z.; Wang, H.; Zhou, C. Long-term groundwater storage changes and land subsidence development in the North China Plain (1971–2015). Hydrogeol. J. 2018, 26, 1417–1427. [Google Scholar] [CrossRef]
  12. Zhao, Q.; Zhang, B.; Yao, Y.; Wu, W.; Meng, G.; Chen, Q. Geodetic and hydrological measurements reveal the recent acceleration of groundwater depletion in North China Plain. J. Hydrol. 2019, 575, 1065–1072. [Google Scholar] [CrossRef]
  13. Liu, R.; Zhong, B.; Li, X.; Zheng, K.; Liang, H.; Cao, J.; Yan, X.; Lyu, H. Analysis of groundwater changes (2003–2020) in the North China Plain using geodetic measurements. J. Hydrol. Reg. Stud. 2022, 41, 101085. [Google Scholar] [CrossRef]
  14. Bai, L.; Jiang, L.; Zhao, Y.; Li, Z.; Cao, G.; Zhao, C.; Liu, R.; Wang, H. Quantifying the influence of long-term overexploitation on deep groundwater resources across Cangzhou in the North China Plain using InSAR measurements. J. Hydrol. 2022, 605, 127368. [Google Scholar] [CrossRef]
  15. Yang, C.; Lu, Z.; Zhang, Q.; Zhao, C.; Peng, J.; Ji, L. Deformation at longyao ground fissure and its surroundings, North China Plain, revealed by ALOS PALSAR PS-InSAR. Int. J. Appl. Earth Obs. Geoinf. 2018, 67, 1–9. [Google Scholar] [CrossRef]
  16. Liu, R.; Zou, R.; Li, J.; Zhang, C.; Zhao, B.; Zhang, Y. Vertical Displacements Driven by Groundwater Storage Changes in the North China Plain Detected by GPS Observations. Remote Sens. 2018, 10, 259. [Google Scholar] [CrossRef]
  17. Lixin, Y.; Fang, Z.; He, X.; Shijie, C.; Wei, W.; Qiang, Y. Land subsidence in Tianjin, China. Environ. Earth Sci. 2010, 62, 1151–1161. [Google Scholar] [CrossRef]
  18. Lu, C.; Zhu, L.; Li, X.; Gong, H.; Du, D.; Wang, H.; Teatini, P. Land Subsidence Evolution and Simulation in the Western Coastal Area of Bohai Bay, China. J. Mar. Sci. Eng. 2022, 10, 1549. [Google Scholar] [CrossRef]
  19. Wang, K.; Wang, G.; Bao, Y.; Su, G.; Wang, Y.; Shen, Q.; Zhang, Y.; Wang, H. Preventing Subsidence Reoccurrence in Tianjin: New Preconsolidation Head and Safe Pumping Buffer. Ground Water 2024. Early View. [Google Scholar] [CrossRef] [PubMed]
  20. Su, G.; Wu, Y.; Zhan, W.; Zheng, Z.; Chang, L.; Wang, J. Spatiotemporal evolution characteristics of land subsidence caused by groundwater depletion in the North China plain during the past six decades. J. Hydrol. 2021, 600, 126678. [Google Scholar] [CrossRef]
  21. Liu, C.; Zheng, H. South-to-north Water Transfer Schemes for China. Int. J. Water Resour. Dev. 2002, 18, 453–471. [Google Scholar] [CrossRef]
  22. Li, M.; Sun, J.; Xue, L.; Shen, Z.; Zhao, B.; Hu, L. Characterization of Aquifer System and Groundwater Storage Change Due to South-to-North Water Diversion Project at Huairou Groundwater Reserve Site, Beijing, China, Using Geodetic and Hydrological Data. Remote Sens. 2022, 14, 3549. [Google Scholar] [CrossRef]
  23. Ye, S.; Xue, Y.; Wu, J.; Yan, X.; Yu, J. Progression and mitigation of land subsidence in China. Hydrogeol. J. 2015, 24, 685–693. [Google Scholar] [CrossRef]
  24. Zhang, C.; Duan, Q.; Yeh, P.J.-F.; Pan, Y.; Gong, H.; Moradkhani, H.; Gong, W.; Lei, X.; Liao, W.; Xu, L.; et al. Sub-regional groundwater storage recovery in North China Plain after the South-to-North water diversion project. J. Hydrol. 2021, 597, 126156. [Google Scholar] [CrossRef]
  25. Yang, W.; Long, D.; Scanlon, B.R.; Burek, P.; Zhang, C.; Han, Z.; Butler, J.J.; Pan, Y.; Lei, X.; Wada, Y. Human Intervention Will Stabilize Groundwater Storage across the North China Plain. Water Resour. Res. 2022, 58, e2021WR030884. [Google Scholar] [CrossRef]
  26. Su, G.; Xiong, C.; Zhang, G.; Wang, Y.; Shen, Q.; Chen, X.; An, H.; Qin, L. Coupled processes of groundwater dynamics and land subsidence in the context of active human intervention, a case in Tianjin, China. Sci. Total Environ. 2023, 903, 166803. [Google Scholar] [CrossRef]
  27. Song, X.-M.; Kong, F.-Z.; Zhan, C.-S. Assessment of water resources carrying capacity in Tianjin City of China. Water Resour. Manag. 2011, 25, 857–873. [Google Scholar] [CrossRef]
  28. Ha, D.; Zheng, G.; Loáiciga, H.A.; Guo, W.; Zhou, H.; Chai, J. Long-term groundwater level changes and land subsidence in Tianjin, China. Acta Geotech. 2020, 16, 1303–1314. [Google Scholar] [CrossRef]
  29. Wu, Y.-X.; Lyu, H.-M.; Shen, J.S.; Arulrajah, A. Geological and hydrogeological environment in Tianjin with potential geohazards and groundwater control during excavation. Environ. Earth Sci. 2018, 77, 392. [Google Scholar] [CrossRef]
  30. Wang, W.; Zhao, B.; Wang, Q.; Yang, S. Noise analysis of continuous GPS coordinate time series for CMONOC. Adv. Space Res. 2012, 49, 943–956. [Google Scholar] [CrossRef]
  31. Herring, T.; King, R.; Floyd, M.; McClusky, S. GAMIT reference manual: GPS analysis at MIT, release 10.7; department of Earth. Atmos. Planet. Sci. 2018. Available online: http://geoweb.mit.edu/gg/docs/GAMIT_Ref.pdf (accessed on 26 August 2024).
  32. Ghaderpour, E. JUST: MATLAB and python software for change detection and time series analysis. GPS Solut. 2021, 25, 85. [Google Scholar] [CrossRef]
  33. Ghaderpour, E.; Vujadinovic, T. Change Detection within Remotely Sensed Satellite Image Time Series via Spectral Analysis. Remote Sens. 2020, 12, 4001. [Google Scholar] [CrossRef]
  34. Razeghi, M.; Tregoning, P.; Shirzaei, M.; Ghobadi-Far, K.; McClusky, S.; Renzullo, L. Characterization of Changes in Groundwater Storage in the Lachlan Catchment, Australia, Derived from Observations of Surface Deformation and Groundwater Level Data. J. Geophys. Res. Solid Earth 2022, 127, e2022JB024669. [Google Scholar] [CrossRef]
  35. Dill, R.; Dobslaw, H. Numerical simulations of global-scale high-resolution hydrological crustal deformations. J. Geophys. Res. Solid Earth 2013, 118, 5008–5017. [Google Scholar] [CrossRef]
  36. Purcell, A.; Tregoning, P.; Dehecq, A. An assessment of the ICE6G_C(VM5a) glacial isostatic adjustment model. J. Geophys. Res. Solid Earth 2016, 121, 3939–3950. [Google Scholar] [CrossRef]
  37. Richard Peltier, W.; Argus, D.F.; Drummond, R. Comment on “An assessment of the ICE-6G_C (VM5a) glacial isostatic adjustment model” by Purcell et al. J. Geophys. Res. Solid Earth 2018, 123, 2019–2028. [Google Scholar] [CrossRef]
  38. Hsu, Y.-J.; Fu, Y.; Bürgmann, R.; Hsu, S.-Y.; Lin, C.-C.; Tang, C.-H.; Wu, Y.-M. Assessing seasonal and interannual water storage variations in Taiwan using geodetic and hydrological data. Earth Planet. Sci. Lett. 2020, 550, 116532. [Google Scholar] [CrossRef]
  39. Jiang, Z.; Hsu, Y.-J.; Yuan, L.; Cheng, S.; Feng, W.; Tang, M.; Yang, X. Insights into hydrological drought characteristics using GNSS-inferred large-scale terrestrial water storage deficits. Earth Planet. Sci. Lett. 2022, 578, 117294. [Google Scholar] [CrossRef]
  40. Jiang, W.; Kaihua, W.; Li, Z.; Zhou, X.; Ma, Y.; Ma, J. Prospect and theory of GNSS coordinate time series analysis. Geomat. Inf. Sci. Wuhan Univ. 2018, 43, 2112–2123. [Google Scholar] [CrossRef]
  41. Zhao, R.; Wang, G.; Yu, X.; Sun, X.; Bao, Y.; Xiao, G.; Gan, W.; Shen, S. Rapid Land Subsidence in Tianjin, China Derived from Continuous GPS Observations (2010–2019). Proc. Int. Assoc. Hydrol. Sci. 2020, 382, 241–247. [Google Scholar] [CrossRef]
  42. Shi, M.; Gong, H.; Gao, M.; Chen, B.; Zhang, S.; Zhou, C. Recent Ground Subsidence in the North China Plain, China, Revealed by Sentinel-1A Datasets. Remote Sens. 2020, 12, 3579. [Google Scholar] [CrossRef]
  43. Hu, R.; Wang, S.; Lee, C.; Li, M. Characteristics and trends of land subsidence in Tanggu, Tianjin, China. Bull. Eng. Geol. Environ. 2002, 61, 213–225. [Google Scholar] [CrossRef]
  44. Zhu, J.; Wang, Z.; Hou, T.; Li, Y. Evolution of Groundwater Dynamic under the Influence of Treatment of Groundwater Overexploitation in the Beijing-Tianjin-Hebe Plain. J. China Hydrol. 2022, 5, 97–101. [Google Scholar] [CrossRef]
  45. Shen, S.-L.; Xu, Y.-S. Numerical evaluation of land subsidence induced by groundwater pumping in Shanghai. Can. Geotech. J. 2011, 48, 1378–1392. [Google Scholar] [CrossRef]
  46. Chai, J.; Shen, S.; Zhu, H.; Zhang, X.L. 1D Analysis of Land Subsidence in Shanghai. Lowl. Technol. Int. 2005, 7, 33–41. [Google Scholar]
  47. Stamatopoulos, C.; Petridis, P.; Parcharidis, I.; Foumelis, M. A method predicting pumping-induced ground settlement using back-analysis and its application in the Karla region of Greece. Nat. Hazards 2018, 92, 1733–1762. [Google Scholar] [CrossRef]
  48. Shi, X.; Zhu, T.; Tang, W.; Jiang, M.; Jiang, H.; Yang, C.; Zhan, W.; Ming, Z.; Zhang, S. Inferring decelerated land subsidence and groundwater storage dynamics in Tianjin–Langfang using Sentinel-1 InSAR. Int. J. Digit. Earth 2022, 15, 1526–1546. [Google Scholar] [CrossRef]
  49. Terzaghi, K. Principles of Soil Mechanics: I—Phenomena of Cohesion of Clays; Engineering News-Record: New York, NY, USA, 1925; Volume 95. [Google Scholar]
  50. Ziaie, A.; Rahnama, M.B. Prediction of Single Well Land Subsidence Due to Ground Water Drainage. Int. J. Agric. Res. 2007, 2, 349–358. [Google Scholar] [CrossRef]
  51. Zhang, T.; Shen, W.-B.; Wu, W.; Zhang, B.; Pan, Y. Recent Surface Deformation in the Tianjin Area Revealed by Sentinel-1A Data. Remote Sens. 2019, 11, 130. [Google Scholar] [CrossRef]
  52. Wessel, P.; Luis, J.F.; Uieda, L.; Scharroo, R.; Wobbe, F.; Smith, W.H.F.; Tian, D. The Generic Mapping Tools Version 6. Geochem. Geophys. Geosyst. 2019, 20, 5556–5564. [Google Scholar] [CrossRef]
Figure 1. Geographic location and distribution of GNSS stations in Tianjin. Red-coded circles represent the location of the GNSS stations.
Remotesensing 16 03213 g001
Figure 2. Original time series and jump-removal time series for GNSS stations (the blue dotted line indicates the judged jumping point).
Remotesensing 16 03213 g002
Figure 3. Annual variation characteristics of vertical deformation of various loading models at GNSS stations. (ad) indicate annual amplitude of vertical displacements regarding NTAL, NTOL, HYDL, and SLEL, respectively.
Remotesensing 16 03213 g003
Figure 4. Long-term rates and cumulative deformation due to GIA at GNSS stations.
Remotesensing 16 03213 g004
Figure 5. GNSS vertical displacement time series after deducting other well-modeled contributions.
Remotesensing 16 03213 g005
Figure 6. Spatial distribution of cumulative surface deformation and subsidence rates for GNSS stations recording data since 2011. White numbers indicate linear subsidence rates, coded circles in various colors depict cumulative surface deformation, and red ellipses highlight the known subsidence funnels.
Remotesensing 16 03213 g006
Figure 7. Subsidence rate changes of nine stations within three periods (2011–2014, 2015–2017, and 2018–2021).
Remotesensing 16 03213 g007
Figure 8. Seasonal deformation signals of load-corrected (red dots) and model-predicted (green lines) vertical deformations at six stations.
Remotesensing 16 03213 g008
Figure 9. Annual linear rates for 21 stations obtained through least-squares regression. The black line at y = 0 represents the threshold between crustal subsidence and uplift. Note that the y-axis of (d) is different from other sub-figures.
Remotesensing 16 03213 g009
Figure 10. Annual groundwater resources (red line), groundwater supply (blue), and precipitation (green bars) in Tianjin from 2011 to 2021.
Remotesensing 16 03213 g010
Disclaimer/Publisher’s Note: The statements, opinions and data contained in all publications are solely those of the individual author(s) and contributor(s) and not of MDPI and/or the editor(s). MDPI and/or the editor(s) disclaim responsibility for any injury to people or property resulting from any ideas, methods, instructions or products referred to in the content.

