Abstract
Accurate prediction of lake surface water temperature (LSWT) is essential for understanding the impacts of climate change on aquatic ecosystems and for guiding environmental management strategies. Predictions of LSWT for two prominent lakes in northern China, Qinghai Lake and Hulun Lake, under various future climate scenarios, were conducted in the present study. Utilizing historical hydrometeorological data and MODIS satellite observations (MOD11A2), we employed three advanced machine learning models—Random Forest (RF), XGBoost, and Multilayer Perceptron Neural Network (MLPNN)—to predict monthly average LSWT across three future climate scenarios (ssp119, ssp245, ssp585) from CMIP6 projections. Through the comparison of training and validation results of the three models across both lake regions, the RF model demonstrated the highest accuracy, with a mean MAE of 0.348 °C and an RMSE of 0.611 °C, making it the most optimal and suitable model for this purpose. With this model, the predicted LSWT for both lakes reveals a significant warming trend in the future, particularly under the high-emission scenario (ssp585). The rate of increase is most pronounced under ssp585, with Hulun Lake showing a rise of 0.55 °C per decade (R2 = 0.72) and Qinghai Lake 0.32 °C per decade (R2 = 0.85), surpassing trends observed under ssp119 and ssp245. These results underscore the vulnerability of lake ecosystems to future climate change and provide essential insights for proactive climate adaptation and environmental management.
1. Introduction
Lake surface water temperature (LSWT) stands as a pivotal factor in the characterization of lake water, playing a crucial role in lake ecosystem research [1]. It serves as a sensitive indicator reflecting changes in lake morphology, watershed conditions, and hydrology [2]. Additionally, LSWT is a significant marker of long-term alterations in both lake thermal structure and regional climate, influenced by variations in lake state and surrounding watersheds [3].
In recent decades, climate change has emerged as a significant challenge to lake ecosystems [4,5]. Global air temperature increases have been identified as a key driver influencing LSWT, with lakes worldwide experiencing a noticeable upward trend of 0.3 °C per decade [6]. Studies, such as those by Woolway et al. [7], have projected an escalation in lake heat waves globally through the conclusion of the 21st century. Wan et al. [3] discovered a significant correlation between the nocturnal LSWT increase and the concurrent rise in regional air temperature across 374 lakes on the Tibetan Plateau (TP). The influence of rising LSWT on lake ecosystems should not be underestimated. Elevated LSWT can lower lake water levels, hasten evaporation, and interfere with heat exchange mechanisms within the lake [8]. Collectively, these factors affect the lake’s biological, chemical, and physical processes [9,10,11]. The increasing trend in LSWT can initiate cyanobacterial blooms, leading to detrimental effects on planktonic habitats and the degradation of lake water quality [12,13,14]. Predicting the LSWT response to climate change is, therefore, imperative.
Multiple factors, encompassing solar radiation, wind, air temperature, and lake morphology, contribute to the complexity of LSWT dynamics [1,15,16,17]. The intricate and nonlinear behavior of these factors, coupled with their interactions, presents a significant challenge to accurate LSWT prediction [1]. Multiple models and methods, ranging from physical–statistical hybrids to machine learning models, have been developed for this purpose [18,19]. Piotrowski et al. [20] improved the performance of the model for predicting water temperature by improving the parameter settings of the physically based model. Furthermore, Bachmann et al. [21] employed multiple regression analyses to predict and analyze the LSWT of lakes across the United States and southern Canada. Salim Heddam et al. [22] compared machine learning methods and air-to-stream models in the LSWT prediction of 25 lakes in northern Poland. These studies illustrate the feasibility of using multiple relevant elemental data to establish relationships with LSWT, but they often rely on site-specific data from large lakes, which may not capture the spatio-temporal variability of regional temperature characteristics [2].
Satellite remote sensing data has become a robust tool for monitoring LSWT, with techniques continuously advancing to enhance accuracy [5]. Multiple types of satellite data have been validated for their high accuracy. For example, Terra/Aqua-MODIS [23,24], Terra-ASTER [25], NOAA-AVHRR [26,27], and Landsat series [28,29] have all been demonstrated as useful on-board sensors for such a purpose. Notably, MODIS data, with their superior temporal resolution and extended time range, are particularly suitable for long-term studies on temperature changes [1]. Kaishan Song et al. [2] used the MOD11A2 data to explore the spatial and temporal variation in LSWT among 56 large lakes on the TP, while also examining the factors influencing this variation during the period 2000–2015. Reinart and Reinhold [30] completed LSWT monitoring of two large Swedish lakes using MODIS data. Similarly, Cong Xie et al. [31] examined the spatial and temporal fluctuations of surface water temperature in Chinese lakes using MODIS data from 2001.
Global climate models (GCMs), recognized as essential tools for predicting future changes in the climate system [32], offer valuable and pertinent data to predict future LSWT changes under various scenarios. The Coupled Model Intercomparison Project (CMIP), currently in its sixth phase (CMIP6), encompasses data from approximately 112 climate models contributed by nearly 33 research and development institutions worldwide and has been utilized to conduct current simulations and make future projections [33]. Relative to its predecessor, CMIP5, CMIP6 exhibits substantial enhancements in spatial resolution, physical processes, and coupled carbon cycles [34]. Within CMIP6, the Geophysical Fluid Dynamics Laboratory (GFDL) in the United States has developed the global climate model GFDL-ESM4. This model serves to compare and assess the responses of global climate models to anthropogenic forcings. It simulates the interactions among the global atmosphere, ocean, land, and sea ice systems to provide predictions and assessments of future climate change [35]. The integration of remote sensing data with future climate projections from GCMs, such as the GFDL-ESM4 in CMIP6, provides a novel approach to predicting LSWT trends under different scenarios.
This study utilizes three machine learning models—XGBoost, Multilayer Perceptron Neural Network (MLPNN), and Random Forest (RF)—to predict LSWT using hydrometeorological data with a 1 km resolution on a monthly basis. Based on the selected optimal machine learning model through prediction experiments, we project LSWT trends for Qinghai Lake and Hulun Lake under three climate scenarios (ssp119, ssp245, and ssp585), as derived from the GFDL-ESM4 model in CMIP6. Unlike traditional LSWT predictions based on station data, the use of remote sensing data in conjunction with these models allows for a more comprehensive capture of the spatial and temporal variations in lake temperature across the region. This approach significantly enhances our understanding of the potential future climatic impacts on these crucial aquatic ecosystems. The main workflow of the study is illustrated in Figure 1.
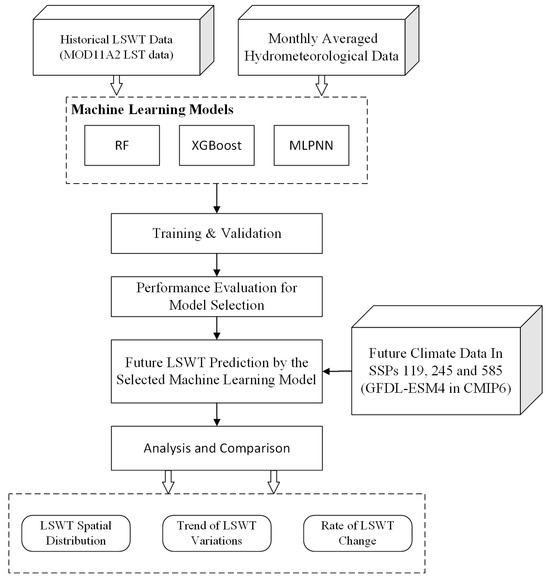
Figure 1.
Workflow for predicting LSWT based on historical and future hydrometeorological data followed in the present study.
2. Materials and Methods
2.1. Study Area
This study centers on two prominent lakes in northern China, Qinghai Lake and Hulun Lake (Figure 2), chosen as representative examples of large lakes in the region. Qinghai Lake, situated in the northeastern region of the Tibetan Plateau (TP) (36°32′–37°15′N, 99°37′–100°47′E), boasts an average altitude of 3260 m and spans an area of approximately 4265 km2. Extending 104 km from east to west and 62 km from north to south, it holds the status of the largest inland saltwater lake in China. Qinghai Lake, with an average water depth of 21 m, operates as a closed basin lake, primarily recharged through direct precipitation and runoff from over 50 intermittent rivers [36]. The region experiences an average annual temperature ranging from −0.9 °C to 1.4 °C, accompanied by an average annual precipitation ranging from 260 to 572 mm.
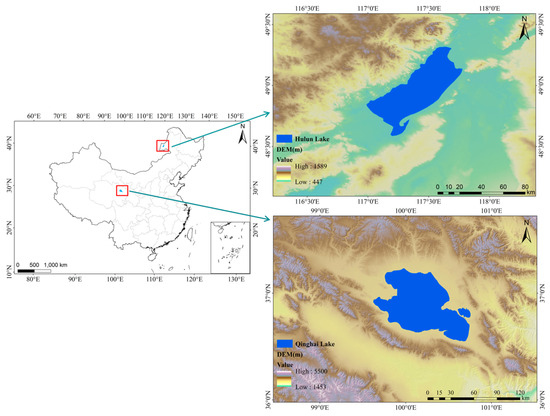
Figure 2.
Geo-location map showing DEM of Qinghai Lake and Hulun Lake surroundings.
Hulun Lake, Northeast China’s largest lake and the country’s fifth-largest freshwater lake, is located at the western edge of the Great Khingan Mountains and the northeastern portion of the Mongolian Plateau [37]. Positioned at an elevation of approximately 545 m above sea level, it extends 93 km in length and 32 km in width, featuring an average depth of 5–8 m and a water storage capacity of 14 billion cubic meters. Hulun Lake, characterized by a continental steppe climate within the middle temperate zone, experiences low temperatures, dry conditions, and strong winds during spring and winter [38].
2.2. Satellite Data and Pre-Processing
The MOD11A2 V6.1 product, generated from MODIS satellite observations and available on the Google Earth Engine (GEE) platform, served as the primary source for land surface temperature (LST) data. This product provides an 8-day mean LST over a grid of 1200 km × 1200 km, with each pixel representing the average LST of corresponding pixels in MOD11A1 collected within the same 8-day period. The monthly mean LSWT for the period 2001–2020 was computed by averaging all MOD11A2 images for each month. Pre-processing on the GEE platform involved calculating monthly average LSWT, image clipping, and data export.
To minimize the impact of shoreline fluctuations on LSWT predictions, given the seasonal and interannual variations in lake water levels, we utilized stable, non-flood season lake boundaries for data clipping. A 1 km inward buffer was applied from these stable boundaries, ensuring that all data used were from the water body itself, excluding any land near the lakeshore.
2.3. Machine Learning Methods
2.3.1. Multilayer Perceptron Neural Network (MLPNN) Model
The Multilayer Perceptron (MLP) is a type of fully connected feedforward artificial neural network (ANN) characterized by its multiple layers of nodes: an input layer, one or more hidden layers, and an output layer (see Figure 3). Each node in the hidden and output layers functions as a neuron equipped with a nonlinear activation function. The MLP is trained using supervised learning techniques, such as backpropagation, where input data are processed through the input layer, subjected to weighted summations, and passed through one or more hidden layers before reaching the output layer [22]. The multilayer structure and nonlinear activation functions enable the MLP to model complex, nonlinear relationships effectively.
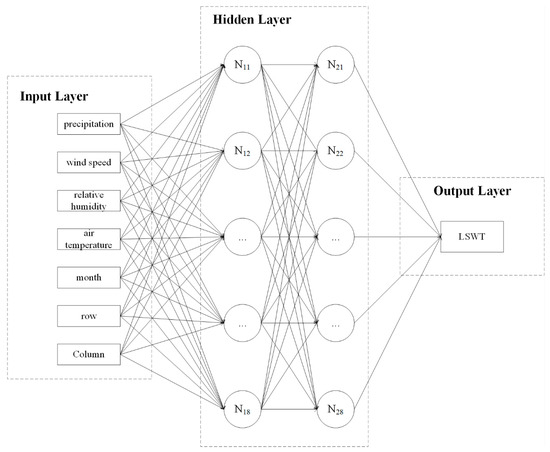
Figure 3.
Flowchart illustrating the structure of the MLPNN model for predicting LSWT.
In this study, the input layer of the MLP was designed to match the number of predictor variables. Alongside the four primary hydrometeorological factors—precipitation, wind speed, relative humidity, and air temperature—the input layer also included the month to capture temporal variations and the row and column indices of each raster to provide spatial location information. The hidden layer configuration was empirically determined, consisting of two layers with eight neurons each. The output layer contained a single neuron that represents the predicted LSWT.
2.3.2. XGBoost Model
XGBoost is an integrated machine learning algorithm rooted in decision trees. It uses a series of tree models for prediction, and each tree model is constructed by iterating over the dataset. During each iteration, XGBoost refines the parameters of the tree models by considering the error between the previous prediction results and the true values. This iterative process aims to achieve progressively more accurate predictions. XGBoost enhances the gradient boosting decision tree (GBDT) algorithm by employing second-order Taylor expansion on the loss function, integrating regularization techniques, and leveraging parallel computing to mitigate overfitting [39]. The overall model function is as follows:
where is the total number of trees, is the kth tree model, is the input sample, and is the prediction result.
Due to the significant differences in the geographic location and natural attributes of the two lakes, we adjusted and trained the XGBoost model with two different sets of parameters for each lake.
2.3.3. Random Forest (RF) Model
The RF algorithm is an integrated learning method that was originally proposed by Breiman [40]. The basic idea of RF is to construct multiple decision trees and output the mode or average prediction value of each decision tree. Each decision tree is constructed from a different subset of training data and randomly selected features. This approach can overcome some limitations of a single decision tree, such as overfitting noise in the data and sensitivity to small variations in the training set. In the prediction phase, each decision tree operates independently to predict the class or value of the target variable. The algorithm’s final output is then determined by aggregating these individual tree predictions [22].
2.3.4. Selection of Hydrometeorological Factors and Temporal/Spatial Predictors
For predicting LSWT, we selected four key hydrometeorological factors: air temperature, precipitation, relative humidity, and wind speed. These factors were chosen based on their critical roles in regulating LSWT.
Air temperature is a primary driver of LSWT variations, with global studies linking increased air temperatures to rising lake surface temperatures [5,17]. Precipitation affects LSWT both directly, through cooling effects, and indirectly, by altering the physical structure and stratification of lakes. Long-term changes in precipitation patterns can exacerbate LSWT fluctuations in a warming climate [41,42,43]. Relative humidity impacts LSWT by influencing evaporation rates; changes in humidity can significantly affect the rate of heat loss from a lake’s surface, making it a crucial factor in lake thermal dynamics [44]. Wind speed affects LSWT through its dual role in promoting vertical mixing, which redistributes heat within the lake, and enhancing evaporation, both of which are essential for determining LSWT [45,46,47].
Additionally, we incorporated temporal factors (month) and spatial factors (latitude and longitude) as predictors. Seasonal variations in LSWT are complex and can differ between lakes, indicating that a single seasonal trend may not fully capture the diverse responses of lakes to climatic changes. Temporal factors, such as month or season, are crucial for understanding intra-annual variations in LSWT and how lakes respond to climate dynamics throughout the year [26,48]. Spatial factors, including latitude and longitude, significantly influence LSWT patterns, as spatial gradients in LSWT trends vary by region. Incorporating spatial information is essential for understanding the regional climate impacts on LSWT and for making accurate predictions across different climatic regions [48,49].
The 1 km resolution monthly datasets for precipitation, mean air temperature, mean relative humidity, and mean wind speed in China were sourced from the National Earth System Science Data Center, National Science & Technology Infrastructure of China (http://www.geodata.cn, accessed on December 2022). The 1 km resolution monthly precipitation dataset was generated using thin-slab sample interpolation, incorporating data from China’s national ground meteorological observatories and DEM data as covariates. The monthly mean temperature dataset was downscaled using the delta spatial downscaling method, which utilized the global 0.5° climate dataset provided by CRU (https://crudata.uea.ac.uk/cru/data/hrg/, accessed on December 2022) and the high-resolution climate dataset from WorldClim (http://www.worldclim.org/, accessed on December 2022) [50]. The monthly mean relative humidity and wind speed data were derived from ERA5 reanalysis climate data, following spatial downscaling [51].
The future scenario datasets for precipitation, wind speed, relative humidity, and temperature were based on the SSP119, SSP245, and SSP585 scenarios from the GFDL-ESM4 model within the CMIP6 framework, covering the period from January 2021 to December 2100. The 1 km resolution monthly mean temperature and precipitation datasets were sourced from the National Earth System Science Data Center, National Science & Technology Infrastructure of China (http://www.geodata.cn, accessed on December 2022), and were generated using the Delta spatial downscaling method for the Chinese region [50]. Monthly mean wind speed and relative humidity data from the GFDL-ESM4 model were obtained from the CMIP6 website (https://pcmdi.llnl.gov/CMIP6/, accessed on December 2022) and resampled to 1 km resolution using the nearest-neighbor interpolation method. This approach integrates reliable satellite data with high-resolution hydrometeorological information, ensuring accurate and detailed predictions of LSWT under various climate scenarios.
2.4. Model Performance Evaluation
In this study, three indicators were utilized to evaluate the model’s performance: the coefficient of determination (R2), the root mean squared error (RMSE), and the mean absolute error (MAE) [19]. The R2 quantifies the proportion of variance in the dependent variable explained by the model, with better model performance indicated by an R2 value closer to 1. The RMSE and MAE values are employed to represent the fit error.
These were calculated as follows:
Here, N denotes the number of raster samples. represents the measured lake surface water temperature, represents the calculated temperature, and represents the mean measured temperature (°C).
3. Results
3.1. Model Training and Validation
Hulun Lake and Qinghai Lake were discretized into 1 km resolution grids, with dimensions of 85 × 95 and 166 × 109 cells, respectively. Remote sensing images and hydrometeorological data were interpolated into these pre-defined grids using the nearest-neighbor interpolation method. Each grid cell was assigned as an input sample, incorporating LSWT, hydrometeorological parameters, temporal (month) information, and spatial (row and column) coordinates. After aligning the spatiotemporal data, approximately 750,000 and 870,000 sample rows were compiled for the past 20 years.
For dataset partitioning, we utilized a random selection approach. The raster data, spatially matched, were shuffled randomly, reserving 10% of the data for validation. The remaining 90% was split into training and test sets, with 70% allocated for training and 30% for model evaluation. The training outcomes for the three models are illustrated in Figure 4 and Figure 5, and the optimal parameters are detailed in Table 1.
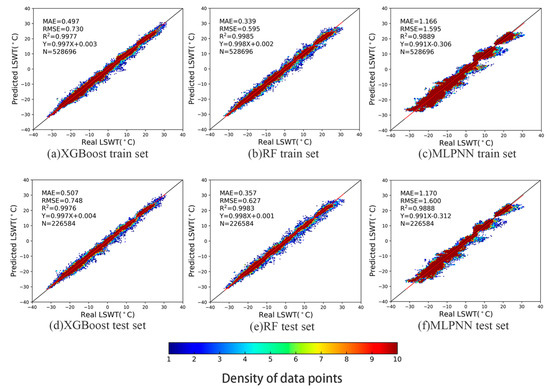
Figure 4.
Training set and validation set for XGBoost, RF, and MLPNN, based on data from Hulun Lake.
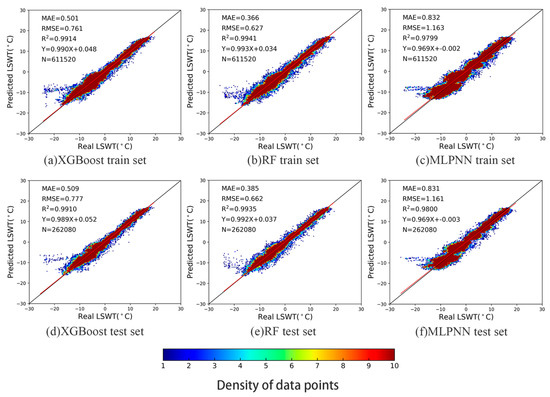
Figure 5.
Training set and validation set for XGBoost, RF, and MLPNN, based on data from Qinghai Lake.

Table 1.
The optimal parameters of MLPNN, XGBoost, and RF models for the Qinghai Lake and Hulun Lake regions.
Given the geographical and environmental diversity of the two studied large lakes, we utilized 20 years of historical data from both lakes to train and validate the three LSWT prediction models, ensuring their regional applicability. As illustrated in Figure 4 and Figure 5, all three models achieved high R2 values, exceeding 0.95, in both study areas. The MLPNN model demonstrated excellent accuracy overall, though some inconsistencies were noted in the scatter plots, revealing challenges in fitting discrete values.
Among the models, the RF model outperformed the XGBoost model in terms of MAE, RMSE, and R2 metrics across both regions. Figure 5 highlights some outliers in the Qinghai Lake area, particularly points with higher estimations in the scatter plot, attributed to mixed pixels caused by lake islands. Despite incorporating geographic information such as latitude and longitude to improve prediction accuracy, the RF model exhibited fewer deviations compared to the other models.
Consequently, the RF model was selected as the optimal choice for predicting LSWT under different future climate scenarios, due to its superior performance and consistency.
3.2. Prediction Results for Future LSWT Based on the Optimal Model
Unlike time-series models that forecast short-term future values based on sequential historical data, our methodology focuses on learning the statistical relationships between various factors and LSWT using historical datasets. This approach involves training our model to understand these relationships and then applying it to predict LSWT under different future climate scenarios. The future climate scenarios provide key variables such as air temperature, wind speed, and atmospheric pressure. By leveraging historical data to train our model, we can predict LSWT under these scenarios, addressing a crucial gap in climate projections.
Based on hydrometeorological datasets for different future discharge scenarios, LSWT predictions were conducted for the period 2021–2100 with the RF model optimized by experimental effects. To show the temporal and spatial distribution of the LSWT data, the results were reconstructed into a geographical raster representing monthly lake surface temperatures. The raster data were matched and superimposed for each month of the multi-year period to calculate the mean values, and the results are shown in Figure 6 and Figure 7, indicating the annual mean temperatures from January to December for the two lakes for different discharge scenarios from 2021 to 2100.
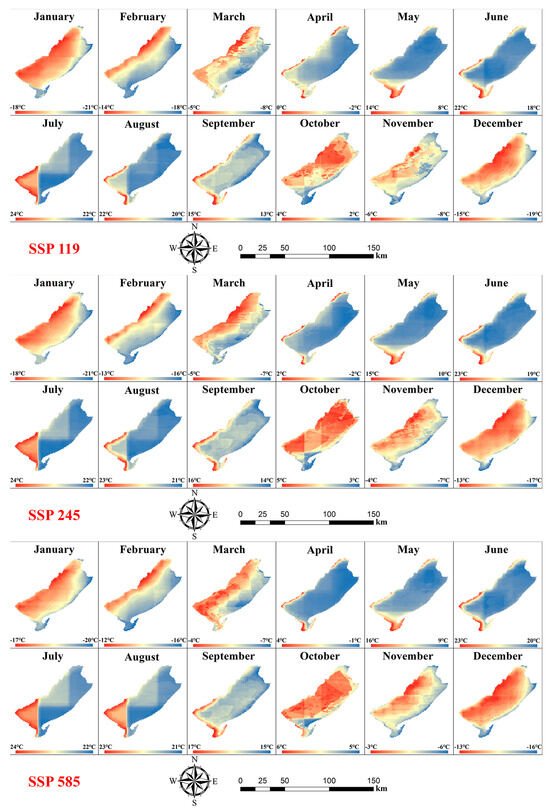
Figure 6.
Predicted annual mean LSWT per month for different discharge scenarios in Hulun Lake from 2021 to 2100.
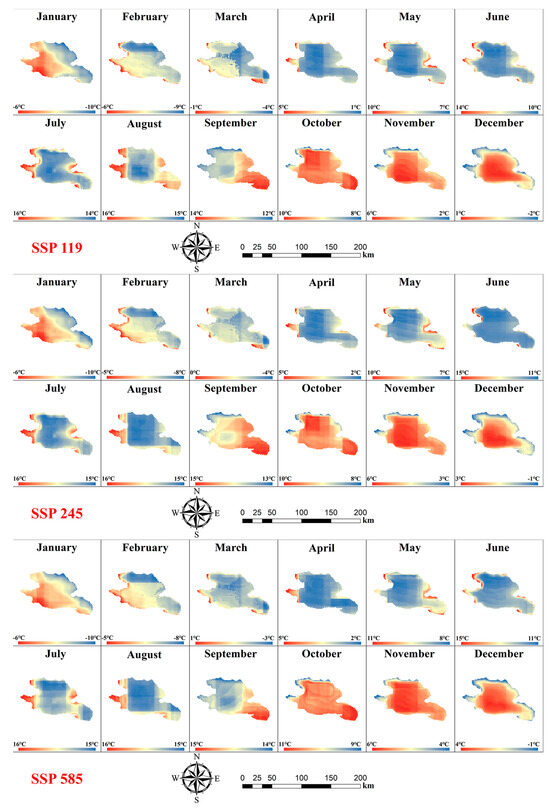
Figure 7.
Predicted annual mean LSWT per month for different discharge scenarios in Qinghai Lake from 2021 to 2100.
Compared with the predicted results of Qinghai Lake and Hulun Lake, the future LSWT of Qinghai Lake and Hulun Lake can better reflect the seasonal variation and spatial distribution of temperature. Both show a consistent rise in temperature from January to July followed by a decline from July to December. In terms of spatial distribution, the warming and cooling process is characterized by a marked change in temperature from the outer waters of the lake to the central region of the lake, which corresponds to the actual lake temperature change pattern.
However, because of variances in the geographical location and environment of the two lakes, the processes of temperature change are significantly different. For Hulun Lake, the warming process from January to July is most pronounced in the western and northwestern sides of the lake. During the cooling period from July to December, the southeast side cools down first. For Lake Qinghai, the temperature of the southwestern side in the warming period is higher. During the cooling process, the lowest temperatures occur on the northwestern side in September and October.
For different discharge scenarios, the spatial and temporal distribution of the temperature properties in the two lakes corresponds to certain changes. Overall, both lakes show a significant increase in LSWT as greenhouse gas emission levels increase. Under the ssp585 scenario, the monthly temperature of Hulun Lake and Qinghai Lake increased by 1–2 °C, which is greater than that under the ssp119 scenario. A remarkable expansion of the higher temperature regions is apparent under the ssp585 scenario.
3.3. Trends of LSWT under Different Emission Scenarios Based on Prediction Results
To investigate the trend of LSWT over time in the two lakes under different emission scenarios, raster images of Kendall Tau attributes were generated for each month from January to December. After arranging the LSWT raster images in chronological order for each month separately, the Kendall Tau values were calculated for each raster, and those rasters that met p < 0.05 were retained, whereas those that did not meet p < 0.05 were excluded and assigned a value of 0. The results are shown in Figure 8 and Figure 9.
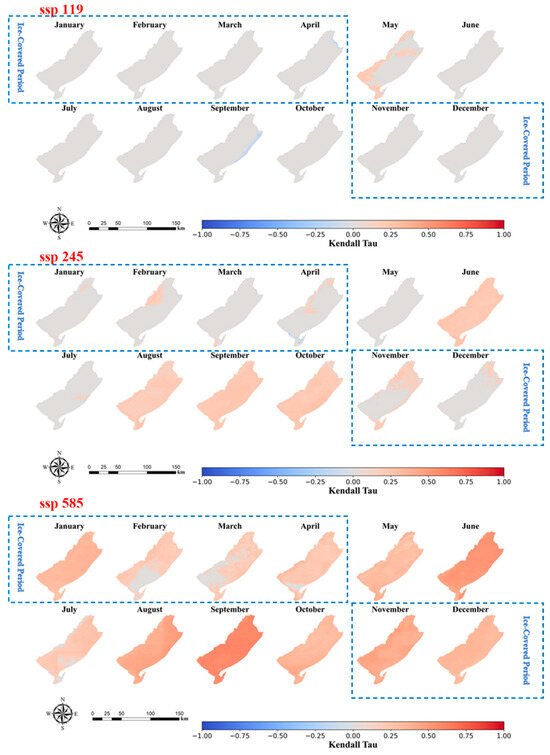
Figure 8.
Kendall Tau for each month based on the predicted LSWT of Hulun Lake under different discharge scenarios for the period 2021–2100.
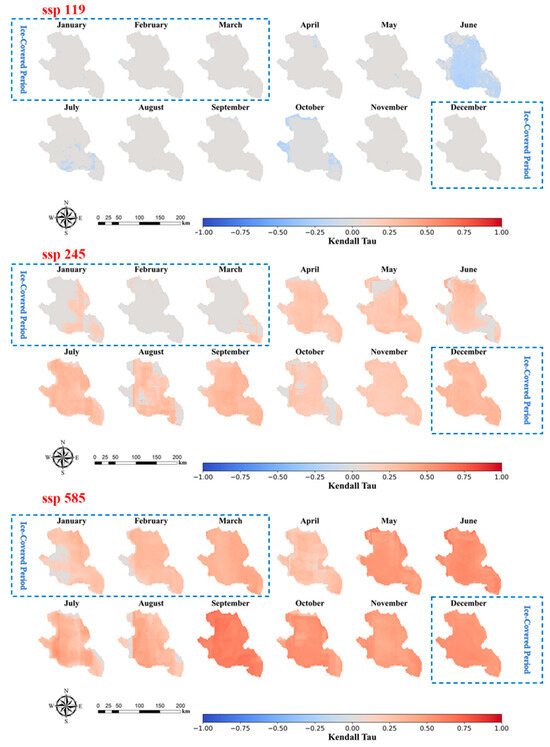
Figure 9.
Kendall Tau for each month based on the predicted LSWT of Qinghai Lake under different discharge scenarios for the period 2021–2100.
It is noteworthy that both lakes experience periods of ice cover, during which the ice layer isolates the lake water. Consequently, satellite observations during these months primarily capture the surface temperature of the ice layer. Therefore, the predictions of our machine learning models under future climate scenarios mainly reflect the surface temperature of the ice. Given that ice surface temperature is highly sensitive to climate change, impacting the processes of lake freezing and thawing, our study specifically annotates and includes the ice surface temperature during the ice-covered periods in the analysis. Qinghai Lake typically enters its frozen period in mid-December and fully thaws by mid-April of the following year. Meanwhile, the Hulun Lake system generally begins to freeze in November, with thawing occurring around the end of April the following year.
For both lakes, a significant increase is observed in the warming trend of the lakes with increasing discharge levels. For Hulun Lake, there is no clear temperature increase or decrease trend in the whole lake area under the ssp119 scenario, except for a small warming trend at the western edge of the lake in May. In the ssp245 scenario, a subtle warming trend is observed across the entire lake area in June, August, September, and October. Under the ssp585 scenario, the lake surface shows a warming trend in almost all months, especially August. For Qinghai Lake, there is also no warming trend in all months under the ssp119 scenario. In fact, there is a slight cooling in June. Under the ssp245 scenario, a weak increasing trend is observed in all months except for February and March, for which there is no significant trend. Under the ssp585 scenario, an increasing trend in temperature is observed for all 12 months, especially in September.
To illustrate the annual average variation in regional temperature for the two lakes, we computed the annual average LSWT for each climate scenario. Figure 10 and Figure 11 present the annual average LSWT variations for Hulun Lake and Qinghai Lake under both historical periods and future climate scenarios. Historical LSWT data from 2001 to 2020 reveal that both lakes have experienced fluctuations with a general warming trend over the past two decades. The annual rate of change in LSWT was 0.32 °C·decade⁻1 (R2 = 0.04) for Hulun Lake and 0.19 °C·decade⁻1 (R2 = 0.04) for Qinghai Lake.
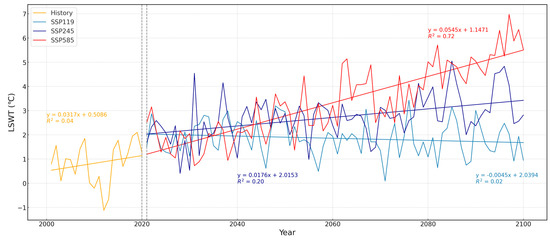
Figure 10.
Annual average LSWT of Hulun Lake in the future under different discharge scenarios.
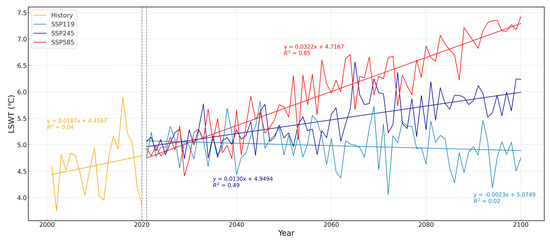
Figure 11.
Annual average LSWT of Qinghai Lake in the future under different discharge scenarios.
Forecasts indicate significant warming of the annual average LSWT with increasing emissions. For Hulun Lake, the annual rates of change in LSWT are −0.045 °C·decade⁻1 (R2 = 0.02) for ssp119, 0.18 °C·decade⁻1 (R2 = 0.20) for ssp245, and 0.55 °C·decade⁻1 (R2 = 0.72) for ssp585. For Qinghai Lake, the rates are −0.02 °C·decade⁻1 (R2 = 0.02) for ssp119, 0.13 °C·decade⁻1 (R2 = 0.49) for ssp245, and 0.32 °C·decade⁻1 (R2 = 0.85) for ssp585. Under the ssp119 scenario, both lakes show a negative rate of change in annual average temperature, though the low R2 values suggest negligible change over time. In contrast, both lakes exhibit a pronounced warming trend and increased warming magnitude under the more extreme emission scenario (ssp585).
4. Discussion
4.1. Impact Analysis of Predictive Factors on LSWT Prediction
The variation in LSWT has significant implications for both lake ecosystem health and climate change research. Given the intensifying global warming, accurate predictions of future LSWT trends are essential for developing effective environmental management and climate adaptation strategies. This study compares three advanced machine learning methods—RF, XGBoost, and MLPNN—using historical hydrometeorological data from Qinghai Lake and Hulun Lake. The RF model, identified as optimal, was used to predict monthly average LSWT under various future climate scenarios.
To ensure high-precision predictions, we focused on selecting predictive factors critical to temperature variations. These factors include hydrometeorological variables such as precipitation, wind speed, relative humidity, and air temperature, as well as spatial and temporal information including latitude, longitude, and time variables. These elements are vital for understanding the thermal balance and energy exchange processes within lakes. This section will discuss the contribution of each meteorological factor to the model’s performance and its correlation with LSWT, thereby providing theoretical support for the accuracy of our predictions.
To quantify the relationships between various predictive factors and LSWT, we constructed a heatmap (Figure 12) utilizing data from seven predictors alongside LSWT. Pearson correlation coefficients were computed to assess these relationships. The results indicate that air temperature is the factor most strongly associated with LSWT. In both study lakes, historical and monthly average data show correlation coefficients exceeding 0.95, confirming that air temperature plays a dominant role in LSWT variations. This observation supports the theory that atmospheric temperature is the primary driver of lake surface water temperature. Precipitation also demonstrates a significant correlation with LSWT, with coefficients surpassing 0.65 in the Hulun Lake area and approaching 0.79 in the Qinghai Lake area. This suggests that precipitation notably affects the thermal balance and water temperature of the lakes. In contrast, wind speed shows a negative correlation with LSWT, with correlation coefficients of −0.23 and −0.41 for historical data, and −0.37 and −0.76 for monthly averages, respectively. This implies that increased wind speeds may enhance surface evaporation and heat exchange, leading to lower water temperatures. The relationship between relative humidity and LSWT varies between the study regions. In the Qinghai Lake area, relative humidity exhibits a strong correlation with LSWT, with coefficients exceeding 0.6. However, in the Hulun Lake area, this correlation is weaker, remaining below 0.3.
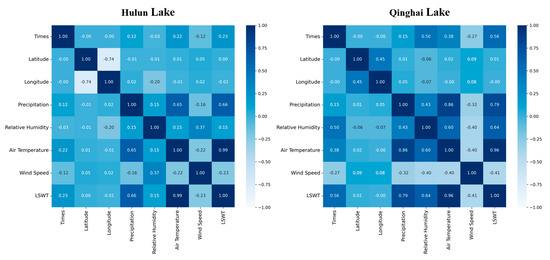
Figure 12.
Correlation heatmap of features in the Qinghai Lake and Hulun Lake regions.
We also computed the monthly averages for four primary hydrometeorological factors and generated scatter plots in relation to lake LSWT. Additionally, scatter plots were created for different months, with colors distinguishing the months, as illustrated in Figure 13 and Figure 14.
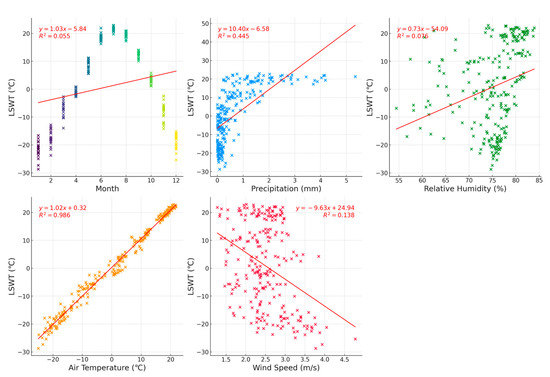
Figure 13.
Scatter plots of primary meteorological factors and monthly averages of LSWT in Hulun Lake.
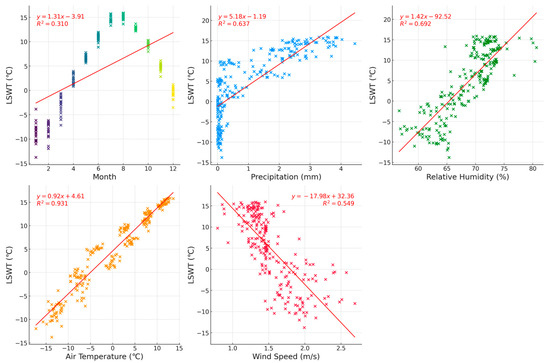
Figure 14.
Scatter plots of primary meteorological factors and monthly averages of LSWT in Qinghai Lake.
The scatter plots further elucidate the relationships between various predictive factors and LSWT and reveal differences across the two lake regions, highlighting the complexity of nonlinear variations. A notable observation is the distinct nonlinear relationship between LSWT and the month, with LSWT increasing in summer and decreasing in winter. This cyclical pattern is well captured by the month predictor.
Moreover, the scatter plots indicate that aside from air temperature—identified as the most strongly correlated factor with LSWT—the correlation between the monthly averages of other hydrometeorological factors and LSWT varies significantly between the Hulun and Qinghai regions, exhibiting distinct nonlinear distribution patterns. In the Hulun region, the correlations of precipitation, relative humidity, and wind speed with LSWT are relatively weak, with R2 values of 0.445, 0.076, and 0.138, respectively. Conversely, in the Qinghai region, these correlations are stronger, with R2 values of 0.637, 0.692, and 0.549. This suggests that in the Qinghai region, in addition to air temperature, precipitation, humidity, and wind speed also significantly influence LSWT.
These regional variations highlight that LSWT changes are influenced by multiple factors, with the strength and nature of these influences differing across regions. Therefore, the use of nonlinear machine learning models, such as RF, is essential. RF models are adept at managing complex nonlinear relationships among multiple factors, thereby accurately capturing intricate interactions between LSWT and various hydrometeorological factors, and significantly improving prediction accuracy and reliability.
The feature importance ranking analysis of the RF model enabled us to quantify the contributions of various meteorological factors to LSWT prediction. As shown in Figure 15, air temperature is identified as the most influential predictor in both the Qinghai Lake and Hulun Lake study areas, with feature importance scores exceeding 0.9. This result reinforces the critical role of air temperature in LSWT prediction, consistent with findings from the correlation analysis.
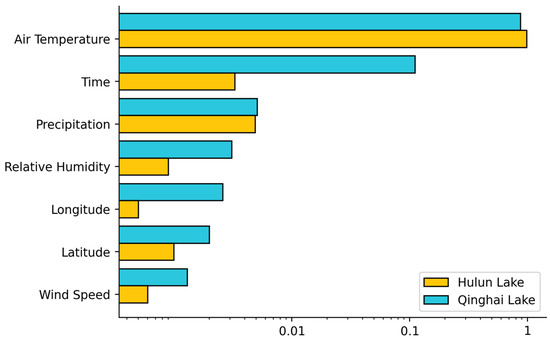
Figure 15.
Feature importance based on the RF model in the Qinghai Lake and Hulun Lake regions.
In contrast, the time and precipitation factors are ranked next in importance across both lake regions, though their influence is somewhat lower. The high importance of the time factor reflects its role in capturing seasonal variations in lake water temperature and long-term climate trends. Precipitation’s significance is related to its impact on the lake’s water balance and heat exchange processes. Additionally, relative humidity also shows notable importance, particularly in the Qinghai Lake region, likely due to the region’s specific climatic conditions and geographical environment.
Figure 16 and Figure 17 illustrate the trends in air temperature and LSWT for Qinghai Lake and Hulun Lake. Although there is a strong correlation between air temperature and LSWT in both lakes and their trends are generally similar, the figures reveal distinct differences in their interactions across the two regions. For instance, in Qinghai Lake, the annual average air temperature is notably higher than the LSWT, a disparity that continues under future climate scenarios. This suggests that LSWT may be influenced by additional mechanisms and factors beyond air temperature. In contrast, in Hulun Lake, the annual average air temperature and LSWT are more closely aligned, indicating a more direct influence of air temperature on LSWT in this region. However, other factors may still affect lake water temperatures. These observations highlight that LSWT variations across different lake regions exhibit unique characteristics. Relying solely on air temperature for predictions may overlook these complex interactions and mechanisms. Thus, incorporating multiple factors and considering nonlinear interactions are crucial for accurately predicting LSWT in various lake regions.
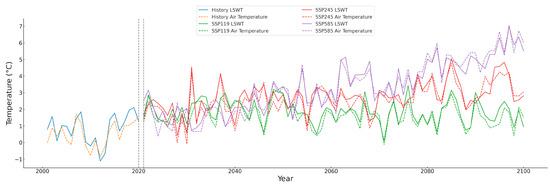
Figure 16.
Annual average LSWT versus air temperature changes in Hulun Lake in the future under different discharge scenarios.
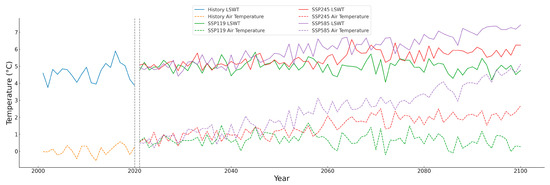
Figure 17.
Annual average LSWT versus air temperature changes in Qinghai Lake in the future under different discharge scenarios.
As demonstrated in Figure 12, Figure 13, Figure 14, Figure 15, Figure 16 and Figure 17, air temperature exhibits a strong correlation with LSWT and is pivotal in LSWT prediction, a relationship extensively validated in previous studies. For instance, the Air2water model by Piccolroaz et al. [52] effectively predicts LSWT using only air temperature. However, relying solely on air temperature has inherent limitations. LSWT variations are influenced not only by air temperature but also by other meteorological factors such as solar radiation, wind speed, and relative humidity, as well as lake-specific attributes like morphology and depth [6,7,53,54]. These additional variables are crucial for accurately capturing the full dynamics of LSWT. A model based solely on air temperature may not fully account for the complexity of LSWT variations, potentially leading to reduced accuracy and limited applicability.
In this study, we utilized machine learning models, including RF, XGBoost, and MLPNN, which are adept at handling multiple input variables and capturing complex nonlinear relationships and spatiotemporal dynamics [16,18,19,22]. These models benefit from extensive, multi-source remote sensing data, significantly enhancing predictive accuracy and robustness. Advances in remote sensing technology have provided comprehensive LSWT observations over large spatial scales, addressing the limitations of traditional in situ monitoring and offering valuable insights for global LSWT assessments [55].
Our study demonstrates that machine learning models like RF can effectively manage the complex nonlinear relationships between LSWT and various hydrometeorological factors under different conditions. While air temperature remains a critical factor influencing LSWT, the complexity and uncertainty associated with future climate scenarios necessitate the use of machine learning models that incorporate a broader range of meteorological and environmental variables. This approach not only improves model generalizability but also provides more accurate and comprehensive scientific insights, which are crucial for ensuring the resilience and long-term sustainability of lake ecosystems in the face of climate change.
4.2. Impacts of Spatiotemporal Variations in LSWT under Different Discharge Scenarios
This study employed the RF model to forecast LSWT for Qinghai Lake and Hulun Lake from 2021 to 2100 under various climate emission scenarios. The results reveal notable differences in both seasonal variations and spatial distribution of temperatures between the two lakes. Generally, temperatures rise from January to July and decrease from July to December. Spatially, a gradient in temperature is observed from the lake periphery to the center, indicating pronounced spatial heterogeneity.
Due to variations in geographical location and environmental conditions, Qinghai Lake and Hulun Lake exhibit distinct temperature patterns. Specifically, in Hulun Lake, the western and northwestern regions experience the most significant warming, while the southeastern region cools down earliest. In contrast, Qinghai Lake’s southern part records higher temperatures during the warming period, whereas the northwestern part registers the lowest temperatures during the cooling period (see Figure 6 and Figure 7).
The LSWT distribution also varies markedly under different emission scenarios. Under higher emission scenarios (e.g., ssp585), certain areas of both lakes show an increase in monthly mean temperatures by 1–2 °C, with a notable expansion of high-temperature zones. Conversely, under lower emission scenarios (e.g., ssp119), temperature changes are more moderate, and some regions even exhibit cooling trends. Statistical analysis further indicates that annual mean temperatures for both lakes exhibit a strong warming trend under the high emission scenario (ssp585), with the magnitude and rate of warming significantly exceeding those under other scenarios (see Figure 6, Figure 7, Figure 8 and Figure 9).
These results highlight significant spatial heterogeneity in temperature distribution within the lakes. The spatial variation in temperature is influenced by factors such as lake topography, depth, water circulation, and the surrounding environmental conditions [56,57,58]. This uneven temperature distribution can profoundly impact lake ecosystems, potentially altering biological habitats, disrupting hydrological processes, and affecting the overall ecological balance [12,13,14]. Understanding and addressing these spatial temperature variations are crucial for maintaining lake ecosystem health.
Furthermore, the temporal variation in lake temperatures underscores the significant impact of global climate change on lake ecosystems. Under high emission scenarios (e.g., ssp585), the marked increase in lake temperatures, coupled with accelerated warming rates, may lead to substantial changes in biological communities and threaten the stability of these ecosystems [59,60]. In contrast, the low emission scenario (e.g., ssp119) exhibits more moderate temperature changes, suggesting that climate mitigation efforts could effectively mitigate lake warming.
By integrating machine learning methods and remote sensing technology, this study provides valuable insights into potential future trends in lake temperature changes. This research addresses a critical knowledge gap in large lake temperature prediction and offers essential scientific evidence for developing lake management and climate adaptation strategies. Given the context of increasingly severe global climate change, these findings are instrumental in safeguarding the health and stability of lake ecosystems.
4.3. Advancements and Limitations in LSWT Prediction Using Remote Sensing and Machine Learning
Remote sensing data are crucial for lake research, providing extensive and detailed information on LSWT across both spatial and temporal dimensions. Unlike traditional site-based monitoring methods, remote sensing offers broader geographical coverage and superior spatial and temporal resolution. This capability allows for a more comprehensive understanding of dynamic changes within lake systems.
Moreover, CMIP6 future climate data are essential supplementary inputs for LSWT predictions. The CMIP global climate models provide worldwide climate simulation data, including variables such as temperature and precipitation. By integrating CMIP data with remote sensing observations, we can effectively combine global climate scenarios with empirical data to predict future LSWT trends more accurately. The application of CMIP data also enables predictions under different scenarios, facilitating the exploration of various climate impacts on lake ecosystems.
Despite the strong correlation between air temperature and LSWT (greater than 0.96), which suggests that air temperature alone could predict LSWT effectively, the development of more sophisticated machine learning models remains advantageous. In this study, machine learning algorithms were instrumental in integrating MODIS temperature products, additional meteorological data, and CMIP grid data to construct the prediction model. These algorithms can automatically learn and identify patterns from large datasets, enhancing the accuracy and stability of LSWT predictions. While air temperature alone shows a high correlation with LSWT, incorporating multiple variables and accounting for nonlinear interactions through advanced modeling techniques yield more accurate, stable, and robust predictions. This approach improves the model’s generalizability and reliability.
While our integration of machine learning algorithms with remote sensing and CMIP6 data has achieved notable success in predicting LSWT, several limitations must be addressed to enhance model accuracy and reliability in future research.
Our primary data sources included MODIS temperature products, meteorological data, and CMIP6 auxiliary data. Despite their widespread use and established reliability, these data sources may still harbor uncertainties. Although prior studies have validated these data products, region-specific errors and limitations could affect our results. It is essential to evaluate how these uncertainties impact prediction accuracy and the generalizability of our findings across different lake systems.
Furthermore, the machine learning algorithms utilized in this study have inherent limitations. We treated values from each grid cell in the multi-layer grid images as independent datasets for training and validation, neglecting the spatial relationships between adjacent grids. This oversight may impact prediction accuracy, as spatial dependencies are crucial for improving model performance. Additionally, the choice of algorithms and model parameters significantly influences outcomes. Deep learning methods, which incorporate convolutional and temporal sequence analysis, may offer enhanced performance, particularly with larger datasets. Future research should therefore explore and compare various algorithms and conduct sensitivity analyses on model parameters to improve the reliability and robustness of LSWT prediction models.
5. Conclusions
This study applied machine learning models, including RF, XGBoost, and MLPNN, to predict LSWT for Qinghai Lake and Hulun Lake under various climate scenarios. The RF model, demonstrating superior performance, was selected for future predictions following comprehensive evaluations. The main conclusions of this research are as follows:
- (1)
- The RF model achieved exceptional accuracy with an average MAE of 0.348 °C, RMSE of 0.611 °C, and R2 of 0.9984, outperforming both XGBoost and MLPNN models. This high level of accuracy was consistent throughout both the training and validation phases.
- (2)
- Projections under the ssp585 climate scenario indicate a significant warming trend in LSWT for both lakes. The monthly mean LSWT from 2021 to 2100 shows pronounced warming during the summer months, as confirmed by the Kendall Tau correlation coefficient.
- (3)
- Emission scenarios significantly affect LSWT trends. Under the ssp585 scenario, annual LSWT increases were 0.55 °C per decade (R2 = 0.72) for Hulun Lake and 0.32 °C per decade (R2 = 0.85) for Qinghai Lake, surpassing the rates observed under ssp119 and ssp245 scenarios.
This research offers valuable insights into future spatiotemporal changes in LSWT under various emission scenarios, providing essential information for proactive environmental management and climate adaptation strategies. By thoroughly analyzing the spatial and temporal variations in LSWT across different climate scenarios, this study enhances our understanding of how lake ecosystems may respond to evolving environmental conditions. The application of the RF model ensures robust and reliable predictions, effectively capturing potential fluctuations in temperature distribution and trends. These findings are critical for supporting informed decision-making in sustainable resource management and for mitigating the impacts of climate change on vital freshwater resources.
Author Contributions
Z.L. and W.Z. designed this study. Z.L. completed the original manuscript. Z.Z., R.L. and S.X. assisted data collection and preprocessing. S.X. provided suggestions and assistance for the experimental part. Z.Z. revised and edited the first version of the manuscript and W.Z. edited the final manuscript. All authors have read and agreed to the published version of the manuscript without interest conflicts.
Funding
The present study was carried out under the support of the National Key R & D Program of China [2023YFC3206202], and Major Science and Technology Projects (Grant No: SKS-2022008) financed by the Ministry of Water Resources, China.
Data Availability Statement
The original contributions presented in the study are included in the article, further inquiries can be directed to the corresponding author.
Acknowledgments
All the authors thank the reviewers for their valuable comments and suggestions in improving the quality of the work presented.
Conflicts of Interest
The authors declare no conflict of interest.
References
- Yang, K.; Yu, Z.; Luo, Y.; Zhou, X.; Shang, C. Spatial-Temporal Variation of Lake Surface Water Temperature and Its Driving Factors in Yunnan-Guizhou Plateau. Water Resour. Res. 2019, 55, 4688–4703. [Google Scholar] [CrossRef]
- Song, K.; Wang, M.; Du, J.; Yuan, Y.; Ma, J.; Wang, M.; Mu, G. Spatiotemporal Variations of Lake Surface Temperature across the Tibetan Plateau Using MODIS LST Product. Remote Sens. 2016, 8, 854. [Google Scholar] [CrossRef]
- Wan, W.; Li, H.; Xie, H.; Hong, Y.; Long, D.; Zhao, L.; Han, Z.; Cui, Y.; Liu, B.; Wang, C.; et al. A Comprehensive Data Set of Lake Surface Water Temperature over the Tibetan Plateau Derived from MODIS LST Products 2001–2015. Sci. Data 2017, 4, 170095. [Google Scholar] [CrossRef]
- Woolway, R.; Kraemer, B.; Lenters, J.; Merchant, C.; O’Reilly, C.; Sharma, S. Global Lake Responses to Climate Change. Nat. Rev. Earth Environ. 2020, 1, 388–403. [Google Scholar] [CrossRef]
- Yang, J.; Yang, K.; Zhang, Y.; Luo, Y.; Shang, C. Maximum Lake Surface Water Temperatures Changing Characteristics under Climate Change. Environ. Sci. Pollut. Res. 2022, 29, 2547–2554. [Google Scholar] [CrossRef] [PubMed]
- O’Reilly, C.M.; Sharma, S.; Gray, D.K.; Hampton, S.E.; Read, J.S.; Rowley, R.J.; Schneider, P.; Lenters, J.D.; McIntyre, P.B.; Kraemer, B.M.; et al. Rapid and Highly Variable Warming of Lake Surface Waters around the Globe. Geophys. Res. Lett. 2015, 42, 10773–10781. [Google Scholar] [CrossRef]
- Woolway, R.; Jennings, E.; Shatwell, T.; Golub, M.; Pierson, D.; Maberly, S. Lake Heatwaves under Climate Change. Nature 2021, 589, 402–407. [Google Scholar] [CrossRef]
- Gronewold, A.D.; Stow, C.A. Water Loss from the Great Lakes. Science 2014, 343, 1084–1085. [Google Scholar] [CrossRef]
- Jeppesen, E.; Meerhoff, M.; Davidson, T.A.; Trolle, D.; Sondergaard, M.; Lauridsen, T.L.; Beklioglu, M.; Brucet, S.; Volta, P.; Gonzalez-Bergonzoni, I.; et al. Climate Change Impacts on Lakes: An Integrated Ecological Perspective Based on a Multi-Faceted Approach, with Special Focus on Shallow Lakes. J. Limnol. 2014, 73, 88–111. [Google Scholar] [CrossRef]
- Li, X.; Peng, S.; Deng, X.; Su, M.; Zeng, H. Attribution of Lake Warming in Four Shallow Lakes in the Middle and Lower Yangtze River Basin. Environ. Sci. Technol. 2019, 53, 12548–12555. [Google Scholar] [CrossRef]
- Piccolroaz, S.; Calamita, E.; Majone, B.; Gallice, A.; Siviglia, A.; Toffolon, M. Prediction of River Water Temperature: A Comparison between a New Family of Hybrid Models and Statistical Approaches. Hydrol. Process. 2016, 30, 3901–3917. [Google Scholar] [CrossRef]
- Gray, E.; Elliott, J.; Mackay, E.; Folkard, A.; Keenan, P.; Jones, I. Modelling Lake Cyanobacterial Blooms: Disentangling the Climate-Driven Impacts of Changing Mixed Depth and Water Temperature. Freshw. Biol. 2019, 64, 2141–2155. [Google Scholar] [CrossRef]
- Mei, X.; Gao, S.; Liu, Y.; Hu, J.; Razlustkij, V.; Rudstam, L.; Jeppesen, E.; Liu, Z.; Zhang, X. Effects of Elevated Temperature on Resources Competition of Nutrient and Light Between Benthic and Planktonic Algae. Front. Environ. Sci. 2022, 10, 908088. [Google Scholar] [CrossRef]
- Shuvo, A.; O’Reilly, C.; Blagrave, K.; Ewins, C.; Filazzola, A.; Gray, D.; Mahdiyan, O.; Moslenko, L.; Quinlan, R.; Sharma, S. Total Phosphorus and Climate Are Equally Important Predictors of Water Quality in Lakes. Aquat. Sci. 2021, 83, 16. [Google Scholar] [CrossRef]
- Ptak, M.; Sojka, M.; Choinski, A.; Nowak, B. Effect of Environmental Conditions and Morphometric Parameters on Surface Water Temperature in Polish Lakes. Water 2018, 10, 580. [Google Scholar] [CrossRef]
- Yu, Z.; Yang, K.; Luo, Y.; Shang, C.; Zhu, Y. Lake Surface Water Temperature Prediction and Changing Characteristics Analysis—A Case Study of 11 Natural Lakes in Yunnan-Guizhou Plateau. J. Clean. Prod. 2020, 276. [Google Scholar] [CrossRef]
- Shinohara, R.; Tanaka, Y.; Kanno, A.; Matsushige, K. Relative Impacts of Increases of Solar Radiation and Air Temperature on the Temperature of Surface Water in a Shallow, Eutrophic Lake. Hydrol. Res. 2021, 52, 916–926. [Google Scholar] [CrossRef]
- Hao, Z.; Li, W.; Wu, J.; Zhang, S.; Hu, S. A Novel Deep Learning Model for Mining Nonlinear Dynamics in Lake Surface Water Temperature Prediction. Remote Sens. 2023, 15, 900. [Google Scholar] [CrossRef]
- Zhu, S.; Ptak, M.; Yaseen, Z.M.; Dai, J.; Sivakumar, B. Forecasting Surface Water Temperature in Lakes: A Comparison of Approaches. J. Hydrol. 2020, 585, 124809. [Google Scholar] [CrossRef]
- Piotrowski, A.; Zhu, S.; Napiorkowski, J. Air2water Model with Nine Parameters for Lake Surface Temperature Assessment. Limnologica 2022, 94, 125967. [Google Scholar] [CrossRef]
- Bachmann, R.; Sharma, S.; Canfield, D.; Lecours, V. The Distribution and Prediction of Summer Near-Surface Water Temperatures in Lakes of the Coterminous United States and Southern Canada. Geosciences 2019, 9, 296. [Google Scholar] [CrossRef]
- Heddam, S.; Ptak, M.; Zhu, S. Modelling of Daily Lake Surface Water Temperature from Air Temperature: Extremely Randomized Trees (ERT) versus Air2Water, MARS, M5Tree, RF and MLPNN. J. Hydrol. 2020, 588, 125130. [Google Scholar] [CrossRef]
- Lazhu; Yang, K.; Qin, J.; Hou, J.; Lei, Y.; Wang, J.; Huang, A.; Chen, Y.; Ding, B.; Li, X. A Strict Validation of MODIS Lake Surface Water Temperature on the Tibetan Plateau. Remote Sens. 2022, 14, 5454. [Google Scholar] [CrossRef]
- Liu, G.; Ou, W.; Zhang, Y.; Wu, T.; Zhu, G.; Shi, K.; Qin, B. Validating and Mapping Surface Water Temperatures in Lake Taihu: Results From MODIS Land Surface Temperature Products. IEEE J. Sel. Top. Appl. Earth Obs. Remote Sens. 2015, 8, 1230–1244. [Google Scholar] [CrossRef]
- Batina, A.; Krtalic, A. Integrating Remote Sensing Methods for Monitoring Lake Water Quality: A Comprehensive Review. Hydrology 2024, 11, 92. [Google Scholar] [CrossRef]
- Lieberherr, G.; Wunderle, S. Lake Surface Water Temperature Derived from 35 Years of AVHRR Sensor Data for European Lakes. Remote Sens. 2018, 10, 990. [Google Scholar] [CrossRef]
- Politi, E.; Cutler, M.; Rowan, J. Using the NOAA Advanced Very High Resolution Radiometer to Characterise Temporal and Spatial Trends in Water Temperature of Large European Lakes. Remote Sens. Environ. 2012, 126, 1–11. [Google Scholar] [CrossRef]
- Malakar, N.; Hulley, G.; Hook, S.; Laraby, K.; Cook, M.; Schott, J. An Operational Land Surface Temperature Product for Landsat Thermal Data: Methodology and Validation. IEEE Trans. Geosci. Remote Sens. 2018, 56, 5717–5735. [Google Scholar] [CrossRef]
- Schaeffer, B.; Iiames, J.; Dwyer, J.; Urquhart, E.; Salls, W.; Rover, J.; Seegers, B. An Initial Validation of Landsat 5 and 7 Derived Surface Water Temperature for US Lakes, Reservoirs, and Estuaries. Int. J. Remote Sens. 2018, 39, 7789–7805. [Google Scholar] [CrossRef]
- Reinart, A.; Reinhold, M. Mapping Surface Temperature in Large Lakes with MODIS Data. Remote Sens. Environ. 2008, 112, 603–611. [Google Scholar] [CrossRef]
- Xie, C.; Zhang, X.; Zhuang, L.; Zhu, R.; Guo, J. Analysis of Surface Temperature Variation of Lakes in China Using MODIS Land Surface Temperature Data. Sci. Rep. 2022, 12, 2415. [Google Scholar] [CrossRef]
- Pachauri, R.; Qin, D.; Stocker, T. Climate Change 2013 The Physical Science Basis Working Group. I Contribution to the Fifth Assessment Report. of the Intergovernmental Panel on Climate Change Preface; Climate Change 2013: The Physical Science Basis; Stocker, T., Qin, D., Plattner, G., Tignor, M., Allen, S., Boschung, J., Nauels, A., Xia, Y., Bex, V., Midgley, P., Eds.; Cambridge University Press: Cambridge, UK, 2014; p. IX. ISBN 978-1-107-05799-9. [Google Scholar]
- Zhou Tianjun; Zou Liwei; Chen Xiaolong Commentary on the Coupled Model Intercomparison Project Phase 6 (CMIP6). Progress. Inquisitiones Mutat. Clim. 2019, 15, 445–456.
- Eyring, V.; Bony, S.; Meehl, G.A.; Senior, C.A.; Stevens, B.; Stouffer, R.J.; Taylor, K.E. Overview of the Coupled Model Intercomparison Project Phase 6 (CMIP6) Experimental Design and Organization. Geosci. Model Dev. 2016, 9, 1937–1958. [Google Scholar] [CrossRef]
- Dunne, J.P.; Horowitz, L.W.; Adcroft, A.J.; Ginoux, P.; Held, I.M.; John, J.G.; Krasting, J.P.; Malyshev, S.; Naik, V.; Paulot, F.; et al. The GFDL Earth System Model Version 4.1 (GFDL-ESM 4.1): Overall Coupled Model Description and Simulation Characteristics. J. Adv. Model. Earth Syst. 2020, 12, e2019MS002015. [Google Scholar] [CrossRef]
- Zhang, W.; Wang, S.; Zhang, B.; Zhang, F.; Shen, Q.; Wu, Y.; Mei, Y.; Qiu, R.; Li, J. Analysis of the Water Color Transitional Change in Qinghai Lake during the Past 35 Years Observed from Landsat and MODIS. J. Hydrol.-Reg. Stud. 2022, 42, 101154. [Google Scholar] [CrossRef]
- Fang, C.; Song, K.; Shang, Y.; Ma, J.; Wen, Z.; Du, J. Remote Sensing of Harmful Algal Blooms Variability for Lake Hulun Using Adjusted FM (AFAI) Algorithm. J. Environ. Inform. 2019, 34, 108–122. [Google Scholar] [CrossRef]
- Zhao, C.; Zhang, Y.; Guo, W.; Baqa, M. Dynamics and Drivers of Water Clarity Derived from Landsat and In-Situ Measurement Data in Hulun Lake from 2010 to 2020. Water 2022, 14, 1189. [Google Scholar] [CrossRef]
- Chen, T.; Guestrin, C. XGBoost: A Scalable Tree Boosting System; Association for Computing Machinery: New York, NY, USA, 2016; pp. 785–794. [Google Scholar]
- Chen, J.; Wang, X.; Lei, F. Data-Driven Multinomial Random Forest: A New Random Forest Variant with Strong Consistency. J. Big Data 2024, 11, 34. [Google Scholar] [CrossRef]
- Peng, Z.; Yang, J.; Luo, Y.; Yang, K.; Shang, C. Impact of Climate Warming on the Surface Water Temperature of Plateau Lake. Acta Geophys. 2021, 69, 895–907. [Google Scholar] [CrossRef]
- Rooney, G.; van Lipzig, N.; Thiery, W. Estimating the Effect of Rainfall on the Surface Temperature of a Tropical Lake. Hydrol. Earth Syst. Sci. 2018, 22, 6357–6369. [Google Scholar] [CrossRef]
- Yang, K.; Zhang, Y.; Luo, Y.; Shang, C. Precipitation Events Impact on Urban Lake Surface Water Temperature under the Perspective of Macroscopic Scale. Environ. Sci. Pollut. Res. 2021, 28, 16767–16780. [Google Scholar] [CrossRef]
- Schmid, M.; Hunziker, S.; Wüest, A. Lake Surface Temperatures in a Changing Climate: A Global Sensitivity Analysis. Clim. Chang. 2014, 124, 301–315. [Google Scholar] [CrossRef]
- Dokulil, M.; de Eyto, E.; Maberly, S.; May, L.; Weyhenmeyer, G.; Woolway, R. Increasing Maximum Lake Surface Temperature under Climate Change. Clim. Chang. 2021, 165, 56. [Google Scholar] [CrossRef]
- Li, J.; Sun, J.; Wang, R.; Cui, T.; Tong, Y. Warming of Surface Water in the Large and Shallow Lakes across the Yangtze River Basin, China, and Its Driver Analysis. Environ. Sci. Pollut. Res. 2023, 30, 20121–20132. [Google Scholar] [CrossRef] [PubMed]
- Stefanidis, K.; Varlas, G.; Papadopoulos, A.; Dimitriou, E. Four Decades of Surface Temperature, Precipitation, and Wind Speed Trends over Lakes of Greece. Sustainability 2021, 13, 9908. [Google Scholar] [CrossRef]
- Piccolroaz, S.; Woolway, R.; Merchant, C. Global Reconstruction of Twentieth Century Lake Surface Water Temperature Reveals Different Warming Trends Depending on the Climatic Zone. Clim. Chang. 2020, 160, 427–442. [Google Scholar] [CrossRef]
- Chen, L.; Wang, L.; Ma, W.; Xu, X.; Wang, H. PID4LaTe: A Physics-Informed Deep Learning Model for Lake Multi-Depth Temperature Prediction. Earth Sci. Inform. 2024. [Google Scholar] [CrossRef]
- Peng, S.; Ding, Y.; Liu, W.; Li, Z. 1 Km Monthly Temperature and Precipitation Dataset for China from 1901 to 2017. Earth Syst. Sci. Data 2019, 11, 1931–1946. [Google Scholar] [CrossRef]
- Jing, W.; Yang, Y.; Yue, X.; Zhao, X. A Spatial Downscaling Algorithm for Satellite-Based Precipitation over the Tibetan Plateau Based on NDVI, DEM, and Land Surface Temperature. Remote Sens. 2016, 8, 655. [Google Scholar] [CrossRef]
- Piccolroaz, S.; Toffolon, M.; Majone, B. A Simple Lumped Model to Convert Air Temperature into Surface Water Temperature in Lakes. Hydrol. Earth Syst. Sci. 2013, 17, 3323–3338. [Google Scholar] [CrossRef]
- Sharma, S.; Gray, D.K.; Read, J.S.; O’Reilly, C.M.; Schneider, P.; Qudrat, A.; Gries, C.; Stefanoff, S.; Hampton, S.E.; Hook, S.; et al. A Global Database of Lake Surface Temperatures Collected by in Situ and Satellite Methods from 1985–2009. Sci. Data 2015, 2, 150008. [Google Scholar] [CrossRef] [PubMed]
- Woolway, R.; Merchant, C. Worldwide Alteration of Lake Mixing Regimes in Response to Climate Change. Nat. Geosci. 2019, 12, 271–276. [Google Scholar] [CrossRef]
- Jia, T.; Yang, K.; Peng, Z.; Tang, L.; Duan, H.; Luo, Y. Review on the Change Trend, Attribution Analysis, Retrieval, Simulation, and Prediction of Lake Surface Water Temperature. IEEE J. Sel. Top. Appl. Earth Obs. Remote Sens. 2022, 15, 6324–6355. [Google Scholar] [CrossRef]
- Mason, L.; Riseng, C.; Gronewold, A.; Rutherford, E.; Wang, J.; Clites, A.; Smith, S.; McIntyre, P. Fine-Scale Spatial Variation in Ice Cover and Surface Temperature Trends across the Surface of the Laurentian Great Lakes. Clim. Chang. 2016, 138, 71–83. [Google Scholar] [CrossRef]
- Toffolon, M.; Piccolroaz, S.; Calamita, E. On the Use of Averaged Indicators to Assess Lakes’ Thermal Response to Changes in Climatic Conditions. Environ. Res. Lett. 2020, 15, 034060. [Google Scholar] [CrossRef]
- Zhong, Y.; Notaro, M.; Vavrus, S. Spatially Variable Warming of the Laurentian Great Lakes: An Interaction of Bathymetry and Climate. Clim. Dyn. 2019, 52, 5833–5848. [Google Scholar] [CrossRef]
- Huber, V.; Adrian, R.; Gerten, D. Phytoplankton Response to Climate Warming Modified by Trophic State. Limnol. Oceanogr. 2008, 53, 1–13. [Google Scholar] [CrossRef]
- Livingstone, D. Impact of Secular Climate Change on the Thermal Structure of a Large Temperate Central European Lake. Clim. Chang. 2003, 57, 205–225. [Google Scholar] [CrossRef]
Disclaimer/Publisher’s Note: The statements, opinions and data contained in all publications are solely those of the individual author(s) and contributor(s) and not of MDPI and/or the editor(s). MDPI and/or the editor(s) disclaim responsibility for any injury to people or property resulting from any ideas, methods, instructions or products referred to in the content. |
© 2024 by the authors. Licensee MDPI, Basel, Switzerland. This article is an open access article distributed under the terms and conditions of the Creative Commons Attribution (CC BY) license (https://creativecommons.org/licenses/by/4.0/).