Article

Satellite Observations Reveal Northward Vegetation Greenness Shifts in the Greater Mekong Subregion over the Past 23 Years

1
Yunnan Key Laboratory of Soil Erosion Prevention and Green Development, Yunnan University, Kunming 650500, China
2
Institute of International Rivers and Eco-Security, Yunnan University, Kunming 650500, China
*
Author to whom correspondence should be addressed.
Remote Sens. 2024, 16(17), 3302; https://doi.org/10.3390/rs16173302
Submission received: 28 July 2024 / Revised: 28 August 2024 / Accepted: 2 September 2024 / Published: 5 September 2024

Abstract

:
The Greater Mekong Subregion (GMS) economic cooperation program is an effective and fruitful regional cooperation initiative for socioeconomic development in Asia; however, the vegetation change trends and directions in the GMS caused by rapid development remain unknown. In particular, there is a current lack of comparative studies on vegetation changes in various countries in the GMS. Based on the MODIS normalized difference vegetation index (NDVI) time series data, this study analyzed the spatiotemporal patterns of vegetation coverage and their trends in the GMS from 2000 to 2022 using the Theil–Sen slope estimation, the Mann–Kendall mutation test, and the gravity center migration model. The key findings were as follows: (1) the NDVI in the GMS showed an overall upward fluctuating trend over the past 23 years, with an annual growth rate of 0.11%. The NDVI changes varied slightly between seasons, with the greatest increases recorded in summer and winter. (2) The spatial distribution of NDVI in the GMS varied greatly, with higher NDVI values in the north–central region and lower NDVI values in the south. (3) A total of 66.03% of the GMS area showed increments in vegetation during the studied period, mainly in south–central Myanmar, northeastern Thailand, Vietnam, and China. (4) From 2000 to 2022, the gravity center of vegetation greenness shifted northward in the GMS, especially from 2000 to 2005, indicating that the growth rates of vegetation in the north–central part of the GMS were higher than those in the south. Furthermore, the vegetation coverage in all countries, except Cambodia, increased, with the most pronounced growth recorded in China. Overall, these findings can provide scientific evidence for the GMS to enhance ecological protection and sustainable development.

1. Introduction

The Greater Mekong Subregion (GMS) economic cooperation mechanism was jointly launched by six countries in the Lancang–Mekong River area, at the initiative of the Asian Development Bank, in 1992 [1]. Since this initiative was launched, the GMS has become one of the fastest-growing and most productive regions in Asia [2]. Additionally, as a key investment and trade region within the Belt and Road Initiative, the GMS plays an integral role in the 21st Century Maritime Silk Road partnership promoted by China [3]. Furthermore, the GMS has rich biodiversity and carbon stocks, which has important impacts on the global carbon cycle [4,5]. As a result, the GMS region has received much international attention. However, the GMS has undergone substantial and rapid changes due to the impacts of extreme climate events and human activity, causing significant changes in vegetation cover that may jeopardize the sustainable development of the region. In addition, there has been massive economic expansion and population growth in the GMS, which has contributed greatly to the development of sectors in recent decades, such as infrastructure and hydropower. Hence, exploring the spatiotemporal patterns of vegetation growth in the GMS and their trend changes are crucial for promoting coordinated socioeconomic development between countries and supporting the global carbon cycle.
Vegetation is a crucial element of terrestrial ecosystems, serving as a natural bridge between soil, atmosphere, and water, while also acting as a sensitive indicator of global eco-environmental changes [6,7]. Monitoring the growth changes of vegetation and rationalizing integrated planning can promote regional ecological protection [8]. However, previous studies on the GMS have primarily focused on issues such as land use change [9], deforestation [10,11], and factors influencing vegetation [12,13]. To our knowledge, dynamic vegetation changes in the GMS region have not been analyzed in-depth, especially in terms of vegetation change characteristics in different seasons. In addition, while the GMS includes six countries, there is a current lack of comparative studies on vegetation changes in these countries, making it difficult to coordinate sustainable ecological and economic development on a regional scale. Therefore, there is an urgent need for in-depth studies of vegetation dynamics across the GMS.
The normalized difference vegetation index (NDVI) is an important metric for monitoring vegetation growth and ecological environment changes [6,14]. Compared to other vegetation indices, NDVI has a wide range of applications and is often considered the best indicator for assessing vegetation growth and cover [6,15,16]. The commonly applied long time-series NDVI datasets include GIMMS-NDVI3g, AVHRR-NDVI, MODIS-NDVI, and SPOT-VGT NDVI [17,18]. The comparative analyses of the above four products have revealed that MODIS NDVI, characterized by a moderate spatial resolution from 250 m to 1 km and a temporal resolution from 8 to 16 days [6,19], can effectively capture vegetation changes across different periods; thus, this product is widely applied to the study of long-term vegetation dynamics at a regional scale [20]. Given the combined evidence, we selected MODIS NDVI data in this study to analyze the spatiotemporal distribution patterns and change trends in the vegetation within the GMS.
To monitor vegetation evolution, many researchers have used linear trend analysis and correlation analysis to explore dynamic spatiotemporal changes in vegetation [6,21]. However, recent studies have found that vegetation dynamics follow a nonlinear change trend instead [8]. Although various researchers have applied nonlinear methods (Sen and Mann–Kendall trend analysis) to study the factors driving vegetation evolution, in-depth analyses of vegetation dynamics have been rarely performed to date [12,17]. Accurately extracting precise details of vegetation dynamic changes (including temporal trends, spatial changes, and mutation point detection) from massive time-series records is a prerequisite for studying changes in vegetation dynamics [22]. In addition, few researchers have explored the magnitude and direction of migration in vegetation dynamics. The gravity center migration model can effectively describe long-term spatial evolution trends and has achieved good results in urban expansion and aeolian erosion [23,24]. However, this technique has rarely been applied to vegetation dynamics. Therefore, this study integrates nonlinear analysis and the gravity center migration model to gain an in-depth understanding of vegetation changes in the GMS region, which will provide scientific significance for ecological conservation and sustainable development in the region.
Given the above discussion, to achieve a better understanding of the long-term growth dynamics of vegetation in the GMS, this study quantitatively analyzed the spatiotemporal patterns of vegetation coverage and change trends in the GMS from 2000 to 2022 based on MODIS NDVI time series data, using Sen’s slope estimation, the Mann–Kendall mutation test, and the gravity center migration model. Specifically, the main aims of this study are to (1) analyze the temporal features of intra- and interannual vegetation changes in the GMS, including the detection of long-term trends and mutation points; (2) explore the differences and trends in vegetation cover changes in different countries within the GMS region; and (3) reveal the migration direction and magnitude of vegetation change in the GMS, based on the gravity center migration model.

2. Materials and Methods
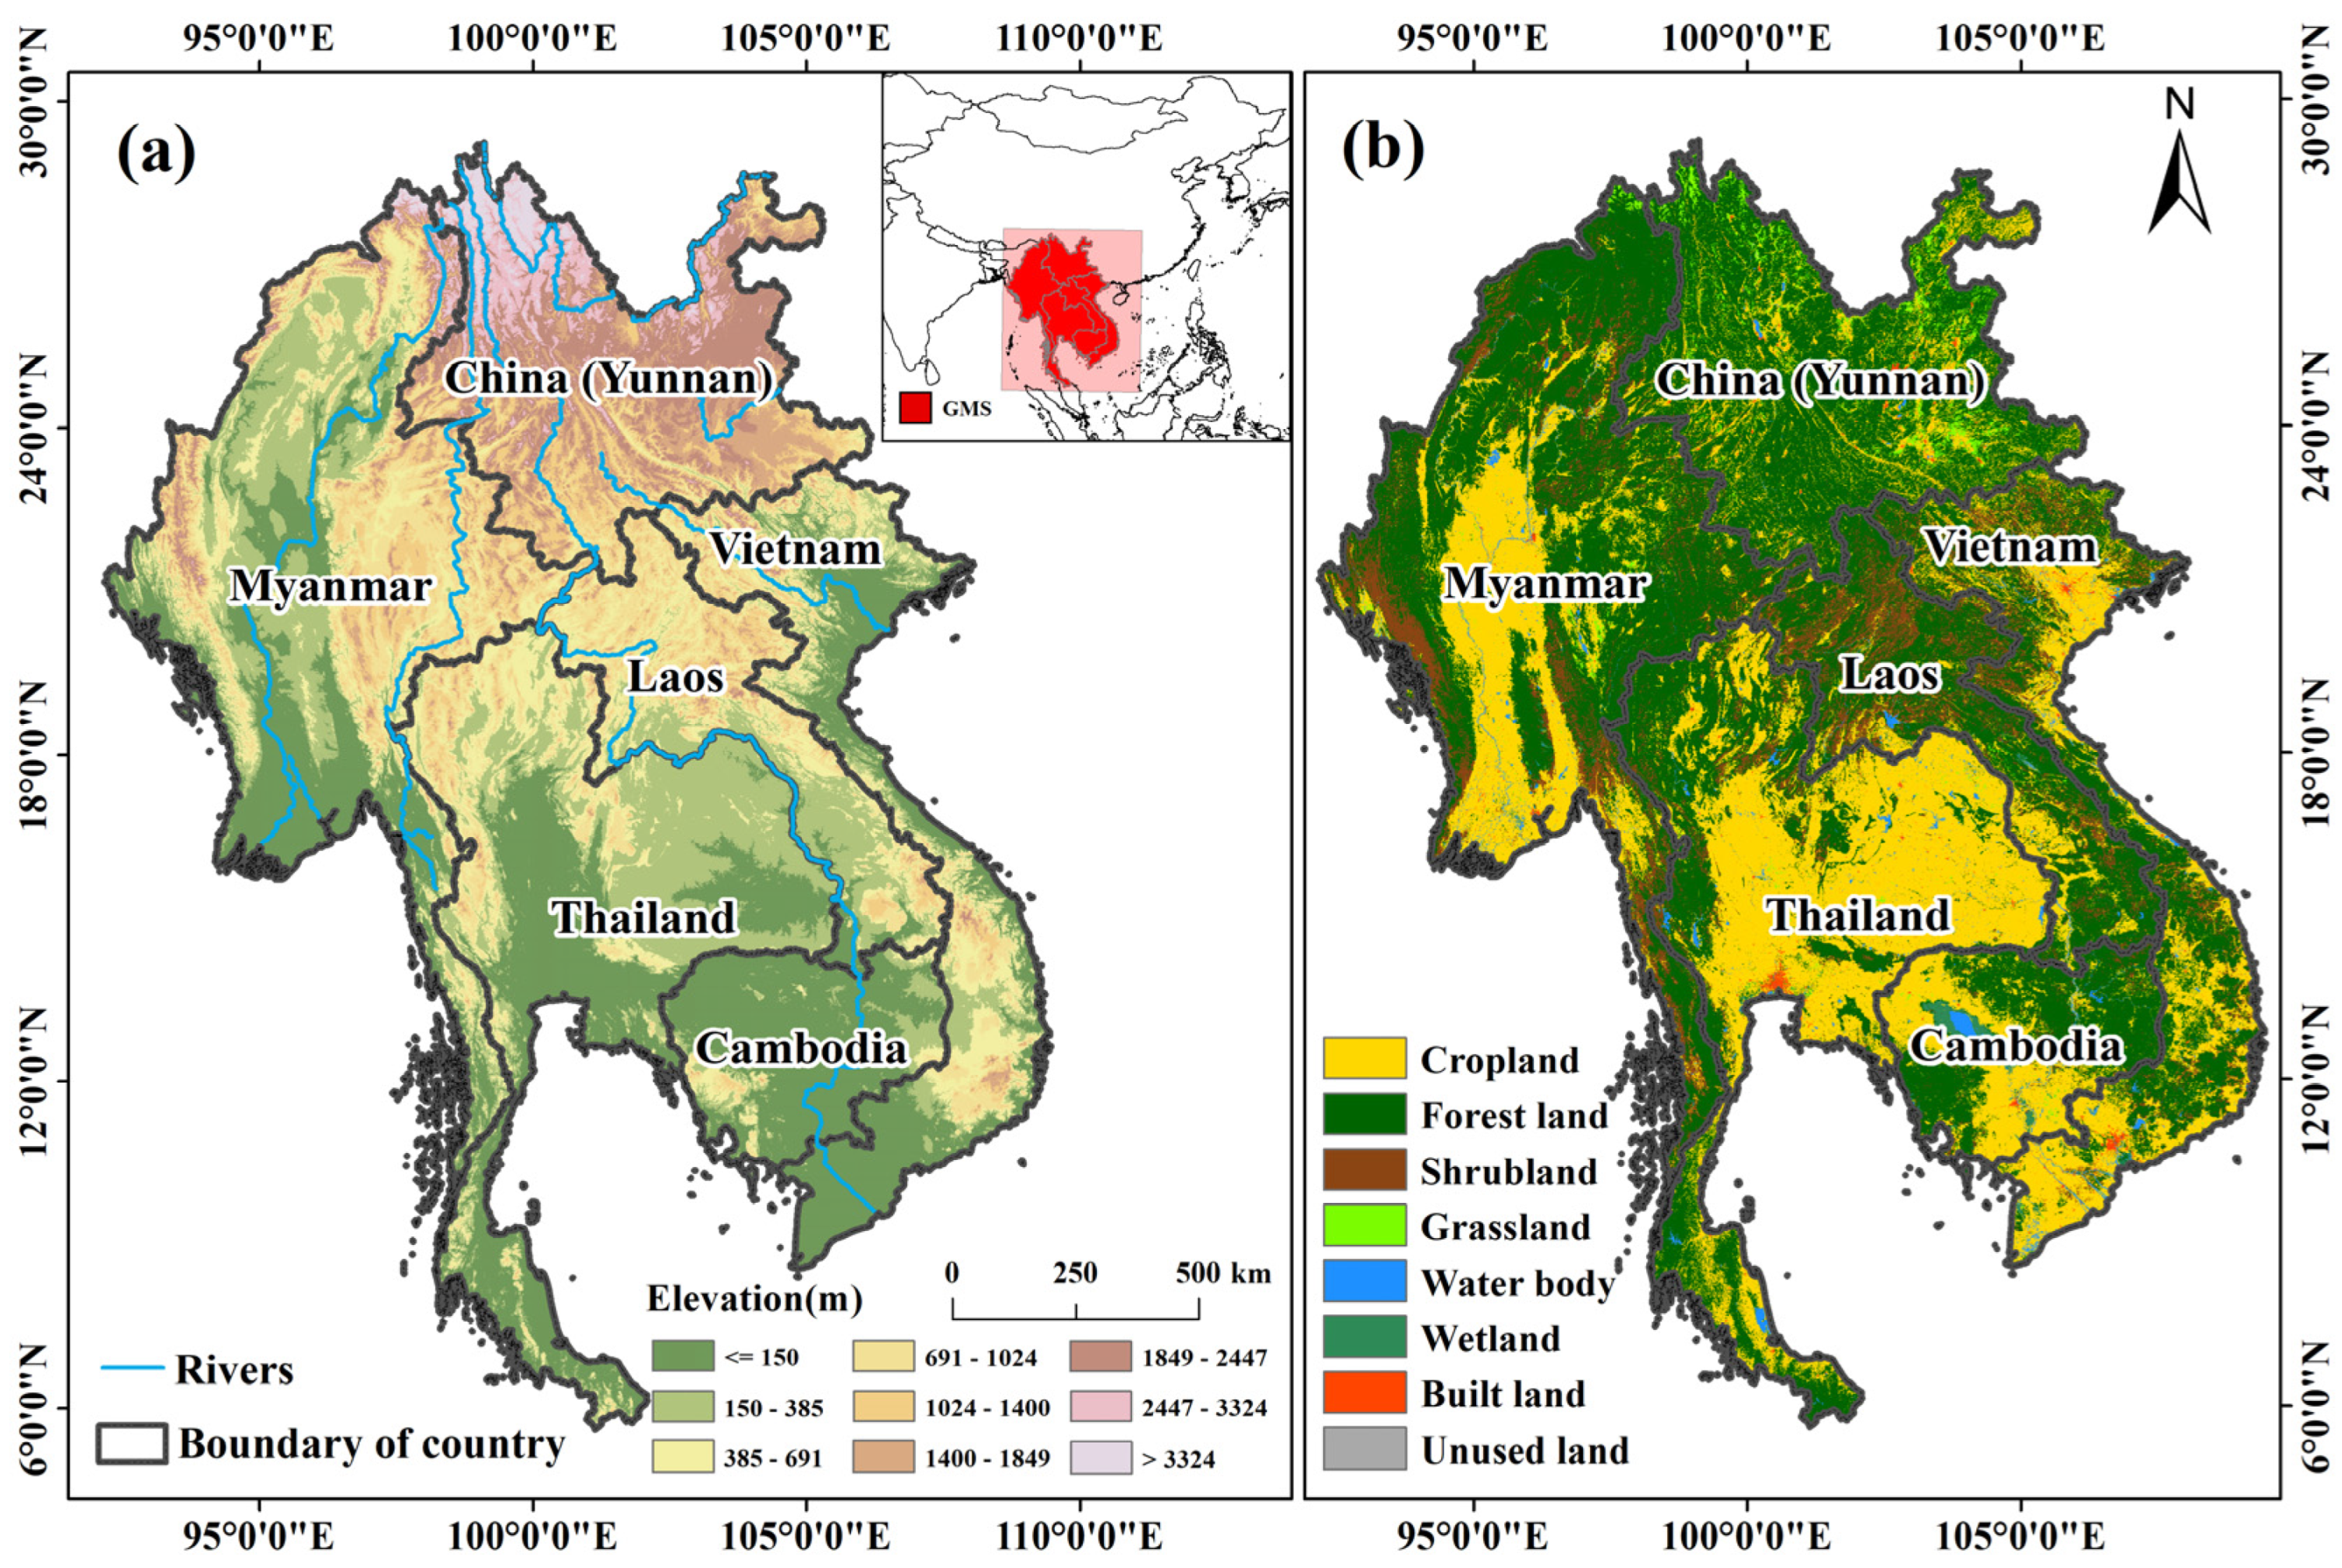
2.1. Study Area

The GMS is a six-country economic cooperation region comprising Cambodia, Laos, Myanmar, Thailand, Vietnam, and China (specifically the Yunnan Province) (Figure 1), spanning latitudes 5.61–29.22°N and longitudes 92.17–112.05°E and covering a total area of 2,568,600 km2 [25]. The region has complex topography, with pronounced differences in elevation, characterized by a gradual transition from highlands to lowlands from north to south. High mountains (mainly in China’s Yunnan Province and Myanmar) and hills (primarily in Laos, Thailand, and northern Vietnam) dominate the northern part of the GMS, with altitudes ranging from 76 to 3065 m above sea level. The GMS has a tropical monsoon climate, which is characterized by a wet season from May to October, affected by the southwest monsoon from the ocean, and a dry season from November to April, influenced by the northeast monsoon from the continent. The region has a total population of about 320 million, with varying population densities and socio-economic conditions. Most of the population and economic activity are concentrated within the lower-lying plains and estuary areas, making these some of the most heavily populated areas in the world. The economy of the GMS relies mainly on agriculture, manufacturing, and services, of which agriculture is particularly important, with the cultivation of rice, corn, and tropical fruits. Therefore, it is important to study the vegetation dynamics to achieve sustainable development in the region.

2.2. Data Resources and Preprocessing

This study uses MODIS NDVI data, digital elevation model data, and administrative division vector data within the study area. The NDVI data were derived from the MODIS 16-day synthetic 250 m spatial resolution MOD13Q1 vegetation index product spanning the period 2000 to 2022, available on the Google Earth Engine (GEE) platform (https://earthengine.google.com/, accessed on 23 August 2023). The MODIS-NDVI dataset was corrected for the effects of distortion and radiation during the data preprocessing stage, in addition to reducing the interference effects of water bodies, clouds, and aerosols [22]. In this study, we used the GEE platform to perform a series of preprocessing steps for the MODIS NDVI data, which included image stitching, coordinate system conversion, and regional cropping. To minimize the effects of atmospheric interference, cloud cover, scan angle variations, and solar zenith angle on image pixel values, we applied the maximum value composite method to generate time series data of NDVI by annual and seasonal analyses [26]. For the seasonal analysis, we followed standard meteorological classifications, dividing the year into four periods: spring (March–May), summer (June–August), autumn (September–November), and winter (December–February) [17]. Additional data, including watershed boundaries, were obtained from the HydroSHEDS website (https://www.hydrosheds.org/, accessed on 18 August 2023), while the administrative division data for the study area were sourced from a global repository containing one million primary geographic datasets (https://www.resdc.cn/data.aspx?DATAID=259, accessed on 5 August 2023).

2.3. Methods

2.3.1. Mann–Kendall Mutation Test

The Mann–Kendall mutation test can be used to assess monotonic trends in a time series [27]. For a given time series x1, x2, …, xn, we define mi as the cumulative number of cases, where xi > xj (1 ≤ ji). The test statistics are subsequently calculated as follows:
d k = i = 1 k   m i , 2 k n
Assuming the original sequence is randomly independent, the statistic UFk is calculated as follows:
U F k = d k E d k v a r d k
where the mean and variance of dk are expressed as
  E d k = k k 1 4
  v a r d k = k k 1 2 k + 5 72
UFk follows a standard normal distribution, which can be expressed in reverse order as follows:
  U B k = U F k
The mutation point in the NDVI time series can be pinpointed by examining the statistical sequences UFk and UBk [17]. A positive UFk value (i.e., UFk > 0) signifies an increasing trend in the series, while a negative value indicates a decreasing trend. The series exhibits a significant increasing or decreasing trend (with a 95% confidence interval), when the series exceeds the threshold α = 0.05. The intersection of the curves UFk and UBk represents the mutation point, and its corresponding time value indicates when the mutation begins. The values of UFk and UBk were calculated using the Python programming language.

2.3.2. Trend Analysis

The Theil–Sen slope estimator is a robust non-parametric statistical approach introduced by Henri Theil [26] and Pranab K. Sen [28]. Notably, this method can analyze time series data without requiring assumptions of serial autocorrelation or normal distribution. Furthermore, this approach is resilient in handling minor outliers and data gaps, making it particularly useful for datasets containing potential noise or missing values. The calculation formula for this estimator is as follows:
β = Median ( X j X i j i ) , ( 2000 i < j 2022 )
where β denotes the median slope value derived from the entire dataset. A positive β value (β > 0) signifies an increasing trend in vegetation cover, whereas a negative β value (β < 0) indicates a decreasing trend in vegetation cover. X denotes a variable in the time series, where Xi and Xj represent the pixel values in year i and year j, respectively. The median operator represents the median value.
The Mann–Kendall test is a non-parametric statistical method for evaluating trend significance [29,30]. In this study, we applied the Mann–Kendall test to determine the statistical significance of the observed vegetation trends. The calculations are as follows:
Z = S 1 v a r S ,   S > 0 0 ,   S = 0 S + 1 v a r S ,   S < 0
S = j = 1 n 1   i = j + 1 a   s g n x j x i
sgn x j x i = 1 ,   x j x i > 0 0 ,   x j x i = 0 1 ,   x j x i < 0
s S = n n 1 2 n + 5 18
where xi and xj have the same meaning as described above (1). The variable n denotes the time series length, while sgn represents the sign function. The Z statistic ranges from negative to positive infinity. A |Z| value exceeding Z(1−α/2) indicates statistically significant changes in the analyzed sequence at the chosen significance level α (0.05 here). Our study integrates Sen’s slope estimation, with the Mann–Kendall significance test to generate the Sen-MK trend, as shown in Table 1.

2.3.3. Gravity Center Migration Model

The center of gravity migration model was used in this study to analyze the spatial trends in vegetation change across the GMS from 2000 to 2022 [31]. This model can effectively capture the dynamic changes in the center of gravity of the NDVI distribution throughout the study period, revealing spatial patterns of vegetation dynamics over time. The details of the model are described below:
  X = i = 1 n C i × X i i = 1 n C i ,   Y = i = 1 n C i × Y i i = 1 n C i
where X and Y represent the latitudinal and longitudinal coordinates, respectively, of the vegetation distribution’s center of gravity for different regions. Ci is the areal extent of vegetation patches in the i-th region, while Xi and Yi indicate the latitudinal and longitudinal coordinates of the centers of gravity for vegetation distribution patches within the i-th region, respectively.

3. Results

3.1. Spatiotemporal Variation in Vegetation Cover

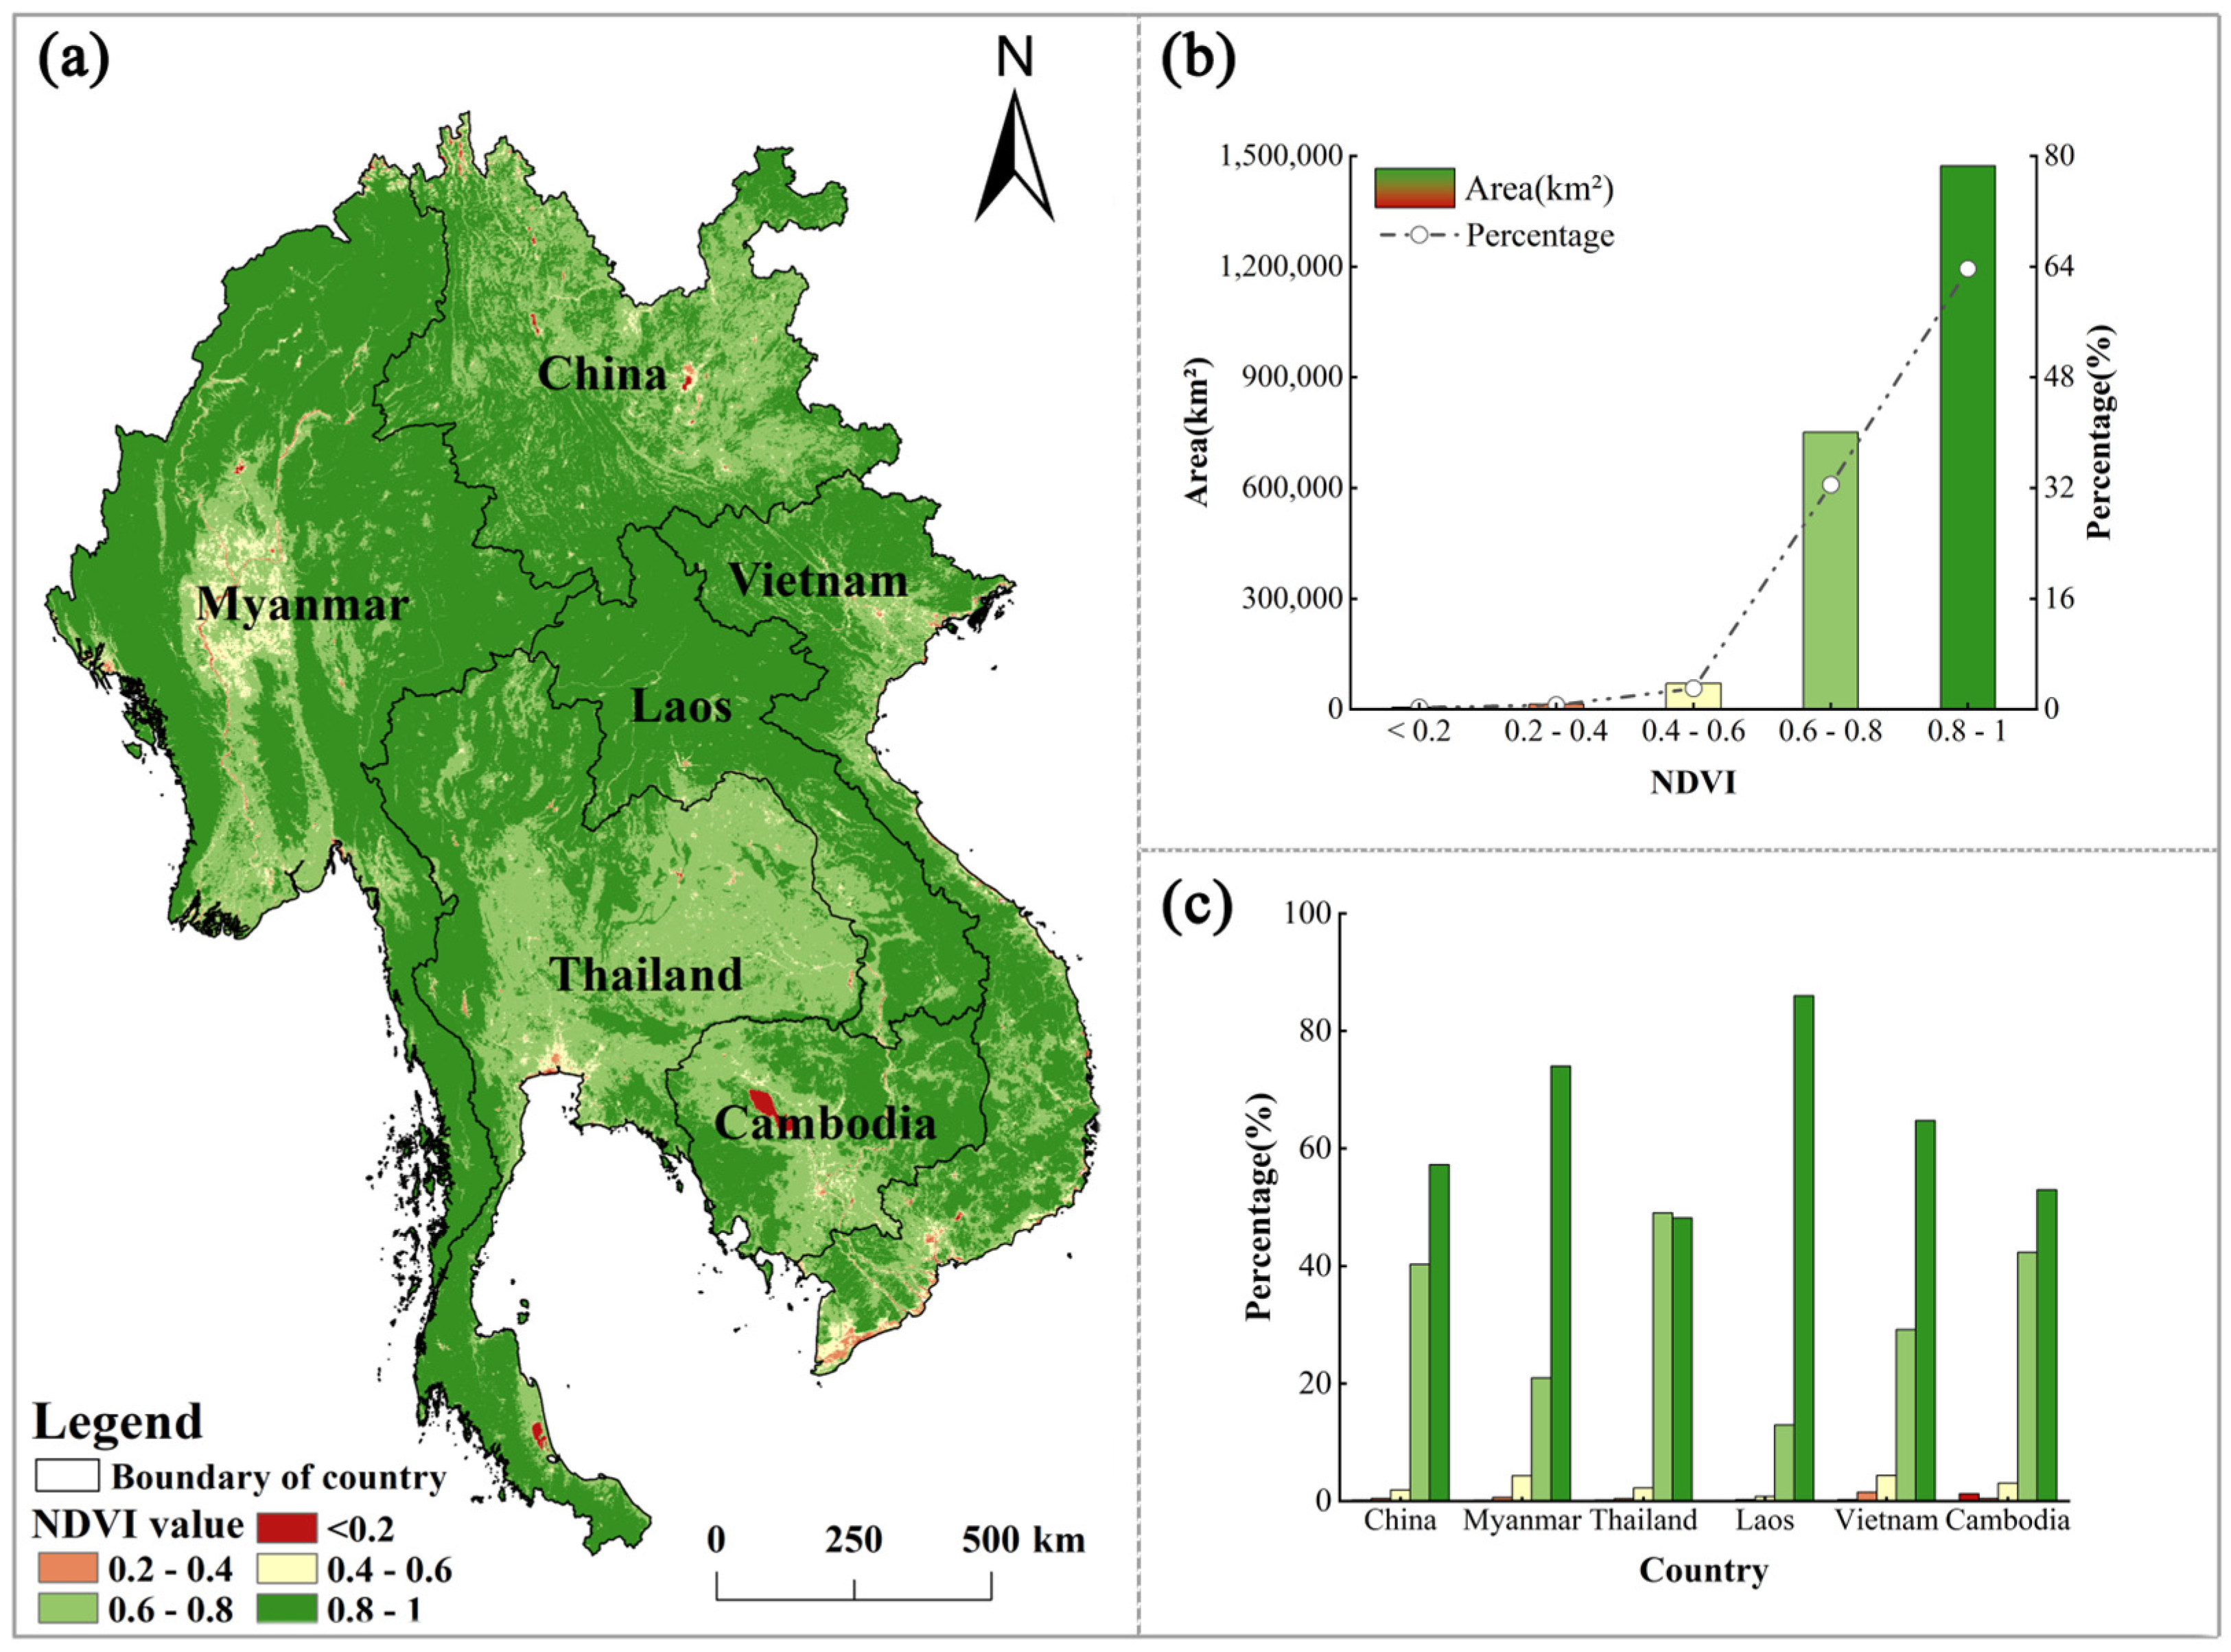
3.1.1. Spatial Distribution Patterns of Vegetation Coverage

We mapped the spatial distribution of the average NDVI in the GMS from 2000 to 2022 (Figure 2). The mean NDVI values across the GMS show obvious spatial differences, with higher NDVI values in the north–central area and lower NDVI values in the south. The areas with average NDVI values exceeding 0.8 account for around 63.68% of the total studied area (Figure 2b) and are predominantly distributed in the southern Yunnan Province of China, northern Myanmar, Laos, and the border between Myanmar and Thailand (Figure 2a). These regions are dominated by forest land and shrubland, with large areas of dense evergreen forests, deciduous broad-leaved forests, and tropical rainforests. However, areas with NDVI values less than 0.4 are scattered in the Irrawaddy Delta, the Mekong Delta, Red River Plain, urban areas, and water bodies, accounting for about 0.85% of the GMS. In terms of the countries comprising the GMS, the NDVI values of each country largely exceed 0.6, representing more than 93% of the area of each country (Figure 2c), thus confirming the high levels of vegetation cover in the GMS.

3.1.2. Temporal Variations in Vegetation Coverage

During 2000–2022, the annual mean NDVI value of the GMS exhibited a fluctuating increase, with a growth rate of 0.11% (Figure 3a), indicating that the vegetation in the study area showed an overall greening trend. The average NDVI value was 0.808 over the studied 23 years, with peak and minimum values recorded in 2021 (0.82) and 2004 (0.78), respectively. The Mann–Kendall mutation test indicated a slightly decreasing trend in vegetation cover from 2003 to 2008 and gradually increasing trends from 2000 to 2002 and 2009 to 2011 (Figure 3f). The mutation occurred in 2011, and the statistical values since then have exceeded the critical confidence coefficient (1.96).
In addition, we further explored the vegetation change characteristics throughout different seasons in the GMS. Our results revealed that the mean NDVI values of the GMS vary markedly in different seasons, and the four seasons in descending order of average NDVI value were autumn (0.78), summer (0.75), winter (0.71), and spring (0.67). From 2000 to 2022, the growth rates of NDVI in different seasons, from large to small, were as follows: winter (0.15%), summer (0.15%), autumn (0.11%), and spring (0.08%) (Figure 3b–e). Specifically, the spring NDVI change trend did not exceed the critical confidence coefficient (UK(k) = 1.96) during the period 2000–2022. While this parameter showed a general decreasing and then increasing trend, these trends were not significant. The summer NDVI showed a slight increasing trend between 2000 and 2006, with several mutations (UK(k) > 1.96) between 2006 and 2022, resulting in a significant increase in vegetation cover overall. The autumn NDVI values in the GMS exhibited an upward trend, and, after a mutation in 2010 (UK(k) > 1.96), the increasing trend became more pronounced over time, resulting in a significant increase in vegetation cover. In the winter, the NDVI exhibited a slight decreasing trend from 2004 to 2011 and then maintained an increasing trend for the rest of the studied period. However, similar to the autumn, there was also a notable mutation in the winter of 2012, at which point the vegetation cover trend changed from a slight increase to a significant increase (Figure 3g–j).

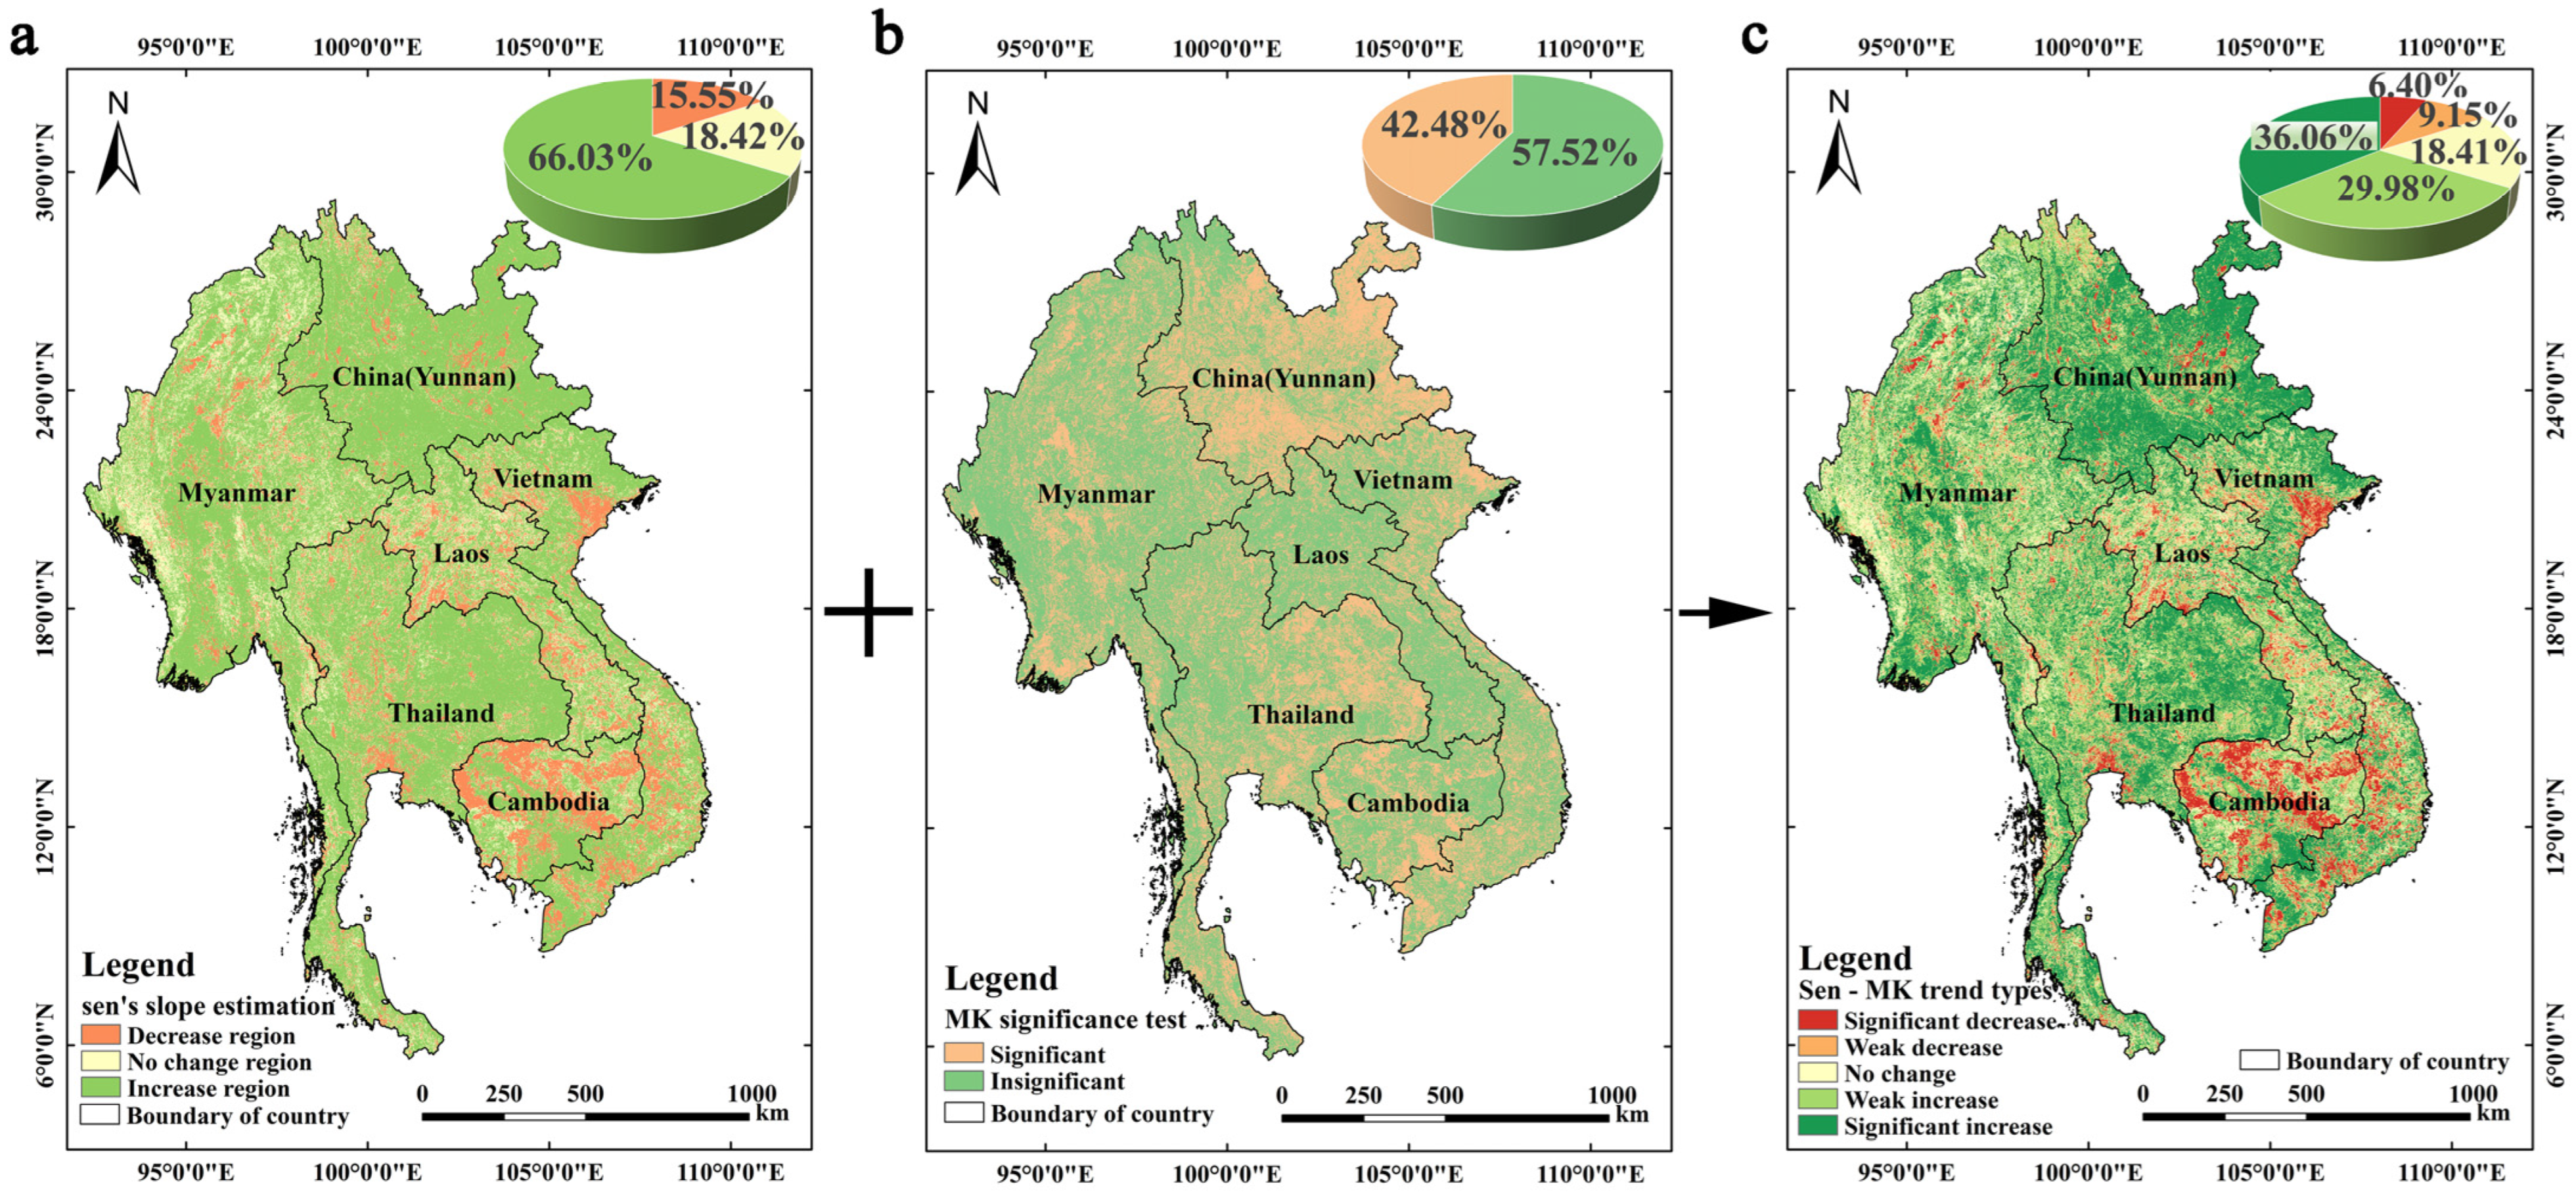
3.2. Change Trends in Vegetation Coverage

The change trends and significance of each pixel from 2000 to 2020 were calculated using Sen’s slope estimation and the Mann–Kendall significance test. The results showed that the vegetation cover improved in 66.03% of the GMS during the studied period, while the degraded and unchanged areas accounted for 15.55% and 18.42% of the GMS, respectively. The areas of improved vegetation cover are mainly distributed in south–central Myanmar, northeastern Thailand, Vietnam, and China’s Yunnan Province, whereas the degraded areas are mainly located in Laos, southwestern Vietnam, and Cambodia (Figure 4a). Significantly more of the area improved than degraded in terms of vegetation cover, with a positive overall trend, suggesting the effective restoration of vegetation cover in the GMS over this period. Furthermore, the Mann–Kendall significance test demonstrated that the trends observed in 42.48% of the area were significant. These areas were mainly located in China, Myanmar, Cambodia, eastern Thailand, and northern Vietnam (Figure 4b), with China having the highest percentage of significant regions.
In addition, we used spatial analysis methods to superimpose the Sen’s slope estimates and the Mann–Kendall significance test results to further explore the characteristics of vegetation cover changes in the GMS over the studied period (Figure 4c). We identified significant regional differences in vegetation changes in the GMS from 2000 to 2022. The regions with the significant increases in vegetation cover accounted for 36.06% of the total area of the GMS and were mainly concentrated in northeastern Thailand and the Yunnan Province of China (Figure 4c). The area of slightly increased vegetation cover accounted for 29.98% of the GMS and was evenly distributed among the GMS countries. In contrast, 18.41% of the GMS showed no change in vegetation cover, with this class mainly located in Myanmar and Laos. The vegetation cover decreased slightly in 9.15% of the area, primarily in Laos, Cambodia, and Vietnam. In addition, 6.40% of the area exhibited a significant decrease in vegetation cover, mainly in the southern basin of Cambodia.

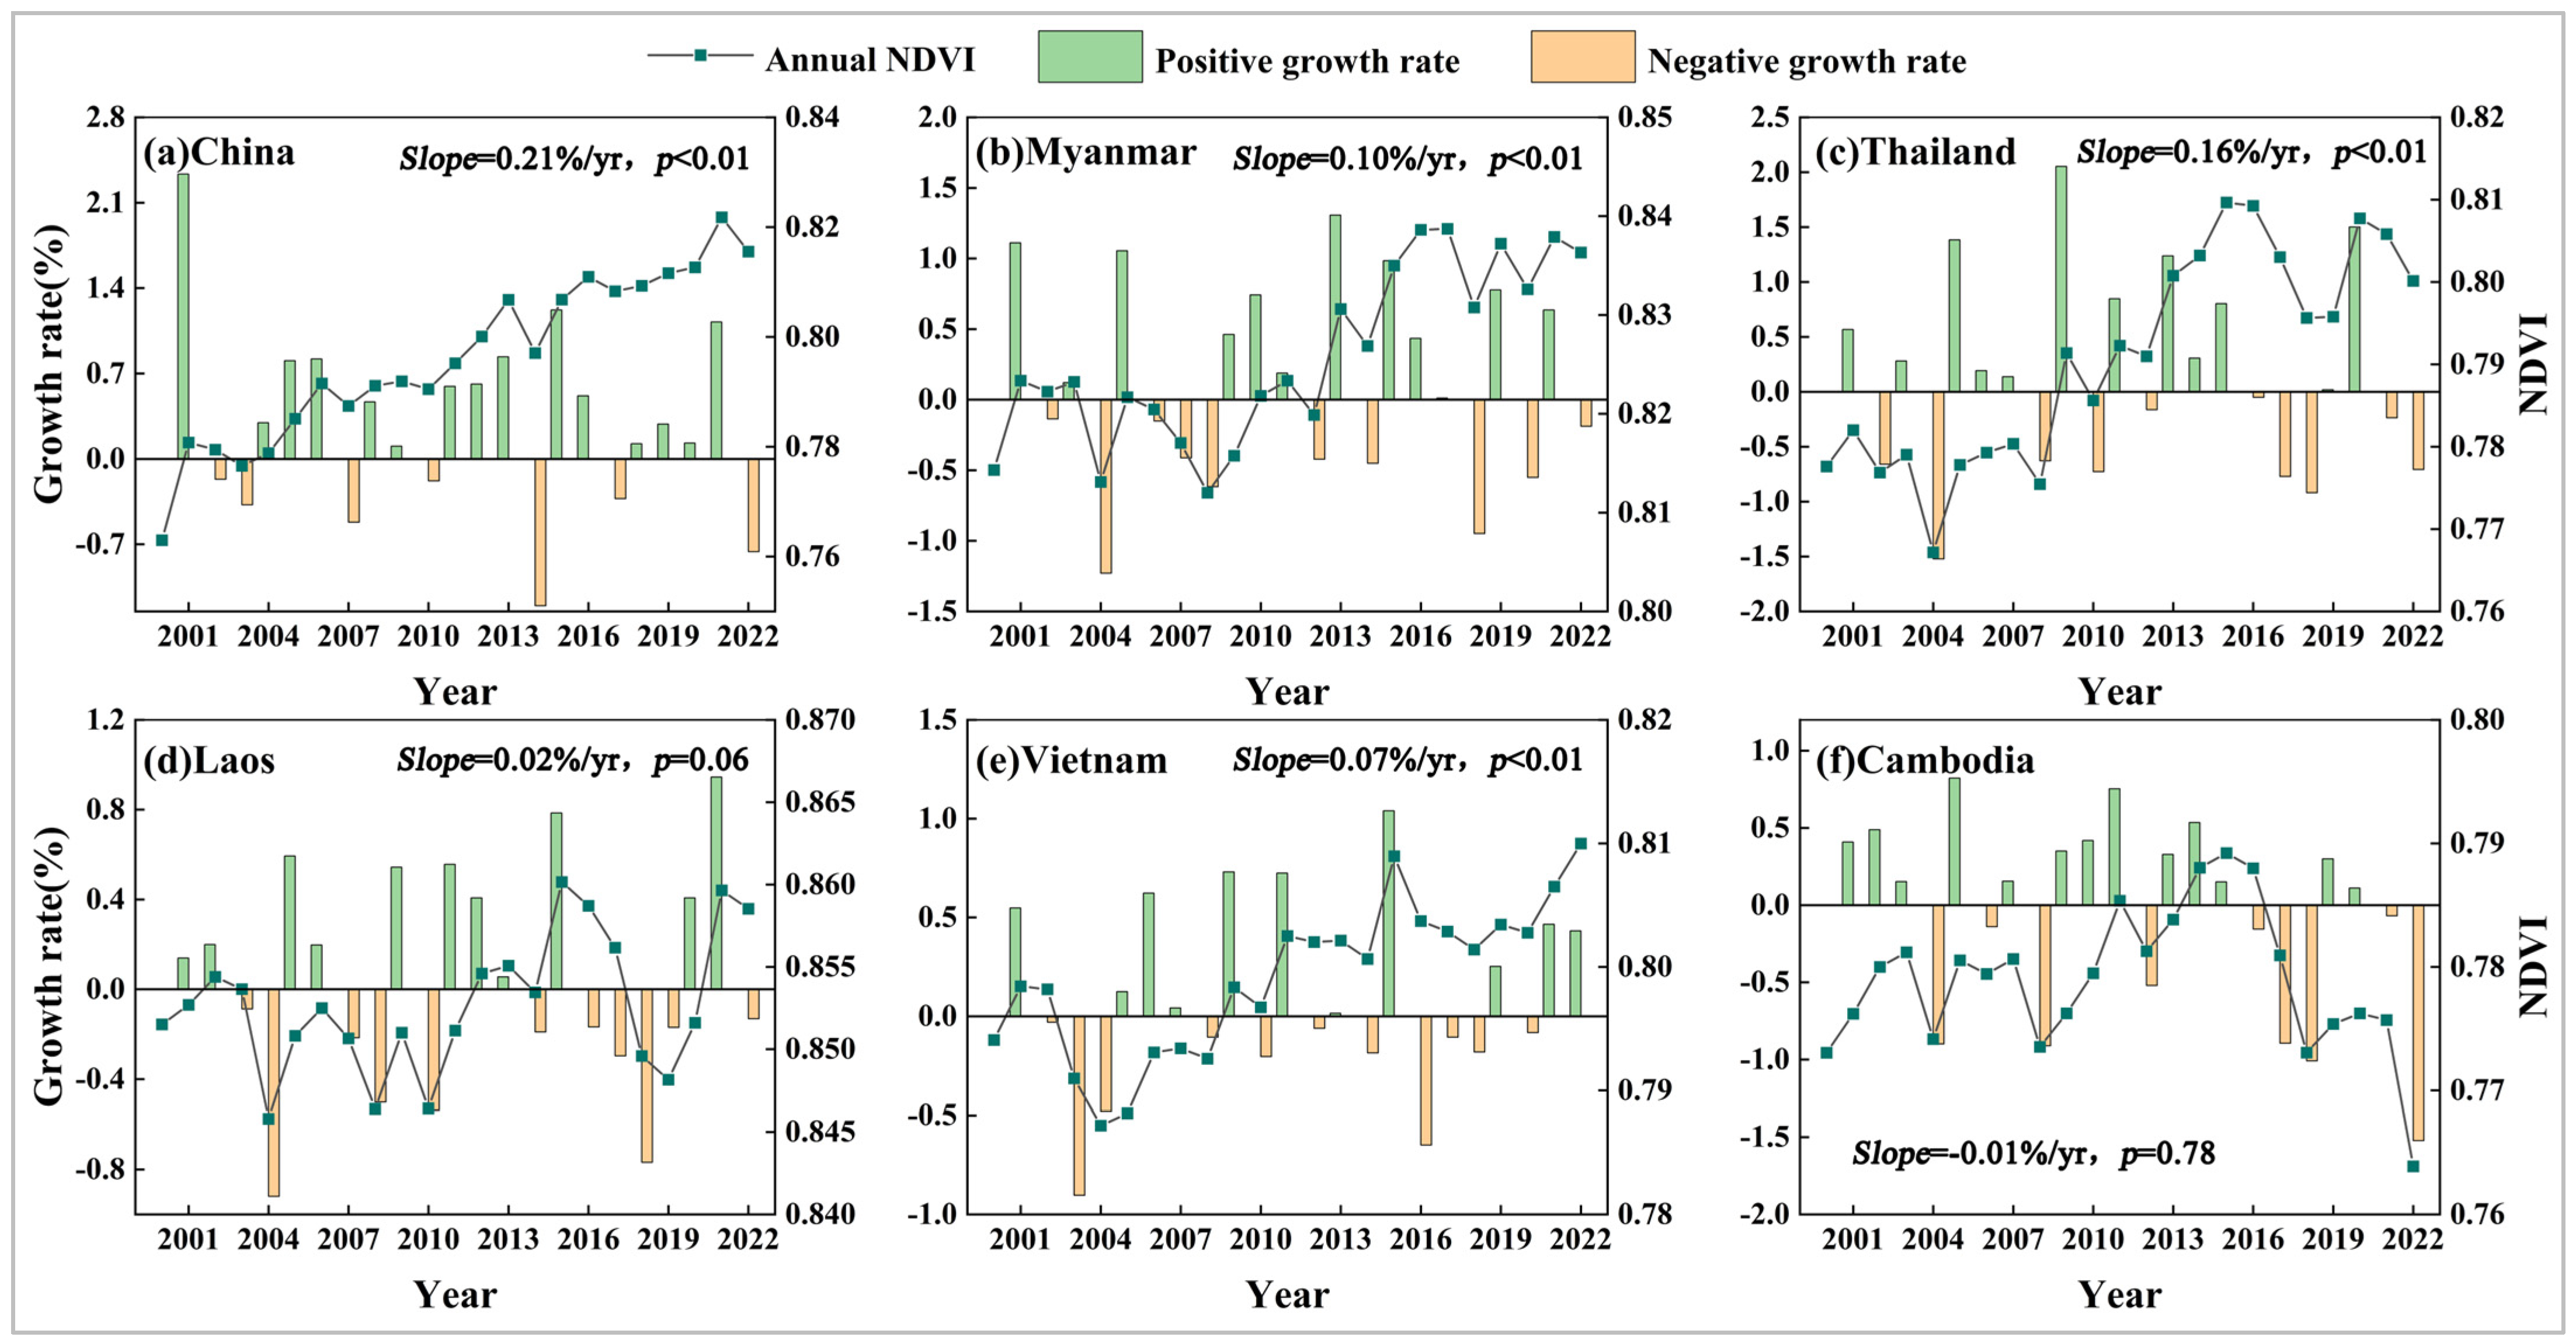
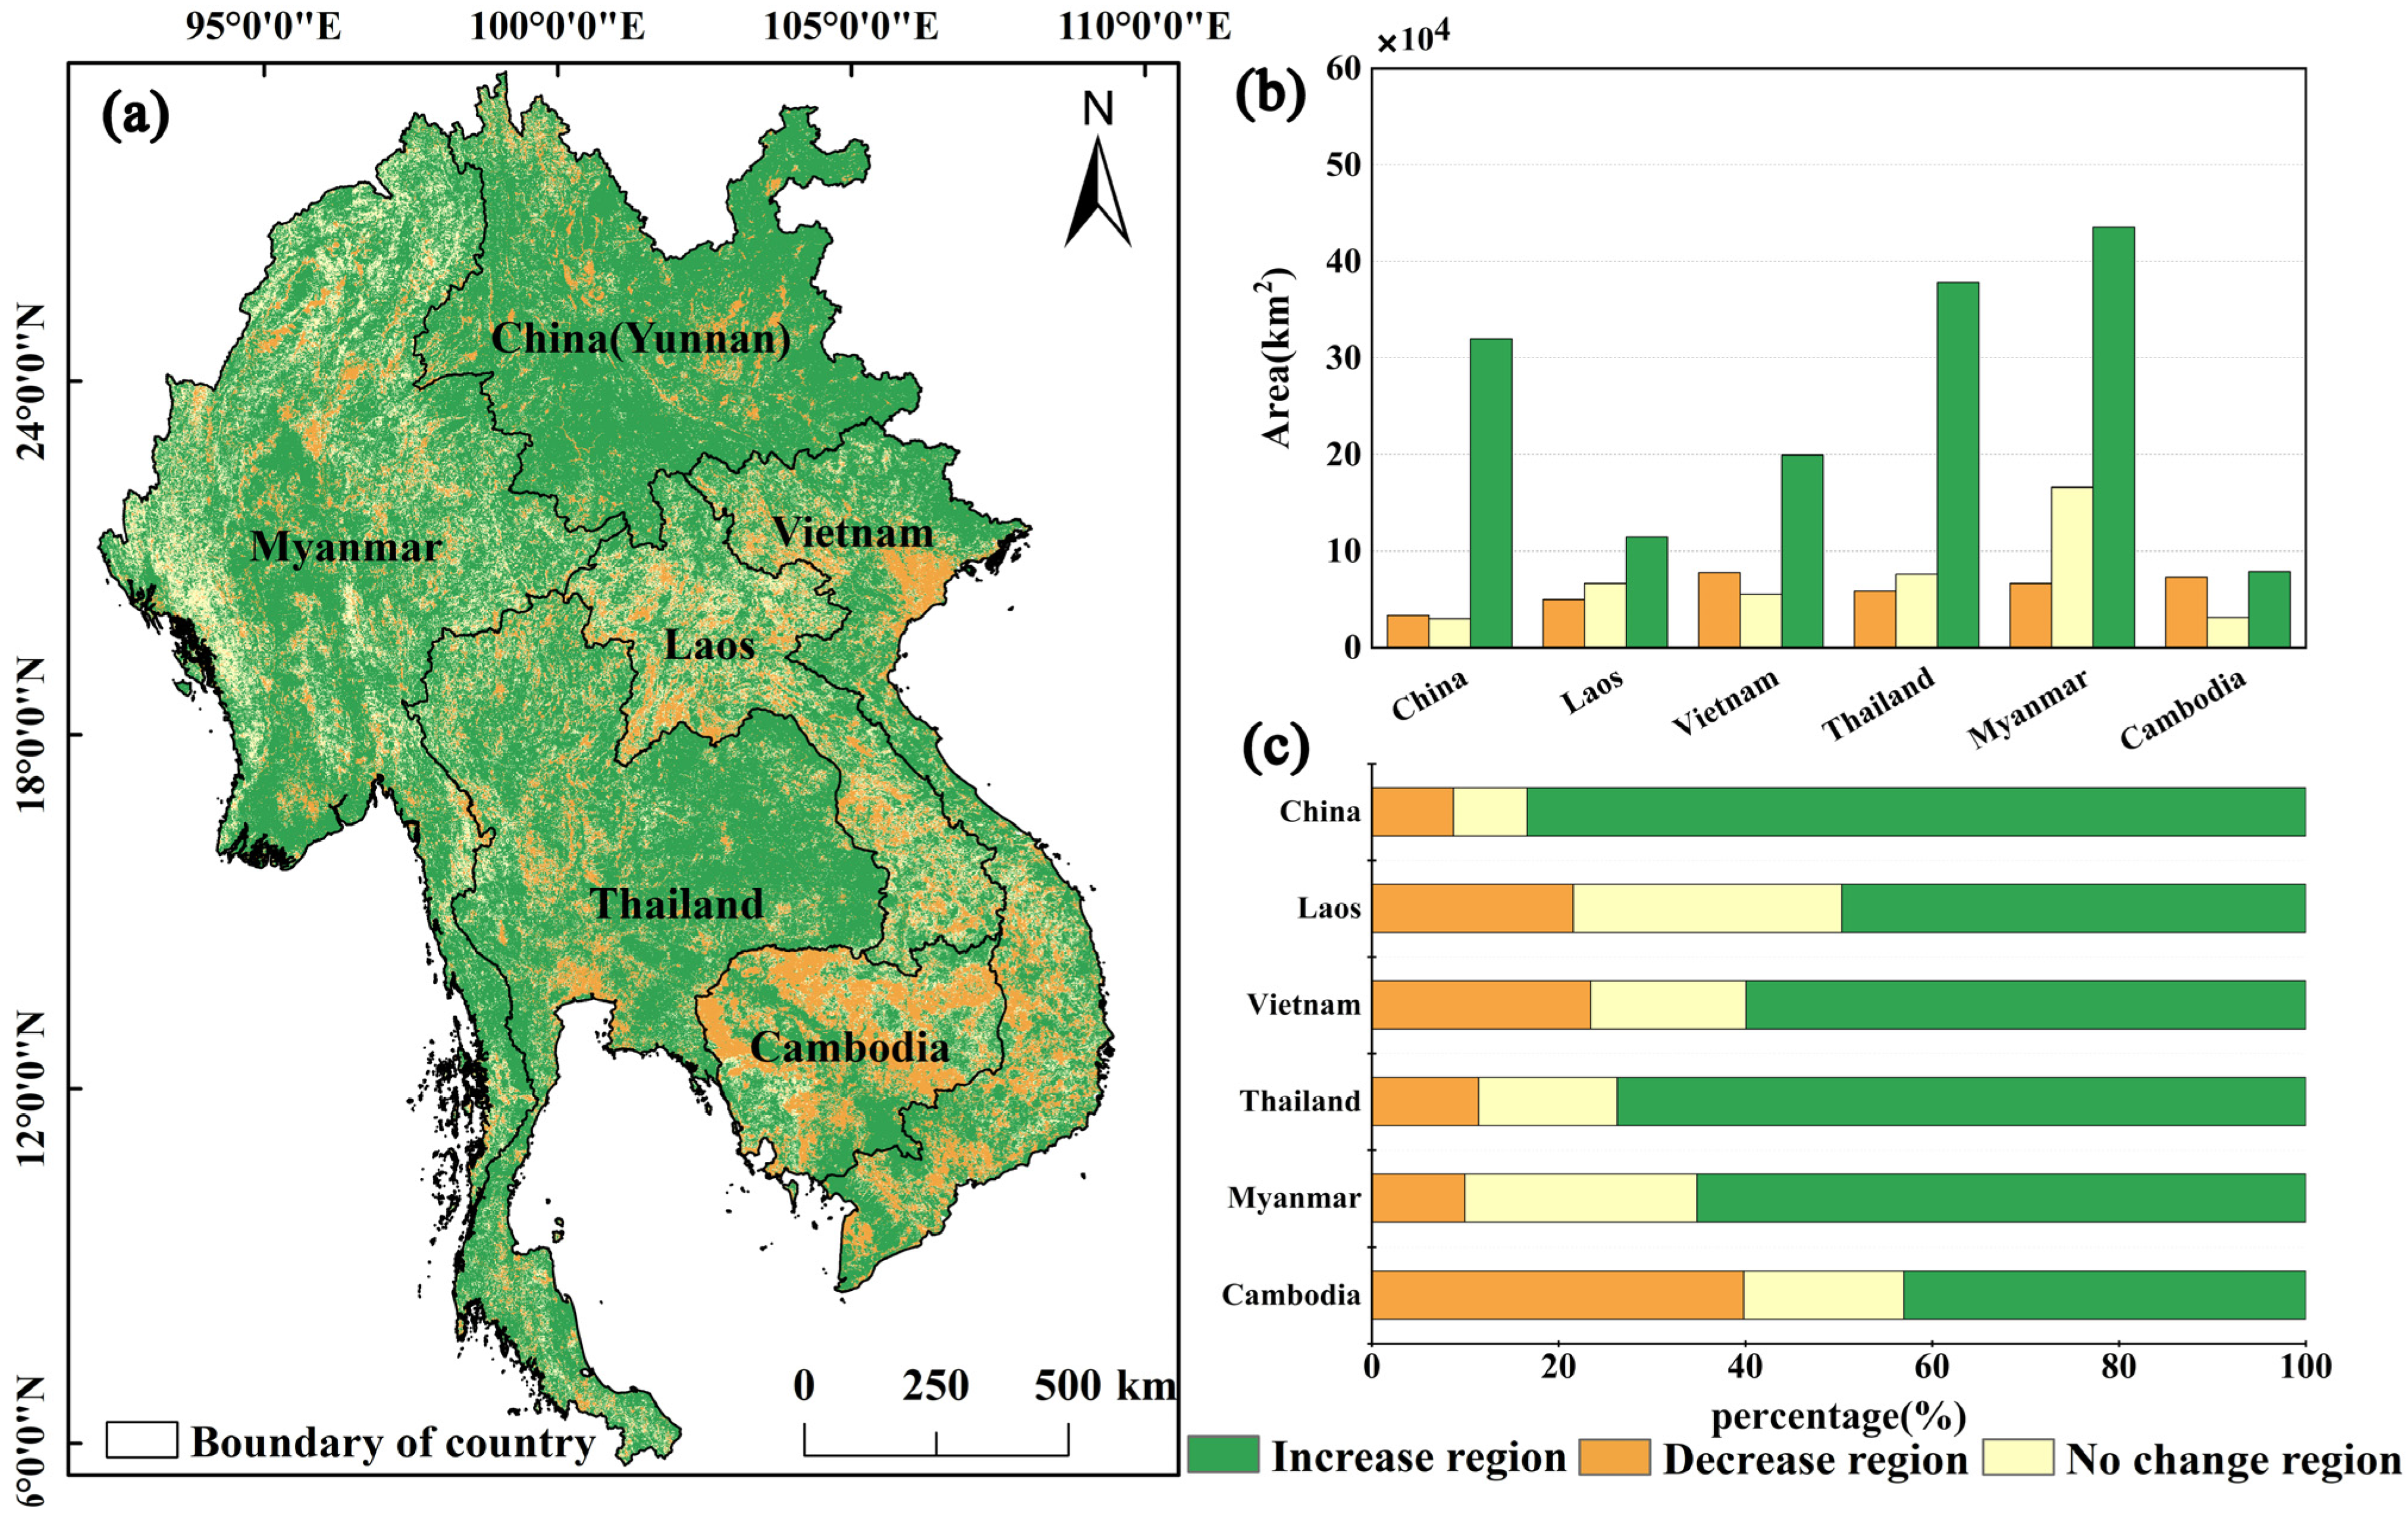
3.3. Spatiotemporal Variation in Vegetation Cover across Different Countries

The annual average NDVI data were used to demonstrate the interannual variability in vegetation cover among the GMS countries (Figure 5). Our findings revealed that from 2000 to 2022, the NDVI of all the countries, except Cambodia, generally showed a fluctuating increasing trend. Notably, the annual average NDVI values in China showed a particularly marked increase, with a growth rate of 0.21%. The other countries showed smaller increases in NDVI values, including Thailand (0.16%), Myanmar (0.10%), Vietnam (0.07%), and Laos (0.02%), indicating that the vegetation in these countries is recovering. However, the vegetation change in Cambodia showed a slight negative growth rate during the study period (−0.01%). Furthermore, the NDVI values in all countries, except China, decreased in both 2004 and 2018, which coincided with the inflection points of the annual NDVI trends across the entire GMS (Figure 3a).
To illustrate the evolutionary trends in NDVI dynamics in the GMS countries from 2000 to 2022, we classified the results into three types: increasing regions, regions of no change, and decreasing regions (Figure 6a). In general, our research results show that vegetation cover changes in the GMS countries are increasing (Figure 6c). Specifically, the overall vegetation cover in China’s Yunnan Province increased significantly during the study period, with 83.38% of the total area of Yunnan Province showing an increase in vegetation cover. Only 8.73% of the Yunnan Province by area exhibited decreased vegetation cover, with these areas mainly distributed in the central part of the province (Figure 6a). The vegetation dynamics trends in Myanmar and Thailand are similar to those in China, with the percentage of increasing vegetation coverage accounting for 65.18% and 73.72% of each country’s total area, respectively. In addition, the vegetation cover in Laos and Vietnam also exhibited an improving trend, with 49.67% and 59.94% of these countries by area undergoing vegetation increases, respectively. Notably, the area percentages of increased and decreased vegetation cover in Cambodia do not differ markedly, accounting for 43.04% and 39.82% of this country, respectively.

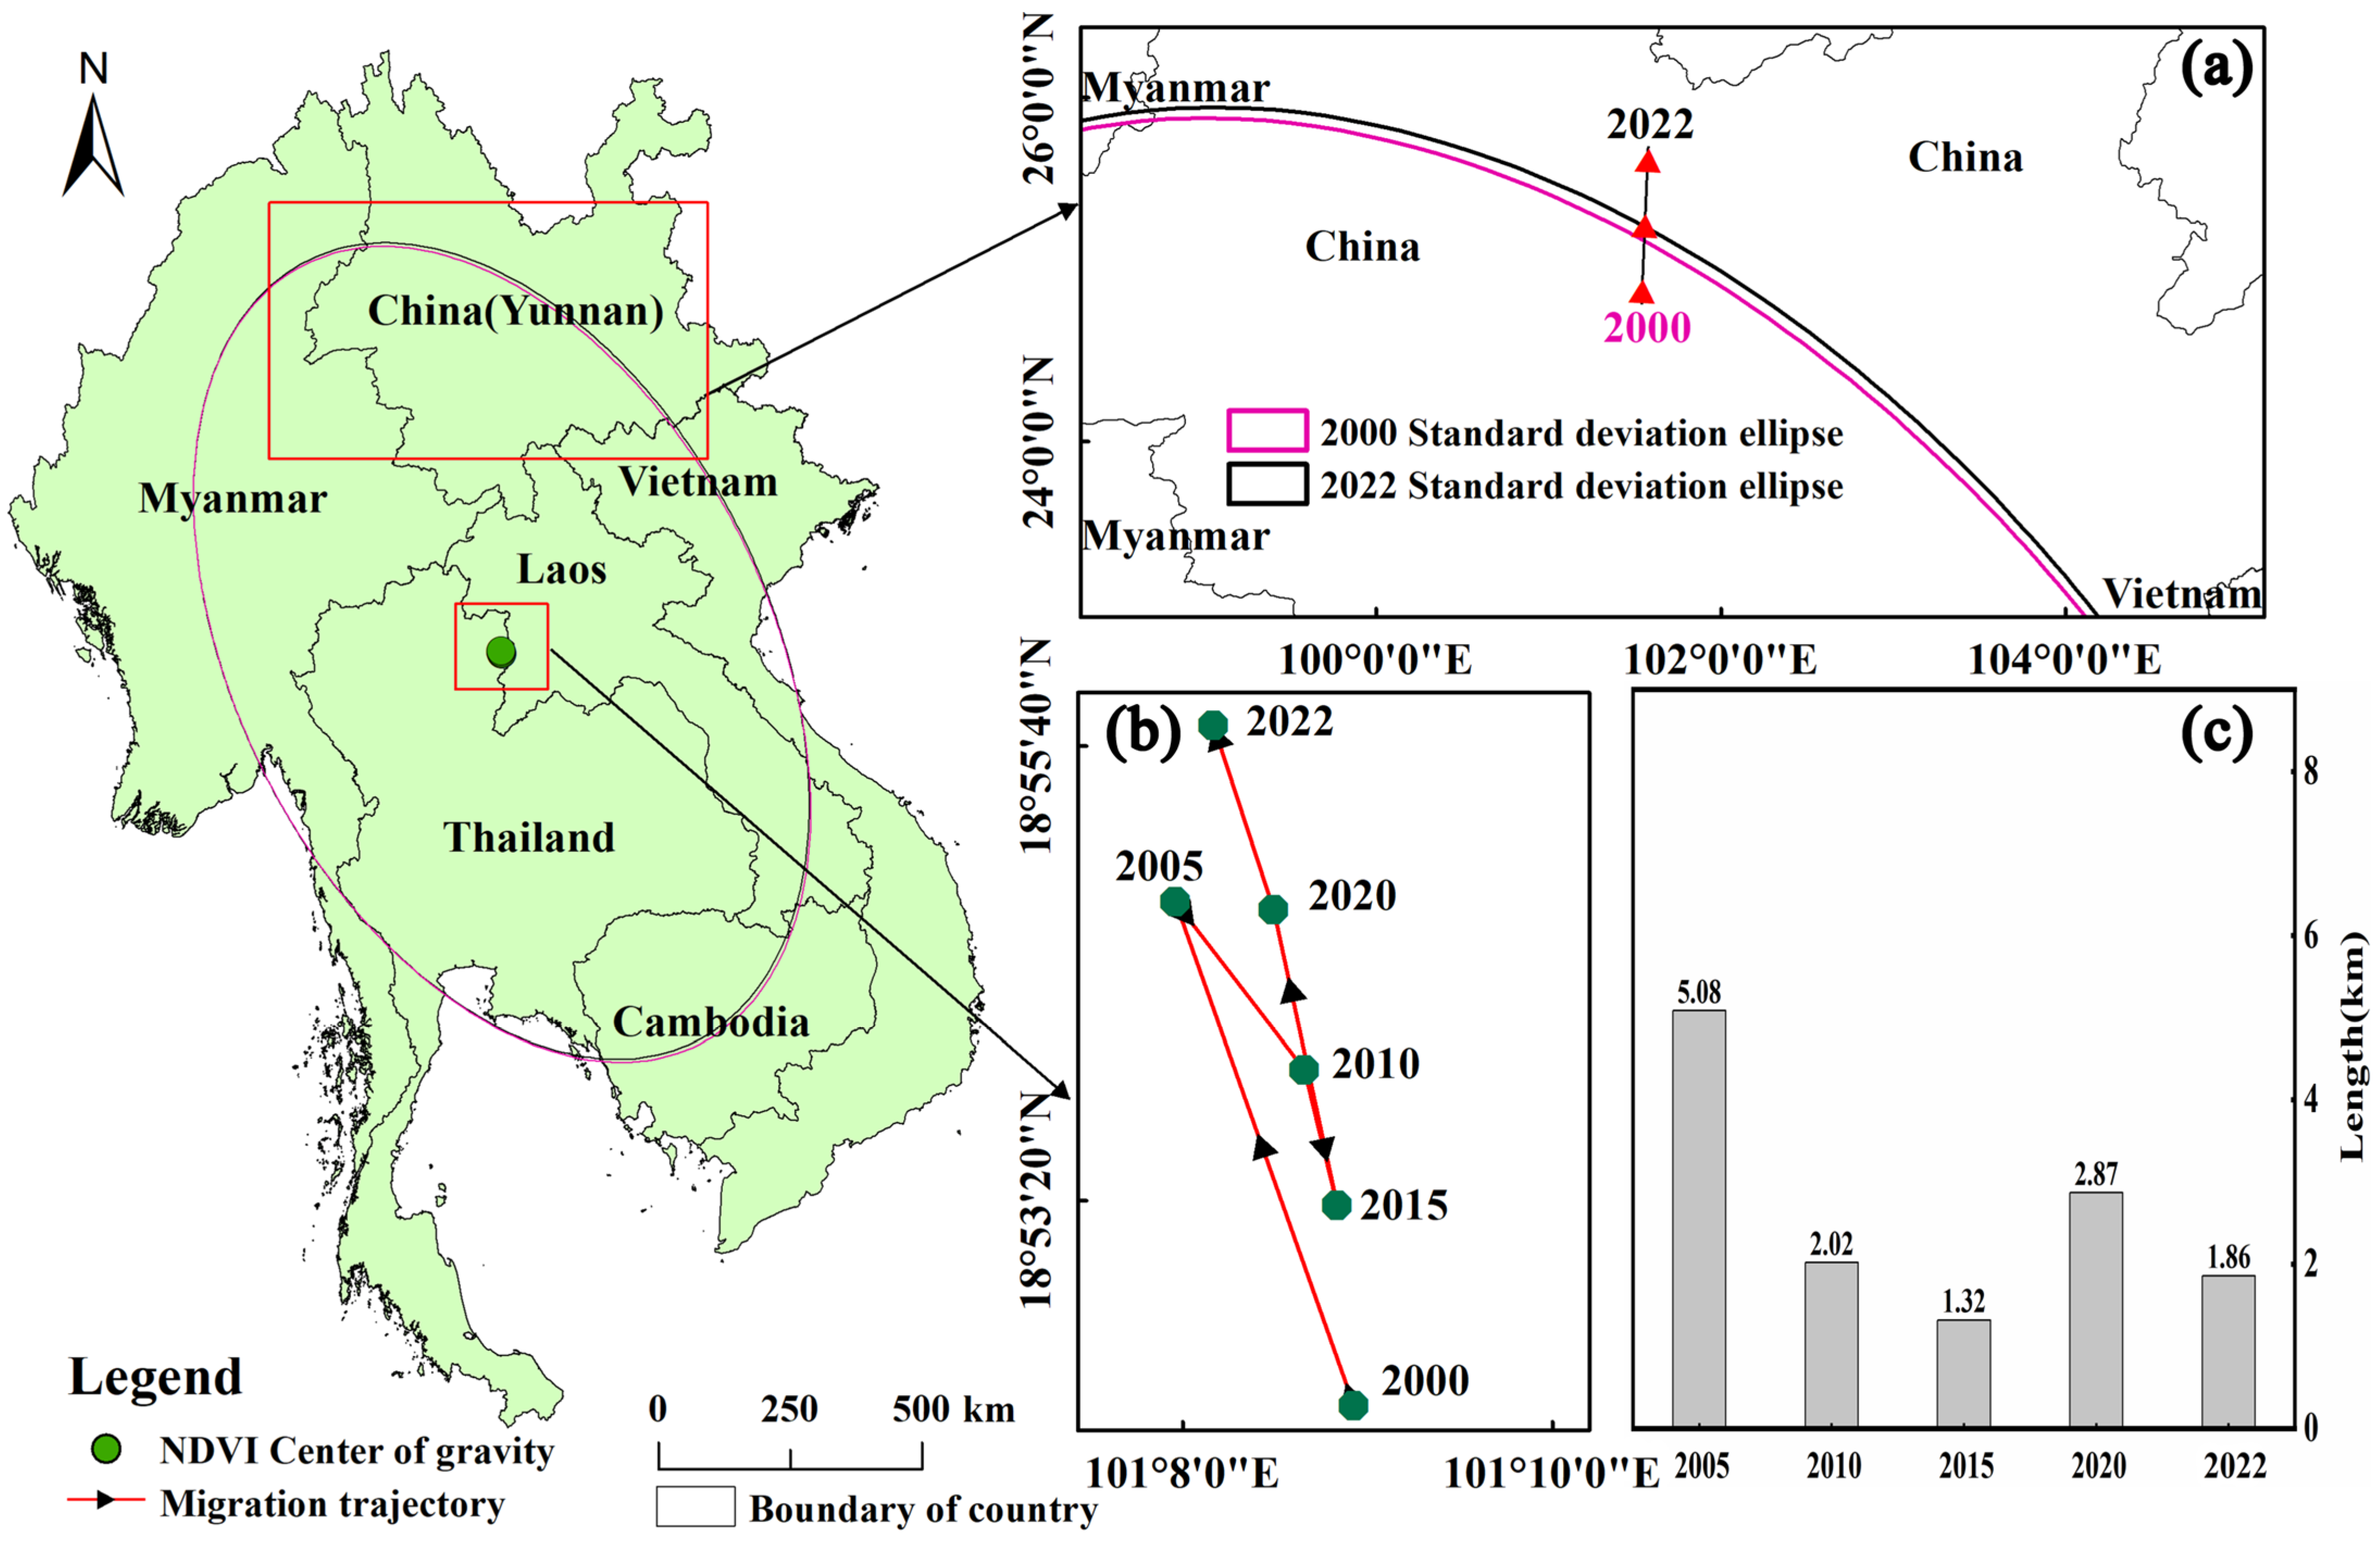
3.4. Characteristics of Shifting Vegetation Coverage Gravity Center

In this study, we calculated the coordinates of the center of gravity of the NDVI for different periods in the GMS from 2000 to 2022, using the gravity migration model (Figure 7). We found that the center of gravity for the NDVI was located in the northern part of Thailand throughout the period 2000 to 2022, exhibiting a northwest–southeast–northwest migration trend, with a cumulative migration distance of 6.47 km. In addition, the standard deviation ellipse results showed that the main spatial distribution direction of NDVI was north–south, and this orientation remained relatively stable. Over the studied 23 years, the area of the standard deviation ellipses exhibited a significant shrinking trend, indicating that the center of gravity for the NDVI became progressively more concentrated throughout the migration process in this period. To display the migration pattern more intuitively, we analyzed the changing trends in NDVI center of gravity migration from 2000 to 2022 in several periods (Figure 7b,c). From 2000 to 2005, the NDVI center of gravity in the GMS initially moved around 5.08 km to the northwest and then migrated about 3.34 km to the southeast between 2005 and 2015. In contrast, from 2015 to 2020 and from 2020 to 2022, the NDVI center of gravity in the study area again migrated northwestward by 2.87 km and 1.86 km, respectively. Generally, the NDVI vegetation center of gravity showed a northward trend, with an average migration rate of around 281.3 m/a over the whole studied period.

4. Discussion

4.1. Trend Changes in the Interannual NDVI Fluctuations

This study analyzes changes in the spatiotemporal distribution of vegetation cover in the GMS from 2000 to 2022. The interannual variation in NDVI shows a 2.81% increase in NDVI values over the studied period, indicating an overall improvement in vegetation cover in the GMS (Figure 3a). This greening trend is consistent with the findings from previous studies of South Asia [32], the GMS [25], and the Mekong River Basin [13]. However, these areas of greening are mainly concentrated in cropland (Figure 4), and the identified vegetation growth trend is fluctuating rather than continuous. For instance, in 2004 and 2018, the NDVI values exhibited negative growth rates. This phenomenon may be related to the occurrence of extreme climatic events in the Mekong River Basin, such as the drought events in 2004 and 2005 and the severe flooding in 2017 [13]. This finding is consistent with a previous study of continental southeast Asia and the Yunnan Province of China [12].
In recent years, there has been a gradual greening of vegetation cover globally, including in southern and southeastern China, India, and Southeast Asia [33]. In this context, we analyzed the interannual variability of vegetation dynamics in the GMS countries from 2000 to 2022 and identified an overall fluctuating vegetation cover growth trend (Figure 5). In detail, the growth rate of vegetation greening varies between countries in the GMS, with China showing the most significant growth trend with an NDVI growth rate of 0.21%, followed by Thailand, Myanmar, Vietnam, Laos, and Cambodia. This phenomenon is highly similar to previous studies, which have shown an increasing trend in greening globally since 1980 [34], with vegetation greening in China attributed to increases in forestland [35]. As shown in Figure 4, the areas of vegetation greening primarily occur in plains and regions of abundant cropland. Notably, we found that the vegetation change in Cambodia exhibited a negative trend, primarily due to human activities such as logging and deforestation, causing the huge damage to forest resources [36]. Furthermore, the Mann–Kendall mutation test results for the annual mean NDVI (Figure 3f) showed a continuous increase in the UF(k) curve from 2000 to 2022. The UF(k) and UB(k) curves crossed in 2011, and the subsequent statistics all exceeded the critical confidence coefficient (1.96); thus, 2011 is the turning point from a gradual increase to a significant increase in vegetation cover.
Vegetation cover in the GMS exhibited distinct seasonal variation characteristics (Figure 3b–e), with the seasonal order based on mean vegetation cover being autumn > summer > winter > spring. This phenomenon may relate to the precipitation distribution in the dry (November to April) and rainy (May to October) seasons in the GMS, with higher vegetation cover during the wet season. The GMS has a tropical or subtropical monsoon climate, which is characterized by rainy weather with high temperatures in the summer and mild conditions with low rainfall in the winter [13]. Li et al. [17] also observed the phenomenon of seasonal variations in their study of vegetation changes in the China–Myanmar Economic Corridor. Meanwhile, other studies have shown that rain is associated with faster vegetation growth [37], which results in significantly higher NDVI values in the summer and autumn compared to the spring and winter. Notably, the spring UF(k) curves do not surpass the 1.96 confidence coefficient throughout the studied time span, whereas the UF(k) curves for the summer, autumn, and winter gradually exceeded the confidence coefficient after the mutation. Thus, the summer, autumn, and winter contributed significantly more than the spring to the increase in vegetation cover in the GMS. This result may be associated with the increase in rainy season precipitation observed in the last few years [32]. Overall, factors including extreme climatic events may have changed transient vegetation cover and caused fluctuations in the NDVI of the study area. However, there were no obvious regular interruptions in vegetation development, and the vegetation of the GMS maintained a relatively stable growth trend.

4.2. Differences in NDVI Change Trends in the GMS Countries

The spatial distribution of NDVI in the study area showed that the vegetation cover in the GMS was generally high (mean NDVI value of 0.81) during the studied 23-year period (Figure 2). However, the trends and fluctuations in vegetation cover showed obvious spatial heterogeneity between 2000 and 2022 (Figure 4), with an overall spatial distribution of high in the north–central part and low in the southern part of the GMS (Figure 2a). This phenomenon may relate to the influence of topography and land cover types [38]. Specifically, 66.03% of the GMS underwent an increase in vegetation and 15.55% underwent a decrease during 2000–2022, with markedly more areas increasing than decreasing. Areas with significant increases in vegetation account for 36.06% of the total area of the GMS, the highest value of any of the vegetation change classes, with these areas mostly located in the north–central part of the region. Surprisingly, the vegetation coverage increased significantly in Yunnan, with 83.38% of the area showing an increasing trend (Figure 6). This observation may relate to the forestry projects implemented in the Yunnan province, such as the restoration of farmland to forest program, the establishment of nature reserves, Pearl River protection forests, and other ecological projects [39,40]. The vegetation changes in Myanmar and Thailand showed an overall upward trend; however, the areas of increasing vegetation greenness were primarily distributed in cropland.
Previous studies have shown that greening of agricultural land contributed significantly to vegetation increases in India, which may also explain the observed increase in vegetation in Myanmar and Thailand in the present study, given these countries’ proximity to India and their similar climatic conditions and agricultural patterns [35,41]. However, the significant decrease in vegetation cover in the southern basin region of Cambodia is particularly notable as it may signify a sudden decrease in greenfield areas as a result of deforestation activities [42]. Additionally, the NDVI vegetation center of gravity showed a northwest–southeast–northwest migration trend over the studied period (Figure 7), with an average migration rate of about 281.3 m/a, further indicating that the greening of vegetation in the GMS is migrating towards China and Myanmar. In general, the vegetation coverage of the GMS is improving overall, but there are still some areas of NDVI degradation. Therefore, we emphasize the importance of continuous protection of vegetation and ecological security on a regional scale.

4.3. Limitations and Perspectives

In this study, we attempted to analyze vegetation changes from 2000 to 2022 both within the GMS as a whole and within different countries in the study area; however, there are several remaining limitations. First, although NDVI can effectively capture the vegetation change in the GMS, there is inevitably a saturation problem. Therefore, we will further use other vegetation indices (kernel NDVI, kNDVI) to further explore the applicability of NDVI in densely vegetated areas in the future [43]. Second, this research focuses on the analysis of vegetation changes over time at a regional scale, exploring in detail long-term trends, cyclical changes, and inflection points [17]. However, it should be noted that this study explores the periodicity and mutation characteristics of vegetation cover at the pixel scale, which, to some extent, constrains the comprehensiveness and completeness of this study. Third, changes in vegetation cover are usually affected by processes that involve both natural factors and human activity [44,45]. However, the current study has not fully examined the role of these factors in assessing trends in vegetation change, and the drivers of NDVI evolution have not been exhaustively analyzed. To more comprehensively reveal the influencing factors and intrinsic mechanisms driving NDVI changes, future studies can utilize approaches including geographical detectors [46,47], correlation analysis [30,48], and residual analysis [49,50]. In summary, despite the above limitations, this research provides important insights for promoting the protection of vegetation in the GMS, especially providing a scientific basis for strengthening the management of cross-border ecosystems in various countries.

5. Conclusions

This study analyzed the spatial and temporal patterns of vegetation coverage and their trends in the GMS from 2000 to 2022, using Sen’s slope estimation, the Mann–Kendall mutation test, and the gravity center migration model. The key findings of this study are as follows: (1) From 2000 to 2022, the vegetation coverage of the GMS generally showed a fluctuating increasing trend, with an average annual growth rate of around 0.11% across the area as a whole. The Mann–Kendall mutation test demonstrated a slight decrease in vegetation cover from 2003 to 2008, followed by an increasing trend, especially in 2011, when a significant increasing mutation occurred. (2) The NDVI in the GMS varies markedly in different seasons, with increasing trends being higher in the summer (0.15%), winter (0.15%), and autumn (0.11%) compared to spring (0.08%). (3) Vegetation cover in the GMS exhibits marked spatial heterogeneity, with generally higher NDVI values recorded in the central and northern parts of the area and lower values in the south. The trend analysis shows that the area of improved vegetation is much larger than that of degraded vegetation from 2000 to 2022, with these two classes accounting for 66.03% and 15.55% of the GMS, respectively. (4) The NDVI in the GMS countries generally exhibited a volatile increasing trend from 2000 to 2022, except for Cambodia. This increase was most pronounced in China, where vegetation greening occurred the fastest. In addition, the NDVI vegetation center of gravity showed a northwest–southeast–northwest migration trend over the studied period, with an average migration rate of around 281.3 m/a. The main innovation of the present study lies in comparing the disparities and trends in vegetation cover changes in different countries within the GMS region, and revealing the migration direction and magnitude of vegetation greening in the study area. Overall, the findings of this study can provide direct evidence of vegetation changes in the GMS and offer a valuable reference for the future implementation of ecological protection projects.

Author Contributions

Conceptualization, X.D. and C.L.; methodology, B.D.; software, B.D. and E.Z.; formal analysis, B.D.; resources, M.H. and Y.L.; data curation, B.D.; writing—original draft preparation, B.D.; writing—review and editing, X.D. and C.L.; visualization, B.D.; funding acquisition, C.L. and X.D. All authors have read and agreed to the published version of the manuscript.

Funding

This research was supported by the National Nature Science Foundation of China (Grant no. 4230135 and U2002209), the Distinguished Young Found Project of Yunnan Province (Grant no. 202201AV070001), the National Key R&D Program of China (Grant no: 2023YFD1901201), the Key Research and Development Program of Yunnan Province (Grant no. 202303AC100009), Yunnan Postdoctoral Foundation (Grant no. C615300504042), the Yuanjiang Dry-Hot Valley Water and Soil Conservation Observation and the Research Station of Yunnan Province.

Data Availability Statement

The MODIS-NDVI dataset can be freely downloaded from the Google Earth Engine (GEE) platform (https://earthengine.google.com/, accessed on 23 August 2023). The watershed boundaries were obtained from the HydroSHEDS website (https://www.hydrosheds.org/, accessed on 18 August 2023), while the administrative division data for the study area were sourced from a global repository containing one million primary geographic datasets (https://www.resdc.cn/data.aspx?DATAID=259, accessed on 5 August 2023). Access to all of the above data is free of charge.

Acknowledgments

We thank the Google Earth Engine platform and developers for their support. We also thank the five anonymous reviewers for their constructive comments that helped to improve this article.

Conflicts of Interest

The authors declare no conflicts of interest.

References

  1. Chen, H.; Zhu, T. The complexity of cooperative governance and optimization of institutional arrangements in the Greater Mekong Subregion. Land Use Policy 2016, 50, 363–370. [Google Scholar] [CrossRef]
  2. Liu, Z.; Liu, W. Message from the workshop chairs HighCloud 2011. In Proceedings of the 2011 14th IEEE International Conference on Computational Science and Engineering, Dalian, China, 24–26 August 2011. [Google Scholar] [CrossRef]
  3. Chen, A.L.Q. The Belt and Road Initiative as a variegated agglomeration of multi-scalar state spatial strategies. Territ. Politics Gov. 2023, 11, 478–501. [Google Scholar] [CrossRef]
  4. Chen, B.Z.; Kayiranga, A.; Ge, M.Y.; Ciais, P.; Zhang, H.F.; Black, A.; Xiao, X.M.; Yuan, W.P.; Zeng, Z.Z.; Piao, S.L. Anthropogenic activities dominated tropical forest carbon balance in two contrary ways over the Greater Mekong Subregion in the 21st century. Glob. Chang. Biol. 2023, 29, 3421–3432. [Google Scholar] [CrossRef] [PubMed]
  5. Pungkul, S.; Suraswasdi, C.; Phonekeo, V. Implementation of forest cover and carbon mapping in the Greater Mekong subregion and Malaysia project—A case study of Thailand. In Proceedings of the 8th International Symposium of the Digital Earth (ISDE), Kuching, Malaysia, 26–29 August 2013. [Google Scholar]
  6. Liu, C.L.; Li, W.L.; Wang, W.Y.; Zhou, H.K.; Liang, T.G.; Hou, F.J.; Xu, J.; Xue, P.F. Quantitative spatial analysis of vegetation dynamics and potential driving factors in a typical alpine region on the northeastern Tibetan Plateau using the Google Earth Engine. Catena 2021, 206, 105500. [Google Scholar] [CrossRef]
  7. Piao, S.L.; Yin, G.D.; Tan, J.G.; Cheng, L.; Huang, M.T.; Li, Y.; Liu, R.G.; Mao, J.F.; Myneni, R.B.; Peng, S.S.; et al. Detection and attribution of vegetation greening trend in China over the last 30 years. Glob. Chang. Biol. 2015, 21, 1601–1609. [Google Scholar] [CrossRef]
  8. Liu, C.X.; Zhang, X.D.; Wang, T.; Chen, G.Z.; Zhu, K.; Wang, Q.; Wang, J. Detection of vegetation coverage changes in the Yellow River Basin from 2003 to 2020. Ecol. Indic. 2022, 138, 108818. [Google Scholar] [CrossRef]
  9. Zhai, J.H.; Xiao, C.W.; Feng, Z.M.; Liu, Y. Are there suitable global datasets for monitoring of land use and land cover in the tropics? Evidences from mainland Southeast Asia. Glob. Planet. Chang. 2023, 229, 104233. [Google Scholar] [CrossRef]
  10. Davis, K.F.; Yu, K.L.; Rulli, M.C.; Pichdara, L.; D’Odorico, P. Accelerated deforestation driven by large-scale land acquisitions in Cambodia. Nat. Geosci. 2015, 8, 772–775. [Google Scholar] [CrossRef]
  11. Zeng, Z.Z.; Estes, L.; Ziegler, A.D.; Chen, A.P.; Searchinger, T.; Hua, F.Y.; Guan, K.Y.; Jintrawet, A.; Wood, E.F. Highland cropland expansion and forest loss in Southeast Asia in the twenty-first century. Nat. Geosci. 2018, 11, 556–562. [Google Scholar] [CrossRef]
  12. Fan, F.F.; Xiao, C.W.; Feng, Z.M.; Yang, Y.Z. Impact of human and climate factors on vegetation changes in mainland southeast asia and yunnan province of China. J. Clean. Prod. 2023, 415, 137690. [Google Scholar] [CrossRef]
  13. Zhong, X.Z.; Li, J.; Wang, J.L.; Zhang, J.P.; Liu, L.F.; Ma, J. Linear and Nonlinear Characteristics of Long-Term NDVI Using Trend Analysis: A Case Study of Lancang-Mekong River Basin. Remote Sens. 2022, 14, 6271. [Google Scholar] [CrossRef]
  14. Yang, S.F.; Zhao, Y.L.; Yang, D.; Lan, A.J. Analysis of Vegetation NDVI Changes and Driving Factors in the Karst Concentration Distribution Area of Asia. Forests 2024, 15, 398. [Google Scholar] [CrossRef]
  15. Li, S.; Yang, S.; Liu, X.; Liu, Y.; Shi, M. NDVI-Based Analysis on the Influence of Climate Change and Human Activities on Vegetation Restoration in the Shaanxi-Gansu-Ningxia Region, Central China. Remote Sens. 2015, 7, 11163–11182. [Google Scholar] [CrossRef]
  16. Hashimoto, H.; Wang, W.L.; Dungan, J.L.; Li, S.; Michaelis, A.R.; Takenaka, H.; Higuchi, A.; Myneni, R.B.; Nemani, R.R. New generation geostationary satellite observations support seasonality in greenness of the Amazon evergreen forests. Nat. Commun. 2021, 12, 684. [Google Scholar] [CrossRef] [PubMed]
  17. Li, J.; Wang, J.; Zhang, J.; Zhang, J.; Kong, H. Dynamic changes of vegetation coverage in China-Myanmar economic corridor over the past 20 years. Int. J. Appl. Earth Obs. Geoinf. 2021, 102, 102378. [Google Scholar] [CrossRef]
  18. Beck, H.E.; McVicar, T.R.; van Dijk, A.; Schellekens, J.; de Jeu, R.A.M.; Bruijnzeel, L.A. Global evaluation of four AVHRR-NDVI data sets: Intercomparison and assessment against Landsat imagery. Remote Sens. Environ. 2011, 115, 2547–2563. [Google Scholar] [CrossRef]
  19. Bai, Y.Q.; Yang, Y.P.; Jiang, H. Intercomparison of AVHRR GIMMS3g, Terra MODIS, and SPOT-VGT NDVI Products over the Mongolian Plateau. Remote Sens. 2019, 11, 2030. [Google Scholar] [CrossRef]
  20. Kang, Y.; Guo, E.L.; Wang, Y.F.; Bao, Y.L.; Bao, Y.H.; Mandula, N. Monitoring Vegetation Change and Its Potential Drivers in Inner Mongolia from 2000 to 2019. Remote Sens. 2021, 13, 3357. [Google Scholar] [CrossRef]
  21. Zhe, M.; Zhang, X.Q. Time-lag effects of NDVI responses to climate change in the Yamzhog Yumco Basin, South Tibet. Ecol. Indic. 2021, 124, 107431. [Google Scholar] [CrossRef]
  22. Cheng, J.; Qian, M.J.; Liu, J.F.; Chen, X.F.; Zuo, Y.T.; Zhao, Z.Q.; Zhang, J.J. How Did the Southwest China Mountains Turn Green from 2000 to 2020? A Case Study in Chongqing. Forests 2023, 14, 1563. [Google Scholar] [CrossRef]
  23. Liu, G.L.; Li, J.Y.; Nie, P. Tracking the history of urban expansion in Guangzhou (China) during 1665-2017: Evidence from historical maps and remote sensing images. Land Use Policy 2022, 112, 105773. [Google Scholar] [CrossRef]
  24. Dai, Y.J.; Tian, L.; Zhu, P.Z.; Dong, Z.; Zhang, R.H. Dynamic aeolian erosion evaluation and ecological service assessment in Inner Mongolia, northern China. Geoderma 2022, 406, 115518. [Google Scholar] [CrossRef]
  25. Han, Z.; Song, W. Interannual trends of vegetation and responses to climate change and human activities in the Great Mekong Subregion. Glob. Ecol. Conserv. 2022, 38, e02215. [Google Scholar] [CrossRef]
  26. A, D.; Zhao, W.; Qu, X.; Jing, R.; Xiong, K. Spatio-temporal variation of vegetation coverage and its response to climate change in North China plain in the last 33 years. Int. J. Appl. Earth Obs. Geoinf. 2016, 53, 103–117. [Google Scholar] [CrossRef]
  27. Bai, Y.; Li, S.; Liu, M.; Guo, Q. Assessment of vegetation change on the Mongolian Plateau over three decades using different remote sensing products. J. Environ. Manag. 2022, 317, 115509. [Google Scholar] [CrossRef] [PubMed]
  28. Zhang, X.; Wang, G.; Xue, B.; Yinglan, A. Changes in vegetation cover and its influencing factors in the inner Mongolia reach of the yellow river basin from 2001 to 2018. Environ. Res. 2022, 215, 114253. [Google Scholar] [CrossRef]
  29. Liu, Z.; Wang, H.; Li, N.; Zhu, J.; Pan, Z.; Qin, F. Spatial and Temporal Characteristics and Driving Forces of Vegetation Changes in the Huaihe River Basin from 2003 to 2018. Sustainability 2020, 12, 2198. [Google Scholar] [CrossRef]
  30. Ren, Z.; Tian, Z.; Wei, H.; Liu, Y.; Yu, Y. Spatiotemporal evolution and driving mechanisms of vegetation in the Yellow River Basin, China during 2000–2020. Ecol. Indic. 2022, 138, 108832. [Google Scholar] [CrossRef]
  31. Liu, C.; Li, W.; Xu, J.; Zhou, H.; Wang, W.; Wang, H. Temporal and spatial variations of ecological security on the northeastern Tibetan Plateau integrating ecosystem health-risk-services framework. Ecol. Indic. 2024, 158, 111365. [Google Scholar] [CrossRef]
  32. Janes, T.; McGrath, F.; Macadam, I.; Jones, R. High-resolution climate projections for South Asia to inform climate impacts and adaptation studies in the Ganges-Brahmaputra-Meghna and Mahanadi deltas. Sci. Total Environ. 2019, 650, 1499–1520. [Google Scholar] [CrossRef]
  33. Chen, B.Z.; Xu, G.; Coops, N.C.; Ciais, P.; Innes, J.L.; Wang, G.Y.; Myneni, R.B.; Wang, T.L.; Krzyzanowski, J.; Li, Q.L.; et al. Changes in vegetation photosynthetic activity trends across the Asia-Pacific region over the last three decades. Remote Sens. Environ. 2014, 144, 28–41. [Google Scholar] [CrossRef]
  34. Piao, S.L.; Wang, X.H.; Park, T.; Chen, C.; Lian, X.; He, Y.; Bjerke, J.W.; Chen, A.P.; Ciais, P.; Tommervik, H.; et al. Characteristics, drivers and feedbacks of global greening. Nat. Rev. Earth Environ. 2020, 1, 14–27. [Google Scholar] [CrossRef]
  35. Chen, C.; Park, T.; Wang, X.H.; Piao, S.L.; Xu, B.D.; Chaturvedi, R.K.; Fuchs, R.; Brovkin, V.; Ciais, P.; Fensholt, R.; et al. China and India lead in greening of the world through land-use management. Nat. Sustain. 2019, 2, 122–129. [Google Scholar] [CrossRef] [PubMed]
  36. Baehr, C.; BenYishay, A.; Parks, B. Highway to the forest? Land governance and the siting and environmental impacts of Chinese government-funded road building in Cambodia. J. Environ. Econ. Manag. 2023, 122, 102898. [Google Scholar] [CrossRef]
  37. Cheong, W.K.; Timbal, B.; Golding, N.; Sirabaha, S.; Kwan, K.F.; Cinco, T.A.; Archevarahuprok, B.; Vo, V.H.; Gunawan, D.; Han, S. Observed and modelled temperature and precipitation extremes over Southeast Asia from 1972 to 2010. Int. J. Climatol. 2018, 38, 3013–3027. [Google Scholar] [CrossRef]
  38. Xiong, Y.L.; Wang, H.L. Spatial relationships between NDVI and topographic factors at multiple scales in a watershed of the Minjiang River, China. Ecol. Inform. 2022, 69, 101617. [Google Scholar] [CrossRef]
  39. Ma, Y.Q.; Huang, L.; Li, J.H.; Cao, W.; Cai, Y.M. Carbon potential of China’s Grain to Green Program and its contribution to the carbon target. Resour. Conserv. Recycl. 2024, 200, 107272. [Google Scholar] [CrossRef]
  40. Huang, W.; Wang, P.; He, L.; Liu, B. Improvement of water yield and net primary productivity ecosystem services in the Loess Plateau of China since the “Grain for Green” project. Ecol. Indic. 2023, 154, 110707. [Google Scholar] [CrossRef]
  41. Wu, X.; Sun, X.M.; Wang, Z.F.; Zhang, Y.L.; Liu, Q.H.; Zhang, B.H.; Paudel, B.; Xie, F.D. Vegetation Changes and Their Response to Global Change Based on NDVI in the Koshi River Basin of Central Himalayas Since 2000. Sustainability 2020, 12, 6644. [Google Scholar] [CrossRef]
  42. Tölle, M.H.; Engler, S.; Panitz, H.J. Impact of Abrupt Land Cover Changes by Tropical Deforestation on Southeast Asian Climate and Agriculture. J. Clim. 2017, 30, 2587–2600. [Google Scholar] [CrossRef]
  43. Wang, Q.; Moreno-Martinez, A.; Munoz-Mari, J.; Campos-Taberner, M.; Camps-Valls, G. Estimation of vegetation traits with kernel NDVI. Isprs J. Photogramm. Remote Sens. 2023, 195, 408–417. [Google Scholar] [CrossRef]
  44. Yang, S.J.; Song, S.; Li, F.D.; Yu, M.Z.; Yu, G.M.; Zhang, Q.Y.; Cui, H.T.; Wang, R.; Wu, Y.Q. Vegetation coverage changes driven by a combination of climate change and human activities in Ethiopia, 2003–2018. Ecol. Inform. 2022, 71, 101776. [Google Scholar] [CrossRef]
  45. Liu, Y.; Zhang, X.; Du, X.; Du, Z.; Sun, M. Alpine grassland greening on the Northern Tibetan Plateau driven by climate change and human activities considering extreme temperature and soil moisture. Sci. Total Environ. 2024, 916, 169995. [Google Scholar] [CrossRef] [PubMed]
  46. Zhao, X.Y.; Tan, S.C.; Li, Y.P.; Wu, H.; Wu, R.J. Quantitative analysis of fractional vegetation cover in southern Sichuan urban agglomeration using optimal parameter geographic detector model, China. Ecol. Indic. 2024, 158, 111529. [Google Scholar] [CrossRef]
  47. Wang, W.S.; Yang, Y.S. Spatial-temporal differentiation characteristics and driving factors of China’s energy eco-efficiency based on geographical detector model. J. Clean. Prod. 2024, 434, 140153. [Google Scholar] [CrossRef]
  48. Gu, Z.J.; Duan, X.W.; Shi, Y.D.; Li, Y.; Pan, X. Spatiotemporal variation in vegetation coverage and its response to climatic factors in the Red River Basin, China. Ecol. Indic. 2018, 93, 54–64. [Google Scholar] [CrossRef]
  49. Yan, X.X.; Li, J.; Shao, Y.; Hu, Z.Q.; Yang, Z.; Yin, S.Q.; Cui, I. Driving forces of grassland vegetation changes in Chen Barag Banner, Inner Mongolia. GISci. Remote Sens. 2020, 57, 753–769. [Google Scholar] [CrossRef]
  50. Guan, Y.L.; Lu, H.W.; Yin, C.; Xue, Y.X.; Jiang, Y.L.; Kang, Y.; He, L.; Heiskanen, J. Vegetation response to climate zone dynamics and its impacts on surface soil water content and albedo in China. Sci. Total Environ. 2020, 747, 141537. [Google Scholar] [CrossRef]
Figure 1. Geographical location of the study area. (a) Elevation and location of the Great Mekong Subregion (GMS); and (b) land use types in 2020.
Remotesensing 16 03302 g001
Figure 2. Spatial distribution of normalized difference vegetation index (NDVI) in the GMS across the studied period (2000–2022). (a) Map showing average annual NDVI, (b) plot showing the total area covered by different NDVI classes, and (c) plot showing the area percentages of each country represented by different NDVI classes.
Remotesensing 16 03302 g002
Figure 3. Plots showing temporal variations in NDVI from 2000 to 2022: (a) interannual, (b) spring, (c) summer, (d) autumn, and (e) winter. Plots showing Mann–Kendall mutation test results from 2000 to 2022: (f) interannual, (g) spring, (h) summer, (i) autumn, and (j) winter.
Remotesensing 16 03302 g003
Figure 4. Maps showing the spatial distribution of vegetation change trends in the GMS: (a) Sen’s slope estimation, (b) Mann–Kendall significance test, and (c) Sen-MK trend-coupling type.
Remotesensing 16 03302 g004
Figure 5. Plots showing temporal variations in annual average NDVI values in the GMS countries from 2000 to 2022: (a) China, (b) Myanmar, (c) Thailand, (d) Laos, (e) Vietnam, and (f) Cambodia.
Remotesensing 16 03302 g005
Figure 6. Spatial variation of NDVI in different countries in the GMS. (a) Map showing NDVI spatial variation across the GMS, (b) plot showing trends in NDVI changes across different countries, and (c) plot showing percentage change in NDVI across different countries.
Remotesensing 16 03302 g006
Figure 7. Trends in NDVI center of gravity migration in the GMS for the period 2000–2022. (a) Standard deviation ellipse, (b) center of gravity migration trajectory, and (c) interannual migration distance.
Remotesensing 16 03302 g007
Table 1. Sen–Mann–Kendall (Sen-MK) trend-type classification.
β ValueZ ValueSen-MK Trend Type
Increase β ≥ 0.0005Significant Z ≥ 1.96Significant increase
Increase β ≥ 0.0005Insignificant Z −1.96 < Z < 1.96Weak increase
No change −0.0005 < β < 0.0005Insignificant Z −1.96 < Z < 1.96No change
Decrease β ≤ 0.0005Insignificant Z −1.96 < Z < 1.96Weak decrease
Decrease β ≤ 0.0005Significant Z < −1.96Significant decrease
Disclaimer/Publisher’s Note: The statements, opinions and data contained in all publications are solely those of the individual author(s) and contributor(s) and not of MDPI and/or the editor(s). MDPI and/or the editor(s) disclaim responsibility for any injury to people or property resulting from any ideas, methods, instructions or products referred to in the content.

