Article

Multi-Scale Classification and Contrastive Regularization: Weakly Supervised Large-Scale 3D Point Cloud Semantic Segmentation

College of Systems Engineering, National University of Defense Technology, Changsha 410073, China
*
Author to whom correspondence should be addressed.
These authors contributed equally to this work.
Remote Sens. 2024, 16(17), 3319; https://doi.org/10.3390/rs16173319 (registering DOI)
Submission received: 16 July 2024 / Revised: 25 August 2024 / Accepted: 5 September 2024 / Published: 7 September 2024

Abstract

:
With the proliferation of large-scale 3D point cloud datasets, the high cost of per-point annotation has spurred the development of weakly supervised semantic segmentation methods. Current popular research mainly focuses on single-scale classification, which fails to address the significant feature scale differences between background and objects in large scenes. Therefore, we propose MCCR (Multi-scale Classification and Contrastive Regularization), an end-to-end semantic segmentation framework for large-scale 3D scenes under weak supervision. MCCR first aggregates features and applies random downsampling to the input data. Then, it captures the local features of a random point based on multi-layer features and the input coordinates. These features are then fed into the network to obtain the initial and final prediction results, and MCCR iteratively trains the model using strategies such as contrastive learning. Notably, MCCR combines multi-scale classification with contrastive regularization to fully exploit multi-scale features and weakly labeled information. We investigate both point-level and local contrastive regularization to leverage point cloud augmentor and local semantic information and introduce a Decoupling Layer to guide the loss optimization in different spaces. Results on three popular large-scale datasets, S3DIS, SemanticKITTI and SensatUrban, demonstrate that our model achieves state-of-the-art (SOTA) performance on large-scale outdoor datasets with only 0.1% labeled points for supervision, while maintaining strong performance on indoor datasets.

1. Introduction

Semantic segmentation for large-scale 3D point clouds is a fundamental task that can support intelligent machines to understand the real 3D world by learning precise semantic meanings. It has made significant contributions in fields such as autonomous driving, human–computer interaction and remote sensing, including applications such as fine-grained object detection and classification, terrain modeling and environmental monitoring, urban planning and infrastructure management, land cover classification and agricultural applications, and forest resource monitoring and management, as well as natural resource exploration and development. Compared to traditional methods, deep learning-based approaches [1,2,3,4] show great superiority. However, these approaches heavily rely on large volumes of fully labeled data for training, which becomes impractical and challenging when dealing with large-scale datasets containing millions of points. Therefore, inspired by the success of weakly supervised methods in the field of 2D image processing [5,6], to explore more efficient and low-cost methods, some works have started to focus on 3D point cloud semantic segmentation trained with fewer point labels.
Existing weakly supervised 3D point cloud semantic segmentation methods can be divided into three categories [7]: (1) 2D label-based methods [8,9,10], which project point clouds for 2D supervision. However, simple projection strategies struggle to retain the complete information of point clouds and are constrained by viewpoint limitations. (2) Pseudo 3D label-based methods [11,12,13,14]. Pseudo labels provide additional constraint information for weak supervision, but these methods typically filter initial pseudo-labels directly based on fixed thresholds or quantities. Consequently, to achieve better segmentation accuracy, such methods often become cumbersome and inefficient. (3) Limited 3D label-based methods [15,16,17]. These are considered optimal for efficiently processing large-scale point clouds.
Although recent limited 3D label-based methods have achieved promising results on several datasets, there are still some limitations. Firstly, existing methods often focus on single-scale classification. However, for large-scale scenes, there is a significant difference in the scale of foreground and background, making single-scale classification inadequate for capturing detailed and wide-ranging structural features. Secondly, these methods still lack sufficient consideration for local semantic information. Additionally, they fail to fully leverage valuable information from weak annotations.
To address the mentioned issues, we explore the full utilization of weakly supervised features in large-scale point clouds. Firstly, considering the significant scale variations in large-scale scenes, we employ a multi-scale classification strategy to capture both global and local features of point clouds, as illustrated in Figure 1. By extracting and analyzing features at different scales, we enhance the model’s ability to recognize complex scenes, thereby improving its robustness and generalization capability. Secondly, since contrastive regularization can extract more stable features from unordered point cloud data, thus fully leveraging global and local semantic information [18], we introduce local contrastive regularization. This approach fully considers the strong local semantic homogeneity of large-scale scenes by modeling the local information of original and augmented data through positive and negative anchor point pairs for contrastive learning. Finally, given the large-scale data and the scarcity of weak labels, we incorporate data augmentation strategies and capture more discriminative features by learning the contrastive information between original points and augmented points, which effectively utilize valuable information from weak annotations.
Based on the above attempts, we propose a network named MCCR, which integrates multi-scale classification and contrastive regularization. The method aims to achieve superior segmentation results with minimal annotation requirements. Initially, MCCR conducts hierarchical encoding of both the original and augmented point clouds, followed by extracting local feature from arbitrary point coordinates and obtaining feature vectors through trilinear interpolation. These feature vectors are utilized for computing multi-scale classification loss and are then aggregated into a single vector, which is fed into a series of multilayer perceptrons (MLPs) for semantic prediction. Leveraging the predicted results, MCCR learns point-level and local contrastive features of both original and augmented data, further optimizing the model by introducing contrastive regularization loss. Furthermore, a Decoupling Layer was designed to constrain the local contrastive regularization loss and segmentation loss in a more adaptive space. Extensive experiments demonstrate that MCCR achieves state-of-the-art performance on large outdoor datasets SemanticKITTI [19] and SensatUrban [20], and maintains strong performance on the indoor dataset S3DIS [21], validating the effectiveness of our approach.
To summarize, our key contributions are the following:
  • We propose MCCR, an end-to-end weakly supervised point cloud semantic segmentation network that combines multiple strategies to obtain better results with only 0.1% annotation.
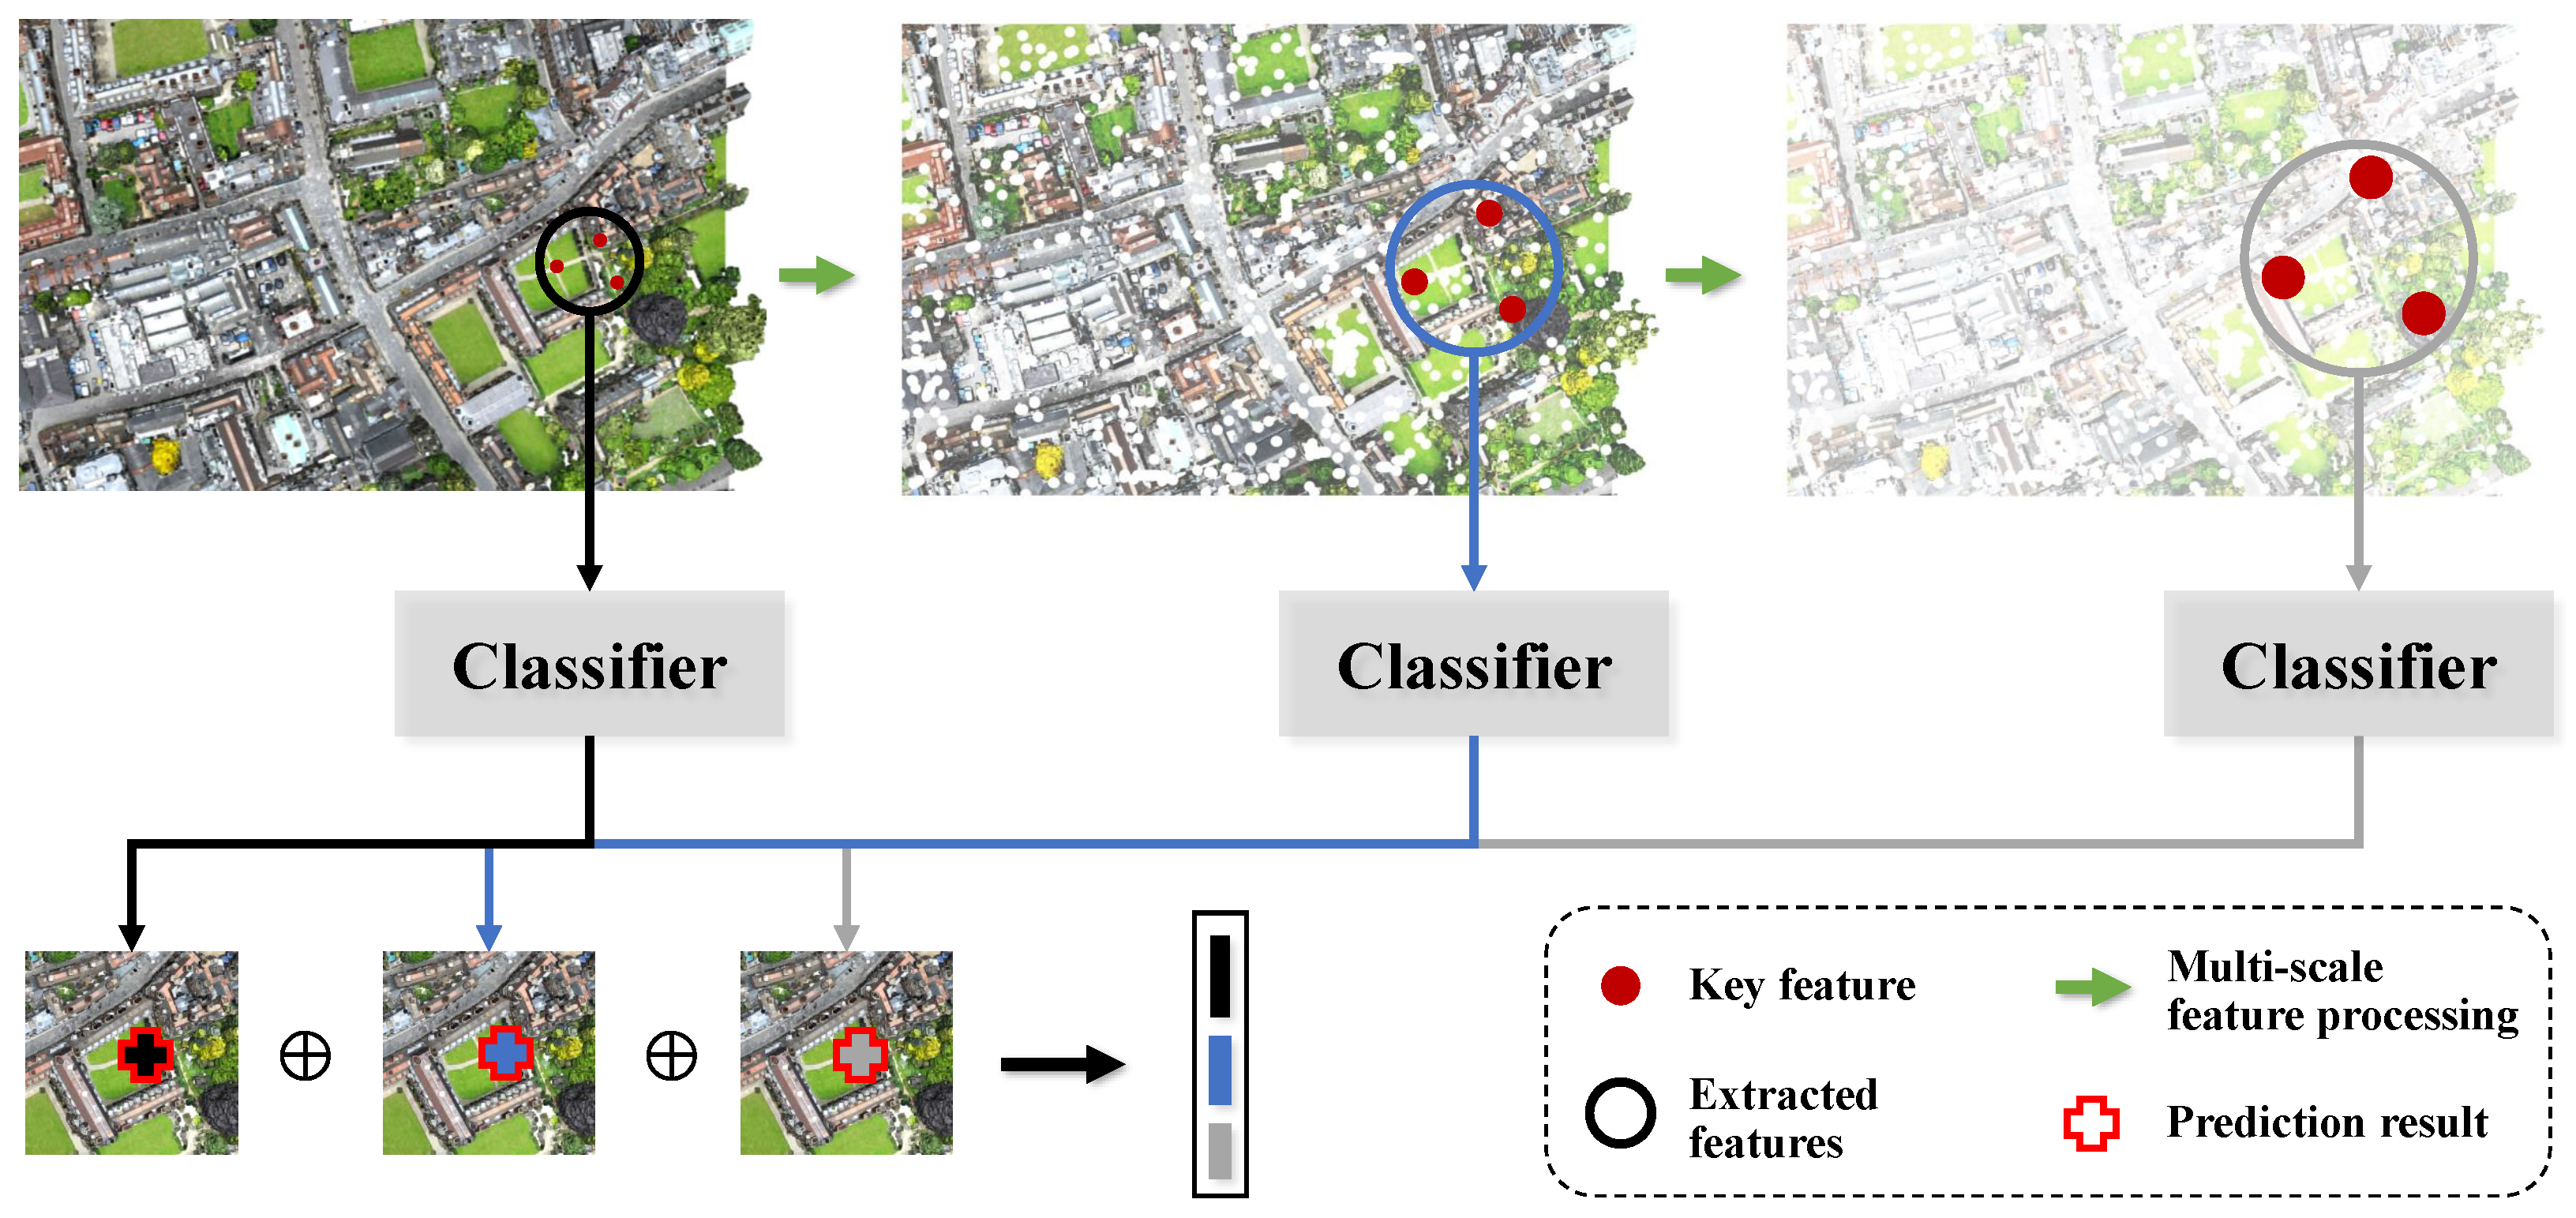
  • We introduce multi-scale classification to comprehensively capture the complex features in large-scale point clouds, thereby improving classification accuracy.
  • We incorporate contrastive regularization to extract more stable local features, thereby enhancing 3D semantic scene understanding tasks.
  • Our proposed MCCR shows a significant improvement over baselines on our benchmark and reaches state-of-the-art performance.

2. Related Work

2.1. Fully Supervised Point Cloud Semantic Segmentation

Recently, the accuracy and effectiveness of fully supervised point cloud semantic segmentation tasks have greatly improved with the increase in the number of accessible datasets. According to different processing strategies for the initial data, these methods can be generalized as projection-based, voxel-based and point-based methods.
Projection-based methods [22,23] first select multiple viewpoints to project 3D data into 2D images, and then perform subsequent semantic learning and processing on the images. However, different viewpoint choices and image processing strategies affect the final segmentation results. Voxel-based methods voxelize the point cloud data. Based on this, Choy et al. [24] proposed 4D spatio-temporal convNets, and Graham et al. [25] introduced new sparse convolutional operations that can efficiently process spatially sparse data. However, the transformation of the 3D data in the above methods increases the amount of processing data and masks the natural characteristics of the initial data, whereas point-based methods can avoid these problems. Therefore, research on point-based methods has flourished in recent years. The groundbreaking work of PointNet [1] processes point cloud data based on MLPs, but it lacks consideration of local geometry and interrelationships between points. Subsequently, numerous methods [26,27,28,29,30,31,32,33,34] have emerged to overcome these problems, although fully supervised methods require a greater cost of annotation in order to obtain higher segmentation accuracy.

2.2. Weakly Supervised Point Cloud Semantic Segmentation

Introducing weak supervision into point cloud semantic segmentation can effectively reduce the costs of annotation, and the labeling strategies chosen for some of these works include point-level annotation, scene-level annotation, subcloud-level annotation [11] and seg-level annotation [35]. The existing methods can be classified into three categories based on the different ways of utilizing training data.

2.2.1. Two-Dimensional Label-Based Methods

These methods only need 2D supervision to complete 3D segmentation tasks. Inspired by work on 3D reconstruction using 2D projection and 3D analysis with graph convolution, Wang et al. [8] firstly proposed a similar approach for point cloud semantic segmentation, which consists of a graph-based pyramid feature network (GPFN) and a 2D optimization module. Among them, the GPFN contains a graph-based feature pyramid encoder and a decoder network, and perspective rendering and the semantic fusion module are chosen for the 2D–3D joint optimization. Then, Wang et al. [9] presented LDLS (Label Diffusion Lidar Segmentation), which uses an off-the-shelf Mask-RCNN [36] to segment RGB images and diffuse their semantic information into 3D space and then construct the graph based on 2D projection coordinates to finally obtain the complete semantic labels of the point cloud. Following this, Wang et al. [10] improved the segmentation framework based on their earlier work [8] to obtain superior segmentation outcomes. However, manual annotation still requires a lot of effort with this strategy.

2.2.2. Pseudo 3D Label-Based Methods

Pseudo labels can improve the accuracy of segmentation by providing additional information for constraint. Inspired by the Class Activation Map (CAM) [5], Wei et al. [11] proposed a method to generate pseudo labels with a Point Class Activation Map (PCAM) and multi-path region mining module, and then trained the segmentation network in a fully supervised manner. This is the first method to employ cloud-level labels for weakly supervised semantic segmentation. Zhang et al. [37] presented a weakly supervised method for the semantic segmentation of large-scale point clouds that incorporates both migration learning and label propagation components. The method learns prior information by self-supervision and migrates it into the weakly supervised network. Then, a sparse label propagation mechanism is employed to generate pseudo labels, thereby introducing more supervised data to improve the training.
Due to the irregular nature of the point cloud, pseudo labels cannot be accurately predicted using only geometric properties. Cheng et al. [12] proposed a new semi-supervised segmentation network SSPC-Net to solve this problem. This method divides the original point cloud into superpoints and constructs a superpoint graph, and then generates pseudo labels with a dynamic label propagation strategy. It also introduces an attention mechanism for superpoint feature learning, and finally trains the semantic segmentation network using supervised superpoints and pseudo labels. Liu et al. [13] constructed the super-voxels of point clouds, employed the graph propagation module for training and label propagation and utilized iterative training to improve classification results. Li et al. [18] constructed HybridCR (hybrid contrastive regularization), the first segmentation framework to simultaneously exploit point consistency, contrastive regularization and pseudo-labeling.
In contrast to previous research, Shi et al. [38] proposed a novel temporal–spatial framework that consists of two stages: firstly, it generates seeding points for different frames based on weak annotation; secondly, matching and graph propagation modules are used to propagate valid pseudo-labeled information in both temporal and spatial dimensions. Liu et al. [39] noted that the majority of existing methods rely on contrast loss for learning and pseudo label prediction by sparse annotations, which is crucial to select and train labeled samples more effectively. Therefore, they propose a method based on active learning and self-training to optimize supervised information while simplifying label propagation. Li et al. [40] utilized an architecture-agnostic contrastive learning strategy for segmentation. Wu et al. [41] utilized predicted confidence and uncertainty to select reliable pseudo labels. These methods choose to complete fully supervision or network retraining by generating pseudo labels, so they are often designed with multiple steps, and the implementation is more complicated.

2.2.3. Limited 3D Label-Based Methods

Mei et al. [15] proposed a semi-supervised semantic segmentation approach for 3D dynamic scenes, which converts the raw point cloud data into a depth map before introducing a CNN-based classifier, and then trains it with a limited quantity of supervised data and a large number of pairwise constraints. This semi-supervised method employs inter-frame constraints that are only relevant for dynamic scenes; hence, it is inapplicable to generic datasets and lacks robustness. Xu and Lee [17] augmented the features of unlabeled points with three additional constraints. However, this method cannot fully consider global features and still requires a high labeling workload. Wei et al. [16] later presented a dense supervision propagation method that can propagate the supervised signal from labeled points to unlabeled ones based on the KPConv [4] network. The first training stage employs the cross-sample feature reallocating (CSFR) module, and the second stage contains the intra-sample feature redistribution (ISFR) module. A perturbed self-distillation (PSD) framework was proposed by Zhang et al. [42] that uses the predictive consistency of perturbed branches and original ones to propagate information between labeled and unlabeled points. It also introduces a context-aware model to improve segmentation performance.
In order to overcome the limitations of existing weakly supervised techniques, Hu et al. [43] explored the limits of current fully supervised methods and proposed a Semantic Query Network (SQN) to share sparse label information using the mature RandLA-Net [3] structure. Yang et al. [44] proposed a MIL-Derived Transformer model in order to take full advantage of inter-cloud semantics. The model introduces a Transformer, and explores pairwise supervised strategy with multiple instance learning (MIL), and chooses adaptive global weighted pooling and point subsampling for robustness optimization and regularization. However, there is still room for improvement in the method’s efficiency. Cheng et al. [45] found that the existing random sampling approaches have some shortcomings for application in autonomous driving scenarios; therefore, they proposed a new Polar Cylinder Balanced Random Sampling method based on RandLA-Net to make the sampled point cloud distribution more balanced. Lee et al. [46] proposed a graphical information gain-based attention network (GaIA) to identify reliable information and propagate plausible features to uncertainty points. In addition to approaches of semantic segmentation using inter-class differences, Su et al. [47] discovered large intra-class differences in 3D point cloud data. Therefore, they proposed a multi-prototype classifier and two constraints to improve the segmentation performance by discovering subclasses within each semantic class under weakly supervised conditions.

2.3. Unsupervised Point Cloud Semantic Segmentation

Research on unsupervised image semantic segmentation [48,49,50,51] has gradually matured. Compared to weakly supervised methods, unsupervised learning does not even require labeled data, prompting some studies to explore the application of this concept to the 3D space. However, the irregularity of point cloud data and the uneven distribution of classes introduce clustering ambiguities, making it impractical to directly apply 2D methods to point cloud tasks [52].
To address these challenges, Bian et al. [53] designed a multi-level feature consistency model, generating the high-quality pseudo labels for the unlabeled target domain. Then, they imposed feature consistency constraints on the feature memory bank of the source and target domains to develop a cycle association model, thereby learning more discriminative features. Chen et al. [52] proposed PointDC (point cloud cross-modal distillation and super-voxel clustering), which consists of two steps: Cross-Modal Distillation (CMD) and Super-Voxel Clustering (SVC). In the CMD stage, multi-view visual features are back-projected into 3D space and aggregated as point features. Then, these features are clustered into super-voxels during the SVC stage, which are then fed into an iterative clustering process to extract semantic classes. Zhang et al. [54] proposed GrowSP (Growing Superpoint), a method that discovers 3D semantic elements through the progressive growth of superpoints. The approach first learns point-wise features from the input point cloud, then incrementally increases the size of the superpoints, and finally groups them into semantic elements via clustering. Furthermore, researchers have suggested that existing self-supervised 3D pretraining techniques [55,56] could be applied to unsupervised semantic segmentation. However, the point features obtained through current pretraining methods lack semantic information and cannot be directly utilized [54].
While unsupervised point cloud semantic segmentation significantly reduces annotation costs, the resulting segmentation accuracy of these methods is often insufficient for practical applications. As a result, our MCCR is designed for limited 3D labels, and it improves segmentation accuracy using the multi-scale classification strategy and enhancing the consideration of local and point-level information, while ensuring a simple structure in an end-to-end manner.

3. Method

In this section, we first present the overview of our proposed method in Section 3.1. Then, we present the general framework of MCCR with multi-scale classification and contrastive regularization in Section 3.2 and Section 3.3. Finally, loss functions are specified in Section 3.4.

3.1. Overview

The overall framework of MCCR is illustrated in Figure 2, which aims to capture more useful information from sparsely labeled training data to enhance the performance.
Firstly, MCCR employs random mirroring, rotation and jittering as data augmentation techniques. These augmentation techniques expand the original point cloud, helping the model in learning a broader and richer range of features, thereby enhancing its segmentation performance and generalization capabilities. Subsequently, both the original and augmented point clouds are subjected to feature extraction and downsampling to generate multi-layer features.
Specifically, we utilize the encoder LFA (Local Feature Aggregation) from RandLA-Net [3] as the feature extractor. LFA first uses Local Spatial Encoding to capture the spatial features for each point, which are then combined with the point’s original features to form a feature set. These feature sets are then weighted and aggregated using attentive pooling to obtain the final features. Additionally, we employ random strategies for downsampling, which involves uniformly and randomly selecting a specified number of points from the original point cloud.
Then, a point is randomly selected, and its local information is retrieved from the multi-layer features based on the input coordinates and interpolated accordingly. The resulting feature vectors are then combined and fed into a series of MLPs to obtain the initial prediction results, upon which the contrastive regularization loss is constructed.
Additionally, MCCR conducts multi-scale classification on the multi-layer features. The decoupled initial prediction results are then combined with the multi-scale classification outcomes to derive the final predictions Y. The segmentation loss is formulated using both the weak supervision information and the final prediction results, and it is combined with the contrastive regularization loss to jointly constrain the network training.

3.2. Multi-Scale Classification

Foreground and background in large-scale point clouds often exhibit significant scale differences. Multi-scale classification can utilize both global and local information, thus capturing more accurate features across them. Therefore, to further enhance segmentation accuracy, we introduce the concept of multi-scale classification, which helps MCCR adapt better to scenes and objects under different conditions.
First, we perform downsampling and feature aggregation multiple times on the original point cloud to extract multi-scale features. Then, the local features of query points are obtained and classified at each scale. Specifically, MCCR inputs the features extracted at each scale into a two-layer fully connected network for classification, and the results are then integrated and fed back into the segmentation loss function. By incorporating multi-scale features, the model can fully capture both global and detailed local information, thereby better guiding the learning process of MCCR. The formula for calculating the multi-scale classification loss is as follows:
L msc = 1 C N h = 1 H i = 1 N c = 1 C y i c log exp y ˜ i h c c = 1 C exp y ˜ i h c
where C represents the total number of annotated classes, N is the number of input points, H denotes the total number of layers, y i c denotes the true value of point x i belonging to category c, and y ˜ i h c is the prediction value at layer h indicating that point x i belongs to class c.

3.3. Contrastive Regularization

Contrastive regularization aims to learn discriminative feature representations by pulling together positive anchor pairs that should be similar while pushing them away from other negative anchors, which can maximize the similarity between positive anchor pairs and minimize the similarity with negative anchors. Inspired by HybridCR, we use contrastive regularization in the initial prediction space to enhance the performance of the model in semantic segmentation tasks and reduce the risk of overfitting. Specifically, the initial predictions are used as positive and negative anchors, and the model is then optimized using contrastive regularization loss.

3.3.1. Point-Level Contrastive Regularization

To emphasize the similarity of features among objects of the same class in the point cloud and the distinctiveness of features among different classes, we first apply point-level contrastive regularization to both the original and augmented data. This involves bringing the initial prediction results of the original points closer to their corresponding augmented points while pushing them away from other points. Thus, the formula for calculating the point-level contrastive regularization loss can be determined as follows:
L pcr = 1 N i = 1 N log j = 1 N 1 [ j = i ] exp y ˜ i · y ^ j / τ j = 1 N 1 [ j i ] exp y ˜ i · y ^ j / τ
where y ˜ i = f θ x i and y ^ j = f θ x ^ j are the predictions of the i-th and j-th point of the original data and the augmented data, respectively. 1 [ j = i ] { 0 , 1 } is an indicator function equaling 1 if j = i , and 1 [ j i ] is the same when j i , τ is a temperature hyper-parameter that we set, and N is mentioned in Equation (1).

3.3.2. Local Contrastive Regularization

The local features of point clouds primarily originate from the points and their neighborhoods. In large-scale 3D point cloud scenes, these local features often exhibit strong semantic similarity. Consequently, we believe that the accuracy of semantic segmentation models relies heavily on effectively capturing and utilizing these features. To enhance segmentation precision, we employ a local contrastive regularization strategy to optimize the modeling of local point cloud features.
In detail, given a 3D query point x i in the original point cloud and its corresponding point x ^ j in the augmented point cloud, we input the coordinates x y z of x ^ j in the prediction space. Using the Euclidean distance, we search for the K nearest augmented neighbors and obtain the mean value of their initial prediction probabilities, denoted as y ^ j k . To make the predicted value of x i closer to y ^ j k and farther from the mean predicted values of other nearest neighbors, we constructed the local contrastive regularization loss with the following formula:
L lcr = 1 N i = 1 N log j = 1 N 1 [ j = i ] exp y ˜ i · y ^ j k / τ j = 1 N 1 [ j i ] exp y ˜ i · y ^ j k / τ
where N, y ˜ i = f θ x i , 1 [ j = i ] { 0 , 1 } , and τ is mentioned in Equation (2). K is the number of nearest neighbors, and y ^ j k = 1 K t = 1 K f θ x ^ t .

3.3.3. Decoupling Layer

To enhance the optimization effect, we introduce contrastive regularization loss in addition to segmentation loss. However, due to the coupled nature of these two losses, they do not always converge simultaneously. To address this issue, inspired by Strong Baseline [57], we propose using a Decoupling Layer to constrain the segmentation loss and contrastive regularization loss in different spaces.
In particular, we add a Batch Normalization (BN) layer after the fully connected layer, which normalizes the input for each batch in the neural network, bringing the mean of each feature close to 0 and the standard deviation close to 1. Consequently, it standardizes the output of the fully connected layer to have a distribution with zero mean and unit variance. If we consider the output of the fully connected layer as points in the feature space, this normalization distributes these points on a high-dimensional spherical surface centered near the origin with a radius of 1. Thus, it normalizes the network’s initial predictions as points on a hypersphere and optimizes the segmentation loss in this new feature space. The Decoupling Layer confines the segmentation loss to the hypersphere, making the optimization process more efficient and stable. The implementation is as follows:
Y = BN ( Y ˜ ) = γ · Y ˜ μ B σ B 2 + ϵ + β
where Y represents the final prediction results, Y ˜ denotes the initial prediction results of the input point cloud, μ B is the mean of the input prediction results, σ B 2 is the variance of the input prediction results, ϵ is a small constant for numerical stability, γ is a learnable scaling parameter, and β is a learnable shifting parameter.

3.4. Loss Functions

Based on the above, we propose an end-to-end weakly supervised 3D point cloud semantic segmentation model MCCR for large-scale scenes, whose overall objective can be expressed as follows:
L total = L seg + L cr
Here, L seg is the cross-entropy between the predicted results after softmax classification, multi-scale classification results and ground truth labels, formulated as
L seg = L pre + L msc
That is,
L seg = 1 C N L i = 1 N L c = 1 C y i c log exp y ˜ i c c = 1 C exp y ˜ i c 1 C N L h = 1 H i = 1 N L c = 1 C y i c log exp y ˜ i h c c = 1 C exp y ˜ i h c
where y ˜ i c denotes the predicted value of point x i belonging to category c. And L cr is formulated as
L cr = L pcr + L lcr
Among them, the calculations of L pcr and L lcr are mentioned in the previous subsection.

4. Experimental Results

4.1. Implementation Details

We employed a point-level weak annotation setup, where a certain proportion of points were randomly selected from each scene as labeled data. The experiments were conducted on a PC with an Intel Core™ i9-12900KF CPU and an NVIDIA RTX 3090Ti GPU (24 GB GPU memory). The numbers of input points N, annotated classes C and layers H vary for the different datasets, and we set K = 3 and τ = 1.0 .
It is worth noting that we designed the weights for the trilinear interpolation as variables related to the Euclidean distance to the nearest neighbors. This approach better reflects the features and structure of the local space, leading to more accurate interpolation results.

4.2. Evaluation Metrics

We evaluated the final performance of the model at all points of the test dataset and chose the Mean Intersection-over-Union (mIoU) and Overall Accuracy (OA) as the evaluation metrics. In assuming that K is the total number of classes, TP is the number of True Positives, FP is False Positives, FN is False Negatives, and TN is True Negatives. The two evaluation metrics can be calculated as follows [20]:
OA = TP TP + FP + FN + TN
mIoU = 1 K k = 1 K T P k TP k + FP k + FN k

4.3. Comparison with SOTA Methods on Large-Scale Datasets

To realistically evaluate the performance of our model, we chose to test it on three commonly used public large-scale datasets. They vary in the acquisition sensors, size and data characteristics.

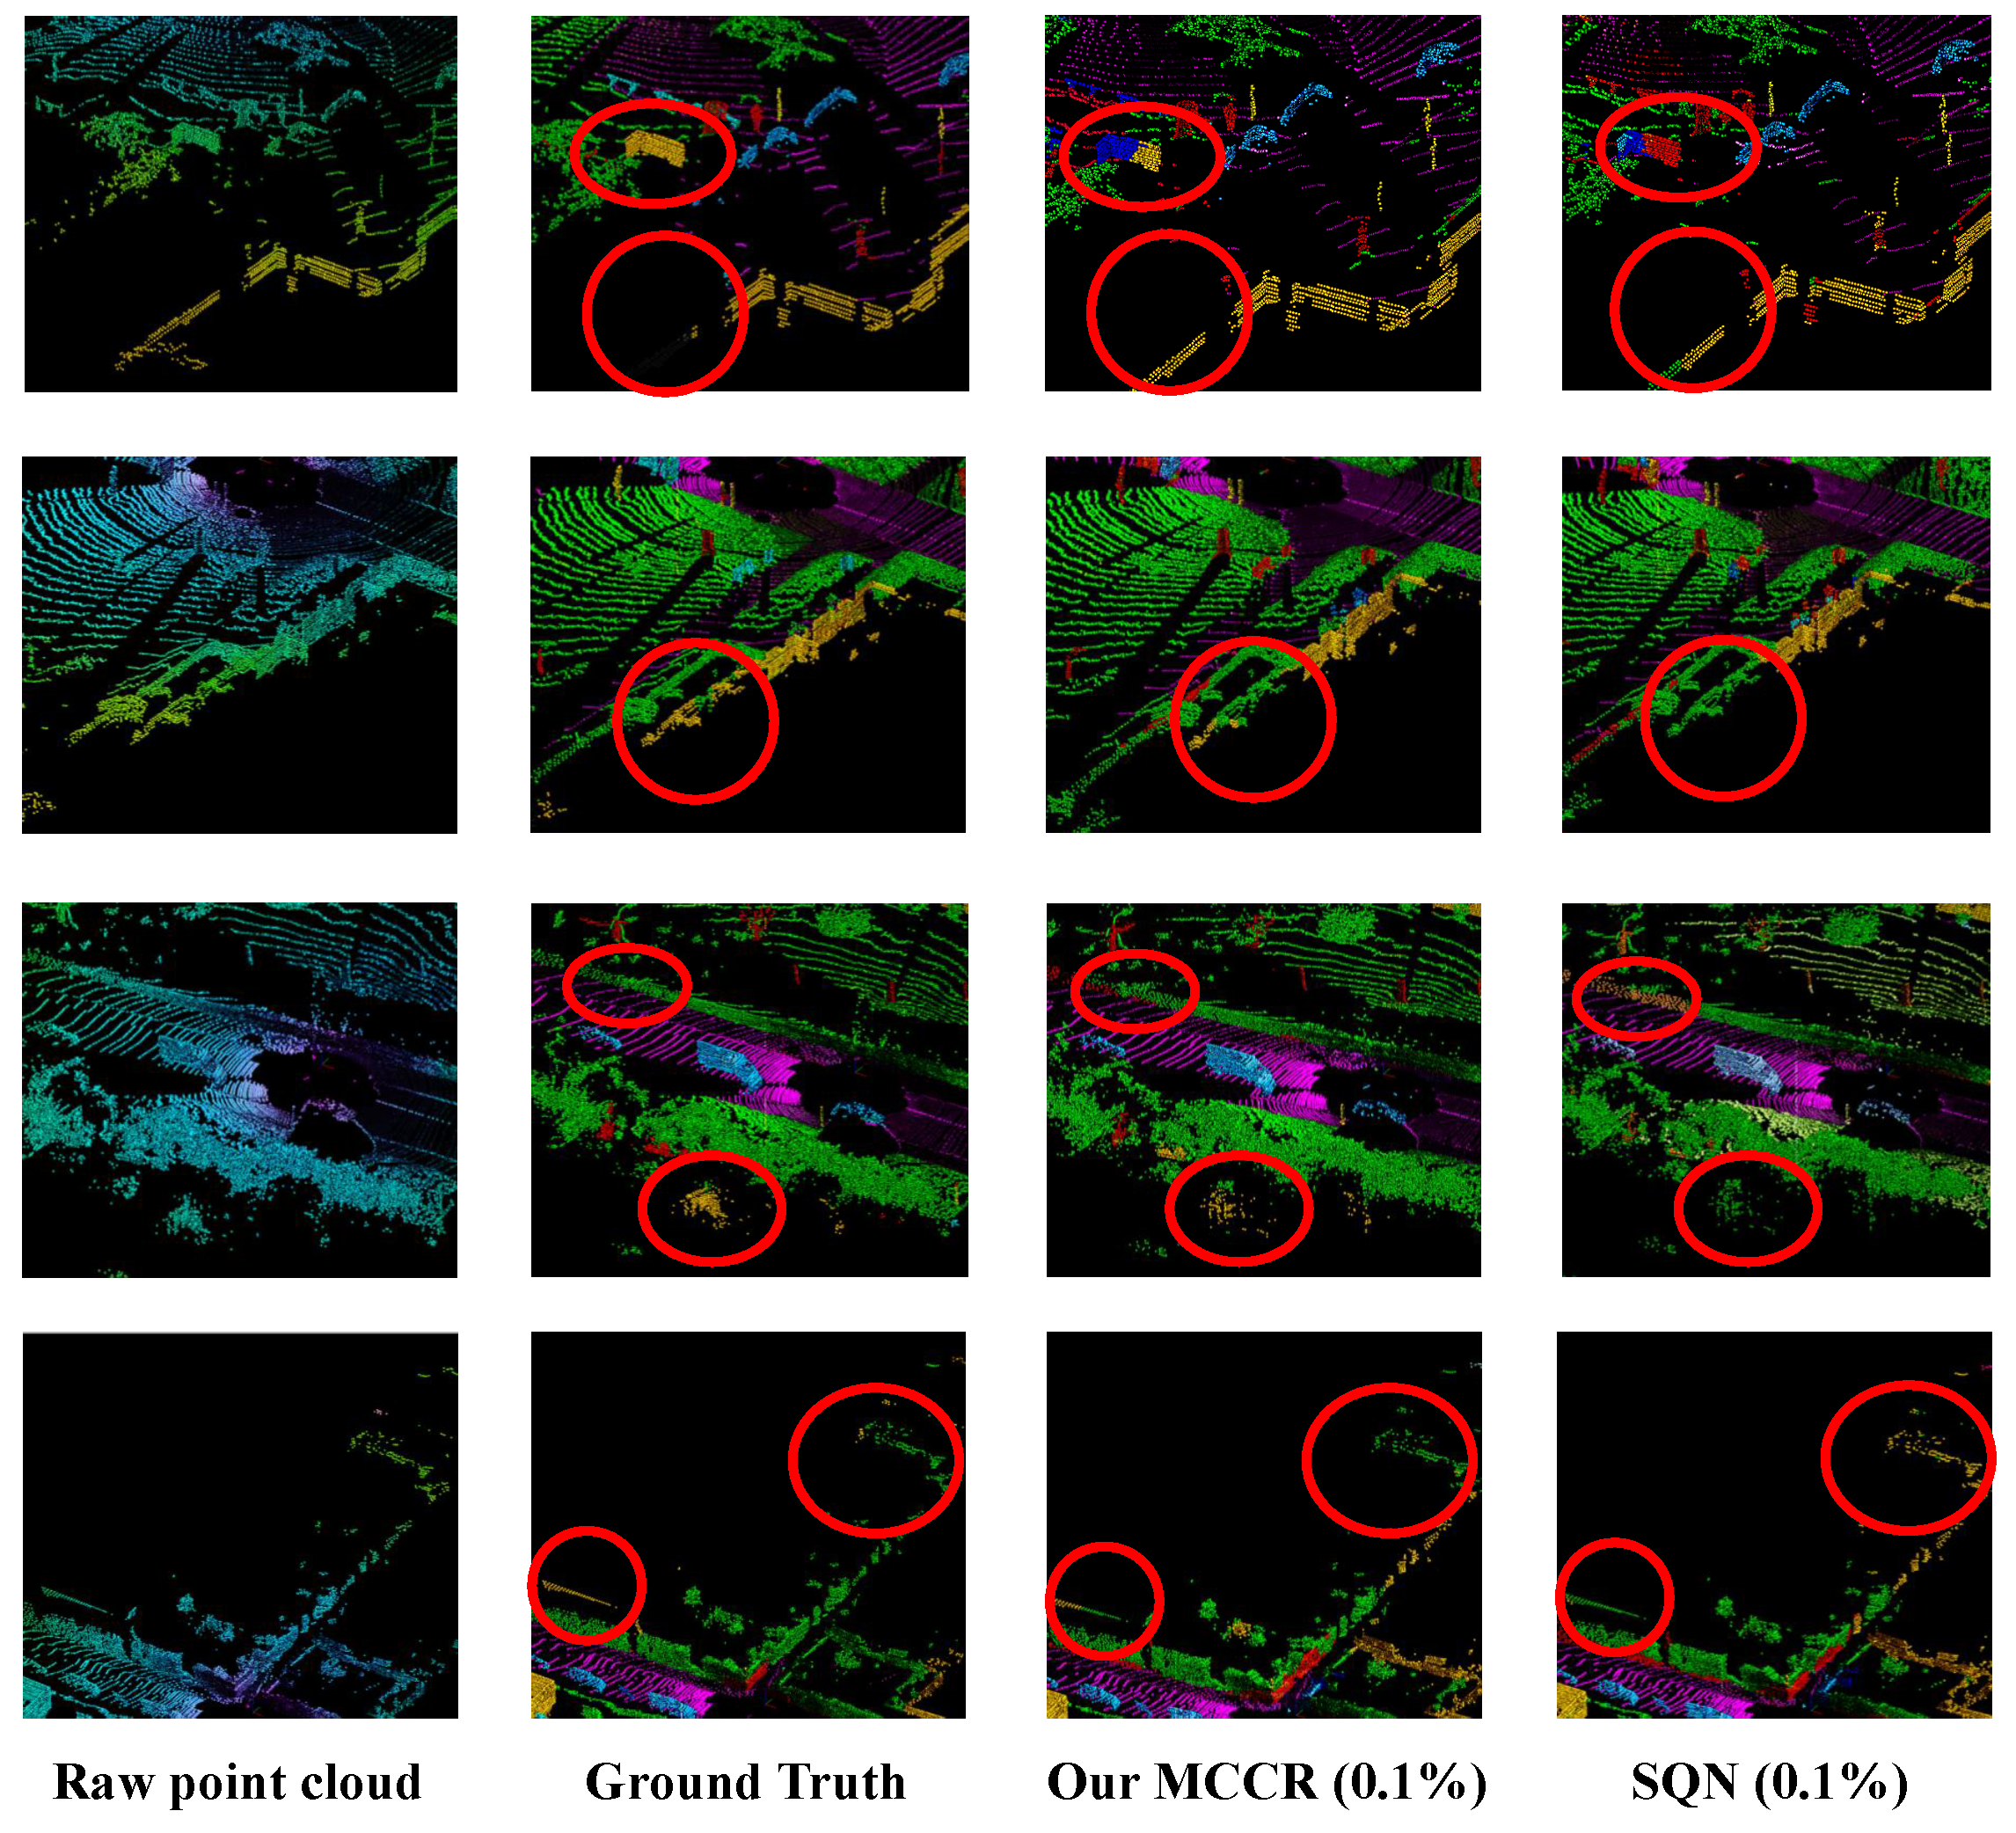
4.3.1. Evaluation on SemanticKITTI

SemanticKTTI [19] is a large dataset of outdoor scenes collected with MLS and densely annotated at the University of Bonn, Germany. It contains 4549 million points and 28 semantic classes and distinguishes between moving and non-moving vehicles and humans. The dataset’s team made online evaluation available through a public website.
We evaluated MCCR and other methods on the SemanticKITTI dataset, as shown in Table 1 and Figure 3. Our MCCR achieves an mIoU of 52.9 with only 0.1% labeled data for training, which outperforms the fully supervised methods PointNet, PointNet++ [2] and SPG by 38.3%, 32.8% and 35.5%, respectively. It also surpasses the 1% weakly labeled HybridCR [18] by 0.6%, and exceeds the baseline methods SQN* and SQN with the same labeling proportion by 1.4% and 2.1%. Additionally, even compared to the more precise fully supervised networks, KPConv and RandLA-Net, our method, trained with only 0.1% labeled data, shows marginal differences of just 5.2% and 1%, respectively.
Furthermore, we present qualitative results on the validation set (Sequence 08) of SemanticKITTI in Figure 3. From left to right, the figure displays the raw point cloud, ground truth, our method’s results and the baseline results. Red circles highlight areas where our method outperforms SQN*. It can be seen that our MCCR recognizes vegetation and sidewalks better.

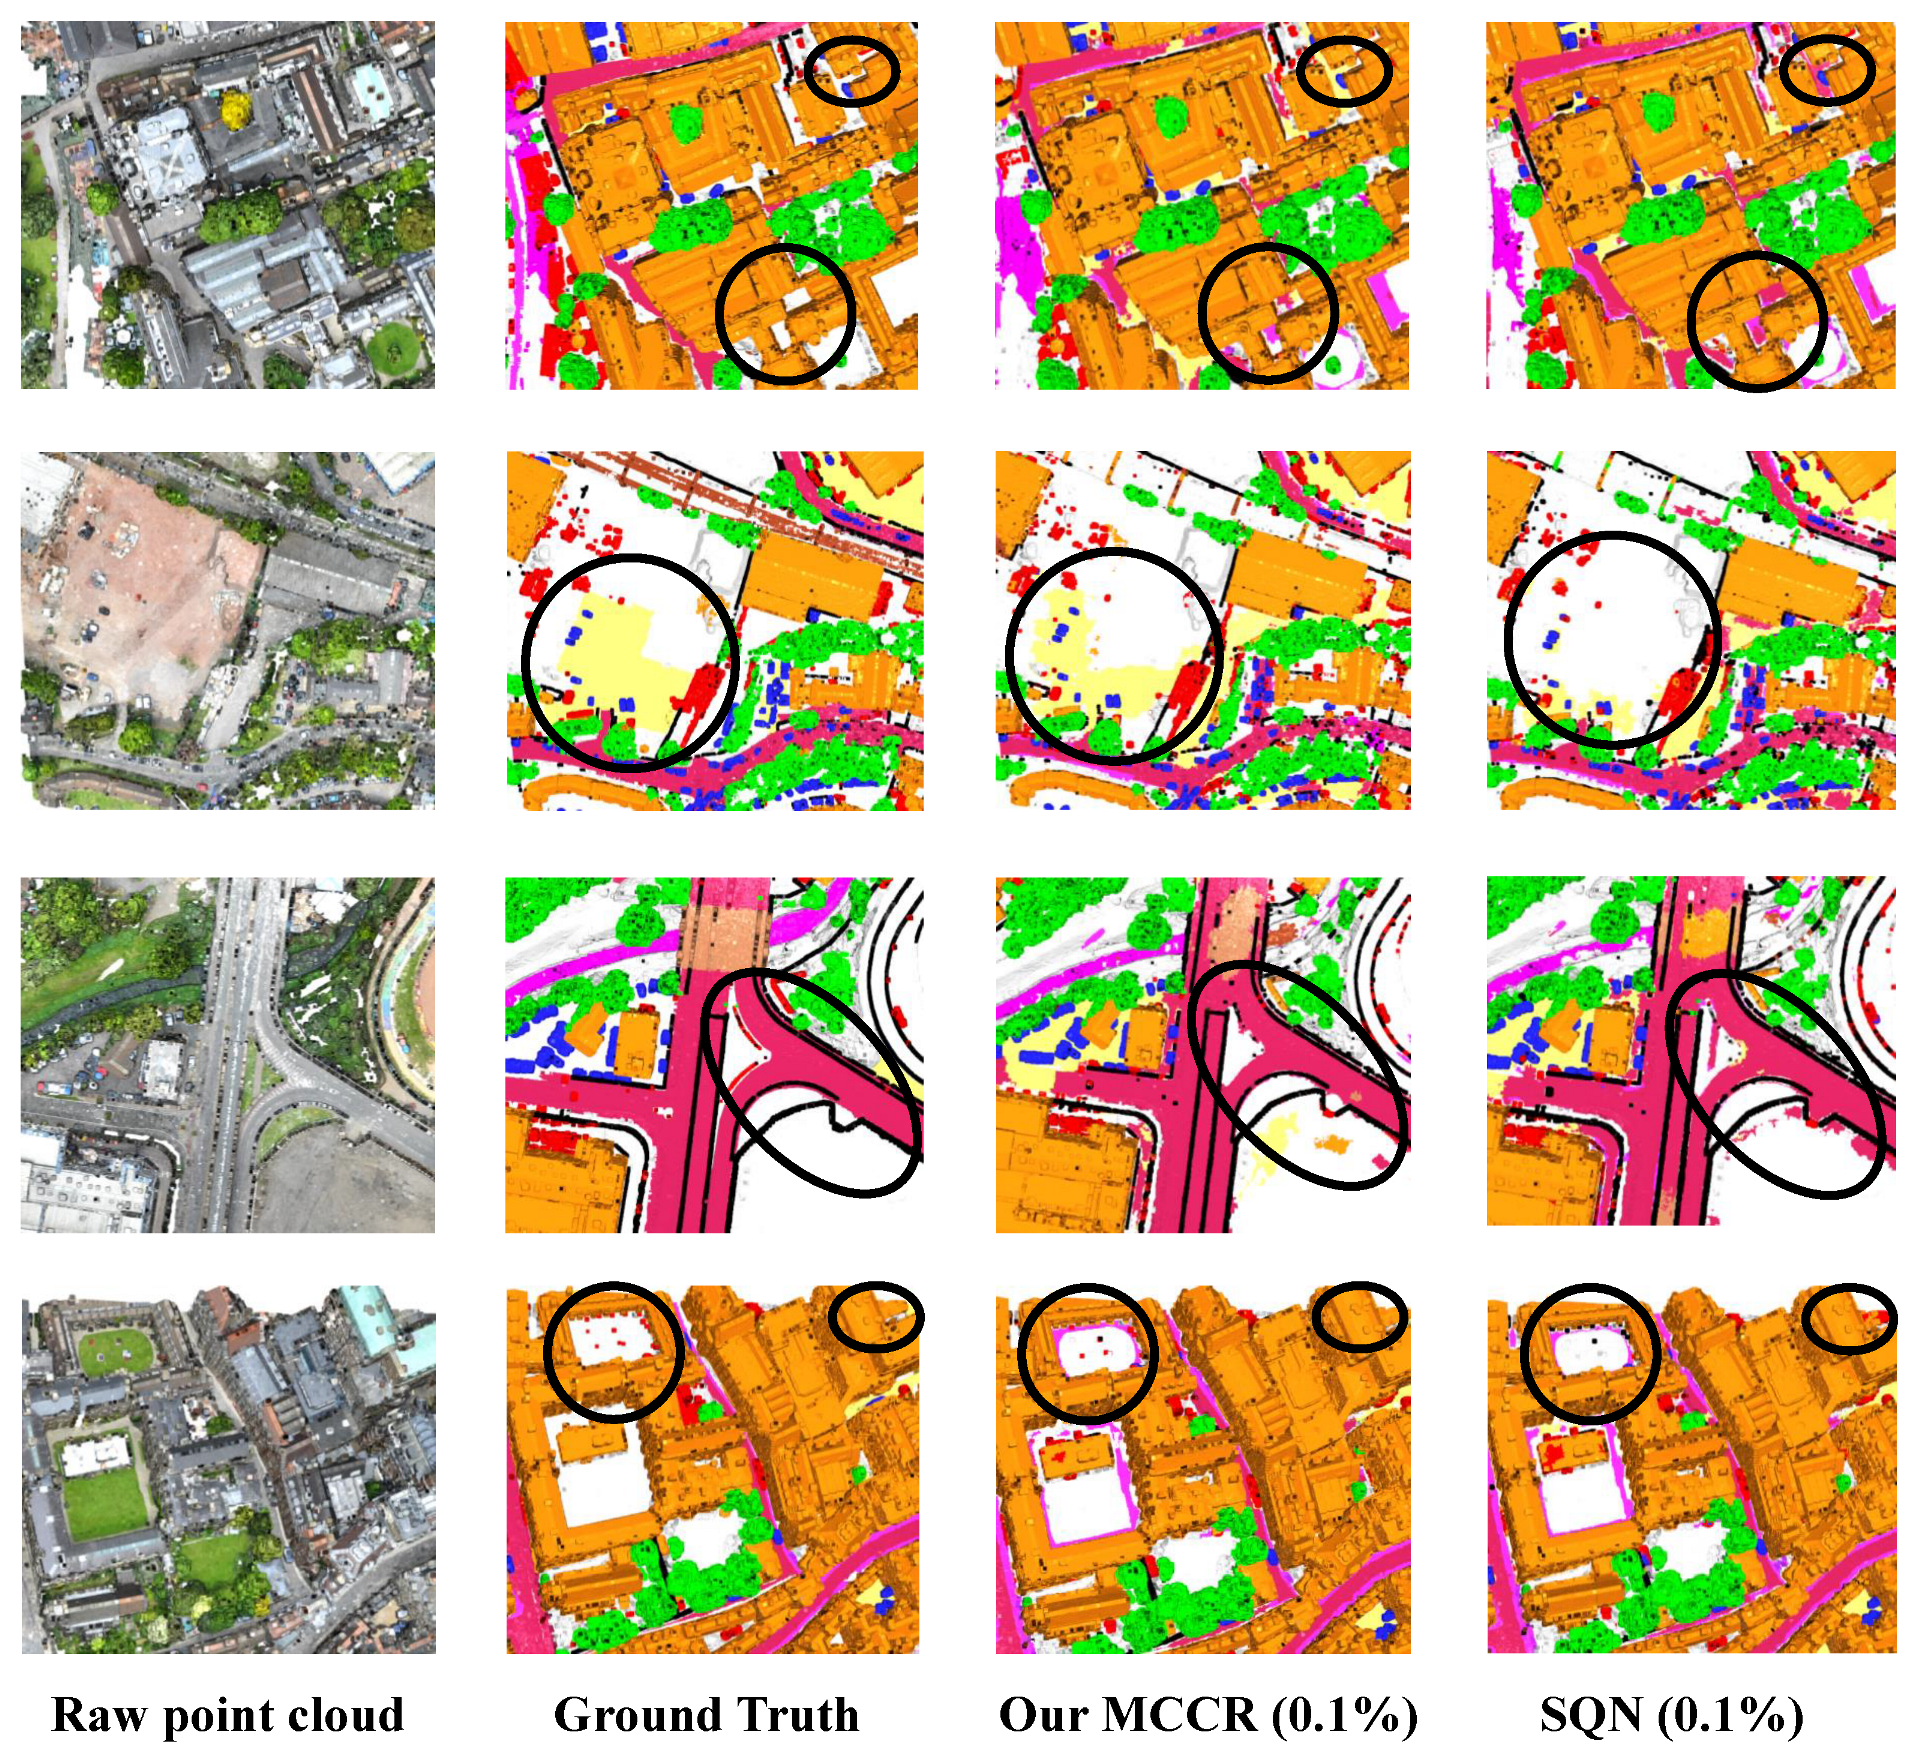
4.3.2. Evaluation on SensatUrban

SensatUrban [20] is a point cloud dataset collected using UAV Photogrammetry at the urban scale. It contains nearly 3 billion points covering 7.6 km2 from three cities in the United Kingdom, with each point semantically labeled with a total of thirteen semantic categories. SensatUrban’s data characteristics differ from those obtained by LiDAR due to the various sensors used in the data collection.
As shown in Table 2, for the SensatUrban dataset, our proposed MCCR achieves a higher mIoU compared to fully supervised methods, with only limited training data. Specifically, our method achieves an mIoU of 59.6 under the setting of 0.1%, with 35.9%, 26.7%, 22.3%, 16.9%, 2% and 6.9% improvements compared to the fully supervised methods PointNet, PointNet++, SPG, SparseConv [25], KPConv and RandLA-Net, respectively. Additionally, MCCR outperforms the baseline methods SQN* and SQN by 4.6% and 5.6% under the same settings. Compared to indoor datasets, our MCCR demonstrates superior performance on the outdoor dataset, reaching state-of-the-art levels.
We visualize the qualitative results on SensatUrban with 0.1% annotations in Figure 4. The regions where MCCR performs better are highlighted with black circles. It can be observed that our method, trained with only a minimal amount of labeled data, can effectively segment categories such as “vehicles”, “parking lots” and “traffic roads”.

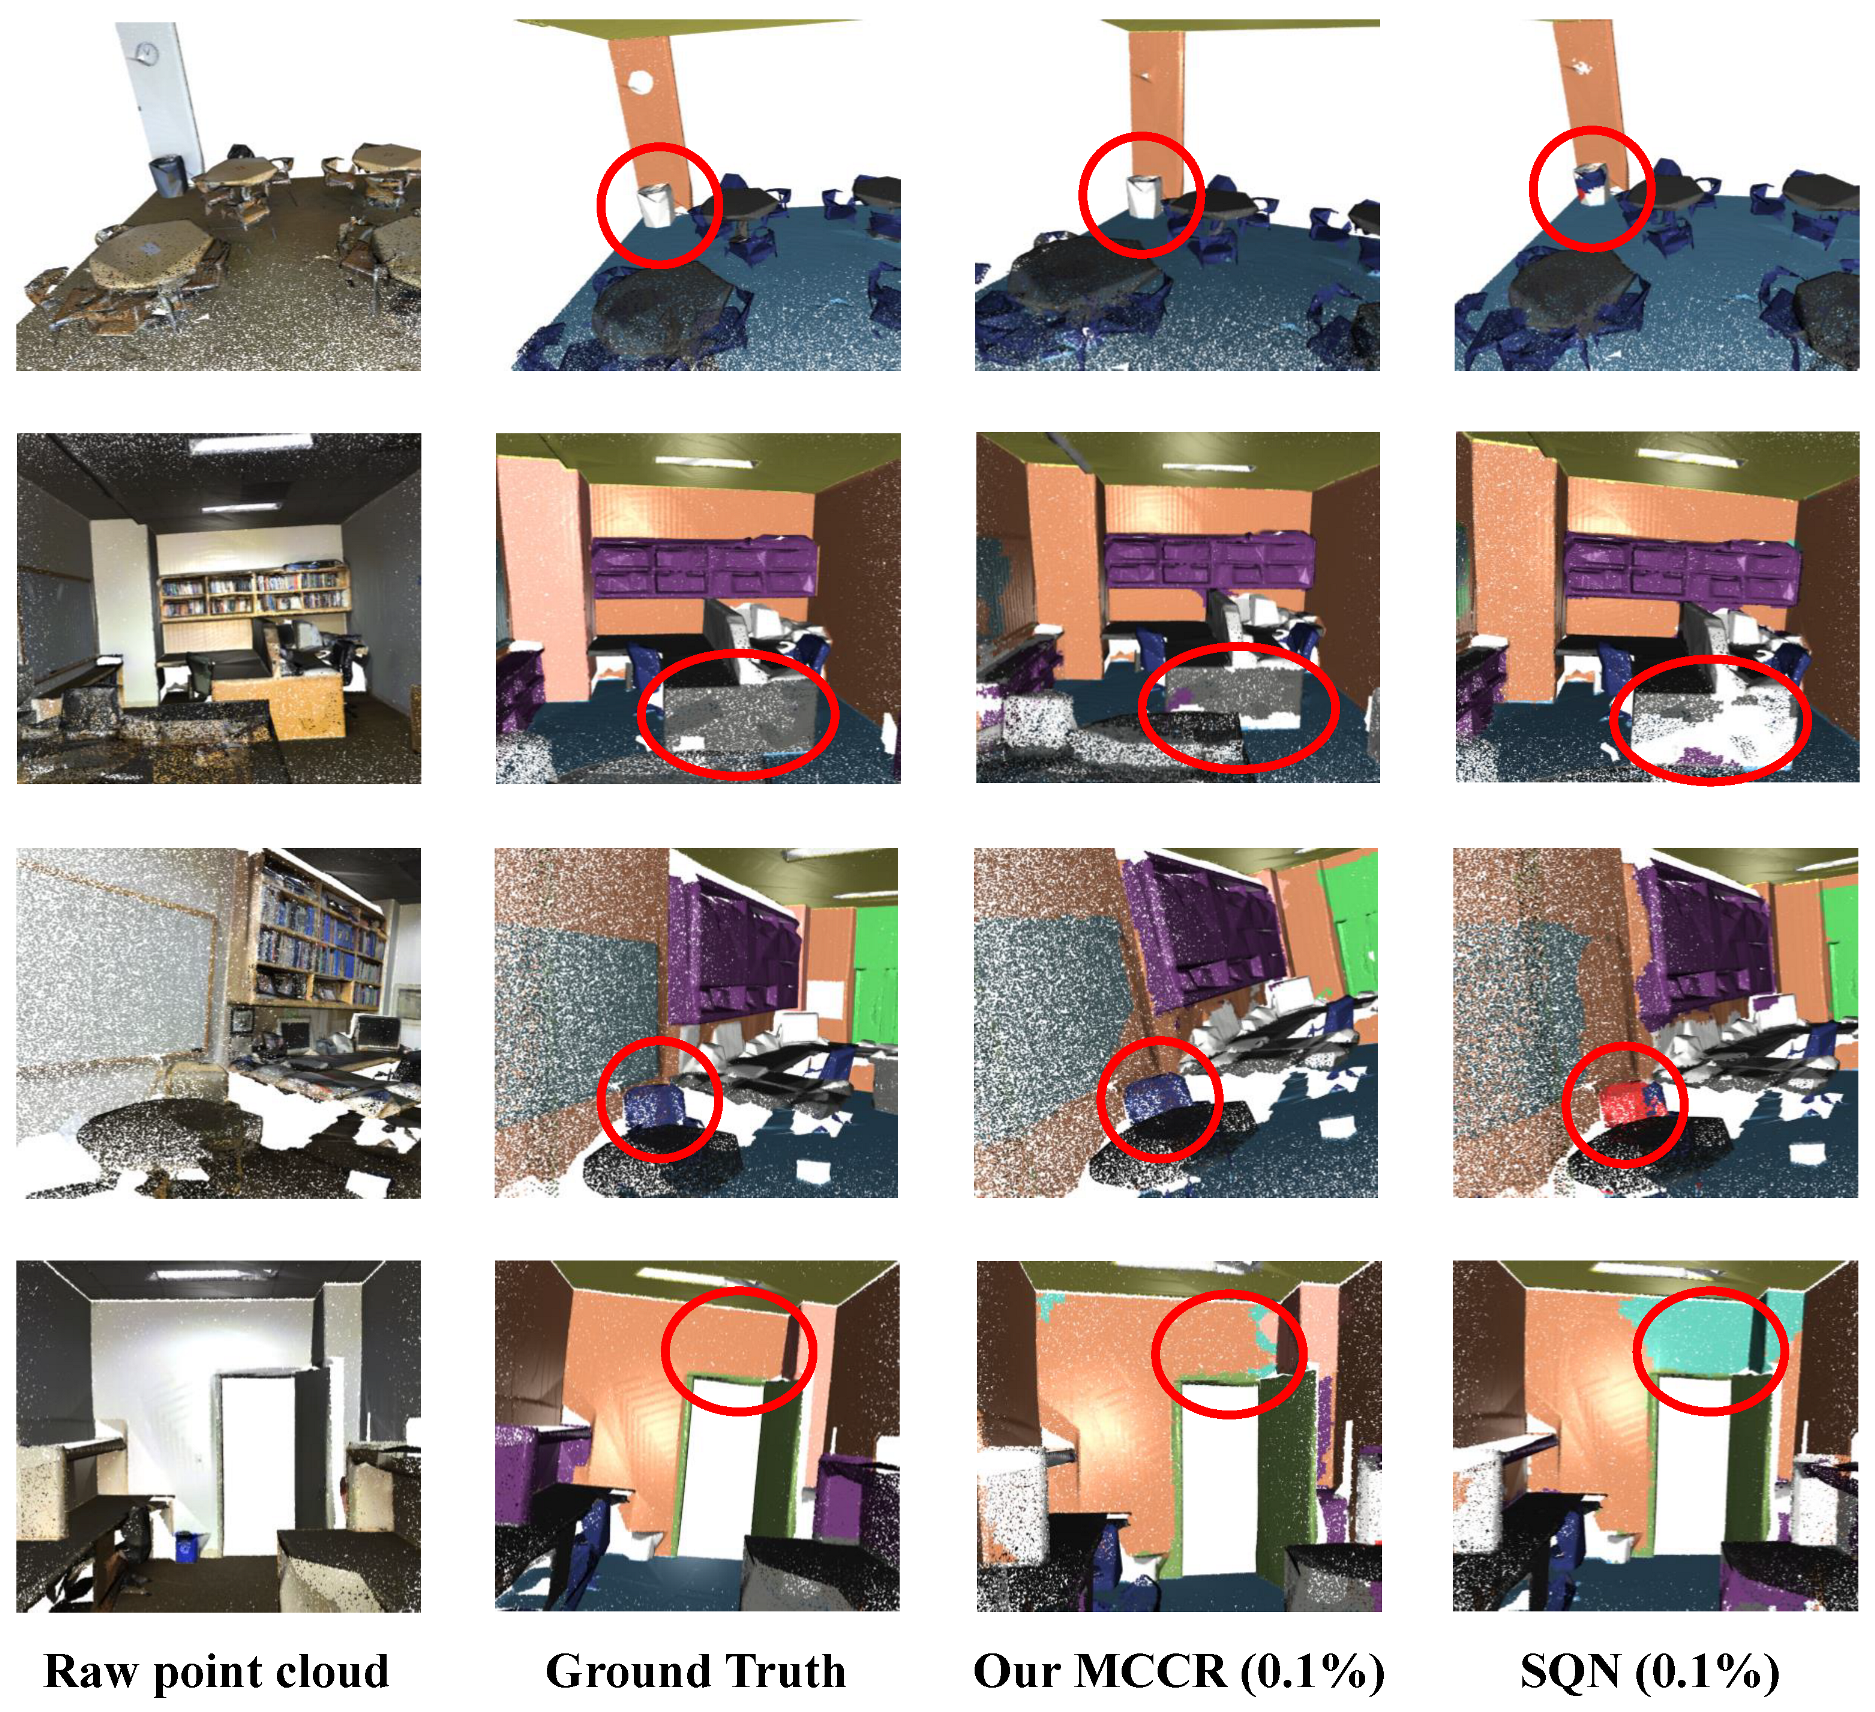
4.3.3. Evaluation on Large Indoor Dataset S3DIS

S3DIS [21] was created by Stanford University using Matterport from three different buildings, and it consists of five areas with distinct characteristics and a total area of 6020 m2. S3DIS has over 215 million points and 13 semantic categories, which include ceiling, floor, wall, beam, column, window, door, table, chair, sofa, bookcase, board and clutter.
Results on Area-5 of S3DIS Dataset. Our MCCR model demonstrated strong performance on two large-scale remote sensing datasets. To further evaluate its segmentation capabilities in indoor scenes, we conducted comparisons with state-of-the-art (SOTA) methods on Area-5 of the S3DIS dataset. The detailed test results are shown in Table 3, which indicate that, compared to other weakly supervised methods, our approach achieves competitive results compared to SOTA methods with the same amount of labeled data. Specifically, MCCR achieves an mIoU of 65.74 with 1% labeled data, which is 20.1%, 13.6%, 2.3% and 11.6% higher than the fully supervised methods PointNet [1], SPG [32] and RandLA-Net [3], respectively, and 17.74% higher than the 10% labeled method by Xu and Lee [17]. It also outperforms the SOTA methods of Zhang et al. [37], PSD [42] and SQN* by 3.94%, 2.34% and 0.84%, respectively, with the same amount of labeled data.
For the setting of 0.1%, MCCR achieves an mIoU of 61.47, which is 20.37% and 6.77% higher than the fully supervised methods PointNet and SPG, respectively, 13.47% and 16.97% higher than the 10% and 0.2% weakly labeled methods by Xu and Lee, respectively, and 2% higher than the baseline method SQN* with the same amount of labeled data. Additionally, for the more accurate fully supervised networks, KPConv [4] and RandLA-Net, our method, when trained with only 0.1% labeled data, differs by only 5.63% and 1.53%, respectively. It is worth noting that our results are comparable to those reported in the original SQN paper, and we achieve superior performance on larger-object categories, such as ceiling, floor and wall.
We show the qualitative results of the segmentation in Figure 5. It can be seen that our proposed MCCR can obtain results consistent with ground truth and it outperforms SQN*, which is reflected in the segmentation results of ‘table’, ‘chair’ and ‘wall’.
Results on S3DIS Six-Fold Cross-Validation. Due to the lack of a strictly defined training and testing set in the S3DIS dataset, we conducted a six-fold cross-validation to ensure an equitable comparison between MCCR and state-of-the-art methods, which involves using each area as a validation set sequentially while using the other areas as training sets. The final result is the average of the validation results across the six areas, as shown in Table 4. With 1% labeled data, our method achieves an mIoU of 67.7, outperforming the fully supervised methods PointNet, SPG, PointCNN [29] and DGCNN [28]. It surpasses the SOTA methods by Zhang et al. and SQN* by 1.8% and 0.5%, respectively, under the same labeling conditions. Our method also achieves a high mIoU of 62.5 in the setting of 0.1%, compared to the fully supervised methods PointNet, SPG, DGCNN and the baseline method SQN* under the same labeling settings, although it is 1.2% lower than that reported for SQN.
In summary, our method, tested on Area-5 and through a 6-fold cross-validation of the indoor dataset S3DIS, with 1% and 0.1% labeled data, matches the weakly supervised SOTA methods under the same conditions and achieves results comparable to fully supervised methods with only a small amount of labeled data.

5. Discussion

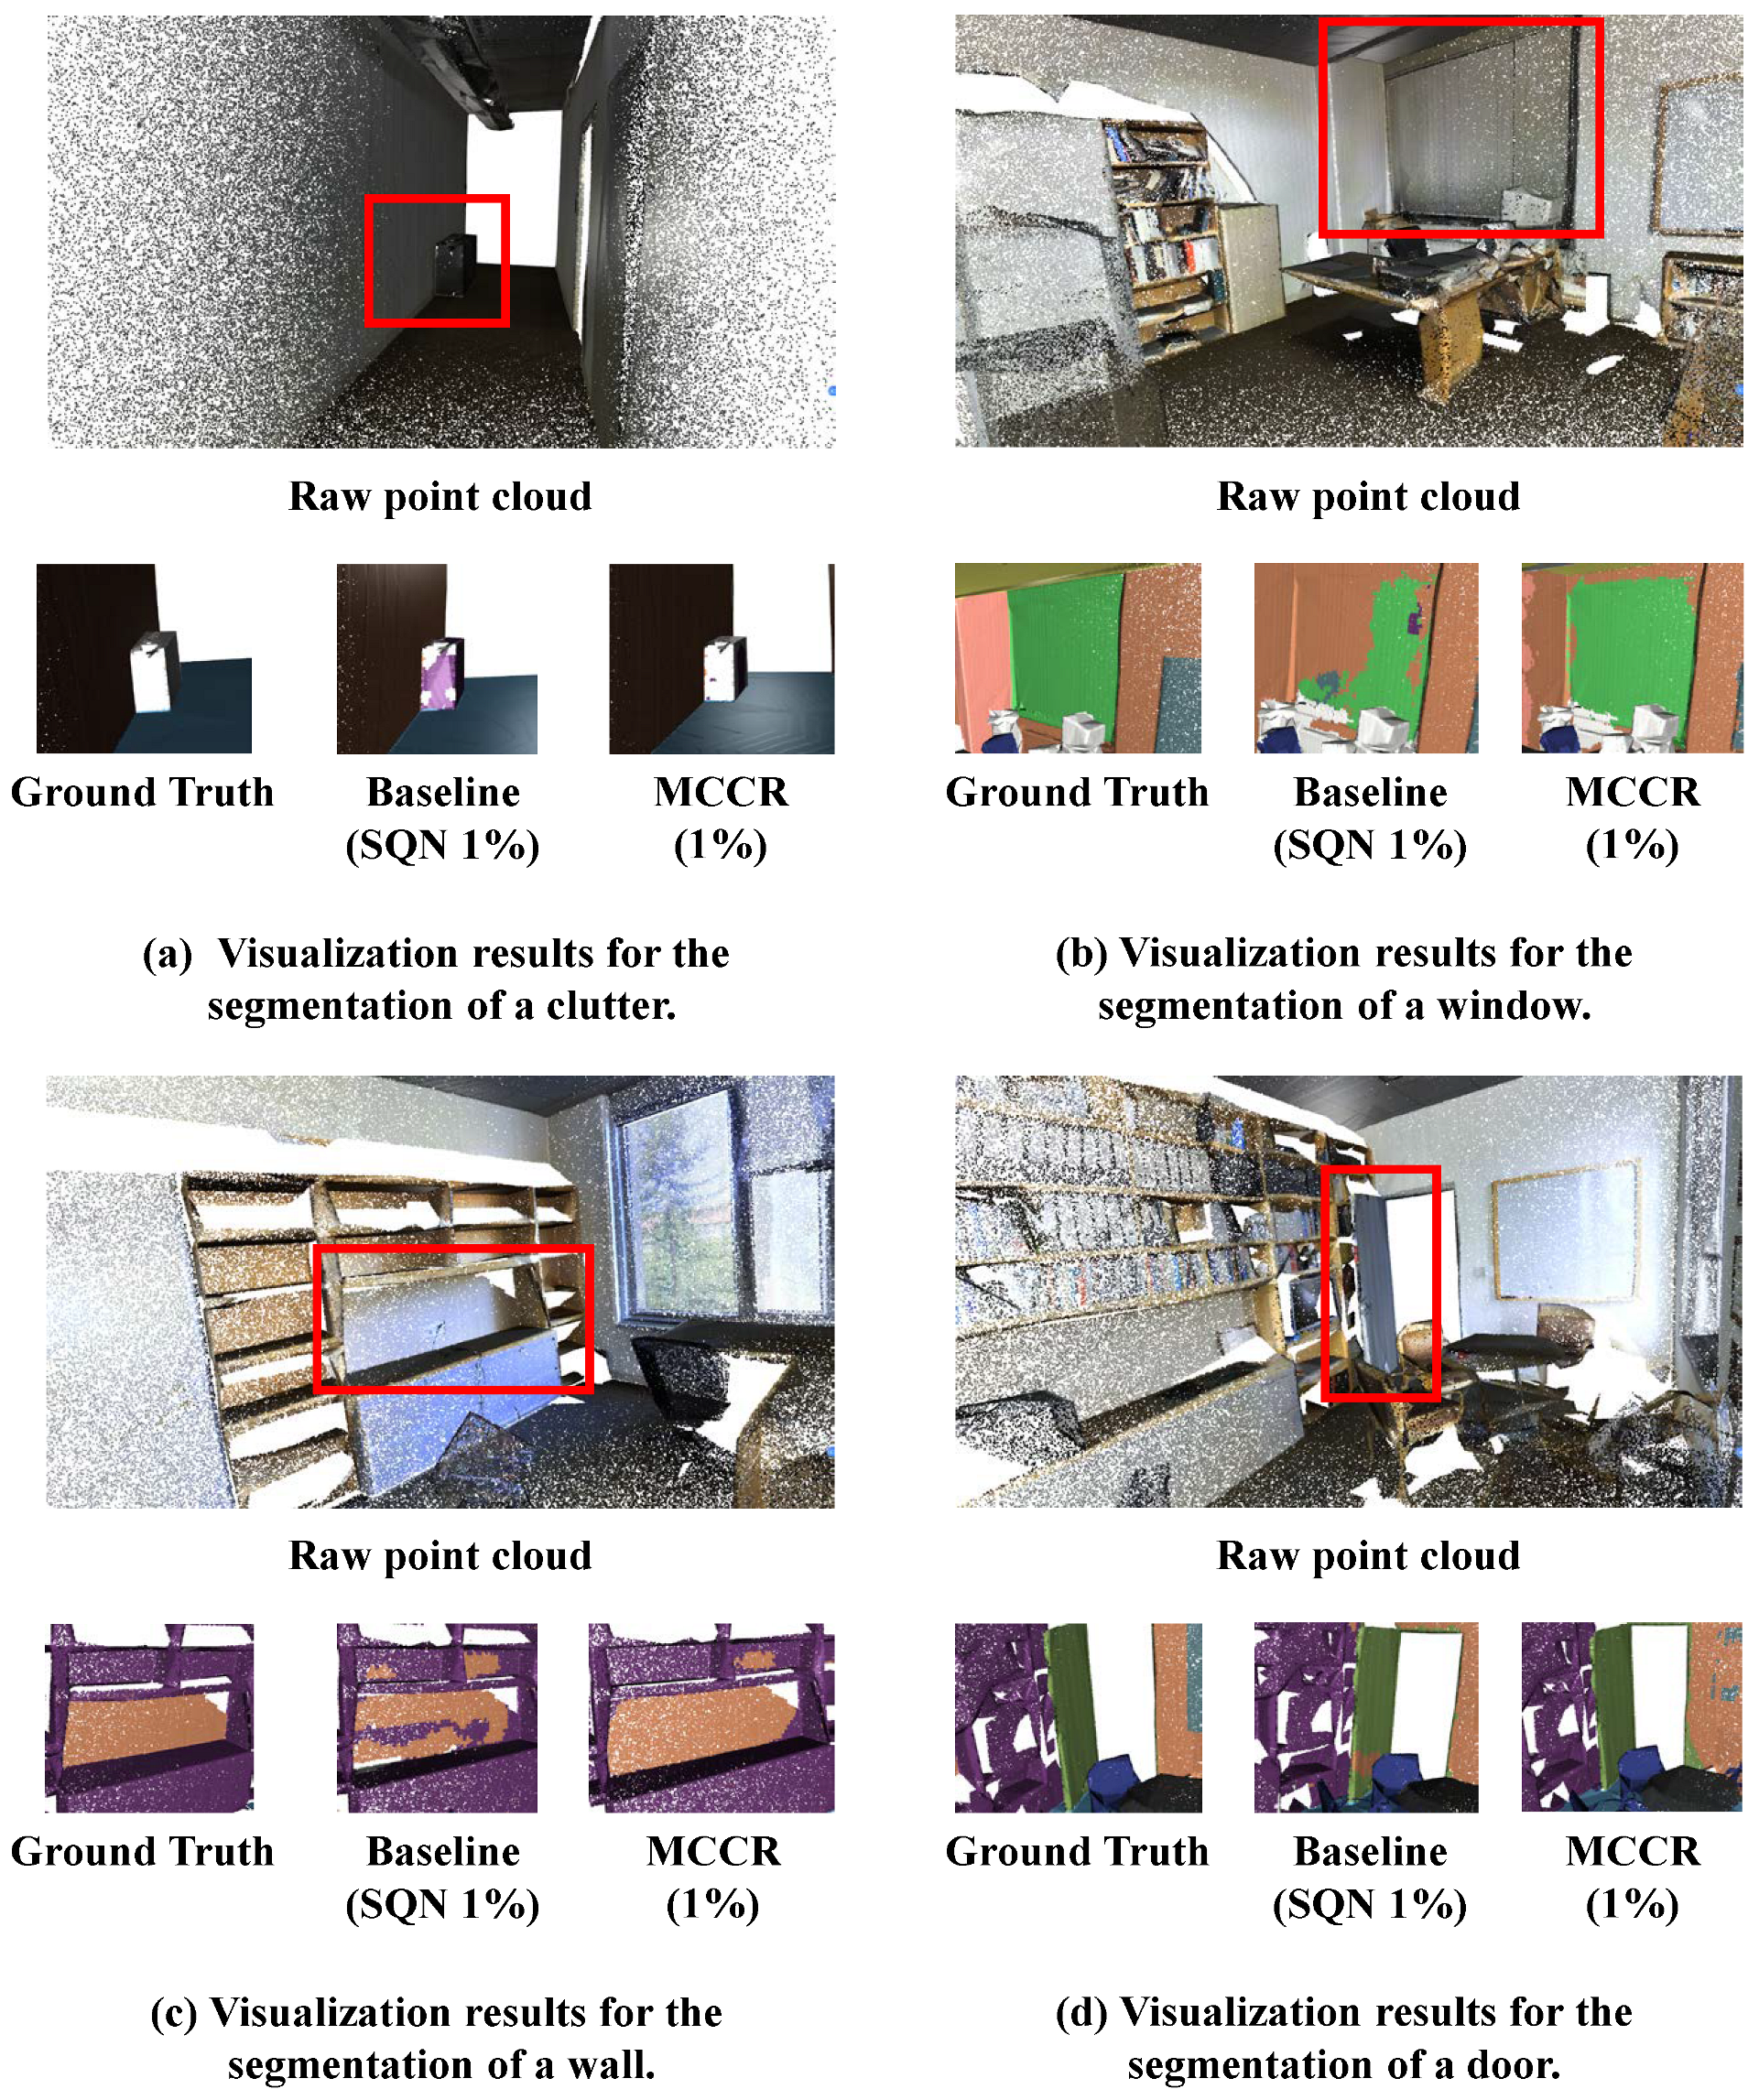
5.1. Visualization Study of the Results on Indoor Dataset

Due to the varying data characteristics across different application scenarios, segmentation strategies in model training may not be perfectly suited for every case. A well-designed network should demonstrate certain levels of generalizability and robustness. Therefore, based on the known optimal performance of MCCR on large-scale remote sensing datasets, we further visualize and discuss the experimental results obtained with 1% labeled data on Area-5 of the S3DIS dataset.
We present the visualization results of our MCCR compared to the baseline method SQN* using the same amount of labeled data in Figure 6. The figure shows that our method outperforms SQN* in several categories. Specifically, (a), (b), (c) and (d) show the visualization results for the segmentation of a clutter, a window, a wall and a door, respectively. Each visualization includes the raw point cloud with segmentation results highlighted in red rectangles, as well as the results for both the baseline method and our approach. It is evident that MCCR achieves superior performance in segmenting larger objects such as windows, walls and doors.
Additionally, we also present the visualization results in Figure 7, where the baseline method SQN* outperforms our MCCR in several categories, using the same amount of labeled data. Specifically, (a), (b), (c) and (d) show the segmentation visualizations for a bookcase, a sofa, some paintings and a chair, respectively. Similar to Figure 6, each visualization in Figure 7 includes the raw point cloud with segmentation results highlighted in red rectangles, along with the results for both the baseline method and our approach. Our MCCR may exhibit limitations in segmenting smaller objects.

5.2. Ablation Study

To comprehensively evaluate the effectiveness of each essential component of MCCR, including the designed trilinear interpolation weights, contrastive regularization and multi-scale classification, we conducted a series of experiments with 0.1% labels for training on Area-5 of S3DIS. The results are shown in Table 5, with Experiment VIII achieving the best performance by incorporating all three components. Note that Experiment I presents the results obtained with the publicly available code of the baseline method SQN, while Experiment VIII shows the test results of our proposed MCCR. The remaining experiments demonstrate the results obtained using individual or combined components.

5.2.1. Effectiveness of the Designed Trilinear Interpolation Weights

We conducted comparative experiments to evaluate the performance of the newly designed trilinear interpolation weights. The experiments included the baseline method SQN (Experiment I), the method with only the new trilinear interpolation weights (Experiment II) and the method incorporating only contrastive regularization and multi-scale classification (Experiment V). From the obtained mIoU results, Experiment II shows an improvement of 0.8% over Experiment I, and Experiment VIII shows an improvement of 1.5% over Experiment V, which indicate that the newly designed strategy outperforms the original strategy and significantly enhances the final segmentation accuracy.

5.2.2. Effectiveness of Contrastive Regularization

The contrastive regularization strategy includes both point-level and local contrastive regularization. Experiment III, which only uses this strategy, shows 1% mIoU improvement compared to the baseline in Experiment I. Experiment VIII, incorporating the full component, improves by 0.7% compared to Experiment VII, which excludes the contrastive regularization module. These results indicate that the point-level contrastive regularization strategy enhances feature learning capabilities, and the local contrastive regularization strategy further leverages nearest-neighbor information to improve model performance.

5.2.3. Effectiveness of Multi-Scale Classification

The multi-scale classification strategy enhances the model’s applicability and accuracy across various scenarios by capturing more comprehensive feature representations, thereby improving segmentation accuracy. To investigate the precise effect of this component in MCCR, we conducted comparative experiments. The results indicate that Experiment IV, which only incorporates the multi-scale classification strategy, achieved a 1.2% increase in mIoU and a 0.7% increase in OA compared to Experiment I. Additionally, Experiment VIII, when compared to Experiment VI (which excludes the multi-scale classification strategy), demonstrates a 3% improvement in mIoU and a 1.1% improvement in OA, validating the ability of multi-scale classification to enhance segmentation accuracy. Furthermore, since Experiment VI’s mIoU is lower than that of Experiment I, but Experiment VIII achieves the highest segmentation accuracy, this confirms that the presence of the other two components can further stimulate the optimization potential of multi-scale classification.
Moreover, the ablation experiments reveal that introducing a single component or combining two components often results in unstable outcomes, manifested as oscillations. However, simultaneously utilizing all three components mitigates this issue, thereby providing a more stable and reliable segmentation performance.

6. Conclusions

In this paper, we propose an end-to-end weakly supervised 3D point cloud semantic segmentation framework for large-scale scenes, which integrates multi-scale classification and contrastive regularization to fully exploit sparse annotation information. The model first augments the input data, and then aggregates features and applies random downsampling to both the original and augmented data. Next, it captures the local features based on the coordinates and multi-scale features of a randomly selected point, and these features are fed into the prediction network to obtain the initial and final predictions. Finally, MCCR iteratively trains the model using strategies such as contrastive learning. Specifically, the model employs multi-scale classification, which enhances the model’s generalization by extracting detailed and wide-ranging structural features. Additionally, contrastive regularization strategies were employed to optimize the network, which include both point-level and local contrastive regularization. Point-level contrastive regularization constrains model training with the information between augmented points and original points, while local contrastive regularization fully explores the local features implied in the weakly supervised labels. Extensive experiments demonstrate that MCCR achieves state-of-the-art performance among weakly supervised methods on both indoor and outdoor large-scale datasets, proving its ability to perform accurate segmentation with only a small amount of labeled data.

Author Contributions

Conceptualization, J.W.; methodology, J.H.; validation, H.T.; formal analysis, Y.L., C.C., M.Z. and H.T.; investigation, J.W. and J.H.; resources, M.Z.; writing—original draft, J.W. and J.H.; writing—review and editing, Y.L., C.C. and H.T.; visualization, J.W.; vupervision, Y.L., C.C., M.Z. and H.T.; project administration, Y.L. and M.Z.; funding acquisition, C.C. All authors have read and agreed to the published version of the manuscript.

Funding

This research received no external funding.

Data Availability Statement

The original data presented in this study are openly available from S3DIS, SemanticKITTI and SensatUrban at http://buildingparser.stanford.edu/ (accessed on 1 December 2022), www.semantic-kitti.org (accessed on 1 June 2023) and http://point-cloud-analysis.cs.ox.ac.uk/ (accessed on 15 June 2023) or [19,20,21].

Conflicts of Interest

The authors declare no conflicts of interest.

Abbreviations

The following abbreviations are used in this manuscript:
MCCRMulti-scale Classification and Contrastive Regularization
MLPsMultilayer perceptrons
SOTAState of the art
BNBatch normalization
LFALocal feature aggregation
RSRandom sampling
DCDecoupling Layer
CECross-entropy

References

  1. Qi, C.R.; Su, H.; Mo, K.; Guibas, L.J. Pointnet: Deep learning on point sets for 3d classification and segmentation. In Proceedings of the IEEE Conference on Computer Vision and Pattern Recognition, Honolulu, HI, USA, 21–26 July 2017; pp. 652–660. [Google Scholar]
  2. Qi, C.R.; Yi, L.; Su, H.; Guibas, L.J. Pointnet++: Deep hierarchical feature learning on point sets in a metric space. Adv. Neural Inf. Process. Syst. 2017, 30, 5105–5114. [Google Scholar]
  3. Hu, Q.; Yang, B.; Xie, L.; Rosa, S.; Guo, Y.; Wang, Z.; Trigoni, N.; Markham, A. Randla-net: Efficient semantic segmentation of large-scale point clouds. In Proceedings of the IEEE/CVF Conference on Computer Vision and Pattern Recognition, Seattle, WA, USA, 13–19 June 2020; pp. 11108–11117. [Google Scholar]
  4. Thomas, H.; Qi, C.R.; Deschaud, J.E.; Marcotegui, B.; Goulette, F.; Guibas, L.J. Kpconv: Flexible and deformable convolution for point clouds. In Proceedings of the IEEE/CVF International Conference on Computer Vision, Seoul, Republic of Korea, 27 October–2 November 2019; pp. 6411–6420. [Google Scholar]
  5. Zhou, B.; Khosla, A.; Lapedriza, A.; Oliva, A.; Torralba, A. Learning deep features for discriminative localization. In Proceedings of the IEEE Conference on Computer Vision and Pattern Recognition, Las Vegas, NV, USA, 27–30 June 2016; pp. 2921–2929. [Google Scholar]
  6. Wang, Y.; Zhang, J.; Kan, M.; Shan, S.; Chen, X. Self-supervised equivariant attention mechanism for weakly supervised semantic segmentation. In Proceedings of the IEEE/CVF Conference on Computer Vision and Pattern Recognition, Seattle, WA, USA, 13–19 June 2020; pp. 12275–12284. [Google Scholar]
  7. Wang, J.; Liu, Y.; Tan, H.; Zhang, M. A survey on weakly supervised 3D point cloud semantic segmentation. IET Comput. Vis. 2024, 18, 329–342. [Google Scholar] [CrossRef]
  8. Wang, H.; Rong, X.; Yang, L.; Wang, S.; Tian, Y. Towards Weakly Supervised Semantic Segmentation in 3D Graph-Structured Point Clouds of Wild Scenes. In Proceedings of the BMVC, Cardiff, UK, 9–12 September 2019; p. 284. [Google Scholar]
  9. Wang, B.H.; Chao, W.L.; Wang, Y.; Hariharan, B.; Weinberger, K.Q.; Campbell, M. LDLS: 3-D object segmentation through label diffusion from 2-D images. IEEE Robot. Autom. Lett. 2019, 4, 2902–2909. [Google Scholar] [CrossRef]
  10. Wang, H.; Rong, X.; Yang, L.; Feng, J.; Xiao, J.; Tian, Y. Weakly supervised semantic segmentation in 3d graph-structured point clouds of wild scenes. arXiv 2020, arXiv:2004.12498. [Google Scholar]
  11. Wei, J.; Lin, G.; Yap, K.H.; Hung, T.Y.; Xie, L. Multi-path region mining for weakly supervised 3D semantic segmentation on point clouds. In Proceedings of the IEEE/CVF Conference on Computer Vision and Pattern Recognition, Seattle, WA, USA, 13–19 June 2020; pp. 4384–4393. [Google Scholar]
  12. Cheng, M.; Hui, L.; Xie, J.; Yang, J. Sspc-net: Semi-supervised semantic 3d point cloud segmentation network. In Proceedings of the AAAI Conference on Artificial Intelligence, Virtual, 9–21 May 2021; Volume 35, pp. 1140–1147. [Google Scholar]
  13. Liu, Z.; Qi, X.; Fu, C.W. One thing one click: A self-training approach for weakly supervised 3d semantic segmentation. In Proceedings of the IEEE/CVF Conference on Computer Vision and Pattern Recognition, Nashville, TN, USA, 20–25 June 2021; pp. 1726–1736. [Google Scholar]
  14. Wang, P.; Yao, W. A new weakly supervised approach for ALS point cloud semantic segmentation. ISPRS J. Photogramm. Remote Sens. 2022, 188, 237–254. [Google Scholar]
  15. Mei, J.; Gao, B.; Xu, D.; Yao, W.; Zhao, X.; Zhao, H. Semantic segmentation of 3d lidar data in dynamic scene using semi-supervised learning. IEEE Trans. Intell. Transp. Syst. 2019, 21, 2496–2509. [Google Scholar] [CrossRef]
  16. Wei, J.; Lin, G.; Yap, K.H.; Liu, F.; Hung, T.Y. Dense supervision propagation for weakly supervised semantic segmentation on 3d point clouds. arXiv 2021, arXiv:2107.11267. [Google Scholar] [CrossRef]
  17. Xu, X.; Lee, G.H. Weakly supervised semantic point cloud segmentation: Towards 10x fewer labels. In Proceedings of the IEEE/CVF Conference on Computer Vision and Pattern Recognition, Seattle, WA, USA, 13–19 June 2020; pp. 13706–13715. [Google Scholar]
  18. Li, M.; Xie, Y.; Shen, Y.; Ke, B.; Qiao, R.; Ren, B.; Lin, S.; Ma, L. Hybridcr: Weakly-supervised 3d point cloud semantic segmentation via hybrid contrastive regularization. In Proceedings of the IEEE/CVF Conference on Computer Vision and Pattern Recognition, New Orleans, LA, USA, 18–24 June 2022; pp. 14930–14939. [Google Scholar]
  19. Behley, J.; Garbade, M.; Milioto, A.; Quenzel, J.; Behnke, S.; Stachniss, C.; Gall, J. Semantickitti: A dataset for semantic scene understanding of lidar sequences. In Proceedings of the IEEE/CVF International Conference on Computer Vision, Seoul, Republic of Korea, 27 October–2 November 2019; pp. 9297–9307. [Google Scholar]
  20. Hu, Q.; Yang, B.; Khalid, S.; Xiao, W.; Trigoni, N.; Markham, A. Sensaturban: Learning semantics from urban-scale photogrammetric point clouds. Int. J. Comput. Vis. 2022, 130, 316–343. [Google Scholar] [CrossRef]
  21. Armeni, I.; Sener, O.; Zamir, A.R.; Jiang, H.; Brilakis, I.; Fischer, M.; Savarese, S. 3d semantic parsing of large-scale indoor spaces. In Proceedings of the IEEE Conference on Computer Vision and Pattern Recognition, Las Vegas, NV, USA, 27–30 June 2016; pp. 1534–1543. [Google Scholar]
  22. Kundu, A.; Yin, X.; Fathi, A.; Ross, D.; Brewington, B.; Funkhouser, T.; Pantofaru, C. Virtual multi-view fusion for 3d semantic segmentation. In Proceedings of the Computer Vision–ECCV 2020: 16th European Conference, Glasgow, UK, 23–28 August 2020; Proceedings, Part XXIV 16. Springer: Berlin/Heidelberg, Germany, 2020; pp. 518–535. [Google Scholar]
  23. Dai, A.; Nießner, M. 3dmv: Joint 3d-multi-view prediction for 3d semantic scene segmentation. In Proceedings of the European Conference on Computer Vision (ECCV), Munich, Germany, 8–14 September 2018; pp. 452–468. [Google Scholar]
  24. Choy, C.; Gwak, J.; Savarese, S. 4d spatio-temporal convnets: Minkowski convolutional neural networks. In Proceedings of the IEEE/CVF Conference on Computer Vision and Pattern Recognition, Long Beach, CA, USA, 15–20 June 2019; pp. 3075–3084. [Google Scholar]
  25. Graham, B.; Engelcke, M.; Van Der Maaten, L. 3d semantic segmentation with submanifold sparse convolutional networks. In Proceedings of the IEEE Conference on Computer Vision and Pattern Recognition, Salt Lake City, UT, USA, 18–23 June 2018; pp. 9224–9232. [Google Scholar]
  26. Jiang, M.; Wu, Y.; Zhao, T.; Zhao, Z.; Lu, C. Pointsift: A sift-like network module for 3d point cloud semantic segmentation. arXiv 2018, arXiv:1807.00652. [Google Scholar]
  27. Chen, L.Z.; Li, X.Y.; Fan, D.P.; Wang, K.; Lu, S.P.; Cheng, M.M. LSANet: Feature learning on point sets by local spatial aware layer. arXiv 2019, arXiv:1905.05442. [Google Scholar]
  28. Phan, A.V.; Le Nguyen, M.; Nguyen, Y.L.H.; Bui, L.T. Dgcnn: A convolutional neural network over large-scale labeled graphs. Neural Netw. 2018, 108, 533–543. [Google Scholar] [CrossRef] [PubMed]
  29. Li, Y.; Bu, R.; Sun, M.; Wu, W.; Di, X.; Chen, B. Pointcnn: Convolution on x-transformed points. Adv. Neural Inf. Process. Syst. 2018, 31, 828–838. [Google Scholar]
  30. Wu, W.; Qi, Z.; Fuxin, L. Pointconv: Deep convolutional networks on 3d point clouds. In Proceedings of the IEEE/CVF Conference on Computer Vision and Pattern Recognition, Long Beach, CA, USA, 15–20 June 2019; pp. 9621–9630. [Google Scholar]
  31. Lai, X.; Liu, J.; Jiang, L.; Wang, L.; Zhao, H.; Liu, S.; Qi, X.; Jia, J. Stratified transformer for 3d point cloud segmentation. In Proceedings of the IEEE/CVF Conference on Computer Vision and Pattern Recognition, New Orleans, LA, USA, 18–24 June 2022; pp. 8500–8509. [Google Scholar]
  32. Landrieu, L.; Simonovsky, M. Large-scale point cloud semantic segmentation with superpoint graphs. In Proceedings of the IEEE Conference on Computer Vision and Pattern Recognition, Salt Lake City, UT, USA, 18–23 June 2018; pp. 4558–4567. [Google Scholar]
  33. Ma, Y.; Guo, Y.; Liu, H.; Lei, Y.; Wen, G. Global context reasoning for semantic segmentation of 3D point clouds. In Proceedings of the IEEE/CVF Winter Conference on Applications of Computer Vision, Snowmass Village, CO, USA, 1–5 March 2020; pp. 2931–2940. [Google Scholar]
  34. Zhiheng, K.; Ning, L. PyramNet: Point cloud pyramid attention network and graph embedding module for classification and segmentation. arXiv 2019, arXiv:1906.03299. [Google Scholar]
  35. Tao, A.; Duan, Y.; Wei, Y.; Lu, J.; Zhou, J. Seggroup: Seg-level supervision for 3d instance and semantic segmentation. IEEE Trans. Image Process. 2022, 31, 4952–4965. [Google Scholar] [CrossRef] [PubMed]
  36. He, K.; Gkioxari, G.; Dollár, P.; Girshick, R. Mask r-cnn. In Proceedings of the IEEE International Conference on Computer Vision, Venice, Italy, 22–29 October 2017; pp. 2961–2969. [Google Scholar]
  37. Zhang, Y.; Li, Z.; Xie, Y.; Qu, Y.; Li, C.; Mei, T. Weakly supervised semantic segmentation for large-scale point cloud. In Proceedings of the AAAI Conference on Artificial Intelligence, Virtual, 2–9 February 2021; Volume 35, pp. 3421–3429. [Google Scholar]
  38. Shi, H.; Wei, J.; Li, R.; Liu, F.; Lin, G. Weakly supervised segmentation on outdoor 4D point clouds with temporal matching and spatial graph propagation. In Proceedings of the IEEE/CVF Conference on Computer Vision and Pattern Recognition, New Orleans, LA, USA, 18–24 June 2022; pp. 11840–11849. [Google Scholar]
  39. Liu, G.; van Kaick, O.; Huang, H.; Hu, R. Active self-training for weakly supervised 3D scene semantic segmentation. Comput. Vis. Media 2024, 10, 425–438. [Google Scholar] [CrossRef]
  40. Li, R.; Cao, A.Q.; de Charette, R. COARSE3D: Class-Prototypes for Contrastive Learning in Weakly-Supervised 3D Point Cloud Segmentation. arXiv 2022, arXiv:2210.01784. [Google Scholar]
  41. Wu, Z.; Wu, Y.; Lin, G.; Cai, J. Reliability-Adaptive Consistency Regularization for Weakly-Supervised Point Cloud Segmentation. Int. J. Comput. Vis. 2024, 132, 2276–2289. [Google Scholar] [CrossRef]
  42. Zhang, Y.; Qu, Y.; Xie, Y.; Li, Z.; Zheng, S.; Li, C. Perturbed self-distillation: Weakly supervised large-scale point cloud semantic segmentation. In Proceedings of the IEEE/CVF International Conference on Computer Vision, Montreal, BC, Canada, 11–17 October 2021; pp. 15520–15528. [Google Scholar]
  43. Hu, Q.; Yang, B.; Fang, G.; Guo, Y.; Leonardis, A.; Trigoni, N.; Markham, A. Sqn: Weakly-supervised semantic segmentation of large-scale 3d point clouds. In Proceedings of the Computer Vision–ECCV 2022: 17th European Conference, Tel Aviv, Israel, 23–27 October 2022; Proceedings, Part XXVII. Springer: Berlin/Heidelberg, Germany, 2022; pp. 600–619. [Google Scholar]
  44. Yang, C.K.; Wu, J.J.; Chen, K.S.; Chuang, Y.Y.; Lin, Y.Y. An mil-derived transformer for weakly supervised point cloud segmentation. In Proceedings of the IEEE/CVF Conference on Computer Vision and Pattern Recognition, New Orleans, LA, USA, 18–24 June 2022; pp. 11830–11839. [Google Scholar]
  45. Han, X.F.; Cheng, H.; Jiang, H.; He, D.; Xiao, G. Pcb-randnet: Rethinking random sampling for lidar semantic segmentation in autonomous driving scene. In Proceedings of the 2024 IEEE International Conference on Robotics and Automation (ICRA), Yokohama, Japan, 13–17 May 2024; IEEE: Piscataway, NJ, USA, 2024; pp. 4435–4441. [Google Scholar]
  46. Lee, M.S.; Yang, S.W.; Han, S.W. Gaia: Graphical information gain based attention network for weakly supervised point cloud semantic segmentation. In Proceedings of the IEEE/CVF Winter Conference on Applications of Computer Vision, Waikoloa, HI, USA, 2–7 January 2023; pp. 582–591. [Google Scholar]
  47. Su, Y.; Xu, X.; Jia, K. Weakly supervised 3d point cloud segmentation via multi-prototype learning. IEEE Trans. Circuits Syst. Video Technol. 2023, 33, 7723–7736. [Google Scholar] [CrossRef]
  48. Chen, Y.; Liu, J.; Ni, B.; Wang, H.; Yang, J.; Liu, N.; Li, T.; Tian, Q. Shape self-correction for unsupervised point cloud understanding. In Proceedings of the IEEE/CVF International Conference on Computer Vision, Montreal, BC, Canada, 11–17 October 2021; pp. 8382–8391. [Google Scholar]
  49. Cho, J.H.; Mall, U.; Bala, K.; Hariharan, B. Picie: Unsupervised semantic segmentation using invariance and equivariance in clustering. In Proceedings of the IEEE/CVF Conference on Computer Vision and Pattern Recognition, Nashville, TN, USA, 20–25 June 2021; pp. 16794–16804. [Google Scholar]
  50. Hoang, C.M.; Kang, B. Pixel-level clustering network for unsupervised image segmentation. Eng. Appl. Artif. Intell. 2024, 127, 107327. [Google Scholar] [CrossRef]
  51. Niu, D.; Wang, X.; Han, X.; Lian, L.; Herzig, R.; Darrell, T. Unsupervised universal image segmentation. In Proceedings of the IEEE/CVF Conference on Computer Vision and Pattern Recognition, Seattle, WA, USA, 17–21 June 2024; pp. 22744–22754. [Google Scholar]
  52. Chen, Z.; Xu, H.; Chen, W.; Zhou, Z.; Xiao, H.; Sun, B.; Xie, X.; Kang, W. PointDC: Unsupervised Semantic Segmentation of 3D Point Clouds via Cross-modal Distillation and Super-Voxel Clustering. In Proceedings of the IEEE/CVF International Conference on Computer Vision, Paris, France, 2–3 October 2023; pp. 14290–14299. [Google Scholar]
  53. Bian, Y.; Xie, J.; Qian, J. Unsupervised domain adaptive point cloud semantic segmentation. In Proceedings of the Asian Conference on Pattern Recognition, Jeju Island, Republic of Korea, 9–12 November 2021; Springer: Berlin/Heidelberg, Germany, 2021; pp. 285–298. [Google Scholar]
  54. Zhang, Z.; Yang, B.; Wang, B.; Li, B. Growsp: Unsupervised semantic segmentation of 3d point clouds. In Proceedings of the IEEE/CVF Conference on Computer Vision and Pattern Recognition, Paris, France, 2–3 October 2023; pp. 17619–17629. [Google Scholar]
  55. Xie, S.; Gu, J.; Guo, D.; Qi, C.R.; Guibas, L.; Litany, O. Pointcontrast: Unsupervised pre-training for 3d point cloud understanding. In Proceedings of the Computer Vision–ECCV 2020: 16th European Conference, Glasgow, UK, 23–28 August 2020; Proceedings, Part III 16. Springer: Berlin/Heidelberg, Germany, 2020; pp. 574–591. [Google Scholar]
  56. Hou, J.; Graham, B.; Nießner, M.; Xie, S. Exploring data-efficient 3d scene understanding with contrastive scene contexts. In Proceedings of the IEEE/CVF Conference on Computer Vision and Pattern Recognition, Nashville, TN, USA, 20–25 June 2021; pp. 15587–15597. [Google Scholar]
  57. Luo, H.; Jiang, W.; Gu, Y.; Liu, F.; Liao, X.; Lai, S.; Gu, J. A strong baseline and batch normalization neck for deep person re-identification. IEEE Trans. Multimed. 2019, 22, 2597–2609. [Google Scholar] [CrossRef]
Figure 1. Multi-scale classification. The point cloud is processed to obtain multi-scale features, which are extracted and analyzed at different scales, and then fed into classifiers. The results are fused to produce the final prediction.
Remotesensing 16 03319 g001
Figure 2. The architecture of MCCR. The original point clouds are first processed through random mirroring, rotation and jittering to generate augmented point clouds. Then, both the original and augmented points are subjected to Local Feature Aggregation and Random Sampling modules to obtain multi-scale features. By randomly selecting a point, its local features are captured at different scales and interpolated accordingly. The interpolated local features are, on the one hand, used for multi-scale classification, and on the other hand, they are fused and fed into a series of MLPs to obtain initial prediction results. These initial predictions are then utilized for local and point-level contrastive regularization, and combined with the multi-scale classification outcomes to derive the final predictions. Note that the red dot represents the input point, while the yellow and reddish-brown dots represent the predictions based on the original data and augmented data, respectively.
Remotesensing 16 03319 g002
Figure 3. Visualization results on the validation set (Sequence 08) of SemanticKITTI. Red circles highlight where we outperform SQN*.
Remotesensing 16 03319 g003
Figure 4. Visualization results on the validation set of SensatUrban. Raw point cloud, ground truth, our results and the baseline are presented separately, from left to right, and we use black circles to highlight where we outperform SQN*.
Remotesensing 16 03319 g004
Figure 5. Visualization results on the test set of S3DIS Area-5. Red circles highlight where we outperform SQN*.
Remotesensing 16 03319 g005
Figure 6. Visualization results on the test set of S3DIS Area-5. Each one includes raw point cloud with segmentation results displayed in the red rectangle for the ground truth, baseline results and ours, respectively. With 1% labeled points, the segmentation results of the baseline method deviate from the ground truth, but our proposed MCCR is able to obtain results consistent with the ground truth.
Remotesensing 16 03319 g006
Figure 7. Visualization results on the test set of S3DIS Area-5. Each one includes the raw point cloud with segmentation results displayed in the red rectangle for the ground truth, baseline results and ours, respectively. With 1% labeled points, the segmentation results of our proposed MCCR deviate from the ground truth, but the baseline method is able to obtain results consistent with the ground truth.
Remotesensing 16 03319 g007
Table 1. Quantitative results of different approaches on SemanticKITTI.
MethodmIoU (%)
Full supervisionPointNet [1]14.6
PointNet++ [2]20.1
SPG [32]17.4
KPConv [4]58.1
RandLA-Net [3]53.9
1%HybridCR [18]52.3
0.1%SQN*51.5
SQN [43]50.8
MCCR (Ours)52.9
“*” denotes the results of the method trained by us using the official code.
Table 2. Quantitative results of different approaches on SensatUrban.
MethodOA (%)mIoU (%)
Full supervisionPointNet [1]80.823.7
PointNet++ [2]84.332.9
SPGraph [32]85.337.3
SparseConv [25]88.742.7
KPConv [4]93.257.6
RandLA-Net [3]89.852.7
0.1%SQN*91.355.0
SQN [43]91.054.0
MCCR (Ours)92.859.6
“*” denotes the results of the method trained by us using the official code.
Table 3. Quantitative results of different methods on Area-5 of S3DIS.
MethodmIoU (%)CeilingFloorWallBeamColumnWindowDoorTableChairSofaBookcaseBoardClutter
Full supervisionPointNet [1]41.188.897.369.80.13.946.310.858.952.65.940.326.433.2
SPG [32]54.791.597.975.90.014.351.352.377.486.440.465.57.250.7
KPConv [4]67.192.897.382.40.023.958.069.091.081.575.375.466.758.9
RandLA-Net [3]63.092.496.780.60.018.361.343.377.285.271.571.069.252.3
10%Xu and Lee [17]48.090.997.374.80.08.449.327.371.769.053.216.523.342.8
1%Zhang et al. [37]61.891.596.980.60.018.258.147.275.885.765.268.965.050.2
PSD [42]63.592.397.780.70.027.856.262.578.784.163.170.458.953.2
SQN* [43]64.993.597.282.20.024.156.767.078.087.569.170.763.354.5
MCCR (Ours)65.793.297.783.50.030.460.272.779.886.657.473.863.356.2
0.2%Xu and Lee [17]44.590.197.171.90.01.947.229.364.062.942.215.918.937.5
0.1%SQN*59.4790.3696.7178.750.0012.0954.9264.1470.7881.7250.3968.5355.8048.93
SQN [43]61.491.795.678.70.024.255.963.170.583.160.767.856.150.6
MCCR (Ours)61.4792.3396.6479.940.0024.2655.1761.5171.9684.7657.4969.4353.9651.67
“*” denotes the results of the method trained by us using the official code.
Table 4. Quantitative results on S3DIS six-fold cross-validation.
MethodOA (%)mIoU (%)
Full supervisionPointNet [1]78.647.6
SPG [32]82.954.1
PointCNN [29]88.165.4
DGCNN [28]\56.1
KPConv [4]\70.6
RandLA-Net [3]88.070.0
1%Zhang et al. [37]\65.9
PSD [42]\68.0
SQN* [43]87.467.3
MCCR (Ours)87.967.7
0.1%SQN*83.860.1
SQN [43]85.363.7
MCCR (Ours)85.462.5
“*” denotes the results of the method trained by us using the official code.
Table 5. Ablation results of different components on Area-5 of S3DIS.
Base.NewWeights.Contrast.Multi.OA (%)mIoU (%)
I 86.059.5
II 86.560.3
III 86.260.5
IV 86.760.7
V 86.860.0
VI 85.858.5
VII 87.059.8
VIII86.961.5
Disclaimer/Publisher’s Note: The statements, opinions and data contained in all publications are solely those of the individual author(s) and contributor(s) and not of MDPI and/or the editor(s). MDPI and/or the editor(s) disclaim responsibility for any injury to people or property resulting from any ideas, methods, instructions or products referred to in the content.

