Article

Coarse-to-Fine Structure and Semantic Learning for Single-Sample SAR Image Generation

1
Xi’an Electronic Engineering Research Institute, China North Industries Group Corporation Limited, Xi’an 710100, China
2
College of Electronic Science and Technology, National University of Defense Technology, Changsha 410073, China
3
Key Laboratory of Remote Sensing and Digital Earth, Chinese Academy of Sciences Aerospace Information Research Institute, Beijing 100094, China
*
Author to whom correspondence should be addressed.
Remote Sens. 2024, 16(17), 3326; https://doi.org/10.3390/rs16173326 (registering DOI)
Submission received: 14 July 2024 / Revised: 27 August 2024 / Accepted: 2 September 2024 / Published: 8 September 2024

Abstract

:
Synthetic Aperture Radar (SAR) enables the acquisition of high-resolution imagery even under severe meteorological and illumination conditions. Its utility is evident across a spectrum of applications, particularly in automatic target recognition (ATR). Since SAR samples are often scarce in practical ATR applications, there is an urgent need to develop sample-efficient augmentation techniques to augment the SAR images. However, most of the existing generative approaches require an excessive amount of training samples for effective modeling of the SAR imaging characteristics. Additionally, they show limitations in augmenting the interesting target samples while maintaining image recognizability. In this study, we introduce an innovative single-sample image generation approach tailored to SAR data augmentation. To closely approximate the target distribution across both the spatial layout and local texture, a multi-level Generative Adversarial Network (GAN) architecture is constructed. It comprises three distinct GANs that independently model the structural, semantic, and texture patterns. Furthermore, we introduce multiple constraints including prior-regularized noise sampling and perceptual loss optimization to enhance the fidelity and stability of the generation process. Comparative evaluations against the state-of-the-art generative methods demonstrate the superior performance of the proposed method in terms of generation diversity, recognizability, and stability. In particular, its advantages over the baseline method are up to 0.2 and 0.22 in the SIFID and SSIM, respectively. It also exhibits stronger robustness in the generation of images across varying spatial sizes.

1. Introduction

Synthetic Aperture Radar (SAR) is type of active imaging system that emits microwaves and records the reflected signals to observe the Earth’s surface. It has the ability to acquire multi-dimensional surface information under severe weather and illumination conditions, as well as to penetrate various surfaces including vegetation, soils, and water bodies [1]. Additionally, SAR offers versatile data acquisition with multiple polarizations, frequency bands, and view angles [2]. Due to its effectiveness in gathering rich and reliable information over large areas, SAR finds extensive applications in military reconnaissance, emergency response, topographic mapping, and Earth system monitoring, thus playing a crucial role in modern radar technology [3,4].
Despite continuous advancements in SAR image quality and resolution, progress in leveraging SAR for automatic target recognition (ATR), especially concerning non-time-sensitive targets, remains relatively slow [5]. Due to the resource-intensive nature of SAR data acquisition, it demands significant time and effort, and may be limited by non-cooperative targets. In recent years, AI-driven target recognition using deep learning (DL) technologies has achieved notable success across various fields including object detection, video object tracking, and image recognition [6,7]. In contrast to the traditional methods, neural networks learn the image features in an end-to-end manner, thereby ensuring higher accuracy and a faster response [8,9,10,11].
However, DL-based approaches for SAR image target recognition face challenges in data limitations. Training neural networks typically requires substantial data volumes, underscoring the criticality of data as the “crude oil” of DL technology. While SAR datasets such as MSTAR, SSDD, HRSID, and LS-SSDD provide some valuable samples, the acquisition of SAR images remains resource-intensive and is frequently restricted by anti-reconnaissance protocols imposed on non-cooperative targets. Consequently, there is a critical need for innovative approaches to augment SAR datasets to effectively address these challenges.
Recent research has shown a growing interest in utilizing deep generative models, notably Generative Adversarial Networks (GANs) and diffusion models, for SAR image synthesis. These approaches exhibit great potential in synthesizing realistic SAR imaging characteristics. In [12], a GAN was trained in the incorporation of constraints that emphasize the structural similarity and gradient penalty, thereby augmenting the samples for ATR in SAR images. In [13], the generation of SAR samples was conditioned with the edges extracted from the optical images. Through the computation of the dominant scattering edges of the targets (vehicles), the geometric imaging characteristics in SAR images were synthesized. In [14], a semantic-layout-guided SAR image synthesis approach was introduced. The layout maps were synthesized to diversify the generation of the object samples. Du et al. improved the target completeness of the generated images by incorporating perceptual loss constraints, yielding images with enhanced realism in the scattering characteristics [15]. This approach enhanced the authenticity of the generated images and successfully deceived several SAR–ATR models. These developments significantly alleviated the data scarcity in ATR and improved the effectiveness of the DL-based ATR with SAR.
However, most of the literature research on SAR image data augmentation with deep generative models demands a large volume of images for training. These methods demonstrate the limitations of practical applications in relation to the scarcity of samples and when dealing with large-size images. Moreover, generative models tend to produce results that are difficult to interpret when dealing with large-sized images. The reason is that these models are typically trained based on data distribution without focusing on the specific content of the images. As a result, they may overlook the structure and details of the images during generation. This disregard for content limits the development of generative techniques, as the capabilities of generative models are constrained by both data distribution and content constraints.
In this study, we focus on improving both the structural and semantic consistency in SAR image generation, and present a comprehensive algorithm that integrates multiple innovative designs. The major contributions can be summarized as follows:
(1)
The proposal of a multi-level hierarchical architecture for SAR image generation. It comprises three distinct GANs that independently model the structural, semantic, and texture patterns, thereby facilitating the generation of highly realistic images with enhanced details.
(2)
By integrating a series of prior constraints, learning to generate SAR imagery with a single sample is achieved. Several advanced regularization techniques are employed, including prior-regularized noise sampling, perceptual loss optimization, and the self-attention mechanisms. This enables extensive exploitation of the intrinsic distribution patterns inherent to the sample images. The resultant approach ensures stability and robustness in the image generation process.
(3)
The achievement of state-of-the-art (SOTA) method performance in single-sample SAR image generation. Through comprehensive experimental comparisons, the proposed method demonstrates significant improvements in a variety of evaluation metrics, including SIFID, SSIM, diversity, and perceptual quality. Human assessment is also introduced to rigorously assess the authenticity of the generated samples. The results indicate that the proposed technique is capable of synthesizing high-quality and realistic samples with plausible semantic diversity.

2. Related Work

In the task of SAR image generation, deep generative models exhibit unparalleled advantages in comparison to conventional data augmentation techniques. Deep generative models do not require explicit feature extraction; they achieve target generation by implicitly learning and fitting the probability distribution of the target image. Common deep generative models include Restricted Boltzmann Machines (RBM) [16], Variational Autoencoders (VAE) [17], Generative Adversarial Networks (GANs) [18], and Diffusion Models.

2.1. Generative Models

Generative Adversarial Networks (GANs) are a class of deep neural networks that learn representations without extensively labeled training data. During training, two neural networks are alternately trained: a generator, G, that captures the data distribution, and a discriminator, D, that discerns the authenticity of images, eventually reaching a Nash equilibrium in a maximin game. GANs exhibit strong capabilities in fitting real data distributions and have widespread applications in data augmentation [19], image generation [20], and image interpretation [21]. In the field of SAR image analysis, numerous derivative methods [22,23,24] of GANs have been developed, demonstrating significant efficacy. Typical GANs consist of a generator, G, and a discriminator, D, that are designed to converge on a Nash equilibrium during training. However, the training process is frequently impeded by challenges such as a model collapse or a failure to achieve convergence.
Another type of image generation method is VAEs. They are derived from auto-encoder networks, but have fundamental differences from them as they are deeply integrated into the Bayesian networks. An important characteristic of the VAE is that its operation in mapping inputs is not to a deterministic vector, but is instead to a probabilistic distribution. This enables VAE to not only perform data reconstruction but also to generate new data that conforms to a similar distribution. Despite all of these advantages, VAEs can inadvertently introduce image distortion into the encoding process of image generation tasks.
Diffusion models are a type of generative model capable of generating target-domain data samples from stochastic noise (i.e., sampling from a simple distribution) [25]. They define a Markov chain of diffusion steps that gradually and incrementally introduce noise to the data and then learn to reverse this process to ‘denoise’ the complex target-domain samples from the introduced perturbations. However, diffusion models tend to produce excessively random outputs, where the resulting images are often uninterpretable and devoid of meaningful constraints.
Figure 1 presents an overview of the different generative methods, where x represents the input image, z is a latent code added with random noise, and θ and ϕ are trainable parameters in the VAE. In summary, despite the recent advances in generative models, their efficacy in SAR generation remains constrained especially in sample-limited scenarios. There are still critical challenges to improving the instability of training generative models and ensuring the structural coherence and interpretability of the generated images, which requires further study.

2.2. Single-Sample Image Generation

Since the emergence of ZSSR [26] and DIP [27], deep internal learning-based methods have gained great research interest. Different from conventional DL-based methods that depend on extensive training with external data, these approaches learn the intrinsic pattern in a single test-time sample and estimate its underlying distribution. The InGAN model [28] is a pioneering method of internal learning that employs deep generative architecture. It utilizes predefined geometric transformation input to generate different images. The SinGAN model [29] is the first unconditional generative model consisting of a fully convolutional GAN pyramid that learns the internal patch distribution of an image. The SinGAN adopts a cascading training strategy [29]: the bottom generator synthesizes layouts, while the later generators learn residual details and expand the layouts. During the training of higher-level generators, all the lower-level generators remain fixed. Some of the literature works have modified the SinGAN model from different perspectives. The ConSinGAN model [30] adopts the training strategy in [31] to improve the generation quality of the SinGAN model, reducing the model stages, and thus achieving faster training. The HP-VAEGAN model [32] introduces a patch-based VAE [33] for a more diverse generation. The MOGAN model [34] follows SinGAN’s multi-stage architecture and incorporates more residual networks. The EXSinGAN model [35] incorporates modularized GANs into the model, increasing both the interpretability and generation quality.

2.3. Augmentation of SAR Data with Deep Generative Models

Guo et al. [36] first introduced GAN to augment the MSTAR dataset, supplementing the SAR target samples at various azimuth angles. Due to distinctive imaging mechanisms inherent to SAR systems, SAR images typically contain significant speckle noise and substantial clutter interference. A standard GAN is susceptible to model collapse, resulting in the production of randomly scattered noise. Gao et al. [37] studied the impact of different labeling rates on SAR target recognition networks based on DCGAN, proposing a method for semi-supervised or unsupervised learning. Kim et al. [38] expanded the MSTAR dataset based on the WGAN-GP and constructed a sample selection mechanism using an SVM classifier, as well as proposed a deep model to generate reliable SAR images. Wang et al. [39] investigated augmenting the MSTAR dataset using three methods: DCGAN, WGAN, and WGAN-GP. Then, they conducted comparative experiments to examine the results. Zhang et al. [40] employed pix2pix [41] to expand the SSG ship dataset. This dataset consisted of 2000 SAR images from partial SSDD data, partial Sentinel-1 data, and GF-3 data. They adopted information entropy, equivalent views, an average gradient, and a target aspect ratio to assess the quality of the generated images. The experiments conducted using the SSD detection algorithm demonstrated improved accuracy. Li et al. [42] proposed an unconditional GAN to learn the internal image distribution from a single sample, and trained it in the SSDD dataset. After annotating the generated data, they incorporated it into two object detection algorithms: SSD and Tiny-YOLO. The experimental results demonstrated significant improvements in detection accuracy. Nevertheless, the generation capacity of this method is limited to one sample after each training, as such diversity is limited. GAN models have been extensively utilized on the MSTAR dataset, demonstrating notable efficacy in synthesizing ship data [43]. These advancements indicate the significant efficacy of GANs in generating SAR images.

3. Proposed One-Shot SAR Image Generation GAN

3.1. Motivation and Overall Framwork

GANs have demonstrated significant effectiveness in data-intensive applications. Nevertheless, their performance greatly degrades when dealing with small sets of data. To achieve image generation with very scarce training samples, we propose a sophisticated approach that thoroughly incorporates noise sampling techniques, perceptual loss functions, attention mechanisms and, crucially, a hierarchical coarse-to-fine refining strategy.
The specific designs addressing the data-scarcity limitations are three-fold. First, we regularized the generation of initial noise in the GAN with prior information extracted from the authentic sample image. This reduces deviations from the target distribution. Second, we proposed a progressive generation architecture to synthesize reasonable and realistic SAR image patterns. The generation was divided into three levels in a coarse-to-fine manner, with each level supervised by the specific training objectives. Third, we further regularized the generation of SAR patterns, combining the attention mechanism and the perceptual loss. This reduces incompleteness and vagueness in the generation results.
To conclude, we introduced multiple training objectives, and strictly regularized the initial distribution and texture features, as well as the structural and semantic characteristics in the generation. These strategies and techniques reduced the searching space of the deep models, thus avoiding sample-intensive training when trying to learn the common patterns in massive images. The proposed approach learns structural and semantic information from internal patches and external priors of the image using three modularized GANs. As the hierarchy increases, the texture information is enhanced. This ensures a comprehensive image analysis, improving the reliability and effectiveness of the system.

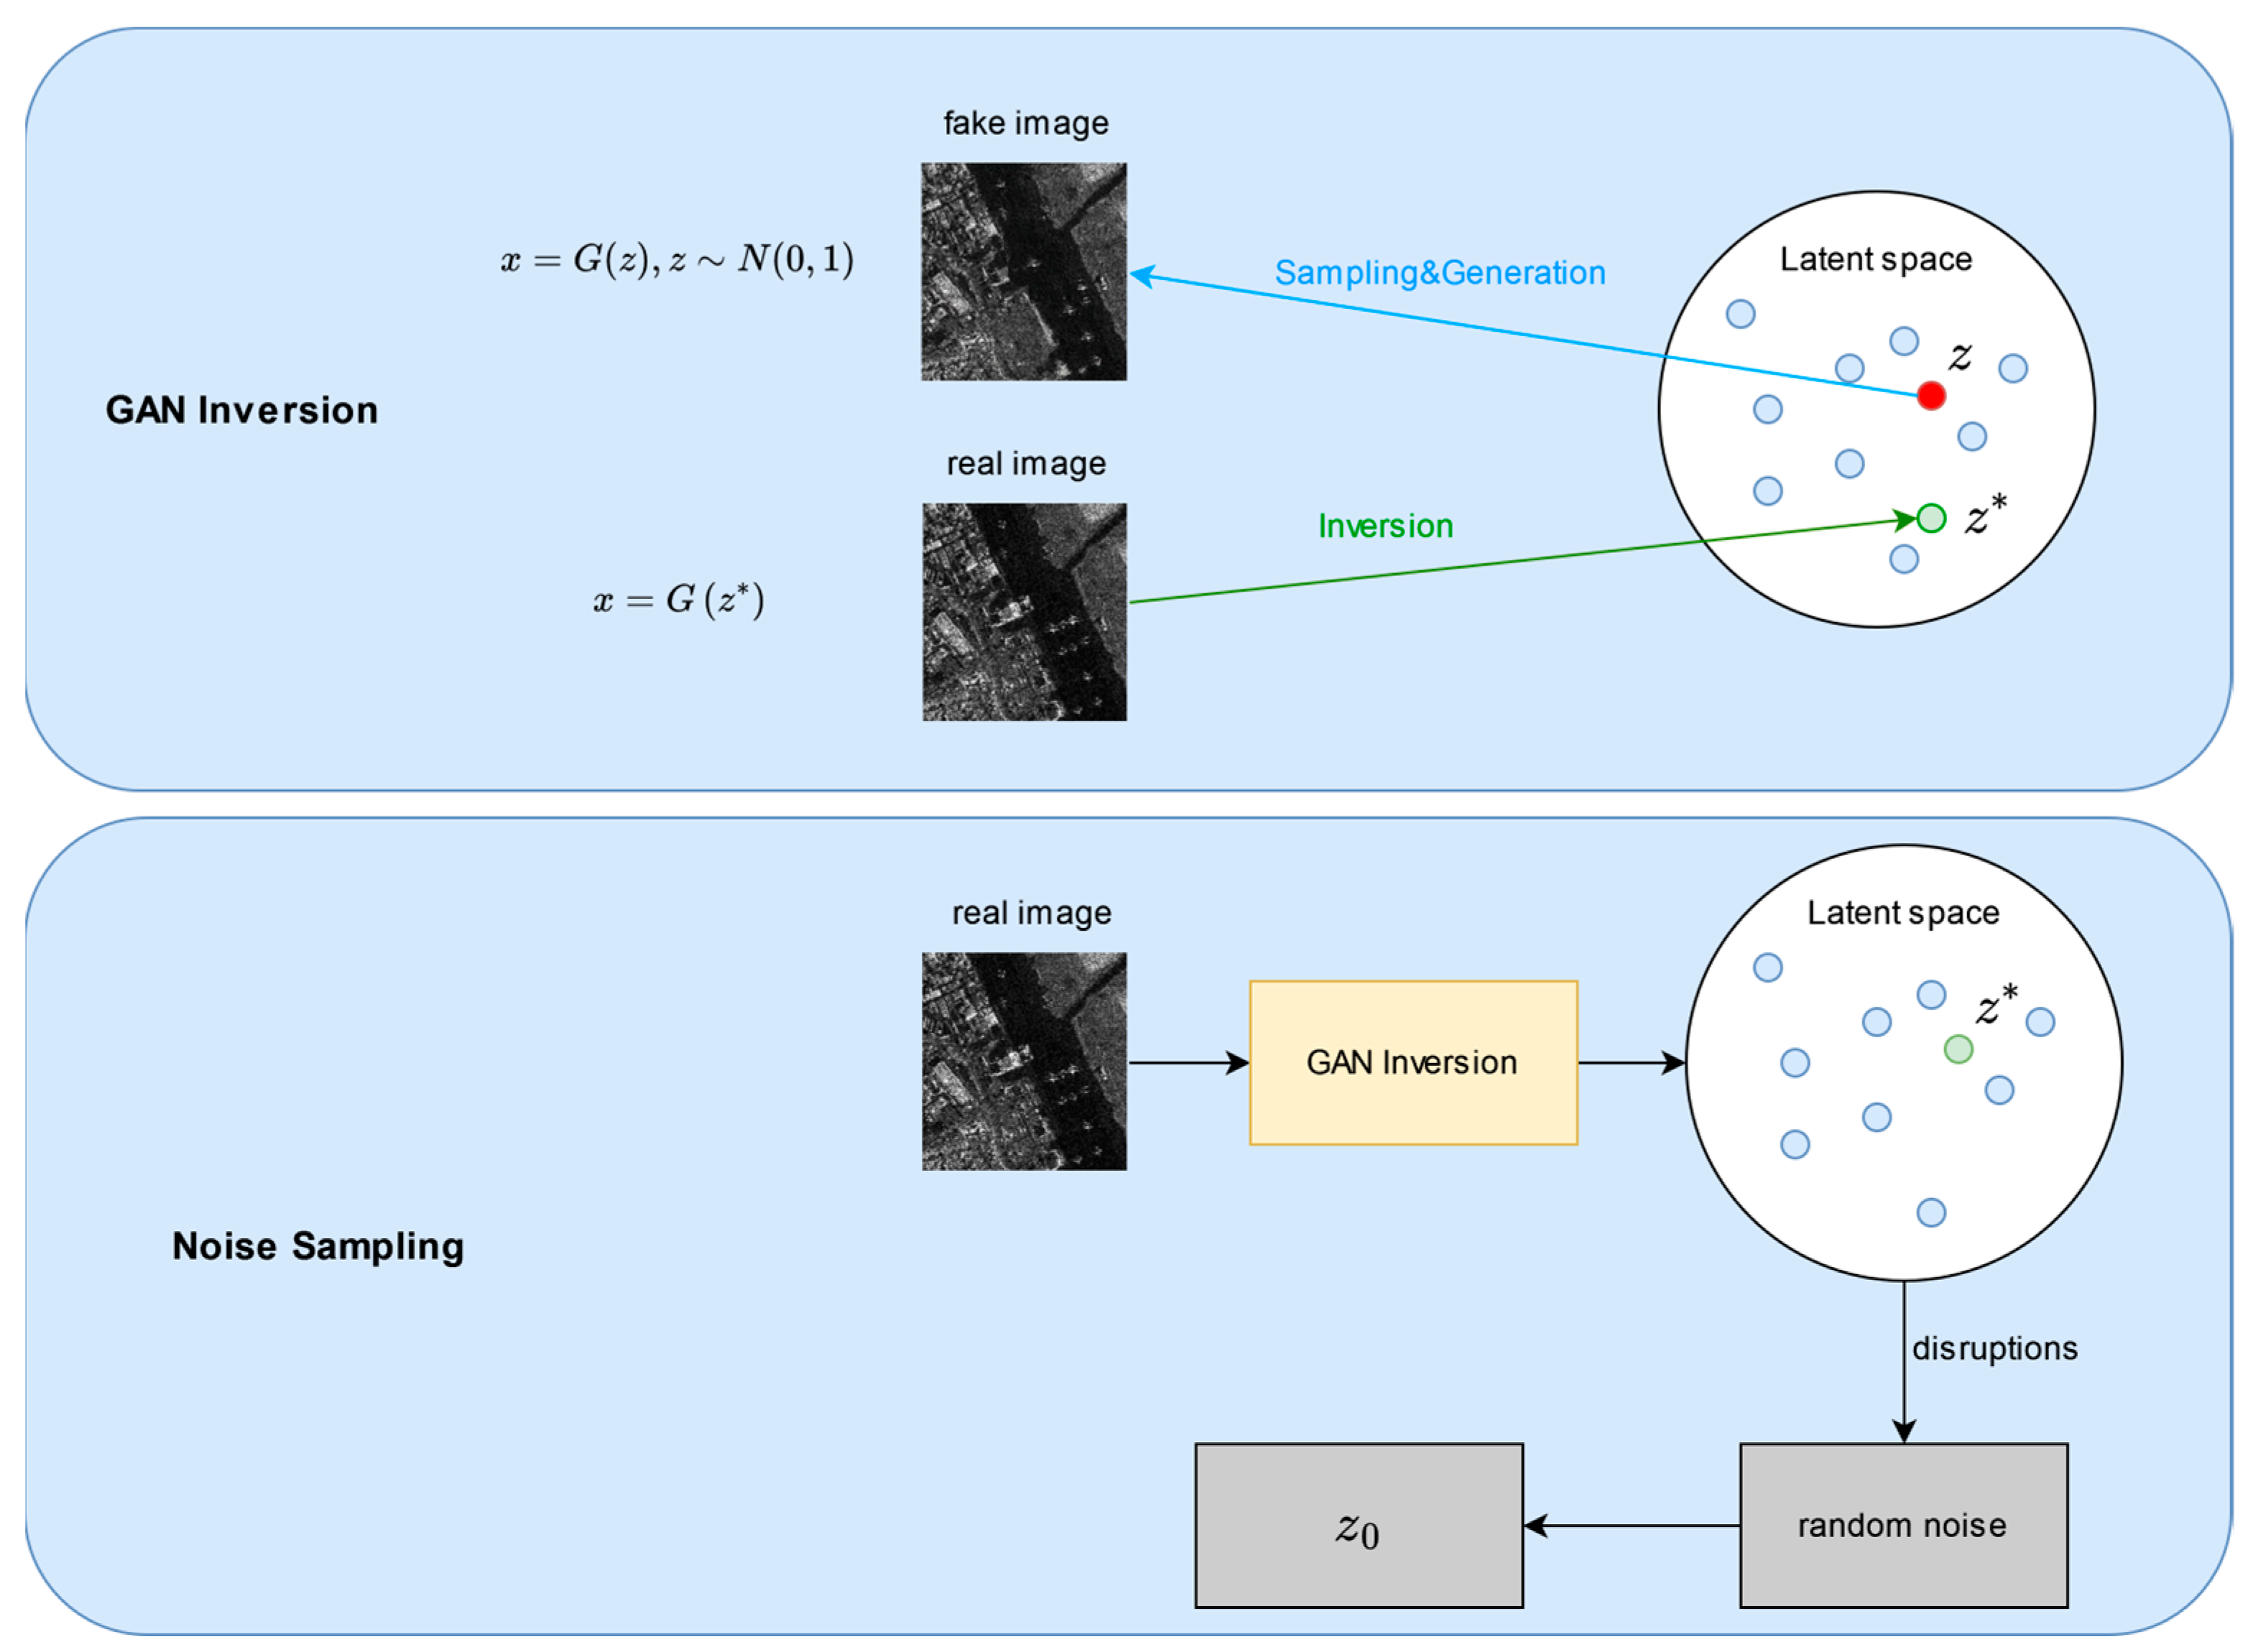
3.1.1. Prior-Regularized Noise Sampling

A standard GAN samples Gaussian noise as input to diversify the generation. However, this introduces a substantial degree of randomness into the generation and may lead to deviations from an authentic distribution. To address this issue, we introduced prior knowledge from the authentic image to guide the sampling of the initial noise image.
This process is illustrated in Figure 2. Specifically, for a given image, we first employed GAN inversion techniques [44] to retrieve its latent representations in the latent variable space.
The GAN inversion technique first leverages the latent variable space of a pre-trained GAN (trained with large-scale natural images) to retrieve the latent code z * of an authentic image. Then, z * is perturbed with Gaussian noise to generate the initial noise sample z 0 :
z 0 = G pre   z * + Δ z i 0 i = 1 , , m
where G pre   is a pretrained generator, Δ z i is random Gaussian noise, and m is the number of synthesis iterations. Additionally, to ensure the stability and diversity of the generation, copies of some real samples were inserted into the dataset to suppress the emergence of artifacts in the synthesized images. Through this sampling process, the obtained noisy input retains prior information from the initial sample, providing reliable structural and semantic priors for the image generation.
Utilization of the perturbed noise effectively facilitates the generation of reasonable and accurate initial images. Moreover, it imposes certain constraints throughout the subsequent stages of image generation, thereby regulating the diversity of the generated images within a reasonable range. This strategy incorporates initial priors into the generation process, and ensures the generator can synthesize high-quality images from limited training samples.

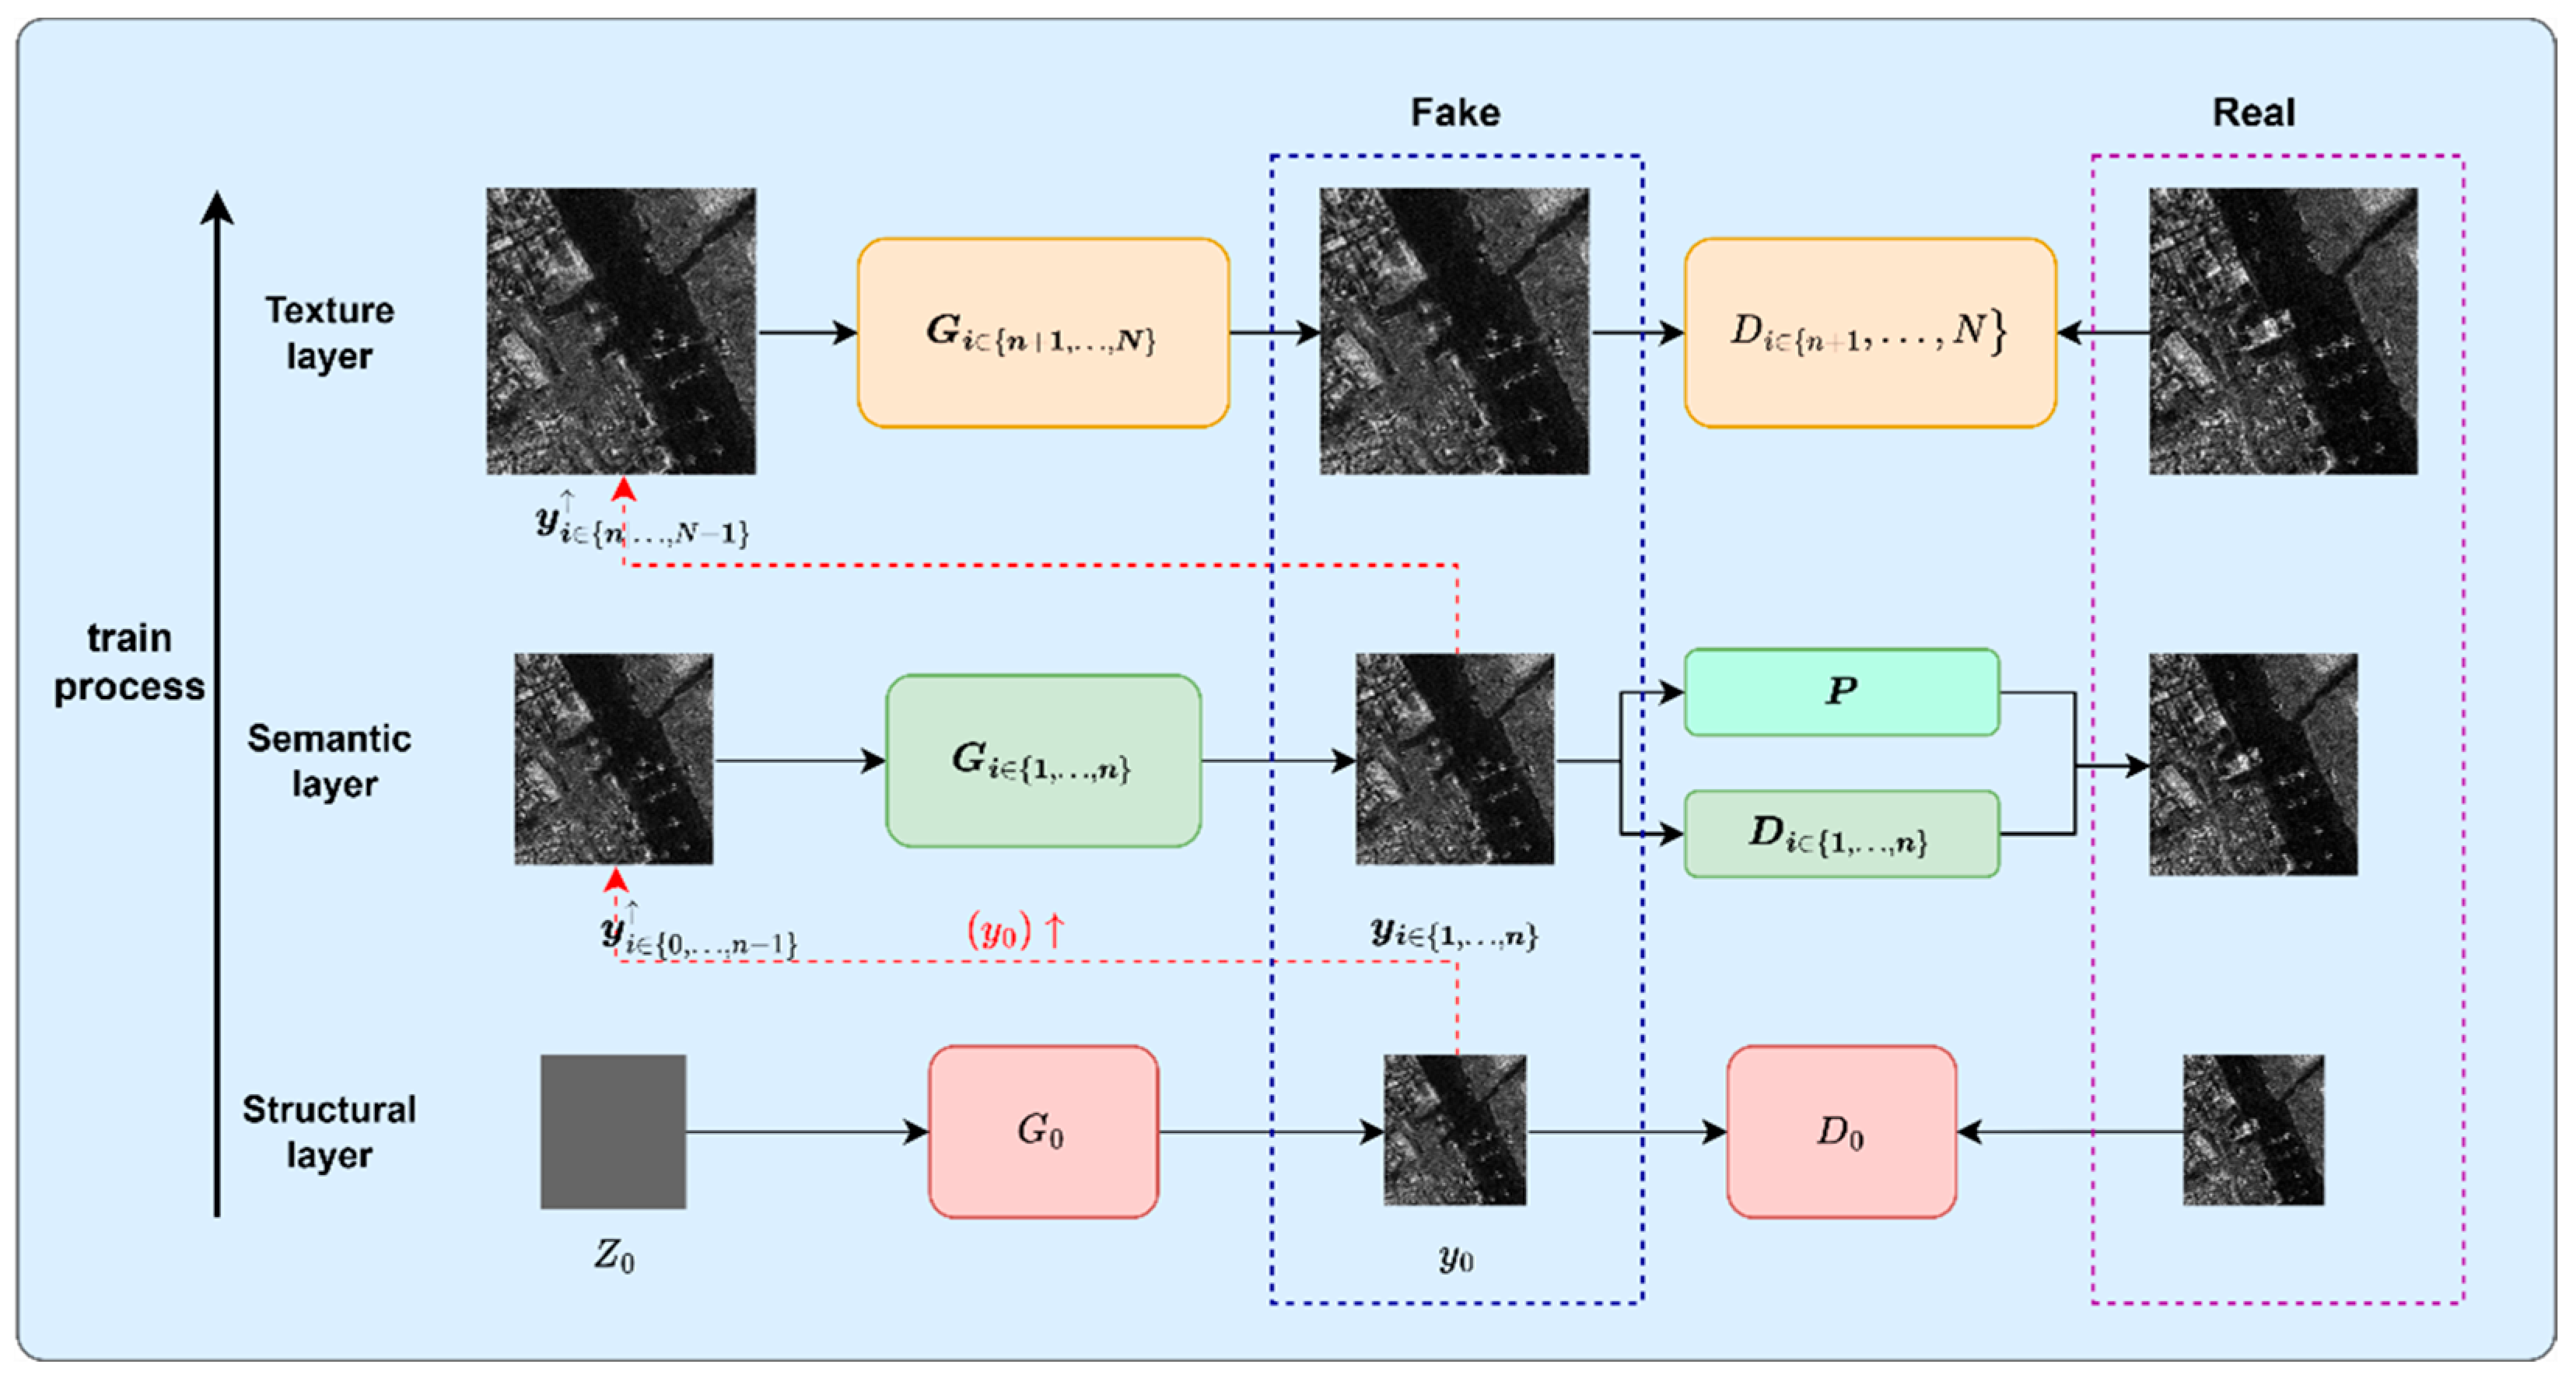
3.1.2. Hierarchical Coarse-to-Fine Image Generation

Typical generative algorithms model the generation process in a single deep neural network; therefore, they are subject to noise and model collapses in the context of SAR image generation. Alternatively, we propose performing progressive image generation within a hierarchical framework. This approach comprises three pairs of generators and discriminators, i.e., three GANs, collaboratively trained to achieve coarse-to-fine image generation. The three modularized GANs are specialized in synthesizing image features at the structural, semantic, and texture levels, respectively. Each GAN is trained with distinct objectives, attending to the different image characteristics.
Figure 3 presents the overall framework of the proposed image generation system. Let us denote z 0 as the noise image after GAN inversion and perturbation, let G 0 N be the generator and D 0 N be the discriminator. P denotes the perceptual loss.
At the coarsest scale (level 0), the structural information is explicitly modeled. Generator G 0 aims to produce a low-resolution SAR image with an overall layout matching the down-sampled ‘real’ SAR image. The input is a noise image z 0 of the same resolution. Compared to learning from the high-resolution images directly, learning from these down-sampled, low-resolution images allows for a better perception of the global information and the image structure. However, the results are blurry at this stage.
At the second stage (level 1), the model learns to recover the spatial resolution and to enhance semantic richness, while retaining the learned structural information. Generator G 1 n takes the noise z 1 n 1 and the upsampled image y 0 n 1 as inputs, where r represents an up-sampling factor. In this layer, the learning objective is to increase the resolution and enrich the image semantics with a feature extraction network.
Finally, at the highest level, the generator learns to enrich the textures of the generated image, and compensate for the subtle differences from the real images. The underlying structural and semantic features learned from the first two levels are jointly modeled through feature integration.
This ‘coarse-to-fine’ progressive generation process leads to the syntheses of a SAR image with its original resolution. It effectively preserves both the details and global information of the SAR image. Moreover, the proposed approach allows for training in the generation process with a single image sample. It utilizes patch blocks for intra-sample blended mode learning, and obtains structural information in a pyramid structure, thus both the spatial details and global semantics are effectively modeled. An elaborated illustration of the network components, as well as their distinctive training objectives, is presented in Section 3.2.

3.2. Network Architecture

The proposed generative algorithm adopts a multi-level hierarchical architecture to learn the refined features in a coarse-to-fine manner. Three GANs are employed to model the structural, semantic, and texture features, respectively. Additionally, we introduce a multi-scale self-attention mechanism (MSDA) [45] to enhance the reliability and generation capability of GANs. In the following sections, we elaborate on the structures and training objectives of these network modules.

3.2.1. Structural GAN

To generate images with realistic structural distributions, we employed the initial generator G 0 , the structural GAN, to infer the spatial layout of the image sample. It synthesizes the down-scaled image using the prior-regularized noise, as introduced in Section 3.1.1. G 0 is a simple CNN comprising five sequential convolutional layers. It is trained using the WGAN-GP loss [46], an adversarial loss with a high convergence stability:
m i n G 0 m a x D 0 L a d v G 0 , D 0
Furthermore, to precisely capture the structural characteristics of the images, a multi-scale structural similarity loss (MS-SSIM-loss) function is introduced along with an L1 mixed loss function:
L MS SSIM x 0 , y 0 + L l 1 = 1 MS   - SSIM x 0 y 0 ˜ + 1 N p P | x 0 y 0 |
The composite loss function for our structural GAN is as follows:
m i n G 0 m a x D 0 L a d v G 0 , D 0 + α 1 L MS SSIM x 0 , y 0 + α 2 L l 1
where α 1 and α 2 are two of the weighting parameters.
The introduced loss functions serve different purposes in the synthesis of structural features. The MS-SSIM is inclined to induce variations in changes in brightness and color deviation, but it is beneficial in retaining high-frequency information, such as the edges and intricate image details. Meanwhile, the L1 loss function avoids severe fluctuations in brightness and color stability. The WGAN-GP loss function can ensure stability in the adversarial training. The integration of these different loss functions effectively improves the structural fidelity of the synthesized images.

3.2.2. Semantic GAN

At the second level, the proposed algorithm endeavors to augment semantic representations into the output of G 0 . Therefore, we introduced a semantic GAN consisting of n layers of GANs, where each of them was a simple CNN. To enrich the semantic details, we further introduced perceptual loss, a type of loss function commonly used in image generation tasks to make the generated image perceptually similar to the target images. Perceptual loss compares the activations of the intermediate layers of a deep network (e.g., VGG) between the original and generated images. Unlike pixel-value based comparisons, perceptual loss focuses on high-level features such as shape and texture. In our implementation, we employed a trained VGG19 [47] to extract features and compute the LPIPS [48] (Learned Perceptual Image Patch Similarity) loss.
As illustrated in Figure 4, the ‘real’ image x i (down-sampled to the i-th scale) and the generated image G i y i 1 are forwarded into a pretrained VGG19 [47] for feature extraction and comparison. The output of each VGG layer is then activated and normalized. The features from the l-th layer are denoted as y ^ l , y ^ 0 l H l × W l × C l . Then, after an element-wise multiplication with w layers of weights, the L2 distance is calculated and averaged. The calculations can be formulated as follows:
L l p i p s x i , G i y i 1 = l 1 H l W l h , w w l y h w l y 0 h w l 2 2    
where x i is the down-sampled authentic image and G i y i 1 is the generated image at the i-th scale. This function is a weighted average of the L2 distance with w l being the weight for the l-th channel.
The introduction of LPIPS facilitates the aggregation of semantic features at various spatial scales throughout the progressive generation process. Compared to the conventional mean squared error (MSE) loss function, LPIPS yields enriched semantic content and results in more refined and detailed SAR imagery. Note that residual learning is deprecated in our implementation as it may cause potential artifacts affecting image quality and structural accuracy.
While LPIPS functions as an auxiliary objective, the training of the semantic GAN necessitates generative losses to guide its optimization. To improve the stability of the generative process, the reconstruction of the loss function L rec   G i = G i x i 1 x i 2 was employed.
Let us denote the diversity loss as L d i and L l p i p s x i , G i y i 1 which is simplified as L p G i . The composite loss function training the semantic GAN can be calculated as follows:
m i n G i m a x D i L a d v G i , D i + α 3 L r e c G i + λ L p G i
The semantic GAN is implemented with multi-layer architecture to synthesize the semantic features and to approximate the target distribution, as the single-layer GAN struggles to sufficiently augment the target instances for ATR.

3.2.3. Texture GAN

In the final texture level, the primary objective is to enhance the synthesized image by incorporating supplementary textures. Specifically, the intention is to infuse intricate details into the y n obtained from the preceding levels, so that it simulates the real image x . The texture GAN adopts a multi-layer architecture with residual blocks, a network design that has been widely used in image super-resolution tasks [49]. The calculations for each layer are as follows:
y i = G i y i 1 + y i 1 , i = n + 1 , , N .  
where y i is the generative output of the i-th layer, and ‘ ’ is an upscaling operation.
Similar to the first level (the structural level), the texture GAN is also trained with a composite loss function to maintain training stability and the rationality of generated image structures. The overall loss function, integrating adversarial loss, reconstruction loss, and structural loss, is calculated as follows:
m i n G i m a x D i L a d v G i , D i + α 3 L r e c G i + α 1 L MS SSIM x 0 , y 0  

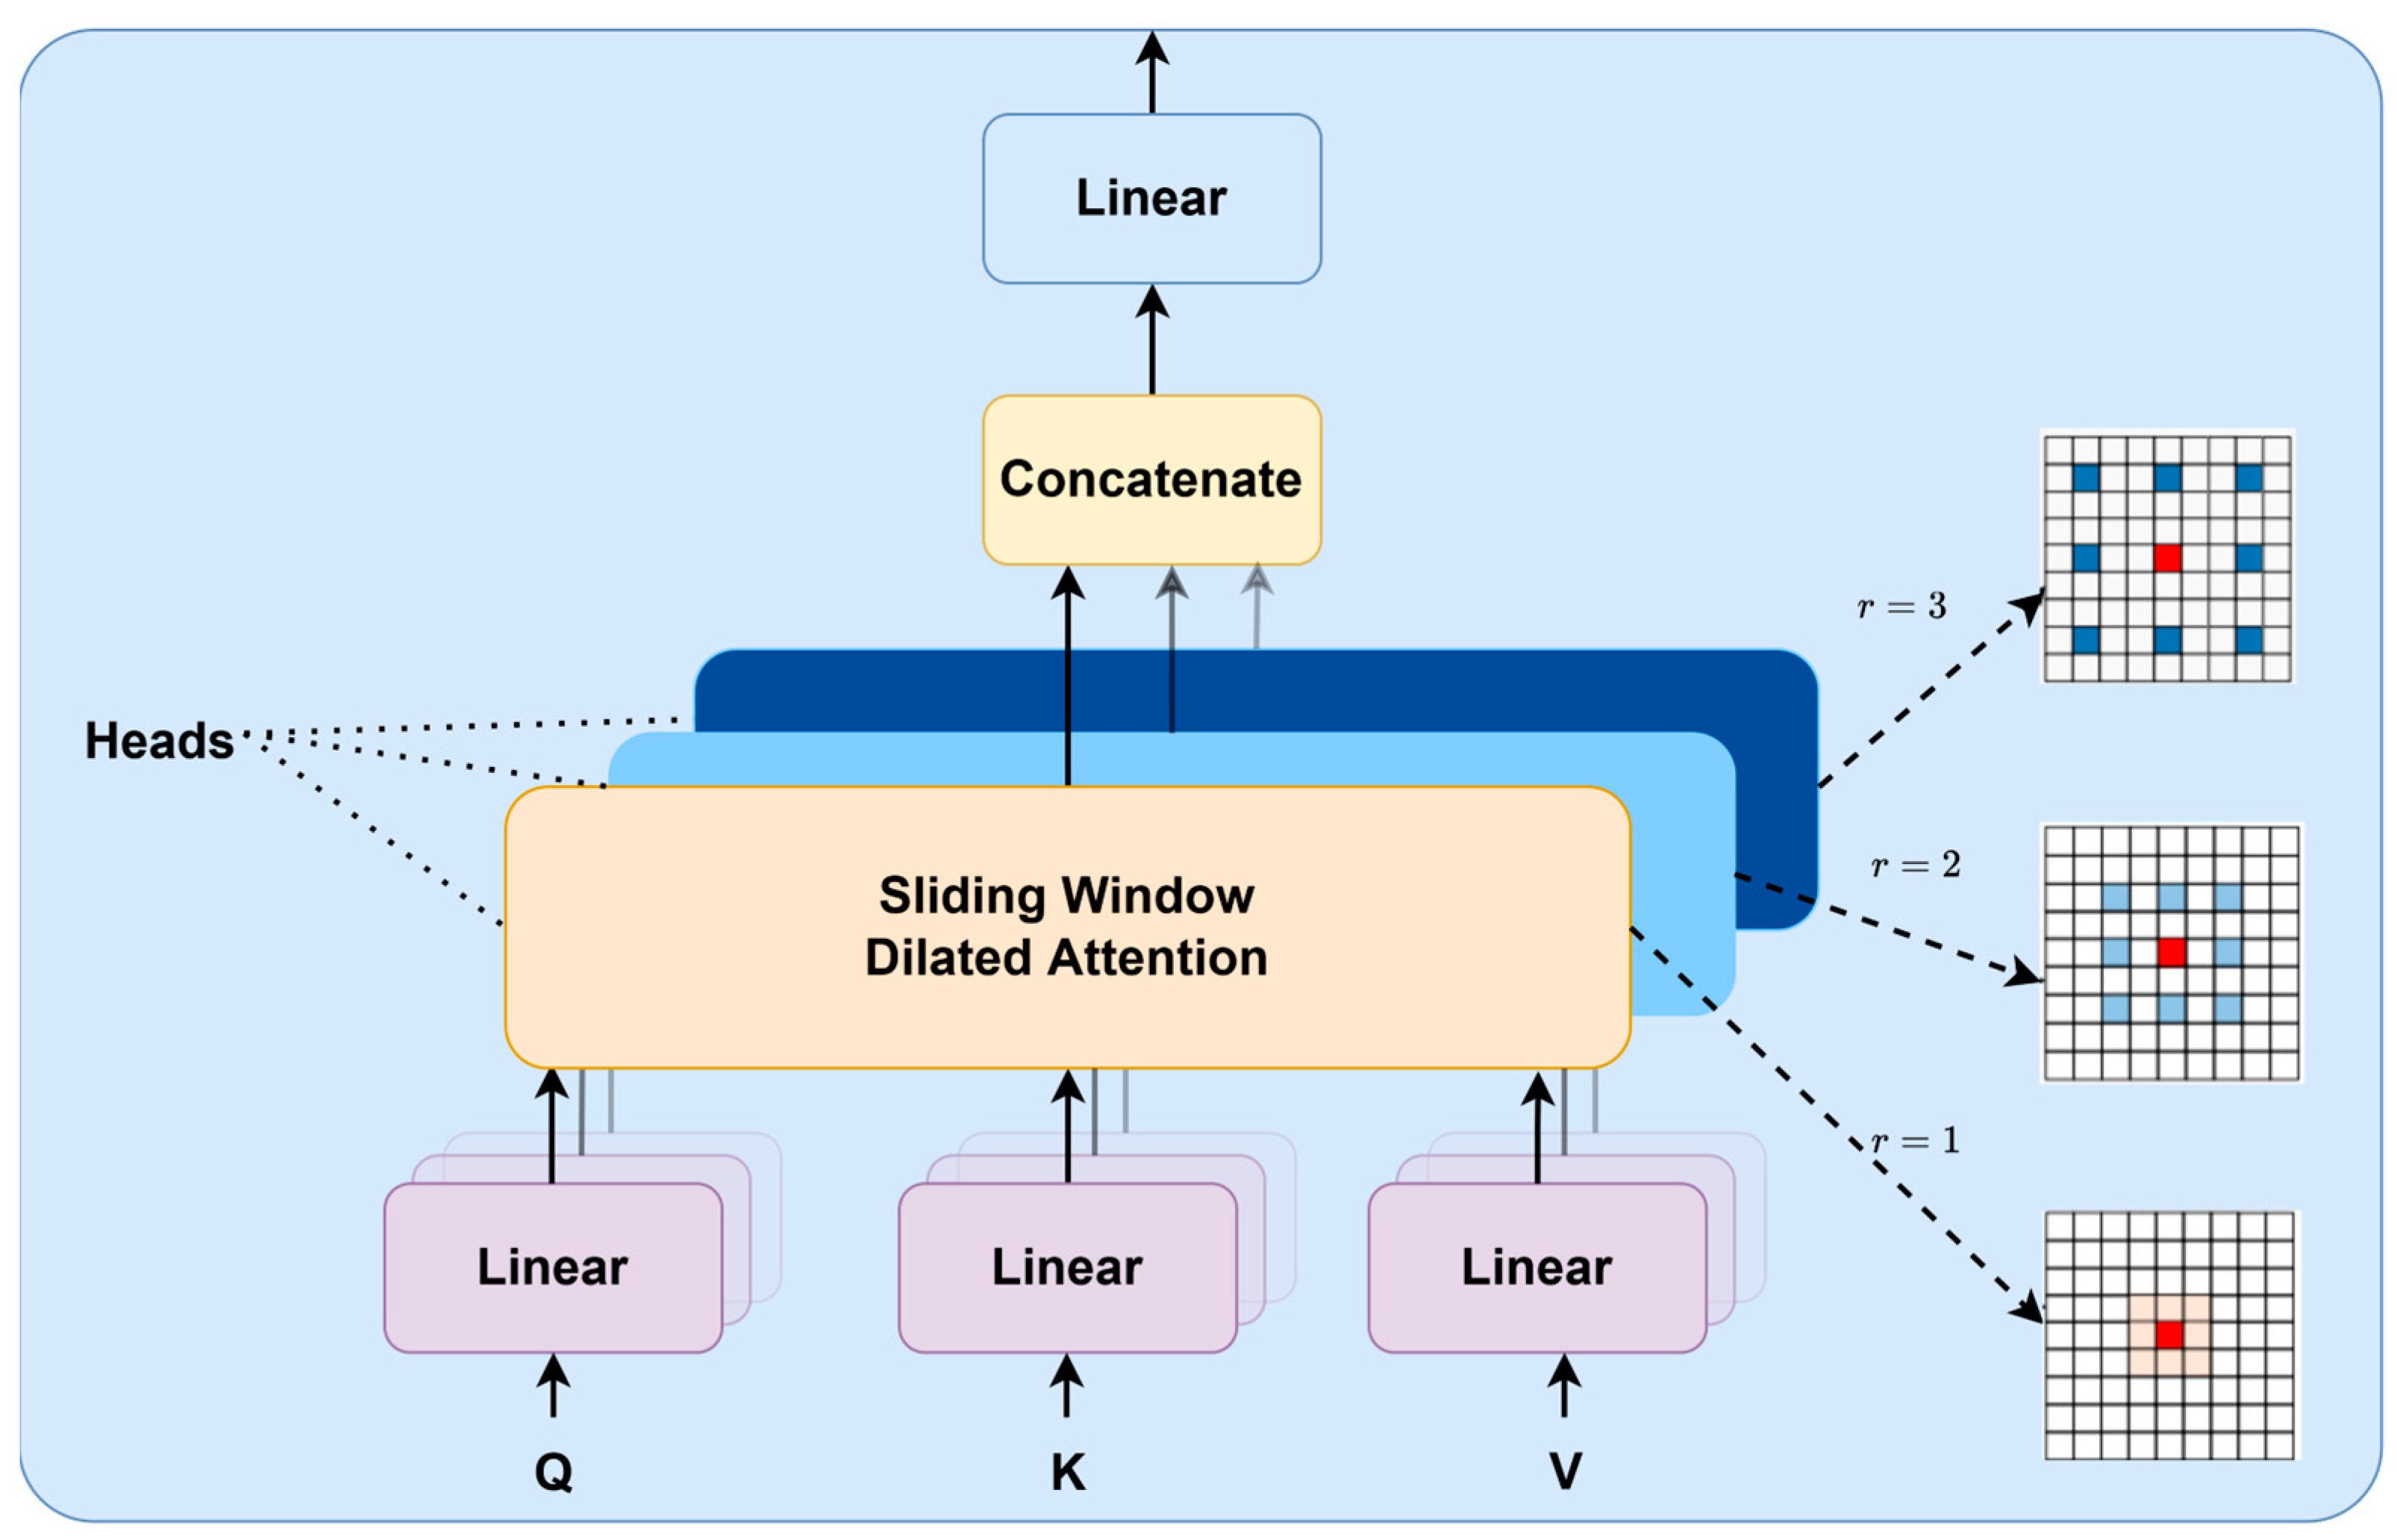
3.2.4. Self-Attention Mechanism Module

Self-attention has been extensively used in image recognition tasks as well as in GANs. Coelho et al. [50] introduced self-attention mechanisms into GANs and achieved significant results. In experimental analyses, it was observed that the self-attention mechanism significantly enhanced the capacity of deep models to capture more nuanced and authentic features, augmenting their generalization, and improving the fidelity of the generated images.
The self-attention mechanism calculates the dependencies between different spatial locations in an image, thus acquiring a perception of the global context. This also enhances precision when observing some specific regions. Owing to its intrinsic calculations, the dependences on external information can be minimized, facilitating a better aggregation of the intra-feature correlations. Consequently, integration of the self-attention mechanism within a single-image generation model not only improves the generalization capability, but also enhances the quality of image generation. In this study, the self-attention mechanism is employed to enable the synthesis of structurally coherent and high-fidelity target images. In Section 4, a comprehensive analysis on the effects of using self-attention is provided.
The multi-scale adaptable channel self-attention mechanism (MSDA) is introduced in the proposed method. The MSDA simulates a sliding window to obtain the distribution and feature correlation between different image patches. This fits well with the proposed progressive generation strategy. In the initial level of generation, a sequence of MSDA blocks are aggregated to facilitate a comprehensive exploitation of the image features. In the middle-level generation phase, global multi-head attention blocks are integrated to refine the generation of intricate image details. The MSDA proficiently captures contextual dependencies across different scales, thereby optimizing the exploitation of discriminative patterns in SAR images.
Figure 5 presents the architecture of the MSDA. First, the feature channels are divided into different operation groups, i.e., the multiple ‘heads’. Then, self-attention operations are performed within each group. To better perception of the different contexts, dilated convolutions with different dilation rates r are used in the multiple embedding heads. The self-attention operations are conducted with different dilation rates. In the proposed network architecture, the convolutional kernels are set to the size of 3 × 3, while the dilation rates are set to r = {1, 2, 3}. The corresponding feature modeling heads have the attention receptive field sizes of 3 × 3, 5 × 5, and 7 × 7, respectively. This allows the aggregation of local contexts from different spatial scales. Finally, the features embedded from different heads are concatenated and processed through a linear layer.
In the proposed architecture, the MSDA modules are integrated into the proposed structural GAN and semantic GAN. They are placed after the convolutional layers to enhance the feature representations. The incorporation of this MSDA enables a comprehensive modeling of both global and local contexts, thereby enhancing the synthesis of SAR patterns at both the structural and semantic levels.

3.3. Implementation Details

The proposed algorithm has been implemented with PyTorch20.1, and trained on a computational server equipped with NVIDI 4090 GPU. First, we deployed the pre-trained models of the BigGAN [51] and VGG-19 [47], along with their respective DGP weights and network configurations. The sample images were processed to derive the noise maps as well as the initial input into the GANs. During these experiments, variations in the spatial size of the images were considered. The BigGAN model has been pre-trained with images of 256 × 256 pixels. Consequently, while processing images of larger sizes, more replicas of the images are required in the sampling of the prior-regularized noise. It is important to acknowledge that in our experimental implementation, the maximum spatial size of the synthesized image was 800 × 800 due to the limitations of the computational hardware.
To facilitate quick and stable training, all the G i and D i consisted of only five convolutional layers. An exception was D 0 , which included three convolutional layers and one fully connected layer. For the training of the Structured GAN, we injected Gaussian noise (with a mean value of 0 and standard deviation between 0.1 and 0.5) to perturb the latent codes. This resulted in 500 sets of noise maps, which were injected into 100 copies of the original images. In the semantic layer, a pre-trained VGG-19 [47] was used for feature extraction, followed by the perceptual loss calculation using LPIPS. To balance training time and performance, the weighting parameters for the loss functions were set as follows: λ = 0.1 , α 1 , α 2 = 0.1 , and α 3 = 10 .
Each level of the GAN was trained in different iterations. Training iterations of the first structural level were set to 10   k with a learning rate of 10 4 . At the subsequent semantic and texture levels, the training iterations were set to 20   k with a learning rate of 5 × 10 4 .

4. Experimental Analysis and Discussions

In this section, we will conduct a comprehensive experimental evaluation of the proposed algorithm, providing both quantitative and qualitative analyses on generation performance, as well as discuss the advantages and limitations. By integrating diverse parameters and employing a cutting-edge evaluation framework, we comprehensively examine the single-sample generation of SAR images, and analyze the support of images with different spatial sizes.

4.1. Evaluation Metrics

4.1.1. SIFID

One of the most commonly used evaluation metrics for GAN-based image generation is the Fréchet Inception Distance (FID). The FID measures the differences in deep feature distributions between the generated and the real images, and calculates the disparity between them. In general, low FID values are preferable, as this signifies that the model has effectively captured the intricate characteristics of images in the target domains. However, while assessing single-sample image generation models, conventional FID computation is less applicable. Thus, a single-sample image FID (SIFID) metric has been introduced in [52]. Instead of using the activation vectors after the last pooling layer in the Inception Network [53] (one vector per image), it leverages the deep feature distribution at the output of the convolutional layers before the second pooling layer (one vector at each position). The SIFID measures the FID between the statistical data of these features in real and generated samples.

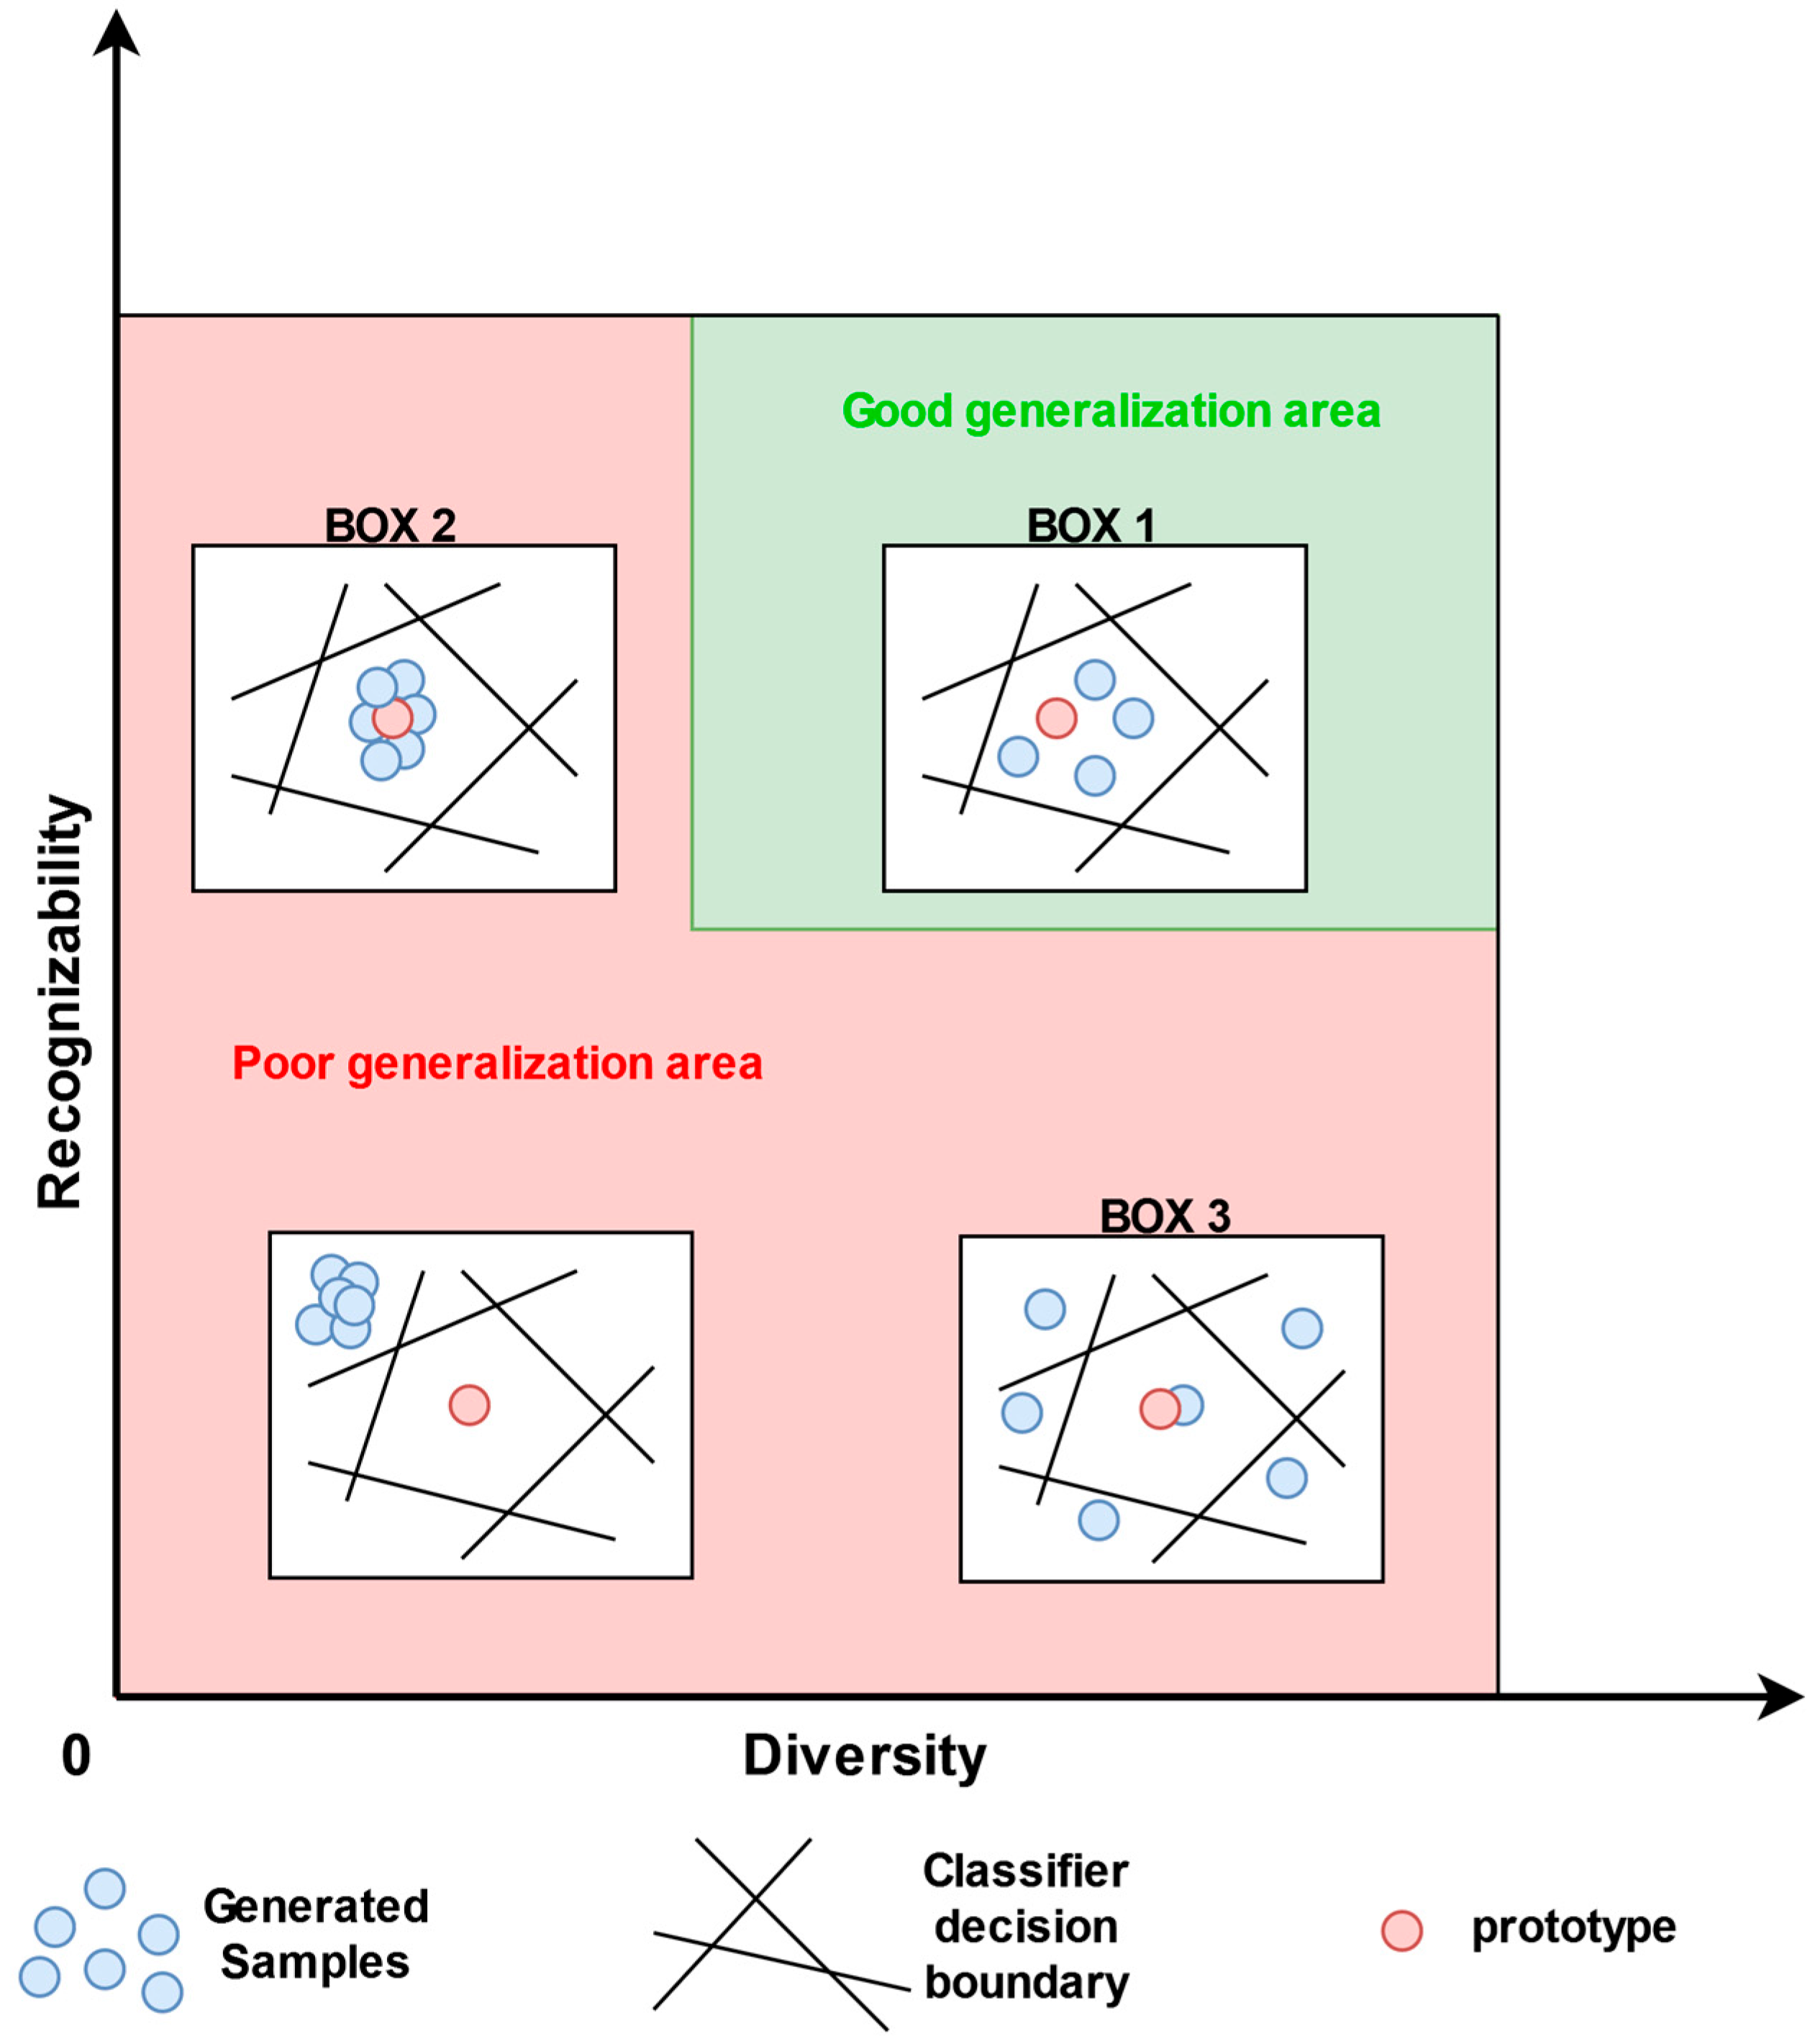
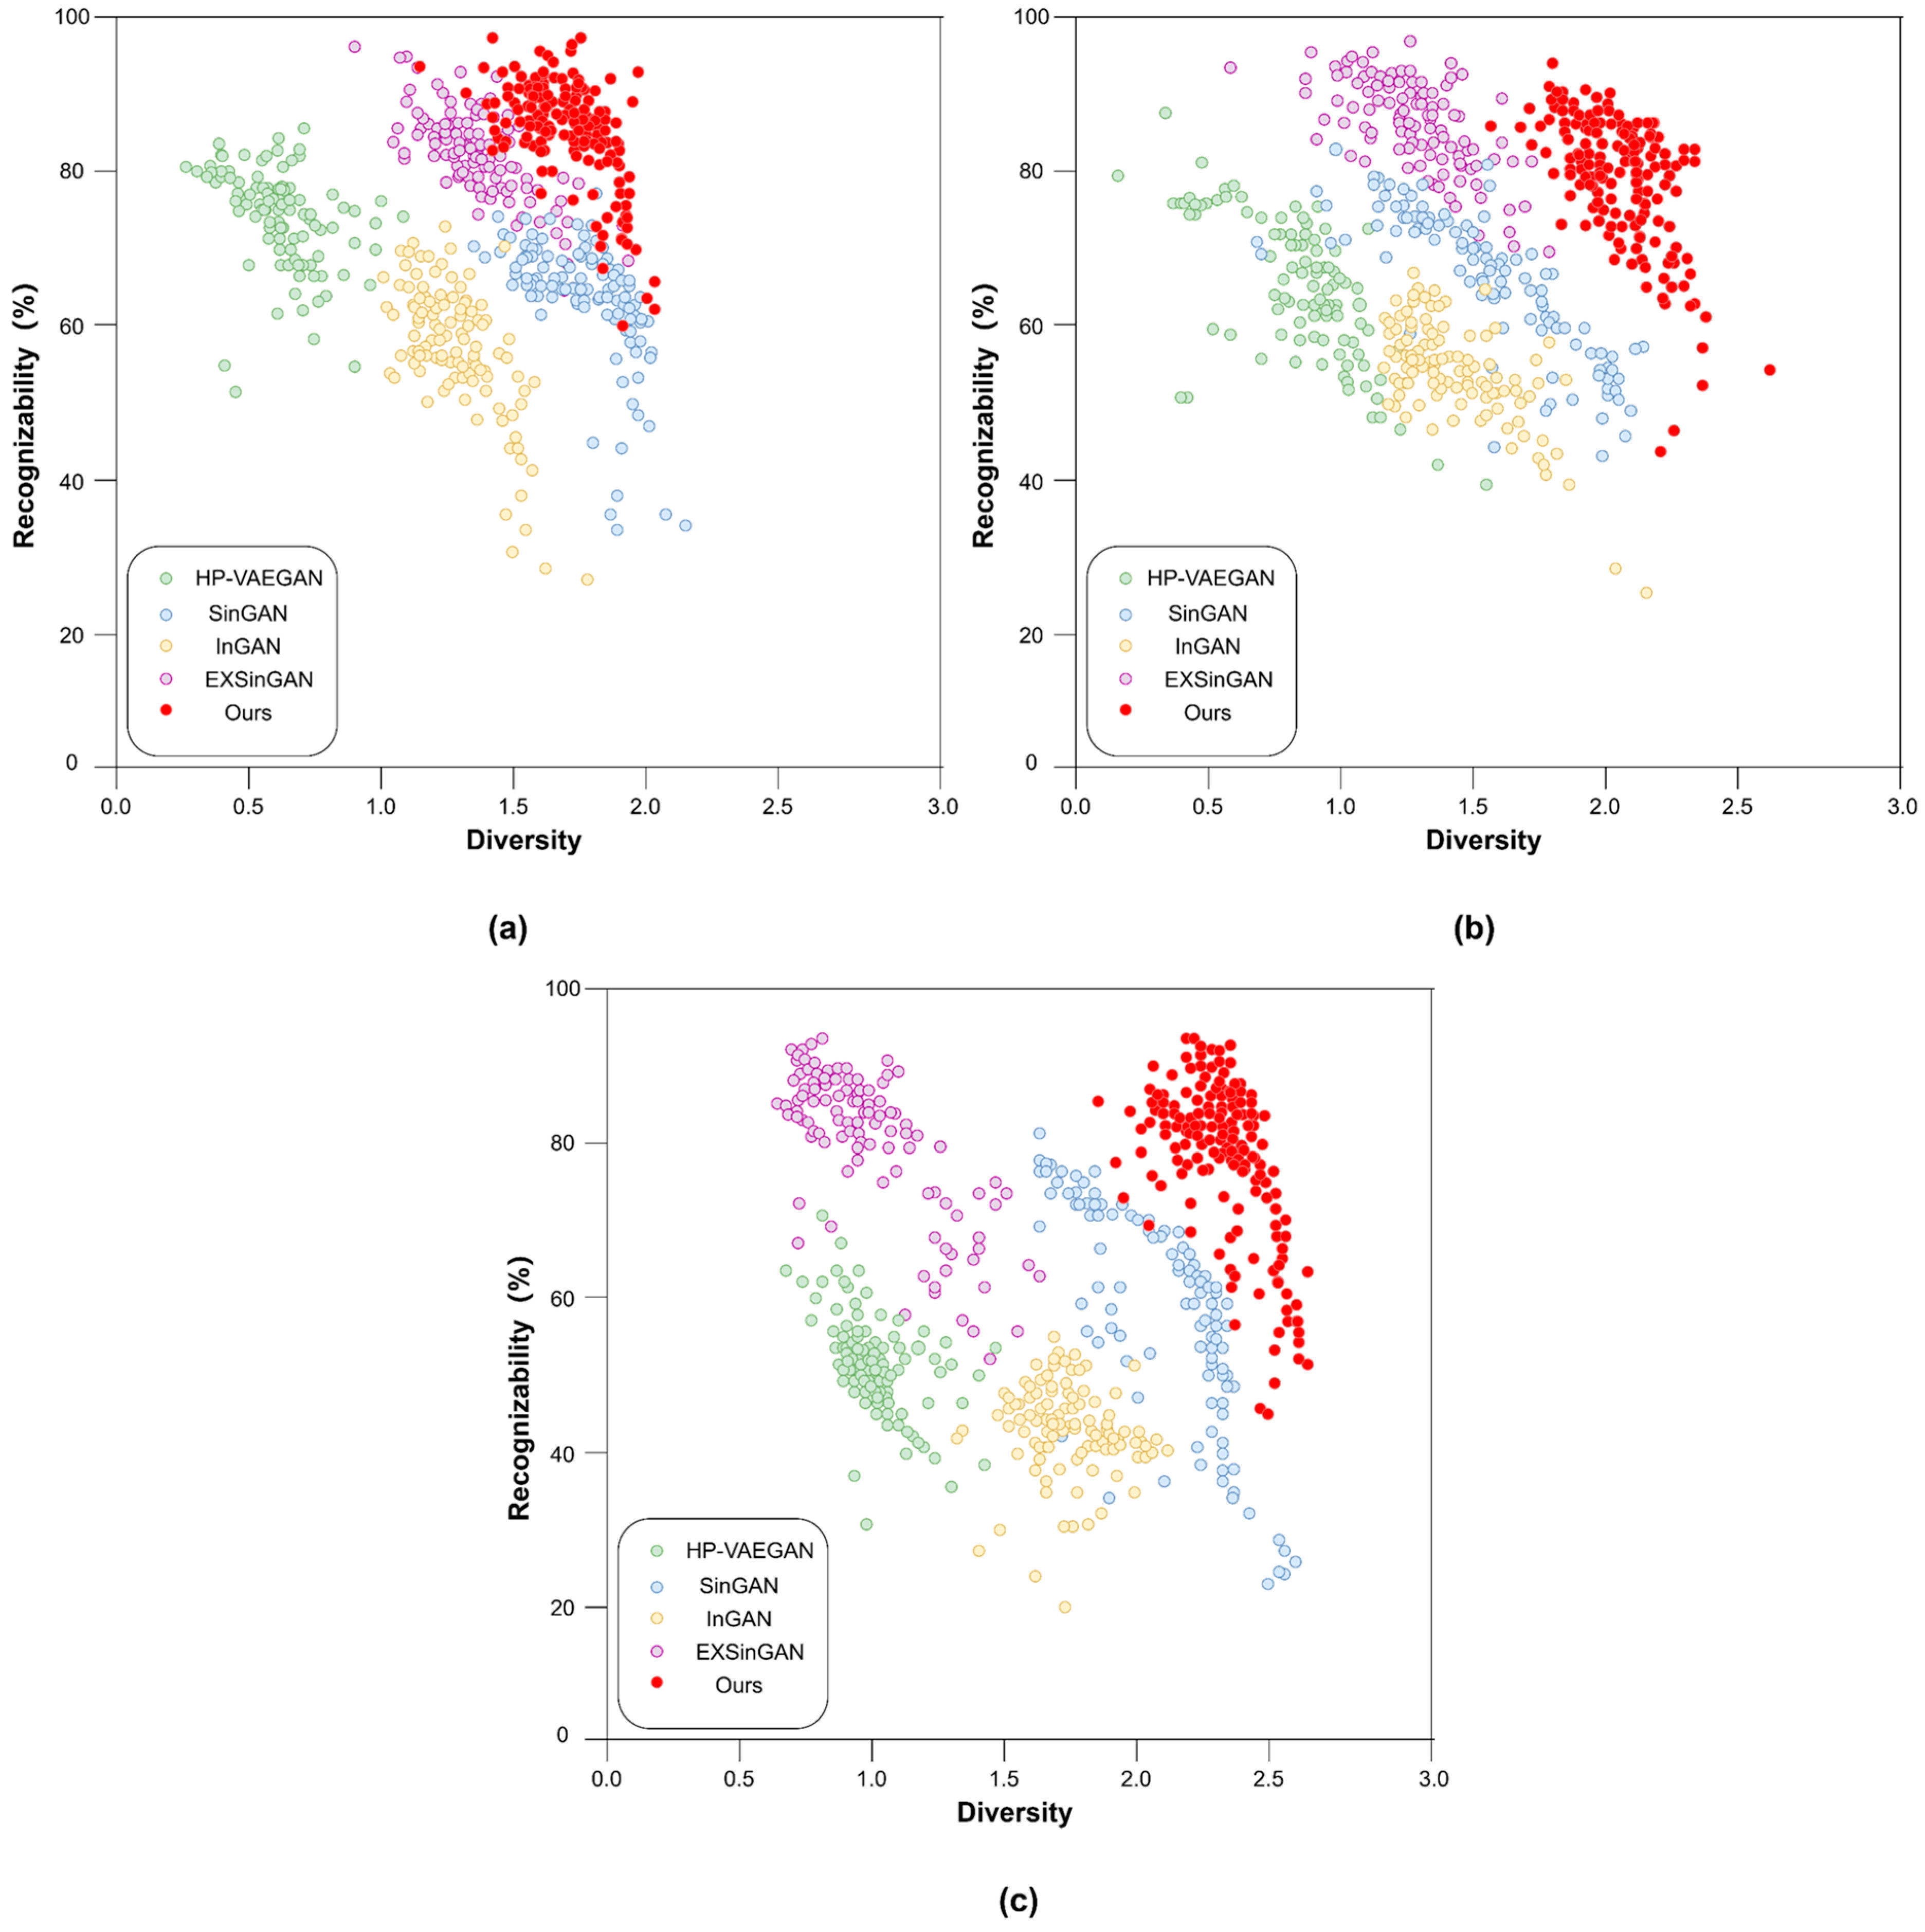
4.1.2. Recognizability vs. Diversity Evaluation Framework

Currently, there are relatively few evaluation methods tailored to evaluating single-sample image generation methods. Conventional evaluation metrics such as the FID (Fréchet Inception Distance) or IS (Inception Score) are designed for methods involving large-scale training. Improved metrics like the SIFID partially mitigate issues related to distribution discrepancies. Nevertheless, in the unique context of single-sample image generation where both the training images and generated images are scarce, metrics like FID and IS may exhibit biases [54,55,56]. These limitations necessitate the exploration of novel metrics tailored to single-sample image generation.
Recently, an evaluation framework for single-sample image generation [57] derived from psychophysics [58] has been developed. It emphasizes two principal criteria: sample diversity (intra-class variability) and recognizability (discriminability). Diversity refers to the intra-class variability of samples generated by the model. It is assessed through the projection of both real and synthetic samples into a feature space, followed by the calculation of the variability using the Bessel-corrected standard deviation. Meanwhile, recognizability is quantitatively measured by conducting a single-sample classification of the generated images.
According to this diversity–recognizability framework, optimal algorithms are expected to achieve a good balance between diversity and recognizability, as represented in the red region in Figure 6. An ideal model generates samples across the decision boundary of the classifier (see Box 1). In contrast, the model in Box 2 generated samples that are identical to the prototypes (exhibiting low diversity). These models failed to capture the variable visual concepts inherent in the images, and their diversity is insufficient for generative applications. Meanwhile, the generated samples may exhibit diversity yet lack recognizability (see Box 3 in Figure 6). These samples deviated from the target distribution; thus, the related models are assessed as possessing suboptimal generalization.

4.2. Ablation Study

In this section, we conduct a comprehensive quantitative analysis to evaluate the qualitative and quantitative performance of the proposed techniques. First, we examine the experimental outcomes by incorporating or excluding particular modules and evaluate them within the diversity vs. recognizability framework. Then, we evaluate the efficacy of incorporating the MSDA in terms of both generalization capability and visual quality. The experiments were conducted by comparing the improvements to the SinGAN [29], the baseline method in this study.

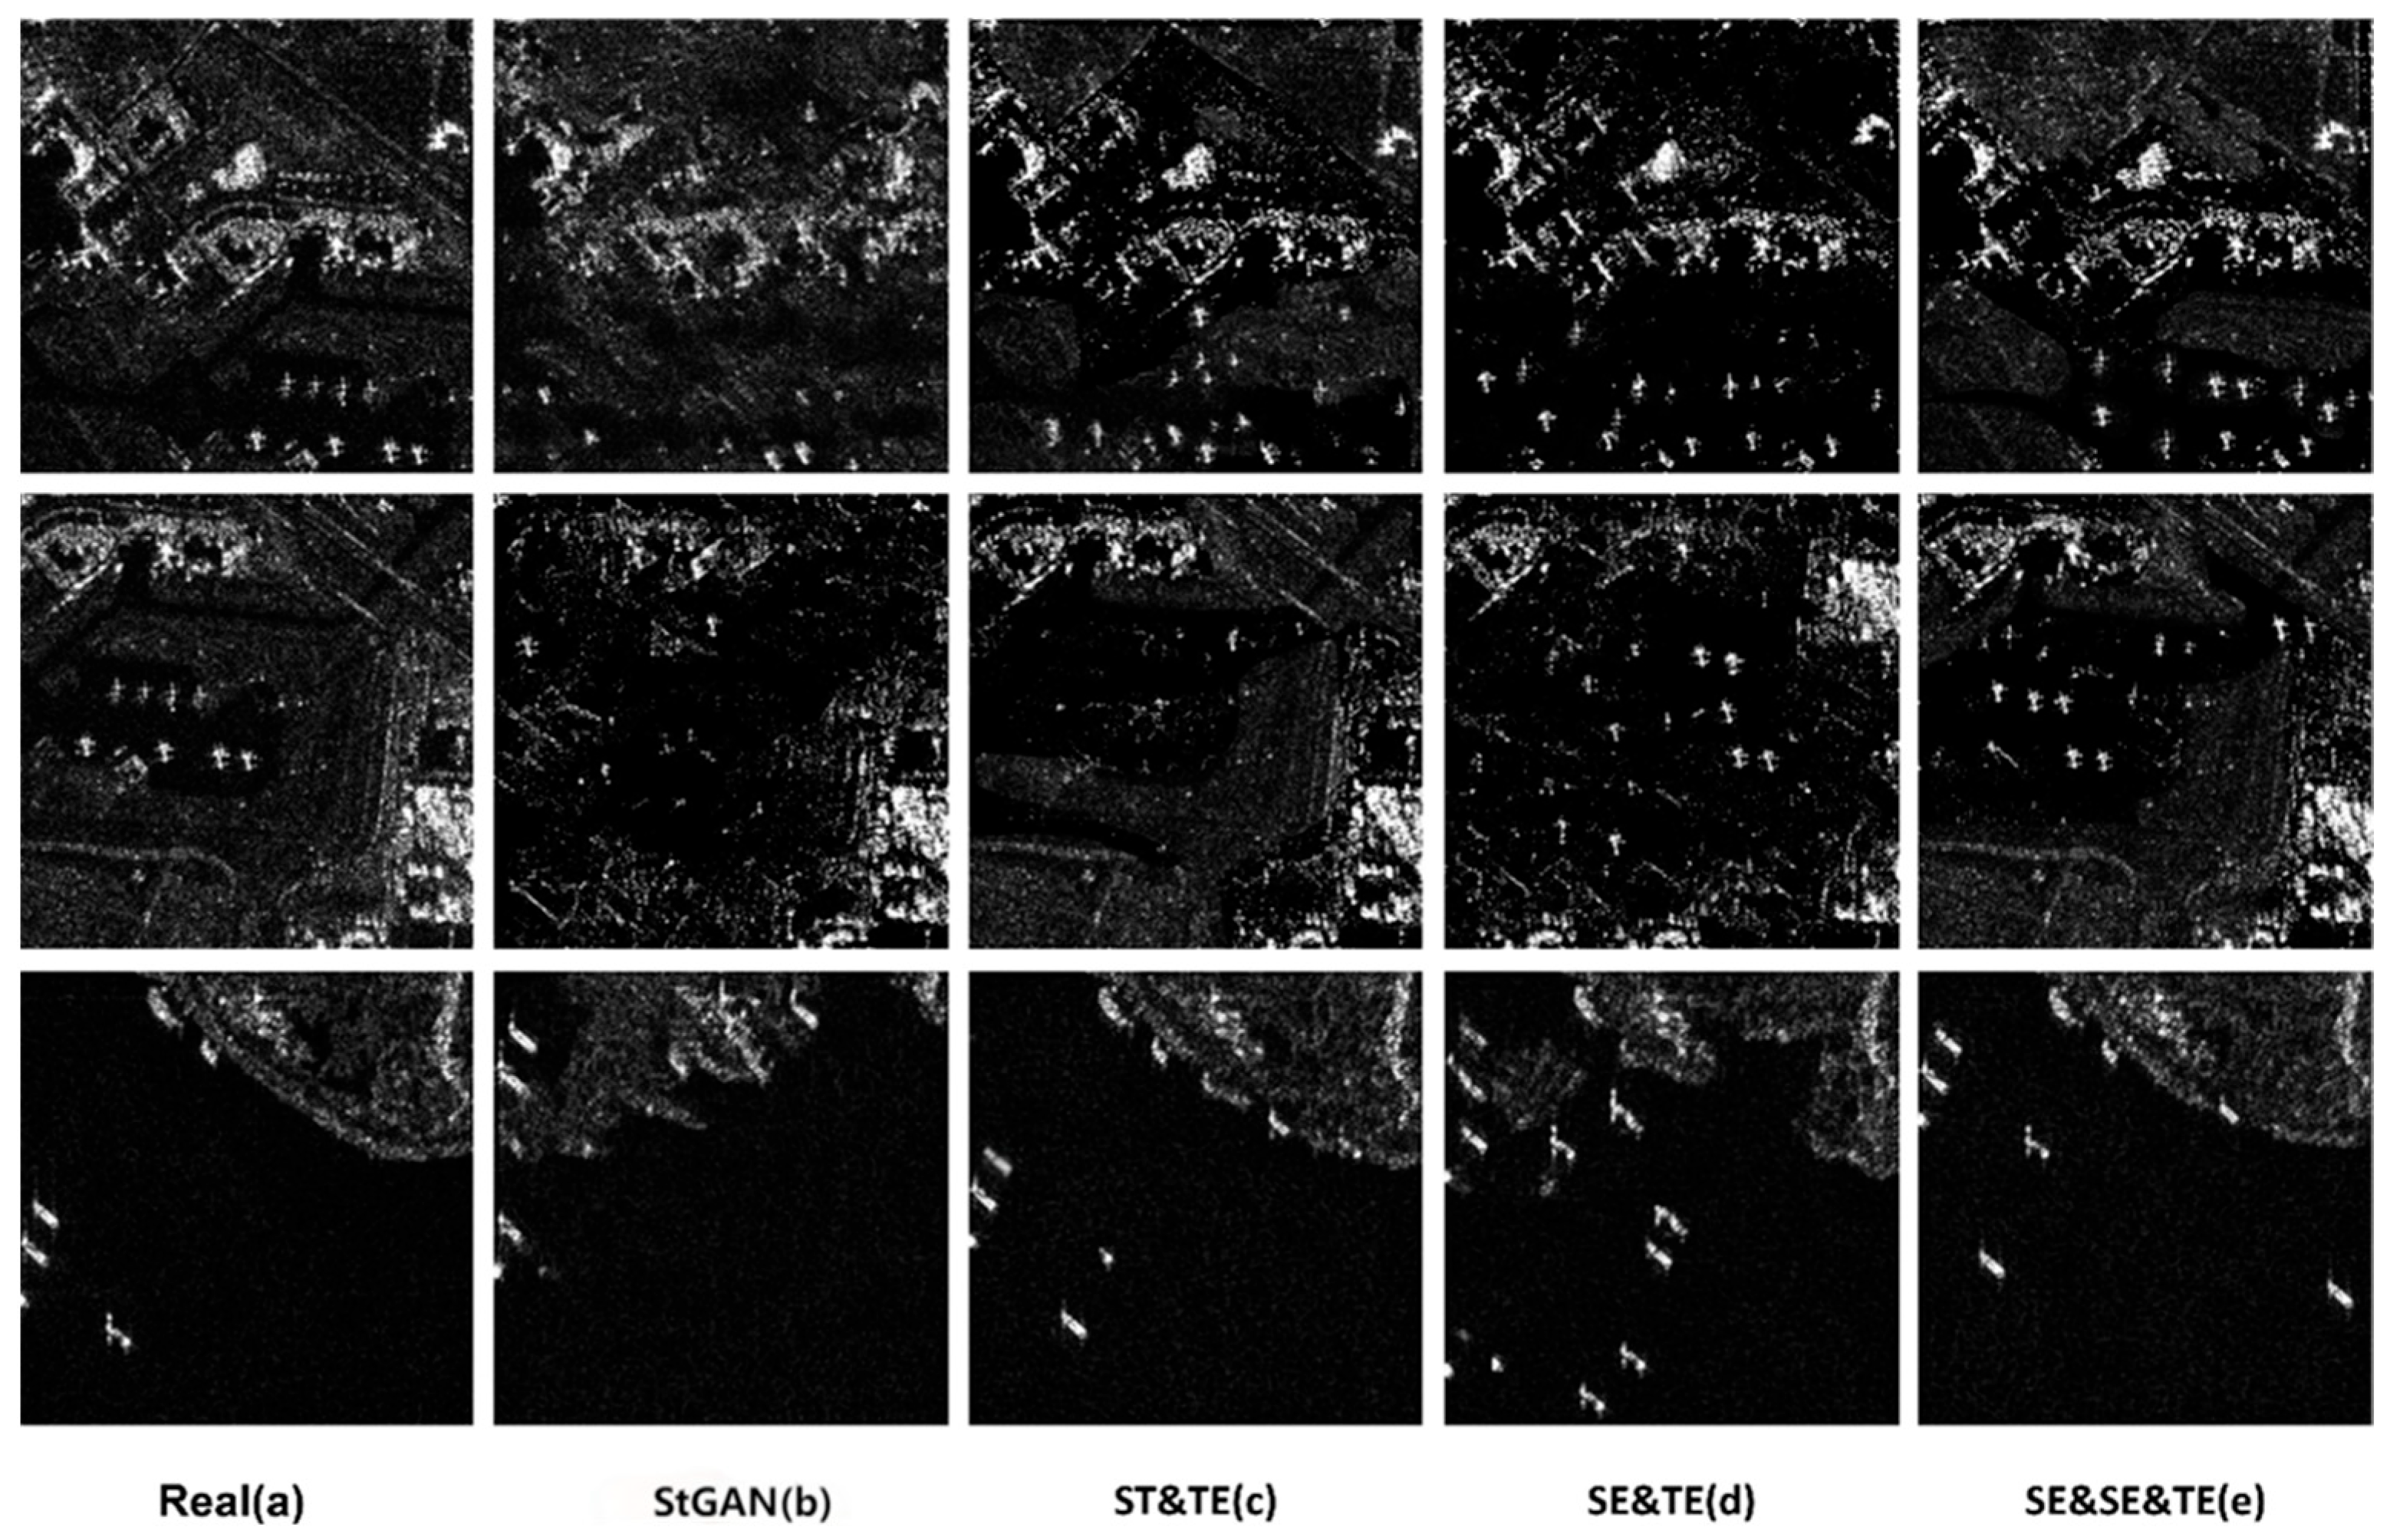
4.2.1. Ablation Study of the Modularized GANs

Table 1 and Table 2 present the qualitative assessments of incorporating the modularized GANs, while Figure 7 and Figure 8 presents examples of the generation results. For simplicity, we refer to the structural, texture, and semantic GANs as StGAN, TeGAN, and SeGAN, respectively.
StGAN Table 1 demonstrates that the model incorporating the StGAN exhibits superior SSIM metric data. Figure 7c,e exhibits how integrating the StGAN into models leads to results with clearer spatial layouts and realistic details, such as runways and coastlines. Moreover, a reduction in SIFID metrics is observed in comparison to the models without the StGAN.
Figure 8 demonstrates how the integration of TeGAN and StGAN modules significantly augments recognizability when compared to the vanilla StGAN. Furthermore, improvements in diversity can be assessed, as the StGAN facilitates learning of the coherent layouts and discrimination between the targets and backgrounds, thereby enhancing image quality.
SeGAN Table 1 also demonstrates how the inclusion of the SeGAN module (referenced in the third and fourth columns) leads to superior SIFID metrics, indicating enhanced image quality and a more accurate approximation of the real SAR distributions. As illustrated in Figure 7d,e, incorporating the Semantic GAN leads to the generation of clearer and more complete objects. Additionally, Figure 7d,e illustrates that the aircraft and ships exhibit greater completeness and variability in both quantity and positioning, when compared to those in Figure 7b,c.
Figure 8 illustrates that although the model employing SeGAN exhibits lower recognizability compared to its StGAN counterpart, it increases generalization capabilities and diversifies the results. Furthermore, the SeGAN model is characterized by a more centralized sample distribution, indicating that the enrichment of image semantics also increases the stability of the model.
To conclude, this ablation study demonstrates the efficacy of the three modularized GANs (i.e., the StGAN, SeGAN and TeGAN). In particular, both visual results and the SIFID and SSIM metrics exhibit the significant impact of StGAN on the acquisition of spatial layout and structural information. It facilitates the synthesis of backgrounds with consistent structural patterns. Furthermore, within the diversity–recognizability framework, StGAN significantly improves the recognizability of generated images, as it facilitates discrimination between the background and target boundaries.
The SeGAN module facilitates the learning of deep features, leads to a reduction in the SIFID, and leads to a closer approximation of the real SAR image distribution. This aids in the generation of more complete and diverse target outputs. The integration of the three different GAN modules enhances interpretability and augments the fidelity of the generated images.

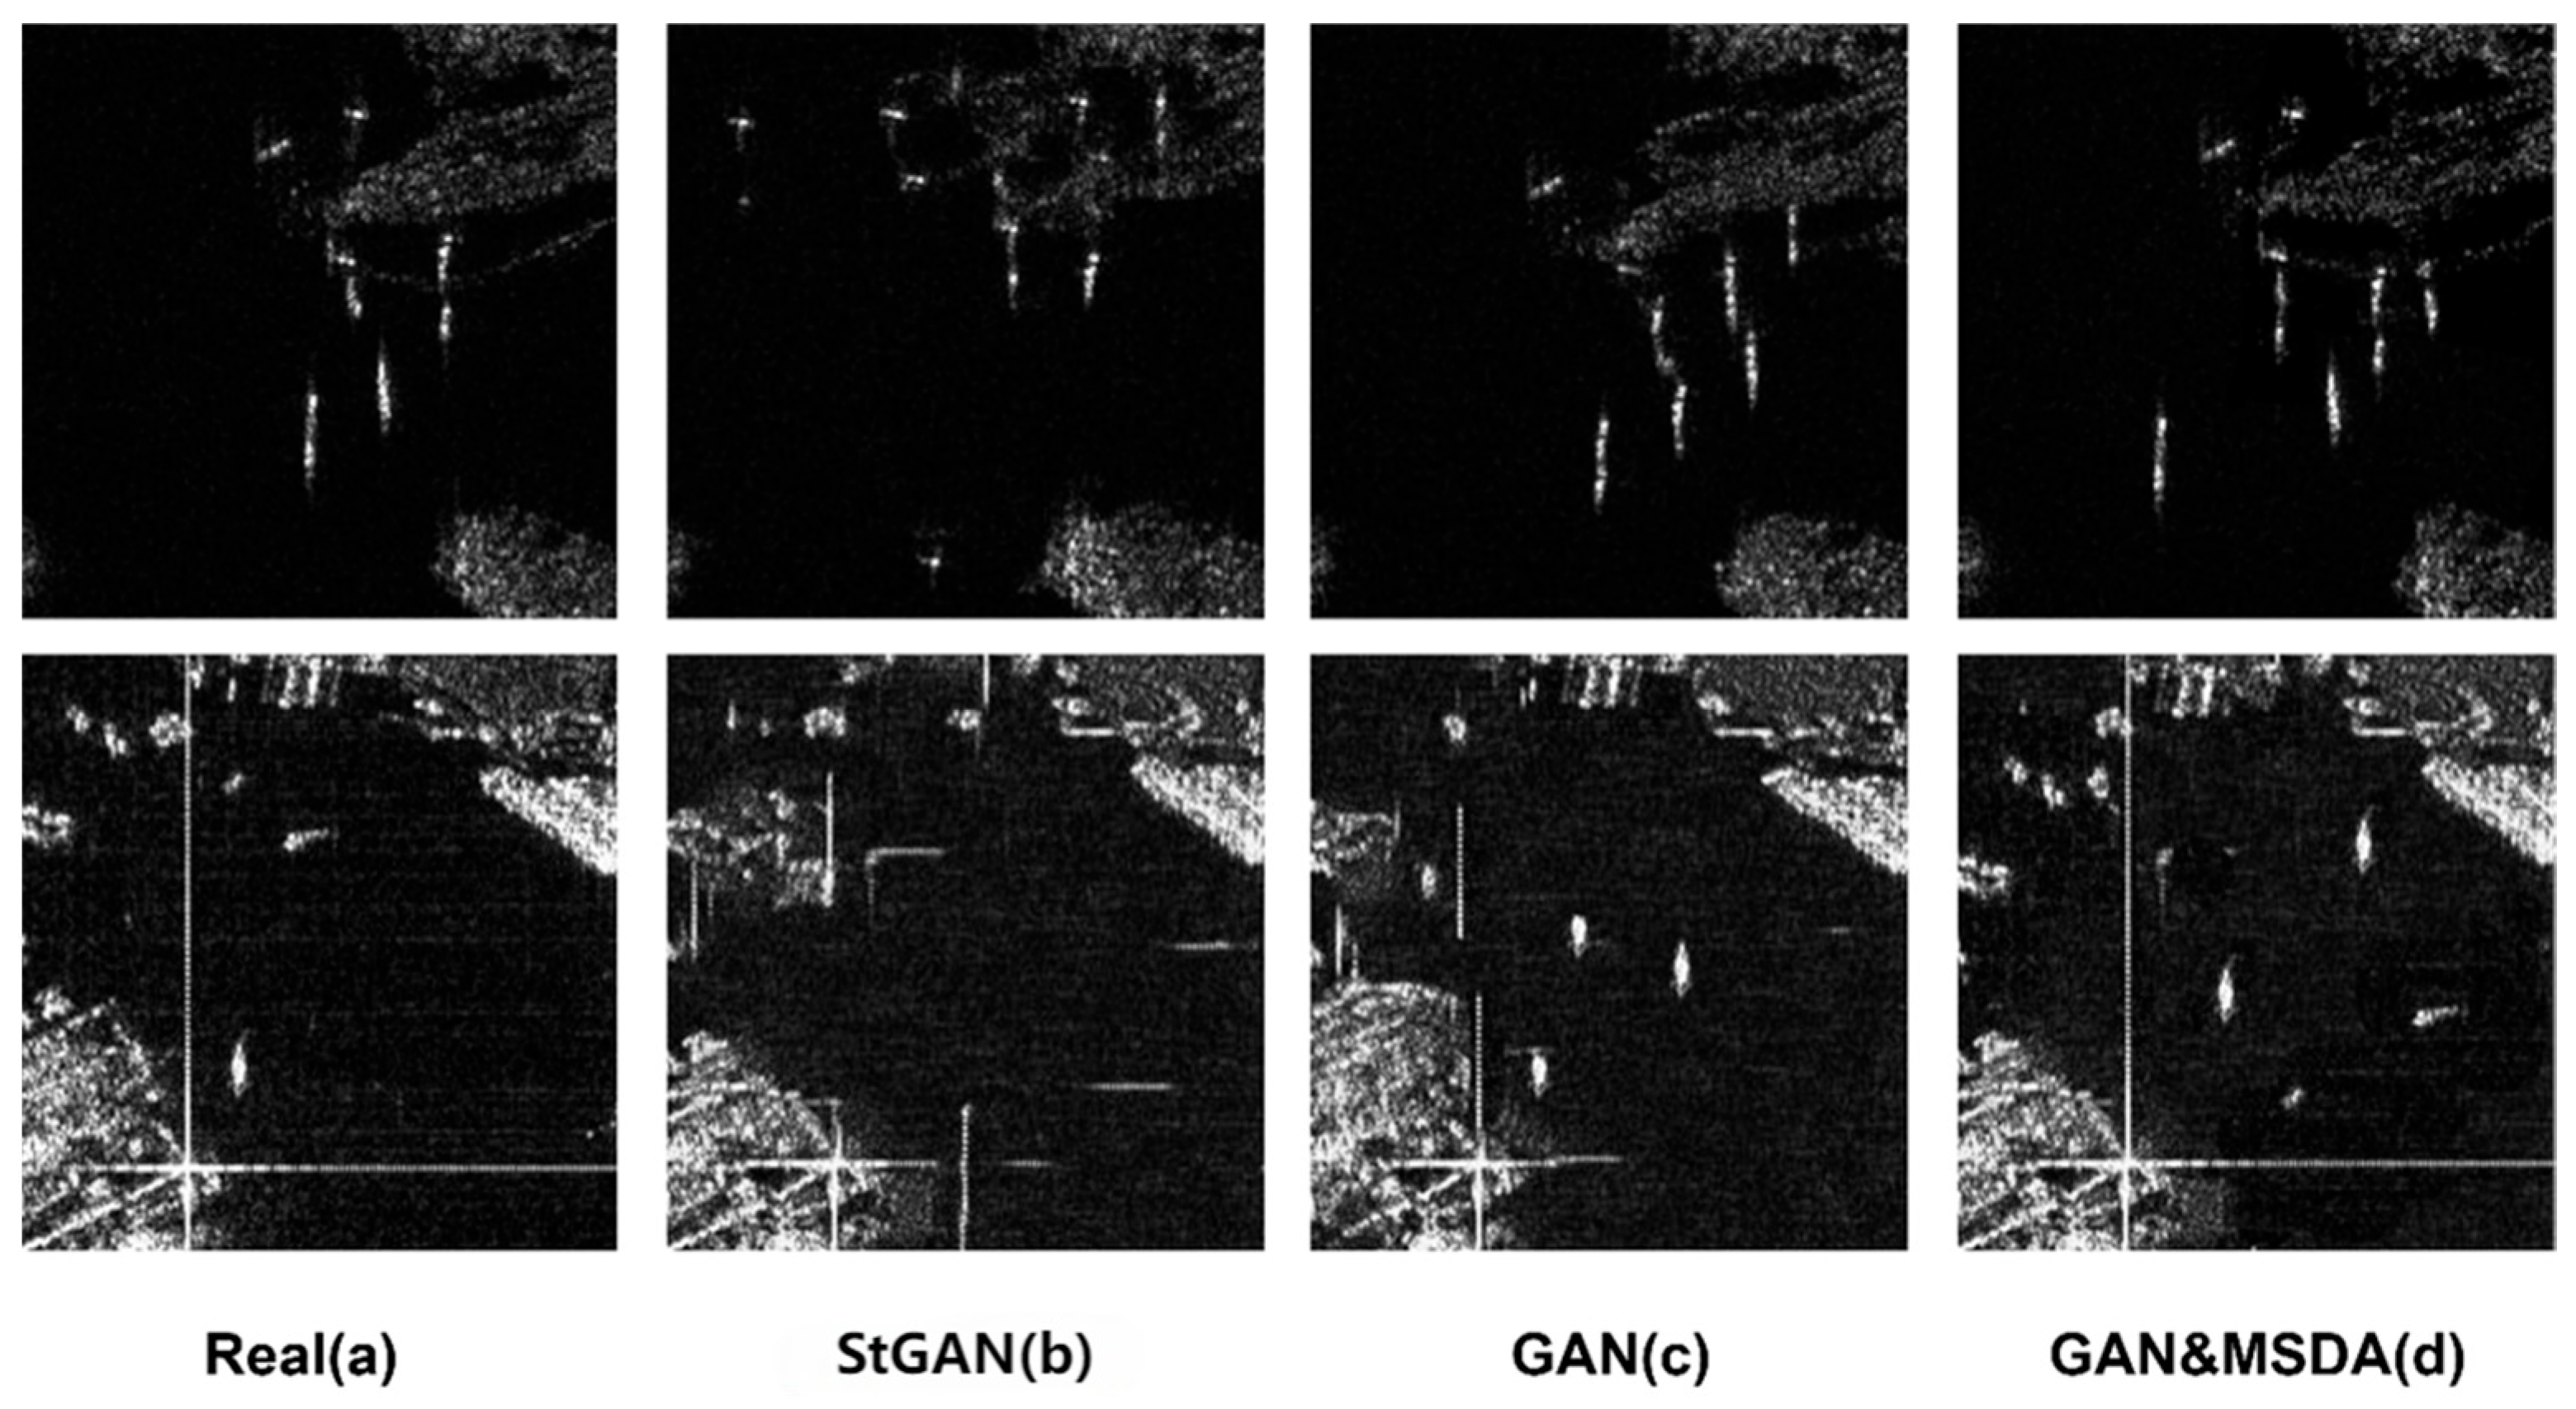
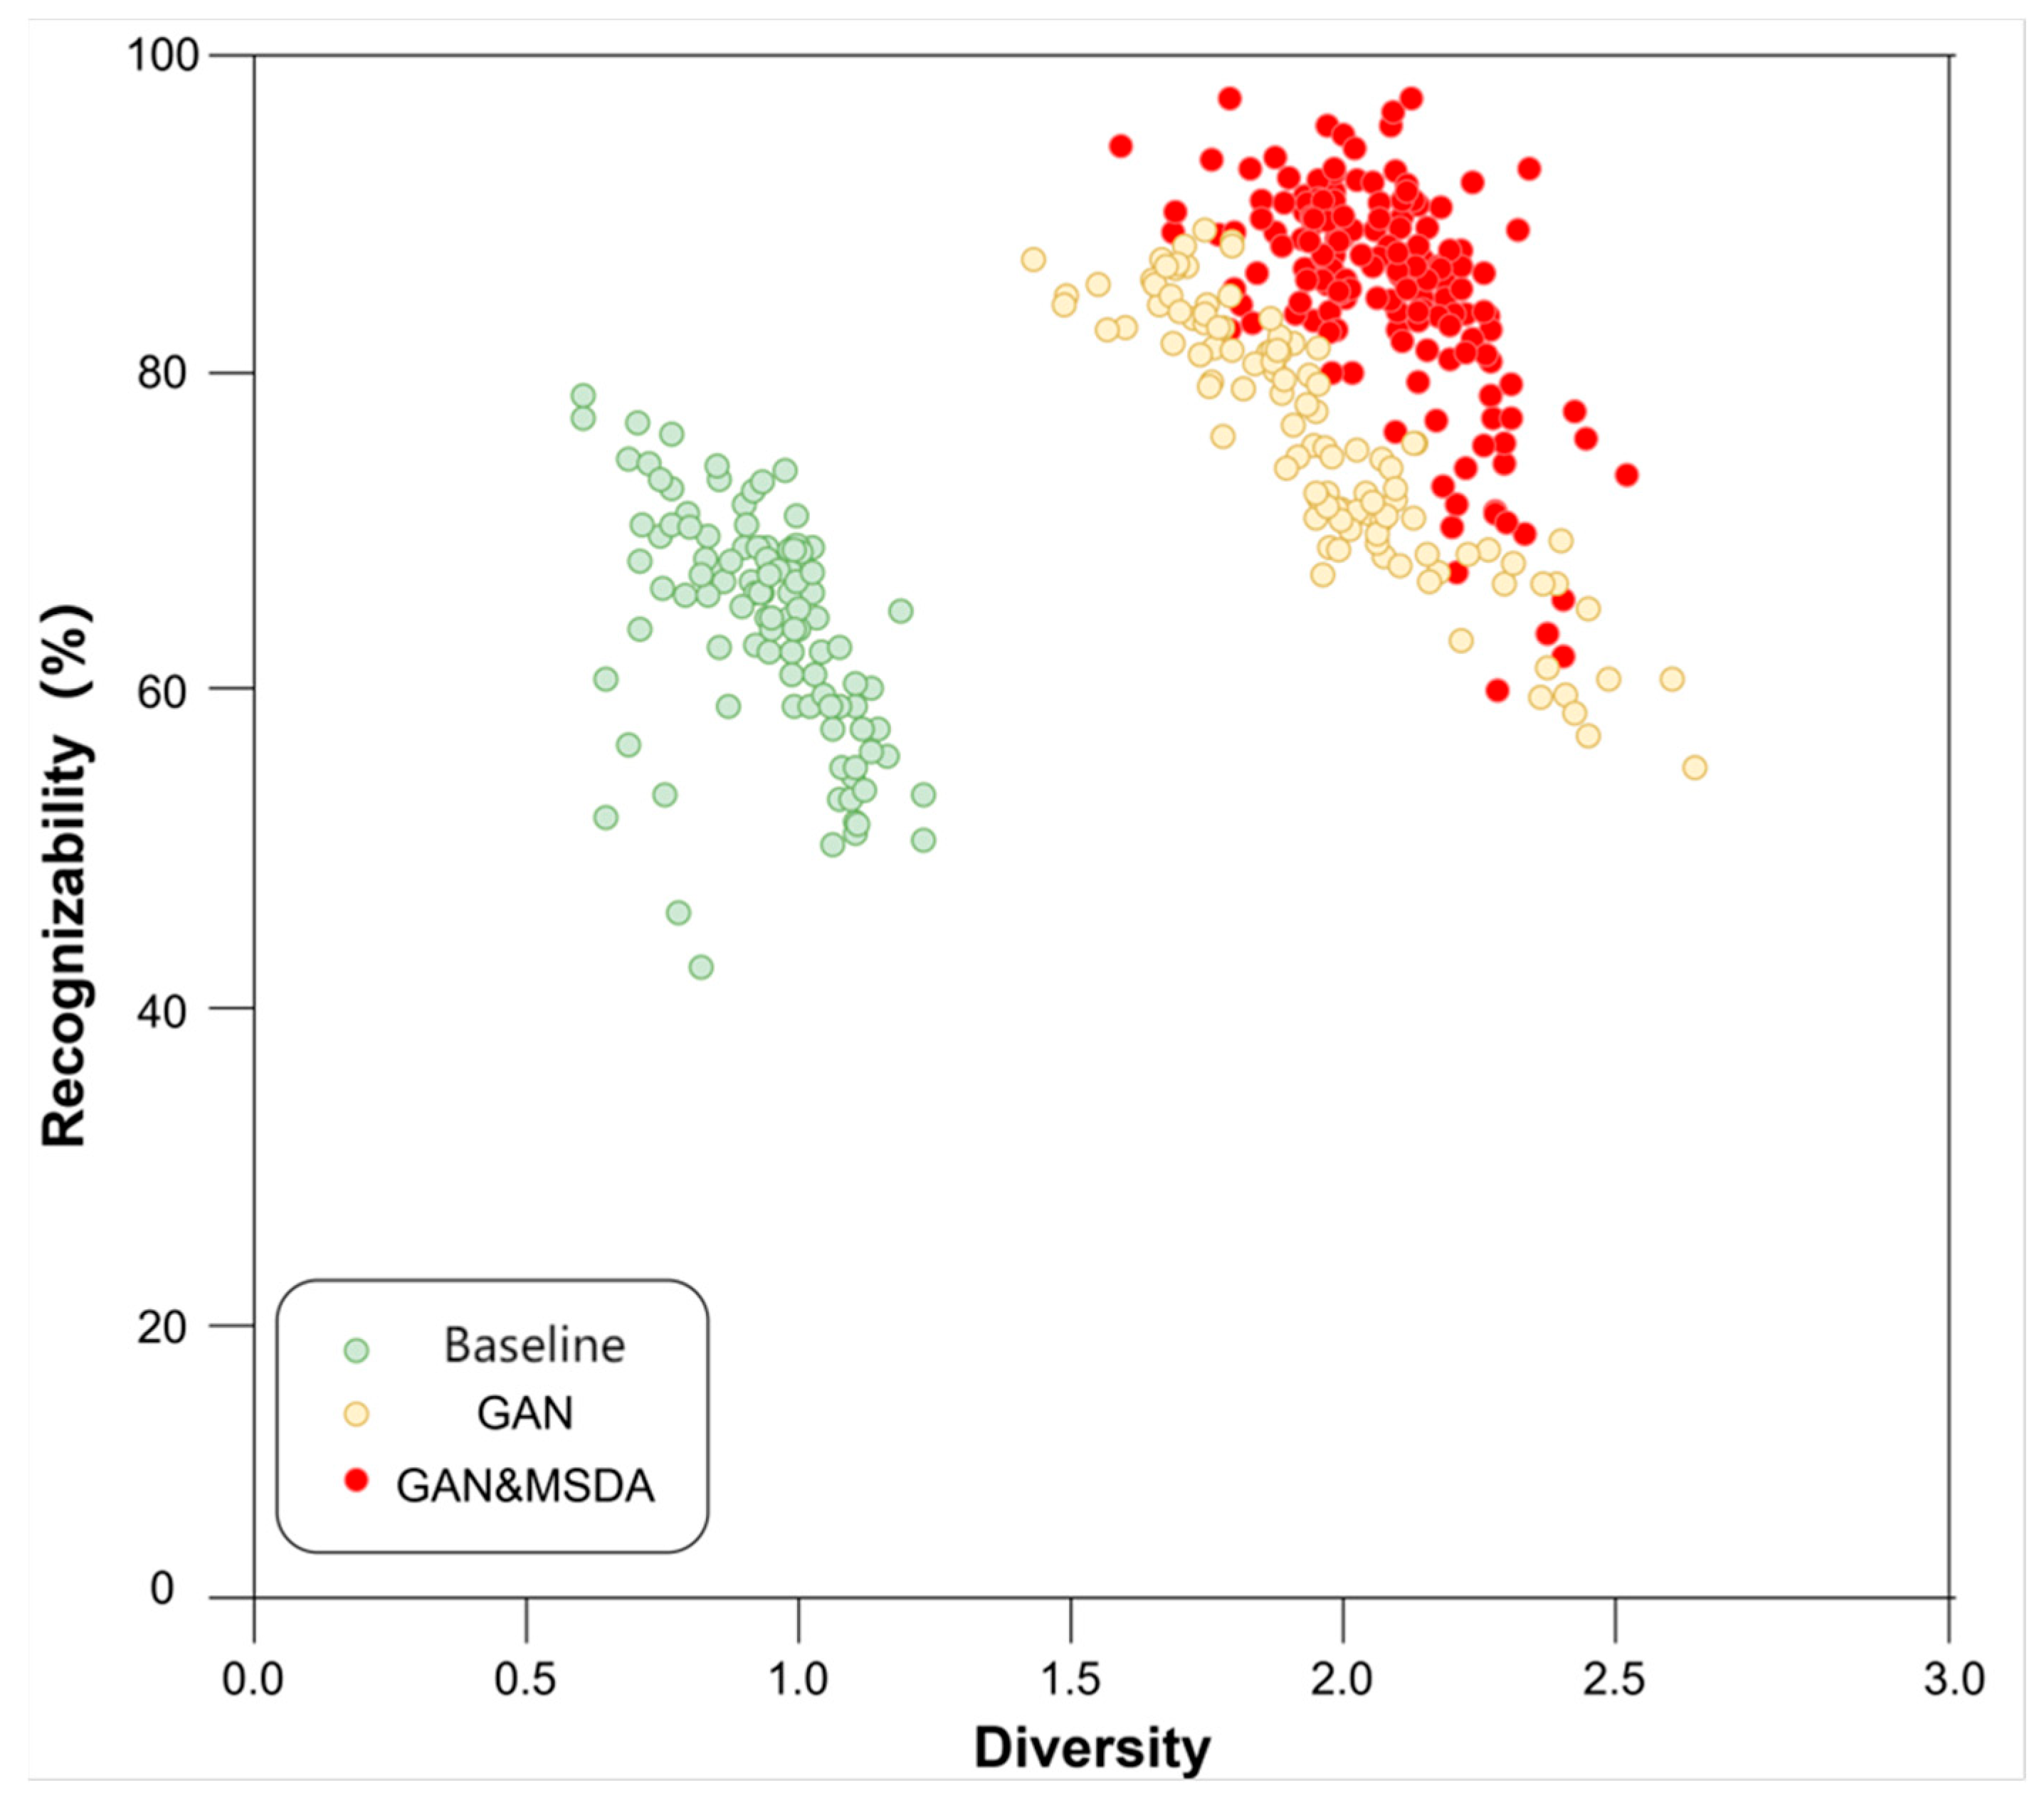
4.2.2. Ablation Study of the MSDA Modules

Table 2 presents a comparative analysis of the original progressive network and the results of the proposed method with and without the use of the MSDA modules. For each method, 70 synthetic samples were generated to measure their distribution differences and structural similarities. One can observe that the method with MSDA embeddings exhibited superior SIFID and SSIM metrics, signifying enhanced generalization capabilities and a closer approximation of the authentic SAR distributions.
Furthermore, as illustrated in Figure 9, the MSDA module leads to generation results with enhanced feature resolution. In the first row of Figure 9, the objects are more extensively distributed and exhibit superior detail (e.g., flight trajectories), thereby achieving better consistency with the authentic images. Additionally, the MSDA module partially mitigates the presence of artifacts. In the second row of Figure 9, one can observe that the model with the MSDA module is capable of learning more complete scattering features. Figure 10 illustrates the comparative performance of the three methods within the diversity–recognizability framework. The image distributions produced by the proposed method, irrespective of the presence of the MSDA module, exhibit a negligible variance. Nonetheless, the incorporation of the MSDA module enhances recognizability at an equivalent level of diversity.

4.2.3. Sensitivity Analysis of the Weighting Parameters

Since the proposed approach is a composite system comprising three modularized GANs, multiple weight functions are leveraged for joint training of the generative system. As depicted in Equations (4), (6) and (8), α 1 , α 2 , α 3 , and λ are the crucial weighting parameters to balance the multi-scale structural similarity loss ( L MS SSIM ), the L1 mixed loss ( L l 1 ), the reconstruction loss function L rec   and the diversity loss L p , respectively. In Table 3, we provide an ablation on the quantitative results related to the different values of the weighting parameters. While evaluating each parameter, the results are achieved by setting the other parameters with the same values. In experiments, we found that α 3 (weight of L rec   ) should be assigned relatively higher values to ensure convergence. The SSIM metrics are significantly influenced by fluctuations in α 1 and α 2 (weights of L MS SSIM and L l 1 ), while λ has stronger impacts on the SIFID metrics. After an exploratory search, we found that { α 1 = 0.1, α 2 = 0.1, α 3 = 10, λ = 0.1} is an optimal set of values, thus we adopted this setting consistently across other experiments.

4.3. Comparative Experiments

We further compared the proposed method with several state-of-the-art (SOTA) methods including the SinGAN [29], EXSinGAN [35], InGAN [28], and HP-VAEGAN [32]. The evaluation was comprehensively conducted in four dimensions: qualitative comparisons of the generated image samples, quantitative comparisons of the results, visualizations of diversity vs. recognizability, and human evaluations. To examine generalization across different image scales, the experiments were conducted at three different sizes of images including 256 × 256, 400 × 400, and 800 × 800. The images of 200 × 200 and 400 × 400 pixels were captured utilizing a C-band, single-polarization SAR radar with a spatial resolution of 3 m. In contrast, the images with 800 × 800 pixels were also obtained with the same SAR system, but with an enhanced resolution of 1 m.

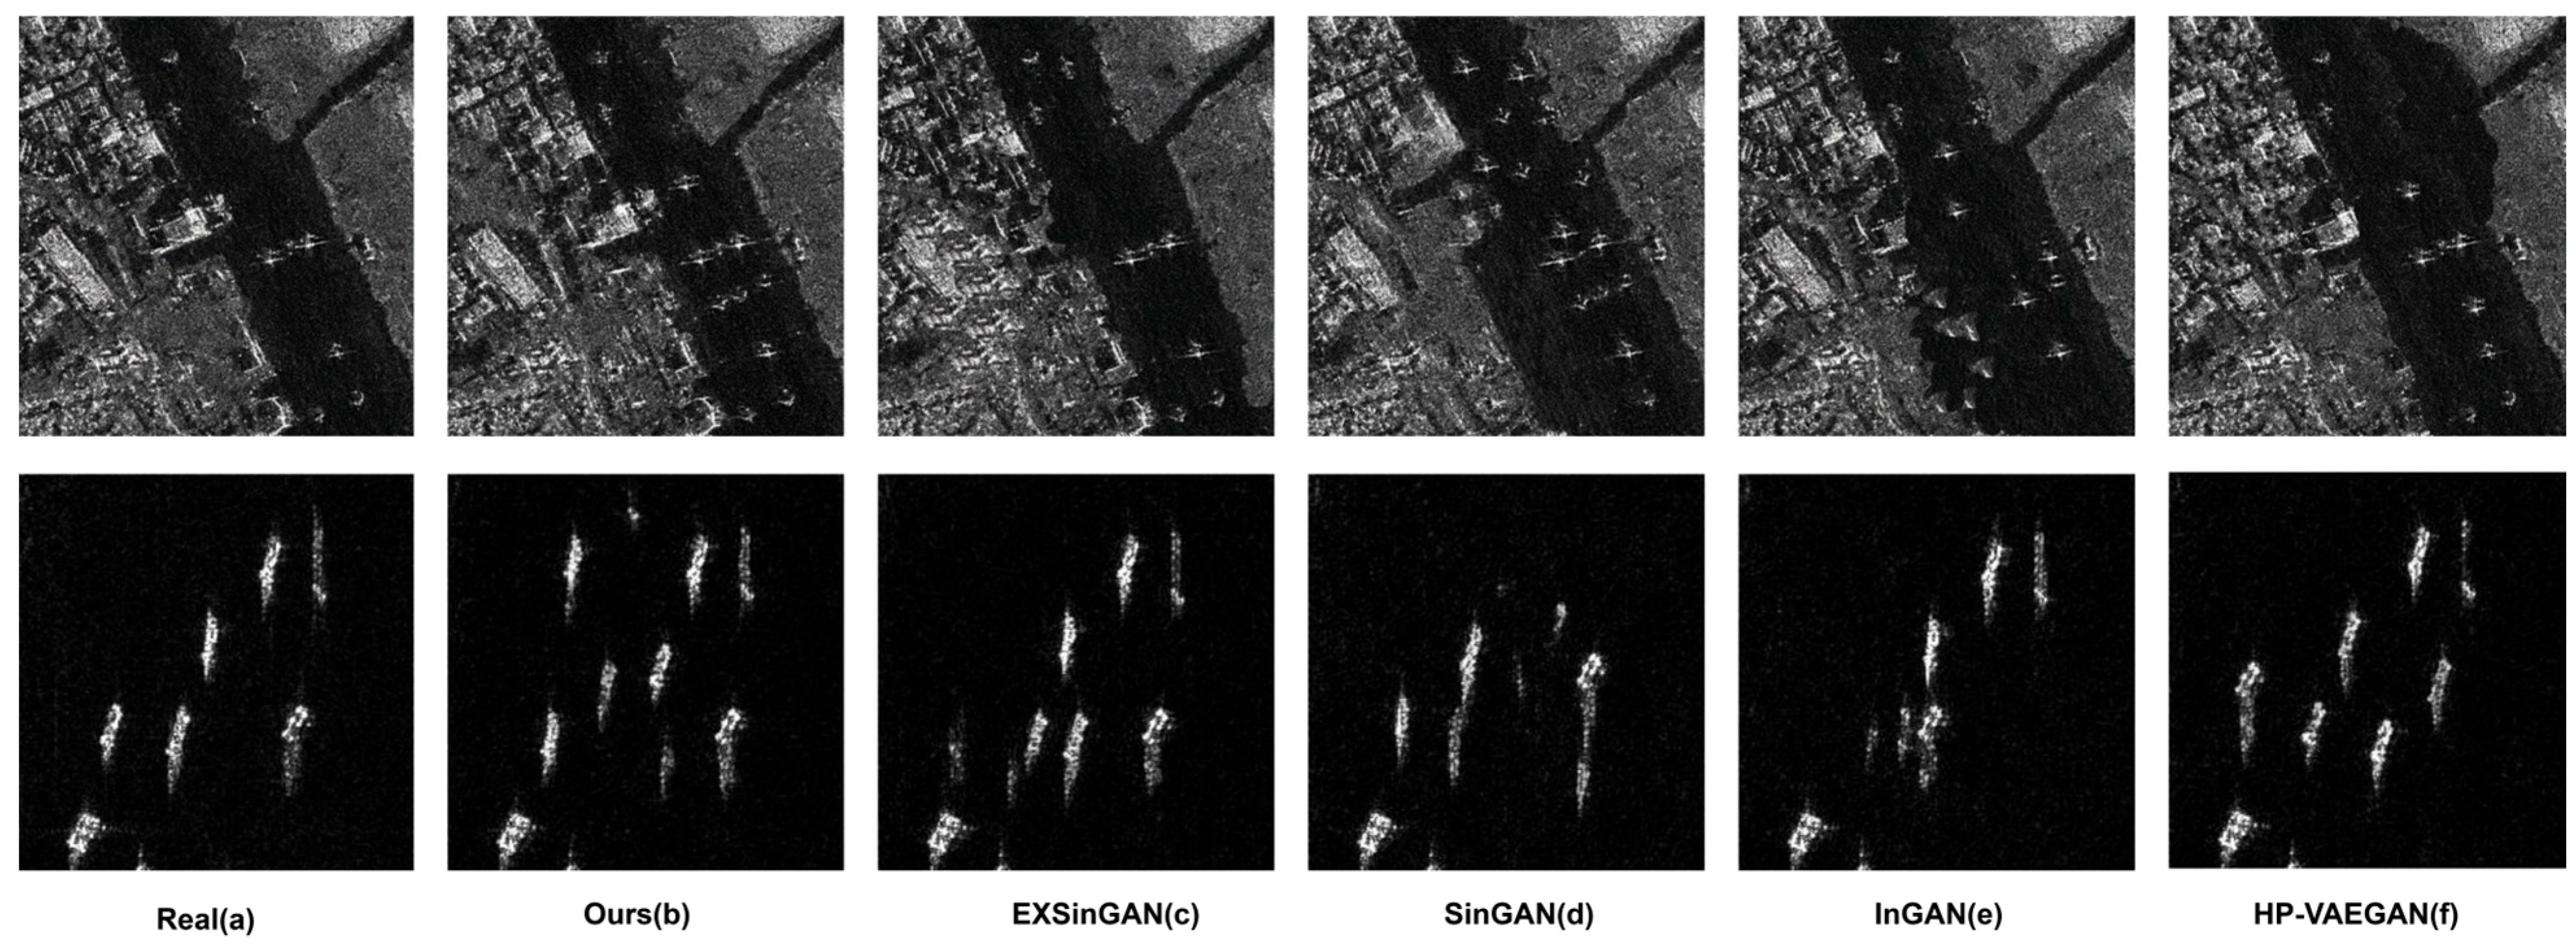
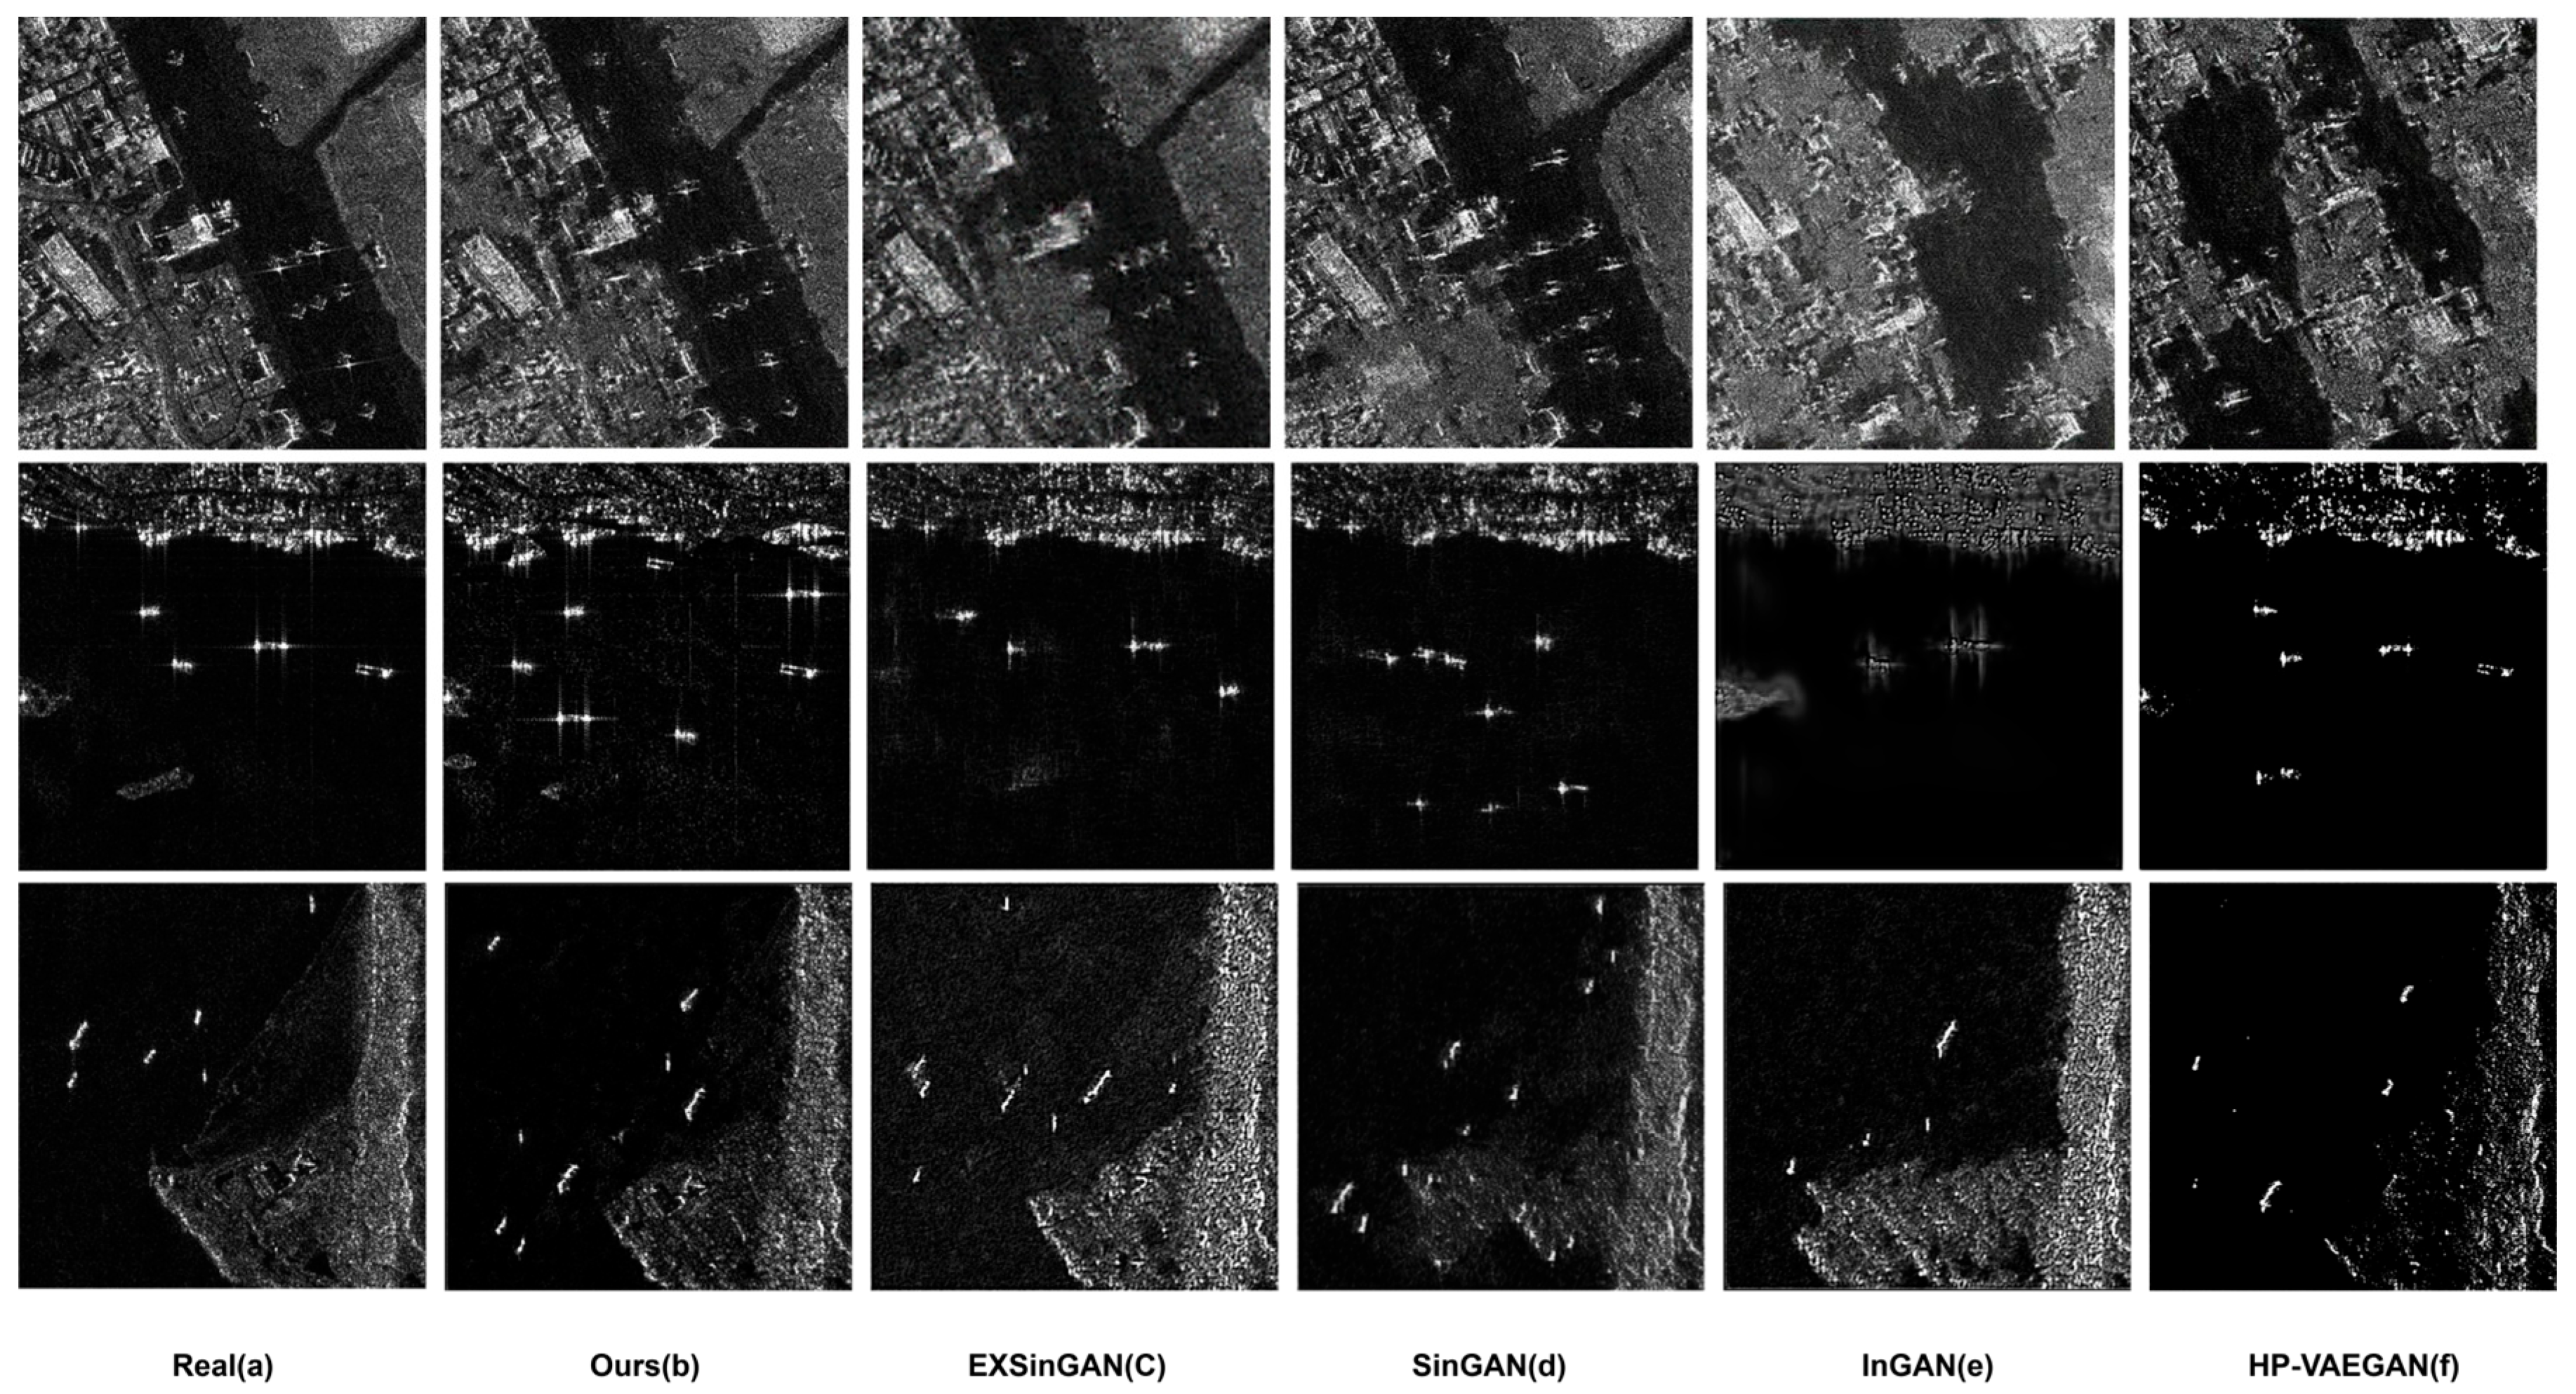
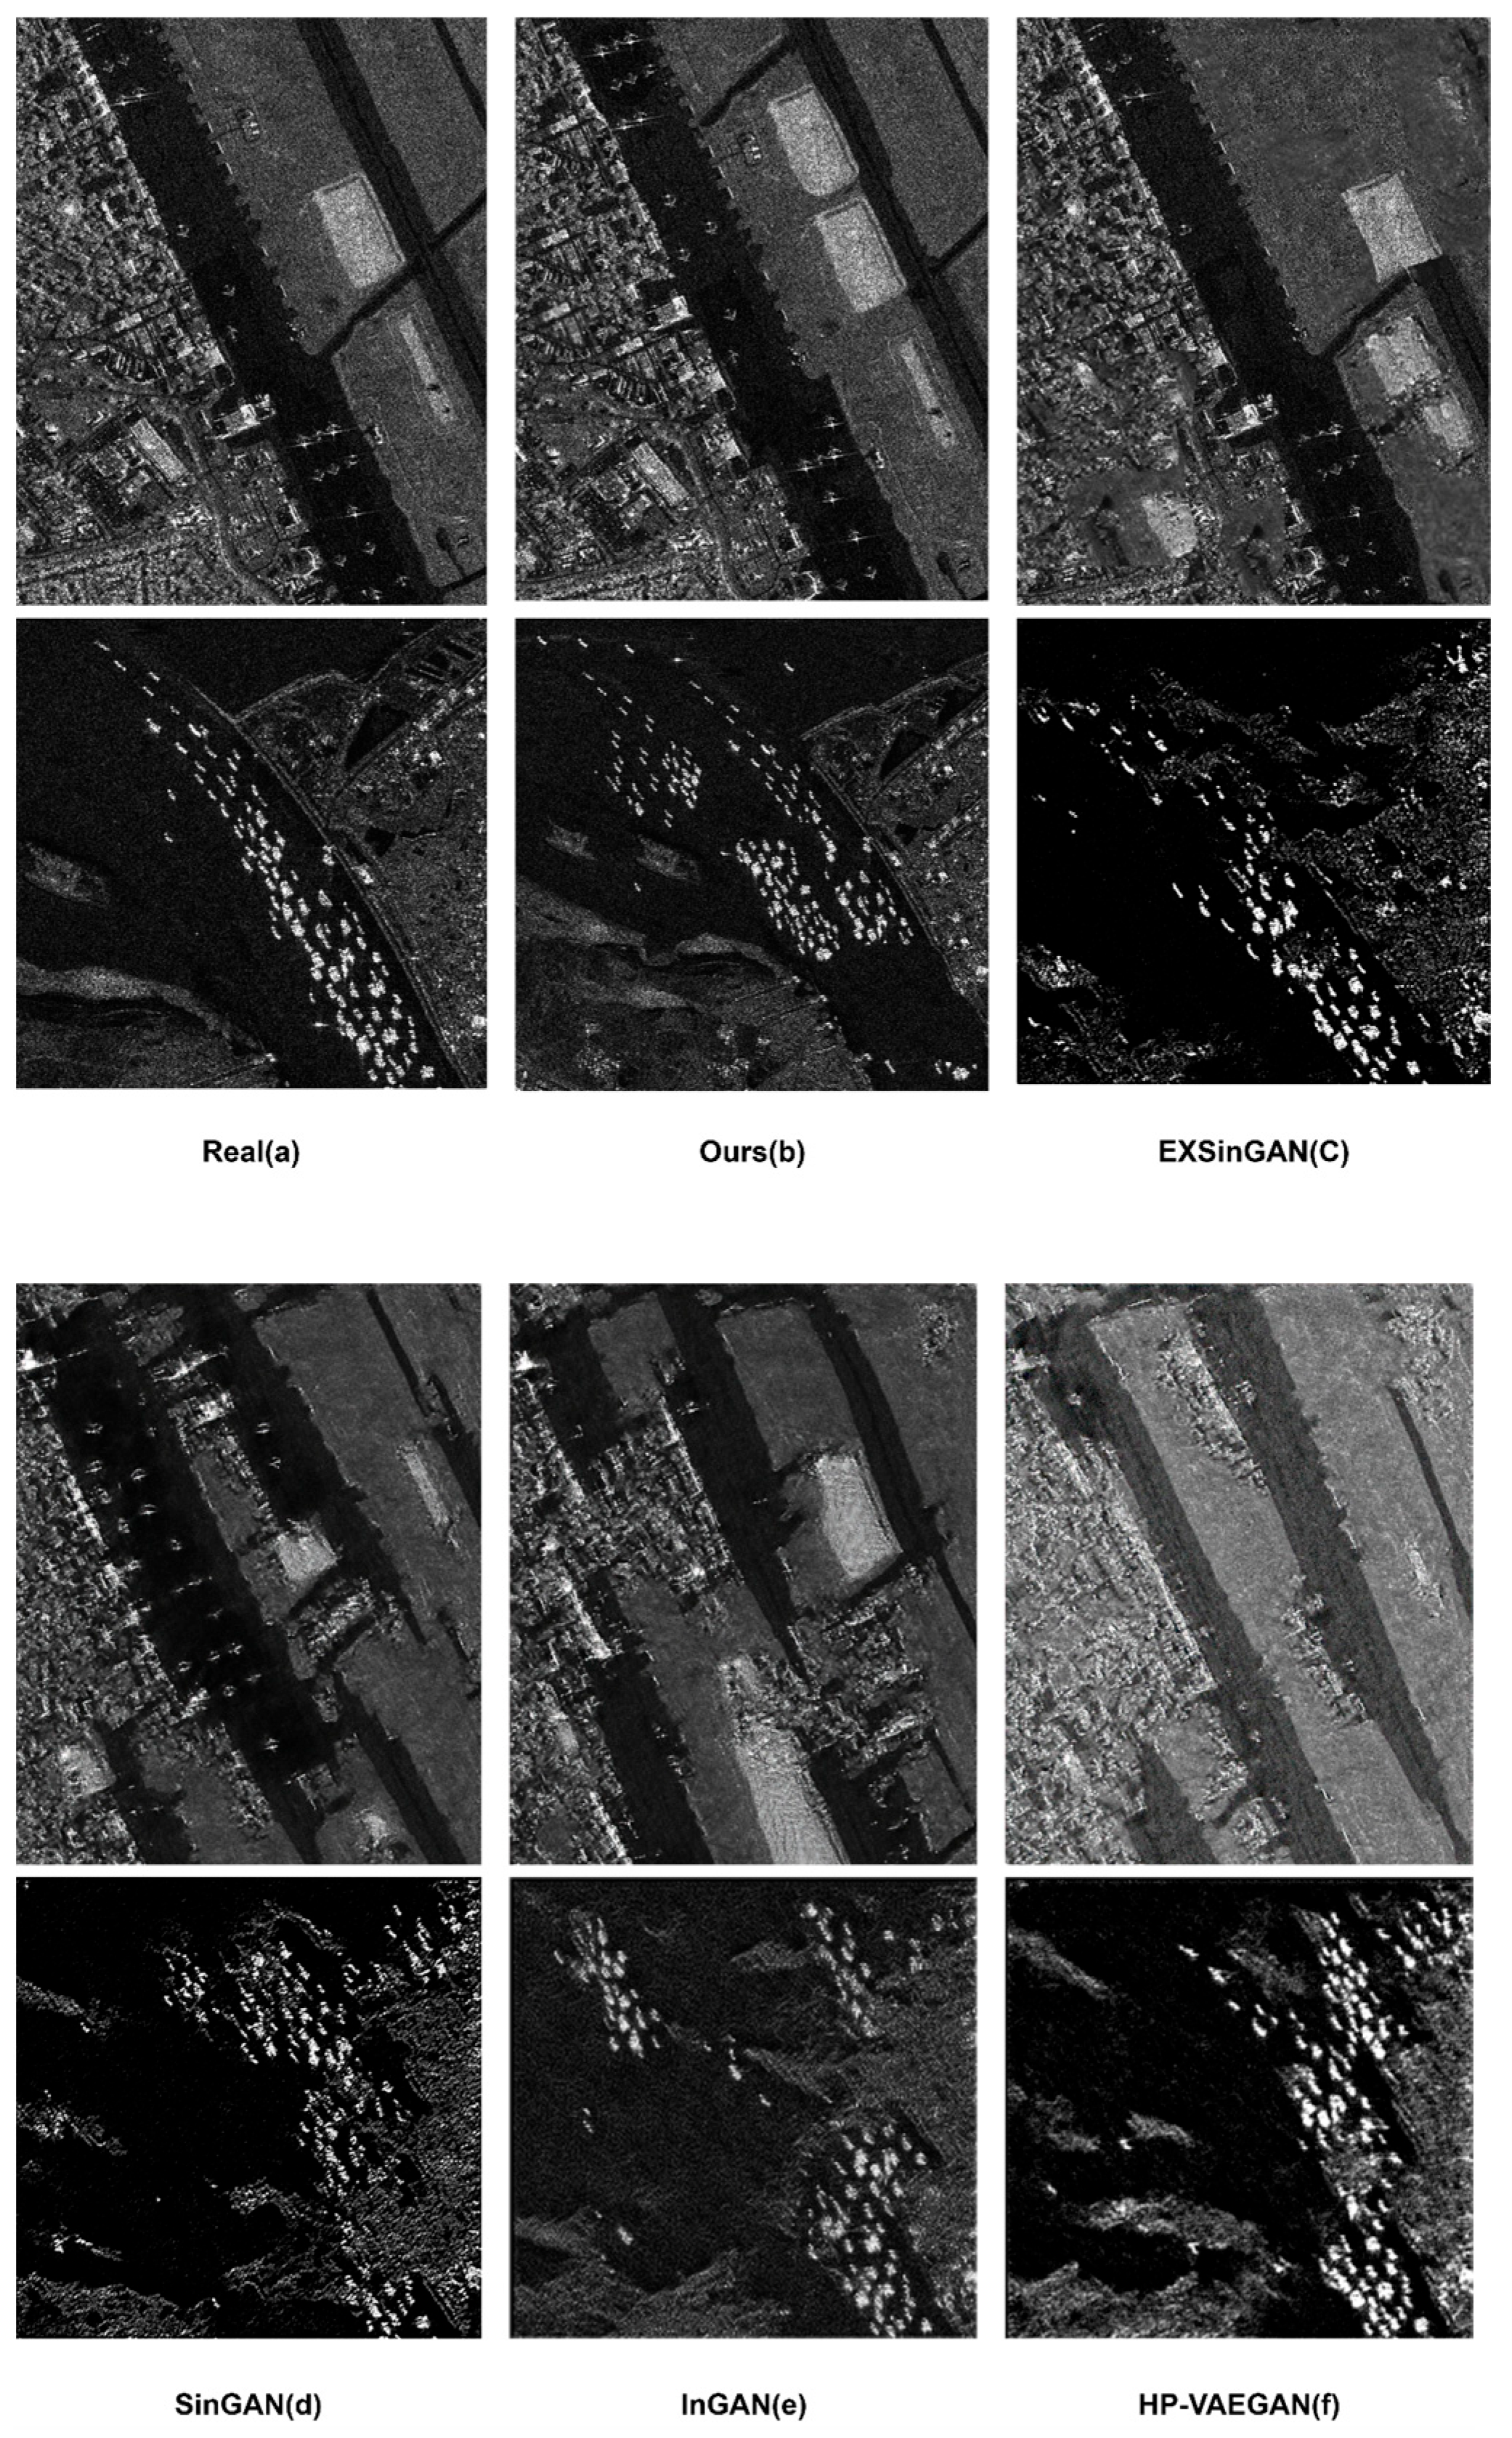
4.3.1. Qualitative Evaluation of Generated Images

The qualitative results randomly generated by the different methods are presented in Figure 11, Figure 12 and Figure 13. They correspond to the image resolutions of 256 × 256, 400 × 400, and 800 × 800 pixels, respectively. Figure 11 exhibits the sample results of the airport and coastline scenes. One can observe that the proposed model leads to synthesized results with a clearer spatial layout and semantic structures. Nevertheless, the advantages of the proposed method over the EXSinGAN and SinGAN are not significant due to the limited image size.
In Figure 12 and Figure 13, with increased image sizes, one can observe that the proposed method not only synthesizes novel target structures but also preserves background details well. Compared to the EXSinGAN, another progressive GAN method, the proposed method produced more complete and diverse target structures. Notably, there is a significant increase in the quantity of ship targets, with their appearances closely resembling those of the authentic samples. This can be attributed to the introduced SeGAN, which encourages diversity and authenticity in the generated samples.
In comparison to SinGAN, the proposed method produced results characterized by a more coherent and realistic background layout. As image size and complexity increase, the InGAN and HP-VAEGAN tend to generate hard-to-interpret images with incomplete target structures. In particular, the results of the InGAN and HP-VAEGAN are, to certain extent, blurred in the high-resolution images, whereas the SinGAN and ExSinGAN are found to omit certain spatial details. In contrast, the proposed method excels at preserving both the spatial layout and textural attributes, owing to the incorporation of the StGAN and TeGAN. The comparative analysis of these results underscores the generative advantages of the proposed method.

4.3.2. Quantitative Evaluation of Generated Images

Due to the limited research of models based on single-image generation, evaluating these models poses a challenging issue. In this paper, we employ three evaluation methods. First, we use the SIFID method proposed by SinGAN to compare the distribution of original SAR images with the distribution of synthetic images extracted using a pre-trained Inception Network [59]. Second, the classic SSIM [60] is used to calculate the structural differences between the generated images and real images. Finally, we adopt an evaluation framework from the perspectives of diversity and recognizability. These comprehensive evaluations provide a thorough assessment of the generated images.
Table 4 presents the experimental results obtained by the evaluated methods at varying spatial resolutions. This examines the generalization and robustness of the compared methods. The results indicate that the proposed method achieves noticeable improvements over the literature methods in terms of SSIM and SIFID metrics. Notably, as image size increases, the proposed method exhibits a superior image generation capability in comparison to the EXSinGAN and SinGAN. In contrast to the other two non-progressive learning GANs, the proposed method exhibits pronounced advantages across diverse image resolutions.
In particular, it is noteworthy that the conventional GANs, including the InGAN and HP-VAEGAN, exhibit suboptimal performance when applied to large-size images. In contrast, approaches utilizing progressive learning architectures, such as the SinGAN and ExSinGAN, effectively mitigate such performance degradation. This indicates that the hierarchical architecture adopted in the proposed method facilitates profound learning about the image distributions, and enables the generation of multi-scale spatial and semantic patterns. This is of great significance for SAR image generation and is consistent with the goal of this study. By integrating regularization techniques, including GAN Inversion and perceptual loss, into the progressive architecture, the proposed method gains improvements in both fidelity and robustness.
We further expand an analysis of the computational resources in Table 5. The parameters and FLOPS (Floating-point Operations Per Second) are utilized to assess the computational costs of each algorithm. These metrics are calculated with an input image with the spatial size of 800 × 800 pixels. Overall, the proposed method consumes more computational resources than the other literature methods, as it employs multiple GANs at different levels. Among the literature methods, the InGAN and HP-VAEGAN are relatively more efficient. Notably, the differences in terms of FLOPS and training time among the compared methods are not markedly significant.
In Figure 14, the diversity vs. recognizability characteristics of the comparative methods are analyzed. Figure 14a presents the results at a spatial resolution of 200 × 200 pixels. It is evidenced that the proposed method, in contrast to the other compared methods, obtains stable recognizability while preserving high diversity. Even though both the proposed method and EXSinGAN lead to a close level of recognizability, our method excels at preserving diversity. In contrast to the SinGAN, the proposed method exhibits stronger recognizability. Additionally, the relative compact distribution pattern of the proposed method exhibits its superior generalization and stability.
Figure 14b,c displays the visualization results at higher spatial dimensions. As the scale increases, the proposed method consistently maintains superior performance relative to the compared models. Although the distribution area associated with the proposed method expands considerably with the increases in image size, its distribution performance remains stable. Specifically, at the scale of 400 × 400, the proposed method exhibits a significant advantage in diversity when compared to comparable methods. This advantage is more pronounced at the scale of 800 × 800. Compared to the SinGAN, InGAN, and HP-VAEGAN, the proposed method sustains a more consistent distribution spectrum and exhibits superior performance in terms of recognizability and diversity across various image sizes.
In summary, the proposed method exhibits superior performance in progressive image generation, particularly when addressing the challenges of large-scale image generation. This highlights the superiority of progressive generation frameworks in handling such demanding tasks.

4.3.3. Human Assessment

To provide a more comprehensive evaluation, we conducted a user study to assess the authenticity and diversity of the images generated by the compared methods. At the spatial resolution of 400 × 400 and 800 × 800, each method generated 50 samples for comparison. The generation results of each sample formed a group. The participants were asked to select the most realistic/diverse synthetic samples within each group.
In greater detail, we collected voting data from a total of 100 participants, with 50 of them possessing expertise in ATR with SAR images. Notably, no labels were assigned to indicate whether a given sample image was real or synthesized. In Table 6, the statistics of the voting are presented, where ‘realism’ refers to the subjective evaluation of the authenticity perceived in the generated sample, while ‘diversity’ denotes the variance in comparison to the authentic sample. One can observe that the majority of participants voted for the proposed method in both realism and diversity. This demonstrates its superior performance in visual quality.
Although the ExSinGAN and SinGAN both adopt a progressive learning strategy, their intrinsic constraints lead to difficulty in producing high-quality SAR images. Additionally, the extensive use of residual networks in these models introduces many artifacts. This can be easily perceived by humans. Furthermore, the proposed method demonstrates a strong robustness against spatial variations. These experimental findings highlight the significant advantages of the proposed single-sample SAR image generation method.

5. Conclusions

In this study, we investigate the single-sample image generation of SAR images, and propose a multi-level generation framework that systematically models the image distributions in a coarse-to-fine manner. To synthesize the intrinsic distributions inherent to SAR images, three distinct GANs were derived, including the Structural GAN, the Semantic GAN, and the Texture GAN. Furthermore, multiple constraints considering the prior distribution and perceptive characteristics were imposed in training, thereby narrowing the selective space and enabling single-sample generation.
The experimental results demonstrate that the proposed method is capable of producing well-structured, intricately detailed, and remarkably diverse SAR images, and achieves strong stability across different spatial sizes. It exhibits significant advantages over the SOTA methods in different dimensions including fidelity, diversity, and generalization. Additionally, we introduce a novel evaluation framework based on diversity and recognizability. We hope that these investigations will facilitate subsequent research on single-sample image generation.
One of the remaining limitations of the proposed approach is its substantial computational costs, as it is a composite method that consists of multiple modularized GANs. Additionally, there remains much room to improve the spatial details of the generation results. More efficient exploitation of prior information may potentially improve performance, which is a subject for future investigations.

Author Contributions

Conceptualization, X.W. and B.H.; methodology, X.W. and B.H.; software, X.W.; validation, X.W., B.H. and P.G.; resources, B.H.; data curation, X.W.; writing—original draft preparation, X.W.; writing—review and editing, X.W., B.H., R.J. and L.D. All authors have read and agreed to the published version of the manuscript.

Funding

This research was partially funded by the Military Science and Technology Commission of the Communist Party Central Committee (CSTC) Foundation Strengthening Program; the grant number is JKWATR-210503.

Data Availability Statement

The data are not publicly available due to privacy.

Acknowledgments

All authors thank the editors and reviewers for their hard work and valuable advice.

Conflicts of Interest

All authors declare no conflicts of interest.

References

  1. Bhattacharjee, S.; Shanmugam, P.; Das, S. A Deep-Learning-Based Lightweight Model for Ship Localizations in SAR Images. IEEE Access 2023, 11, 94415–94427. [Google Scholar] [CrossRef]
  2. Townsend, W. An initial assessment of the performance achieved by the Seasat-1 radar altimeter. IEEE J. Ocean. Eng. 1980, 5, 80–92. [Google Scholar] [CrossRef]
  3. Wang, Y.; Jia, H.; Fu, S.; Lin, H.; Xu, F. Reinforcement Learning for SAR Target Orientation Inference with the Differentiable SAR Renderer. IEEE Trans. Geosci. Remote 2024, 62, 5216913. [Google Scholar] [CrossRef]
  4. Stofan, E.R.; Evans, D.L.; Schmullius, C.; Holt, B.; Plaut, J.J.; van Zyl, J.; Wall, S.D.; Way, J. Overview of results of Spaceborne Imaging Radar-C, X-Band Synthetic Aperture Radar (SIR-C/X-SAR). IEEE Trans. Geosci. Remote 1995, 33, 817–828. [Google Scholar] [CrossRef]
  5. Guo, Y.; Chen, S.; Zhan, R.; Wang, W.; Zhang, J. LMSD-YOLO: A Lightweight YOLO Algorithm for Multi-Scale SAR Ship Detection. Remote Sens. 2022, 14, 4801. [Google Scholar] [CrossRef]
  6. Huang, H.; Gao, F.; Sun, J.; Wang, J.; Hussain, A.; Zhou, H. Novel Category Discovery Without Forgetting for Automatic Target Recognition. IEEE J. Sel. Top. Appl. Earth Observ. Remote Sens. 2024, 17, 4408–4420. [Google Scholar] [CrossRef]
  7. Gao, F.; Kong, L.; Lang, R.; Sun, J.; Wang, J.; Hussain, A.; Zhou, H. SAR target incremental recognition based on features with strong separability. IEEE Trans. Geosci. Remote Sens. 2024, 62, 5202813. [Google Scholar] [CrossRef]
  8. Bai, X.; Pu, X.; Xu, F. Conditional Diffusion for SAR to Optical Image Translation. IEEE Geosci. Remote Sens. Lett. 2024, 21, 4000605. [Google Scholar] [CrossRef]
  9. Chen, S.; Wang, H.; Xu, F.; Jin, Y. Target Classification Using the Deep Convolutional Networks for SAR Images. IEEE Trans. Geosci. Remote Sens. 2016, 54, 4806–4817. [Google Scholar] [CrossRef]
  10. Liu, M.; Wang, H.; Chen, S.; Tao, M.; Wei, J. A Two-Stage SAR Image Generation Algorithm Based on GAN with Reinforced Constraint Filtering and Compensation Techniques. Remote Sens. 2024, 16, 1963. [Google Scholar] [CrossRef]
  11. Ding, Z.; Wang, Z.; Wei, Y.; Li, L.; Ma, X.; Zhang, T.; Zeng, T. SPA-GAN: SAR Parametric Autofocusing Method with Generative Adversarial Network. Remote Sens. 2022, 14, 5159. [Google Scholar] [CrossRef]
  12. Du, S.; Hong, J.; Wang, Y.; Qi, Y. A high-quality multicategory SAR images generation method with multiconstraint GAN for ATR. IEEE Geosci. Remote Sens. Lett. 2021, 19, 4011005. [Google Scholar] [CrossRef]
  13. Sun, X.; Li, X.; Xiang, D.; Hu, C. SAR vehicle image generation with integrated deep imaging geometric information. Int. J. Appl. Earth Observ. Geoinf. 2024, 132, 104028. [Google Scholar] [CrossRef]
  14. Kuang, Y.; Ma, F.; Li, F.; Liu, F.; Zhang, F. Semantic-Layout-Guided Image Synthesis for High-Quality Synthetic-Aperature Radar Detection Sample Generation. Remote Sens. 2023, 15, 5654. [Google Scholar] [CrossRef]
  15. Du, W.L.; Zhou, Y.; Zhao, J.Q.; Tian, X. K-Means clustering guided generative adversarial networks for SAR-optical image matching. IEEE Access 2020, 8, 217554–217572. [Google Scholar] [CrossRef]
  16. Harrison, R.W. Continuous restricted Boltzmann machines. Wirel. Netw. 2022, 1263–1267. [Google Scholar] [CrossRef]
  17. Kingma, D.P.; Welling, M. Auto-Encoding Variational Bayes. arXiv 2013, arXiv:1312.6114. [Google Scholar]
  18. Hui, L. Research on Medical Image Enhancement Method Based on Conditional Entropy Generative Adversarial Networks. Appl. Math. Nonlinear Sci. 2024, 9. [Google Scholar] [CrossRef]
  19. Yang, L.; Su, J.; Li, X. Application of SAR Ship Data Augmentation Based on Generative Adversarial Network in Improved SSD. Acta Armamentarii 2019, 40, 2488–2496. [Google Scholar]
  20. Jaskie, K.; Dezember, M.; Majumder, U.K. VAE for SAR active learning. In Proceedings of the Algorithms for Synthetic Aperture Radar Imagery XXX, Orlando, FL, USA, 30 April–4 May 2023. [Google Scholar]
  21. Zhang, M.; Zhang, P.; Zhang, Y.; Yang, M.; Li, X.; Dong, X.; Yang, L. SAR-to-Optical Image Translation via an Interpretable Network. Remote Sens. 2024, 16, 242. [Google Scholar] [CrossRef]
  22. Barratt, S.; Sharma, R. A Note on the Inception Score. arXiv 2018, arXiv:1801.01973. [Google Scholar]
  23. Zhao, J.; Chen, S. Facies conditional simulation based on VAE-GAN model and image quilting algorithm. J. Appl. Geophys. 2023, 219, 105239. [Google Scholar] [CrossRef]
  24. Karras, T.; Aila, T.; Laine, S.; Lehtinen, J. Progressive Growing of GANs for Improved Quality, Stability, and Variation. arXiv 2017, arXiv:1710.10196. [Google Scholar]
  25. Dalva, Y.; Yesiltepe, H.; Yanardag, P. GANTASTIC: GAN-based Transfer of Interpretable Directions for Disentangled Image Editing in Text-to-Image Diffusion Models. arXiv 2024, arXiv:2403.19645. [Google Scholar]
  26. Shocher, A.; Cohen, N.; Irani, M. Zero-Shot Super-Resolution Using Deep Internal Learning(Conference Paper). In Proceedings of the IEEE Computer Society Conference On Computer Vision and Pattern Recognition, Salt Lake City, UT, USA, 18–22 June 2018; pp. 3118–3126. [Google Scholar]
  27. Shabtay, N.; Schwartz, E.; Giryes, R. Deep Phase Coded Image Prior. arXiv 2024, arXiv:2404.03906. [Google Scholar]
  28. Shocher, A.; Bagon, S.; Isola, P.J.; Irani, M. InGAN: Capturing and Retargeting the “DNA” of a Natural Image. In Proceedings of the IEEE International Conference on Computer Vision, Seoul, Republic of Korea, 27 October–2 November 2019. [Google Scholar]
  29. Shaham, T.R.; Dekel, T.; Michaeli, T. SinGAN: Learning a Generative Model from a Single Natural Image. arXiv 2019, arXiv:1905.01164. [Google Scholar]
  30. Hinz, T.; Fisher, M.; Wang, O.; Wermter, S. Improved Techniques for Training Single-Image GANs. In Proceedings of the IEEE/CVF Winter Conference on Applications of Computer Vision, Waikoloa, HI, USA, 3–7 January 2021; pp. 1300–1309. [Google Scholar]
  31. Horry, M.J.; Chakraborty, S.; Paul, M.; Ulhaq, A.; Pradhan, B.; Saha, M.; Shukla, N. COVID-19 Detection Through Transfer Learning Using Multimodal Imaging Data. IEEE Access 2020, 8, 149808–149824. [Google Scholar] [CrossRef] [PubMed]
  32. Gur, S.; Benaim, S.; Wolf, L. Hierarchical Patch VAE-GAN: Generating Diverse Videos from a Single Sample. arXiv 2020, arXiv:2006.12226. [Google Scholar]
  33. Eryilmaz-Eren, E.; Senbayrak, S.; Karlidag, G.E.; Mert, D.; Urkmez, F.Y.; Peña-López, Y.; Rello, J.; Alp, E. Ventilator-associated event (VAE) epidemiology and prognosis: Preliminary results of VAE-Türkiye. J. Crit. Care 2024, 81, 154671. [Google Scholar] [CrossRef]
  34. Chen, J.; Xu, Q.; Kang, Q.; Zhou, M. MOGAN: Morphologic-Structure-Aware Generative Learning From a Single Image. arXiv 2023, arXiv:2103.02997. [Google Scholar] [CrossRef]
  35. Zhang, Z.; Han, C.; Guo, T. ExSinGAN: Learning an Explainable Generative Model from a Single Image. arXiv 2022, arXiv:2105.07350. [Google Scholar]
  36. Guo, J.G.J.; Lei, B.L.B.; Ding, C.D.C.; Zhang, Y.Z.Y. Synthetic Aperture Radar Image Synthesis by Using Generative Adversarial Nets. IEEE Geosci. Remote Sens. Lett. 2017, 14, 1111–1115. [Google Scholar] [CrossRef]
  37. Gao, F.; Yang, Y.; Wang, J.; Sun, J.; Yang, E.; Zhou, H. A Deep Convolutional Generative Adversarial Networks (DCGANs)-Based Semi-Supervised Method for Object Recognition in Synthetic Aperture Radar (SAR) Images. Remote Sens. 2018, 10, 846. [Google Scholar] [CrossRef]
  38. Oghim, S.; Kim, Y.; Bang, H.; Lim, D.; Ko, J. SAR Image Generation Method Using DH-GAN for Automatic Target Recognition. Sensors 2024, 24, 670. [Google Scholar] [CrossRef] [PubMed]
  39. Wang, Y.; Wang, C.; Zhang, H.; Dong, Y.; Wei, S. A SAR Dataset of Ship Detection for Deep Learning under Complex Backgrounds. Remote Sens. 2019, 11, 765. [Google Scholar] [CrossRef]
  40. Hu, X.; Zhang, P.; Ban, Y.; Rahnemoonfar, M. GAN-based SAR and optical image translation for wildfire impact assessment using multi-source remote sensing data. Remote Sens. Environ. 2023, 289, 113522. [Google Scholar] [CrossRef]
  41. Khan, M.A.; Menouar, H.; Hamila, R. Multimodal Crowd Counting with Pix2Pix GANs. In Proceedings of the 19th International Conference on Computer Vision Theory and Applications, Rome, Italy, 27–29 February 2024. [Google Scholar]
  42. Men, Z.; Wang, P.; Chen, J.; Li, C.; Liu, W.; Yang, W. Advanced high-order nonlinear chirp scaling algorithm for high-resolution wide-swath spaceborne SAR. Chin. J. Aeronaut. 2021, 34, 563–575. [Google Scholar] [CrossRef]
  43. Wei, S.; Zeng, X.; Qu, Q.; Wang, M.; Su, H.; Shi, J. HRSID: A High-Resolution SAR Images Dataset for Ship Detection and Instance Segmentation. IEEE Access 2020, 8, 120234–120254. [Google Scholar] [CrossRef]
  44. Golhar, M.V.; Bobrow, T.L.; Ngamruengphong, S.; Durr, N.J. GAN Inversion for Data Augmentation to Improve Colonoscopy Lesion Classification. IEEE J. Biomed. Health Inform. 2024. [Google Scholar] [CrossRef]
  45. Sun, H.; Wang, Y.; Wang, X.; Zhang, B.; Xin, Y.; Zhang, B.; Cao, X.; Ding, E.; Han, S. MAFormer: A transformer network with multi-scale attention fusion for visual recognition. Neurocomputing 2024, 595, 127828. [Google Scholar] [CrossRef]
  46. Lin, H.; Wang, H.; Xu, F.; Jin, Y. Target Recognition for SAR Images Enhanced by Polarimetric Information. IEEE Trans. Geosci. Remote Sens. 2024, 62, 5204516. [Google Scholar] [CrossRef]
  47. Simonyan, K. Very deep convolutional networks for large-scale image recognition. arXiv 2014, arXiv:1409.1556. [Google Scholar]
  48. Ghazanfari, S.; Garg, S.; Krishnamurthy, P.; Khorrami, F.; Araujo, A. R-LPIPS: An Adversarially Robust Perceptual Similarity Metric. arXiv 2023, arXiv:2307.15157. [Google Scholar]
  49. Jiang, N.; Zhao, W.; Wang, H.; Luo, H.; Chen, Z.; Zhu, J. Lightweight Super-Resolution Generative Adversarial Network for SAR Images. Remote Sens. 2024, 16, 1788. [Google Scholar] [CrossRef]
  50. Coelho, F.; Pinto, M.F.; Melo, A.G.; Ramos, G.S.; Marcato, A.L.M. A novel sEMG data augmentation based on WGAN-GP. Comput. Methods Biomech. Biomed. Eng. 2023, 26, 1008–1017. [Google Scholar] [CrossRef] [PubMed]
  51. Dixe, S.; Leite, J.; Fonseca, J.C.; Borges, J. BigGAN evaluation for the generation of vehicle interior images. Procedia Comput. Sci. 2022, 204, 548–557. [Google Scholar] [CrossRef]
  52. Deijn, R.; Batra, A.; Koch, B.; Mansoor, N.; Makkena, H. Reviewing FID and SID Metrics on Generative Adversarial Networks. arXiv 2024, arXiv:2402.03654. [Google Scholar]
  53. Tiedemann, H.; Morgenstern, Y.; Schmidt, F.; Fleming, R.W. One-shot generalization in humans revealed through a drawing task. eLife 2022, 11, e75485. [Google Scholar] [CrossRef]
  54. Wang, Z.; Bovik, A.; Sheikh, H.R.; Simoncelli, E.P. Image quality assessment: From error visibility to structural similarity. IEEE Trans. Image Process. 2004, 13, 600–612. [Google Scholar] [CrossRef]
  55. Xiang, P.; Xiang, S.; Zhao, Y. Texturize a GAN Using a Single Image. arXiv 2023, arXiv:2302.10600. [Google Scholar]
  56. Ye, R.; Boukerche, A.; Yu, X.; Zhang, C.; Yan, B.; Zhou, X. Data augmentation method for insulators based on Cycle GAN. J. Electron. Sci. Technol. 2024, 22, 100250. [Google Scholar] [CrossRef]
  57. Boutin, V.; Singhal, L.; Thomas, X.; Serre, T. Diversity vs. Recognizability: Human-like generalization in one-shot generative models. arXiv 2022, arXiv:2205.10370. [Google Scholar]
  58. Rumelhart, D.E.; McClelland, J.L. Information Processing in Dynamical Systems: Foundations of Harmony Theory; MIT Press: Cambridge, MA, USA, 1987; pp. 194–281. [Google Scholar]
  59. Ramzan, M.; Abid, A.; Bilal, M.; Aamir, K.M.; Memon, S.A.; Chung, T.-S. Effectiveness of Pre-Trained CNN Networks for Detecting Abnormal Activities in Online Exams. IEEE Access 2024, 12, 21503–21519. [Google Scholar] [CrossRef]
  60. Ljubičić, R.; Dal Sasso, S.F.; Zindović, B. SSIMS-Flow: Image velocimetry workbench for open-channel flow rate estimation. Environ. Model. Softw. 2024, 173, 105938. [Google Scholar] [CrossRef]
Figure 1. Network structure of the different generative models.
Remotesensing 16 03326 g001
Figure 2. GAN Inversion and noise sampling with prior constraints.
Remotesensing 16 03326 g002
Figure 3. An overview of the ‘coarse-to-fine’ image generation process. The leftmost figures represent the input data fed into the generator at each hierarchical level, while the central figures represent the synthesized outputs produced by the generator, i.e., the ‘fake’ images. The rightmost figures present the actual reference images, i.e., the ‘real’ images. The red dashed lines represent the upscaling operations.
Remotesensing 16 03326 g003
Figure 4. Calculation of the LPIPS loss function.
Remotesensing 16 03326 g004
Figure 5. Structure of the MSDA module.
Remotesensing 16 03326 g005
Figure 6. A diversity vs. recognizability evaluation framework. Among the synthesized samples, those that exhibit intra-class variance within the decision boundaries demonstrate strong generalization (Box 1). In contrast, exact replicas (Box 2) and excessively diversified samples that surpass the boundaries (Box 3) exhibit poor generalization.
Remotesensing 16 03326 g006
Figure 7. Comparison of the synthesized results in the ablation study. (a) Real images, (b) results of the StGAN, (c) results of StGAN and TeGAN, (d) results of the TeGAN and SeGAN, (e) results of the StGAN, TeGAN, and SeGAN.
Remotesensing 16 03326 g007
Figure 8. Visualization of diversity vs. recognizability in the synthesized image samples. Each point represents one sample, while each method yields 70 image samples. The ‘st’, ‘te’ and ‘se’ refer to the StGAN, TeGAN, and SeGAN, respectively.
Remotesensing 16 03326 g008
Figure 9. Comparison of synthesized results obtained with and without the use of the MSDA. (a) Real images, (b) the baseline method, (c) the proposed method without MSDA, (d) the proposed method with MSDA.
Remotesensing 16 03326 g009
Figure 10. Visualization of diversity vs. recognizability in the synthetic results obtained with and without the use of the MSDA. Each point represents one sample, while each method yields 70 image samples.
Remotesensing 16 03326 g010
Figure 11. Qualitative comparisons of small image samples with 256 × 256 pixels. (a) Real images, (b) results of the proposed method, (c) results of the ExSinGAN, (d) results of the SinGAN, (e) results of the InGAN, (f) results of the HP-VAEGAN.
Remotesensing 16 03326 g011
Figure 12. Qualitative comparisons of small image samples with 400 × 400 pixels. (a) Real images, (b) results of the proposed method, (c) results of the ExSinGAN, (d) results of the SinGAN, (e) results of the InGAN, (f) results of the HP-VAEGAN.
Remotesensing 16 03326 g012
Figure 13. Qualitative comparisons of small image samples with 800 × 800 pixels. (a) Real images, (b) results of the proposed method, (c) results of the ExSinGAN, (d) results of the SinGAN, (e) results of the InGAN, (f) results of the HP-VAEGAN.
Remotesensing 16 03326 g013
Figure 14. The visualization of diversity vs. recognizability of the compared methods. The different colors indicate the samples generated by the different methods. The results are analyzed in the sample images with the spatial sizes of (a) 200 × 200, (b) 400 × 400, and (c) 800 × 800.
Remotesensing 16 03326 g014
Table 1. Quantitative results of the ablation study. The second to last column presents the results using different GAN modules. SIFD and SSIM assess the distribution and structural characteristics, respectively.
Evaluation
Metrics
BaselineStGAN
& TeGAN
TeGAN
& SeGAN
StGAN
& TeGAN
& SeGAN
SIFID0.140.120.100.09
SSIM0.330.380.340.41
Table 2. Quantitative comparison of the results obtained with and without the use of the MSDA.
Evaluation MetricsBaselineGANs w./o. MSDAGANs w. MSDA
SIFID0.140.110.09
SSIM0.330.380.41
Table 3. The quantitative results obtained with varying weighting parameter values.
ParametersSIFID SSIMSIFID SSIMSIFID SSIM
Value: 0.05Value: 0.1Value: 0.3
α 1   ( α 2 =   λ = 0.5 ,   α 3 = 1)0.20 0.37 0.21 0.410.34 0.27
α 2   ( α 1 =   λ = 0.5 ,   α 3 = 1)0.18 0.35 0.25 0.360.39 0.14
λ   ( α 1 =   α 2 = 0.5 ,   α 3 = 1)0.18 0.160.14 0.19 0.22 0.12
α 3   ( α 1   = α 2 =   λ = 0.5)value: 5value: 10value: 20
0.19 0.180.11 0.250.52 0.19
Table 4. Quantitative comparison of the results obtained at different resolutions.
Methods200 × 200400 × 400800 × 800
SIFID SSIMSIFID SSIMSIFID SSIM
Ours0.09 0.410.15 0.420.28 0.47
SinGAN0.12 0.360.25 0.200.28 0.47
EXSinGAN0.10 0.380.18 0.390.27 0.52
InGAN0.64 0.180.75 0.130.93 0.07
HP-VAEGAN0.30 0.190.32 0.150.61 0.05
Table 5. Comparison of the computation costs of different methods.
MethodsParameters (m)FLOPS (Gbps)Training Time
Ours45.38141.71.5 h
SinGAN32.82124.91 h
EXSinGAN37.13133.61 h
InGAN22.67104.950 min
HP-VAEGAN29.31118.150 min
Table 6. Percentage of human assessments of the synthetic images obtained by different methods.
Methods400 × 400
Realism Diversity
800 × 800
Realism Diversity
The proposed method68% 70%75% 66%
SinGAN14% 8%15% 8%
EXSinGAN6% 12%10% 16%
InGAN8% 7%3% 7%
HP-VAEGAN4% 3%2% 3%
Disclaimer/Publisher’s Note: The statements, opinions and data contained in all publications are solely those of the individual author(s) and contributor(s) and not of MDPI and/or the editor(s). MDPI and/or the editor(s) disclaim responsibility for any injury to people or property resulting from any ideas, methods, instructions or products referred to in the content.

