

Evolution Patterns and Dominant Factors of Soil Salinization in the Yellow River Delta Based on Long-Time-Series and Similar Phenological-Fusion Images


Abstract
1. Introduction
2. Data Source and Methods
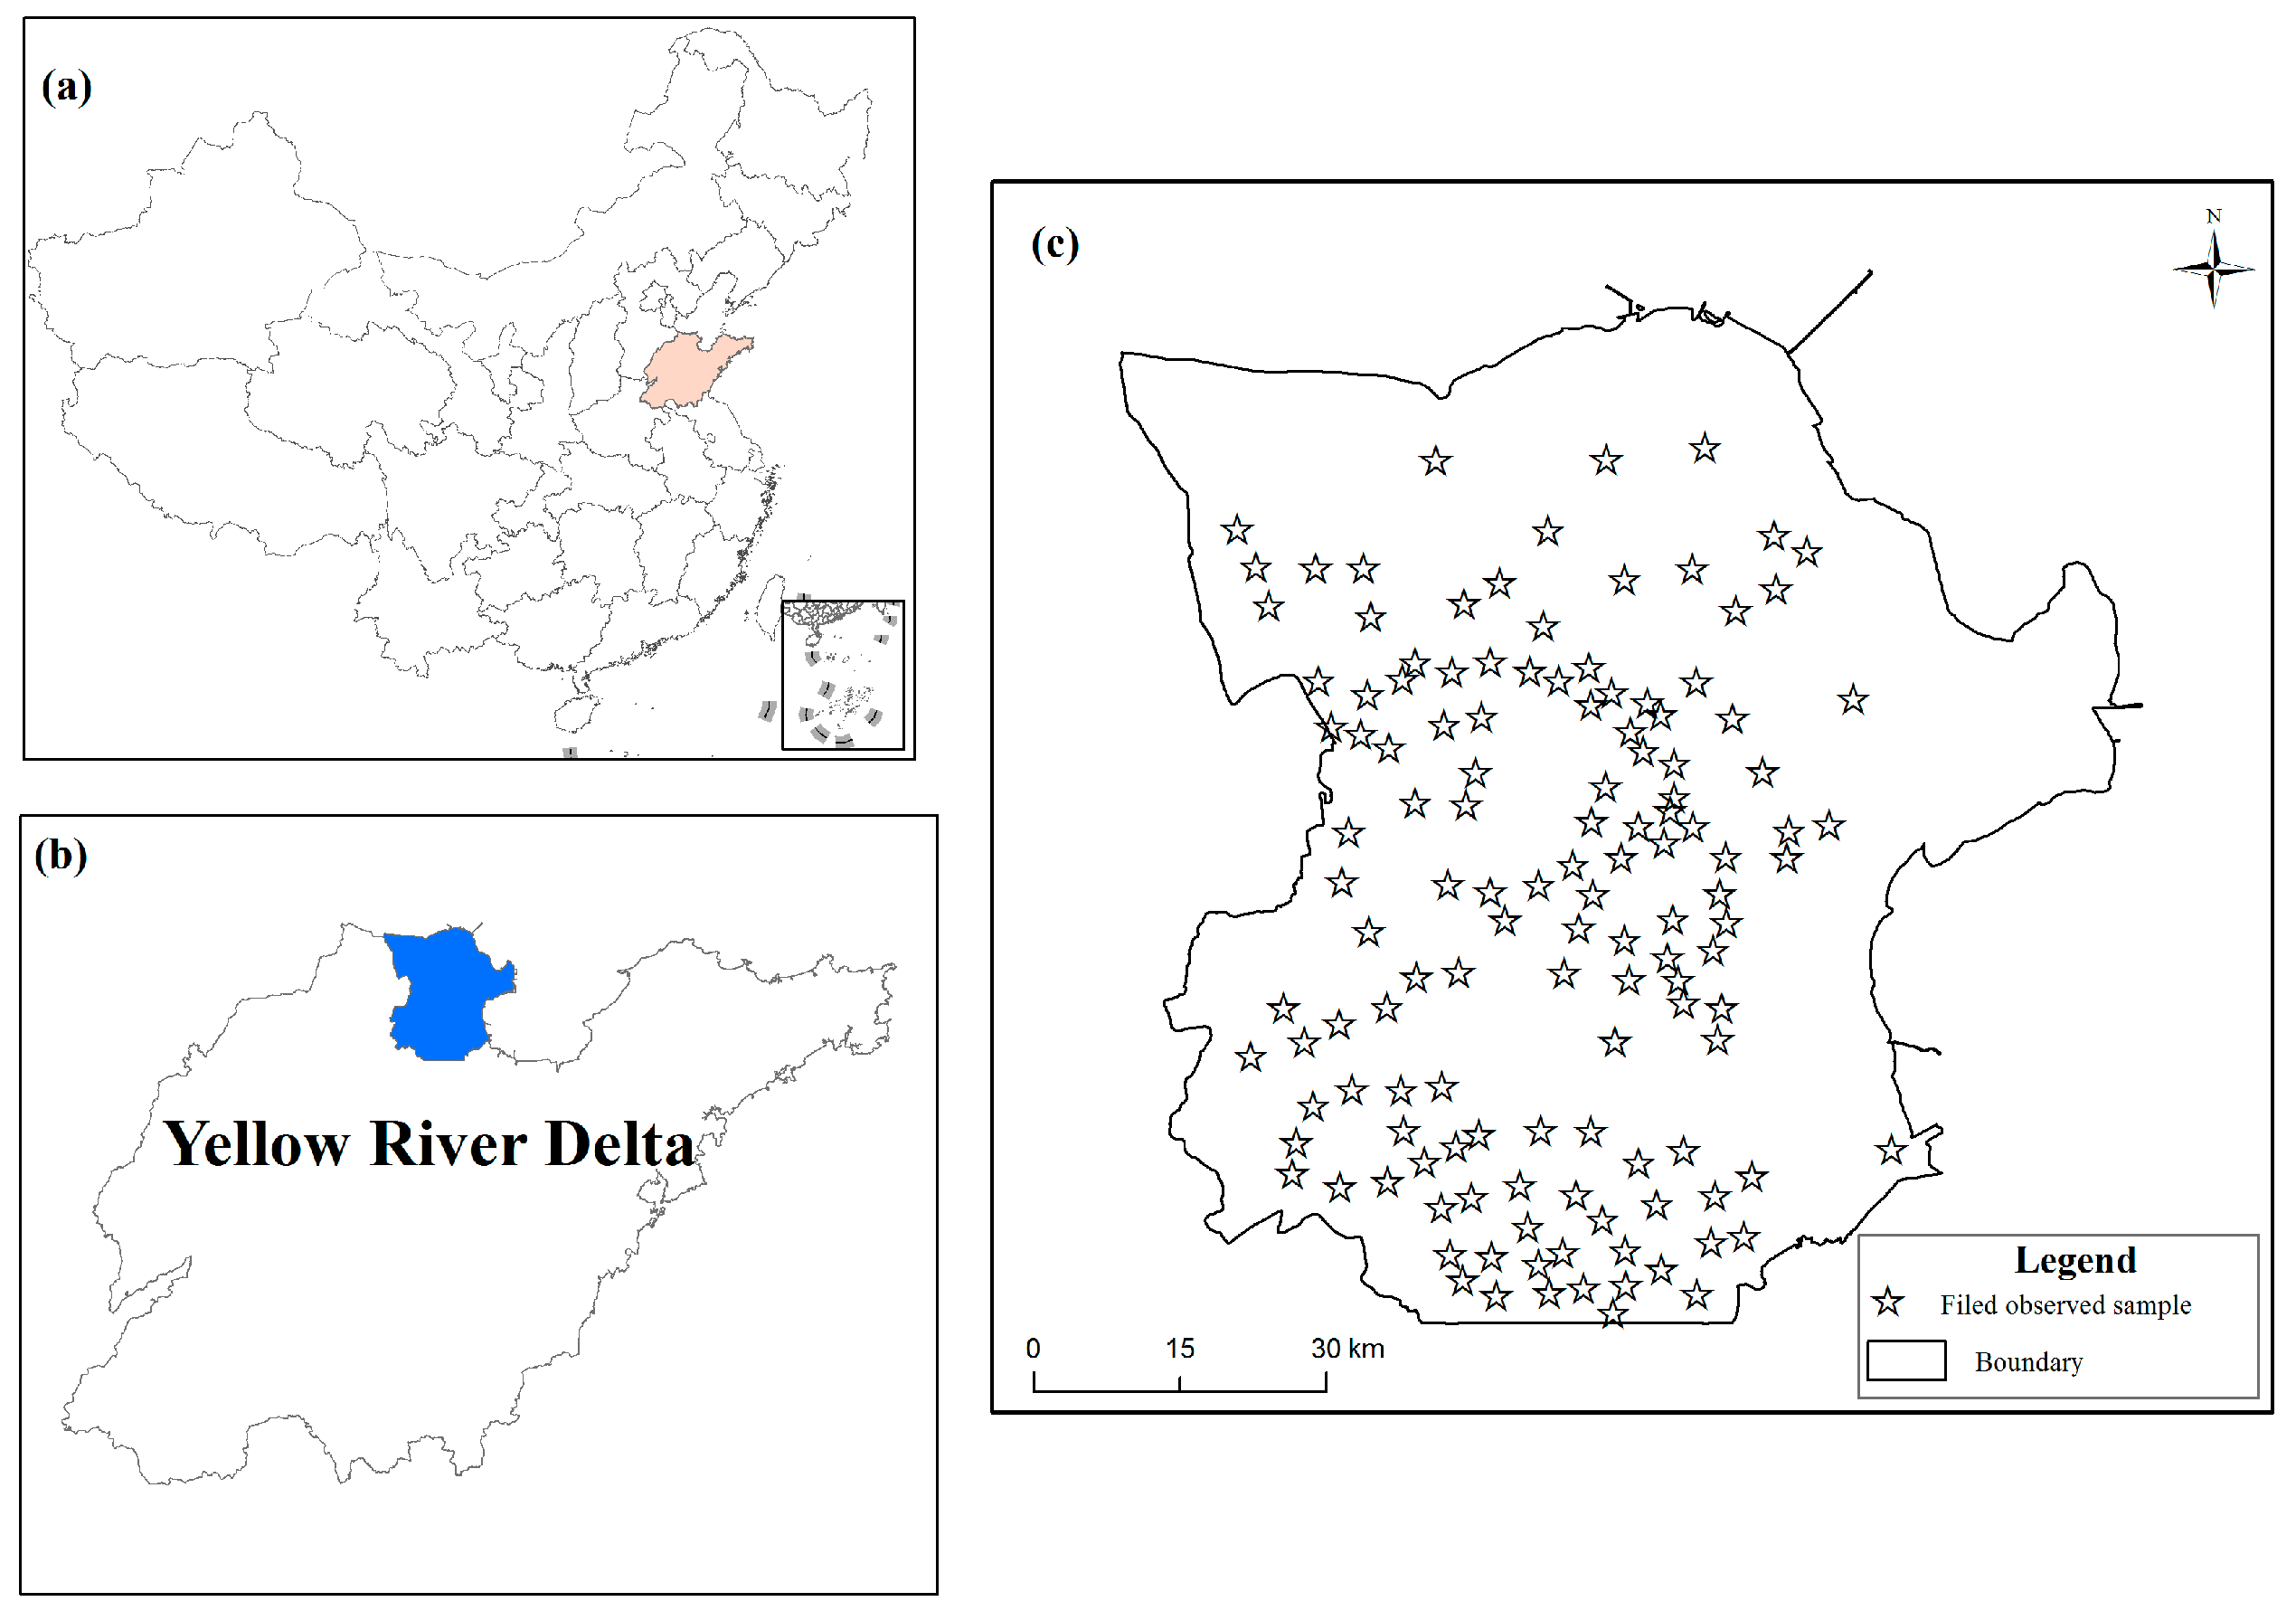
2.1. Study Area
2.2. Data Source and Preprocessing
2.2.1. Remote Sensing Images
2.2.2. Field Measurement Data
2.2.3. Natural-Factor Data and Socio-Economic Factors
2.3. Research Methods
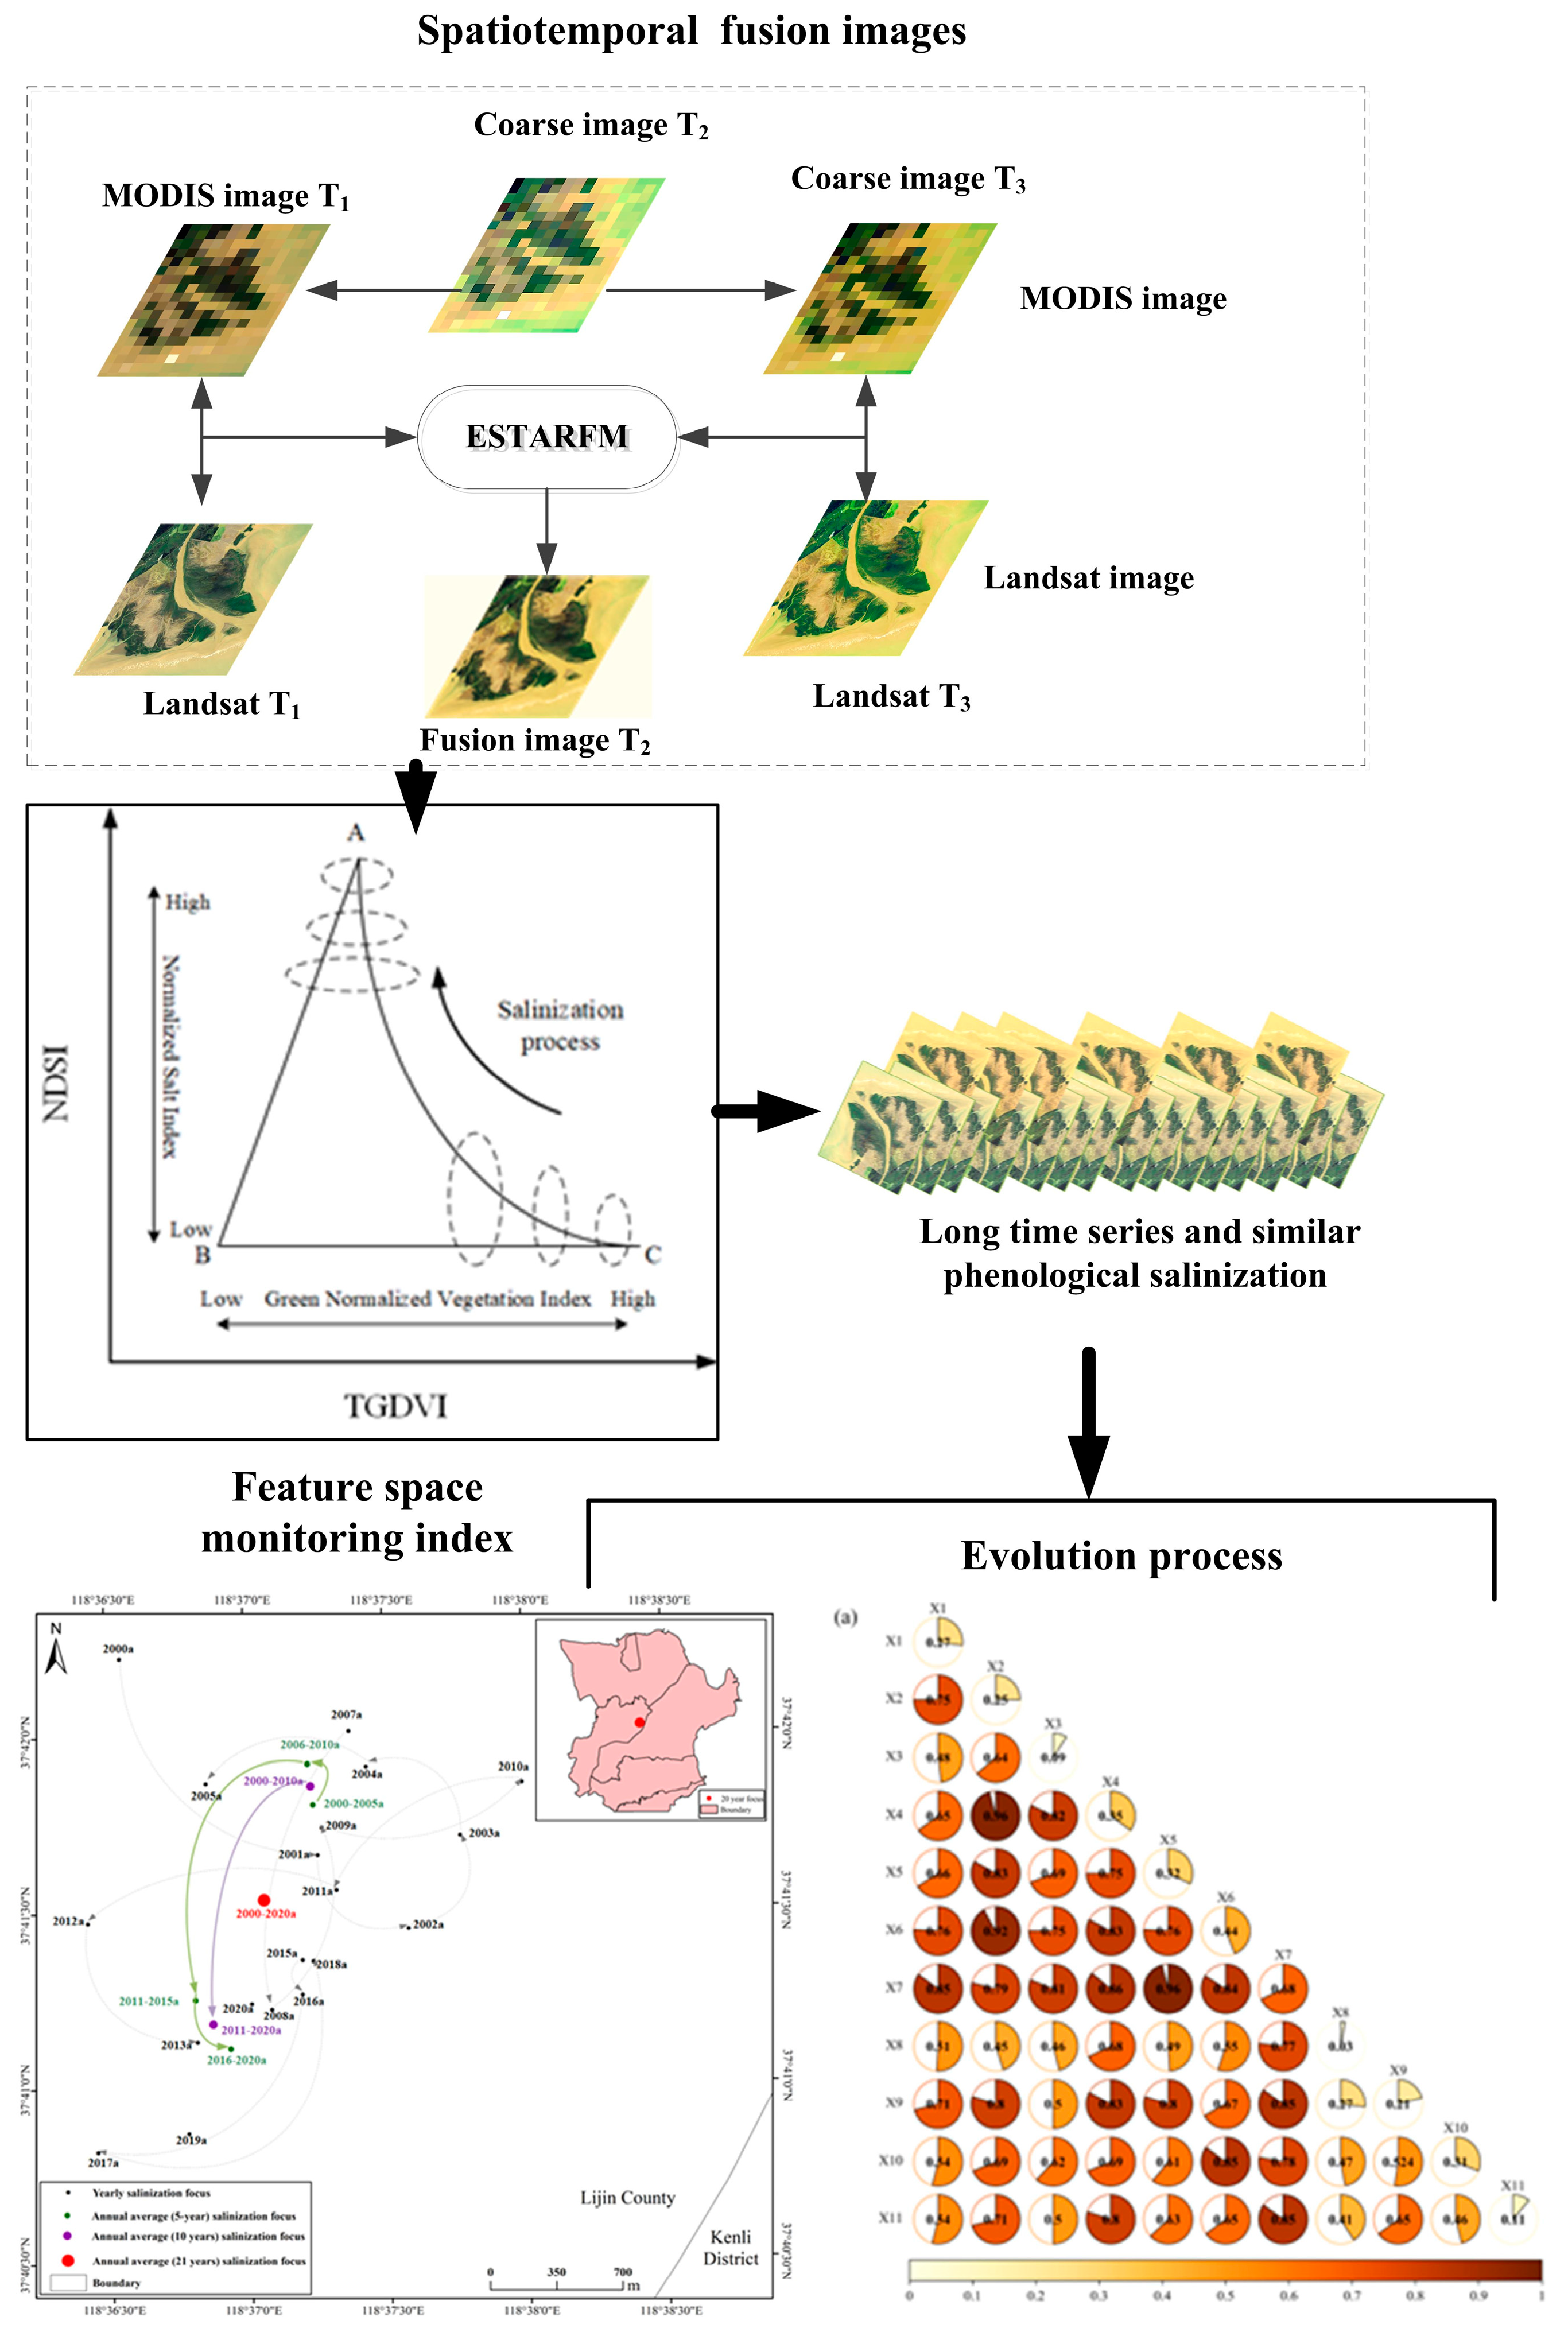
2.3.1. Spatiotemporal-Fusion Algorithm
2.3.2. Random Forest Algorithm
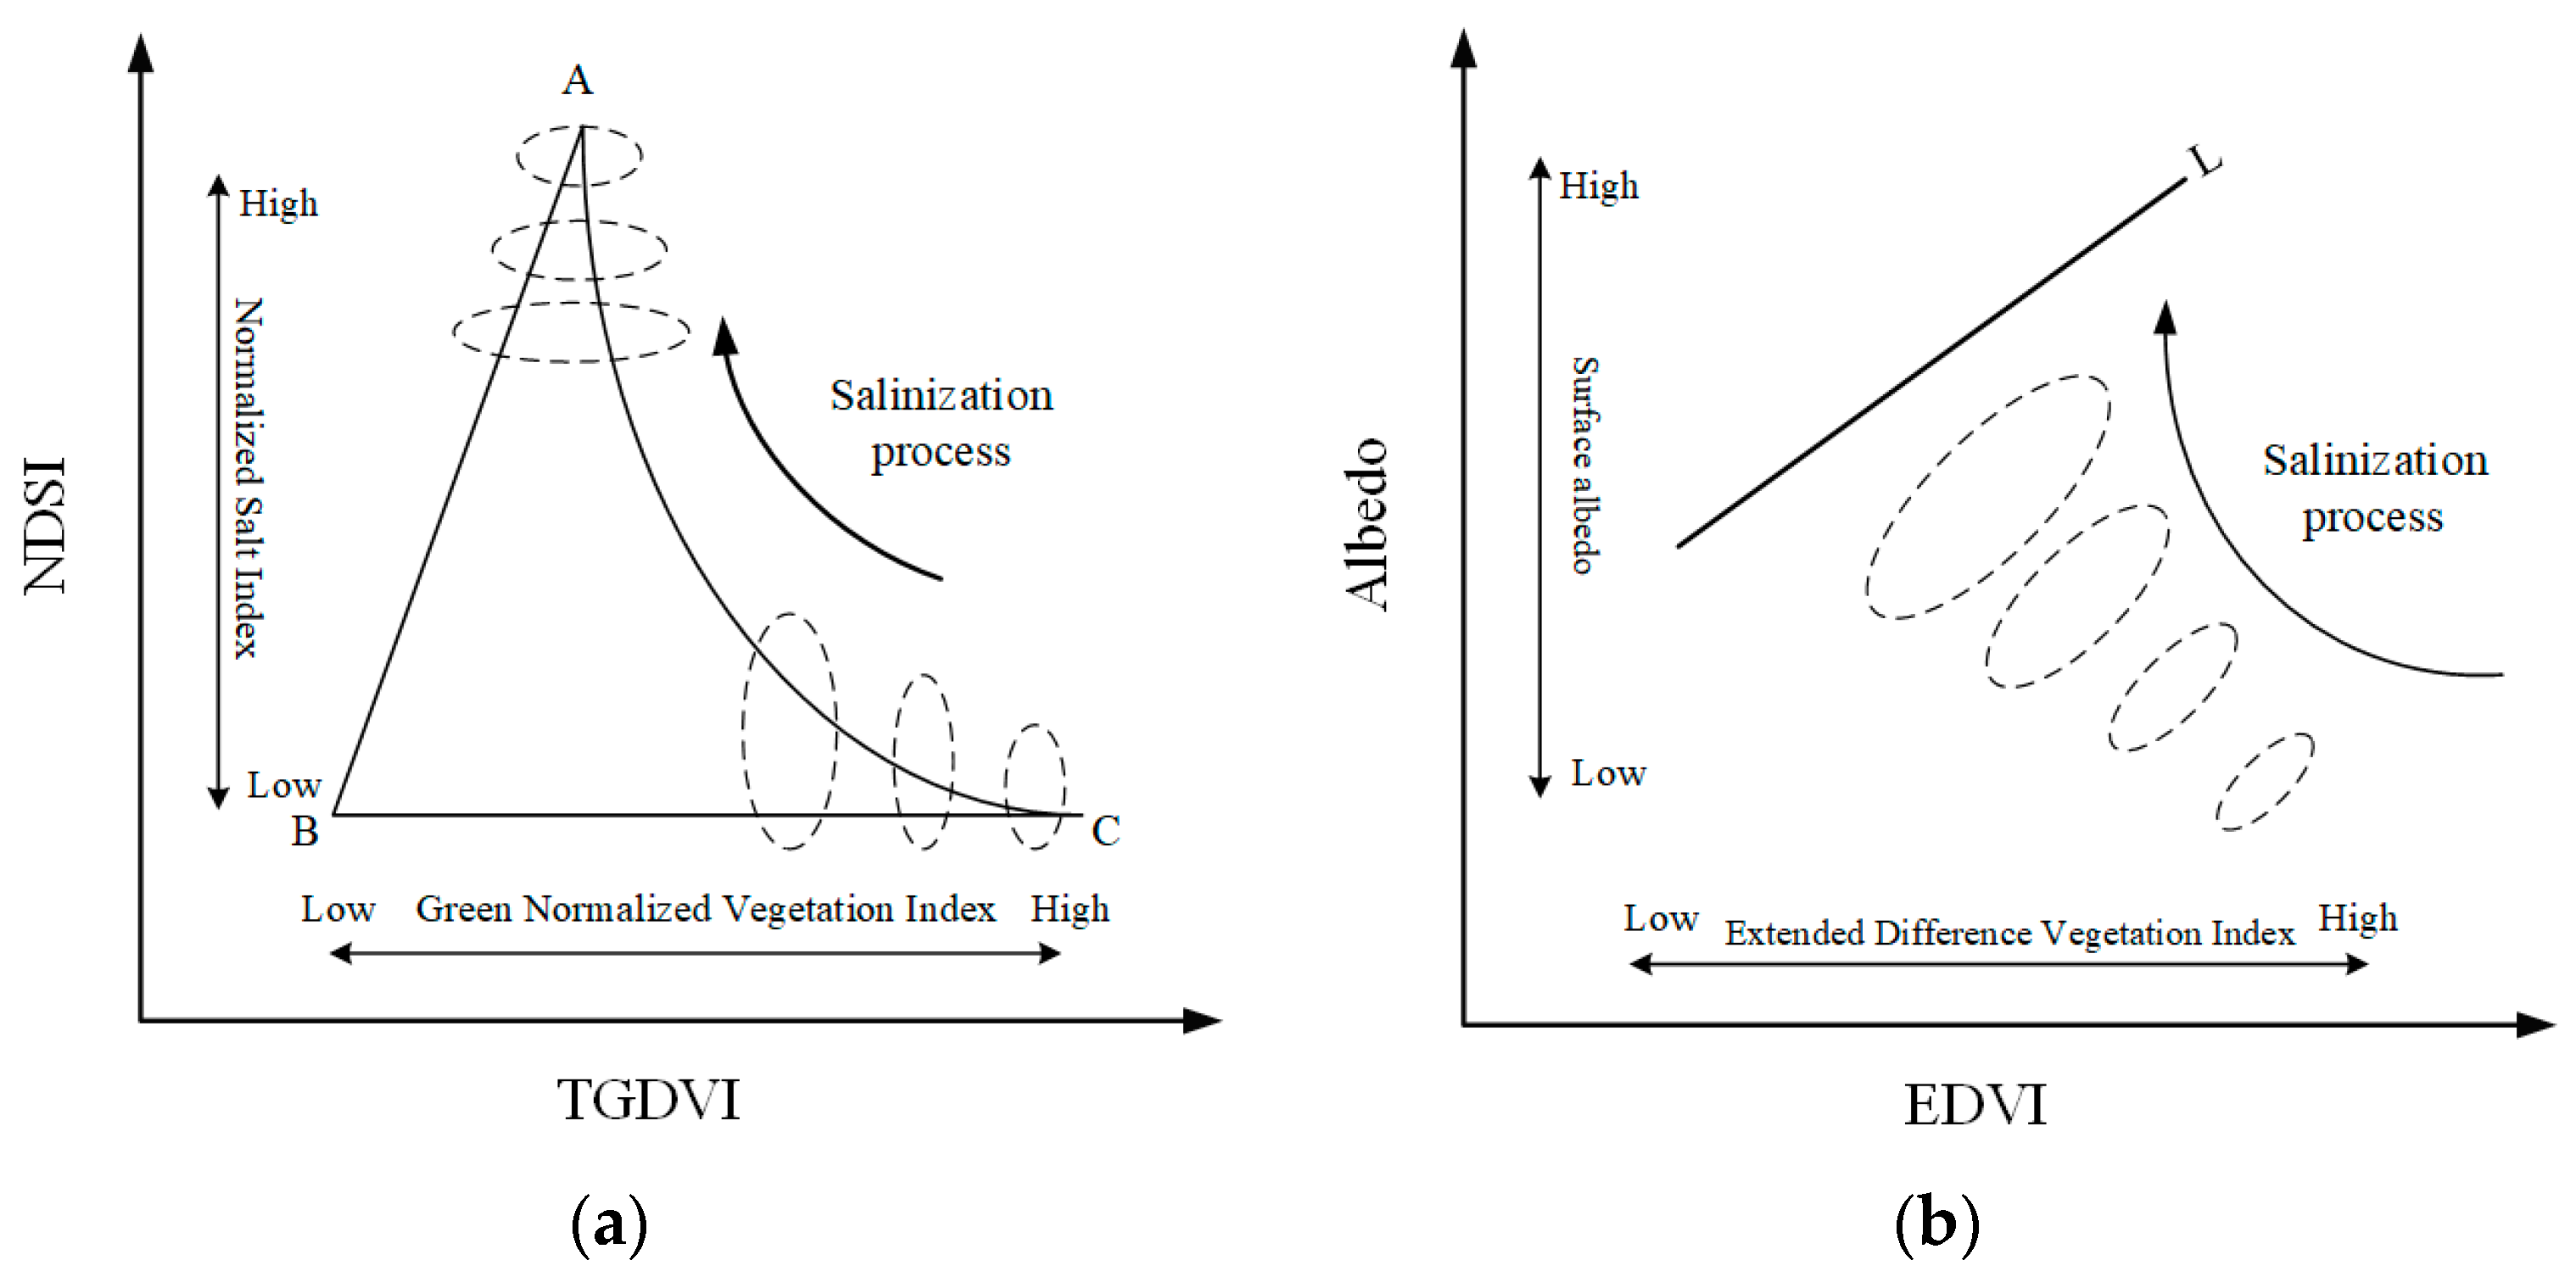
2.3.3. Feature Space Model
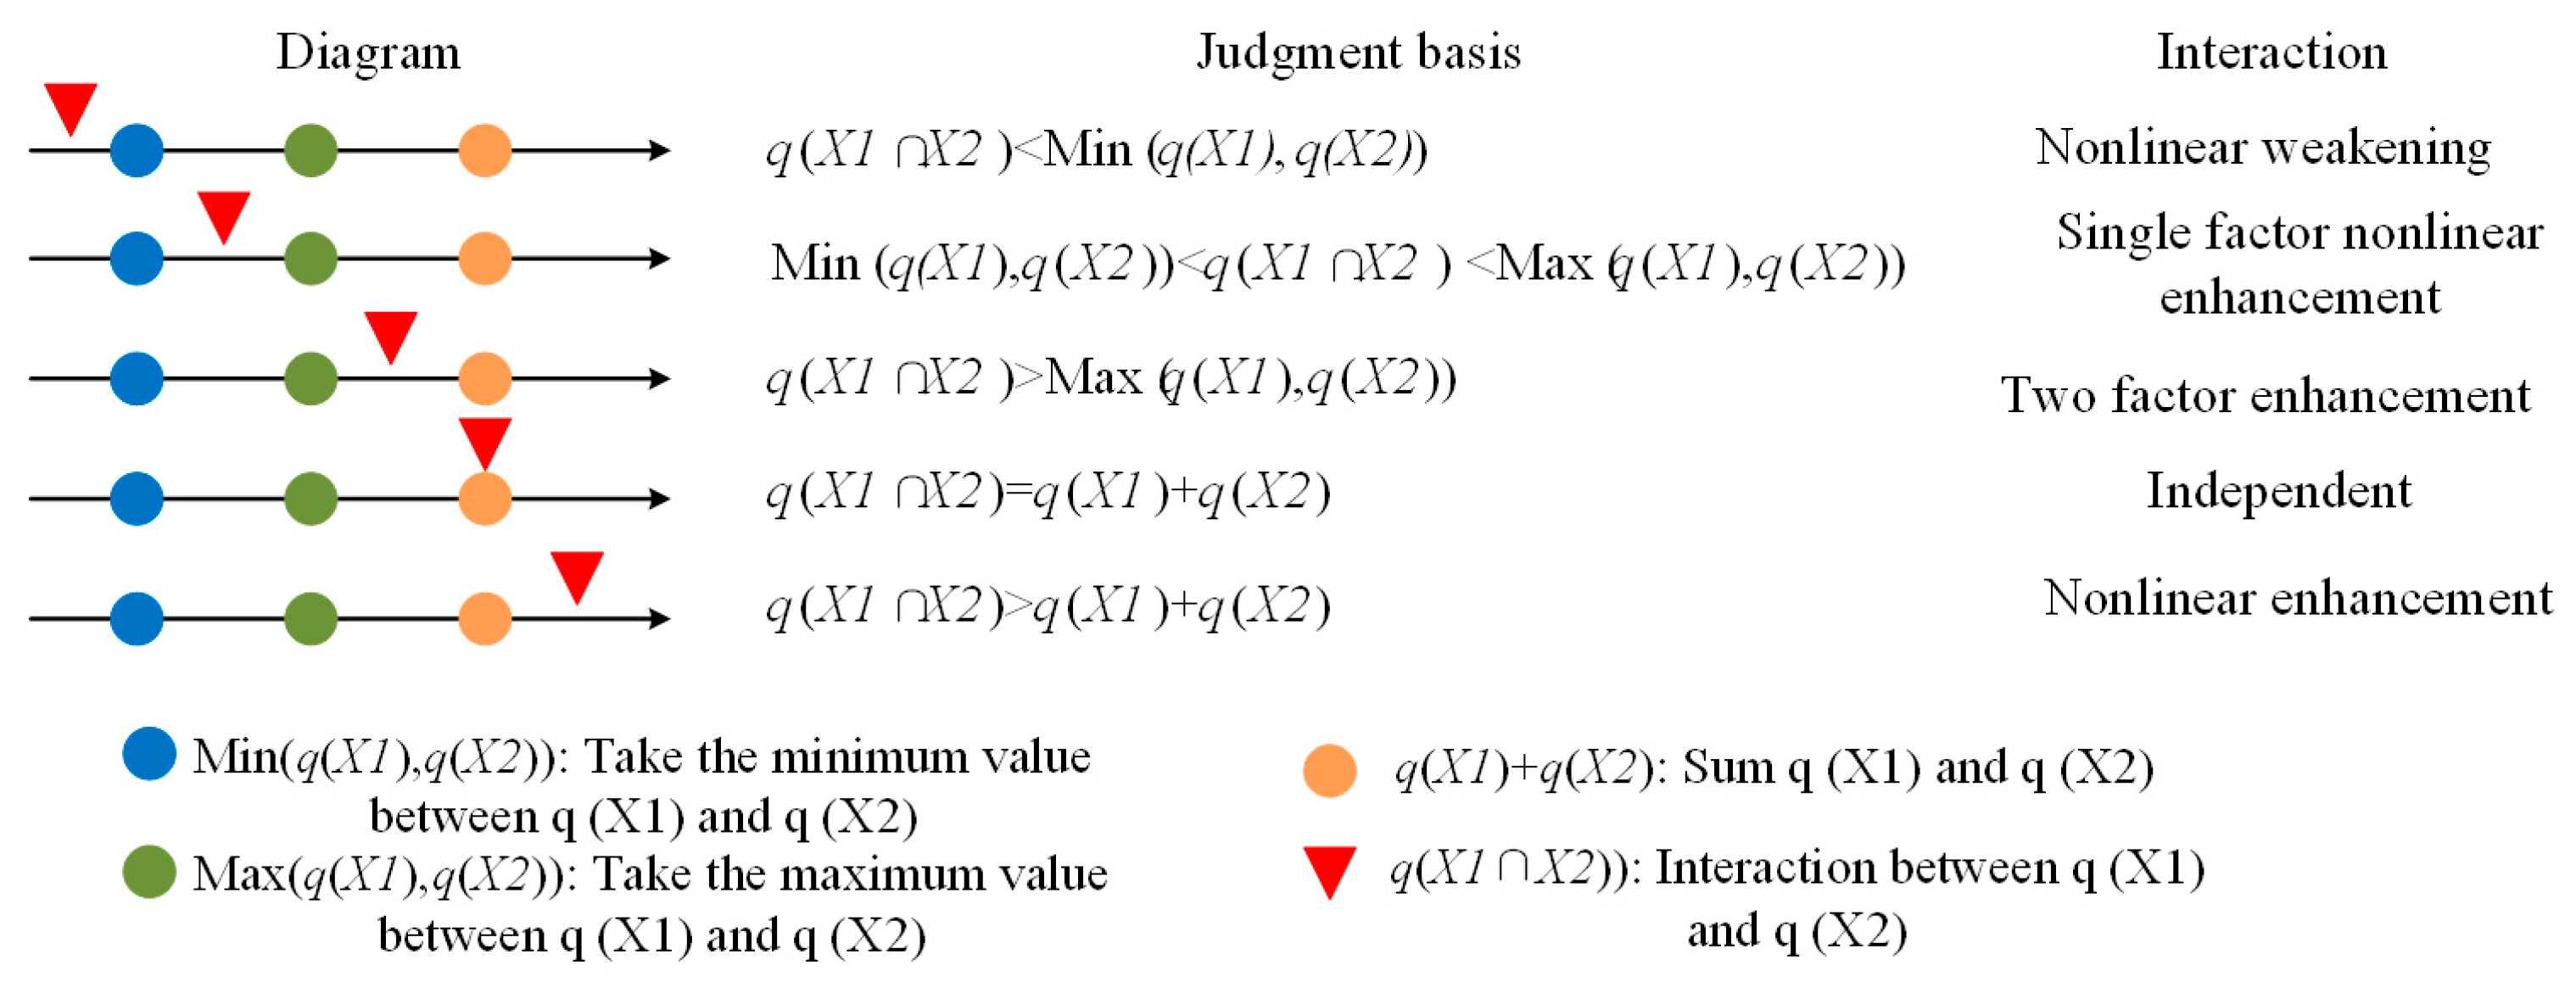
2.3.4. Geographical Detector
3. Results
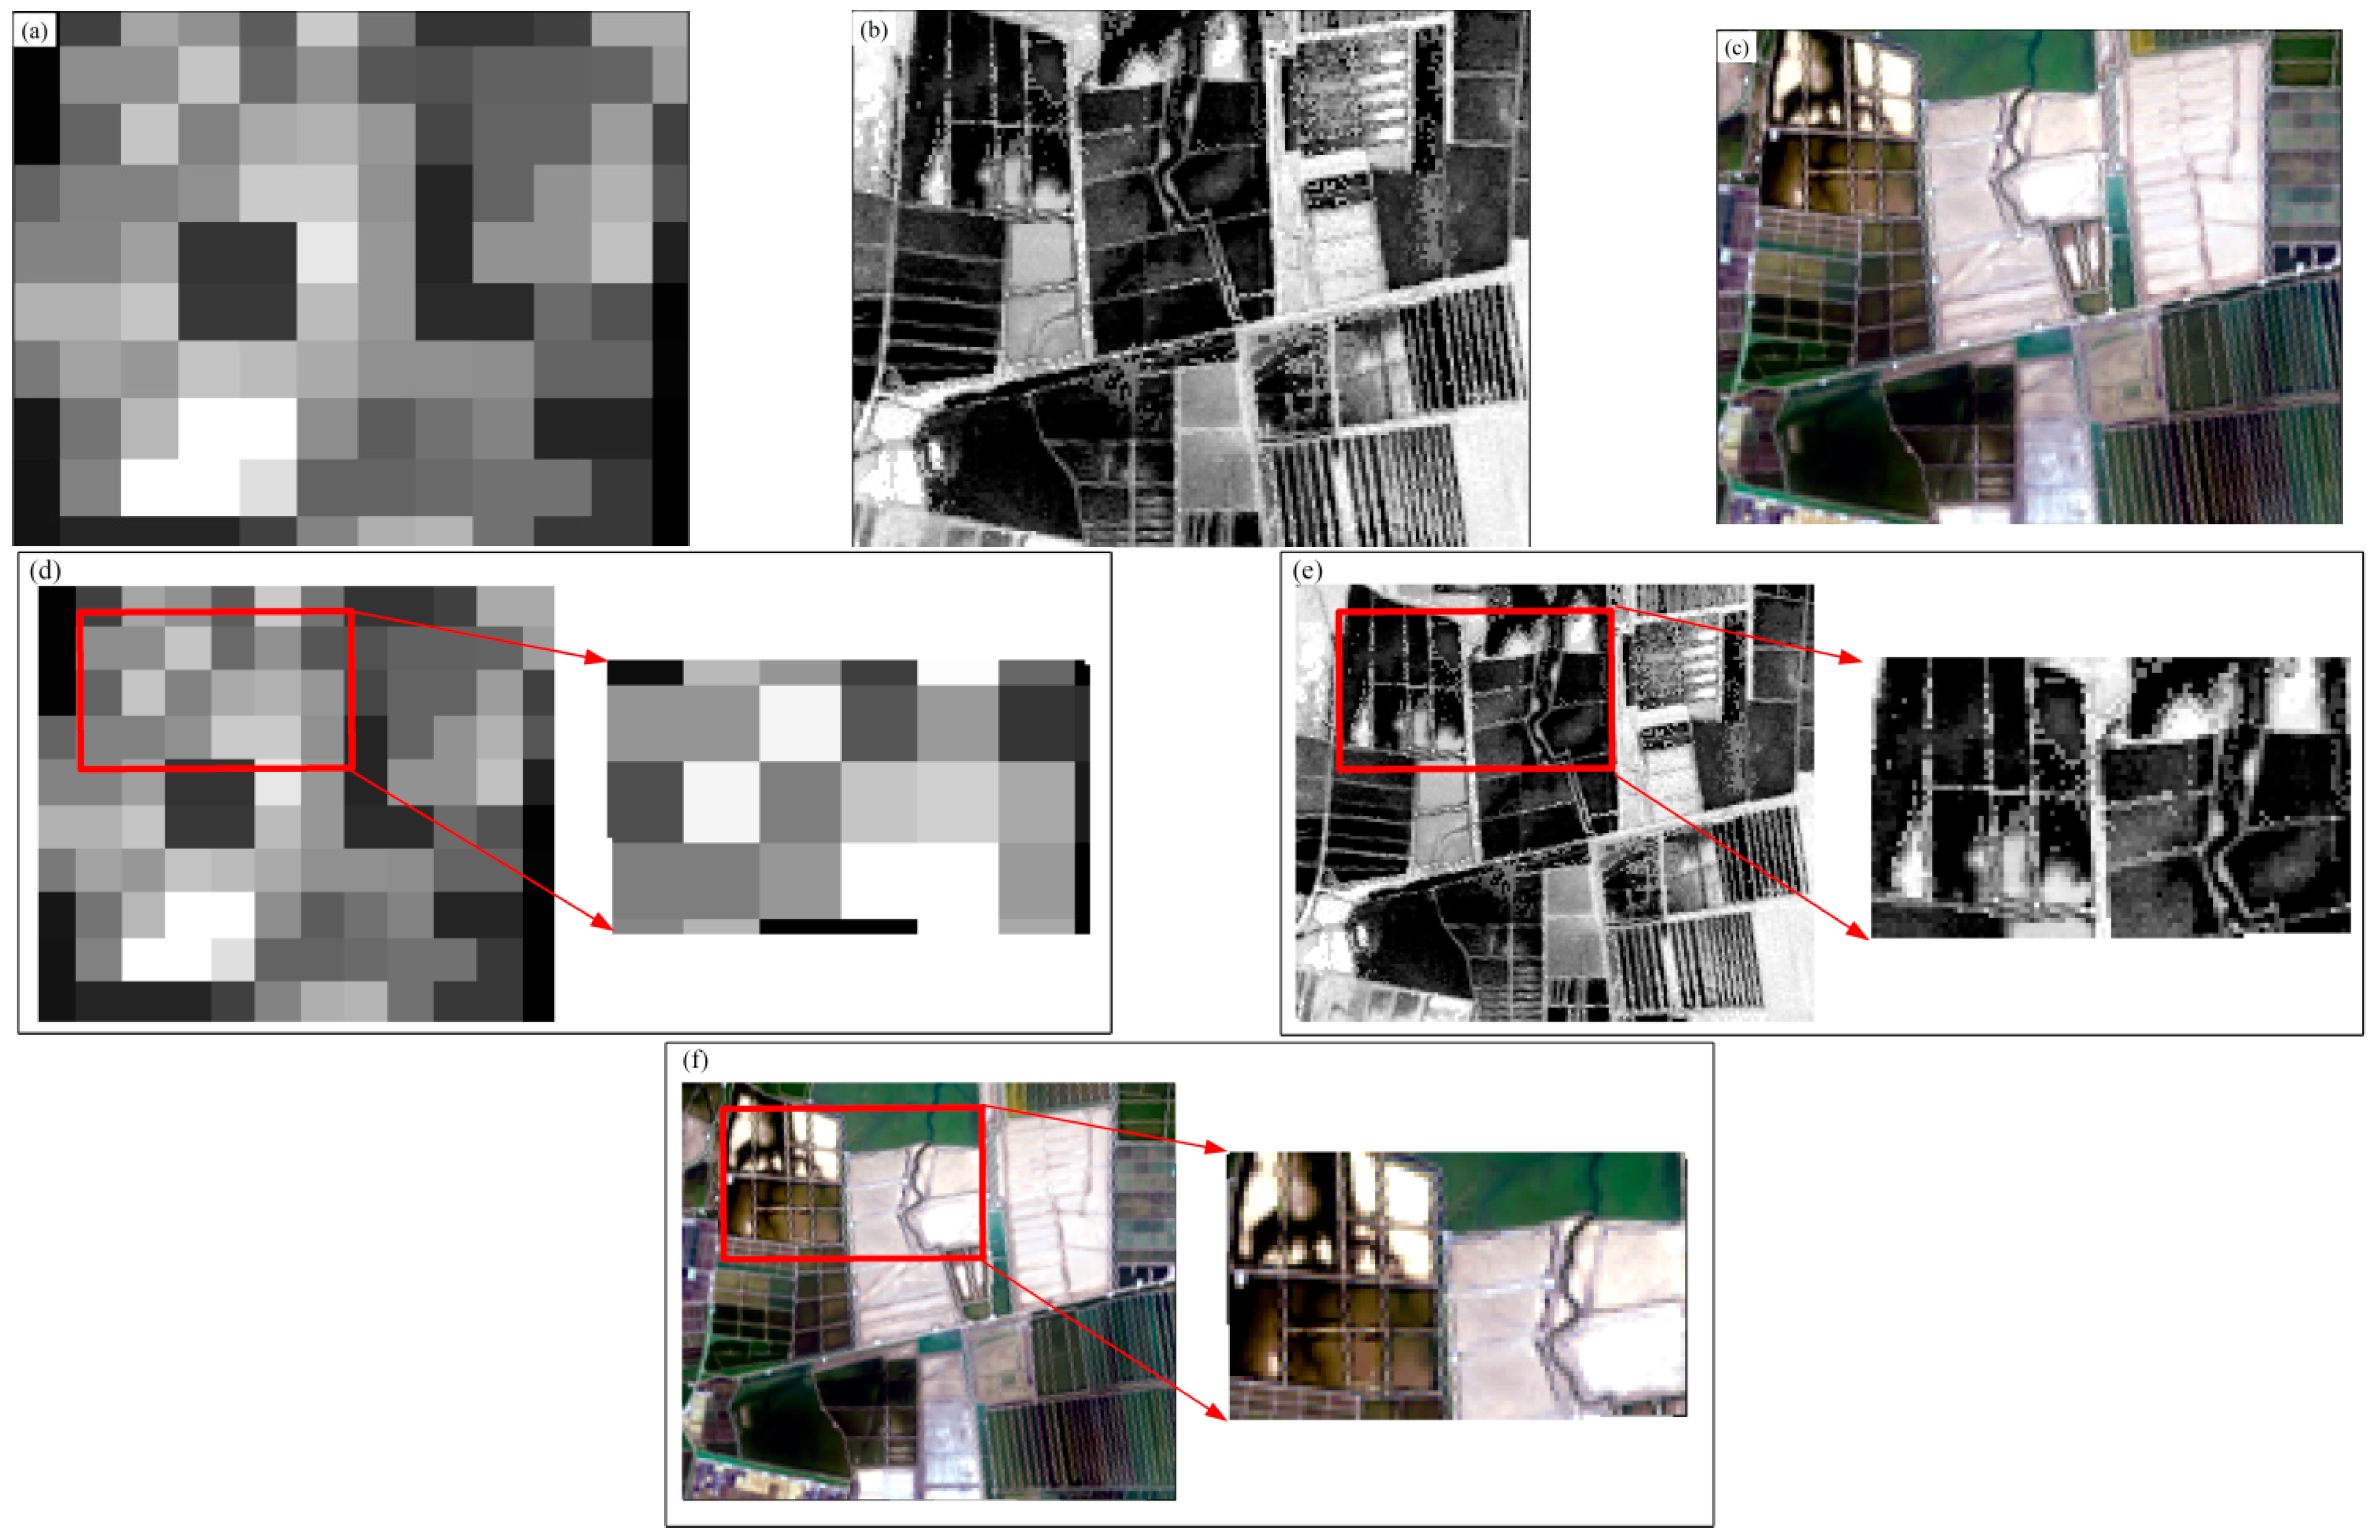
3.1. Construction of High-Spatiotemporal-Resolution Fusion Dataset Based on ESTARFM
3.2. Construction of Optimal Salinization Remote Sensing Monitoring Index Model
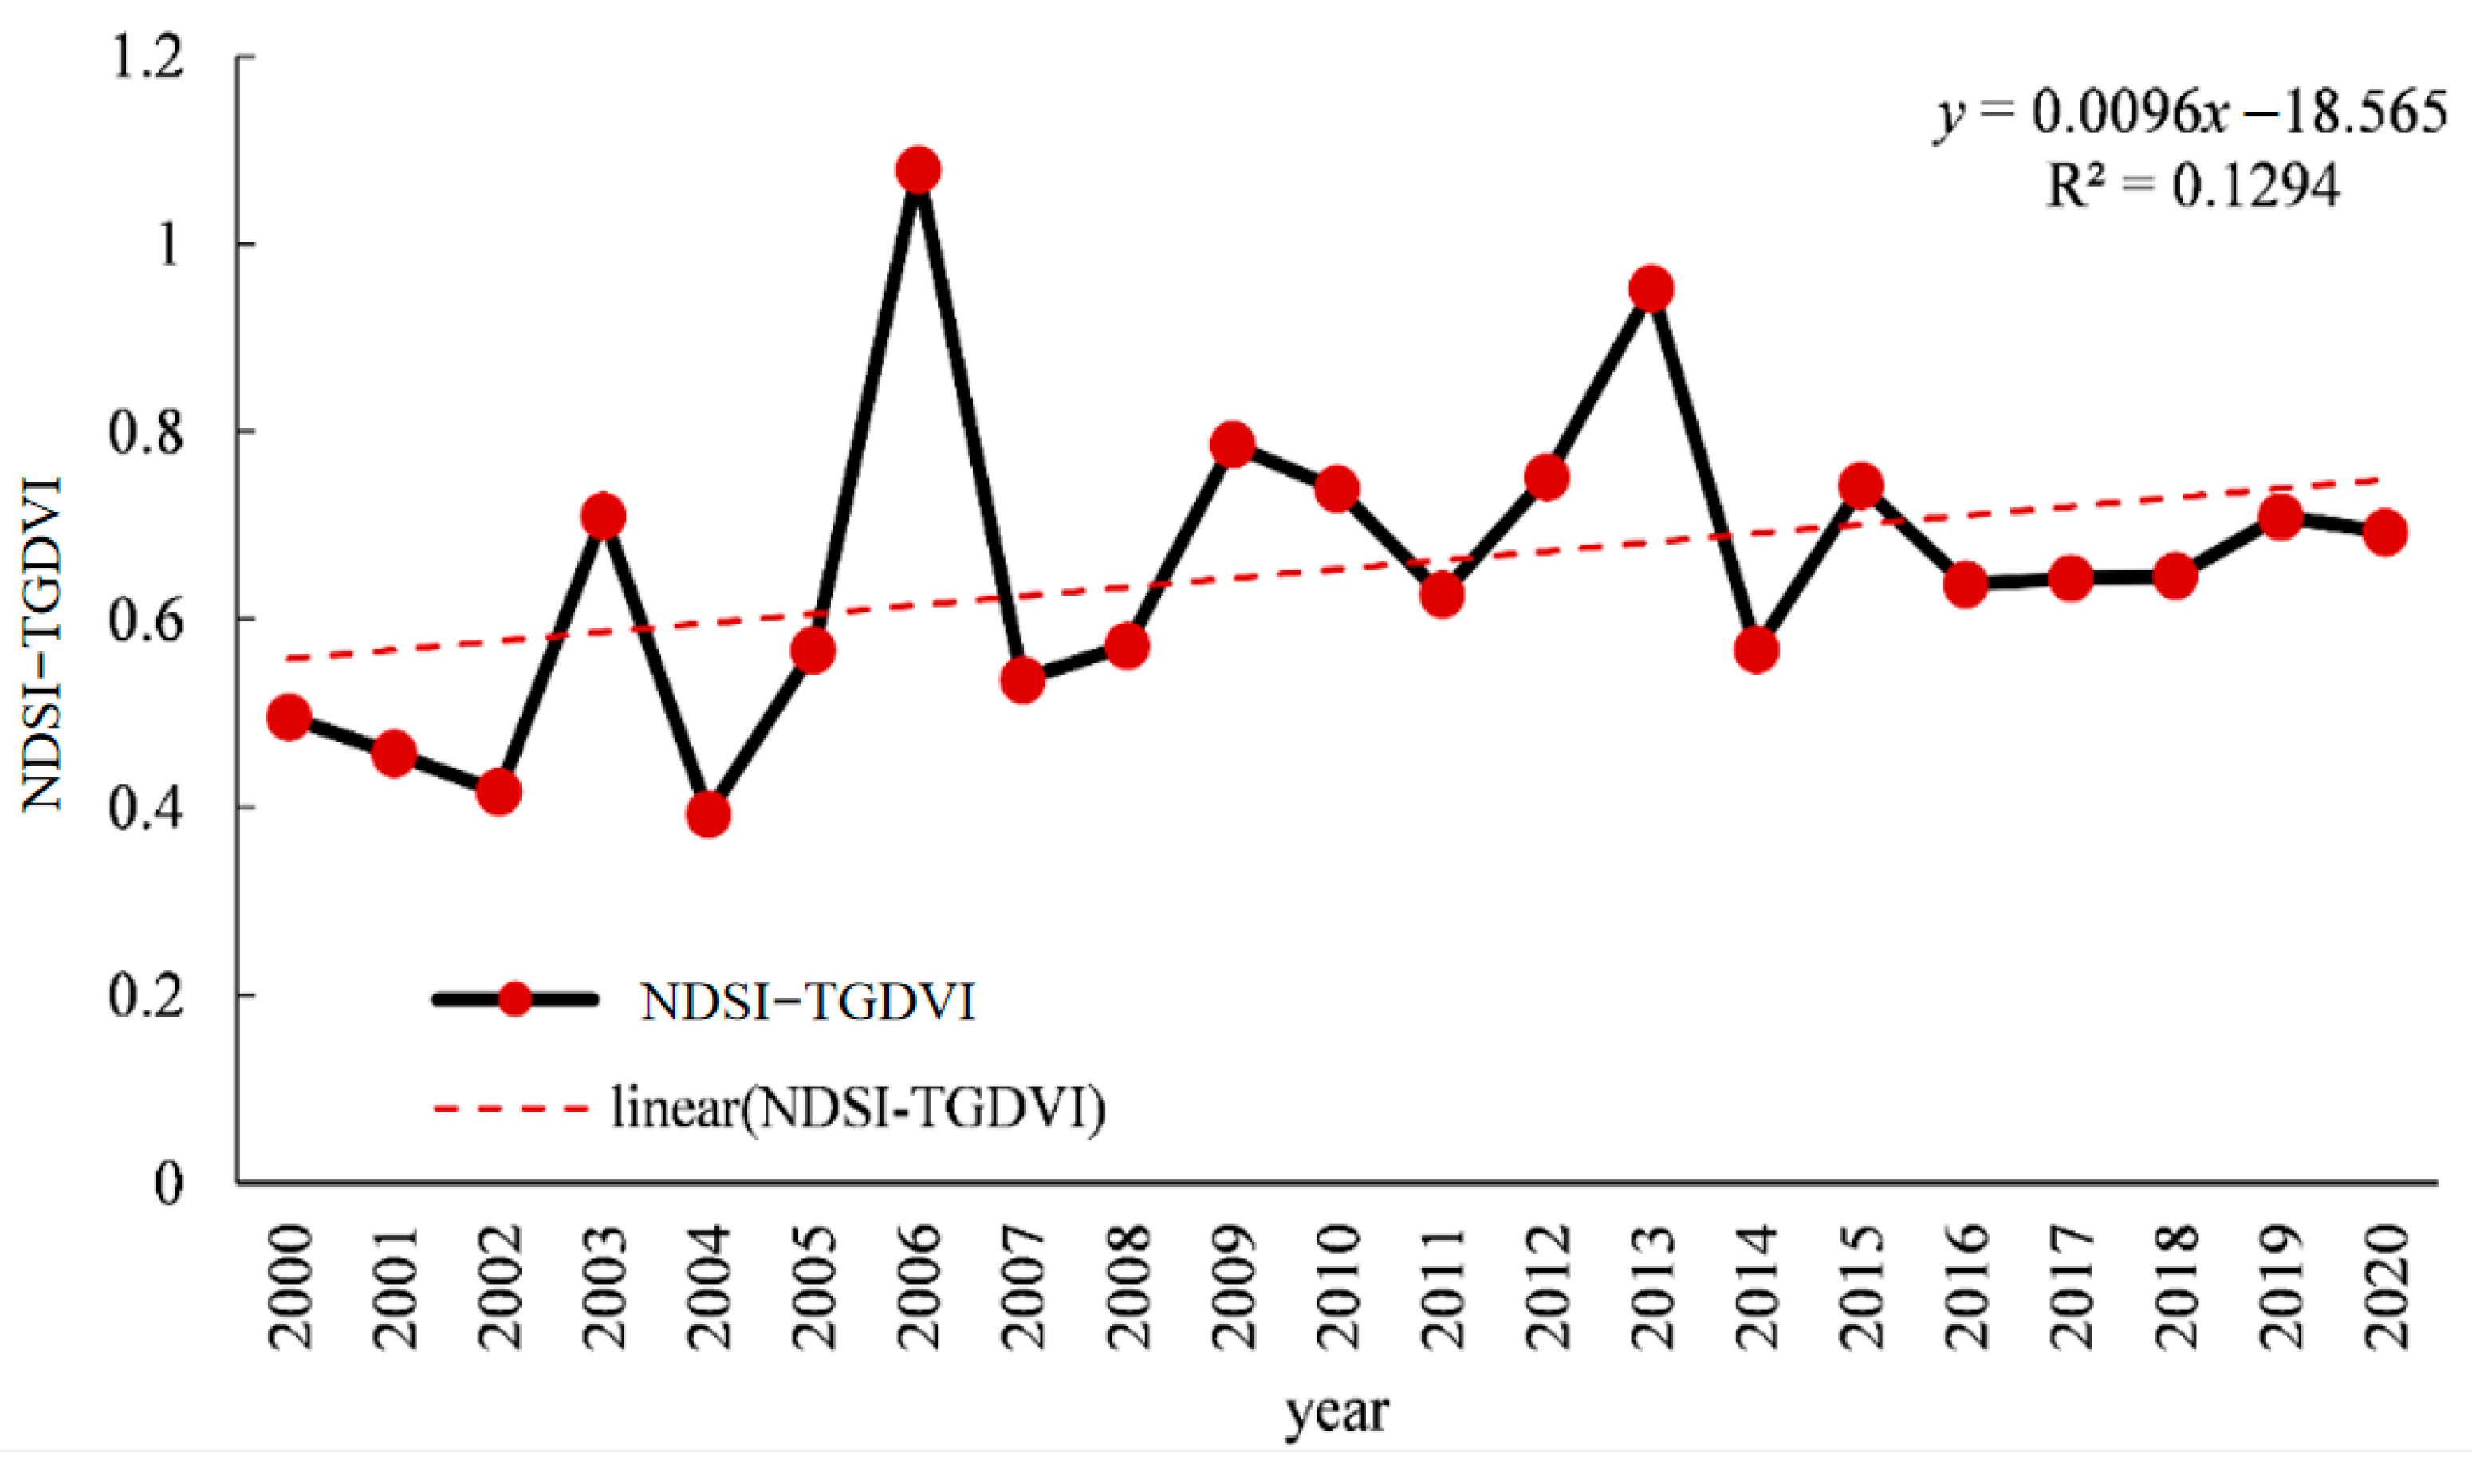
3.3. Temporal Changes in Salinization Monitoring Models from 2000 to 2020
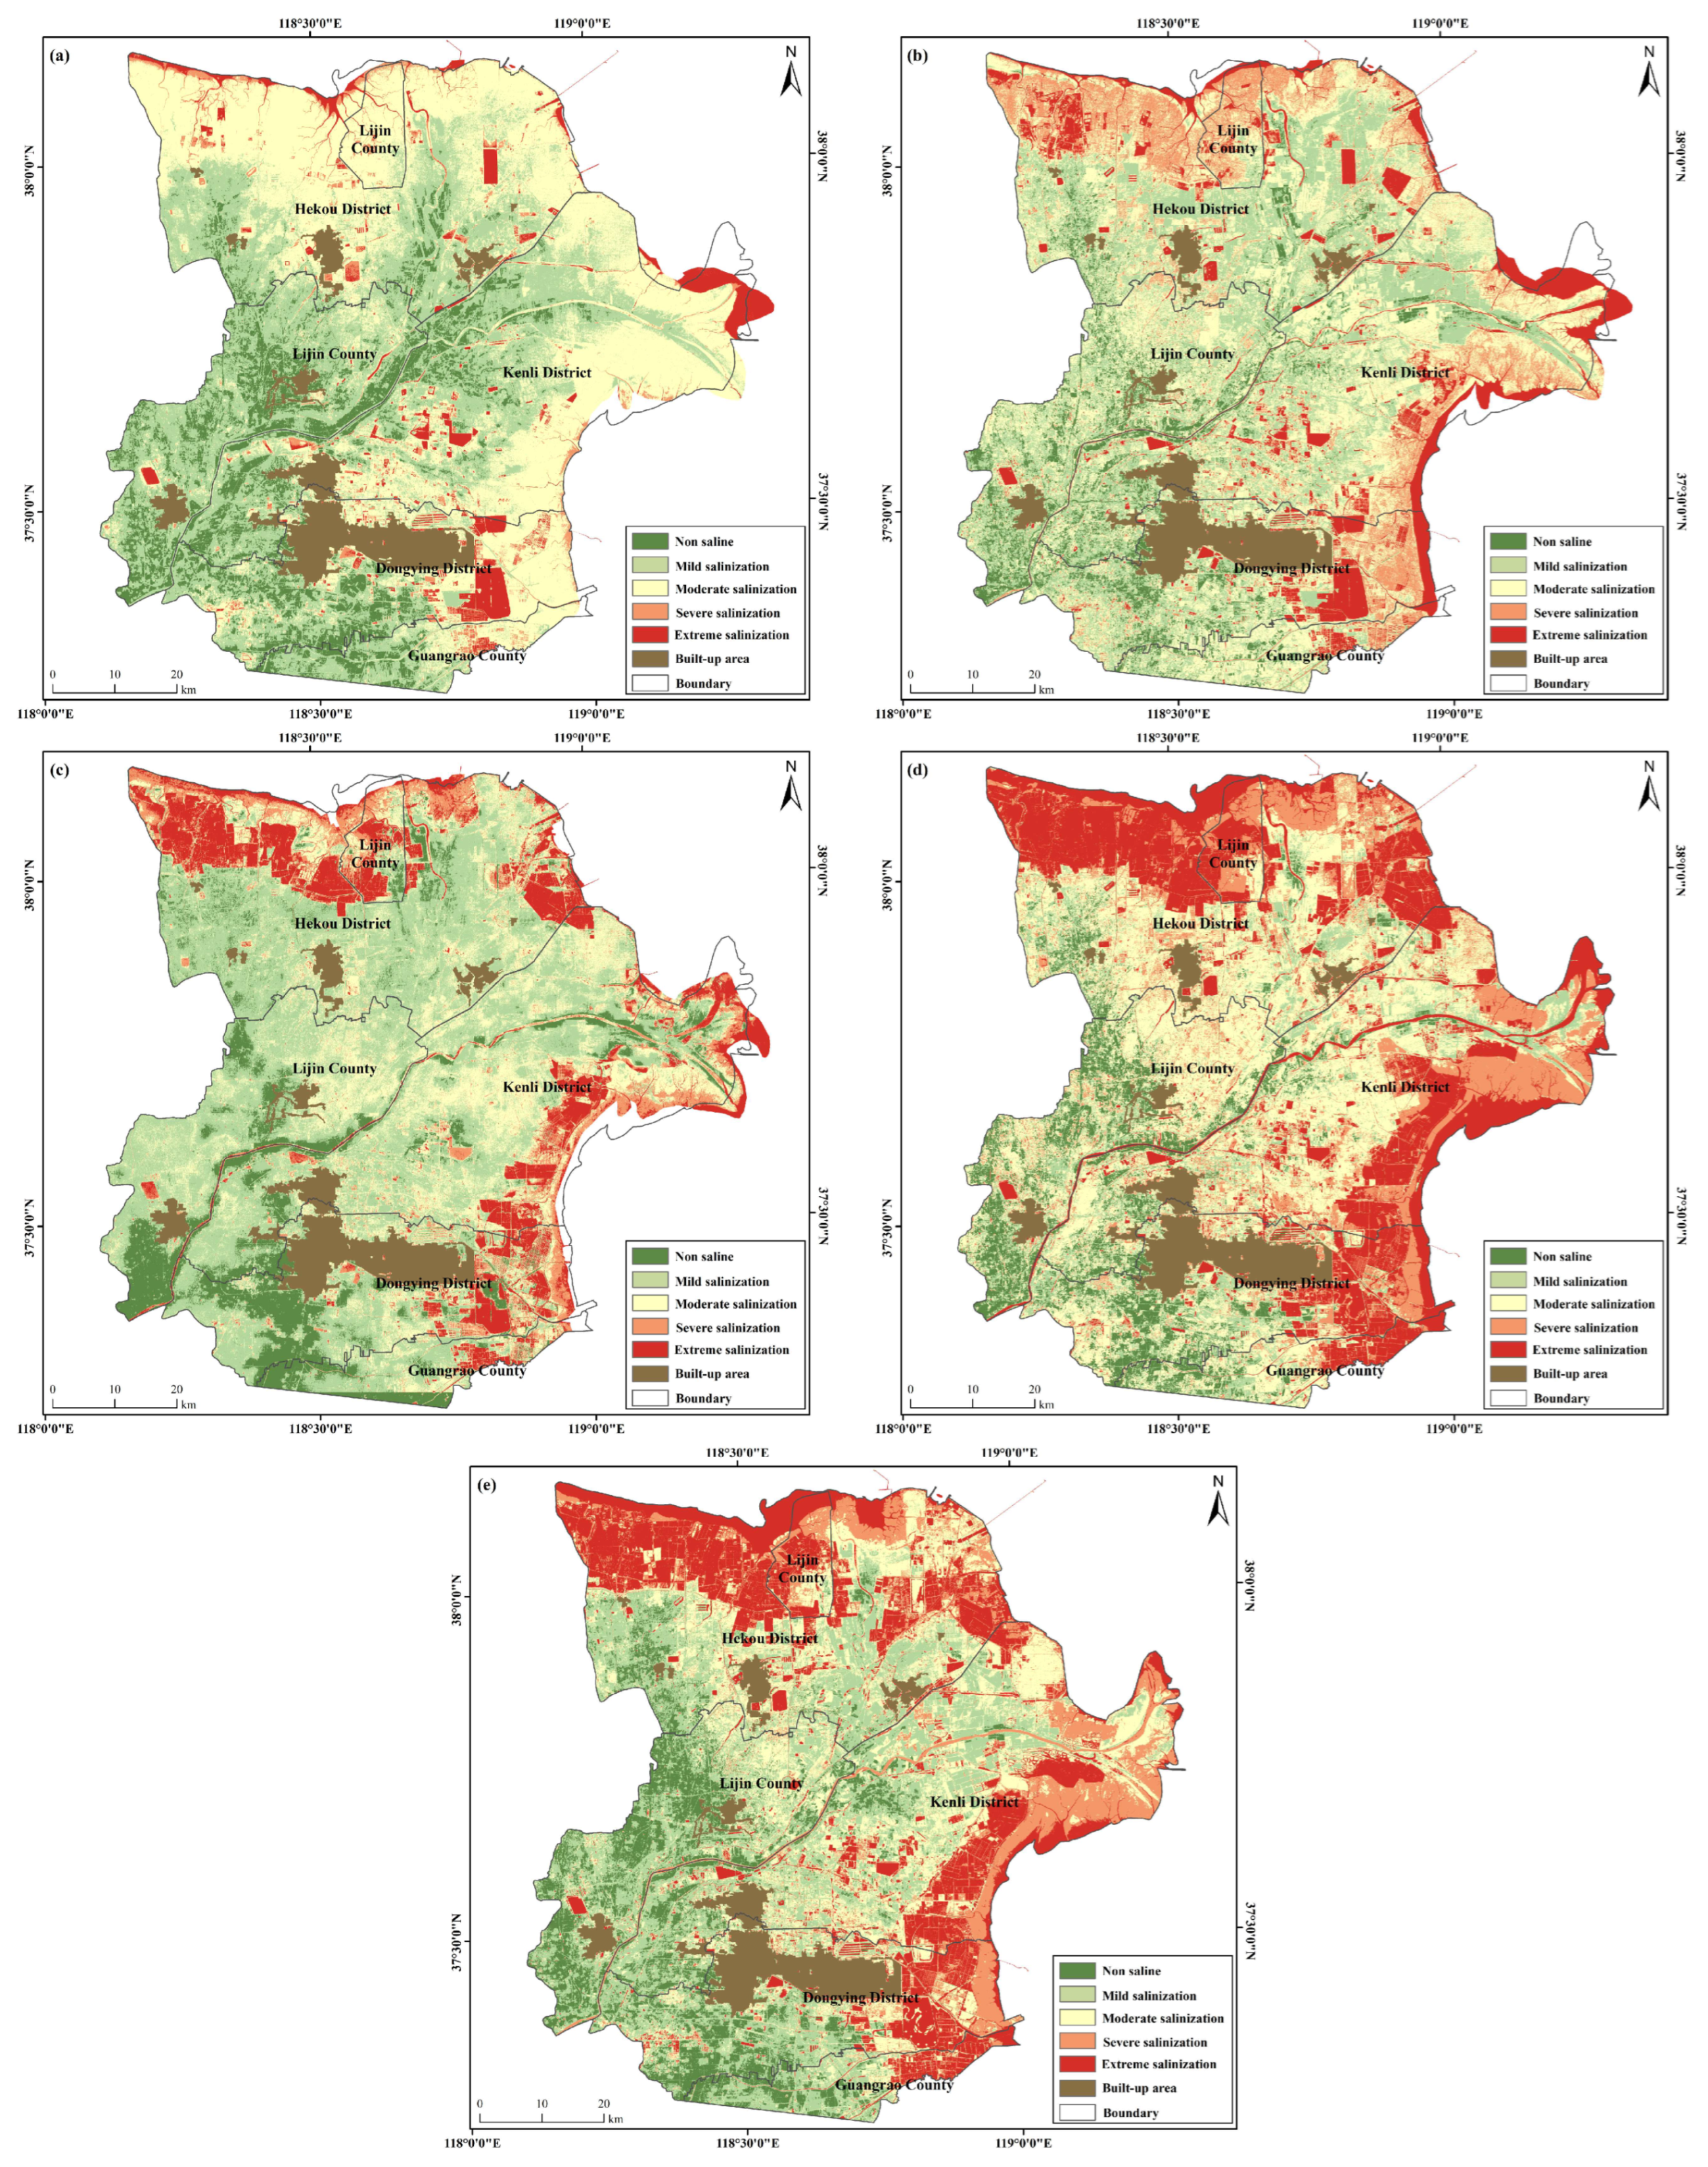
3.4. Spatial Distribution Changes in Different Levels of Salinization from 2000 to 2020
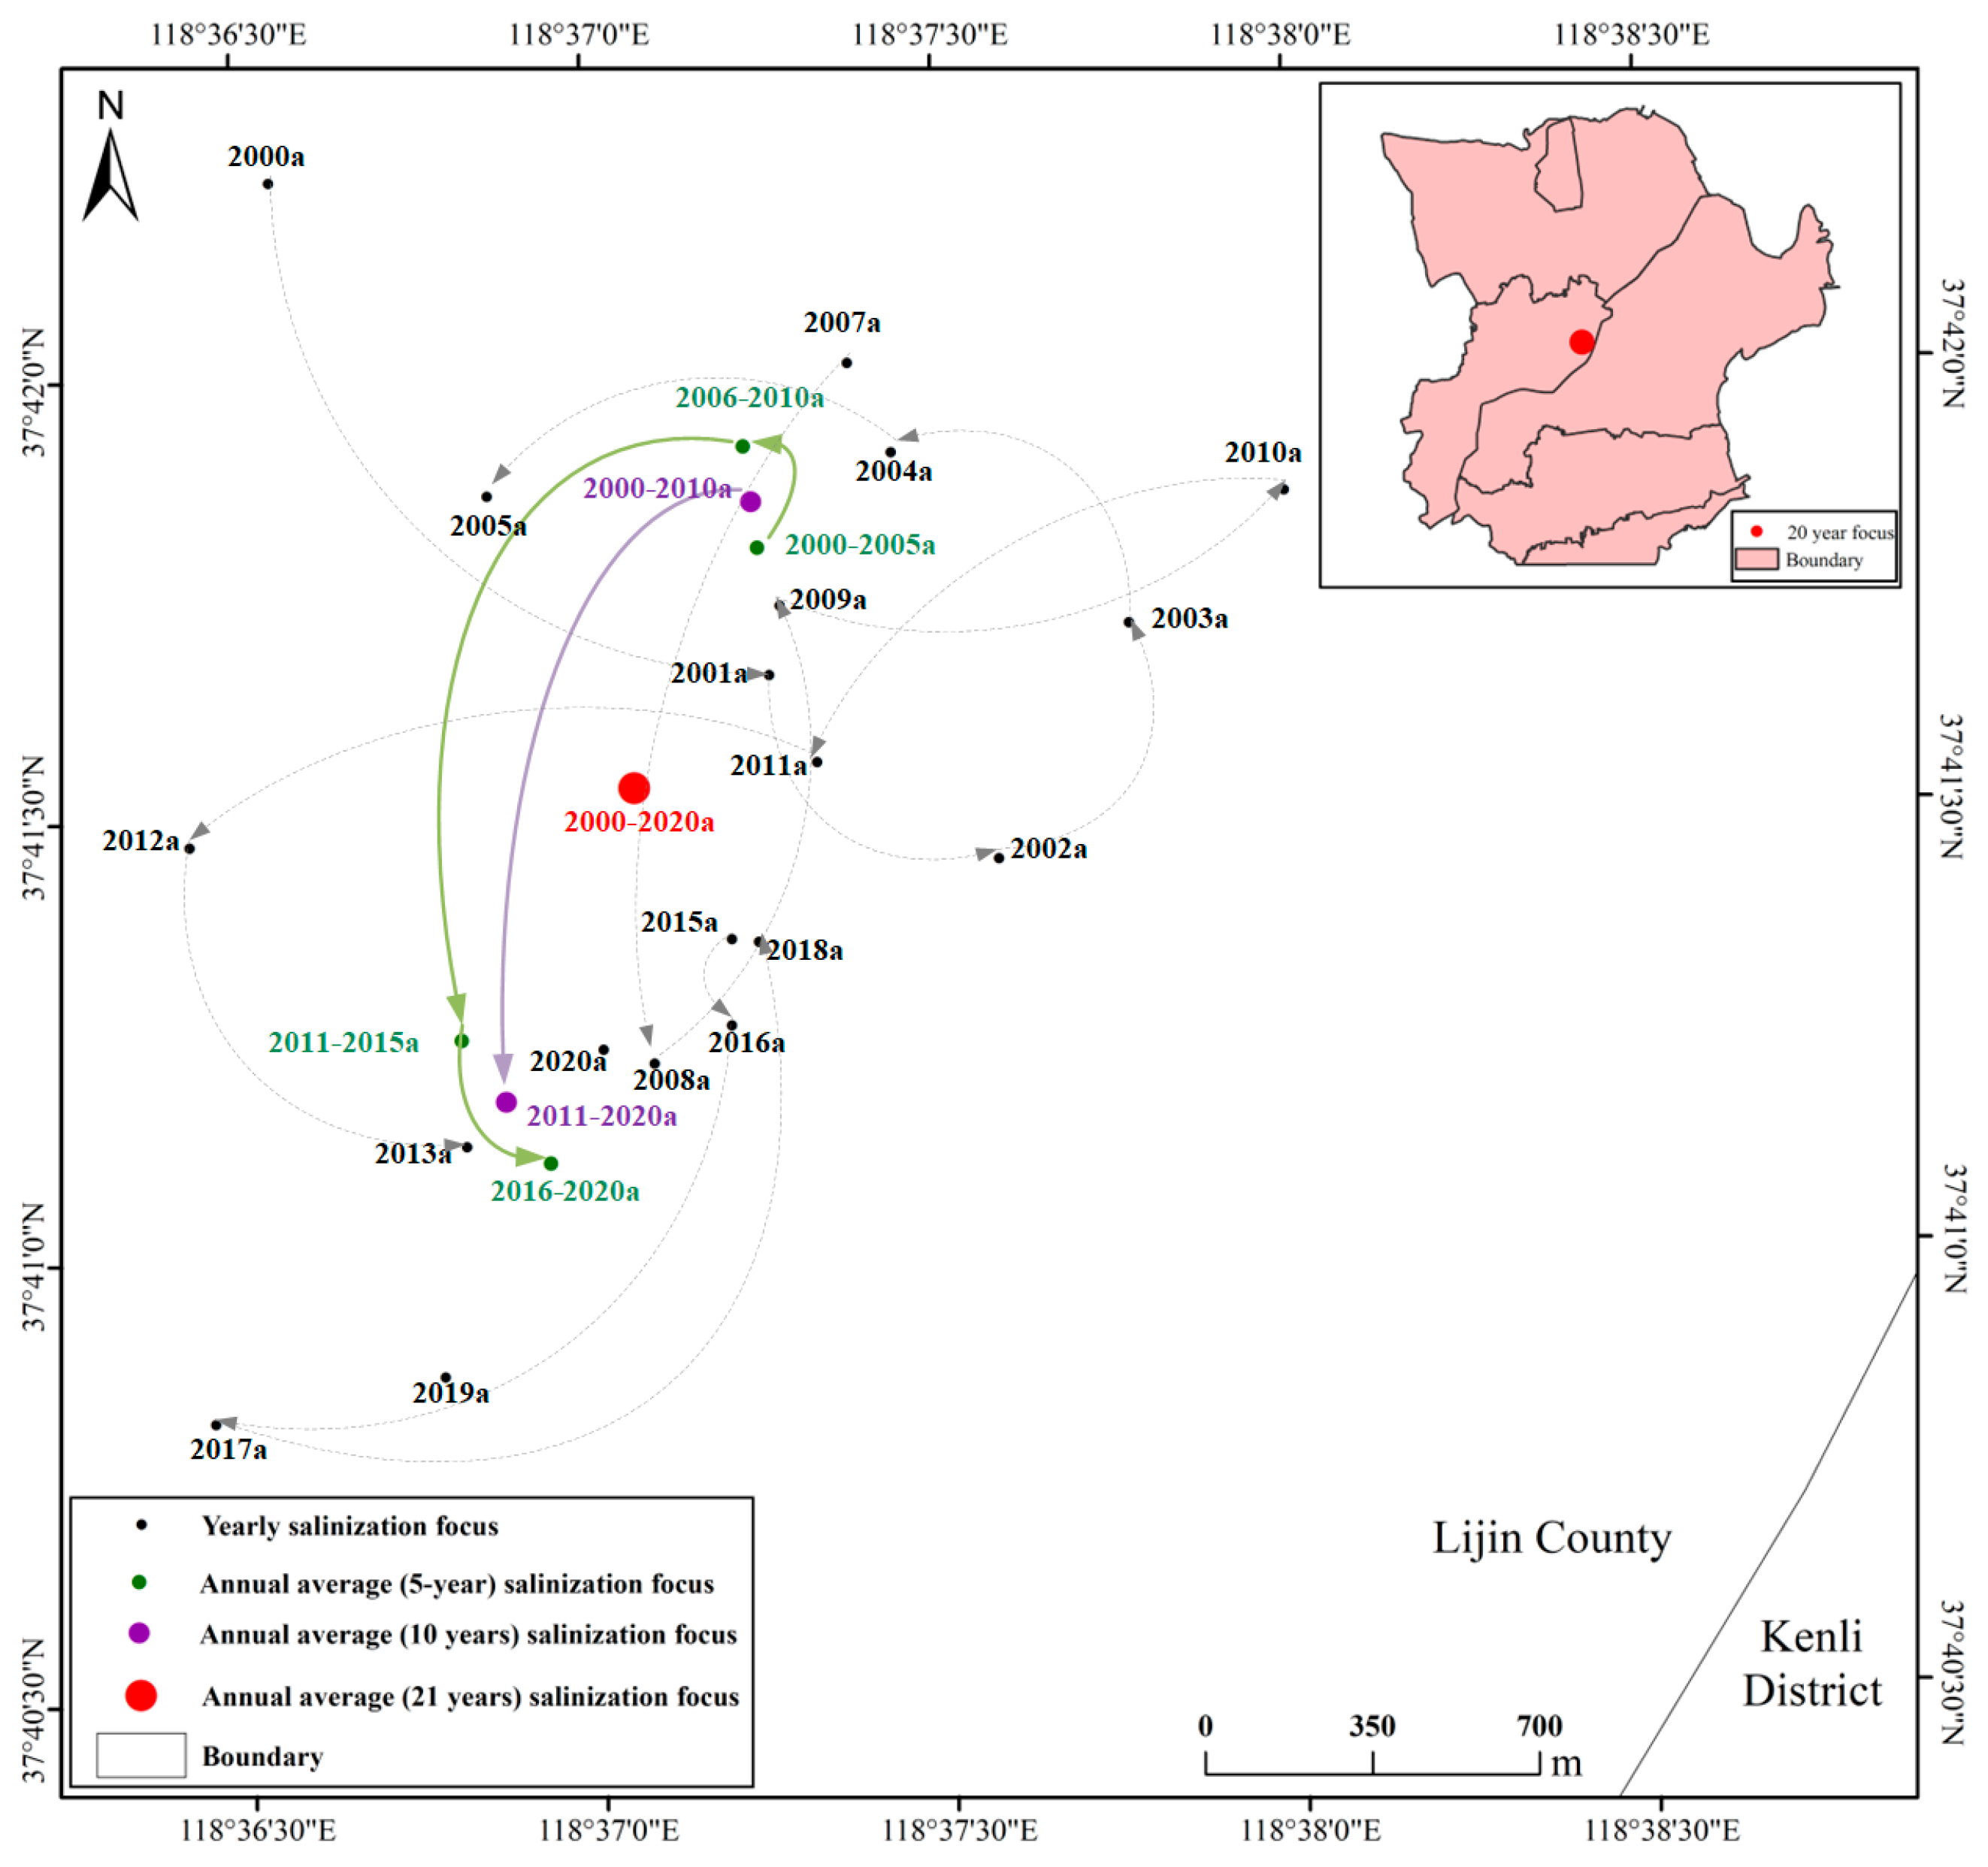
3.5. Migration Trajectory of Soil Salinization Gravity Center in the Yellow River Delta from 2000 to 2020
3.6. Dominant Driving Factor of Salinization Evolution
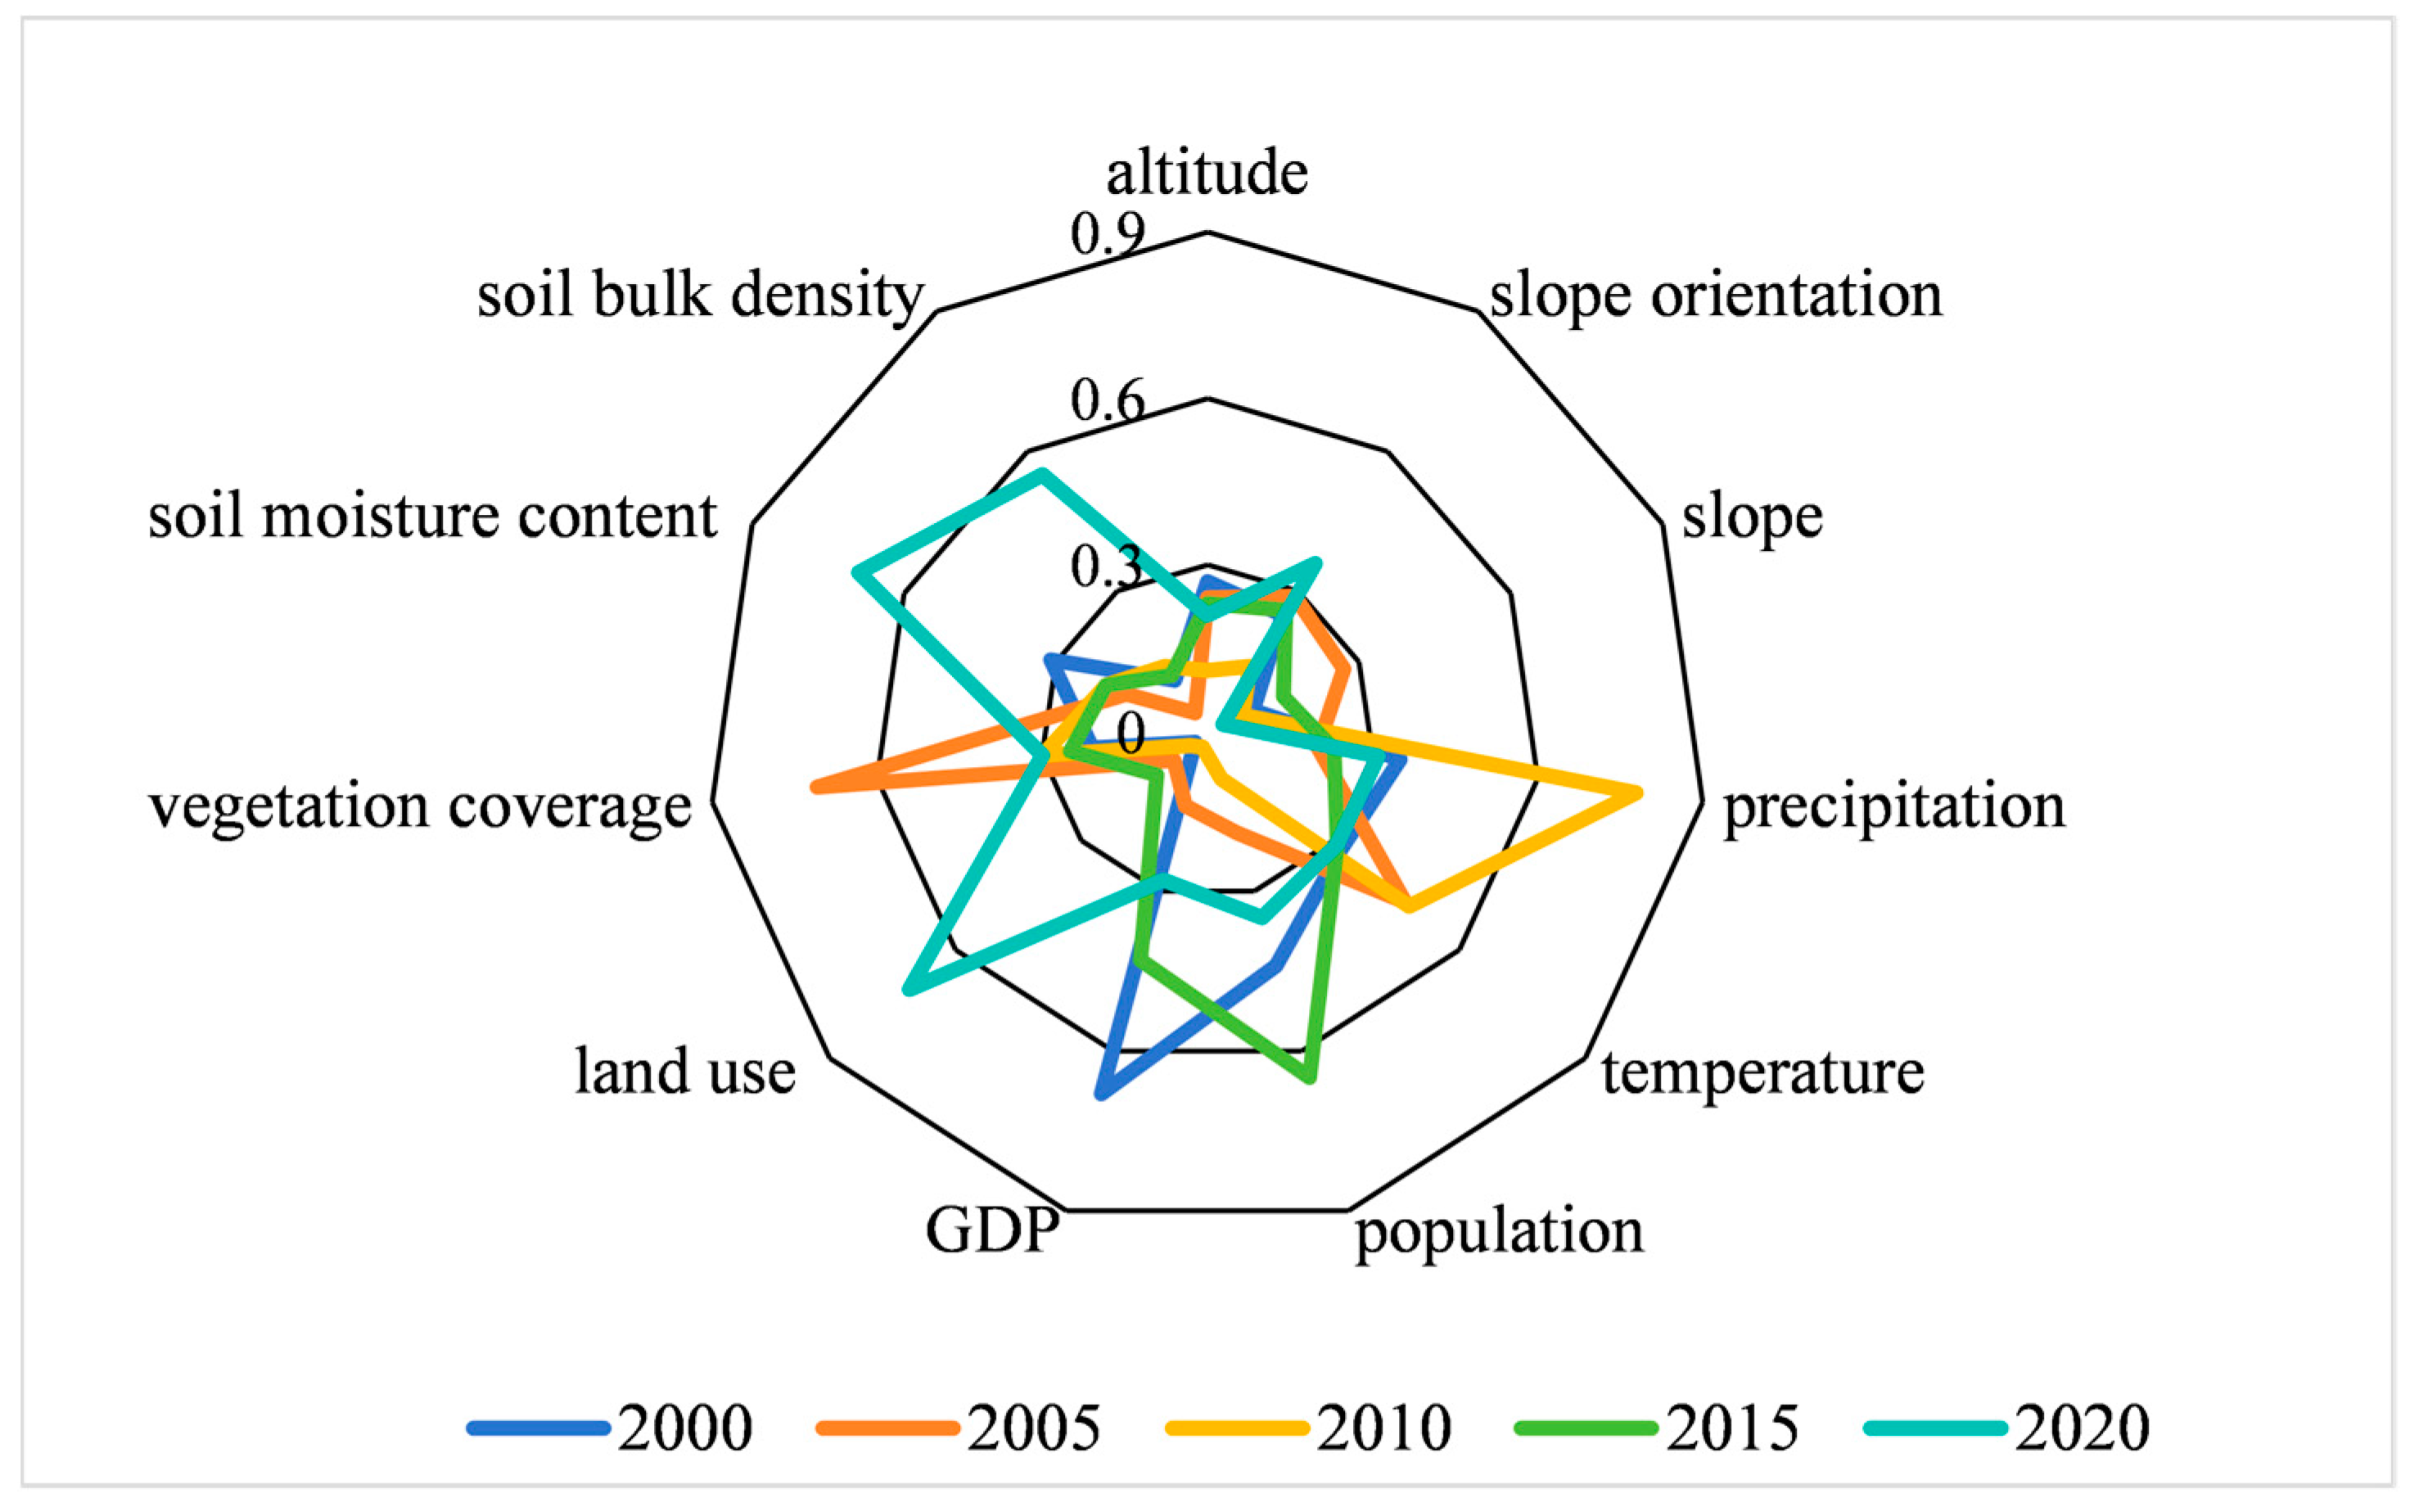
3.6.1. Dominant Single Factors in the Evolution of Salinization
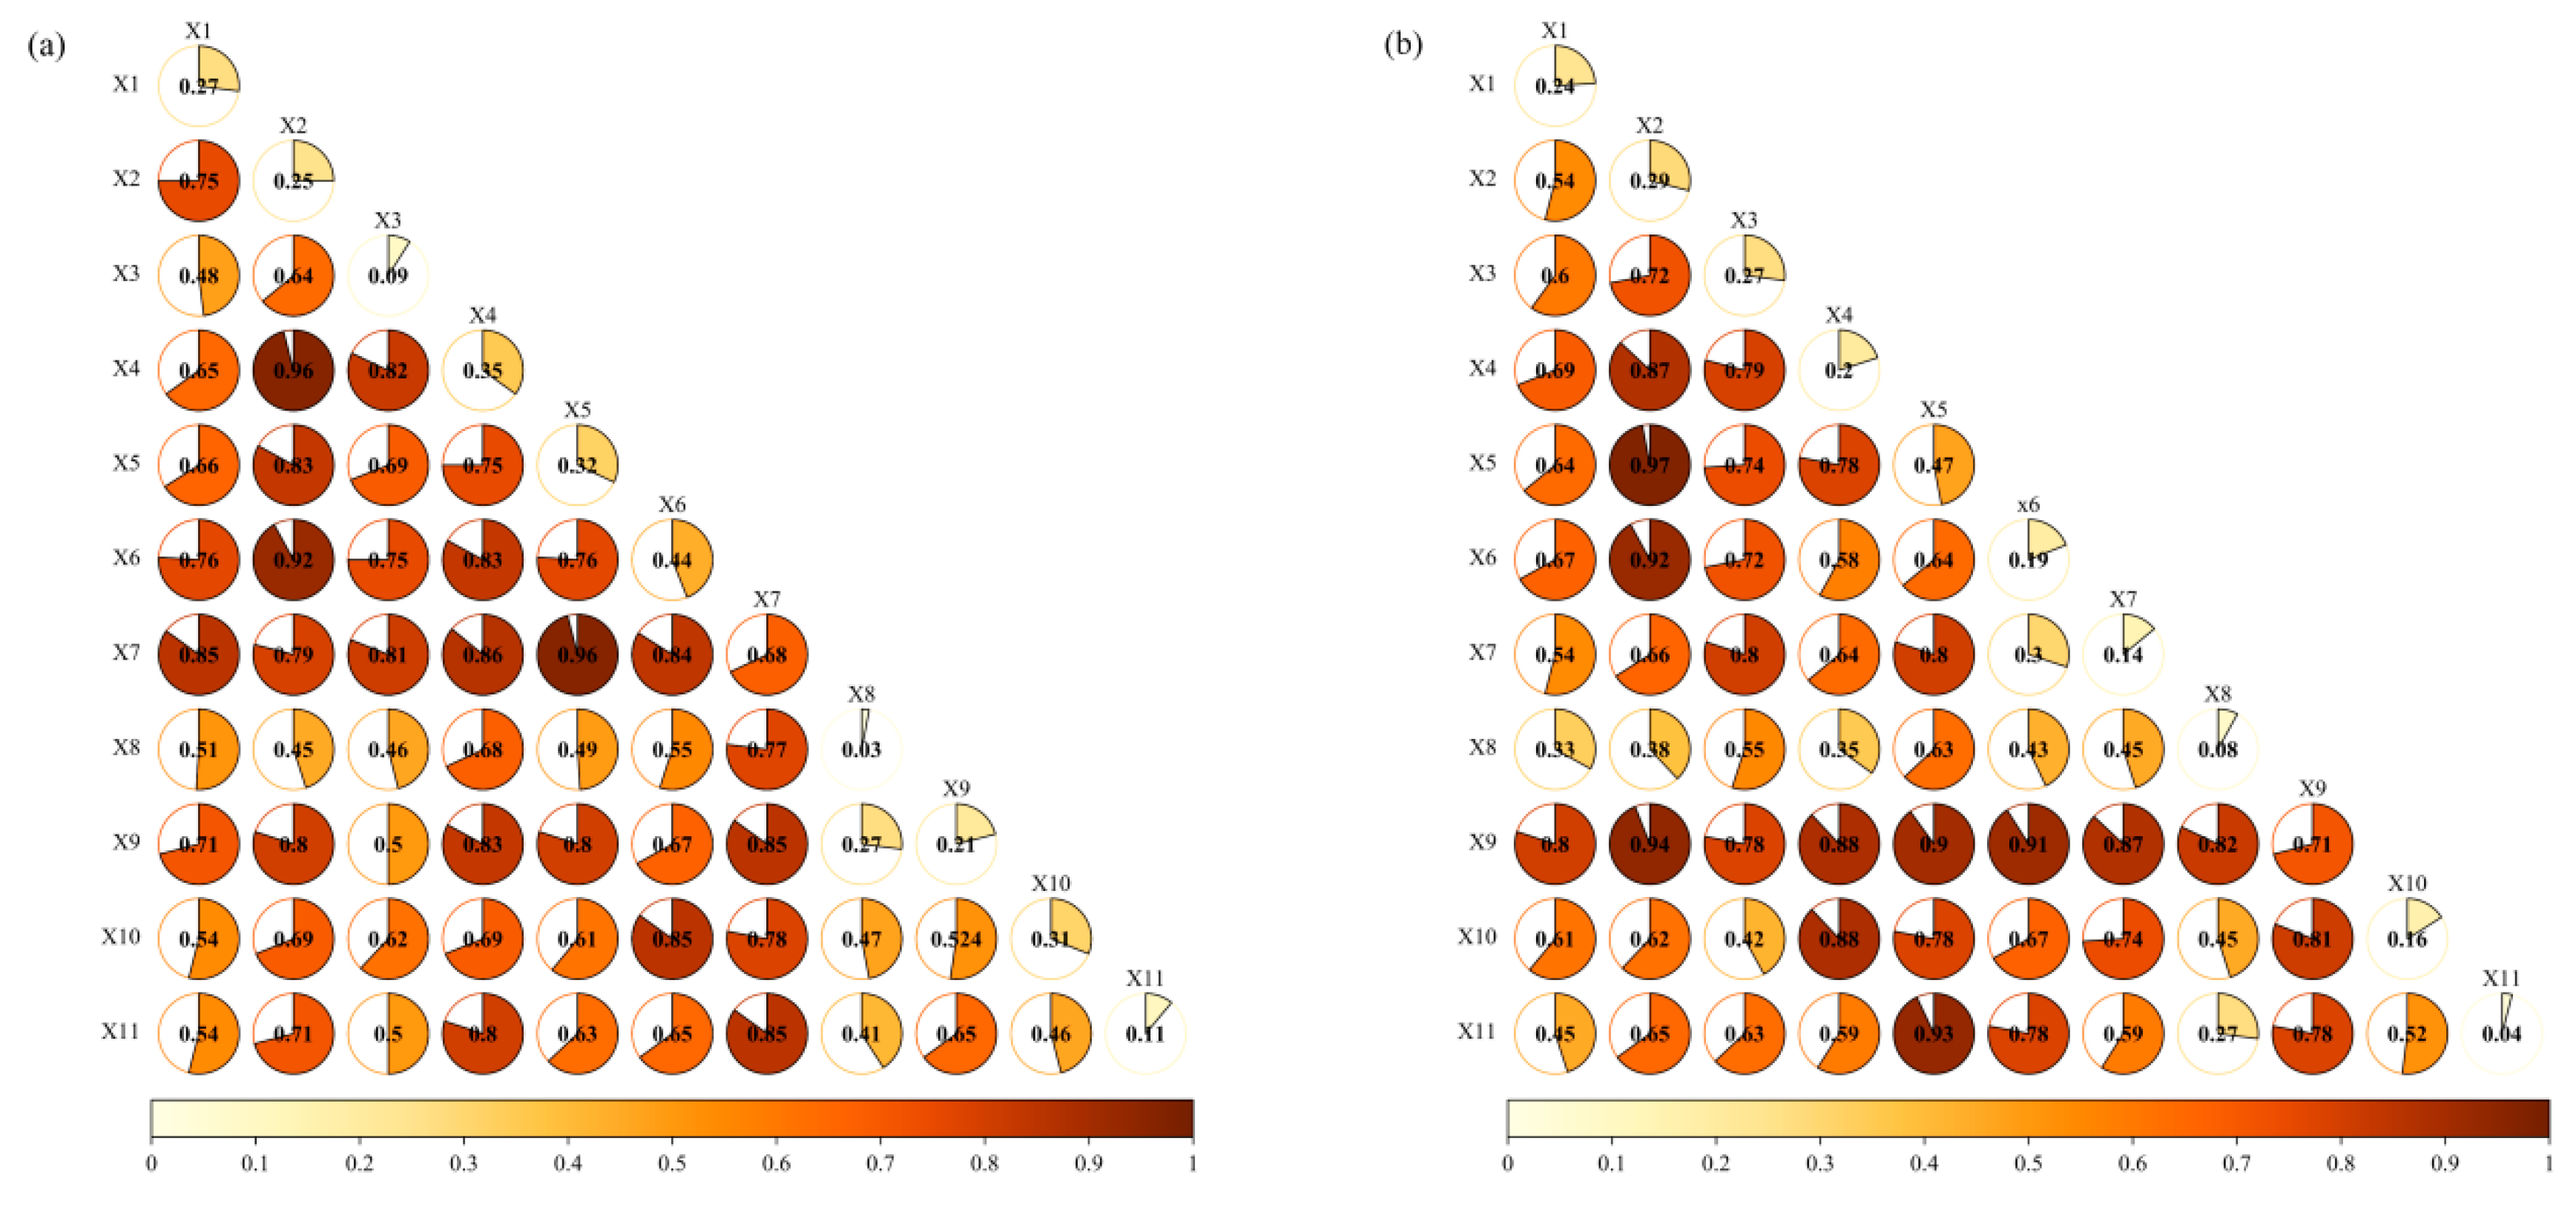
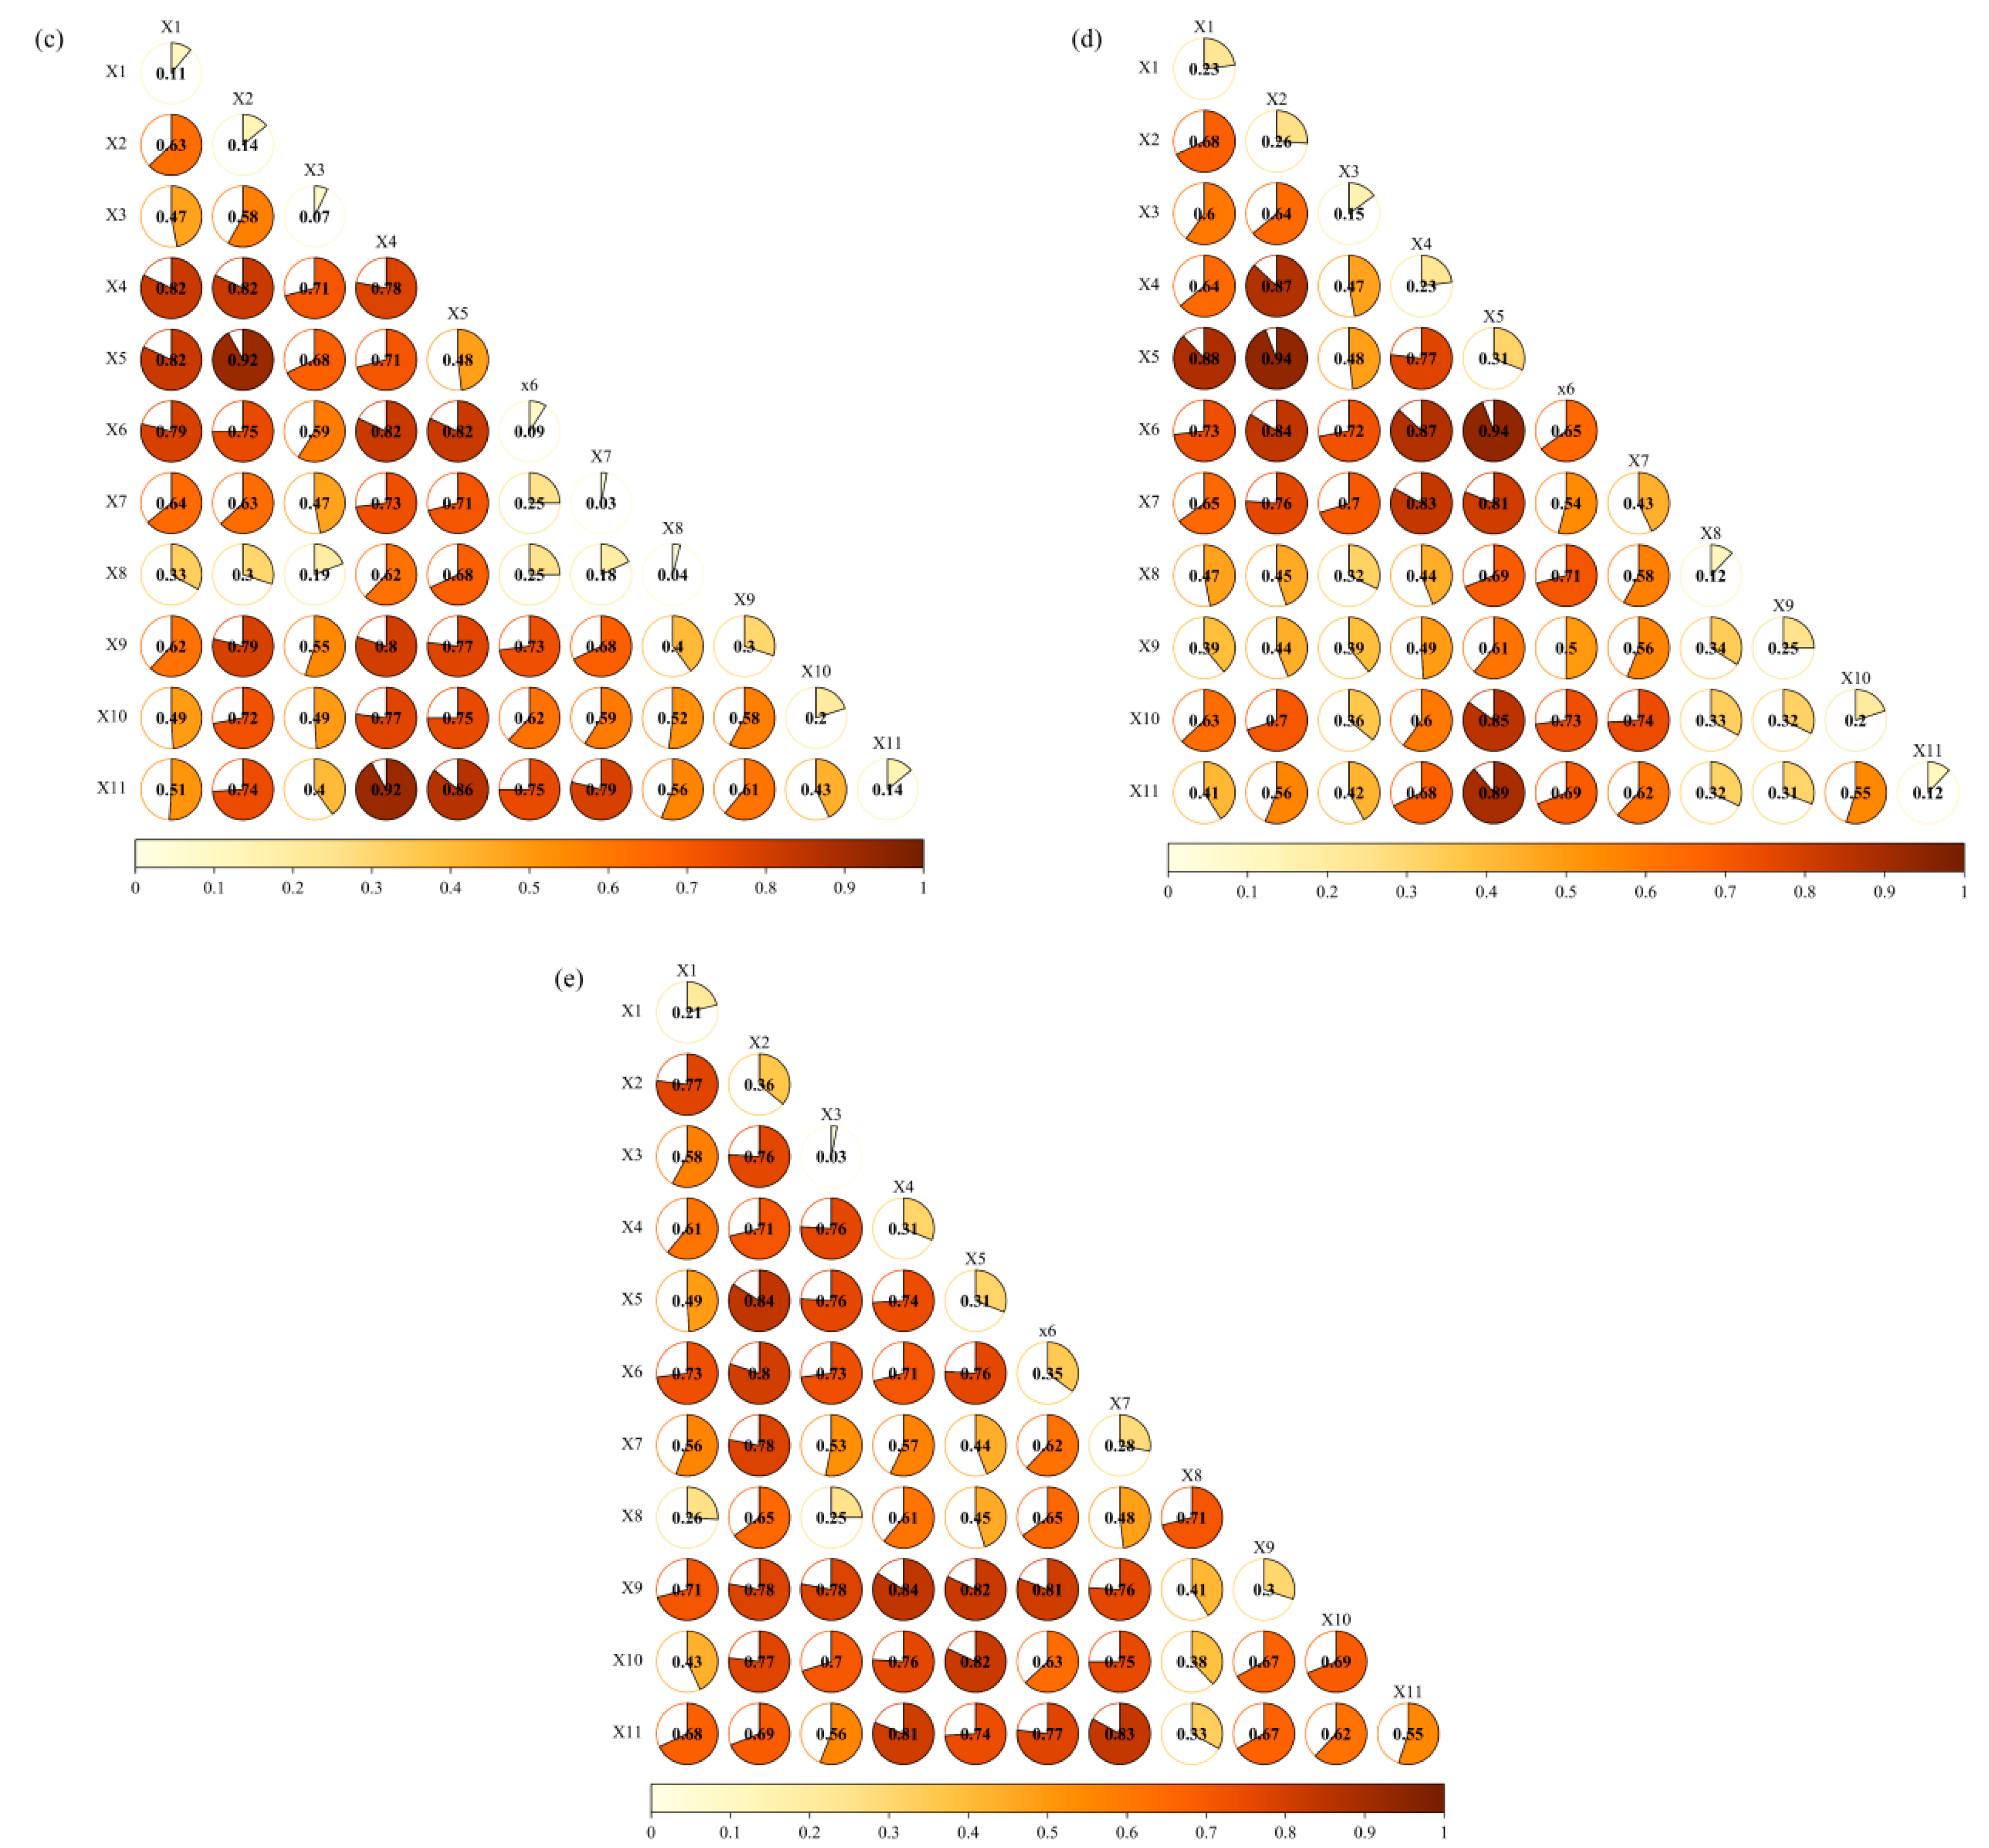
3.6.2. Dominant Interactive Factors in the Evolution of Salinization
4. Discussion
4.1. Advantages of Research Model
4.2. Recent Causes of Soil Salinization Changes in the Yellow River Delta
4.3. Analysis of the Driving Mechanism of Soil Salinization
5. Conclusions
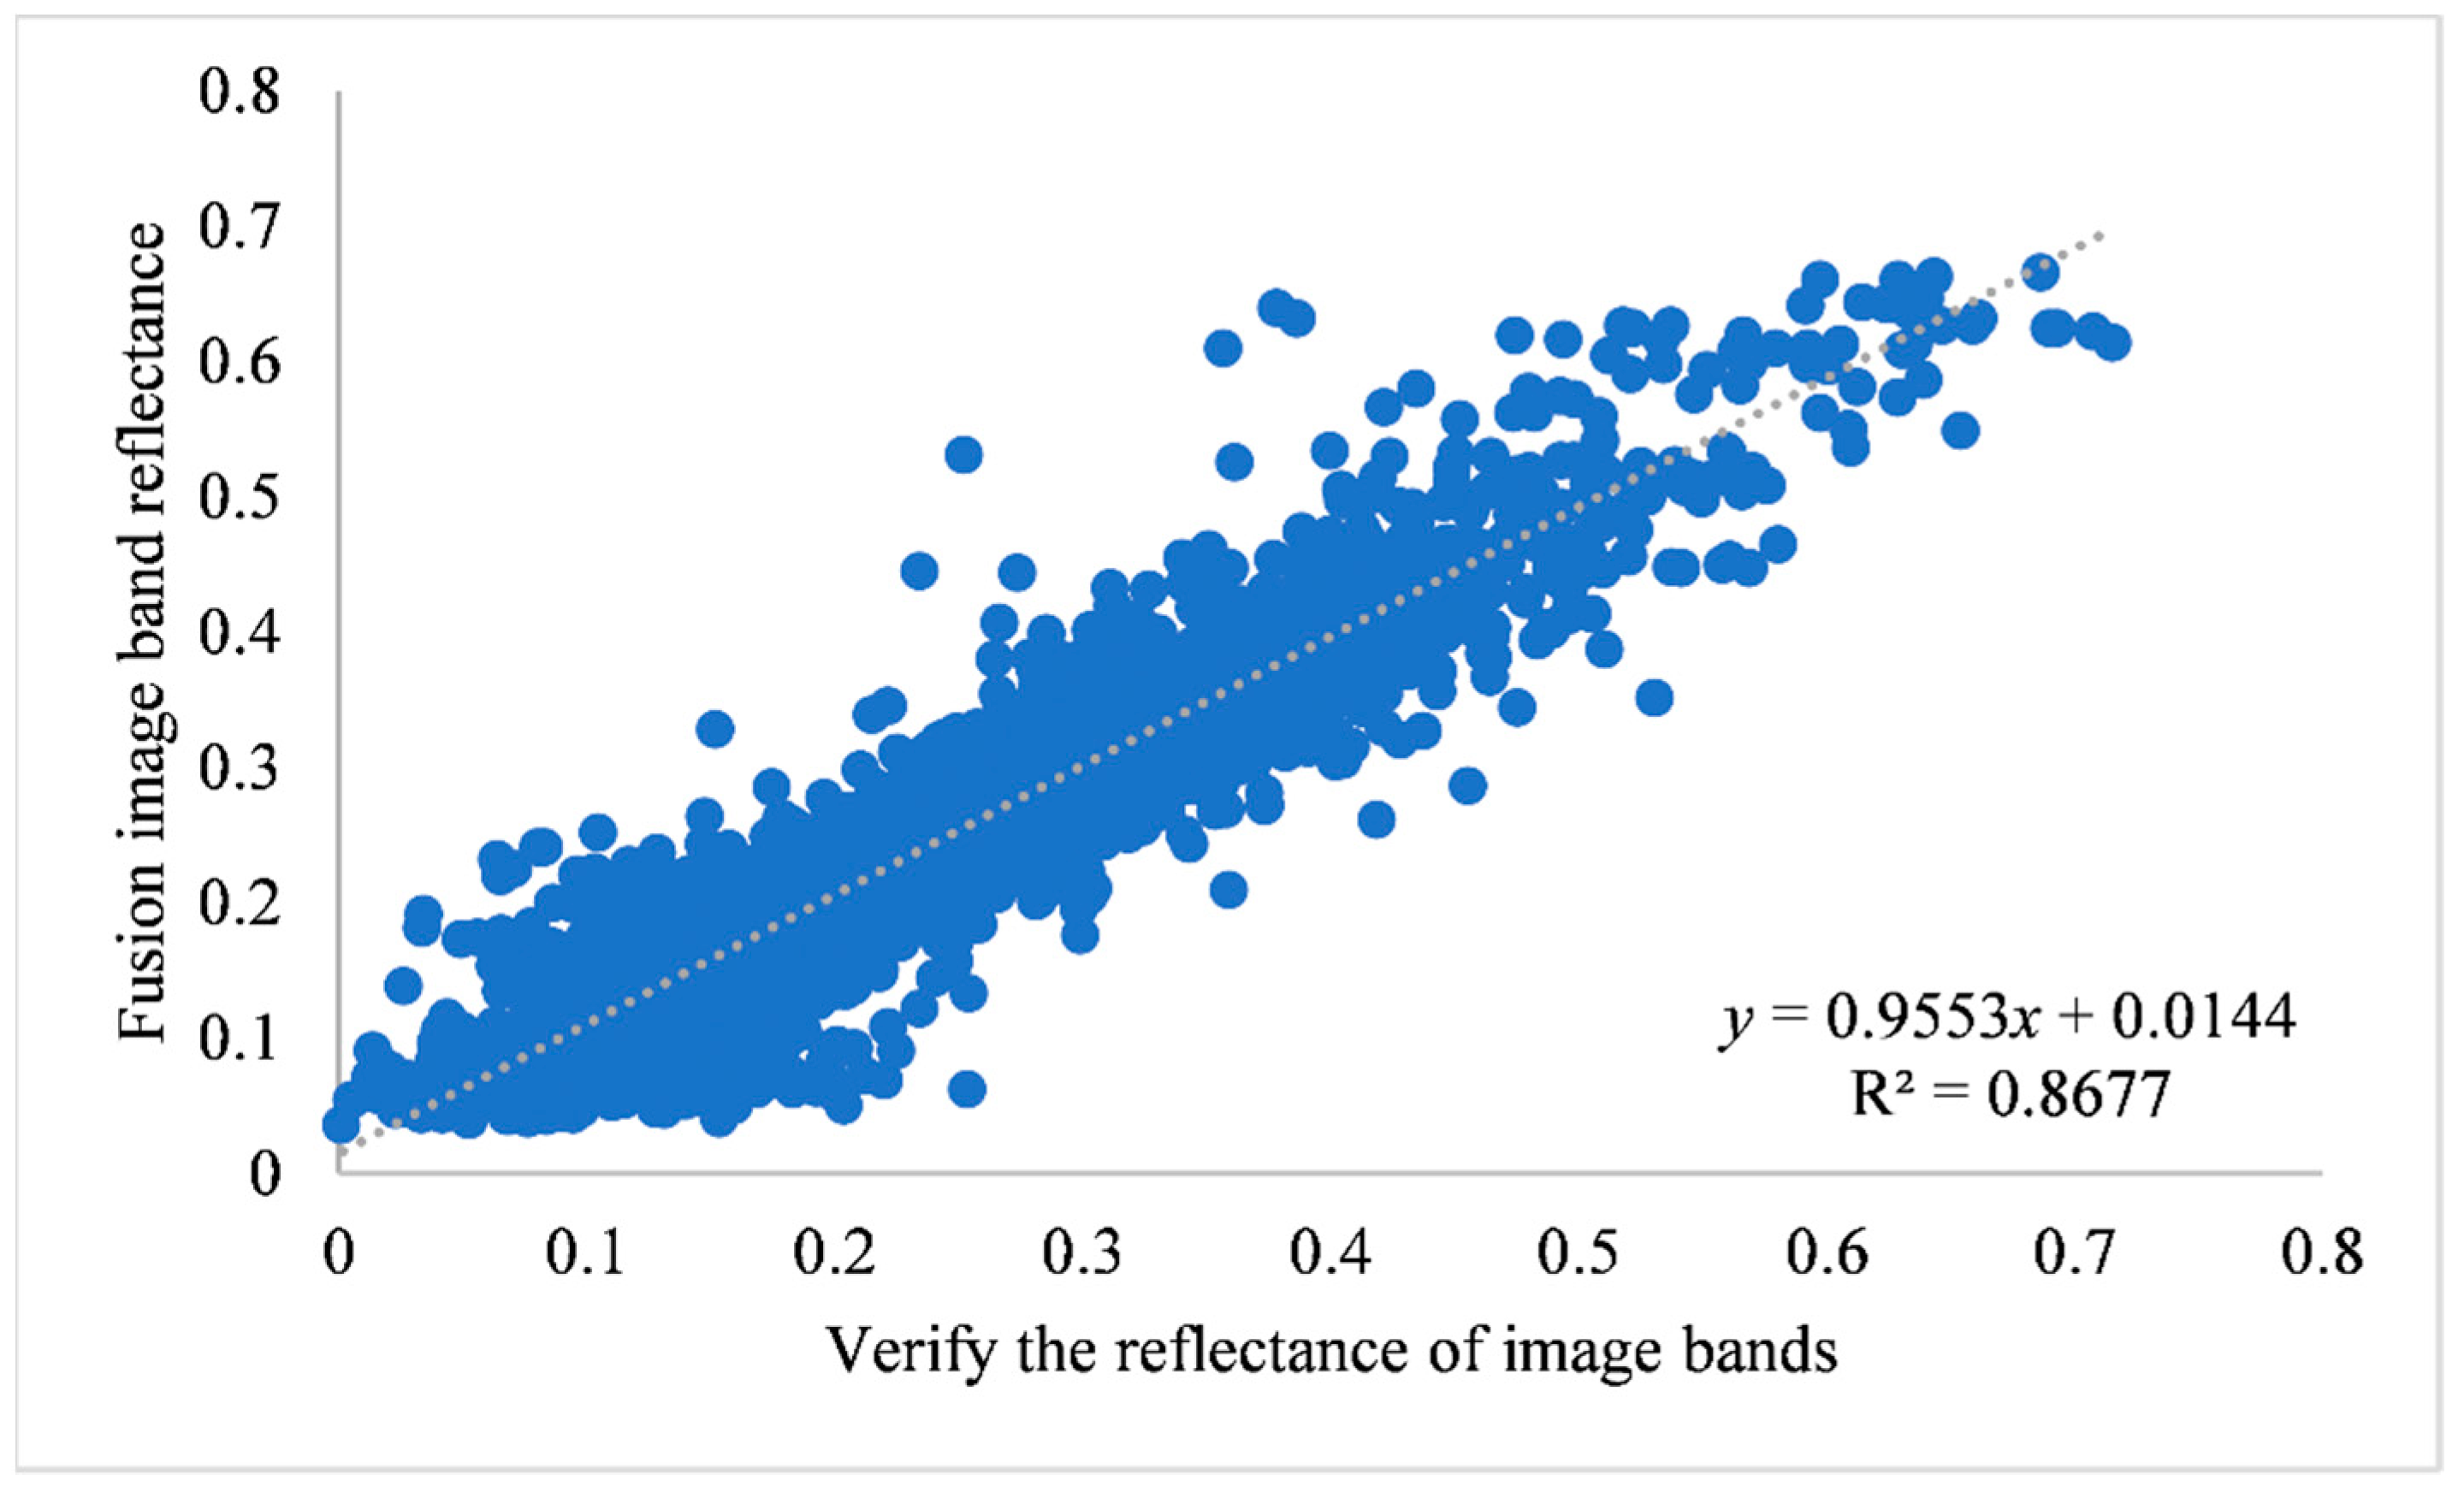
- (1)
- The result of the ESTARFM has the highest correlation coefficient, R2 = 0.8677, indicating that the ESTARFM algorithm has better application in the Yellow River delta.
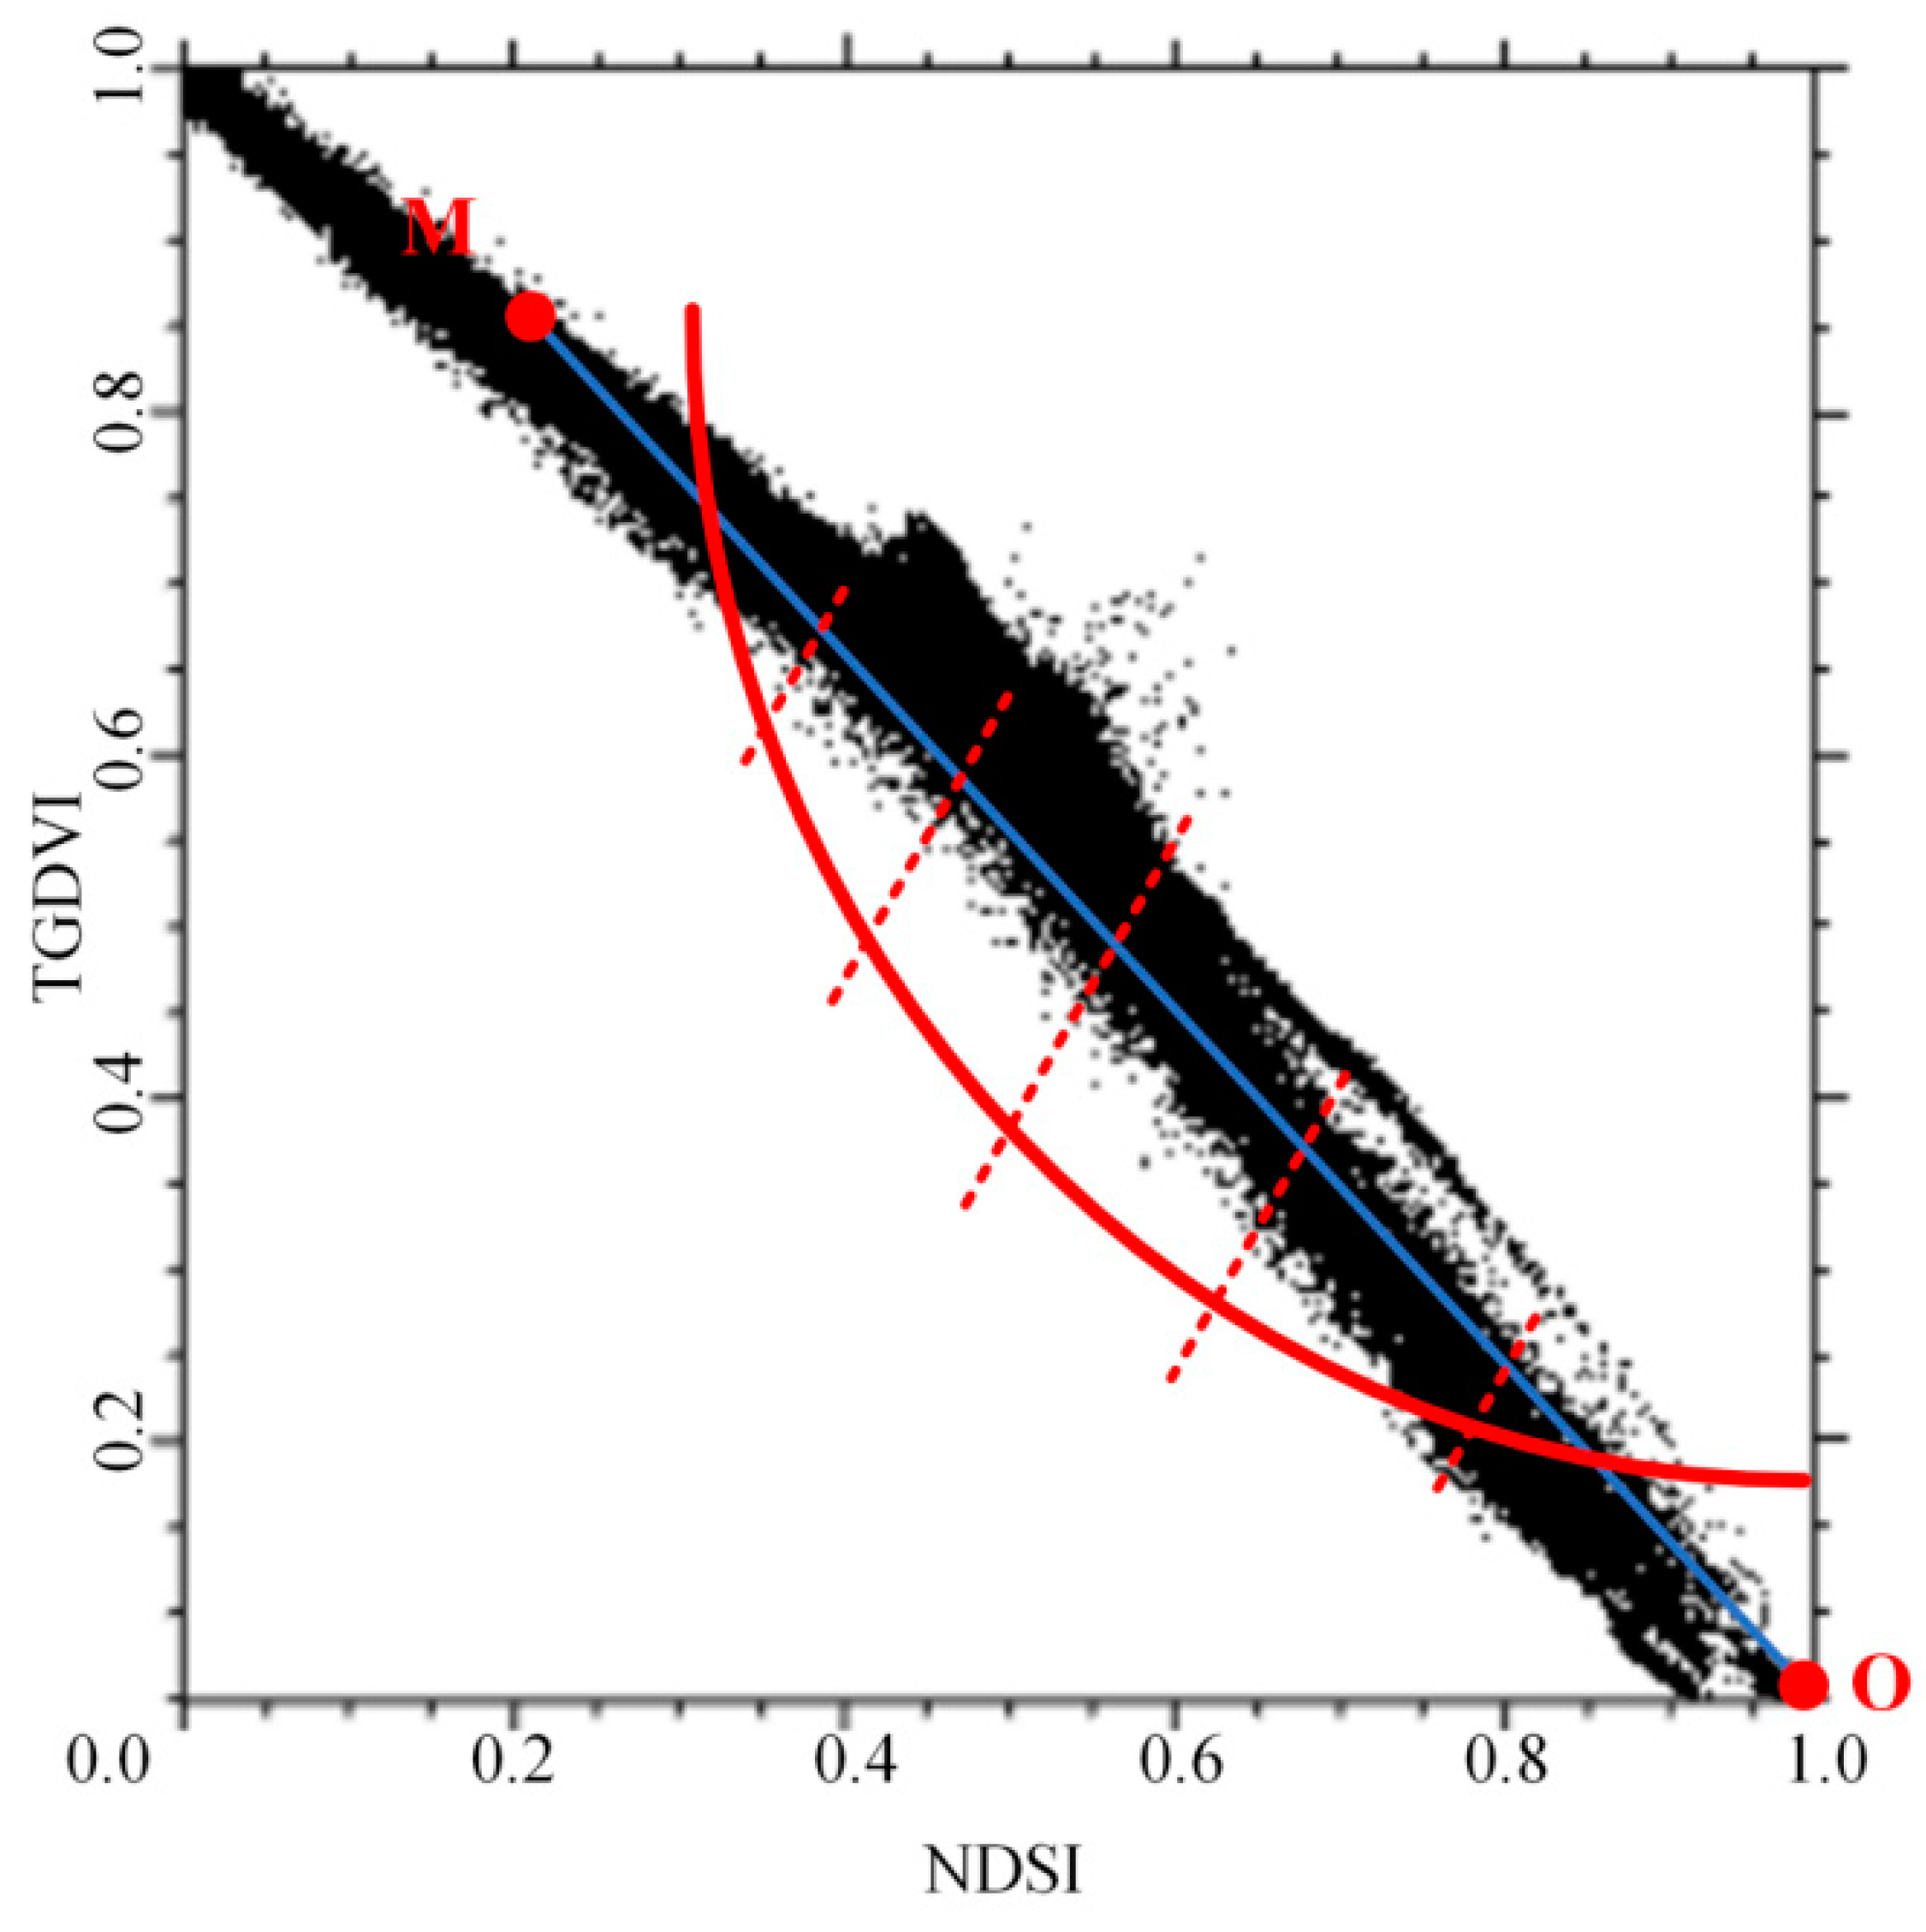
- (2)
- The NDSI-TGDVI feature space salinization monitoring index model based on point-to-point mode has the highest accuracy of 0.92, followed by the EDVI-Albedo feature space salinization monitoring index model based on point-to-point mode, with an accuracy of 0.91.
- (3)
- From 2000 to 2020, the remote sensing monitoring index model of soil salinization in the Yellow River Delta region showed an overall aggravation trend. The average salinization in the past 20 years was 0.65, which is categorized as severe salinization, and the degree of salinization gradually decreased from the northeastern coastal area to the southwestern inland area.
- (4)
- The dominant factors affecting soil salinization vary in different historical periods, with little difference in the dominant interactive factors, which are mainly temperature and slope orientation.
Author Contributions
Funding
Data Availability Statement
Conflicts of Interest
Appendix A

| Code | Time of Fine-Resolution Image | Type of Fine-Resolution Image | Resolution | Type of Coarse-Resolution Image | Time of Coarse-Resolution Image | Time of Fusion Image | Resolution | Time of Reconstructed Images |
|---|---|---|---|---|---|---|---|---|
| 1 | 8 April 2000 | TM | 30 | -- | -- | -- | -- | 8 April 2000 |
| 2 | 10 March 2001 | TM | 30 | MOD09A1 | 6 March 2001 | 15 April 2001 | 500 | 15 April 2001 |
| 16 July 2001 | TM | 30 | 12 July 2001 | 500 | ||||
| 3 | 8 January 2002 | TM | 30 | MOD09A1 | 9 January 2002 | 15 April 2002 | 500 | 15 April 2002 |
| 7 October 2002 | TM | 30 | 8 October 2002 | 500 | ||||
| 4 | 12 February 2003 | TM | 30 | MOD09A1 | 10 February 2003 | 15 April 2003 | 500 | 15 April 2003 |
| 20 June 2003 | TM | 30 | 18 June 2003 | 500 | ||||
| 5 | 19 April 2004 | TM | 30 | -- | -- | -- | -- | 19 April 2004 |
| 6 | 22 April 2005 | TM | 30 | -- | -- | -- | -- | 22 April 2005 |
| 7 | 9 April 2006 | TM | 30 | -- | -- | -- | -- | 9 April 2006 |
| 8 | 11 March 2007 | TM | 30 | MOD09A1 | 14 March 2007 | 15 April 2007 | 500 | 15 April 2007 |
| 14 May 2007 | TM | 30 | 17 May 2007 | 500 | ||||
| 9 | 14 April 2008 | TM | 30 | -- | -- | -- | -- | 14 April 2008 |
| 10 | 1 April 2009 | TM | 30 | -- | -- | -- | -- | 1 April 2009 |
| 11 | 11 September 2010 | TM | 30 | MOD09A1 | 14 September 2010 | 15 April 2010 | 500 | 15 April 2010 |
| 14 January 2010 | TM | 30 | 17 January 2010 | 500 | ||||
| 12 | 22 March 2011 | TM | 30 | MOD09A1 | 22 March 2011 | 15 April 2011 | 500 | 15 April 2011 |
| 2 February 2011 | TM | 30 | 2 February 2011 | 500 | ||||
| 13 | 17 April 2012 | ETM+ | 30 | -- | -- | -- | -- | 17 April 2012 |
| 14 | 30 May 2013 | OLI | 30 | MOD09A1 | 25 May 2013 | 15 April 2013 | 500 | 15 April 2013 |
| 30 May 2013 | OLI | 30 | 17 May 2013 | 500 | ||||
| 15 | 14 March 2014 | OLI | 30 | MOD09A1 | 14 March 2014 | 15 April 2014 | 500 | 15 April 2014 |
| 1 May 2014 | OLI | 30 | 1 May 2014 | 500 | ||||
| 16 | 1 March 2015 | OLI | 30 | MOD09A1 | 6 March 2015 | 15 April 2010 | 500 | 15 April 2015 |
| 4 May 2015 | OLI | 30 | 01 May 2015 | 500 | ||||
| 17 | 3 March 2016 | OLI | 30 | MOD09A1 | 5 March 2016 | 14 April 2016 | 500 | 14 April 2016 |
| 19 March 2016 | OLI | 30 | 21 March 2016 | 500 | ||||
| 18 | 23 April 2017 | OLI | 30 | -- | -- | -- | -- | 23 April 2017 |
| 19 | 25 March 2018 | OLI | 30 | MOD09A1 | 22 March 2018 | 15 April 2018 | 500 | 15 April 2018 |
| 9 March 2018 | OLI | 30 | 3 March 2018 | 500 | ||||
| 20 | 12 March 2019 | OLI | 30 | MOD09A1 | 14 March 2019 | 15 April 2019 | 500 | 15 April 2019 |
| 23 January 2019 | OLI | 30 | 25 January 2019 | 500 | ||||
| 21 | 15 April 2020 | OLI | 30 | -- | -- | -- | -- | 15 April 2020 |
References
- Zhao, M.; Chang, C.Y.; Wang, Z.R.; Zhao, G.X. Driving Force Analysis and Prediction Simulation of Soil Salinization in Coastal Area of Yellow River Delta. Chin. Agric. Sci. Bull. 2024, 40, 75–83. [Google Scholar]
- Zhang, S.N.; Lu, M.; Wen, C.Y.; Song, Y.Q.; Kang, L.; Shen, J.H.; Yang, M.Z. Study of soil salinity remote sensing inversion method integrating crop type. Bull. Surv. Mapp. 2024, 2, 1–7. [Google Scholar]
- Zhang, Z.M.; Fan, Y.G.; Jiao, Z.J.; Guan, Q.C. Impact of salinization on the eco-environment quality of coastal wetlands; A case study of Yellow River Delta. Remote Sens. Nat. Resour. 2023, 35, 226–235. [Google Scholar]
- Fan, X.M.; Liu, G.H.; Liu, H.G. Yellow River Delta based on Kriging and Cokriging methods Evaluation of soil salinization. Resour. Sci. 2014, 36, 321–327. [Google Scholar]
- Zhang, Z.T.; Wei, G.F.; Yao, Z.H.; Tan, C.X.; Wang, X.T.; Han, J. Soil Salt Inversion Model Based on UAV Multispectral Remote Sensing. Tran. Chin. Soc. Agric. Mach. 2019, 50, 151–160. [Google Scholar]
- Wang, J.Q.; Peng, J.; Li, H.Y.; Yin, C.Y.; Liu, W.Y.; Wang, T.W.; Zhang, H.P. Soil salinity mapping using machine learning algorithms with the Sentinel-2 MSI in arid areas, China. Remote Sens. 2021, 13, 305. [Google Scholar] [CrossRef]
- Liu, Y.; Pan, X.Z.; Shi, R.J.; Li, Y.L.; Wang, C.K.; Li, Z.T. Estimation of Soil Salt Content over Partially Vegetated Areas Based on Blind Source Separation. Acta Pedo Sinica 2016, 53, 322–331. [Google Scholar]
- Li, J.H.; Gao, M.X. Temporal and Spatial Characteristics of Salinization of Coastal Soils in the Yellow River Delta. Chin. J. Soil Sci. 2018, 49, 1458–1465. [Google Scholar]
- Singh, A. Soil salinization management for sustainable development: A review. J. Environ. Manag. 2021, 277, 111383. [Google Scholar] [CrossRef]
- Yang, J.S.; Yao, R.J.; Wang, X.P.; Xie, W.P.; Zhang, X.; Zhu, W.; Zhang, L.; Sun, R.J. Research on Salt-affected Soils in China: History, Status Quo and Prospect. Acta Pedo Sinica 2022, 59, 10–27. [Google Scholar]
- Wang, D.Y.; Chen, H.Y.; Wang, G.F.; Cong, J.Q.; Wang, X.F.; Wei, X.W. Salinity Inversion of Severe Saline Soil in the Yellow River Estuary Based on UAV Multi-Spectra. Sci. Agric. Sinica 2019, 52, 1698–1709. [Google Scholar]
- Shi, H.B.; Wu, D.; Yan, J.W.; Li, X.Y.; Zhu, K.; Chi, B.X. Spatial-temporal Variation of Soil Salinity after Water Saving Transformation in Salinized Irrigation District. Tran. Chin. Soc. Agric. Mach. 2020, 51, 318–331. [Google Scholar]
- Wang, F.; Ding, J.L. Soil Salinity Modelling Study with Salinity Inference Model Based on the Integration of Soil and Vegetation Spectrum in Arid Land. Spect. Spect. Anal. 2016, 36, 1848–1853. [Google Scholar]
- Zhang, T.J.; Chen, Y.J.; Liu, J.Z. Characteristics of soil salinization in coastal wetlands based on canonical correspondence analysis. Acta Ecol. Sinica 2019, 39, 3322–3332. [Google Scholar]
- Chen, X.L.; Wang, Y.F.; Zhang, H.M.; Liu, F.G.; Shen, Y.J. Extraction method of irrigated arable land in the Chahannur Basin based on the ESTARFM NDVI. Chin. J. Eco-Agric. 2021, 29, 1105–1116. [Google Scholar]
- Yang, L.B.; Chen, C.B.; Zheng, H.W.; Luo, G.P.; Shang, B.J.; Olaf, H. Retrieval of Soil Salinity Content based on Random Forests Regression Optimized by Bayesian Optimization Algorithm and Genetic Algorithm. J. Geo-Inf. Sci. 2021, 23, 1662–1674. [Google Scholar]
- Kumar, P.; Tiwari, P.; Biswas, A.; Srivastava, P.K. Spatio-temporal assessment of soil salinization utilizing remote sensing derivatives, and prediction modeling: Implications for sustainable development. Geosci. Front. 2024, 15, 101881. [Google Scholar] [CrossRef]
- Wang, N.; Chen, S.; Huang, J.; Frappart, F.; Taghizadeh, R.; Zhang, X.; Wigneron, J.; Xue, J.; Xiao, Y.; Peng, J.; et al. Global Soil Salinity Estimation at 10 m Using Multi-Source Remote Sensing. J. Remote Sens. 2024, 4, 0130. [Google Scholar] [CrossRef]
- Alaa, A.M.; Katsuaki, K.; Mohames, M.-E.-H.; Khaled, S.G. Mapping soil salinity using spectral mixture analysis of Landsat 8 OLI images to identify factors influencing salinization in an arid region. Int. J. Appl. Earth Obs. 2019, 83, 101944. [Google Scholar]
- Zhuang, Q.W.; Shao, Z.F.; Huang, X.; Zhang, Y.; Wu, W.F.; Feng, X.X.; Lv, X.W.; Ding, Q.; Cai, B.W.; Altan, O. Evolution of soil salinization under the background of landscape patterns in the irrigated northern slopes of Tianshan Mountains, Xinjiang, China. Catena 2021, 206, 105561. [Google Scholar] [CrossRef]
- Wang, Z.; Zhang, F.; Zhang, X.L.; Chan, N.W.; Kung, H.T.; Ariken, M.; Zhou, X.H.; Wang, Y.S. Regional suitability prediction of soil salinization based on remote-sensing derivatives and optimal spectral index. Sci. Total Environ. 2021, 775, 145807. [Google Scholar] [CrossRef] [PubMed]
- Ding, J.L.; Yao, Y.; Wang, F. Detecting soil salinization in arid regions using spectral feature space derived from remote sensing data. Acta Ecol. Sin. 2014, 34, 4620–4631. [Google Scholar]
- Guo, B.; Zang, W.Q.; Han, B.M.; Yang, F.; Luo, W.; He, T.L.; Fan, Y.W.; Yang, X.; Chen, S.T. Dynamic monitoring of desertification in Naiman Banner based on feature space models with typical surface parameters derived from Landsat images. Land. Degrad. Dev. 2020, 31, 1573–1592. [Google Scholar] [CrossRef]
- Shoba, P.; Kokila, P.R. A novel approach to quantify soil salinity by simulating the dielectric loss of SAR in three-dimensional density space. Remote Sens. Eniron. 2020, 251, 112059. [Google Scholar]
- Zhang, T.Y.; Wang, L.; Zeng, P.L.; Wang, T.; Geng, Y.H.; Wang, H. Soil Salinization in the Irrigated Area of the Manas River Basin Based on MSAVI-SI Feature Space. Arid. Zone Res. 2016, 33, 499–505. [Google Scholar]
- Guo, B.; Yang, F.; Han, B.M.; Fan, Y.W.; Chen, S.T.; Yang, W.N.; Jiang, L. A model for the rapid monitoring of soil salinization in the Yellow River Delta using Landsat 8 OLI imagery based on VI-SI feature space. Remote Sens. Lett. 2019, 10, 796–805. [Google Scholar] [CrossRef]
- Bian, L.L.; Wang, J.L.; Liu, J.; Han, B.M. Spatiotemporal changes of soil salinization in the Yellow River Delta of China from 2015 to 2019. Sustainability 2021, 13, 822. [Google Scholar] [CrossRef]
- Wu, Z.H.; Yan, Q.W.; Zhang, S.T.; Lei, S.G.; Lu, Q.Q.; Hua, X. Remote sensing monitoring of soil salinization based on SI-Brightness feature space and drivers analysis: A case study of surface mining areas in semi-arid steppe. IEEE Access 2021, 9, 110137–110148. [Google Scholar] [CrossRef]
- Guo, B.; Zang, W.Q.; Luo, W.; Wen, Y.; Yang, F.; Han, B.M.; Fan, Y.W.; Chen, X.; Qi, Z.; Wang, Z. Detection model of soil salinization information in the Yellow River Delta based on feature space models with typical surface parameters derived from Landsat8 OLI image. Geomat. Nat. Hazards Risk 2020, 11, 288–300. [Google Scholar] [CrossRef]
- Yao, Y.; Ding, J.L.; Wang, S. Soil salinization monitoring in the Werigan-Kuqa Oasis, China, based on a three-dimensional feature space model with machine learning algorithm. Remote Sens. Lett. 2021, 12, 269–277. [Google Scholar] [CrossRef]
- Guo, B.; Liu, Y.F.; Fan, J.F.; Lu, M.; Zang, W.Q.; Liu, C.; Wang, B.Y.; Huang, X.Z.; Lai, J.B.; Wu, H.W. The salinization process and its response to the combined processes of climate change–human activity in the Yellow River Delta between 1984 and 2022. Catena 2023, 231, 107301. [Google Scholar] [CrossRef]
- Wang, F.; Yang, S.T.; Wei, Y.; Shi, Q.; Ding, J.L. Characterizing soil salinity at multiple depth using electromagnetic induction and remote sensing data with random forests: A case study in Tarim River Basin of southern Xinjiang, China. Sci. Total Environ. 2020, 754, 142030. [Google Scholar] [CrossRef] [PubMed]
- Huang, C.; Zhang, C.C.; Liu, Q.S.; Li, H.; Yang, X.M.; Liu, G.H. Multi-Feature Classification of Optical and SAR Remote Sensing Images for Typical Tropical Plantation Species. Sci. Silvae Sin. 2021, 57, 80–91. [Google Scholar]
- Yang, X.H.; Luo, Y.Q.; Yang, H.C.; Zhang, F.H.; Lei, J.J. Soil salinity retrieval and spatial distribution of oasis farmland in Manasi river basin. J. Arid. Land. Resour. Environ. 2021, 35, 156–161. [Google Scholar]
- Wu, C.S.; Huang, C.; Liu, G.H.; Liu, Q.S. Assessment of ecological vulnerability in the Yellow River Delta using the Fuzzy Analytic Hierarchy Process. Acta Ecol. Sin. 2018, 38, 4584–4595. [Google Scholar]
- Guo, B.; Yang, F.; Fan, Y.W.; Han, B.M.; Chen, S.T.; Yang, W.N. Dynamic monitoring of soil salinization in Yellow River Delta utilizing MSAVI–SI feature space models with Landsat images. Environ. Earth Sci. 2019, 78, 308. [Google Scholar] [CrossRef]
- Huang, B.; Zhao, Y.Q. Research Status and Prospect of Spatiotemporal Fusion of Multi-source Satellite Remote Sensing Imagery. Acta. Geoda Carto Sin. 2017, 46, 1492–1499. [Google Scholar]
- Chen, H.Y.; Ma, Y.; Zhu, A.X.; Wang, Z.R.; Zhao, G.X.; Wei, Y.N. Soil salinity inversion based on differentiated fusion of satellite image and ground spectra. Int. J. Appl. Earth Obs. 2021, 101, 102360. [Google Scholar] [CrossRef]
- Wu, Z.J.; Zhang, J.H.; Deng, F.; Zhang, S.; Zhang, D.; Xun, L.; Javed, T.; Liu, G.Z.; Liu, D.; Ji, M.F. Fusion of GF and MODIS data for regional-scale grassland community classification with EVI2 time-series and phenological features. Remote Sens. 2021, 13, 835. [Google Scholar] [CrossRef]
- Liu, M.L.; Ke, Y.H.; Yin, Q.; Chen, X.W.; Im, J.H. Comparison of five spatio-temporal satellite image fusion models over landscapes with various spatial heterogeneity and temporal variation. Remote Sens. 2019, 11, 2612. [Google Scholar] [CrossRef]
- Ping, B.; Meng, Y.S.; Su, F.Z. Comparisons of Spatio-temporal Fusion Methods for GF-1 WFV and MODIS Data. J. Geo-Inf. Sci. 2019, 21, 157–167. [Google Scholar]
- Alonso, A.; Munoz-Carpena, R.; Kaplan, D. Coupling high-resolution field monitoring and MODIS for reconstructing wetland historical hydroperiod at a high temporal frequency. Remote Sens. Environ. 2020, 247, 111807. [Google Scholar] [CrossRef]
- Januar, T.W.; Lin, T.H.; Huang, C.Y.; Chang, K.E. Modifying an image fusion approach for high spatiotemporal LST retrieval in surface dryness and evapotranspiration estimations. Remote Sens. 2020, 12, 498. [Google Scholar] [CrossRef]
- Yan, Y.C.; Wu, C.J.; Wen, Y.Y. Determining the impacts of climate change and urban expansion on net primary productivity using the spatio-temporal fusion of remote sensing data. Ecol. Indic. 2021, 127, 107737. [Google Scholar] [CrossRef]
- Jiang, D.P.; Du, J.; Song, K.S.; Zhao, B.Y.; Zhang, Y.W.; Zhang, W.J. Classification of Conservation Tillage Using Enhanced Spatial and Temporal Adaptive Reflectance Fusion Model. Remote Sens. 2023, 15, 508. [Google Scholar] [CrossRef]
- Leo, B. Random Forests. Mach. Learn. 2001, 45, 5–32. [Google Scholar]
- Bi, S.B.; Ji, H.; Chen, C.C.; Yang, H.R.; Shen, X. Application of geographical detector in human-environment relationship study of prehistoric settlements. Prog. Geogra 2015, 34, 118–127. [Google Scholar]
- Yang, Y.H. Spatial and Temporal Fusion of Evapotranspiration Based on Multi-source Remote Sensing Data: A case study of Houzhai River sub-basin in Guizhou Province. Sci. Technol. Indus 2023, 23, 236–244. [Google Scholar]
- Xie, C.H.; Zhang, S.Y.; Cui, L.Z.; An, W.T.; Tang, J.K. Progress and Trend of Remote Sensing Classification of Land Cover in the Yellow River Delta. Sci. Technol. Eng. 2022, 42, 4524–4535. [Google Scholar]
- Wang, X.N.; Su, W.H.; Dong, L.B. Age estimation model for individual tree in natural Larix gmelinii forest based on random forest. Chin. J. Appl. Ecol. 2024, 5, 1055–1063. [Google Scholar]
- Cao, Y.; Sun, Y.L.; Chen, Z.X.; Yan, H.; Qian, S. Dynamic changes of vegetation ecological quality in the Yellow River Basin and its response to extreme climate during 2000-2020. Acta Ecol. Sin. 2022, 42, 4524–4535. [Google Scholar]
- Xu, C.D.; Wang, R.R.; Cheng, H.; Lian, H.D.; Gong, X.W.; Liu, L.Y.; Wang, Y. Spatial-temporal distribution of water and salt in artificial oasis irrigation area in arid area based on remote sensing analysis. Trans. CSAE 2019, 35, 80–89. [Google Scholar]


| Mode | Feature Space | Formula | R2 |
|---|---|---|---|
| point-to-point | GNDVI-NDSI | 0.8588 | |
| NDSI-EDVI | 0.9007 | ||
| NDSI-RVI | 0.873 | ||
| NDSI-TGDVI | 0.9209 | ||
| SI2-Albedo | 0.5608 | ||
| WI-Albedo | 0.526 | ||
| WI-SI2 | 0.627 | ||
| point-to-line | EDVI-Albedo | 0.9116 | |
| GNDVI-Albedo | 0.6608 | ||
| NDSI-Albedo | 0.6944 | ||
| TGDVI-Albedo | 0.7462 | ||
| TGDVI-SI2 | 0.607 |
Disclaimer/Publisher’s Note: The statements, opinions and data contained in all publications are solely those of the individual author(s) and contributor(s) and not of MDPI and/or the editor(s). MDPI and/or the editor(s) disclaim responsibility for any injury to people or property resulting from any ideas, methods, instructions or products referred to in the content. |
© 2024 by the authors. Licensee MDPI, Basel, Switzerland. This article is an open access article distributed under the terms and conditions of the Creative Commons Attribution (CC BY) license (https://creativecommons.org/licenses/by/4.0/).
Share and Cite
Guo, B.; Xu, M.; Zhang, R. Evolution Patterns and Dominant Factors of Soil Salinization in the Yellow River Delta Based on Long-Time-Series and Similar Phenological-Fusion Images. Remote Sens. 2024, 16, 3332. https://doi.org/10.3390/rs16173332
Guo B, Xu M, Zhang R. Evolution Patterns and Dominant Factors of Soil Salinization in the Yellow River Delta Based on Long-Time-Series and Similar Phenological-Fusion Images. Remote Sensing. 2024; 16(17):3332. https://doi.org/10.3390/rs16173332
Chicago/Turabian StyleGuo, Bing, Mei Xu, and Rui Zhang. 2024. "Evolution Patterns and Dominant Factors of Soil Salinization in the Yellow River Delta Based on Long-Time-Series and Similar Phenological-Fusion Images" Remote Sensing 16, no. 17: 3332. https://doi.org/10.3390/rs16173332
APA StyleGuo, B., Xu, M., & Zhang, R. (2024). Evolution Patterns and Dominant Factors of Soil Salinization in the Yellow River Delta Based on Long-Time-Series and Similar Phenological-Fusion Images. Remote Sensing, 16(17), 3332. https://doi.org/10.3390/rs16173332