Abstract
Although advanced deep learning techniques have significantly improved SAR ship detection, accurately detecting small ships remains challenging due to their limited size and the few appearance and geometric clues available. In order to solve this problem, we propose several small object detection strategies. The backbone network uses space-to-depth convolution to replace stride and pooling. It reduces information loss during down-sampling. The neck integrates multiple layers of features globally and injects global and local information into different levels. It avoids the inherent information loss of traditional feature pyramid networks and strengthens the information fusion ability without significantly increasing latency. The proposed intersection-of-union considers the center distance and scale of small ships specifically. It reduces the sensitivity of intersection-of-union to positional deviations of small ships, which is helpful for training toward small ships. During training, the smaller the localization loss of small ships, the greater their localization loss gains are. By this, the supervision of small ships is strengthened in the loss function, which can make the losses more biased toward small ships. A series of experiments are conducted on two commonly used datasets, SSDD and SAR-Ship-Dataset. The experimental results show that the proposed method can detect small ships successfully and thus improve the overall performance of detectors.
1. Introduction
Synthetic aperture radar (SAR) is a type of active sensor not limited by light, climate and cloud, which can work in all-weather and all-day conditions. At present, SAR has become one of the most important means for high-resolution earth observation. The unique advantages of SAR give it high practical application value in mapping, military, disaster, geology, agriculture, forestry and other fields. SAR is also an important tool for marine target surveillance. Finding ships from SAR images (named SAR ship detection) is the key technology for this [1]. The traditional detection method is based on CFAR (constant false alarm rate). CFAR first conducts statistical modeling of clutter and then obtains the threshold value according to the false alarm rate. Pixels higher than the threshold are regarded as ship pixels, and those lower than the threshold are regarded as background. In general, when the scene is relatively simple, the CFAR method can achieve good results. However, for complex scenes, because of the difficulty in modeling, it may cause performance degradation. CFAR only uses the distribution features of pixel intensity, while deep learning obtains better features through learning, which enables it to have very high detection accuracy. For example, the paper [2] compared the K-distribution-based CFAR method with Faster R-CNN on the AIR-SARShip-1.0 dataset. They achieved 27.1% and 79.3% AP, respectively, which showed excellent performance of deep learning in SAR ship detection.
Since the emergence of deep learning and the good performance it showed in 2012 [3], it has become the main solution for SAR ship detection [4,5]. For example, the review paper [4] shows that there were 177 papers that used deep learning in SAR ship detection in the past five years. Additionally, the AP50 has increased from 78.8% in 2017 to 97.8% on SSDD in 2022. Deep learning-based object detection methods can be divided into single-stage and two-stage methods [6,7,8]. The single-stage method can predict the bounding box directly based on the anchor box; it is faster but not precise enough. The latter first generates a large number of region proposals based on the features of CNN (convolutional neural network) and then identifies the proposals with another head; it has higher accuracy but slightly slower speed. Deep learning-based object detection methods can also be divided into anchor-based and anchor-free methods [9,10,11,12]. The anchor-based detector densely presets anchors of different sizes on the image and then classifies and regresses them to output the final prediction result. The anchor-free detector predicts targets by generating bounding boxes directly from key points or center points. The most advanced detectors are anchor-based, generally, but anchor free detectors have less computation.
No matter whether it is single-stage, two-stage, anchor-based or anchor free, the performance of these methods is not good for small targets. This phenomenon is very serious in SAR ship detection, as SAR images have a large number of small ships in general. It would lead to a huge decrease in detection accuracy [13].
There are two ways to define small targets generally. One is relative size; that is, the ratios of the width and height of the bounding box to the image are less than 0.1, or the ratio of the area of the bounding box to the image is less than 0.03. Another method is the absolute size; taking the division standard of the COCO dataset as an example, the area of a small target is less than 1024, the area of a medium target is between 1024 and 9216 and the area of a large target is greater than 9216. The above definitions mean that the information on small targets is very limited.
For deep learning-based detectors, the detection performance of a small target is worse than that of a large one. For example, in the MS COCO dataset, the AP50 of Mask R-CNN [14] for large, medium and small objects is 48.1%, 39.9% and 21.1%, respectively, and the AP of a large target is twice as high as that of a small one.
Compared to the datasets in computer vision, the proportion of small targets in SAR ship detection datasets is extremely high. For example, in Table 1, the proportions of small, medium and large objects in the COCO dataset are 41.4%, 34.3% and 24.2%, respectively. However, in the SAR detection datasets SSDD [15] and SAR-Ship-Dataset [16], the proportions are 62.8%, 34.6% and 2.6%, and 56.5%, 43.2% and 0.3%, respectively. Therefore, due to the high proportion of small targets in SAR ship detection datasets, it is very hard to detect them successfully, which reduces the overall performance of the detector. In order to alleviate this problem, it is necessary to use small object detection strategies to improve the detection performance of small targets in SAR images and thus improve the overall performance of the detector.

Table 1.
Proportions of small, medium and large targets in MS COCO, SSDD and SAR-Ship-Dataset.
The reasons for the poor detection performance of small targets can be summarized as follows [17,18]: (1) Location information is lost. A small target has fewer pixels, limited size, and few appearance and geometric clues. When they pass through the convolutional networks, the spatial position information will vanish due to the down-sampling and pooling operations. This will make it difficult to locate them. (2) Semantic information interference. After passing through the convolutional networks, the features of small targets are often polluted by the background, making it difficult to capture the discriminant information that is crucial for classification. (3) Sensitivity to position change. In IoU (Intersection of Union)-based metrics, if the predicted bounding box has position deviations from the ground truth bounding boxes, a small target will produce a larger loss compared to a large target. This will make it difficult to find suitable thresholds and provide high-quality positive and negative samples to train the network. (4) The training process does not consider the characteristics of small targets. The deep learning-based object detector mainly considers the medium and large targets in the training process, and the small targets are considered less. Therefore, the supervision signals are insufficient and thus have poor performance.
To solve the above problems, the strategies commonly used include the following [19,20]: super resolution technology, fusing context information, multi-scale learning, anchor box designing, data augmentation and loss function designing. These strategies may face inadaptability in SAR ship detection. Therefore, based on the existing strategies and the characteristics of SAR ship detection, we propose a variety of improvements to improve the detection performance of small ships and thus improve the overall performance. The improvements include backbone, neck, IoU and loss function, and they are based on YOLOX [21], as it has excellent performance in both computer vision and SAR ship detection.
The main novelties can be summarized as follows:
- (1)
- In order to avoid the information loss of small ships when conducting down-sampling, the backbone network uses S2D (space-to-depth) convolution to replace convolution and pooling layers.
- (2)
- In order to avoid the information loss in FPN (feature pyramid network) and improve the fusion ability of the neck when detecting small targets, the neck network realizes efficient information exchange and fusion by integrating features of different levels globally and injecting them into different levels.
- (3)
- In order to avoid the sensitivity of the original IoU and make it more suitable for the computation of small ship losses, the designed IoU takes the distance and scale between boxes as the main consideration factors rather than the area.
- (4)
- In order to improve the optimization result of the detector for small ships, the designed loss function strengthens the supervised signal of small ships by adjusting the gain of the localization loss adaptively.
The remainder of this paper is organized as follows. Section 2 briefly introduces the work related to small target detection in computer vision and SAR images. Section 3 shows the architecture and improvements of the proposed method. Section 4 shows the experimental results. Section 5 shows the discussion and future directions. Section 6 is the conclusion.
2. Related Work
For computer vision, small object detection is a hot topic. Researchers have analyzed the definition, characteristics, existing problems and solutions to them. In order to improve the performance for small targets, super-resolution technologies, fusing context information, multi-scale learning, anchor box designing, data augmentation and loss function designing, are commonly used. These studies provide references for improving the detection performance of small ships in SAR images. Though datasets used in SAR ship detection have a large proportion of small targets, few researchers pay attention to this issue, and only the following papers have touched on this direction slightly.
Han [22] adopted de-convolution to improve the representation of small ships in the feature pyramid of SSD. Jin [23] stated that small ships have few pixels, limited data and simple geometric structures whose are hard to detect for Faster R-CNN and its variations. They proposed a lightweight patch-to-pixel convolutional neural network to solve this problem. In order to use semantic information in all scales, all feature maps are fused, and the dilated convolutions are used. Gui [24] proposed a scale transfer module for detecting small ships in SAR images. It connected several feature maps to obtain multi-scale features. Zhang [25] constructed a dataset called LS-SSDD-v1.0, which is specifically used for small ship detection in large-scale backgrounds. Wang [26] proposed a path argumentation fusion network to combine spatial and semantic information of different scales in bottom-up and top-down manners. Chen [27] used the feature pyramid network in the region proposal network and mapped it to a new feature space for generating bounding boxes. Zhao [28] pointed out that CNNs have difficulty detecting small and densely clustered ships. They proposed an exhaustive ship proposal network for generating ship-like regions from multiple layers with multiple receptive fields.
From the above discussion, we can see that the existing research on small ship detection is few and shallow, and the solutions are primarily based on feature fusion (feature map fusion at different levels and FPN, etc.). They lack an in-depth discussion on the proportion of small ships in datasets, the reasons for difficult detection and the corresponding solutions. This results in limited improvement in the detection of small ships. Therefore, it is necessary to adopt special strategies to improve the detection result for small ships. This is the main motivation of our paper.
3. The Proposed Method
3.1. The Overall Architecture
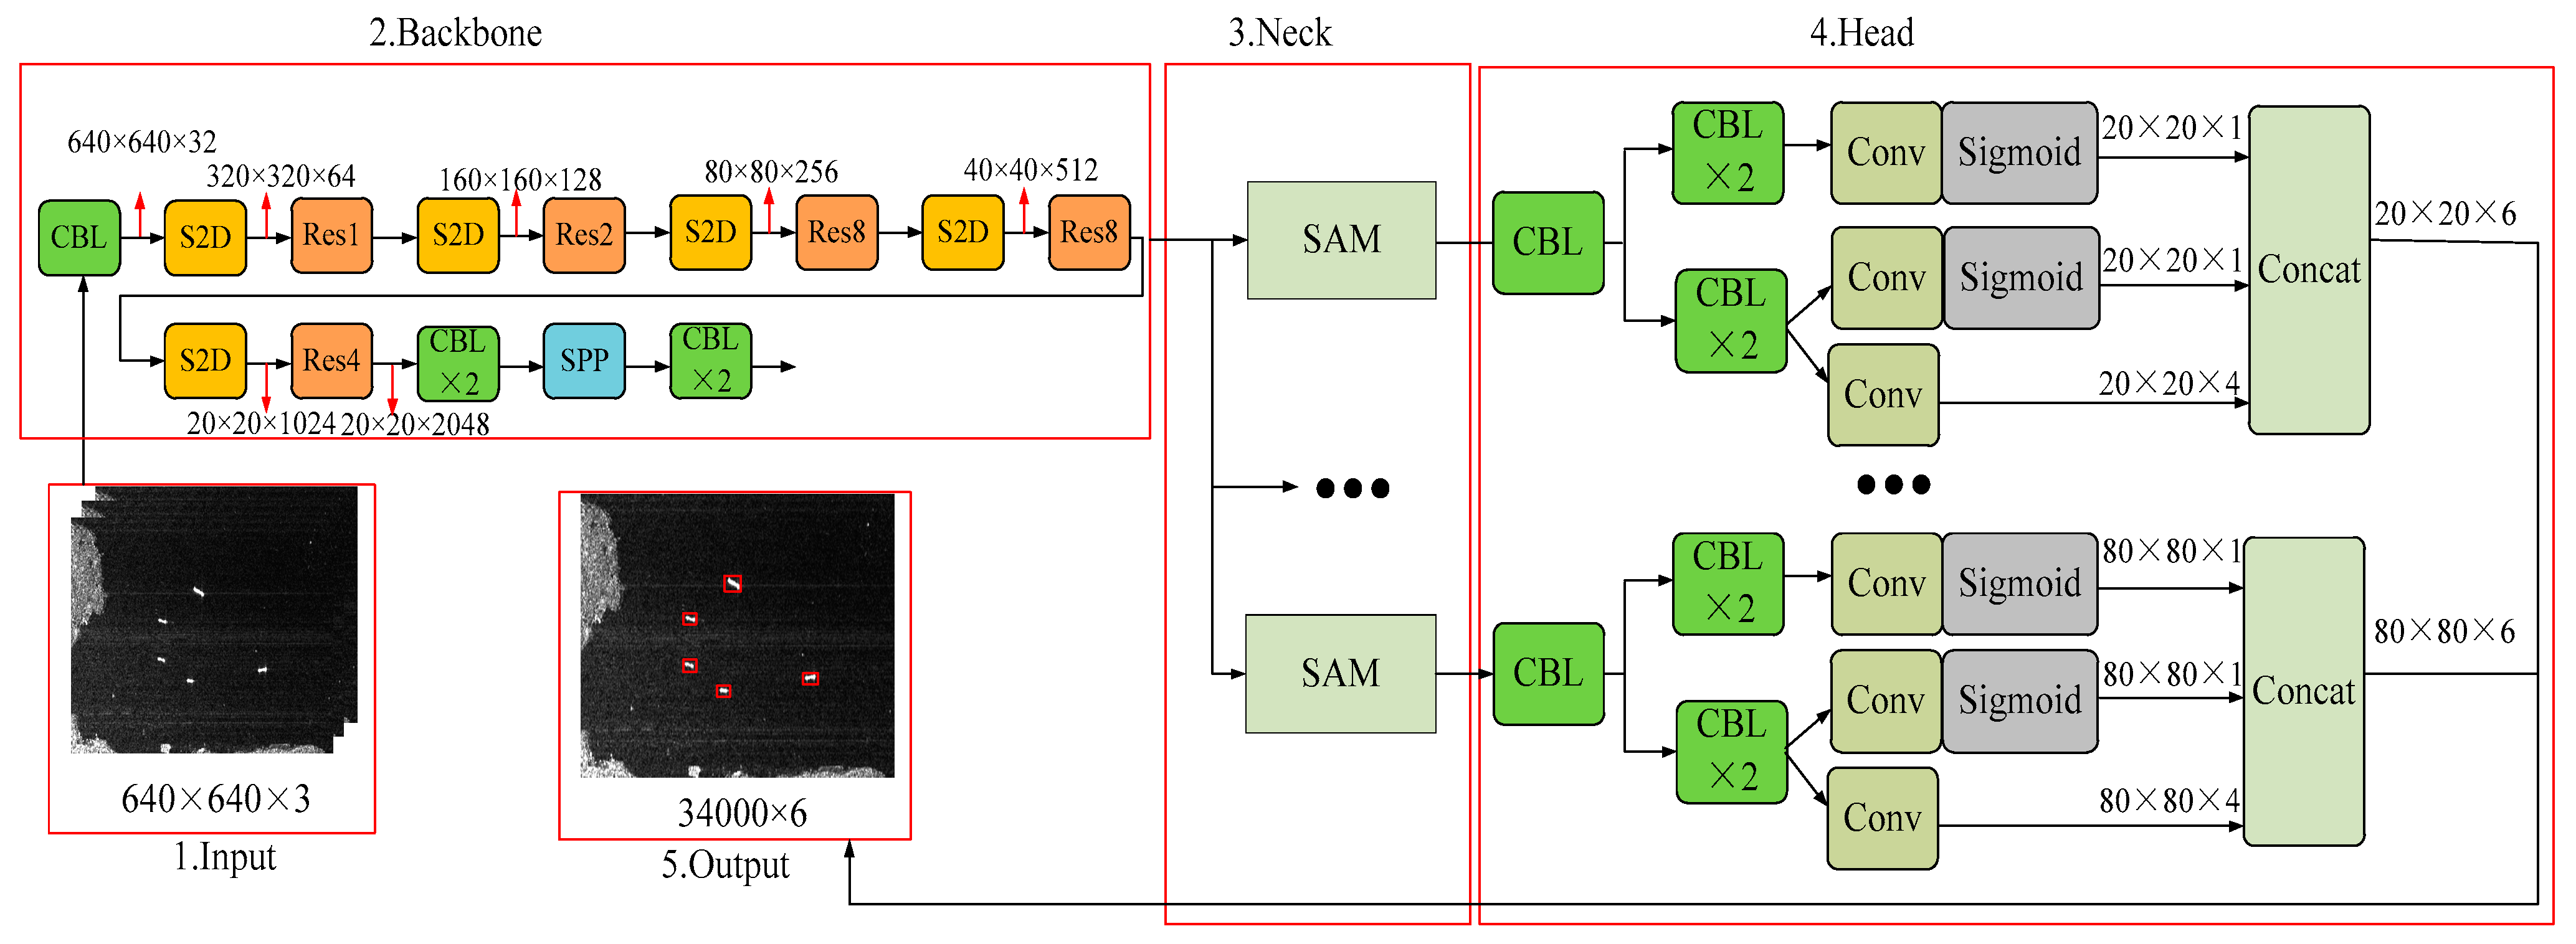
We propose several strategies to improve the detection of small ships in SAR images. The overall architecture of the proposed method is shown in Figure 1. It is based on YOLOX, as YOLOX is anchor-free, trained from scratch, and has a favorable performance in SAR ship detection. We can design and train the backbone from scratch according to the demands of small ship detection.
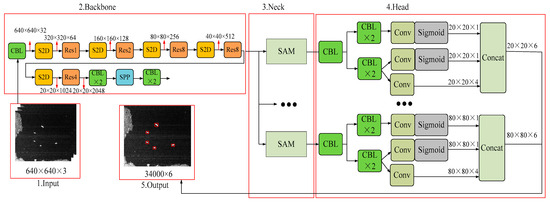
Figure 1.
The overall architecture of the proposed method.
The proposed method is improved by the following four strategies: backbone, neck, IoU and loss function. All strategies are specifically designed for detecting small ships in SAR images.
For the backbone, in order to avoid the information loss of small ships when conducting down-sampling, the stride and pooling are replaced by S2D convolution. The S2D convolution consists of a space-to-depth layer and a convolutional layer without stride, avoiding the loss of fine-grained information and the learning of less efficient feature representations. For the neck, in order to avoid the information loss in FPN and improve the fusion ability of the neck when detecting small ships, the scale attention module is used with FPN for fusing and interacting information of different scales. It integrates multiple layers of features globally and injects global information into higher levels. This significantly enhances the information fusion ability of the neck without significantly increasing the delay. For IoU, in order to avoid the sensitivity of the original IoU and make it more suitable for the computation of small ship losses, the center point and scale are specially considered for the metric of small ships. This helps in assigning labels to small ships and skews training toward small ships. For the loss function, in order to improve the optimization result of the detector on small ships, the supervision of small ships is strengthened during training, which can make the losses more biased towards small ships.
3.2. The Backbone Network
One of the main reasons for the performance degradation of small ships is the down-sampling operation by convolution and pooling. They would lead to the disappearance of features for small ships. This issue is not evident in computer vision, as most targets have a large size, and after down-sampling, the model can still learn features well. However, when faced with a large number of small ships in SAR images, this situation will become very serious as it can lead to information loss and the insufficient learning of features, making it difficult to detect small ships. Therefore, it is necessary to use other operations to replace down-sampling while ensuring that small ship information is not lost.
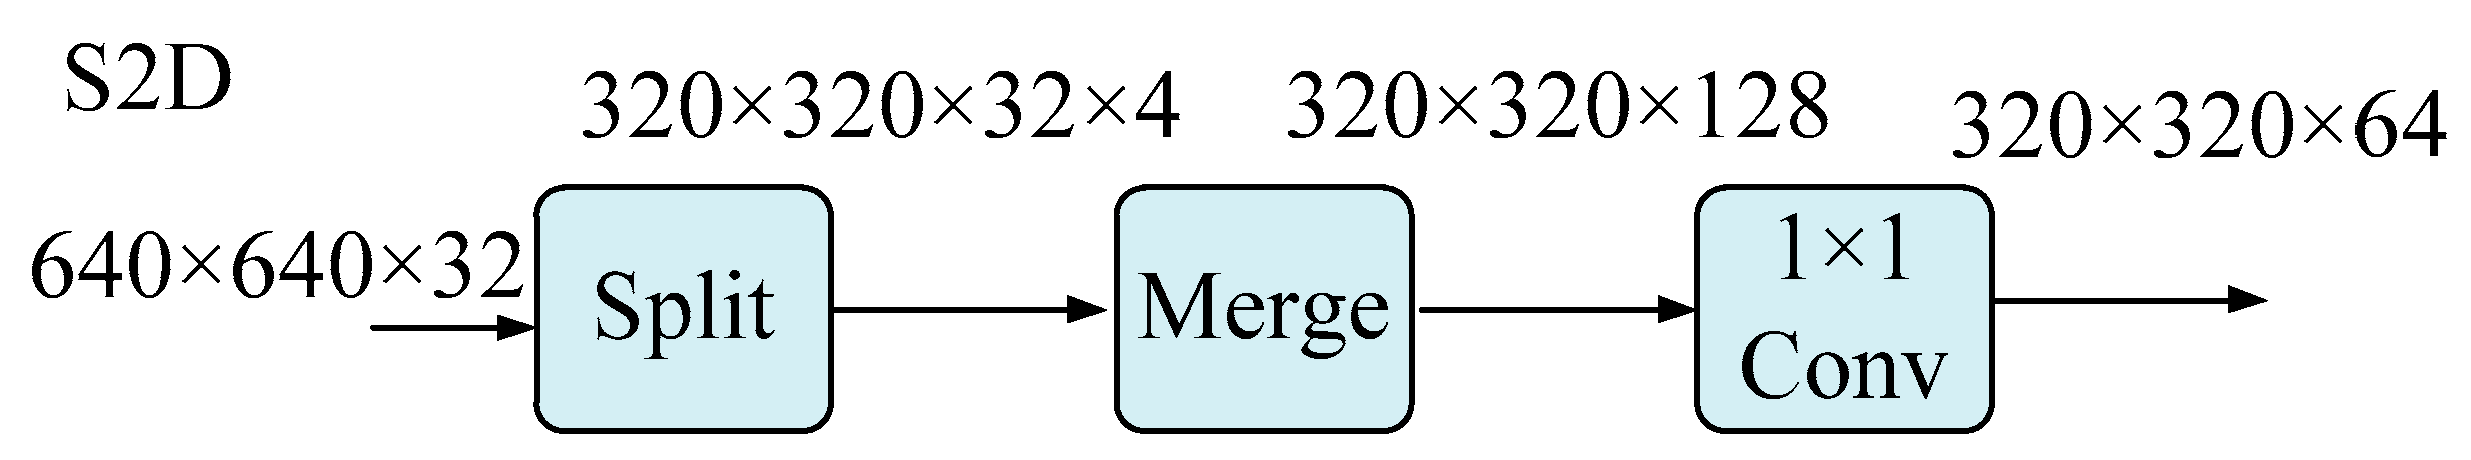
The S2D convolution can be used to replace the convolution and pooling layers [29]. S2D convolution is a space-to-depth layer followed by a convolution layer without strides. The S2D layer down-samples the feature map but retains all information in the channel dimension, so there is no information loss. We add a convolution without strides after each S2D to reduce (or increase) the number of channels using learnable parameters in the added convolutional layers.
Consider any size of 640 × 640 × 32 feature maps, dividing the features into 320 × 320 × 32 × 4. Map and connect these sub-features along the channel dimension to obtain feature maps of size 320 × 320 × 128. Its spatial dimension decreases and channel dimension increases. It adjusts the number of channels to 64 through a 1 × 1 convolution and outputs feature maps of size 320 × 320 × 64, as shown in Figure 2.
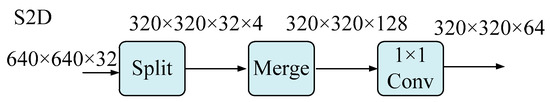
Figure 2.
The S2D module.
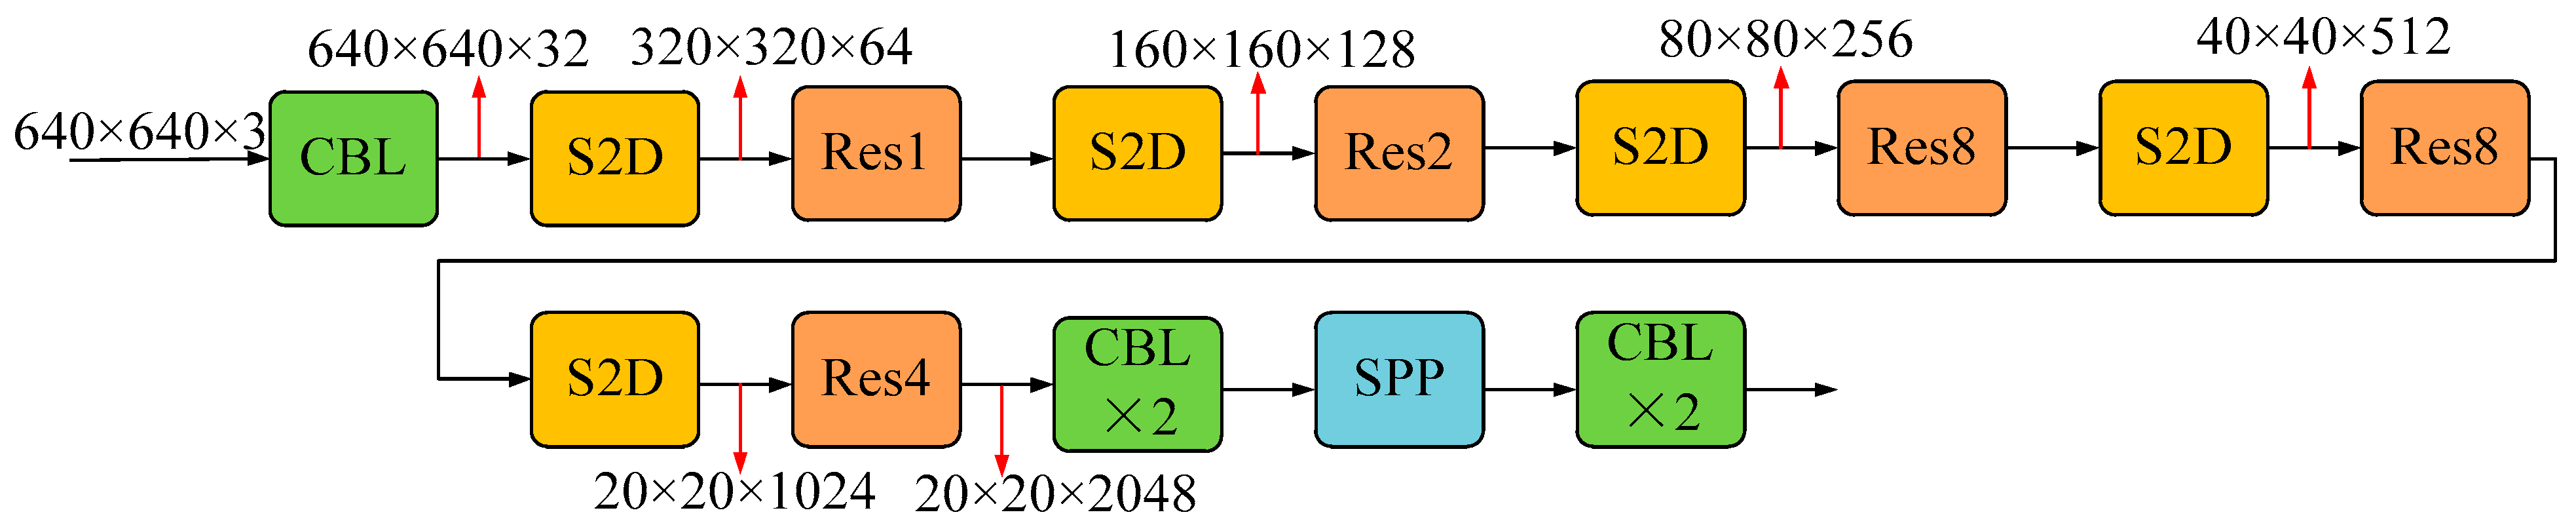
Based on YOLOX-DarkNet-53, we replace the original convolution with S2D convolution building blocks, as shown in Figure 3.
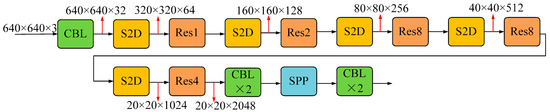
Figure 3.
The backbone without stride and pooling.
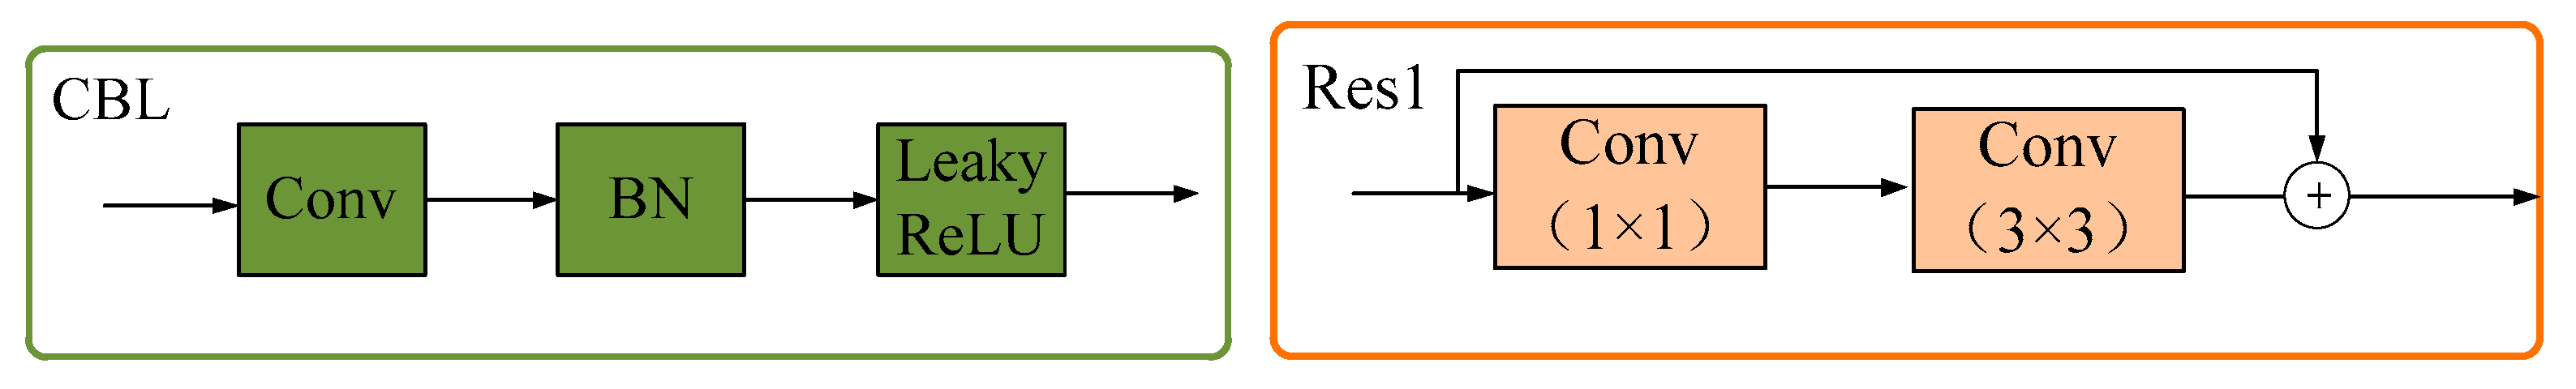
CBL represents convolution, batch normalization layer [30] and leaky ReLU [31], while Res1, Res2, Res4 and Res8 represent 8 residual units [32], respectively. SPP [33] is spatial pyramid pooling. It is shown in Figure 4.
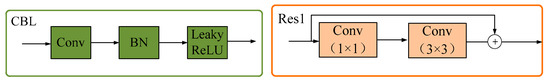
Figure 4.
The CBL and Res1 module.
It is a backbone network designed specifically for small targets and can be successfully trained on SAR ship detection datasets.
3.3. The Neck Network
Deep CNN generates feature maps with different spatial resolutions, where the low-level features describe finer details and have more localization information, while the high-level features capture richer semantic information, which is helpful for classification. Due to the presence of down-sampling, the response of small ships may disappear in deeper layers. To alleviate this problem, many researchers construct feature pyramids by reusing multi-scale feature maps generated by forward propagation and then use low-resolution feature maps to detect small ships, such as FPN [34] and its variants.
FPN and its variants can only fully integrate the features of adjacent layers and can only indirectly “recursively” obtain information from other layers. They can only exchange information selected by the intermediate layer, and unselected information is discarded during transmission [35]. This results in the information of one layer that only affects adjacent layers and has limited impact on other global layers. Therefore, the overall effectiveness of information fusion is limited.
In order to avoid information loss during transmission in traditional FPN structures, the original recursive method is abandoned and a new fusion mechanism is constructed. By using a unified module to collect and fuse information from various levels and then distributing it to different levels, it not only avoids the inherent information loss of traditional FPN but also strengthens the information fusion ability of the neck without significantly increasing latency.
The input of the neck consists of feature maps B2, B3, B4 and B5, and they are extracted from the backbone, with dimensions of 160 × 160, 80 × 80, 40 × 40 and 20 × 20, respectively. The SAM (scale attention module) module collects and aligns features from various levels and distributes them to different levels C3, C4 and C5, as shown in Figure 5.
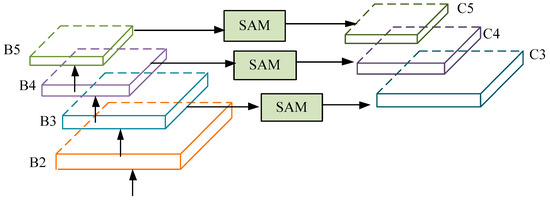
Figure 5.
FPN with scale attention module.
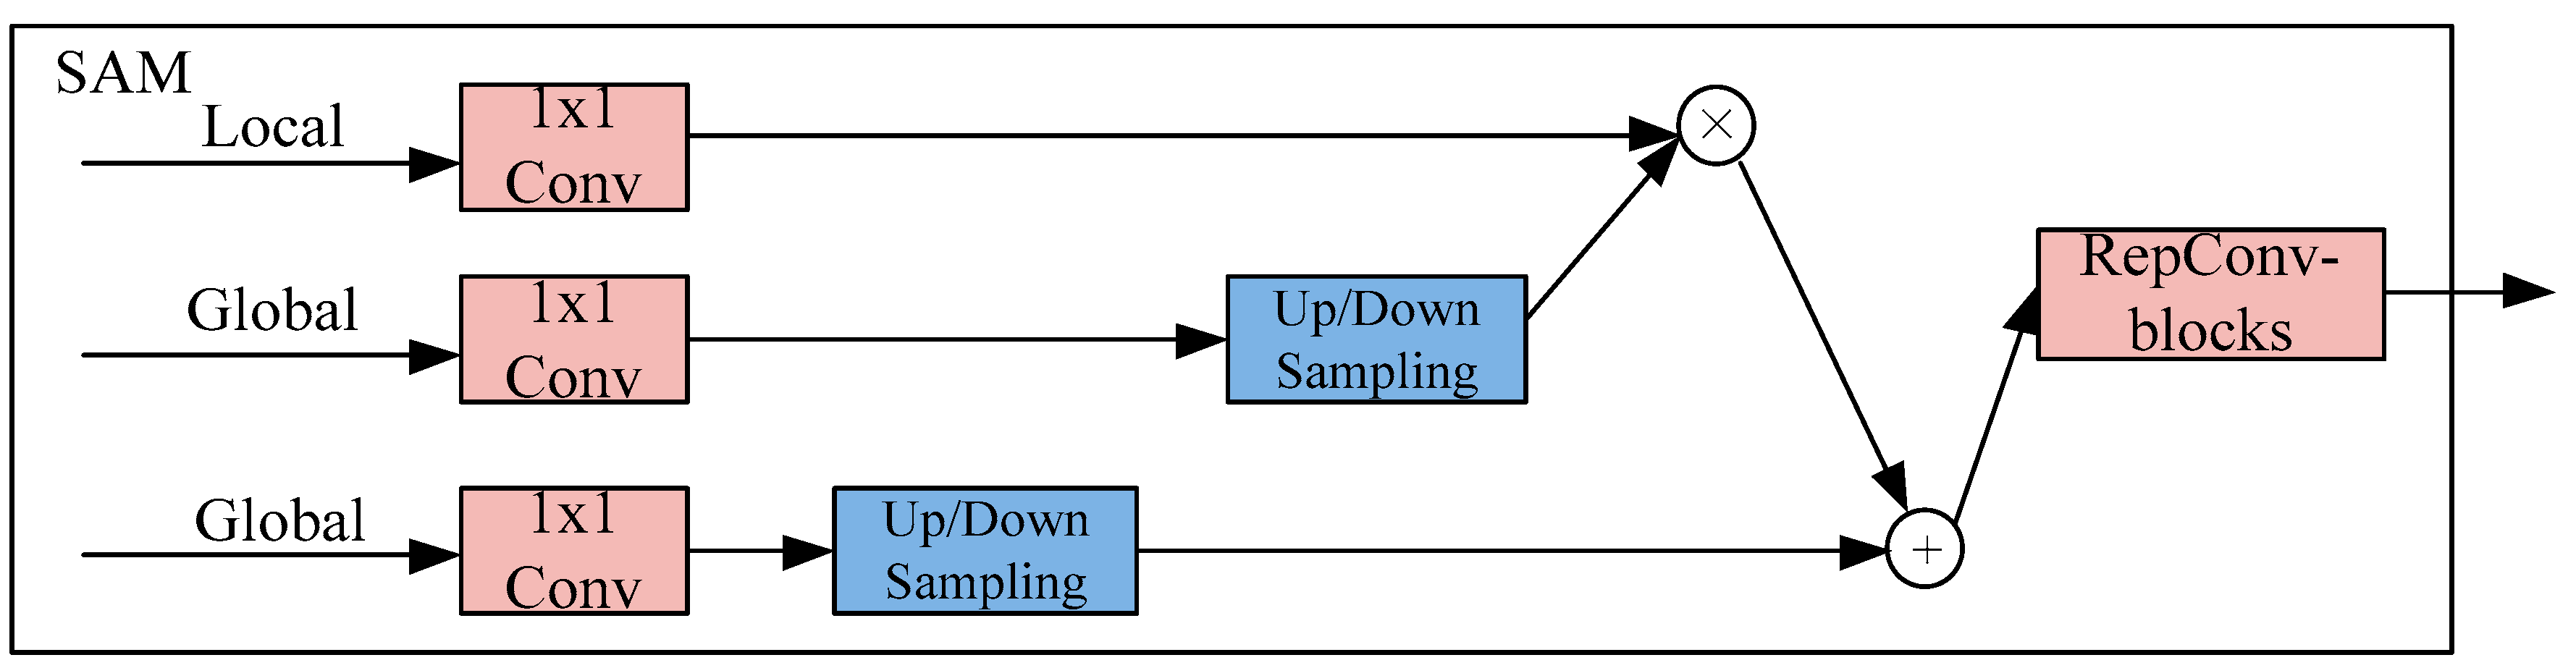
The structure of a SAM module is shown in Figure 6. The input is local features B2–B5 and global features. The global features are produced by fusing the features of B2–B5, and two different convolutions are used for calculations on the global features.
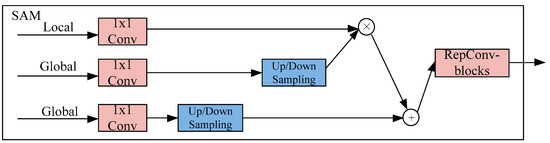
Figure 6.
The SAM module (B2, B3, B4, and B5 are local features).
Due to the size difference between local and global features, average pooling or bilinear interpolation are used to scale the global features to ensure appropriate alignment. At the end of each attention fusion, RepConv is added to further extract and fuse information [36].
The addition symbol represents the addition operation in which two tensors add each other element by element. The multiplication symbol represents the multiplication operation in which two tensors multiply each other element by element.
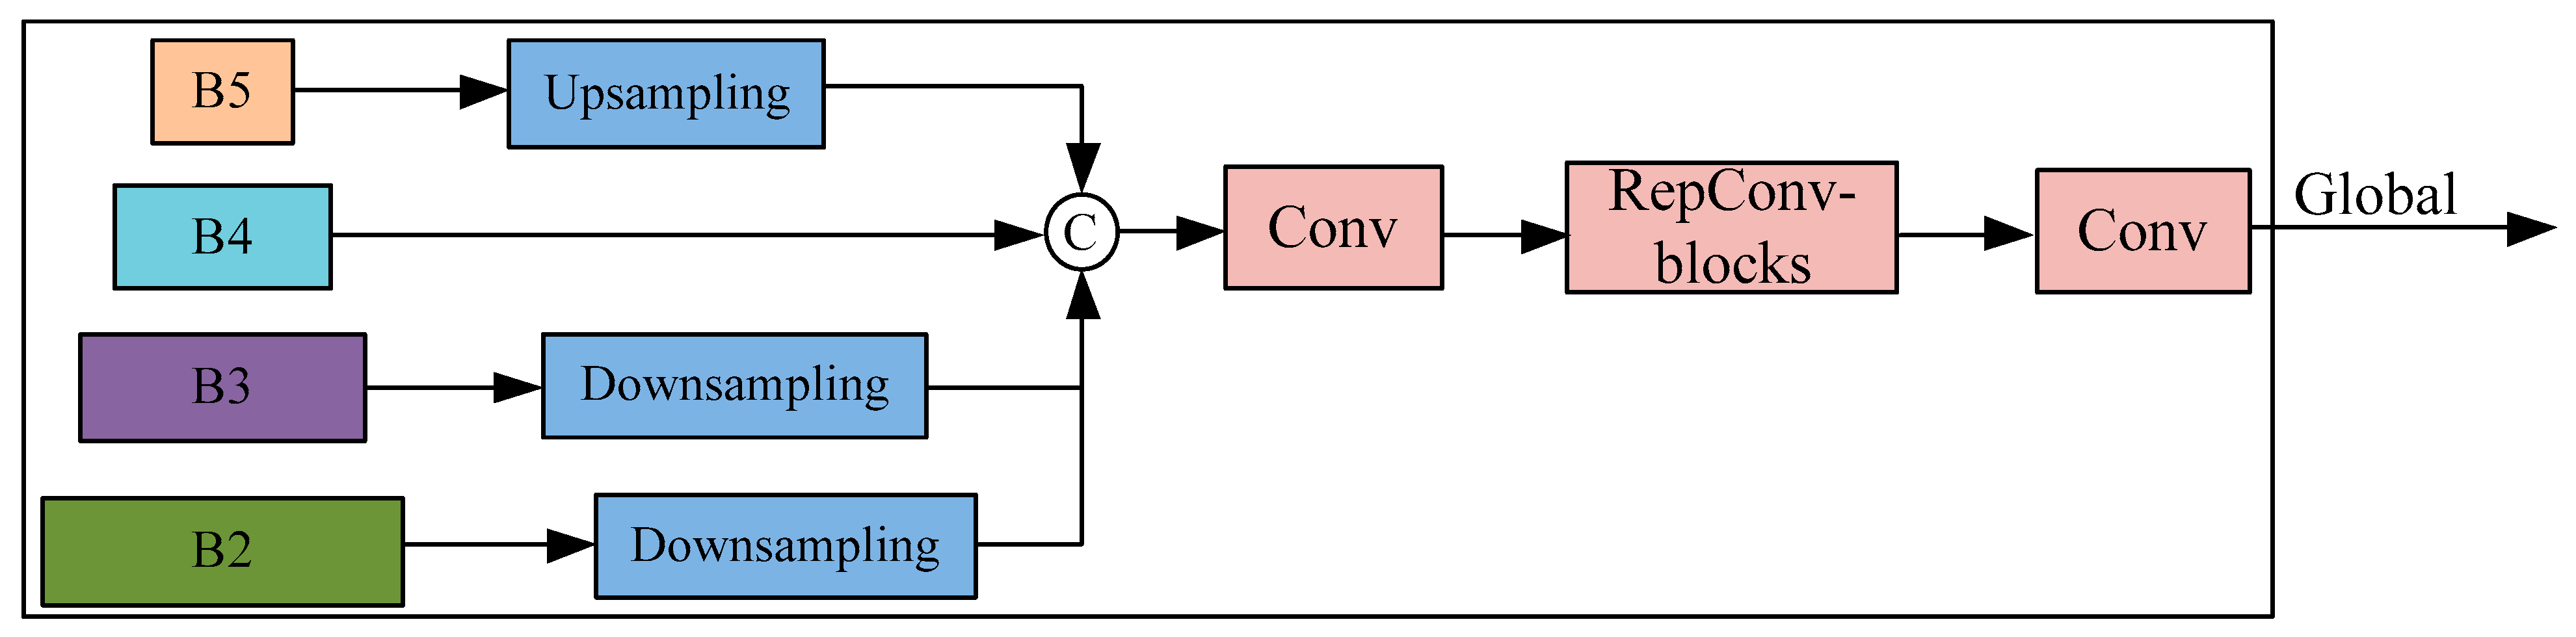
Select B2, B3, B4 and B5 features for fusion and obtain high-resolution features that retain small ship information. Using average pooling operation to down-sample input features and achieve uniform size can aggregate information efficiently while minimizing computation. The concatenation symbol represents the concatenation operation in which two tensors are spliced together along one dimension. It is shown in Figure 7.
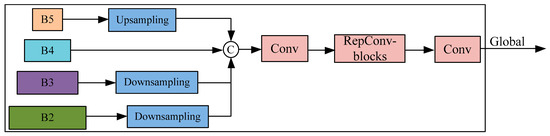
Figure 7.
Global feature module.
A larger feature map can retain more localization information but will increase computational complexity. A smaller feature map will lose the localization information of smaller ships. Therefore, we chose B4 as the size for feature alignment to achieve a balance between speed and accuracy.
After obtaining the fused global information, the information is distributed to various levels and injected using simple attention operations to improve the detection ability of branches.
By fusing features from different levels globally to obtain global information and injecting global information into features at different levels, efficient information exchange and fusion are achieved. Without significantly increasing delay, the SAM system significantly improves the information fusion ability of the neck part and improves the model’s detection ability for small ships.
3.4. The IoU
The IoU and its improvements (such as GIoU, DIoU, CIoU, etc.) are commonly used to compute the loss of the predicted bounding boxes with the ground truth bounding boxes [37,38]. We observed that they are sensitive to slight deviations for small ships. The little deviation between two small bounding boxes may cause significant changes in loss. To reduce the sensitivity of small ships, we propose a new method called Scale IoU for computing loss.
In fact, small ships can be regarded as points, and the importance of width and height is much lower than the position of the center point. Meanwhile, we found that IoU is scale-invariant (scaling all coordinates of two boxes by the same factor k will result in the same IoU), while the detection model is not scale-invariant (the ratio of the localization error to ship size increases as the ship becomes smaller). Therefore, the IoU of small ships will be lower. To alleviate this issue, we propose Scale IoU to relax the invariance of IoU and enable it to support more small ships. The new designed IoU is defined as follows:
In which and it is a function of ship size; therefore, the score is rescaled based on the size of the ship. The k1 and k2 are two parameters that control rescaling. We set these to and , respectively, according to previous experiments [39]. D represents the Euclidean distance between the centers of two bounding boxes, and S represents the area of the bounding box. The expression is as follows:
In the formula, and represent the center coordinates of the bounding boxes of A and B, respectively, while w1, h1, w2 and h2 represent the width and height of the bounding boxes.
Scale IoU takes into account both the area and center distance of the ship box (a small area leads to a large loss, and a small distance leads to a small loss). It focuses on the position and size relationship between the center points, making it more suitable for small ships. It is not sensitive to slight deviations between two bounding boxes.
As the proposed detector is anchor-free, the proposed Scale IoU can be used in NMS [40] and the computation of regression loss.
3.5. The Loss Function
In the training process, small ships would have fewer positive samples during the label-assigning process as the small area. As a result, they contribute less to the total loss in most training iterations compared to the large ones. Insufficient supervision signals for small ships can lead to poor detection performance. Therefore, it is necessary to focus more on the loss of small ships.
For object detection, the loss function generally consists of three parts: classification loss, confidence loss, and localization loss. The classification loss and confidence loss are independent of the size of the ship, while the localization loss is related to the size of the ship [41]. In order to balance the loss distribution and alleviate the insufficient supervision of small ships, a new localization loss function is proposed, which can effectively supervise small ships and train detectors more evenly. The designed loss function is multiplied by the function before the localization loss:
The loss function is borrowed from YOLOv5. The three loss functions include classification loss, localization loss and confidence loss. The cross entropy loss function is used for classification loss, the Scale IoU function is used for localization loss and the objectness score function is used for confidence loss. , and were the balance coefficients, which were 0.5, 1 and 0.05, respectively.
In order to ensure that the loss function leans more toward small ships during the training iteration process—the smaller the loss of small ships, the greater their loss—we use the gain function . The formula of the gain function is as follows:
Among them,
In the formula, t represents the area of the ground truth bounding box, and τ represents the ratio of small ship losses to total losses. The gain coefficient is ; it introduces τ as a feedback signal that is sensitive to loss distribution. It also adopts a nonlinear scale sensitivity coefficient to make it sensitive to scale changes. The smaller the ship size t and the loss of small ships τ, the greater the gain coefficient. refers to the sum of loss values for small ships, and refers to the sum of loss values for all ships (small, medium and large).
To avoid the problem of negative gain, it is designed as a piecewise function. When t is less than the threshold ω, uses , and when it is greater than the threshold, the original scale sensitive gain coefficient (2 − t) is used.
Through the above loss function, the supervised signal for small ships will be more sufficient, the training of the detector will be more balanced and the accuracy will steadily improve. This loss function can be easily integrated into any detector, and it imposes almost no additional burden during training and inference processes.
4. The Experimental Results
4.1. The Environments
The experiments were conducted on Ubuntu 18.04 operation system. The Pytorch 1.1 deep learning framework and MMdetection 1.1 object detection frameworks were used. The hardware is Intel Xeon (Cascade Lake) Platinum 8269CY CPU@2.5 GHz with one NVIDIA GeForce TITAN V GPU (with 12GB memory). The warming up strategy was adopted for all training parameters. The former 500 iterations were carried out with one-third of the regular learning rate, and then the learning rate gradually recovered to 0.0025. The momentum of all models was set to 0.9, and the weight rate attenuation was set to 0.0025. The SGD optimizer was used for optimization. The division standard of small, medium and large ships in the SAR ship detection dataset were coincident with the MS COCO dataset.
4.2. The Datasets
SSDD and the SAR-Ship-Dataset are two commonly used datasets for SAR ship detection with deep learning. SSDD was released publicly at the 2017 BIGSARDATA conference in Beijing [15]. It is the first dataset in SAR ship detection and has played a very important role in promoting the development of this field. This is demonstrated in paper [4], in which the significance, benchmark results and future directions of SSDD are shown. It is the most commonly used dataset to date. It has 1160 images and 2456 ships. The ships in this dataset are diverse. Some of the samples in this datasets are shown in Figure 8.
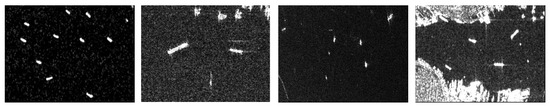
Figure 8.
Some of the samples in SSDD.
The SAR-Ship-Dataset is a larger dataset in this area compared to SSDD [14]. It has 43,819 images and 59,535 ships. These ships have distinct scales and backgrounds. The resolution, incident angle, polarization mode and imaging mode are diverse, which is helpful for detection. Some of the samples in this dataset are shown in Figure 9.
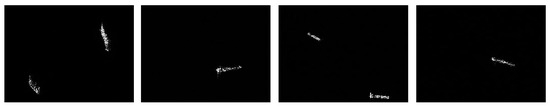
Figure 9.
Some of the samples in the SAR-Ship-Dataset.
From the above two datasets, we can see that the ships in SAR images are rather small and the proportion of small ships in the datasets is extremely high, as shown in Table 1. This phenomenon presents significant challenges for SAR ship detection. Therefore, small object detection strategies are essential for improving the overall performance of ship detection in SAR images.
4.3. Comparison with the State-of-the-Art Object Detectors on SSDD
In order to verify the performance of different detectors on small, medium and large ships in SSDD, the following experiments were conducted in this section. A total of 22 detectors were selected in Table 2. The AP (average precision), Aps (AP for small ships), Apm (AP for medium ships), Apl (AP for large ships) and FPS (frames per second) were used as evaluation metrics [42].
Table 2.
The performance of different detectors on SSDD.
From Table 2, we can observe that the single-stage detectors have a higher AP compared to two-stage detectors overall. However, the former is faster than the latter in general. Besides, the anchor-free detectors can obtain a better tradeoff between accuracy and latency.
Among them, YOLOX has significant advantages in speed and accuracy compared to other detectors, and it does not require anchor boxes and is trained from scratch. Therefore, the proposed method in this paper is based on YOLOX. It can be found that the AP of the proposed detector increased by 0.085, and the Aps, Apm and Apl improve by 0.09, 0.064 and 0.071, respectively. The proposed method has improved the performance of large, medium and small ships, and the improvement of small ships is rather large. This is partly due to the fact that the datasets have a large number of small ships, and improving Aps is a good method to improve the overall performance of SAR ship detection.
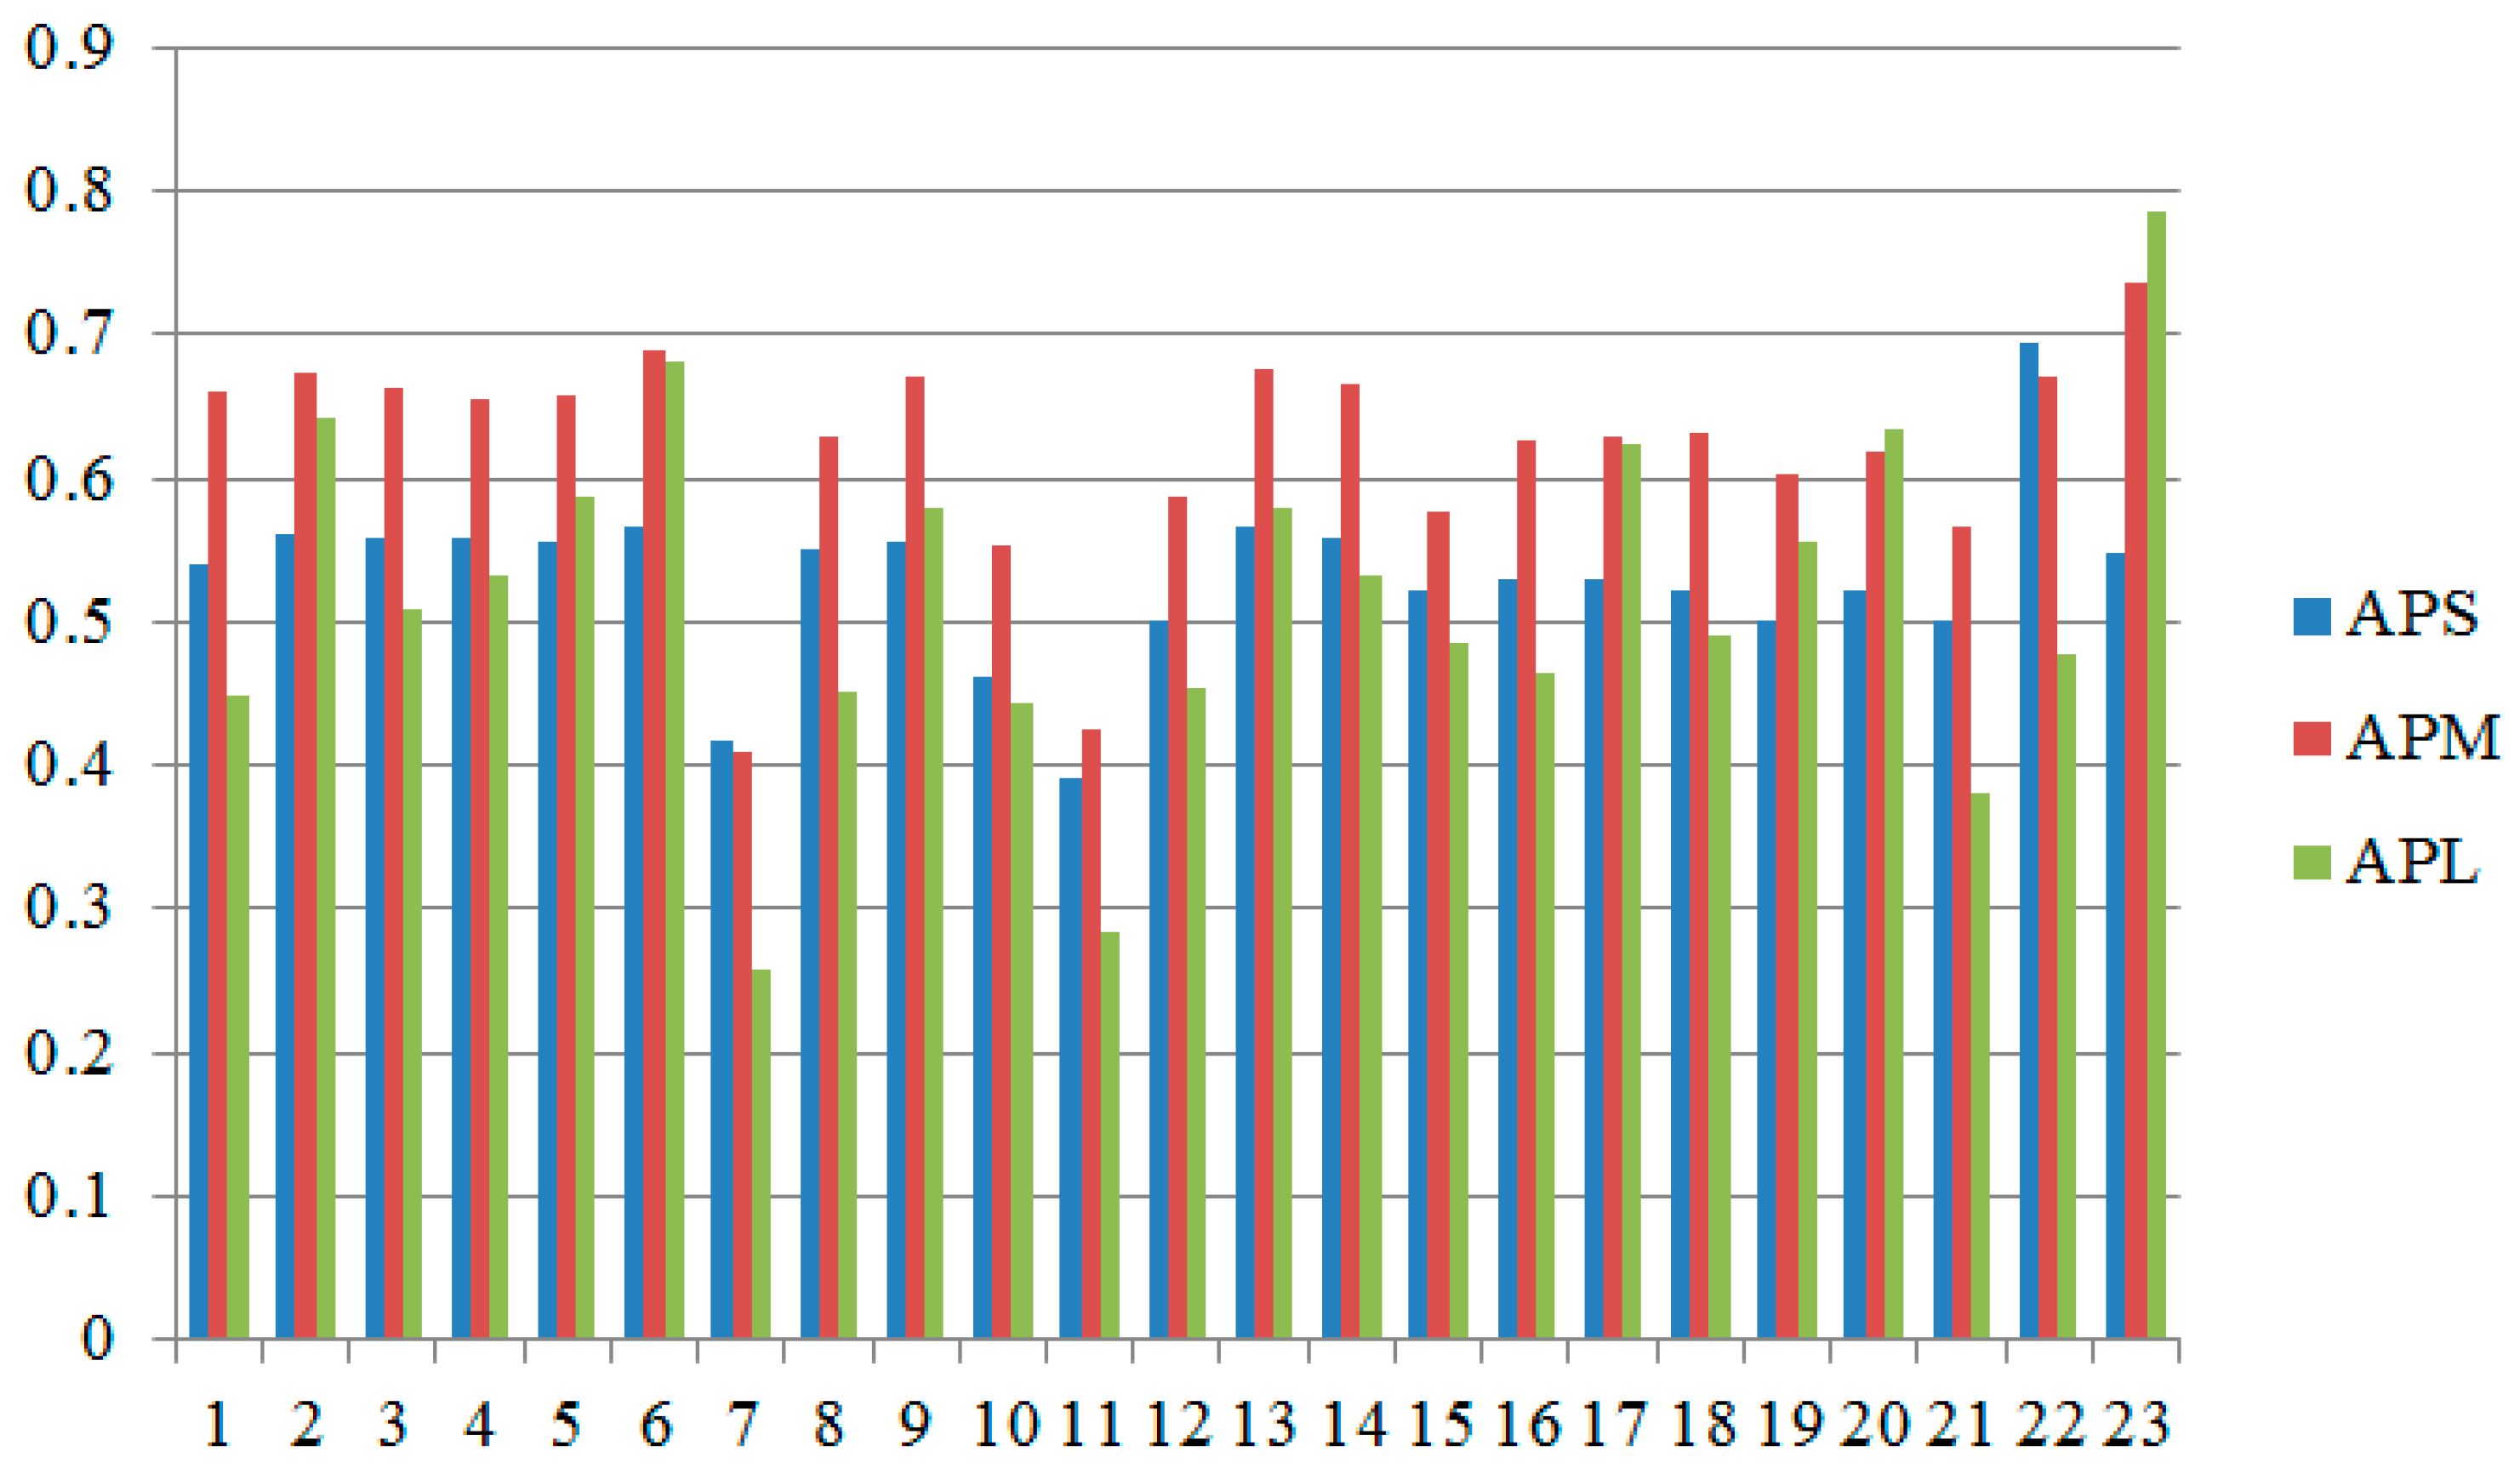
Drawn from the above data, as shown in the following figure, two phenomena can be observed. The first is fluctuation, and the second is that many detectors have lower AP for large ships compared to small and medium ships.
Intuitively, the Aps should be much lower than that of Apm or Apl, but we found that it is not the case, as seen in Figure 10. There are significant fluctuations in Figure 10; sometimes large ships have higher AP, and sometimes small ships have higher AP. By analyzing the dataset, the reason behind this phenomenon is as follows: in SSDD, there are fewer large ships (62.8%, 34.6% and 2.6% for small, medium and large, respectively), and missing or successfully detecting one during testing has a significant impact on the final AP, resulting in significant fluctuations.
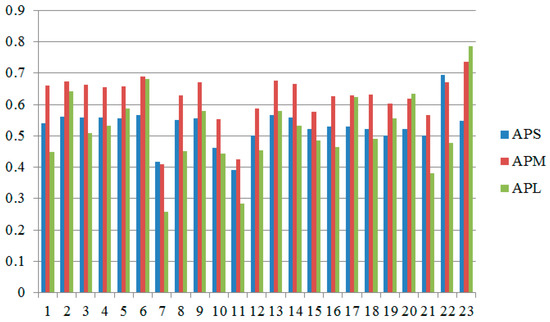
Figure 10.
The curves of different detectors on SSDD with Aps, Apm and Apl (the x-axis represents the sequence number of the detector).
From the above figure, it can be observed that there is an abnormal phenomenon of low AP for many large ships. Further statistics were conducted on the average of AP, Aps, Apm and Apl. The results are shown in Table 3, with an average Aps, Apm and Apl of 0.53, 0.615 and 0.504, respectively. It is normal for Apm to be higher than Aps. However, it is anomalous that Apl is lower than Aps and Apm. The reason is that there are fewer large ships in the datasets SSDD and SAR-Ship-Dataset, and large ships are trained less frequently, resulting in poor detection performance.
Table 3.
The average of AP, Aps, Apm and Apl on SSDD.
4.4. Comparison with the State-of-the-Art Object Detectors on SAR-Ship-Dataset
In order to verify the detection performance of different detectors on small, medium and large ships in SAR-Ship-Dataset, the following experiments were conducted in this section. A total of 14 detectors were selected in Table 4; the AP, Aps, Apm, Apl and FPS were used as evaluation metrics.
Table 4.
The performance of different detectors on the SAR-Ship-Dataset.
From Table 4, we can also find that the single-stage detectors have higher AP but lower speed. The anchor-free detectors have a better tradeoff between accuracy and latency. Compared to YOLOX, the proposed method has improved the average AP, Aps, Apm and Apl by 0.084, 0.101, 0.07 and 0.061, respectively.
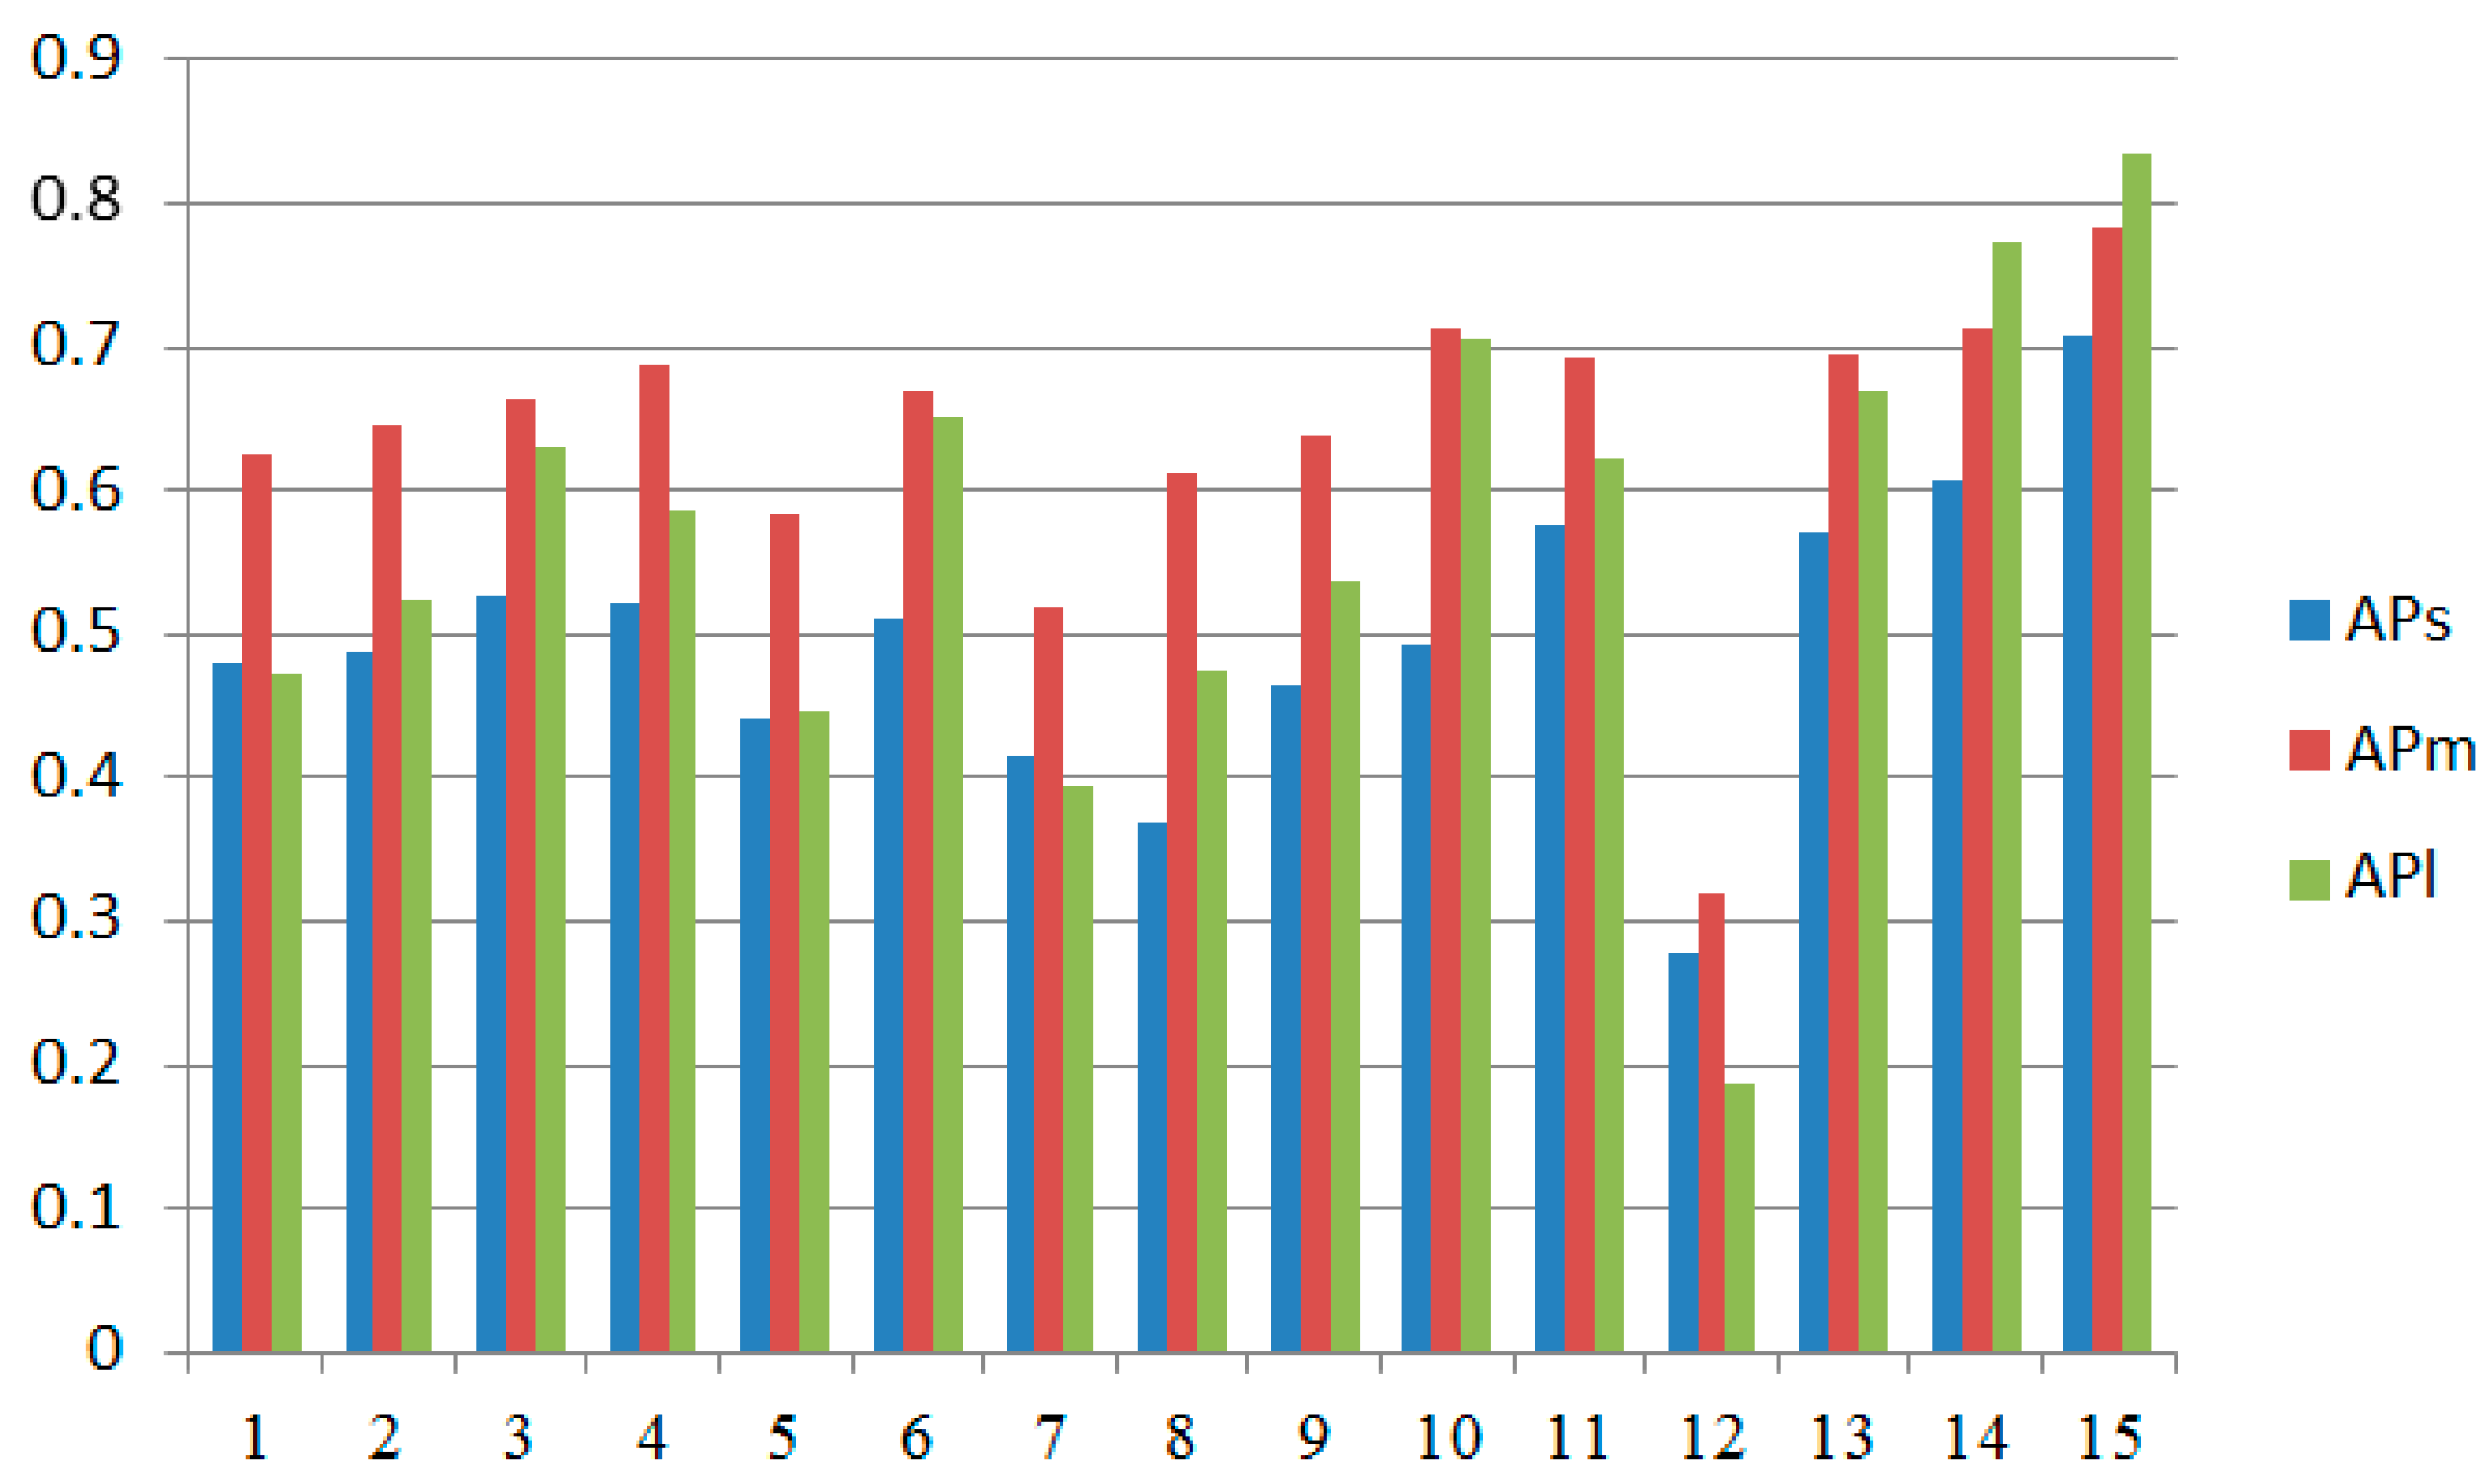
Drawn from the above data, as shown in Figure 11, two phenomena can be observed, which are similar to that observed in SSDD.
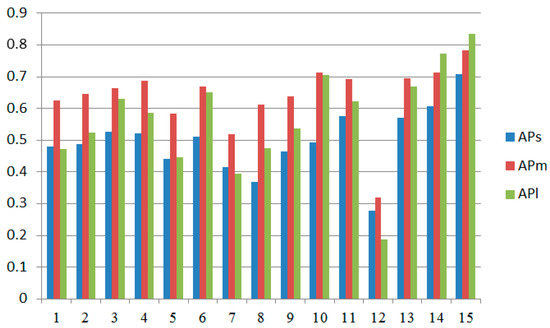
Figure 11.
The curves of different detectors on the SAR-Ship-Dataset with Aps, Apm and Apl (the x-axis represents the sequence number of the detector).
The fluctuations are due to the fact that the SAR-Ship-Dataset has fewer large ships (56.5%, 43.2% and 0.3% for small, medium and large, respectively), and missing or successfully detecting one during testing has a significant impact on the final AP. The statistics are shown in the table below, with an average Aps, Apm and Apl of 0.53, 0.615 and 0.504, respectively. It is normal for Apm to be higher than Aps. However, it is abnormal for Apl to be lower than Aps and Apm. The reason is that there are fewer large ships in the dataset, and large ships are trained less frequently, resulting in poor detection performance.
It should be noticed that no detector can simultaneously balance the small targets and large targets. This is also demonstrated in SSDD and the SAR-Ship-Dataset as shown in Table 4 and Table 5. Therefore, improving the detection performance of small targets also means decreasing the detection performance of large targets. Since SAR ship detection datasets have a large proportion of small ships, using the strategies we propose, we can increase the accuracy and decrease loss. Therefore, the overall detection performance can be improved.
Table 5.
The average of AP, Aps, Apm and Apl on the SAR-Ship-Dataset.
4.5. Evaluation of Different Components
The improvements of each component on SSDD and the SAR-Ship-Dataset are shown in Table 6 and Table 7. The AP of YOLOX is 0.686 and 0.658, respectively. The proposed backbone improves AP by 0.021 and 0.028, demonstrating the effectiveness of S2D in reducing information loss during down-sampling. It is an effective method to use S2D convolution to replace convolution and pooling layers. The proposed neck improves AP by 0.014 and 0.016, which demonstrates the effectiveness of using global and local information in constructing FPN. It is an effective method to realize efficient information exchange and fusion by integrating features of different levels globally and injecting them into different levels. The proposed IoU increases AP by 0.015 and 0.019, indicating that it is more suitable as a measure for small ships. It is an efficient metho to take the distance and scale between boxes as the main factors of consideration rather than the area. The proposed loss function increases AP by 0.017 and 0.021, indicating the importance of increasing the weight of the localization loss of small ships. It is an effective method to strengthen the supervised signal of small ships by adjusting the gain of the localization loss adaptively.
Table 6.
The ablation results of the proposed detector on SSDD.
Table 7.
The ablation results of the proposed detector on SAR-Ship-Dataset.
From the above experiments, it can be found that the backbone has the most significant improvement, followed by the loss function, IoU and the neck. This is because small ships are extremely prone to losing information during feature extraction. Taking measures to preserve the information of small ships is crucial for improving detection performance. The above experiments also proved that integrating the four strategies mentioned above is effective.
The proposed method is conducted on the test dataset, which has a large number of small ships and a small number of large ships. By improving the performance of small ships, the overall performance is also improved, even though the performance for large ships may decrease occasionally.
4.6. The Detection Results
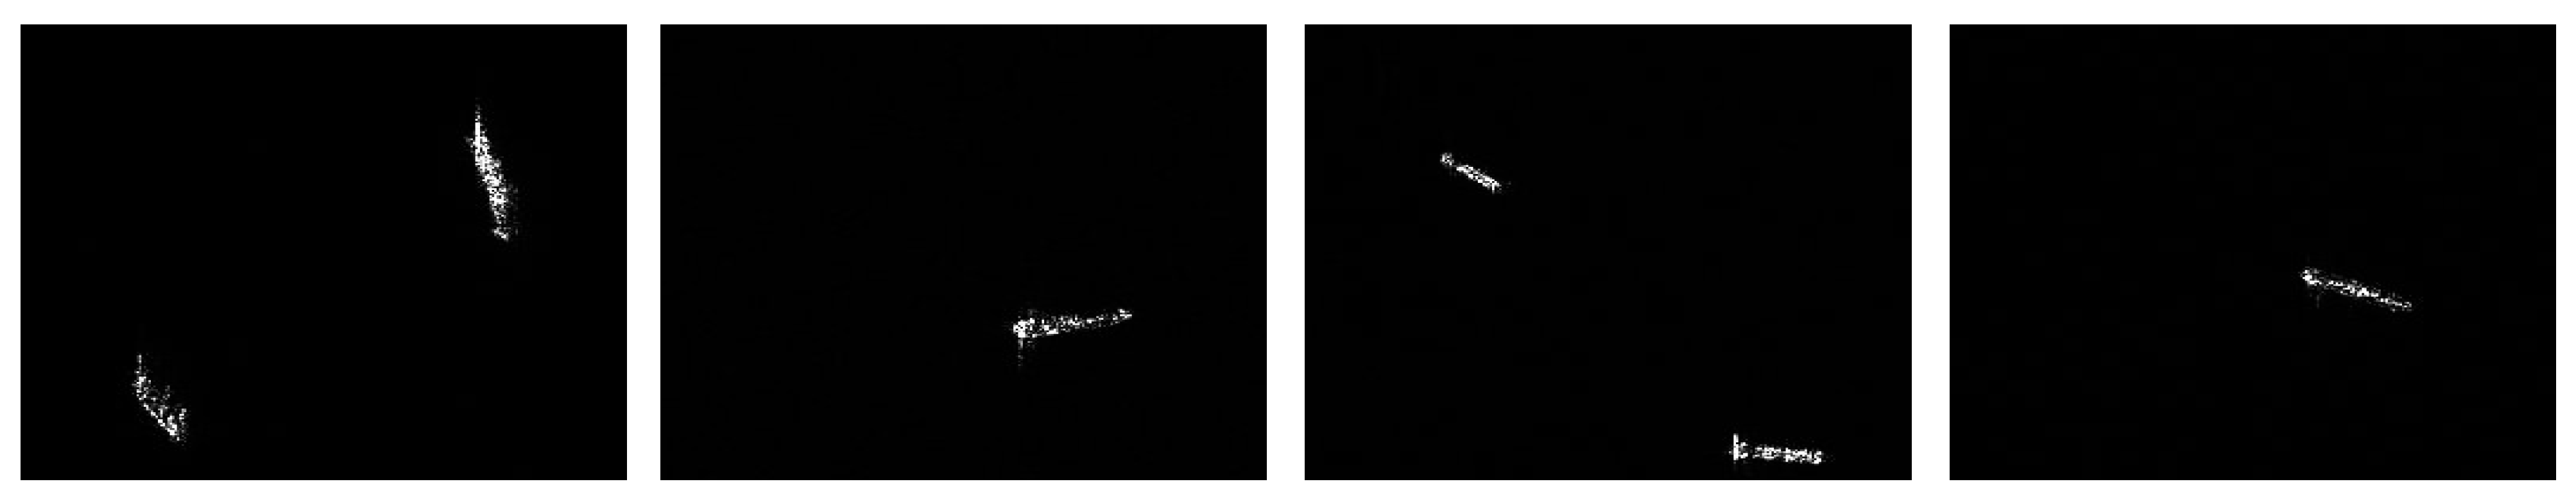
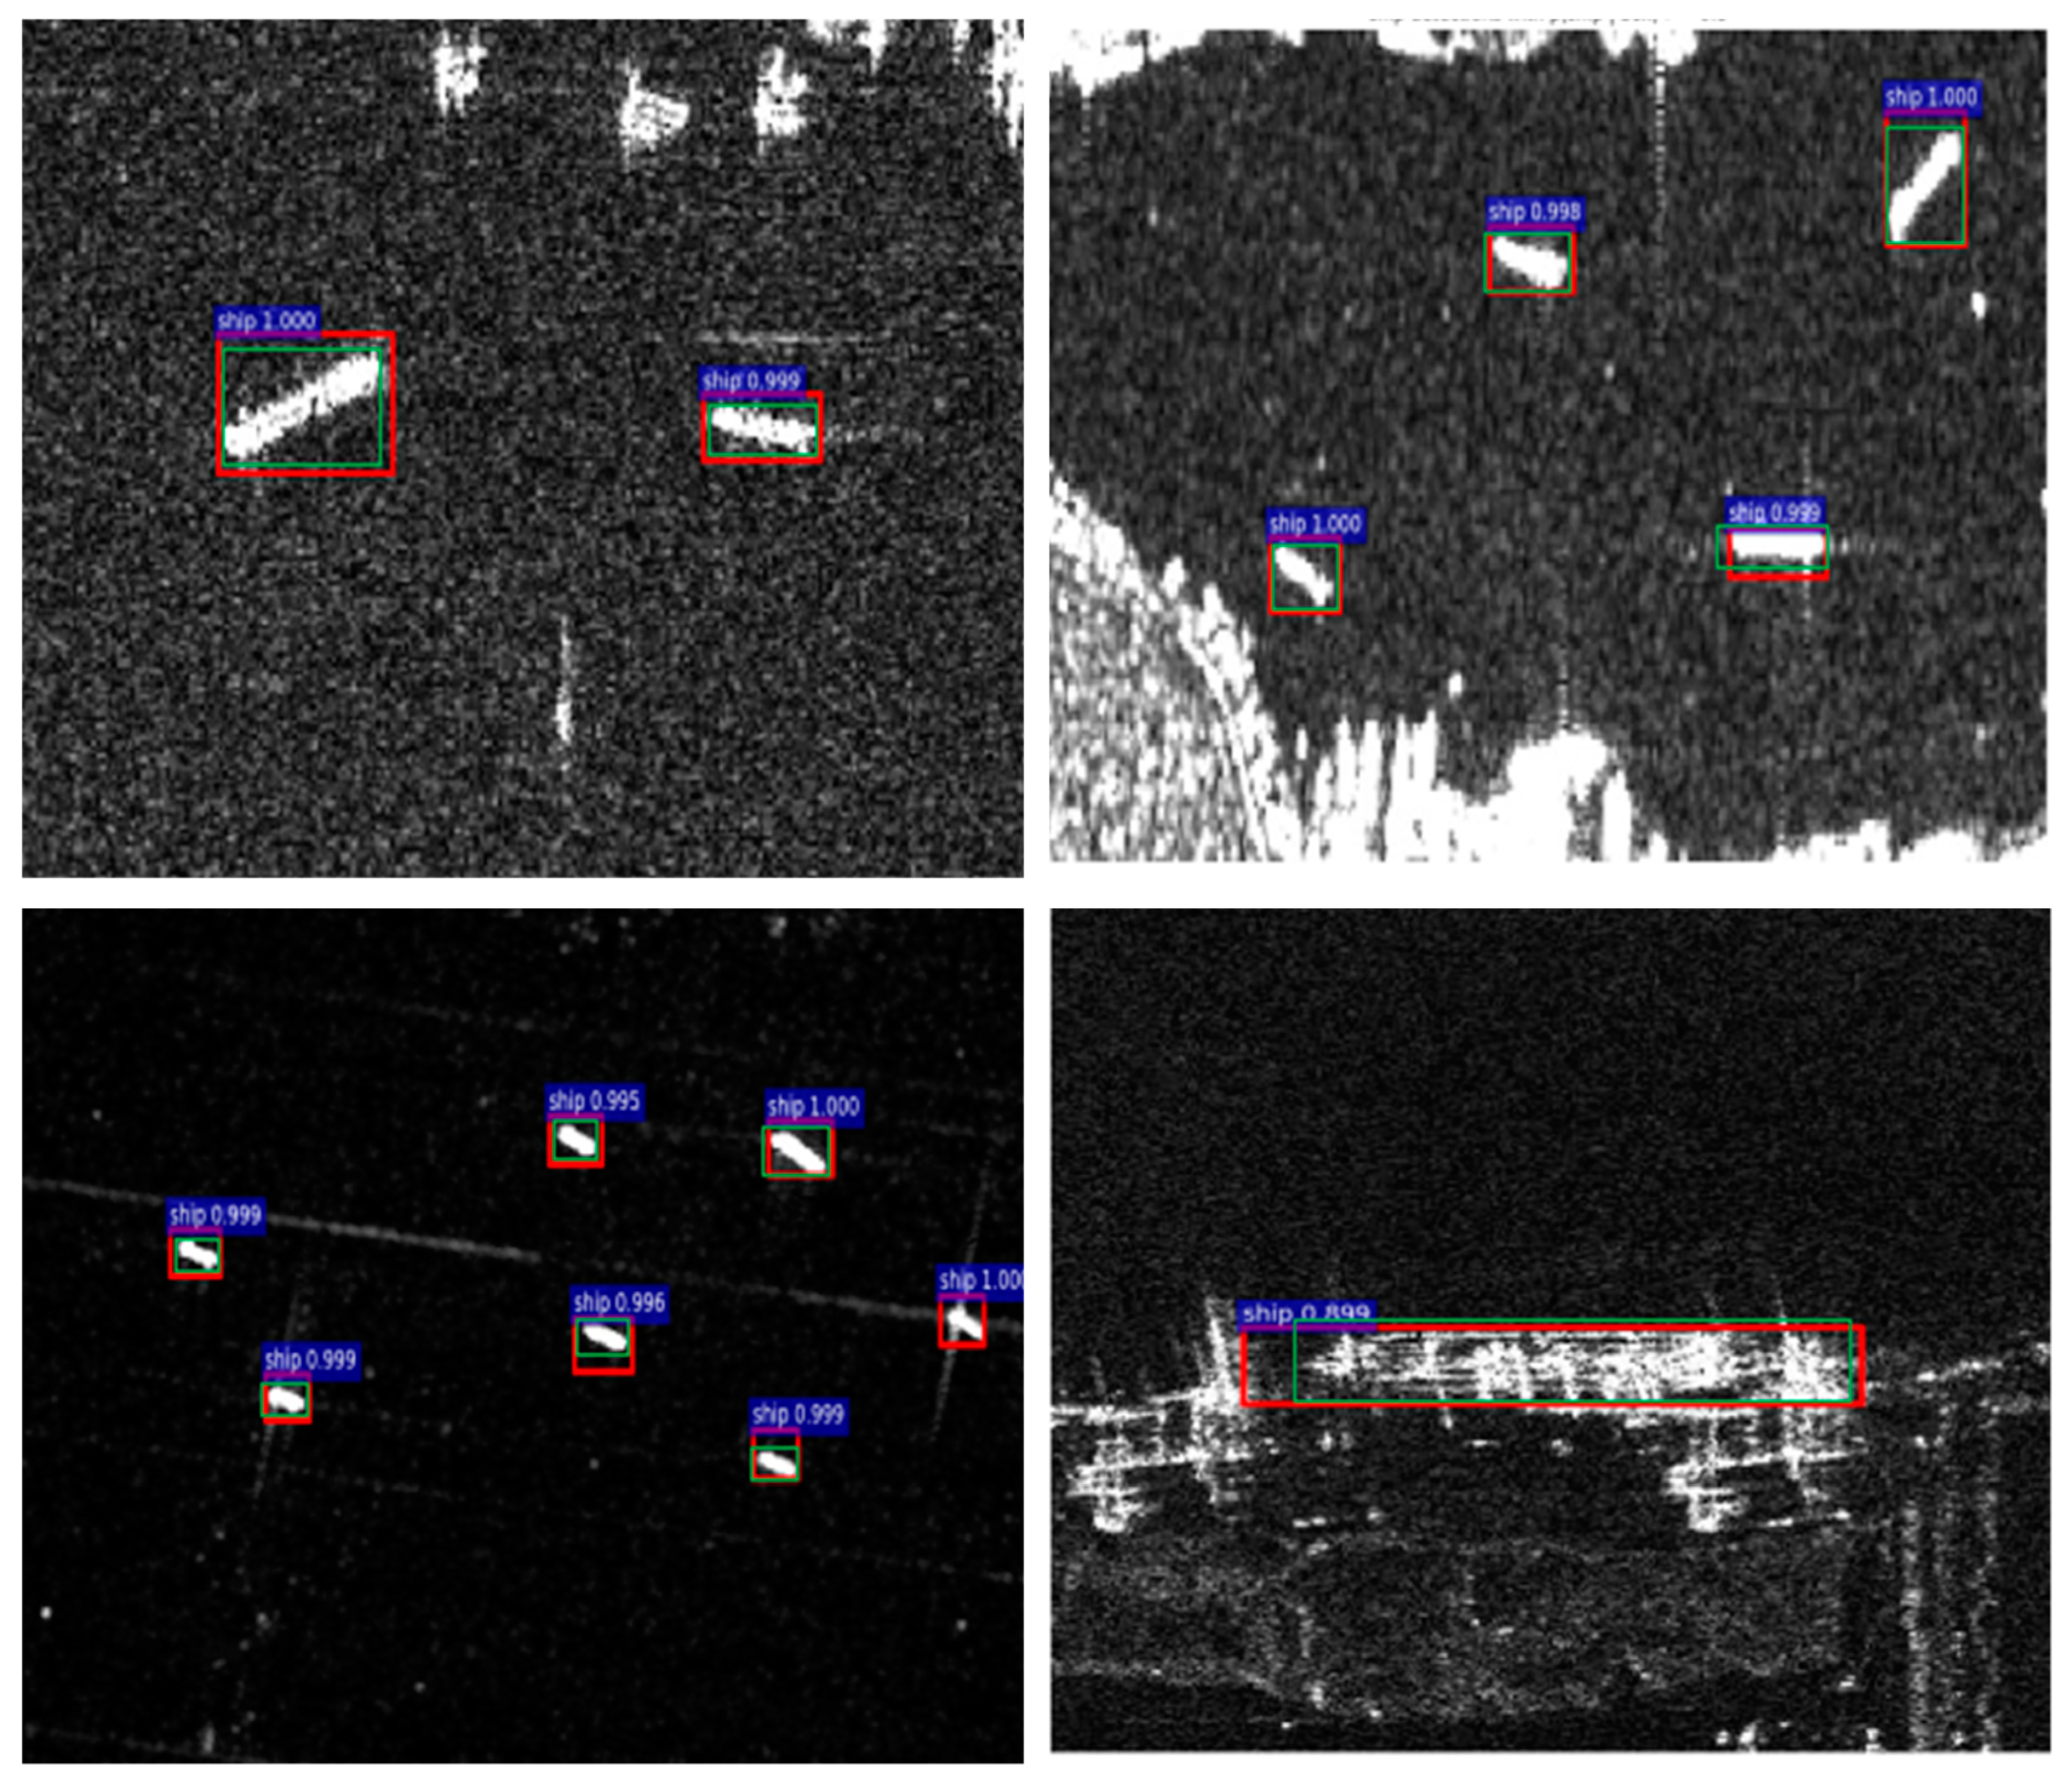
Some of the detection results of the proposed method on SSDD and the SAR-Ship-Dataset are shown in Figure 12 and Figure 13. We found that most of the ships are small, and the proposed method can successfully detect small ships in most cases. Therefore, it is an effective way to improve the overall detection performance through small object detection strategies.
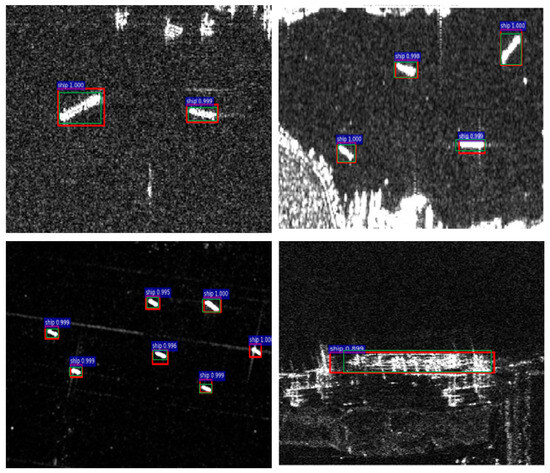
Figure 12.
The detection results on SSDD (the ground truth boxes are shown with green color).
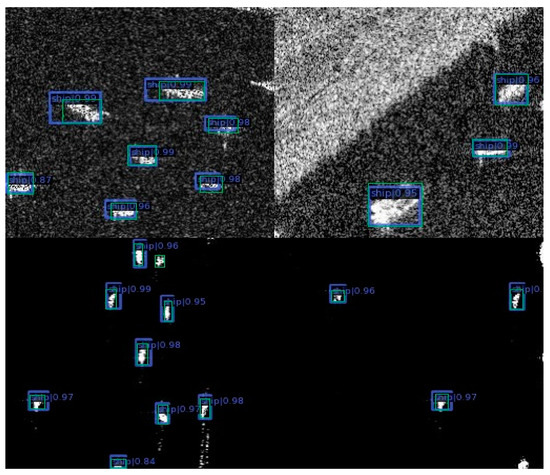
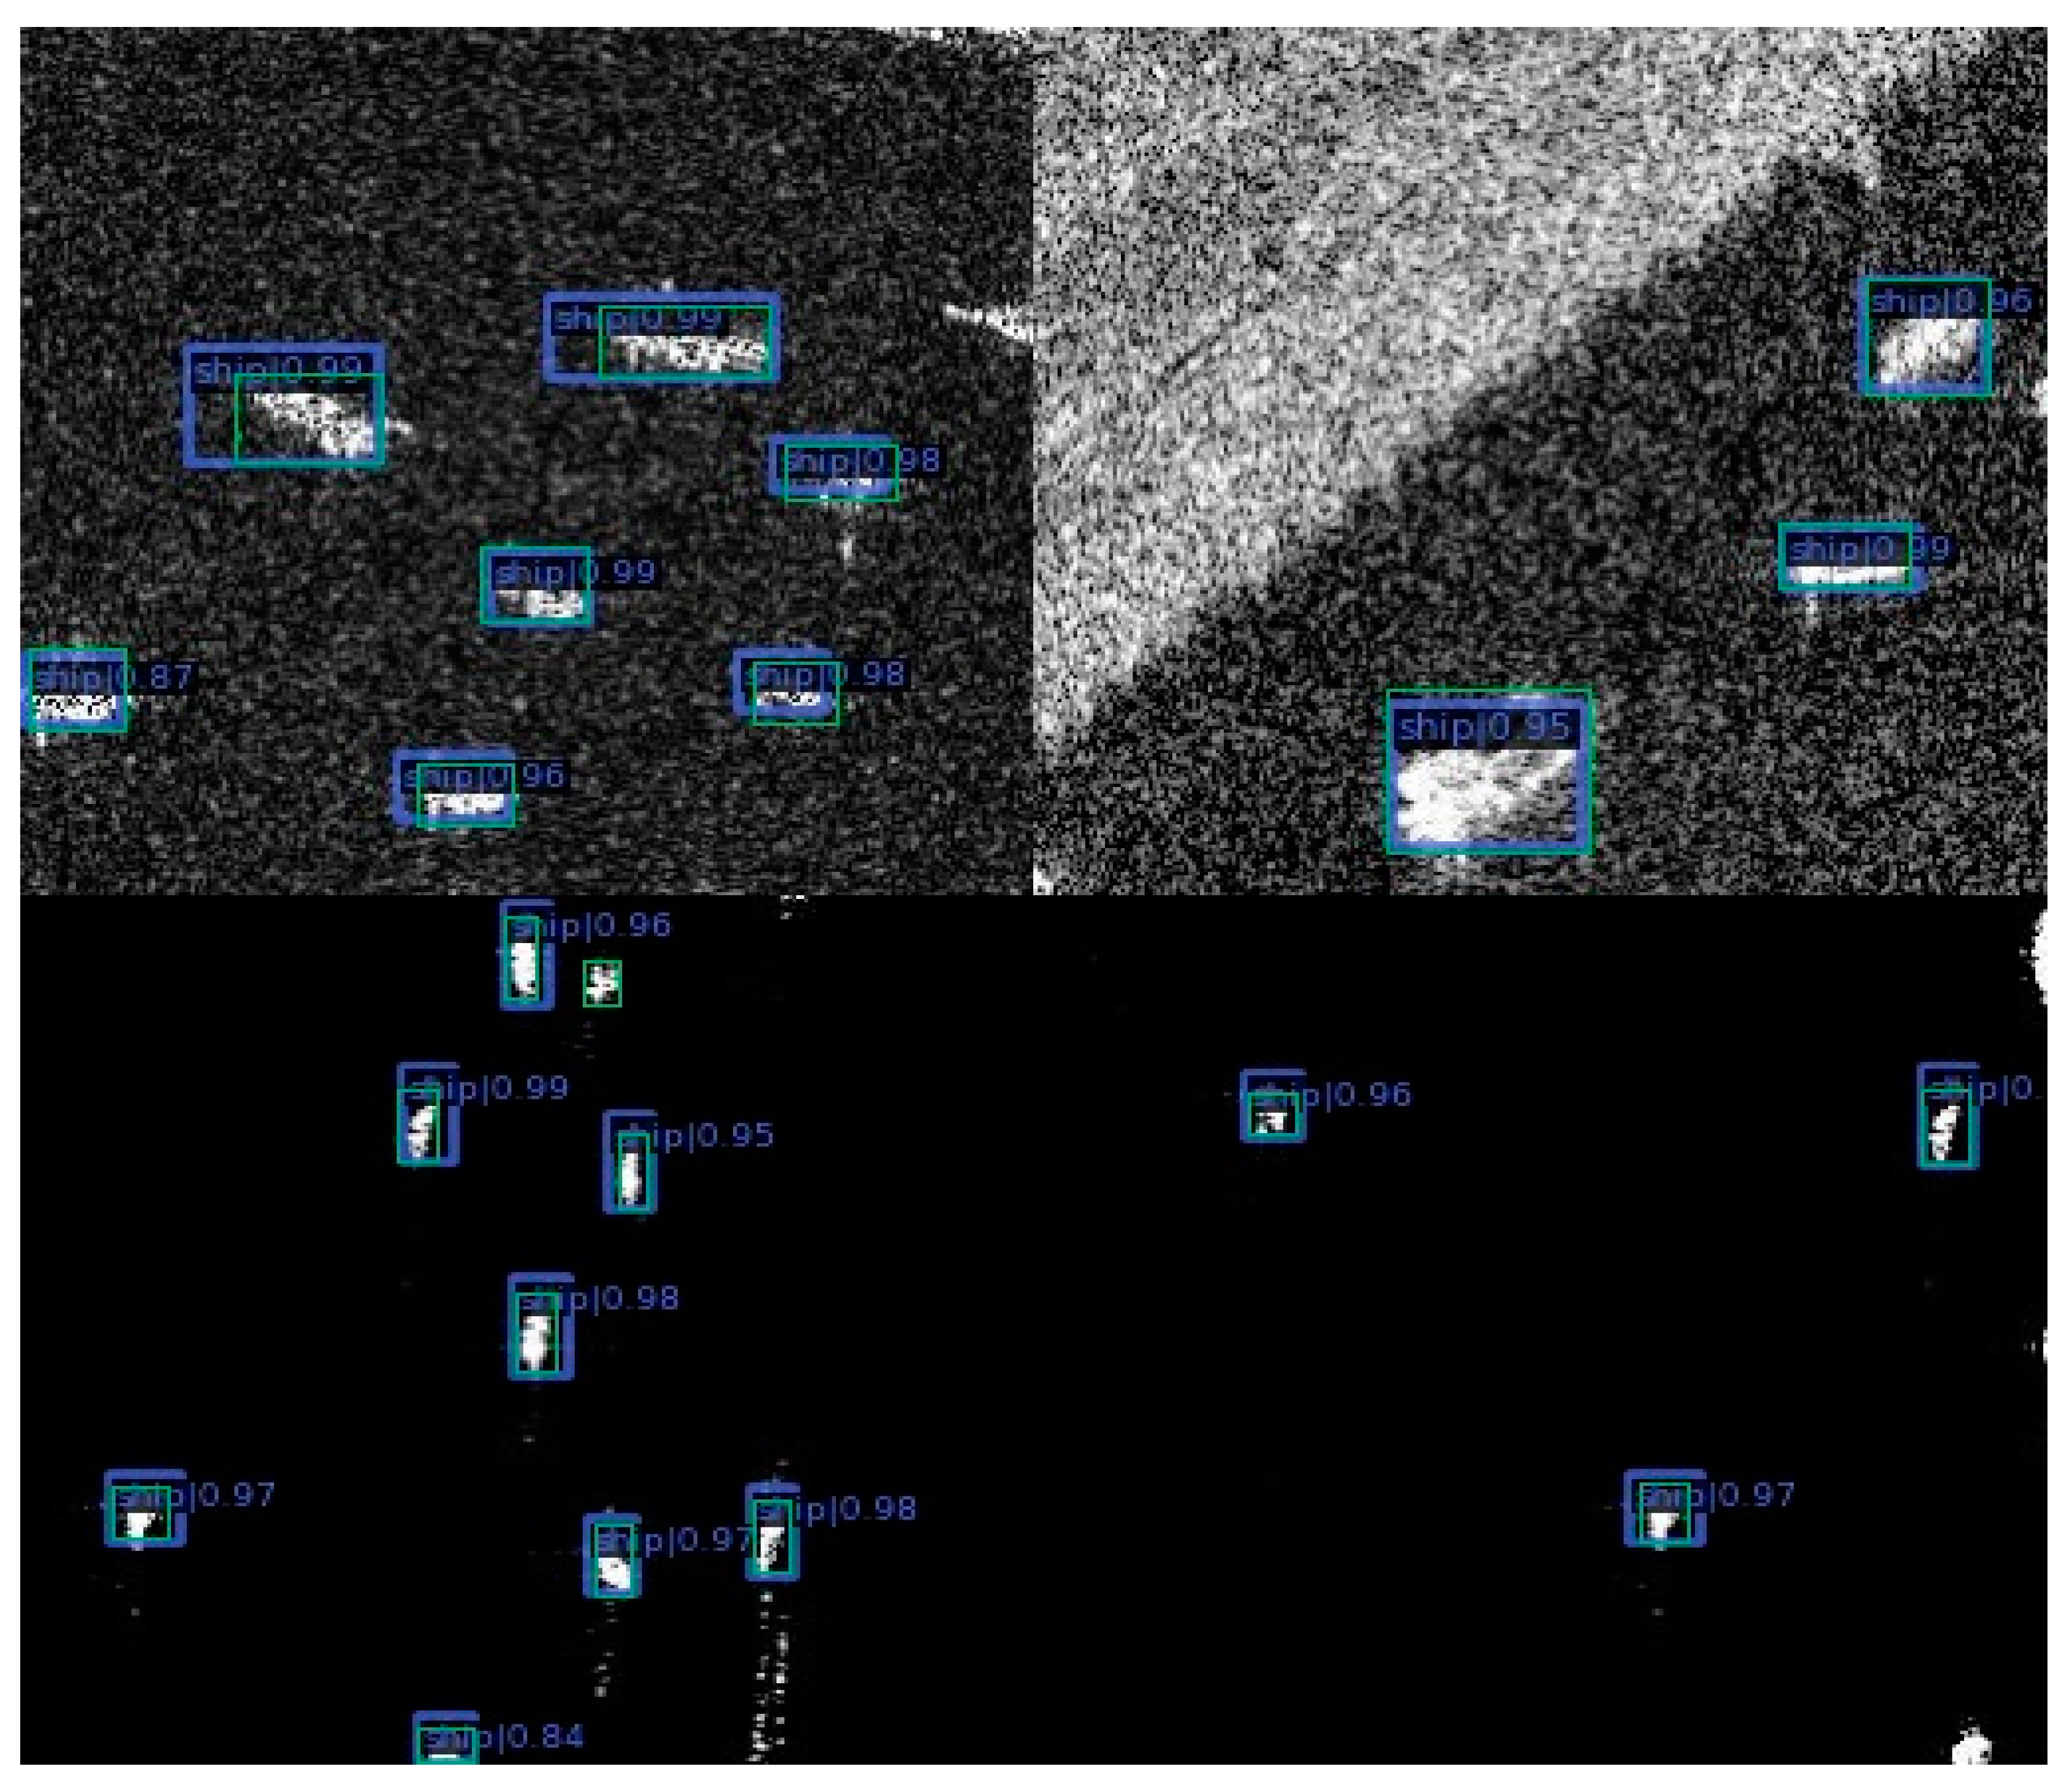
Figure 13.
The detection results on SAR-Ship-Dataset (the ground truth boxes are shown with green color).
From the results, we found that the proposed method can not only handle small ships but can also handle medium and large ships. That is to say, it can detect ships of various sizes. Additionally, the proposed method is also robust, and it can detect ships in noisy images (images with land, as shown in the second image in Figure 10 and Figure 11).
5. Discussion and Future Direction
Small object detection is challenging because they do not contain detailed information and may even disappear in deep neural networks. This condition is even worse in SAR ship detection, as the small target has a huge proportion. Therefore, using small object detection strategies is a good choice for improving overall performance.
Compared to state-of-the-art object detectors, the proposed method obtains an AP of 0.753 and 0.742 on SSDD and the SAR-Ship-Dataset, which is higher than other detectors. The success of the proposed method is mainly due to the improvements on the backbone, neck, IoU and loss function according to the characteristics of the ships in the datasets. The backbone alleviates the problem of feature disappearance for small ships while extracting features. It improved AP by 0.021 and 0.028 on the two datasets. The neck effectively fuses features from different levels. It improved AP by 0.014 and 0.016 on the two datasets. IoU considers the sensitivity of small ships to center points and size. It improved AP by 0.015 and 0.019 on the two datasets. The loss function solves the problem of insufficient supervision information for small ships during training. It improved AP by 0.017 and 0.021 on the two datasets. The advantage of the proposed method can be summarized as follows: From the experimental results, we found that the improvement for small ships is rather large compared to large ships, and due to the huge proportion of small ships in the datasets, the overall performance was improved by these strategies.
To our knowledge, this paper is the first systematic application of small object detection strategies and has achieved good performance.
Although this paper has achieved good performance on small ship detection, there is still significant room for improvement. In the future, the algorithm should be improved in the following areas. The backbone, neck, IoU, label assignment, loss function and data augmentation should continue to be improved according to the characteristics of small ships. It is also necessary to consider combining the above strategies to jointly improve the detection performance of small ships. Furthermore, the large targets should also be considered to further improve the overall performance.
6. Conclusions
SAR ship detection datasets contain a large number of small ships, making small object detection strategies crucial for improving overall performance. This is significant in maritime surveillance and security applications as ships in SAR images are always small compared to targets in computer vision datasets. We put the above idea into practice in this paper. The backbone, neck, IoU and loss function were redesigned according to the characteristics of small ships. The backbone uses S2D to conduct down-sampling with little information loss. It improved AP by 0.021 and 0.028 on the two datasets. The neck fuses features globally and locally, which alleviates the lack of information interaction of cross layers in traditional FPN. It improves AP by 0.014 and 0.016 on the two datasets. The newly designed IoU takes consideration of the area and center distance of the ground truth and predicted bounding boxes. It is more suitable for small targets. It improves AP by 0.015 and 0.019 on the two datasets. The loss function focuses on the localization loss of small targets during the training process, thereby strengthening the supervision signal for them. It improves AP by 0.015 and 0.019 on the two datasets. Through extensive experiments on the datasets SSDD and SAR-Ship-Dataset, it was found that the proposed method improved from 0.686 and 0.658 to 0.753 and 0.742, respectively, compared to YOLOX. Not only has it improved the detection performance for small ships but it has also improved the detection performance for large and medium ships, which proves that the proposed method is effective. It should be noted that excessive attention to small ships can, to some extent, reduce the detection performance for large ones. In practical applications, it is necessary to balance this situation. The experimental results also show that using backbone networks with low information loss is the best way to improve the detection performance of small ships.
From the experimental results we can also observe that although the detection performance of small ships increases, the performance of large ships decreases to some extent. This is because large ships have a small proportion, and they are not trained thoroughly. However, the improvement on small ships can surpass the decrease on large ships. Thus, the overall performance is improved by the proposed method. Therefore, the detection strategies for small ships are a very effective method to improve the overall performance for ships of various sizes. Furthermore, the proposed method is robust and can handle noisy images.
Author Contributions
Conceptualization, J.L. and Z.Y.; methodology, J.C. and L.Y.; investigation, C.C.; writing—original draft preparation, J.L.; writing—review and editing, J.L.; supervision, Z.Y.; funding acquisition, P.C. All authors have read and agreed to the published version of the manuscript.
Funding
This research received no external funding.
Data Availability Statement
The original contributions presented in the study are included in the article, further inquiries can be directed to the corresponding author.
Acknowledgments
The authors would like to thank the editors and anonymous reviewers for their valuable comments that can greatly improve our manuscript.
Conflicts of Interest
The authors declare no conflicts of interest.
References
- Bezerra, D.X.; Lorenzzetti, J.A.; Paes, R.L. Marine Environmental Impact on CFAR Ship Detection as Measured by Wave Age in SAR Images. Remote Sens. 2023, 15, 3441. [Google Scholar] [CrossRef]
- Sun, X.; Wang, Z.; Sun, Y.; Diao, W.; Zhang, Y.; Fu, K. AIR-SARShip-1.0: High-resolution SAR ship detection dataset. J. Radar 2019, 8, 852–863. [Google Scholar]
- Krizhevsky, A.; Sutskever, I.; Hinton, G. ImageNet Classification with Deep Convolutional Neural Networks. Adv. Neural Inf. Process. Syst. 2012, 25. [Google Scholar] [CrossRef]
- Li, J.; Xu, C.; Su, H.; Gao, L.; Wang, T. Deep Learning for SAR Ship Detection: Past, Present and Future. Remote Sens. 2022, 14, 2712. [Google Scholar] [CrossRef]
- Li, J.; Chen, J.; Cheng, P.; Yu, Z.; Yu, L.; Chi, C. A survey on deep-learning-based real-time SAR ship detection. IEEE J. Sel. Top. Appl. Earth Obs. Remote Sens. 2023, 16, 3218–3247. [Google Scholar] [CrossRef]
- Sun, Z.; Dai, M.; Leng, X.; Lei, Y.; Xiong, B.; Ji, K.; Kuang, G. An Anchor-Free Detection Method for Ship Targets in High-Resolution SAR Images. IEEE J. Sel. Top. Appl. Earth Obs. Remote Sens. 2021, 14, 7799–7816. [Google Scholar] [CrossRef]
- Kaur, R.; Singh, S. A comprehensive review of object detection with deep learning. Digit. Signal Process. 2023, 132, 103812. [Google Scholar] [CrossRef]
- Liu, W.; Anguelov, D.; Erhan, D.; Szegedy, C.; Reed, S.; Fu, C.Y.; Berg, A.C. SSD: Single shot MultiBox detector. In Computer Vision—ECCV 2016; Springer International Publishing: Cham, Switzerland, 2016; pp. 21–37. [Google Scholar] [CrossRef]
- Diwan, T.; Anirudh, G.; Tembhurne, J.V. Object detection using YOLO: Challenges, architectural successors, datasets and applications. Multimed. Tools Appl. 2023, 82, 9243–9275. [Google Scholar] [CrossRef] [PubMed]
- Yu, D.; Guo, H.; Zhao, C.; Liu, X.; Xu, Q.; Lin, Y.; Ding, L. An anchor-free and angle-free detector for oriented object detection using bounding box projection. IEEE Trans. Geosci. Remote. Sens. 2023, 61, 84–90. [Google Scholar] [CrossRef]
- Gao, F.; Cai, Y.; Deng, F.; Yu, C.; Chen, J. Feature Alignment in Anchor-Free Object Detection. IEEE Trans. Circuits Syst. Video Technol. 2023, 33, 3799–3810. [Google Scholar] [CrossRef]
- Li, Z.; Hou, B.; Wu, Z.; Ren, B.; Yang, C. FCOSR: A simple anchor-free rotated detector for aerial object detection. Remote Sens. 2023, 15, 5499. [Google Scholar] [CrossRef]
- Zhang, Y.; Zhang, H.; Huang, Q.; Han, Y.; Zhao, M. DsP-YOLO: An anchor-free network with DsPAN for small object detection of multiscale defects. Expert Syst. Appl. 2024, 241, 122669. [Google Scholar] [CrossRef]
- He, K.; Gkioxari, G.; Dollár, P.; Girshick, R. Mask R-CNN. IEEE Trans. Pattern Anal. Mach. Intell. 2020, 42, 386–397. [Google Scholar] [CrossRef]
- Li, J.; Qu, C.; Shao, J. Ship detection in SAR images based on an improved faster R-CNN. In Proceedings of the Sar in Big Data Era: Models, Methods & Applications, Beijing, China, 13–14 November 2017. [Google Scholar] [CrossRef]
- Wang, Y.; Wang, C.; Zhang, H.; Dong, Y.; Wei, S. A SAR Dataset of Ship Detection for Deep Learning under Complex Backgrounds. Remote Sens. 2019, 11, 765. [Google Scholar] [CrossRef]
- Wang, G.; Chen, Y.; An, P.; Hong, H.; Hu, J.; Huang, T. UAV-YOLOv8: A small-object-detection model based on improved YOLOv8 for UAV aerial photography scenarios. Sensors 2023, 23, 7190. [Google Scholar] [CrossRef]
- Tong, K.; Wu, Y. Deep learning-based detection from the perspective of small or tiny objects: A survey. Image Vis. Comput. 2022, 123, 104471. [Google Scholar] [CrossRef]
- Ji, S.-J.; Ling, Q.-H.; Han, F. An improved algorithm for small object detection based on YOLO v4 and multi-scale contextual information. Comput. Electr. Eng. 2023, 105, 108490. [Google Scholar] [CrossRef]
- Cheng, G.; Yuan, X.; Yao, X.; Yan, K.; Zeng, Q.; Xie, X.; Han, J. Towards Large-Scale Small Object Detection: Survey and Benchmarks. IEEE Trans. Pattern Anal. Mach. Intell. 2022, 45, 13467–13488. [Google Scholar] [CrossRef]
- Ge, Z.; Liu, S.; Wang, F.; Li, Z.; Sun, J. YOLOX: Exceeding YOLO Series in 2021. CoRR 2021, abs/2107.08430. [Google Scholar]
- Han, L.; Ye, W.; Li, J.; Ran, D. Small ship detection in SAR images based on modified SSD. In Proceedings of the 2019 IEEE International Conference on Signal, Information and Data Processing (ICSIDP), Chongqing, China, 11–13 December 2019. [Google Scholar] [CrossRef]
- Jin, K.; Chen, Y.; Xu, B.; Yin, J.; Wang, X.; Yang, J. A Patch-to-Pixel Convolutional Neural Network for Small Ship Detection With PolSAR Images. IEEE Trans. Geosci. Remote Sens. 2020, 58, 6623–6638. [Google Scholar] [CrossRef]
- Gui, Y.; Li, X.; Xue, L.; Lv, J. A scale transfer convolution network for small ship detection in SAR images. In Proceedings of the 2019 IEEE 8th Joint International Information Technology and Artificial Intelligence Conference (ITAIC), Chongqing, China, 24–26 May 2019. [Google Scholar] [CrossRef]
- Zhang, T.; Zhang, X.; Ke, X.; Zhan, X.; Shi, J.; Wei, S.; Pan, D.; Li, J.; Su, H.; Zhou, Y.; et al. LS-SSDD-v1.0: A Deep Learning Dataset Dedicated to Small Ship Detection from Large-Scale Sentinel-1 SAR Images. Remote Sens. 2020, 12, 2997. [Google Scholar] [CrossRef]
- Wang, J.; Lin, Y.; Guo, J.; Zhuang, L. SSS-YOLO: Towards more accurate detection for small ships in SAR image. Remote Sens. Lett. 2020, 12, 93–102. [Google Scholar] [CrossRef]
- Chen, P.; Chen, P.; Li, Y.; Li, Y.; Zhou, H.; Zhou, H.; Liu, B.; Liu, B.; Liu, P.; Liu, P. Detection of Small Ship Objects Using Anchor Boxes Cluster and Feature Pyramid Network Model for SAR Imagery. J. Mar. Sci. Eng. 2020, 8, 112. [Google Scholar] [CrossRef]
- Zhao, J.; Guo, W.; Zhang, Z.; Yu, W. A coupled convolutional neural network for small and densely clustered ship detection in SAR images. Sci. China Inf. Sci. 2019, 62, 42301. [Google Scholar] [CrossRef]
- Sunkara, R.; Luo, T. No More Strided Convolutions or Pooling: A New CNN Building Block for Low-Resolution Images and Small Objects. In Machine Learning and Knowledge Discovery in Databases. ECML PKDD 2022. Lecture Notes in Computer Science; Springer: Cham, Switzerland, 2023; Volume 13715. [Google Scholar] [CrossRef]
- Ioffe, S.; Szegedy, C. Batch normalization: Accelerating deep network training by reducing internal covariate shift. In Proceedings of the International Conference on Machine Learning, Lille, France, 6–11 July 2015. [Google Scholar]
- Maas, A.L.; Hannun, A.Y.; Ng, A.Y. Rectifier nonlinearities improve neural network acoustic models. Proc. Icml. 2013, 30, 3. [Google Scholar]
- He, K.; Zhang, X.; Ren, S.; Sun, J. Deep residual learning for image recognition. In Proceedings of the IEEE Conference on Computer Vision and Pattern Recognition, Las Vegas, NV, USA, 27–30 June 2016. [Google Scholar]
- He, K.; Zhang, X.; Ren, S.; Sun, J. Spatial pyramid pooling in deep convolutional networks for visual recognition. IEEE Trans. Pattern Anal. Mach. Intell. 2015, 37, 1904–1916. [Google Scholar] [CrossRef]
- Lin, T.Y.; Dollár, P.; Girshick, R.; He, K.; Hariharan, B.; Belongie, S. Feature pyramid networks for object detection. In Proceedings of the IEEE Conference on Computer Vision and Pattern Recognition, Honolulu, HI, USA, 21–26 July 2017. [Google Scholar]
- Li, Y.; Huang, Q.; Pei, X.; Chen, Y.; Jiao, L.; Shang, R. Cross-layer attention network for small object detection in remote sensing imagery. IEEE J. Select. Top. Appl. Earth Observ. Remote Sens. 2021, 14, 2148–2161. [Google Scholar] [CrossRef]
- Wang, C.; He, W.; Nie, Y.; Guo, J.; Liu, C.; Han, K.; Wang, Y. Gold-YOLO: Efficient Object Detector via Gather-and-Distribute Mechanism. CoRR 2023, abs/2309.11331. [Google Scholar]
- Tong, Z.; Chen, Y.; Xu, Z.; Yu, R. Wise-IoU: Bounding box regression loss with dynamic focusing mechanism. arXiv 2023, arXiv:2301.10051. [Google Scholar]
- Zhang, S.; Li, C.; Jia, Z.; Liu, L.; Zhang, Z.; Wang, L. Diag-IoU loss for object detection. IEEE Trans. Circuits Syst. Video Technol. 2023, 33, 7671–7683. [Google Scholar] [CrossRef]
- Jeune, P.L.; Mokraoui, A. Rethinking intersection over union for small object detection in few-shot regime. arXiv 2023, arXiv:2307.09562. [Google Scholar]
- Neubeck, A.; Van Gool, L. Efficient non-maximum suppression. In Proceedings of the 18th International Conference on Pattern Recognition (ICPR’06), Hong Kong, China, 20–24 August 2006; Volume 3. [Google Scholar]
- Liu, G.; Han, J.; Rong, W. Feedback-driven loss function for small object detection. Image Vis. Comput. 2021, 111, 104197. [Google Scholar] [CrossRef]
- Everingham, M.; Eslami, S.; Gool, L.V.; Williams, C.; Winn, J.; Zisserman, A. The pascal visual object classes challenge: A retrospective. Int. J. Comput. Vis. 2015, 111, 98–136. [Google Scholar] [CrossRef]


Disclaimer/Publisher’s Note: The statements, opinions and data contained in all publications are solely those of the individual author(s) and contributor(s) and not of MDPI and/or the editor(s). MDPI and/or the editor(s) disclaim responsibility for any injury to people or property resulting from any ideas, methods, instructions or products referred to in the content. |
© 2024 by the authors. Licensee MDPI, Basel, Switzerland. This article is an open access article distributed under the terms and conditions of the Creative Commons Attribution (CC BY) license (https://creativecommons.org/licenses/by/4.0/).