Article

Identifying Rare Earth Elements Using a Tripod and Drone-Mounted Hyperspectral Camera: A Case Study of the Mountain Pass Birthday Stock and Sulphide Queen Mine Pit, California

1
Department of Earth and Atmospheric Sciences, University of Houston, Houston, TX 77204, USA
2
MP Materials, Las Vegas, NV 89135, USA
3
Cobb, Fendley & Associates, Inc., Houston, TX 77040, USA
*
Author to whom correspondence should be addressed.
Remote Sens. 2024, 16(17), 3353; https://doi.org/10.3390/rs16173353 (registering DOI)
Submission received: 22 July 2024 / Revised: 5 September 2024 / Accepted: 6 September 2024 / Published: 9 September 2024
(This article belongs to the Special Issue Deep Learning for Spectral-Spatial Hyperspectral Image Classification)

Abstract

:
As the 21st century advances, the demand for rare earth elements (REEs) is rising, necessitating more robust exploration methods. Our research group is using hyperspectral remote sensing as a tool for mapping REEs. Unique spectral features of bastnaesite mineral, has proven effective for detection of REE with both spaceborne and airborne data. In our study, we collected hyperspectral data using a Senop hyperspectral camera in field and a SPECIM hyperspectral camera in the laboratory settings. Data gathered from California’s Mountain Pass district revealed bastnaesite-rich zones and provided detailed insights into bastnaesite distribution within rocks. Further analysis identified specific bastnaesite-rich rock grains. Our results indicated higher concentrations of bastnaesite in carbonatite rocks compared to alkaline igneous rocks. Additionally, rocks from the Sulphide Queen mine showed richer bastnaesite concentrations than those from the Birthday shonkinite stock. Results were validated with thin-section studies and geochemical data, confirming the reliability across different hyperspectral data modalities. This study demonstrates the potential of drone-based hyperspectral technology in augmenting conventional mineral mapping methods and aiding the mining industry in making informed decisions about mining REEs efficiently and effectively.

1. Introduction

Rare earth elements (REEs) are metallic elements that have unique physical and chemical properties. They are not only essential but also critical to our survival, success, and growth in the 21st century as they are used in many high-tech devices, automotive, aerospace, wind power, and IT technologies of the future [1,2,3,4,5,6]. REEs such as Neodymium (Nd), Praseodymium (Pr), and Dysprosium (Dy) are used to make powerful permanent magnets. These magnets are used in green energy of the future, such as drones, magnetic levitation trains, electric vehicles, energy-efficient computers, wind turbines, etc. [7,8]. They are also crucial for national defense in electronic displays, guidance systems, lasers, and radar and sonar systems [9,10]. REEs such as Nd, Europium (Eu), and Terbium (Tb) are components of smartphones and computers. Some REEs, such as Cerium (Ce), Lanthanum (La), and Yttrium (Y), are also used to make electronic components, such as capacitors, resistors, transistors, and LEDs [11].
Because of their importance in many applications, the demand for REEs is increasing over time [6,12,13]. China dominates the global supply and demand of REEs since the most significant reserves of REEs are in China, which accounts for more than 90% of the world’s production [12,14]. The United States Geological Survey (USGS) has reported several REE deposits in the United States: The Bear Lodge district in Wyoming, The Bokan Mountain complex in Alaska, The Iron Hill deposit in Colorado, The Lemhi Pass district in Idaho and Montana, and the Pea Ridge deposit in Missouri. However, not all these deposits have been economically developed or mined, as they face various challenges, such as low concentrations, complex mineralogy, and environmental impacts. Therefore, the United States still relies heavily on imported REEs from other countries, especially China. The largest and most famous REE mine in the U.S. is the Sulphide Queen mine in the Mountain Pass district, California, which reopened in 2017 after being closed for several years due to several reasons [15,16,17,18]. Because of the strategic value and limited supply of REEs, the USGS categorized them as one of the critical minerals in 2018. Other countries, including the US, are trying to diversify their sources and reduce their reliance on China. Relying exclusively on a single source for REEs can lead to market instability and supply chain disruptions, creating a critical vulnerability for industries that underpin the economic prosperity of countries with low REE production.
REEs are named “Rare” not because they are rare in abundance in the Earth’s crust. They are tricky and expensive to separate from natural sources [19]. In other words, their deposits of economic value are rare and require critical conditions for the enrichment of REEs. There are some significant challenges in mining REEs as they are often found in low concentrations and mixed with other elements, making them difficult and costly to extract and separate. REE mining produces large amounts of toxic waste, which can contaminate the soil, water, and air [20,21,22] harming the health and livelihoods of local communities and wildlife. However, there are also opportunities for innovation and improvement. For example, some researchers are exploring alternative methods of REE exploration and extraction from the host rock, such as bioleaching, solvent extraction, and ion exchange, that could reduce the environmental impact and increase the efficiency of REE mining [23,24,25].
Remote sensing is a powerful and efficient technique that uses sensors to measure the electromagnetic radiation reflected or emitted by objects on the Earth’s surface and is widely used to study various natural phenomena [26,27,28,29,30,31]. In the mining industry, remote sensing provides accurate, timely, and comprehensive data that can support the planning, management, and evaluation of mining activities, as well as the mitigation of environmental and social impacts [32,33,34,35,36]. Remote sensing can detect REEs by analyzing their spectral signatures, which are the characteristic patterns of light absorption and emission at different wavelengths in the Visible Near InfraRed (VNIR) part of the electromagnetic spectrum. For instance, Nd has distinctive spectral features at ~560 nm, ~745 nm, ~800 nm, and ~966 nm [37,38] (Figure 1). However, remote sensing of REEs faces some challenges, such as low concentrations, complex mineralogy, and interference from other elements. Therefore, remote sensing of REEs requires high-resolution hyperspectral sensors, advanced data processing methods, and ground truth validation. It has been established that REEs as low as 300 ppm [38] or 1000 ppm [39] is sufficient to produce the diagnostic absorption features in the spectral profile.
In remote sensing studies, researchers develop or utilize pre-existing mathematical equations known as spectral indices to highlight pixels of interest in digital images. Spectral indices are widely applied across various disciplines, including vegetation analysis and agriculture [40,41,42], urbanization [43], geology [44,45], and many other fields [46,47]. Our research group previously designed the BI (Equation (1)), a spectral index that has proven effective in identifying REE-enriched zones at Mountain Pass mine in California when tested on both spaceborne, airborne and laboratory-based hyperspectral data [48,49].
B I = ( P 1 + P 5 2 + P 2 + P 3 + P 4 ) ( T 1 + T 2 + T 3 + T 4 ) ( P 1 + P 5 2 + P 2 + P 3 + P 4 ) + ( T 1 + T 2 + T 3 + T 4 )
Hyperion, one of the spaceborne hyperspectral data utilized in these studies, has a spatial resolution of 30 m, whereas the AVIRIS airborne hyperspectral data offers a finer resolution of approximately 3 m. The BI detected the REE-rich zones in different areas of the Mountain Pass mine. However, given that REE concentrations in potential host rocks are typically measured in parts per million (ppm), it is essential to evaluate the effectiveness of the BI on higher spatial resolution remote sensing data. Additionally, publicly available data often do not cover specific study areas, as data acquisition is contingent upon Data Acquisition Requests (DARs) submitted by the public for some specific areas. With Hyperion now decommissioned, no additional hyperspectral spaceborne data from the sensor will be available. Furthermore, other existing hyperspectral data repositories, accessible to the researchers, may not accurately reflect the current state of rock exposure, particularly in a highly dynamic environment such as an open pit mine.
In this study, we acquired high spatial and spectral resolution hyperspectral data using a Senop hyperspectral camera mounted on a tripod and a drone at two locations in the Mountain Pass district: the Birthday site and the Sulphide Queen mine pit. We also conducted field sampling and geochemical analysis of the rock samples collected from both locations. We processed the hyperspectral data and applied the BI index to delineate the REE-enriched horizons. We validated the BI results with the laboratory-based hyperspectral data, geochemical data, and thin section studies, and observed a high degree of agreement between them. This study had two main objectives: (1) to evaluate the performance of the BI in higher spatial resolution hyperspectral data collected via various platforms and (2) to develop a streamlined workflow for rapid and efficient processing and interpretation of hyperspectral data for REE exploration. This research validates the dependability of the BI index across various hyperspectral data types and showcases how remote sensing can enhance traditional methods of mapping critical minerals. This is particularly valuable in geological settings where space-borne or airborne data are not publicly accessible. Additionally, it highlights the ability of drone-based hyperspectral technology to aid the mining industry in making well-informed decisions.

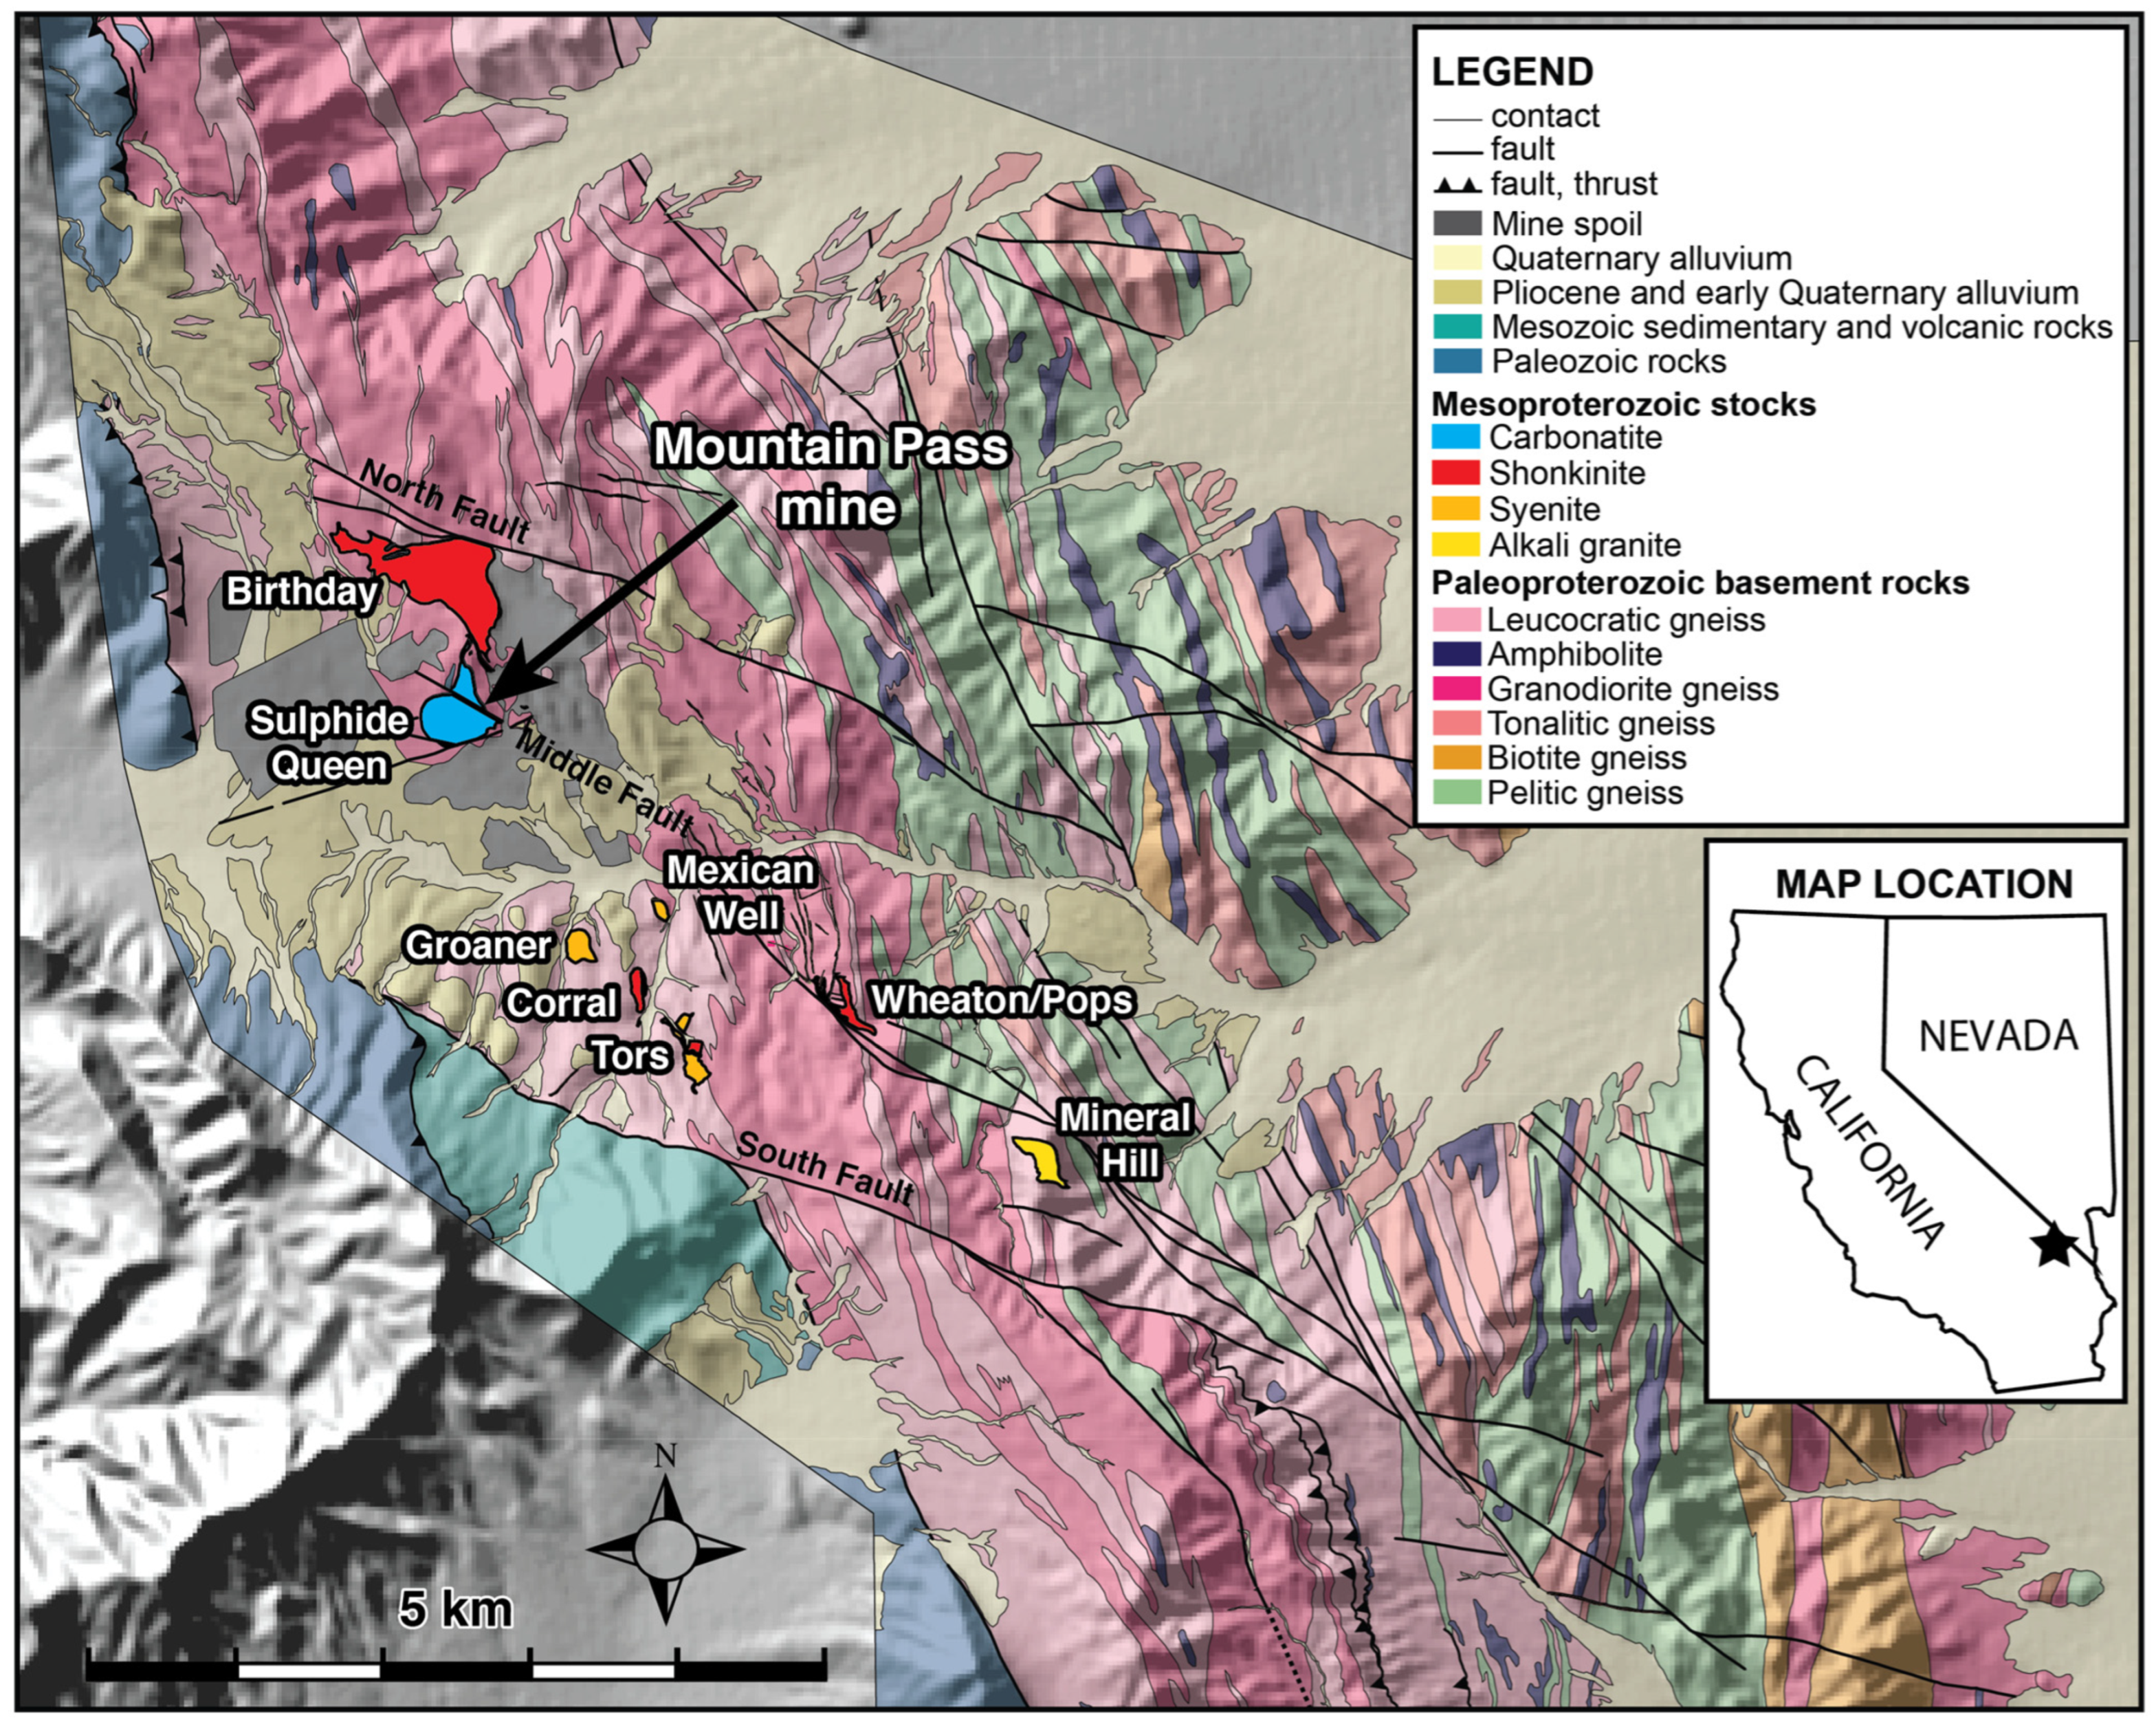
2. Geology of the Study Area

The Mountain Pass district holds the United States’ most valuable deposit of REEs, crucial for economic development [15,18,50]. It is located in the central Mojave Desert of southeastern California, about 75 km SSW of Las Vegas, Nevada, in a topographic low between the Clark Mountain and the Mescal Ranges. Regionally, the district falls within the Mojave crustal province, a region characterized by crystalline basement rock that extends across a large portion of southeastern California, reaching into Nevada, Utah, and Arizona [51,52,53].
From a geological perspective, the Mountain Pass district is composed of Paleoproterozic metamorphic and Mesoproterozoic igneous rocks, bordered to the south and east by the Quaternary alluvial deposits in the Ivanpah Valley (Figure 2) [15,50,54]. On the west, the Clark Mountain normal fault (South Fault) separates the block from sedimentary and volcanic rocks of the Paleozoic and Mesozoic ages. The district has a prominent transverse fault as its boundary in the north. The pre-Cambrian metamorphic complex comprises lithologic units that are intruded by ultra-potassic, mafic to felsic, plutonic silicate rocks of Mesoproterozoic age (ca. 1.4 Ga). These intrusions are part of the Mesoproterozoic Mountain Pass intrusive suite (MPIS) [17,55]. The region features eight large-scale stocks alongside numerous smaller dikes, ranging from less than a meter to several meters wide, composed of shonkinite, syenite, alkali granite, and carbonatite. These dikes vary in width from 0.3 to 10 m and can extend up to a kilometer in length. Shonkinite dominates this suite, followed by syenite and alkali granite (minor). Field observations suggest shonkinite intruded first, followed by syenite and alkali granite, and finally, carbonatite, which crosscuts all other types of alkaline silicate intrusive rocks except for one reported instance where a shonkinite dike intersects a carbonatite vein within the Birthday stock zone [50].
Among eight stocks, the Sulphide Queen stock stands out as a significant carbonatite intrusion. It contains high-grade bastnaesite [56], the most abundant REE mineral in the carbonatites. The orebody is enriched in the LREEs (atomic numbers 57–63), such as La, Ce, and Nd, over HREEs (atomic numbers 64–71). What sets the Sulphide Queen carbonatite apart is its primary igneous origin of bastnaesite, coupled with an intriguing association with ultrapotassic rocks—an atypical occurrence within carbonatites. Many researchers have explored the petrogenesis, mineralogy, geochemistry, and geochronology of this unique geological feature [15,16,18,50,56,57,58]. The Sulphide Queen carbonatite has two groups of carbonatites: (1) ore types, which include calcite carbonatite (bastnaesite-barite-sovite) and dolomite carbonatite (bastnaesite-barite-dolomite) or mixture of them, and (2) other types, which include both calcite and dolomite carbonatites with minerals like parasite and monazite. The ore-type carbonatites are the most economically important, as they contain 5% or more rare earth oxides (REOs) and as much as 25% REO locally. While the orebody has a modest spatial coverage, measuring up to 700 m at its broadest point and reaching a maximum thickness of 150 m, it is of high grade [56].
Since its discovery in the early 1950s, Chevron Mining Inc., Englewood, CO, USA (formerly Molycorp Inc.) has produced REEs from this carbonatite using open-pit mining (Figure 3). During the 1960s to the mid-1990s, the Sulphide Queen mine was the world’s largest source of LREEs. However, production experienced a substantial decline until 1998, ultimately ceasing altogether by 2002 due to environmental and economic factors—chiefly competition from China. The mining operations resumed in 2007 after a five-year hiatus. Starting with only eight employees, MP Material acquired the mine in 2017 with multistage long-term plans to restore the site successfully and sustainably. With the number of employees growing to over 600, MP Materials has turned the mine into an integrated site from mining to processing, producing the mineral concentrate and separating REEs in one location at low cost. As mentioned in the latest press release of the company, MP Materials has produced more than 41,000 metric tons of REE oxides in concentrate, sold more than 36,000 metric tons of REO, and generated a revenue of USD 253.4 million in revenue in 2023. The Sulphide Queen deposit remains the largest REE deposit in the United States [59,60]. It has an estimated resource of 20 to 47 million metric tons of REOs, with an average grade of 8.9% [61].
The Birthday shonkinite stock, situated 800 m north of the Sulphide Queen mine pit, represents the second largest intrusion within the Mountain Pass district (Figure 2). This location is significant as it is the district’s discovery site [57]. The mineral bastnaesite was discovered here in a carbonatite in 1949 (Figure 4). Subsequently, the Sulphide Queen carbonatite stock was found and recognized as a major REE deposit in the 1950s.

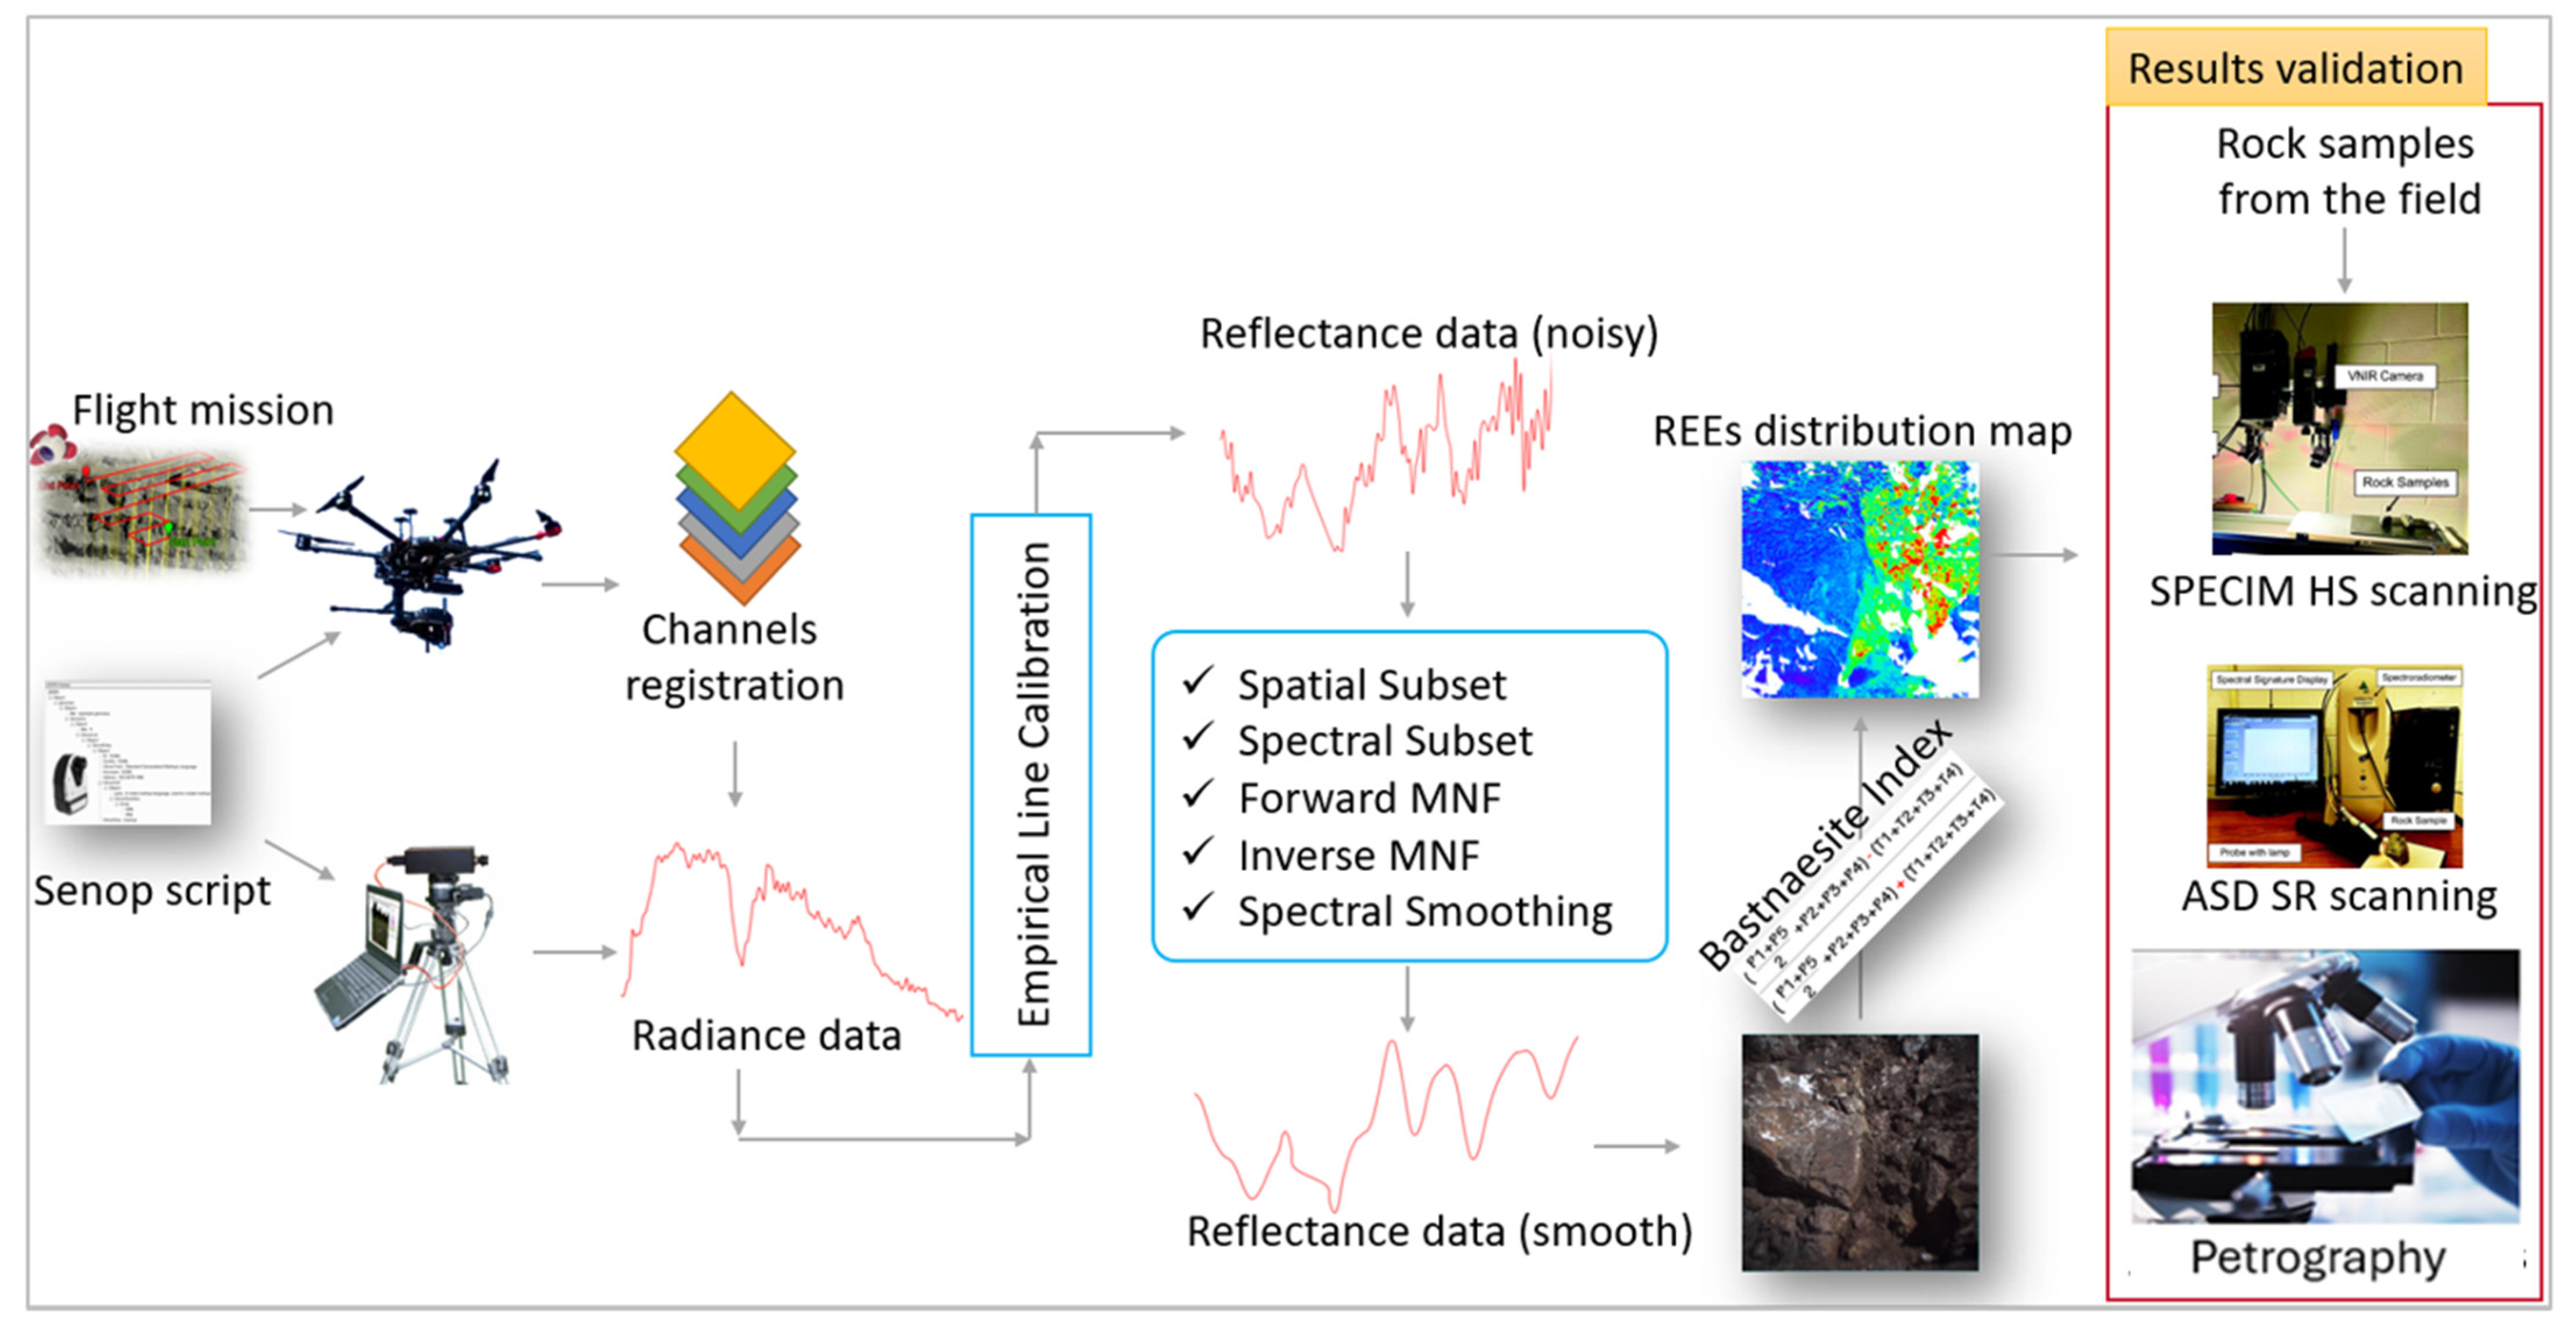
3. Materials and Methods

Figure 5 shows a generalized workflow that we adopted in this study. This research employs two distinct hyperspectral cameras: the HSC-2 VNIR hyperspectral camera (Senop Oy, Finland) [62] deployed in the field using a tripod and a drone, and the VNIR-SWIR SPECIM hyperspectral cameras (SPECtral IMaging Ltd., Oulu, Finland) [63] used in a laboratory setting. The former is a frame-based snapshot camera, while the latter is a pushbroom line scanner. The study incorporates three drones, each equipped with a unique camera and serving a specific purpose (Figure 6).
The DJI M600 Pro [64] carries the Senop HSC-2 camera for hyperspectral data collection. The DJI M300 RTK [65] captures RGB images using the Zenmuse L-1 lidar camera [66]. Using the ArcGIS Drone2Map [67], these images are used to create a single, seamless, georeferenced image known as an orthomosaic that serves as a high-resolution basemap for georeferencing the hyperspectral data. The DJI Mavic 3 Multispectral drone [68] is used for reconnaissance studies of the area and capturing RGB images in the field. Compared to the other drones used, the smaller and more compact size of the Mavic 3 makes it a better choice to launch it swiftly and perform quick reconnaissance studies and RGB photography. Conducting preliminary reconnaissance before data acquisition is crucial, particularly in challenging environments like open pit mines and their surroundings. In such cases, relying solely on basemaps from tools like Google Earth may not accurately represent the actual terrain, making on-site assessment essential for defining accurate study-area boundaries.
Additionally, we collected some rock samples from the Birthday site and the mine pit. We analyzed them in the laboratory using the laboratory-based SPECIM hyperspectral camera and the ASD spectroradiometer [69], in addition to the petrography.

3.1. Materials

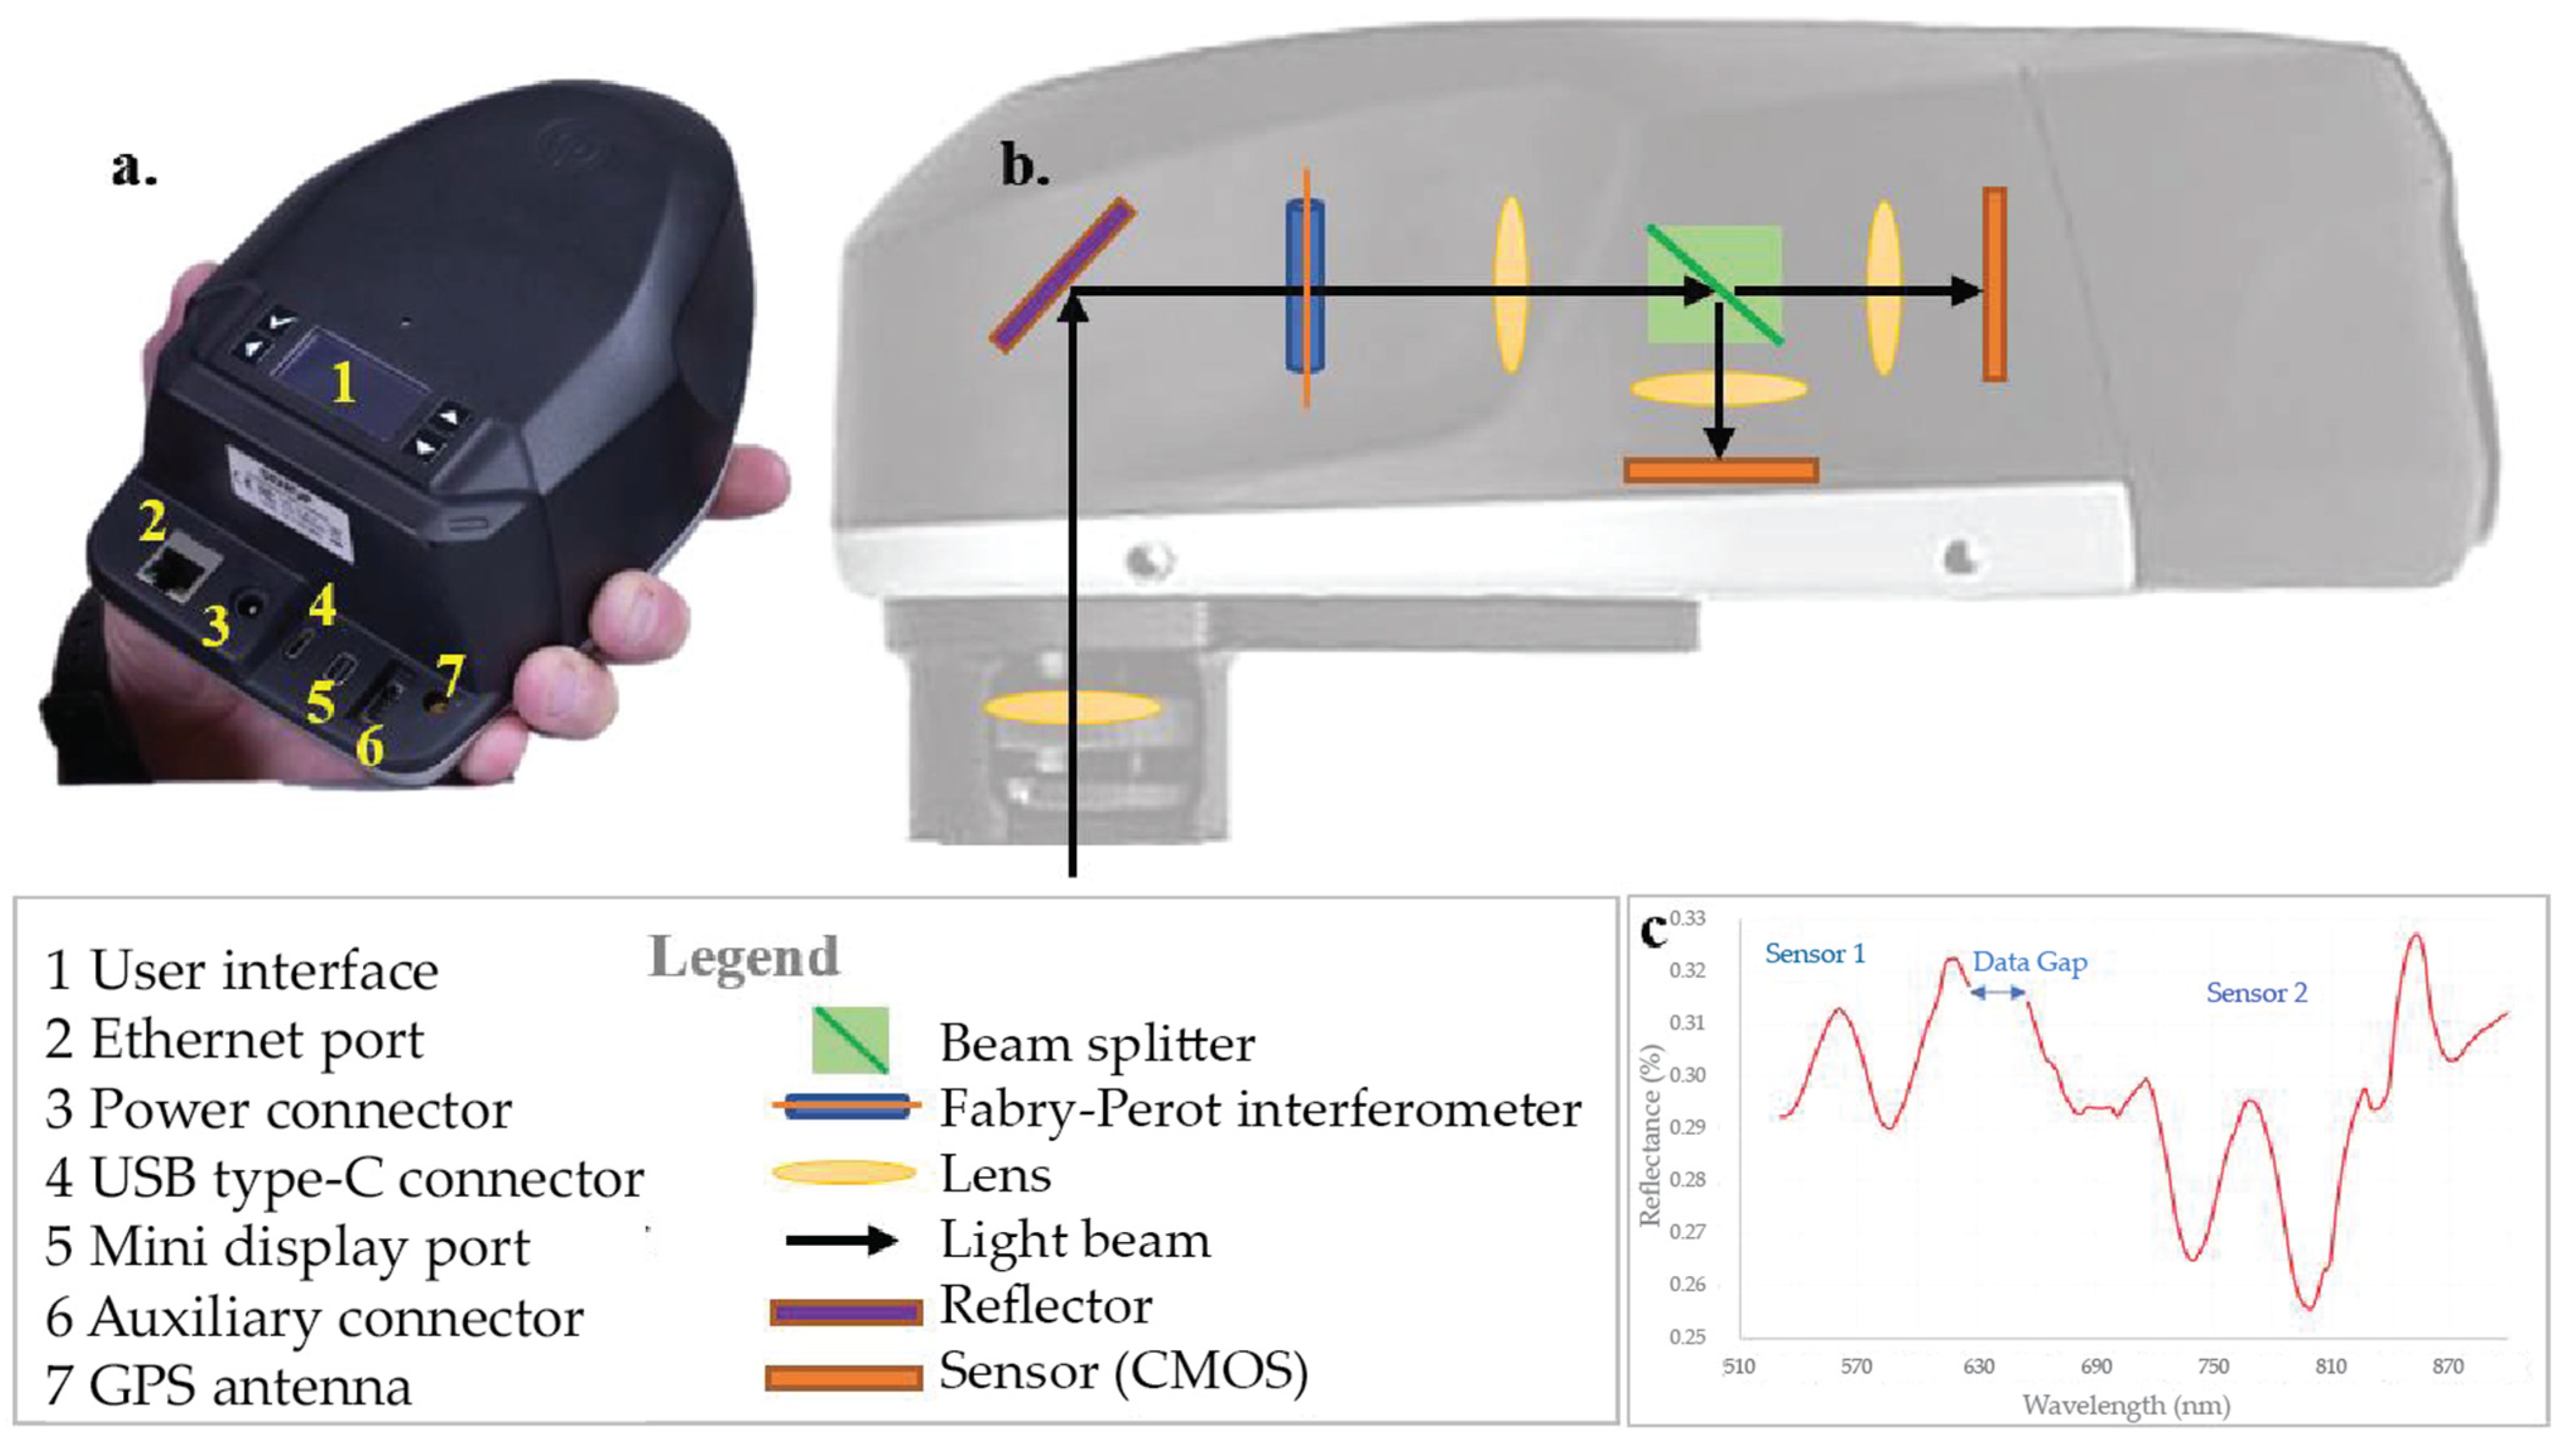
3.1.1. Senop HSC-2 Hyperspectral Camera

The Senop HSC-2 camera is a comparatively low-cost hyperspectral camera (Figure 7a) that operates in the 500–900 nm VNIR spectral range (Senop Oy, Finland) and offers up to one thousand narrow bands. It is a frame-based snapshot recording system with a max recording speed of 149 frames per second. The camera grabs the frames to create a set of spectral bands to generate a hyperspectral cube (HC) with each spectral band in the HC covering a particular wavelength response. The image captured has true pixels with a spatial resolution of 1 megapixel, eliminating the need for interpolation.
The camera has two complementary metal-oxide-semiconductor (CMOS) sensors, each covering a specific spectrum range. One sensor records the visible electromagnetic spectrum ranging from 500 nm to 636 nm, while the other acquires longer VNIR bands ranging from 650 nm to 900 nm. A “gap-area” with invalid data occurs around 636 nm wavelength where the sensors switch [70] (Figure 7b,c). Some additional features of the camera are summarized in Table 1. We utilized an Edmond VNIR lens with a focal length of 50 mm.
The Senop hyperspectral camera operates when a script is triggered directly from the camera’s user interface or the computer using the Senop HSI software (v. 1.1) when the camera is connected. Our script used the Senop HSI software uploaded onto the camera. In the script, the user can select the desired spectral bands, range limits, and spectral resolution of the hyperspectral cubes to be acquired by the sensor.

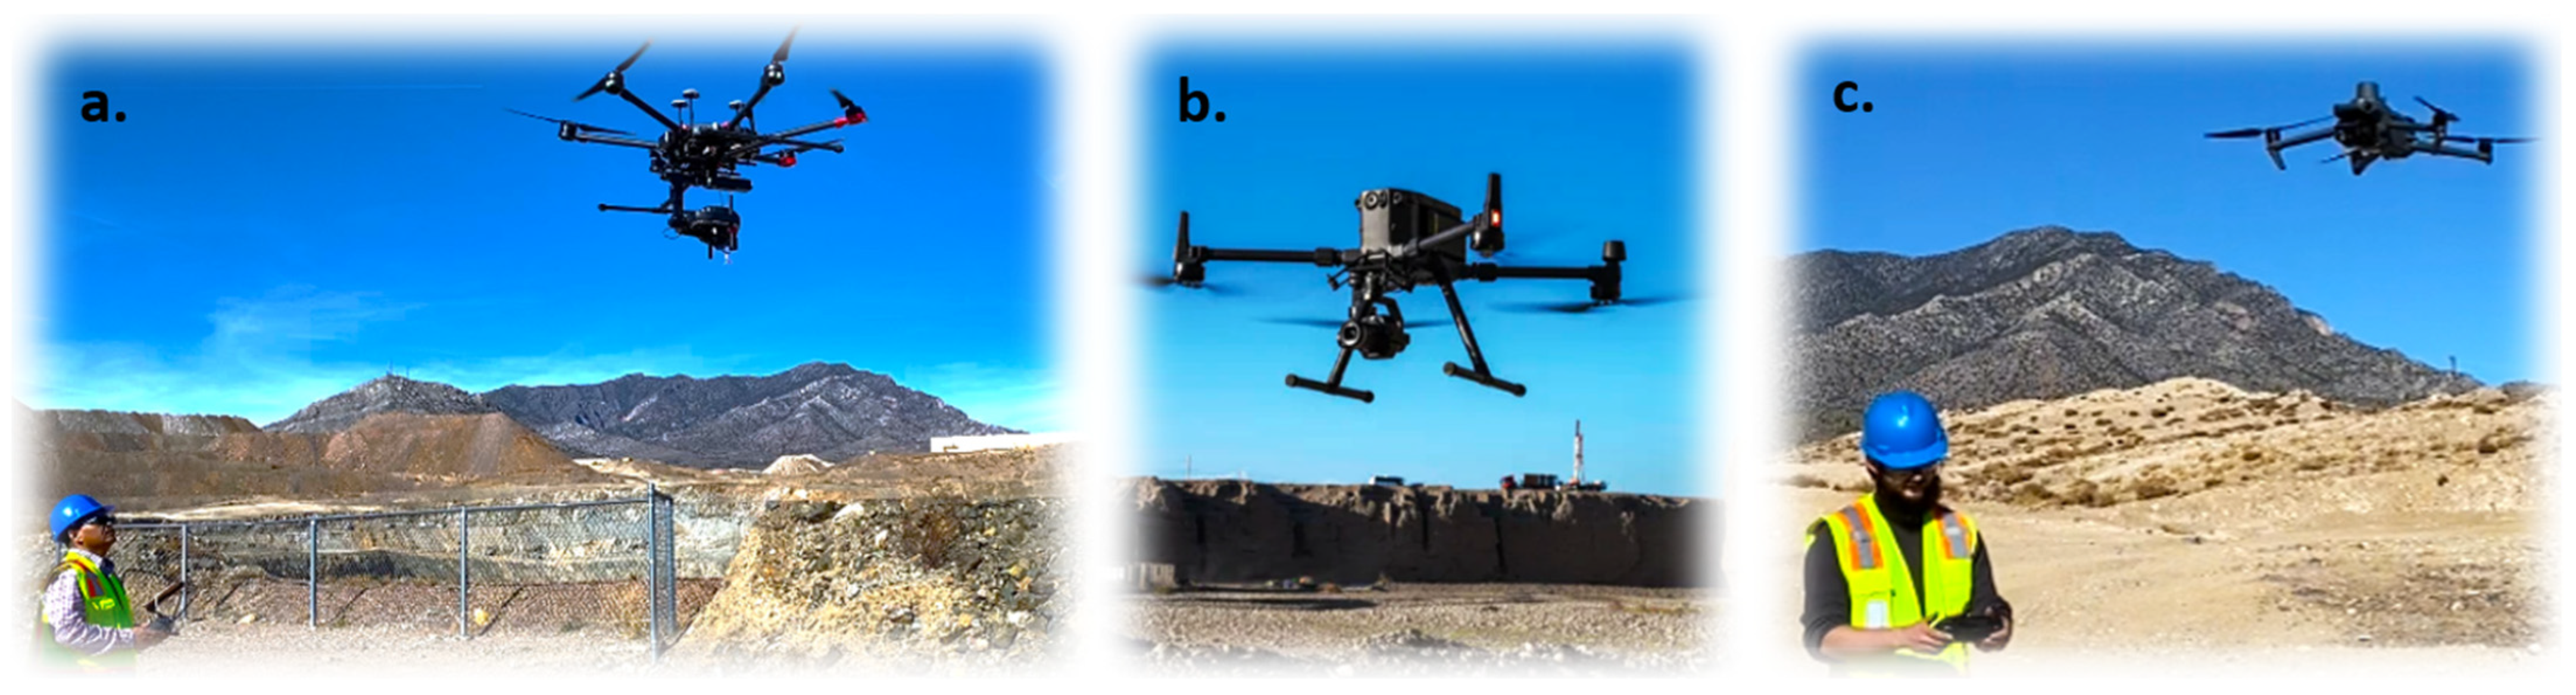
3.1.2. DJI M600 Pro and Litchi App

The DJI Matrice 600 Pro, commonly known as DJI M600 Pro, is a sophisticated drone platform used for professional aerial photography. It includes the A3 Pro flight controller, Light Bridge 2 HD transmission system, Intelligent Batteries, and Battery Management system. Although it has a low wind resistance (28.8 km/h) compared to the DJI M300 RTK (53.9 km/h) and DJI has made many advanced drones, we choose this as a platform for the Senop hyperspectral camera for a few reasons:
  • A variety of Zenmuse cameras and stabilizing gimbals were seamlessly integrated. Instead of designing a customized platform like some researchers did [71], we used a DJI Ronin MX gimbal to mount the Senop HSC-2 camera on the drone. It is easy to install on the drone and connect the camera to the drone. The camera needs proper balancing every time it is removed and reinstalled after being used on the tripod. We used the DJI Assistant app to balance the camera on the gimbal.
  • The drone’s modular design makes it easy to mount additional modules, and it offers full integration with third-party software and hardware. Contrary to the other drones that come with the pre-installed DJI Pilot or DJI Pilot 2 app on the controllers, any app of choice can be used to control the flight missions of the m600 Pro. We used the Litchi app to design and control drone flights for a few reasons that are described later in this section.
  • The M600 Pro has a better load capacity (6.02 kg) than the m300 RTK (2.70 kg), so with a camera of 1 kg and the Ronin mx gimbal of 2.2 kg, there is still capacity for an additional third-party camera for live streaming.
We used the Litchi drone flight application for this study. It allows for efficient mission management via its Mission Hub website on multiple platforms, such as desktop, laptop, or tablet. After designing the flight mission for the Mountain Pass mine pit on the Mission Hub website, we accessed it in the Litchi app using an iPad during the drone flight. We collected hyperspectral data of the Birthday shonkinite outcrop and the Sulphide Queen mine pit using the same Senop HSC-2 camera but with different platforms. Therefore, we will present them separately, as they require different data acquisition and processing methods. We used a tripod-mounted system for the Birthday shonkinite outcrop as the outcrop was small and steep. For the mine pit, we used the drone-mounted system as the pit was large and had shallower slopes.

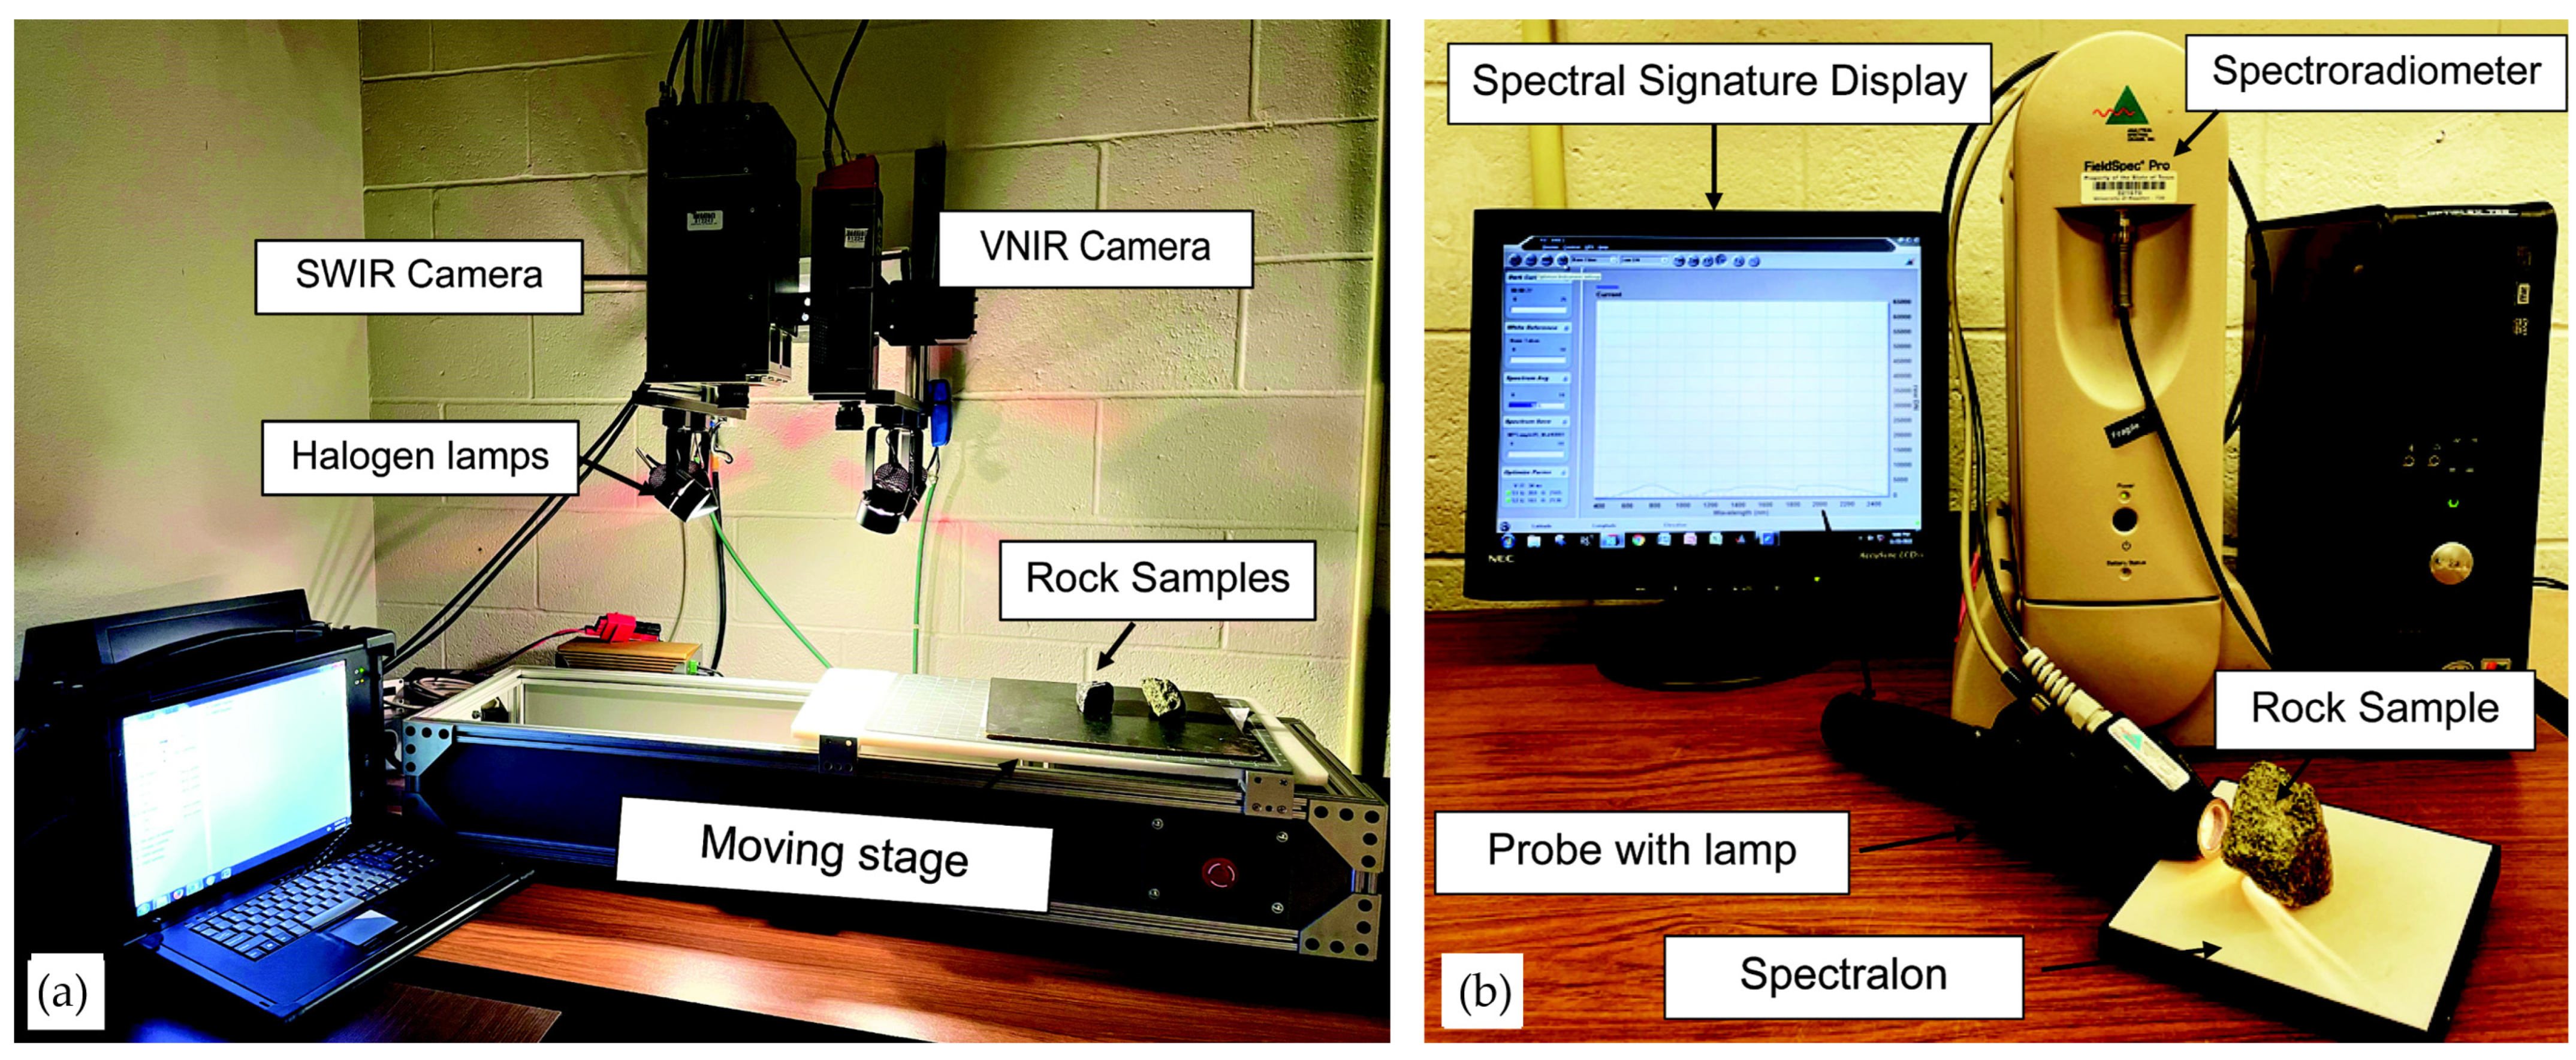
3.1.3. Laboratory Based Analysis

Rock samples were imaged in a laboratory setting using SPECIM VNIR and SWIR hyperspectral cameras (Figure 8a), capturing spectral signatures between 400 and 2500 nm. The VNIR camera, equipped with a lens having a 28.9° field of view (FOV) and a 0.3 mm pixel size, was used alongside the SWIR camera, which utilized a wide-angle lens (OLES 22.5, 24° FOV, 0.4 mm pixel size). The cameras were mounted on a stand, while samples were placed on a movable stage to scan them in the along-track direction at a constant speed. The distance between the samples and the cameras’ lens is about 1.5 feet. Illumination was provided by four 50-watt halogen bulbs. To mitigate background noise, dark current images were captured by covering the lenses. A Spectralon white reference panel was positioned next to the samples on the stage for calibration.
The SPECIM hyperspectral analysis was validated using the ASD FieldSpec Pro FR spectroradiometer (Malvern Panalytical, Malvern, UK) (Figure 8b). In a controlled laboratory setting, this instrument captures the unique spectral behavior of rocks within the VNIR and SWIR regions of the electromagnetic spectrum, ranging from 0.35 to 2.5 μm, with a sampling interval of 2 to 3 μm. Following calibration with Spectralon, a high-intensity contact probe equipped with a halogen bulb was placed on the flat surface of each sample. This probe’s light detectors recorded the reflected light, producing unique spectral signatures. Spectral signatures were obtained for each rock sample at a minimum of two points: areas of high REE concentration and areas of low REE concentration. These areas were assessed from the results of the SPECIM hyperspectral images. For some samples, additional signatures were collected from areas of moderate REE concentration. The depths of absorption features in the ASD spectral profiles extracted from these areas were used to validate the results of the SPECIM hyperspectral data and ultimately the results of the hyperspectral data acquired in the field using the Senop camera.
Thin sections of the rock samples were prepared to ensure that the same part of the rock used in the SPECIM hyperspectral scanning and ASD spectroradiometer analysis was preserved. These thin sections enabled us to further corroborate the remote sensing data results of both SPECIM and Senop hyperspectral cameras.

3.2. Methods

3.2.1. Tripod-Based Hyperspectral Data

For the Birthday shonkinite outcrop, we mounted the Senop HSC-2 camera on a tripod about 30 m away and recorded seven overlapping images. We also placed a white Lambertian target with 75% reflectance and a black target with a 10% reflectance on the outcrop. To calibrate the Senop HSC-2 camera and measure the dark current of the Senop Hyperspectral sensor, we covered the lens and replayed the script after collecting seven images of the outcrop and removed the noise from the original images. The data acquisition time with five HCs of different exposure times was 35 s. The data collection procedure took half an hour, including setting up the camera, adjusting the focus and exposure, taking seven images with five HCs each, and dismantling the setup.
We processed the seven hyperspectral images individually. The initial step involved the execution of image dark current subtraction in ENvironment for Visualizing Images (ENVI) [72], which eliminated the camera’s background noise. Subsequently, a spectral subset was performed to discard fifteen frames that exhibited extremely low or abnormally high DN values. To convert DN values to reflectance, we utilized the Empirical Line Calibration (ELC) tool provided by ENVI. The Regions of Interest (ROIs) extracted from the white and dark target panels were used in the ELC reflectance retrieval. We implemented the MNF and Inverse MNF tools and the THOR Spectral Smoothing tools to remove the noise from the reflectance data. Following this, we applied the BI to generate a distribution map of the bastnaesite mineral. To eliminate the erroneous results of darker pixels representing shadows, we created a mask and excised those pixels on the BI map. In the final step, we applied a rainbow color table to the BI map and assigned an appropriate stretch to accentuate areas with higher bastnaesite concentrations.

3.2.2. Drone-Based Hyperspectral Data

When mounted on a drone, we designed a different script for the Senop camera using the same wavelength range of 512 nm to 900 nm but with a larger spectral gap of 3 nm. Thus, one HC consisted of 130 frames. Although the recording time for a single HC was only a few seconds, a drone is never as stable a platform as a tripod for the cameras. The drone’s instability caused pixel displacement and spectral distortion in most of the stacked frames in an HC. To mitigate this issue, we recorded the frames individually in the script and later used Python’s automated frame registration process to align them. In the Python script, we used pystackreg which is an open-source Python library. We used “for loop” in the script to automate the registration process of all the frames in an HC. In addition, the drone-mounted Senop HSC-2 script recorded only one HC with the optimal exposure time, unlike the tripod-mounted Senop HSC 2 camera script, which records five HCs. The Senop HSC-2 camera was inefficient for sequences with more than one HC. Therefore, finding the optimal exposure time for the single HC is critical for the drone-based camera script. Keeping only one HC in the script also reduced the drone image capture time and saved battery power, enabling us to cover more outcrop areas. We started the script using the camera’s user interface before the drone took off. The snapshot button of the Lightbridge 2 remote controlled the trigger once the drone reached the target height.
We also designed a drone flight mission in the Litchi app. To maintain an overlap of at least 40–50% between adjacent images, we set the waypoints of the flight mission 17 m apart. We calculated this distance based on different parameters, such as the camera’s sensor size, the height of the drone, and the lens focal length. The drone hovered at each waypoint for 6s, allowing the Senop camera to capture an image. Designing a Senop script and DRONE flight mission in this fashion ensured precise control over the data recording process, enhancing the quality and relevance of the captured data.
The hyperspectral data captured by the drone-mounted Senop camera undergoes a similar processing procedure as the tripod-based hyperspectral data, albeit with a few additional steps. Initially, the data stored by the Senop camera is in a complex hierarchical directory structure. We implemented a Python script to streamline the workflow and systematically organize the data, categorizing the recorded data into individual waypoints. A crucial additional step involves the co-registration of all 130 frames of a waypoint. Without this registration, the spectral profiles of the image pixels become distorted, leading to erroneous results. To rectify this, we employed a Python script to filter and register these frames, resulting in a new HC with all the frames aligned for each waypoint. The ROIs used in the ELC reflectance retrieval were extracted from the darkest and the brightest pixels of each image. The resulting spectra are normalized as such most of the spectra in the study represent apparent reflectance. The remaining processing steps for the drone-mounted data are identical to those for the tripod-mounted data, ensuring consistency in our approach.

4. Results

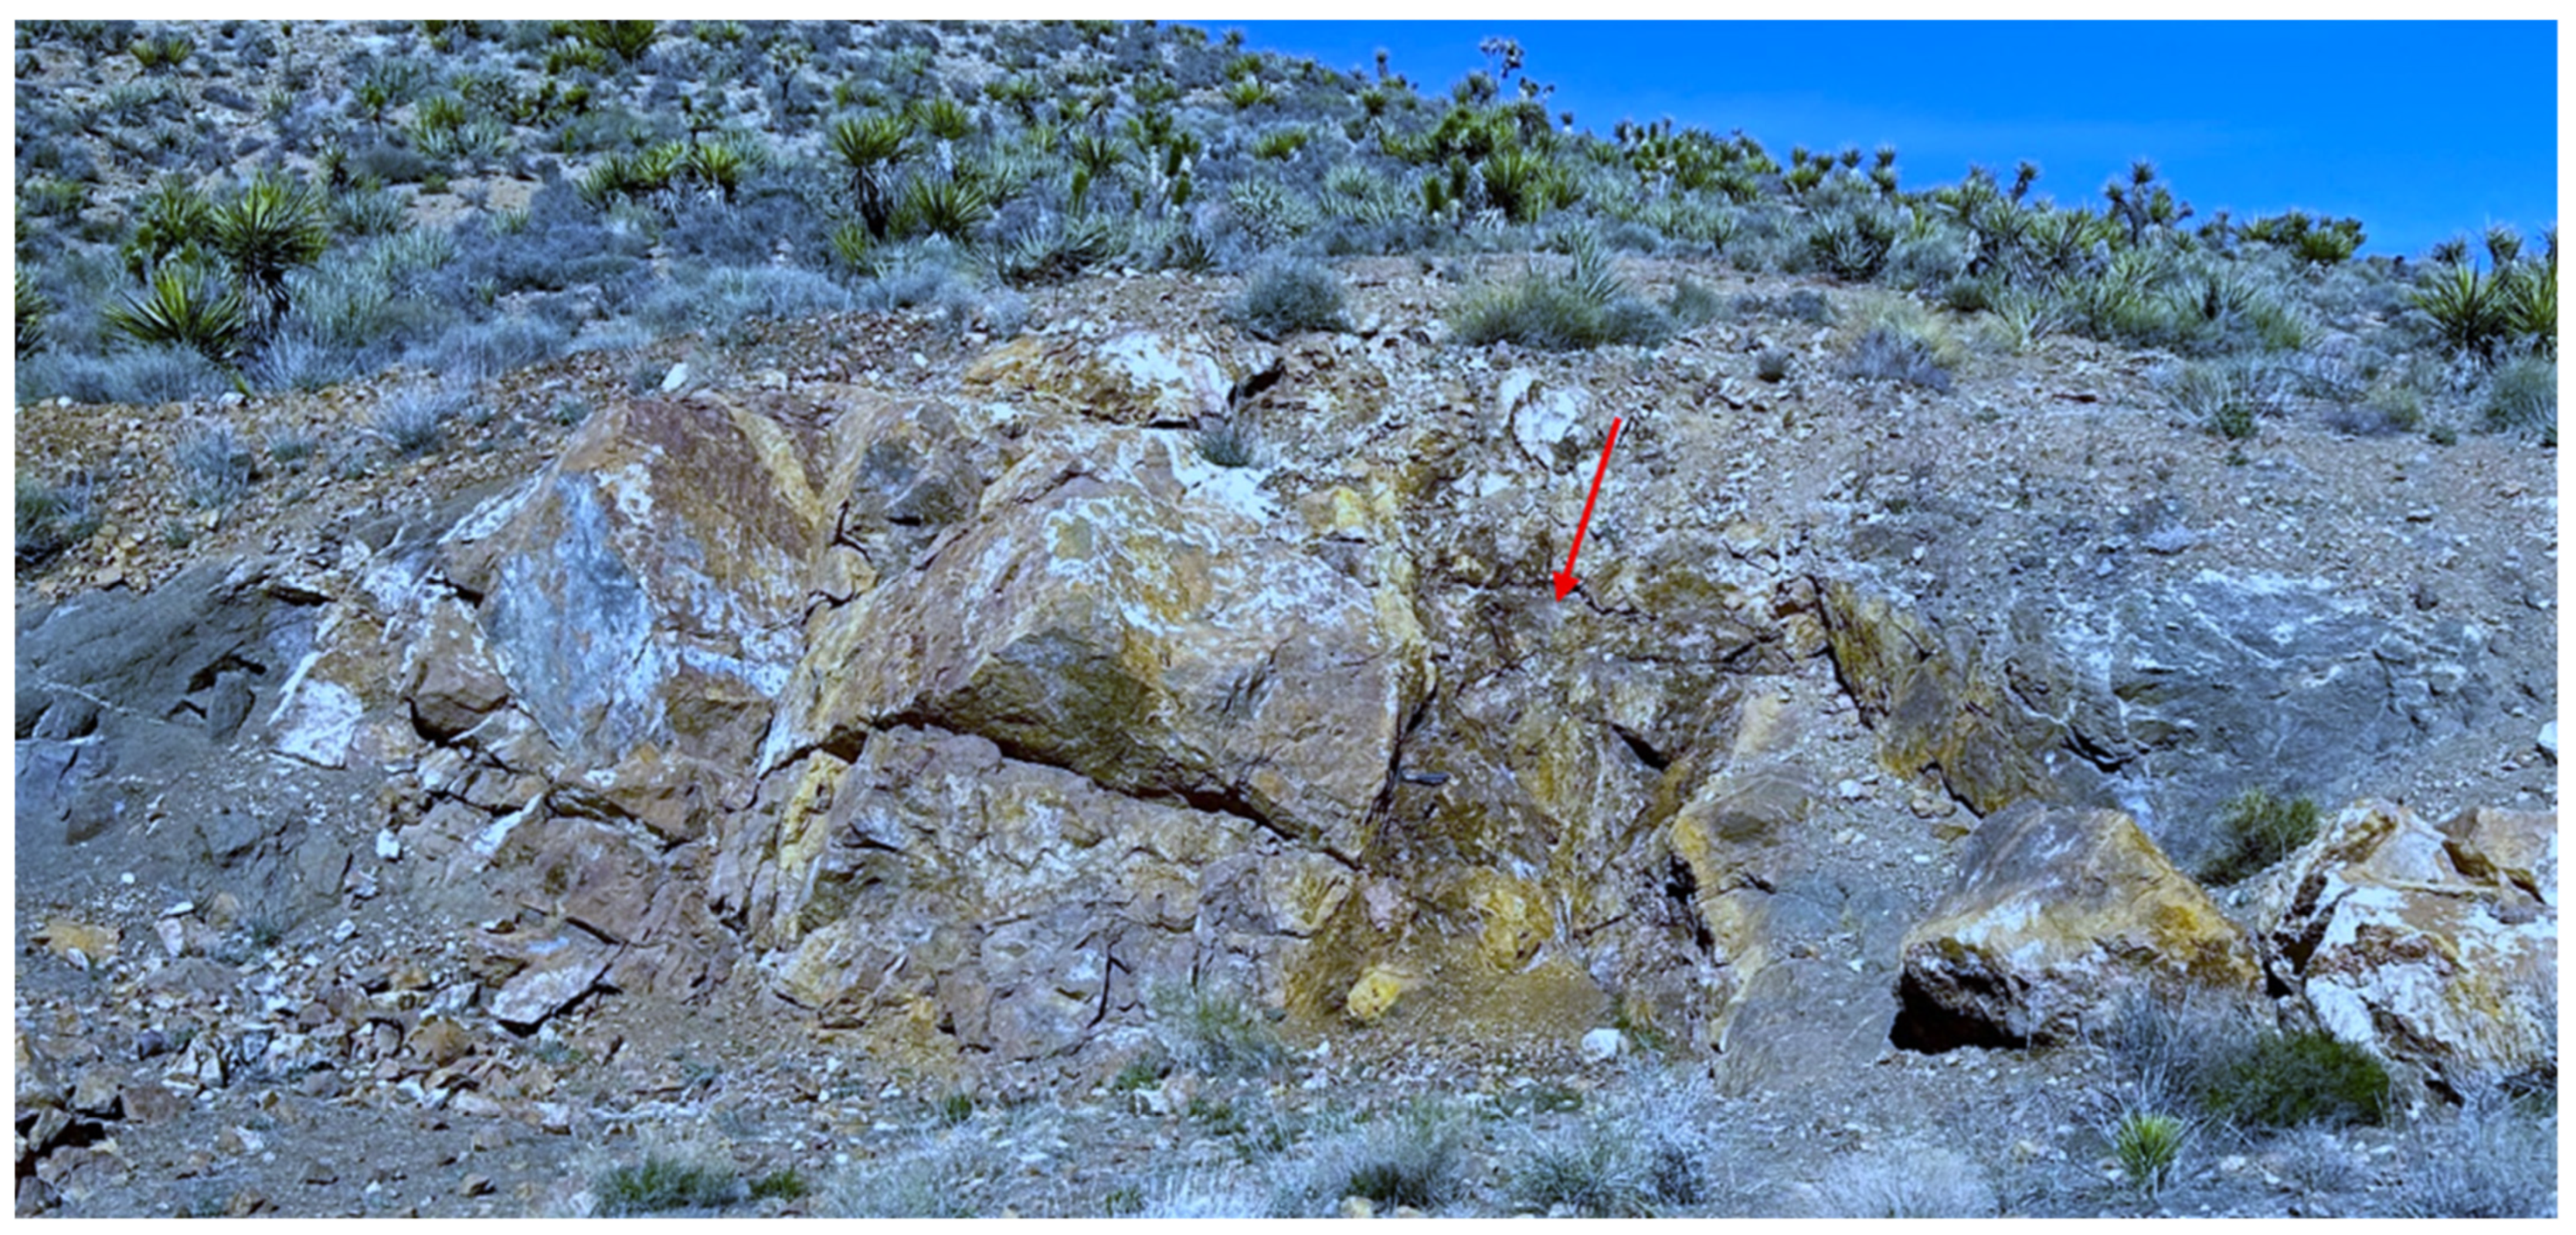
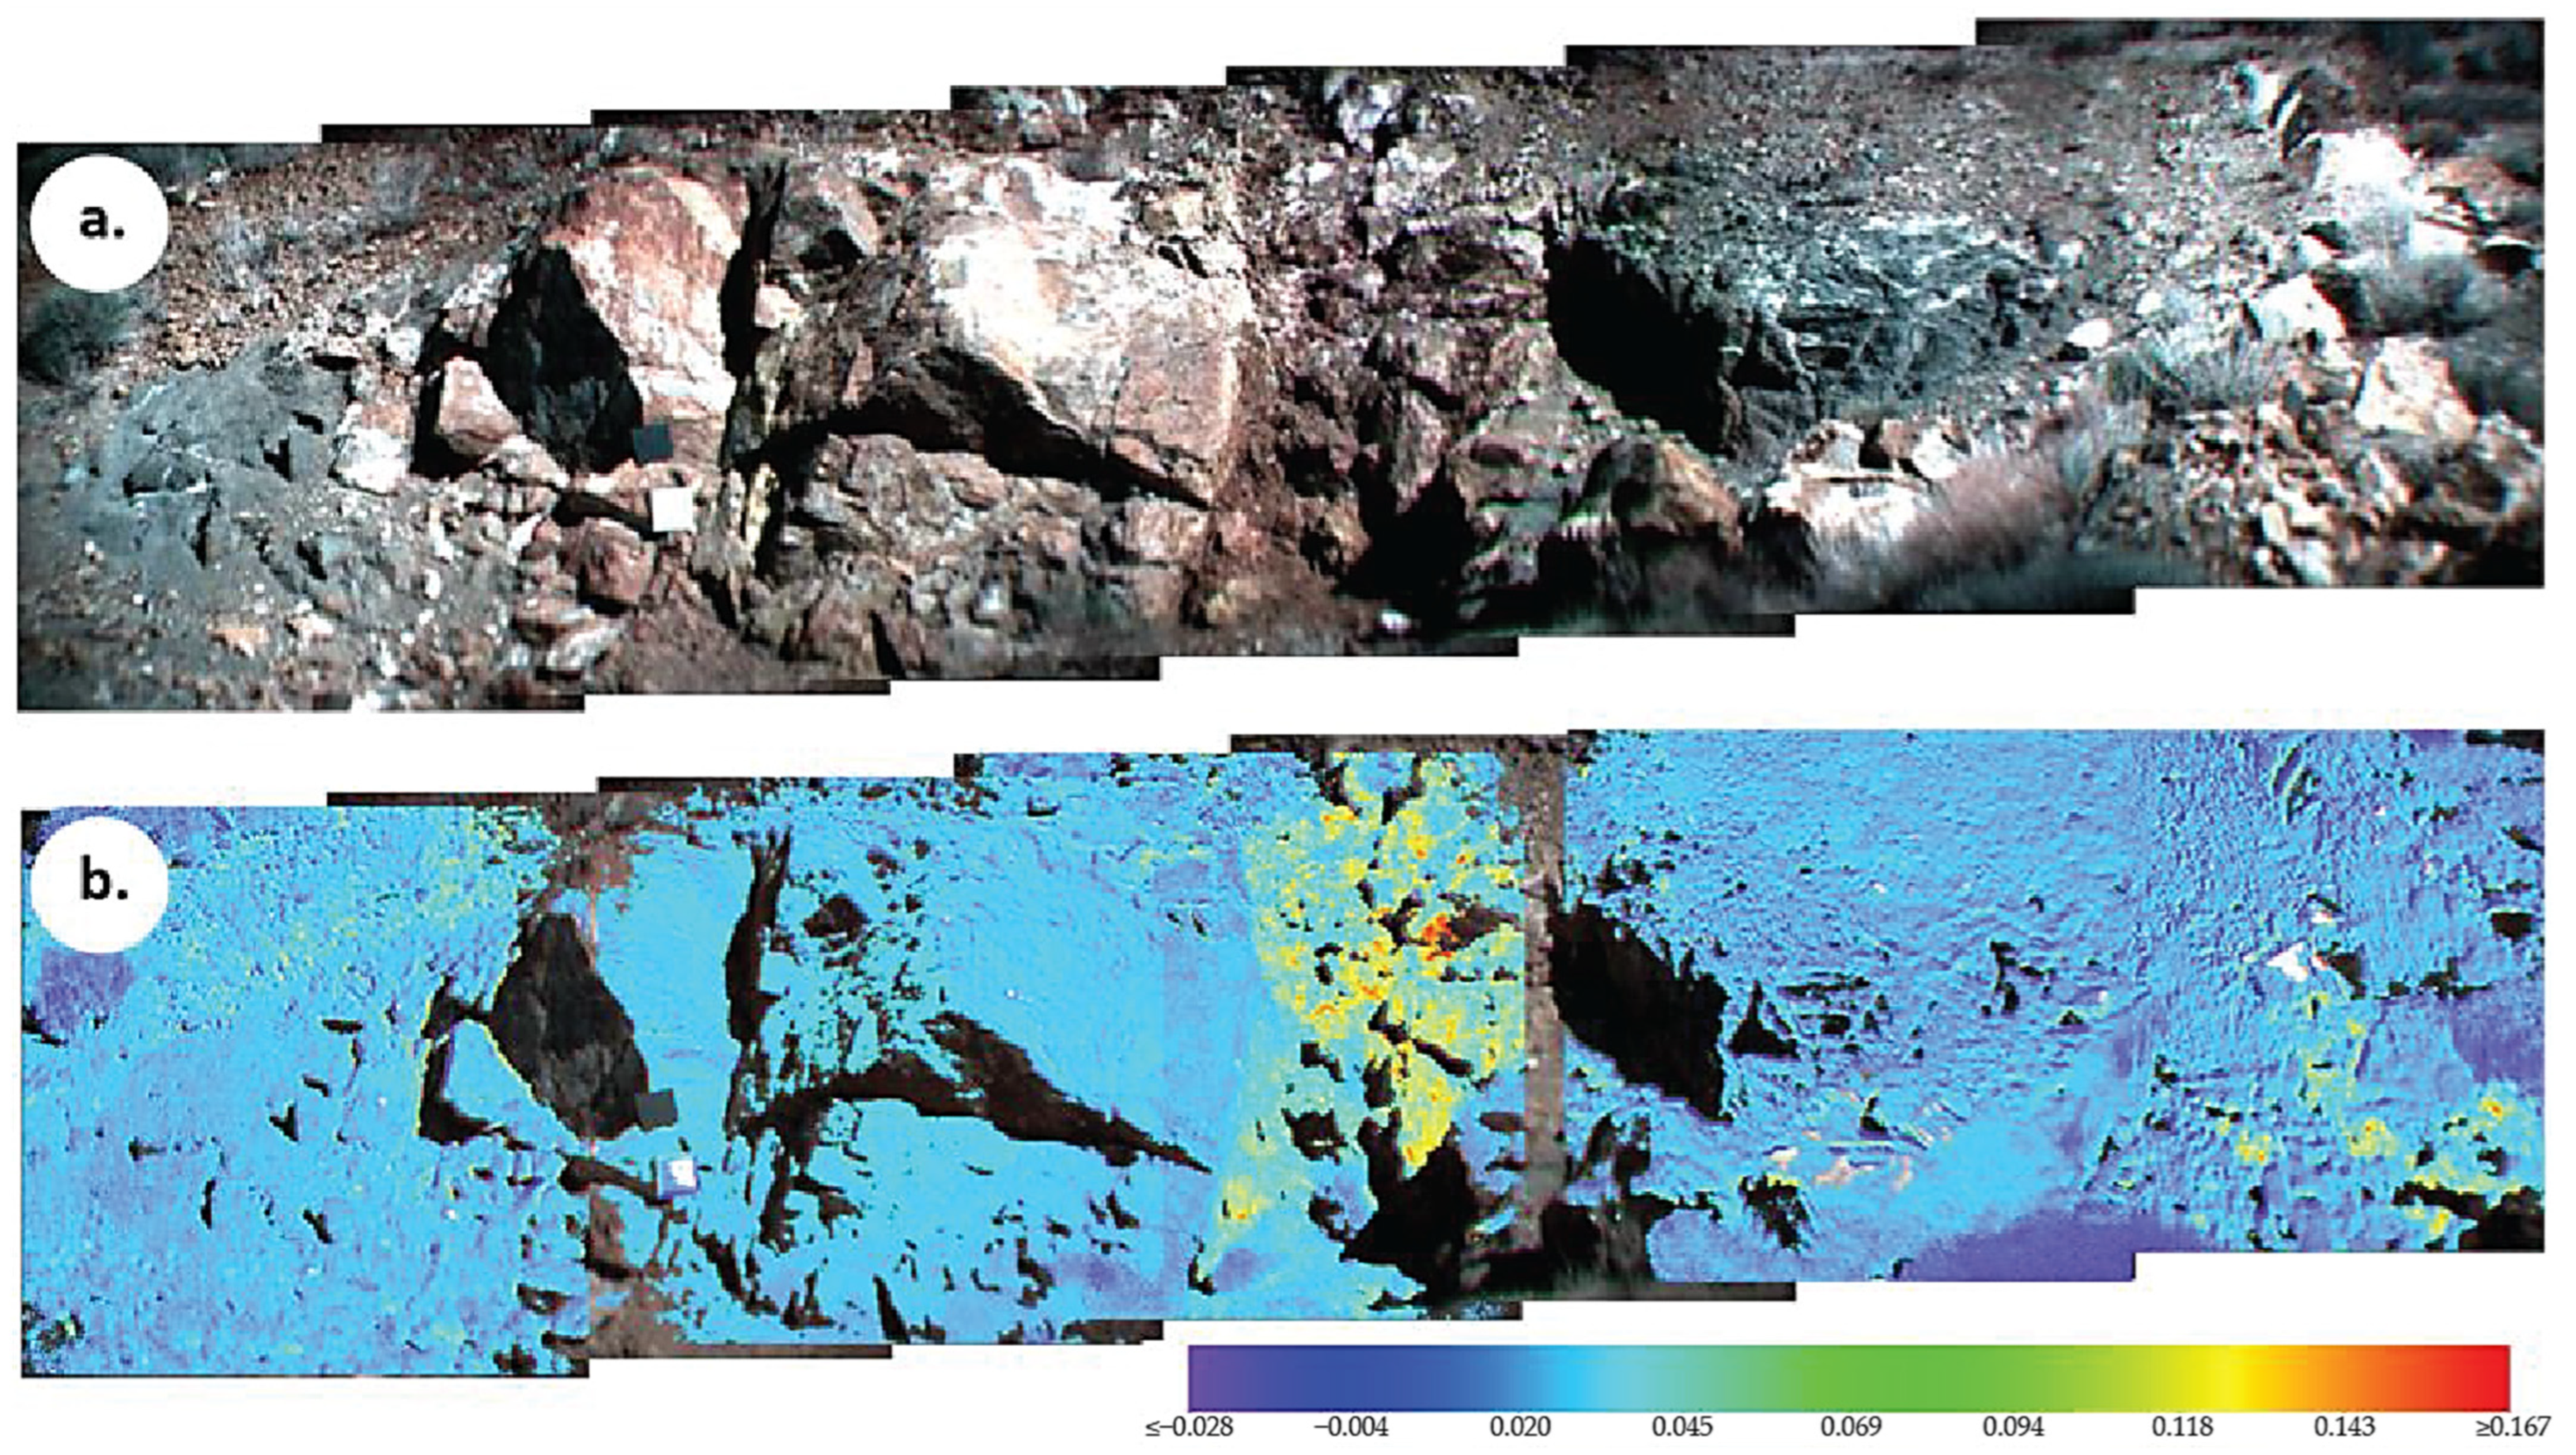
4.1. REEs in the Birthday Shonkinite Stock

Upon comparing the panorama of the Birthday shonkinite site, constructed by stitching seven hyperspectral images (Figure 9a), with the field photograph of the site (Figure 4), we can discern a noticeable exaggeration on the right-most portion of the outcrop. We performed the stitching process in ArcGIS Pro [73], which matches features in the overlapping zones of adjacent images without accounting for the homography of the captured images. However, this exaggeration was disregarded because the distribution map of bastnaesite concentration does not necessitate this level of accuracy as no length or area measurements are being performed.
The BI map of the Birthday shonkinite site (Figure 9b) reveals a higher concentration of bastnaesite in the carbonatite body that has intruded into the shonkinite stock. Any pixel in the map with an index value exceeding 0.04 indicates a bastnaesite concentration greater than 3 wt. %. The geochemical analysis of the rock samples conducted by MP Materials corroborates our findings. It is worth noting that several boulders on the right side of the carbonatite body also exhibit higher concentrations of bastnaesite.

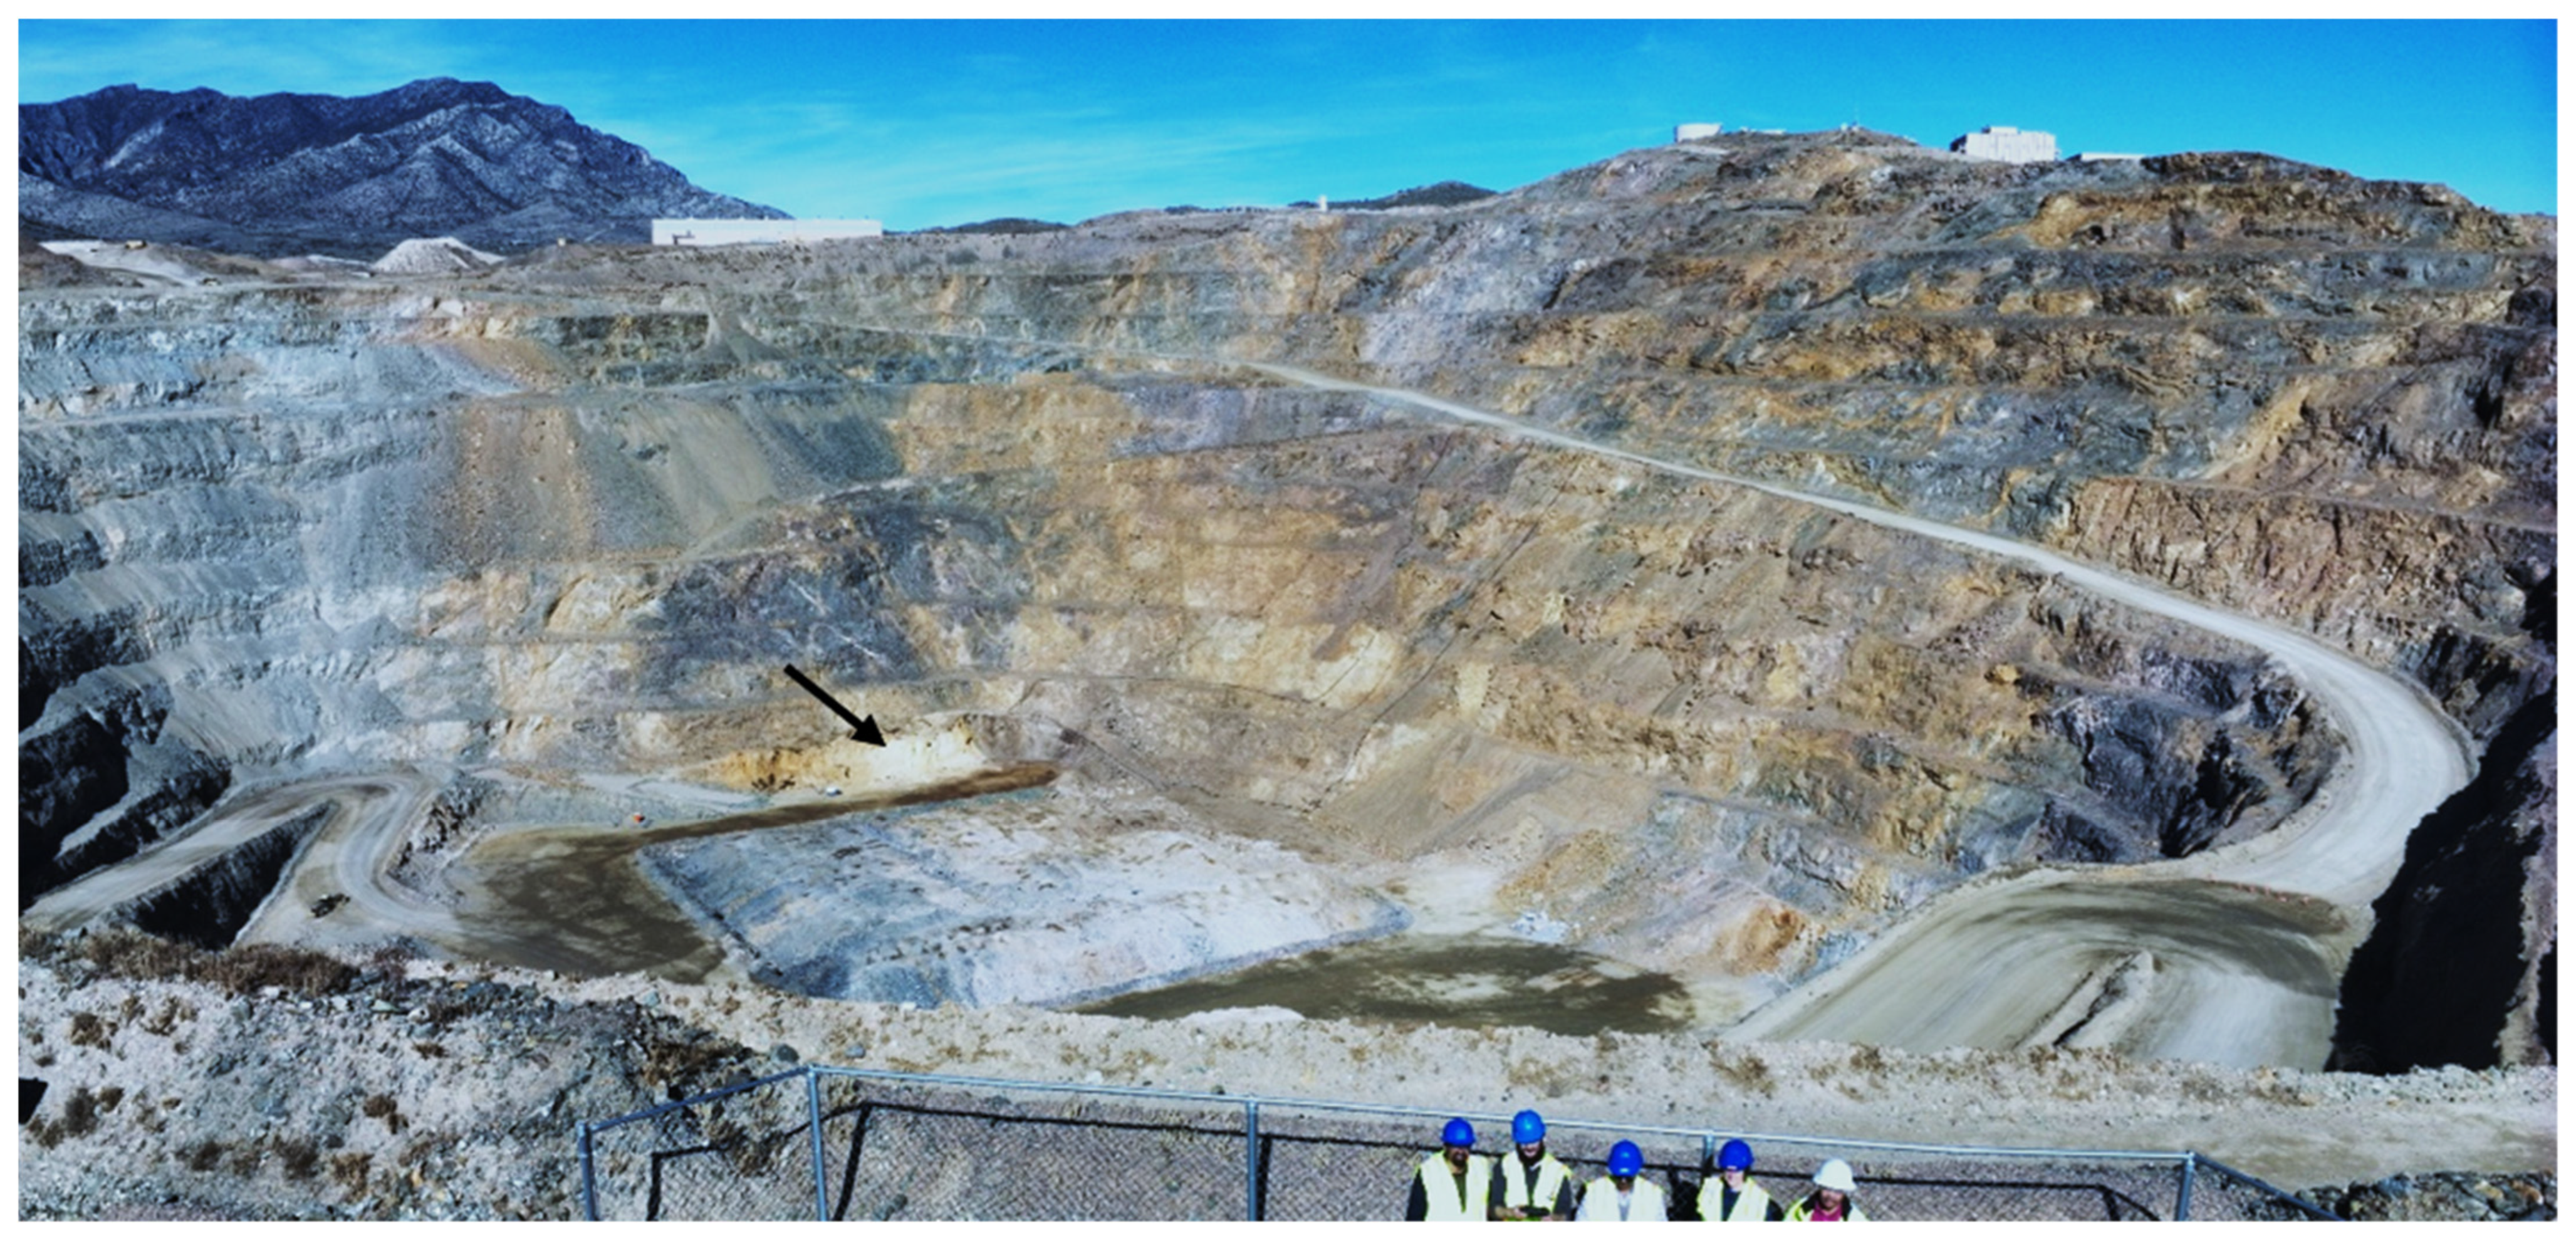
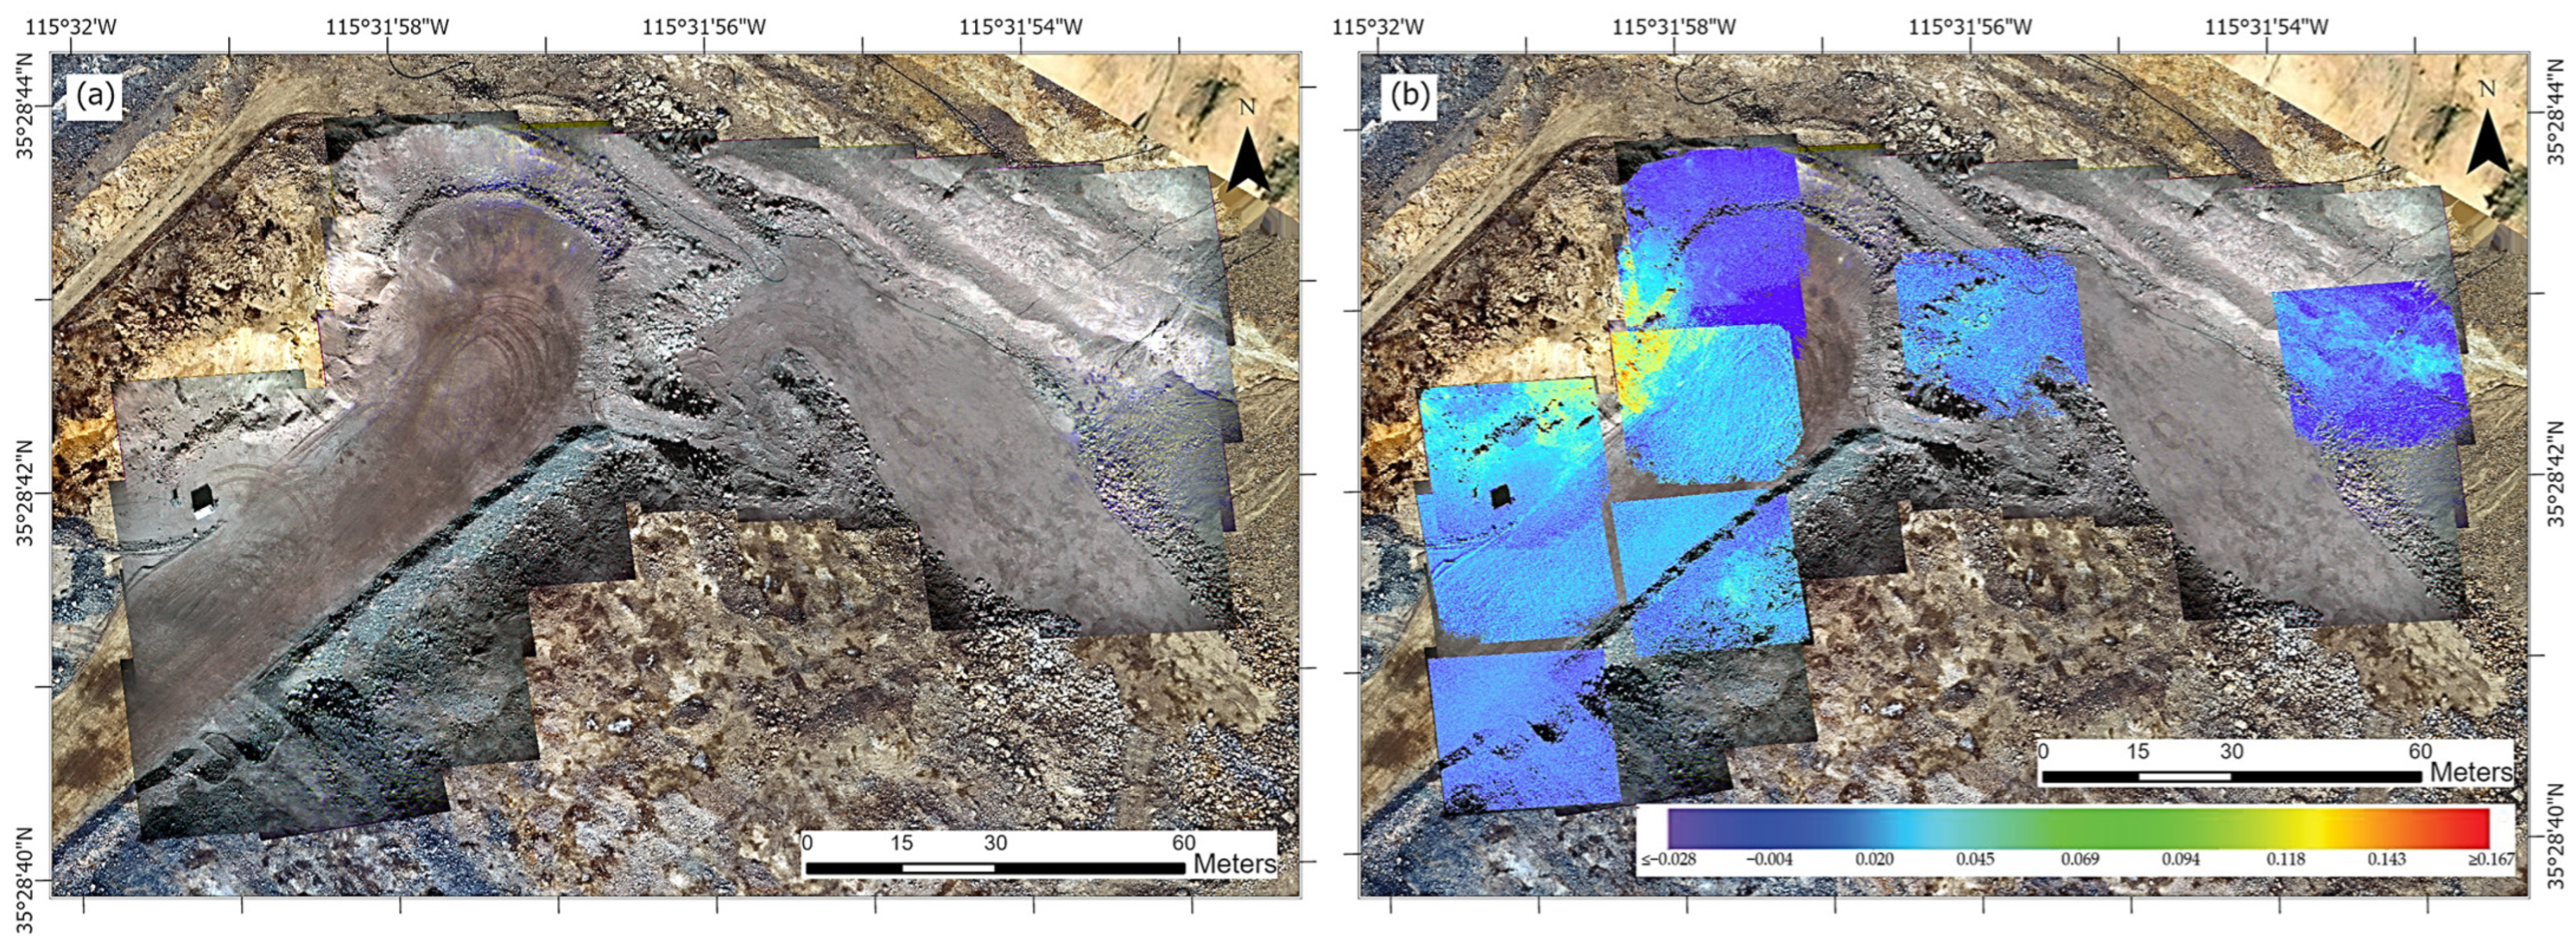
4.2. REEs in the Sulphide Queen Mine Pit

Given the hovering accuracy of the DJI M600 Pro drone, which is approximately 0.5 m in the vertical direction and 1.5 m in the horizontal direction when using the P-GPS mode, most of the frames captured at each waypoint exhibited more horizontal than vertical or rotational displacements (Figure 10a). Therefore, a translational transformation was sufficient to register the frames accurately and align the rock units captured in each frame (Figure 10b).
Our objective in the Sulphide Queen mine pit was to acquire the drone-based hyperspectral data of the light brown outcrop (Figure 11a), which had the highest bastnäsite concentration according to the geochemical analysis by MP Materials. MP Materials named it “white and black carbonatite”. However, the outdated satellite basemap of the Litchi app did not show the current outcrop condition of the mine pit. Therefore, an inaccurately designed drone mission led to incomplete coverage of the target area by our drone which is evident from the stitched images obtained during the flight (Figure 11a). Nevertheless, we managed to capture a reasonable portion of the target outcrop sufficient to validate our working concept. The BI map of the outcrop confirmed the presence of bastnaesite at a higher concentration than any other location in the recorded hyperspectral data (Figure 11b). The hyperspectral data extracted from the images of the mine pit is shown in Figure 12a,c.
In remote sensing studies, one of the essential requirements is ensuring the validity and accuracy of the results. The outcome of the different methods we employed in this study are explained in the forthcoming sections. While we relied on previously published geochemical results to validate our findings, we strongly recommend conducting a comprehensive geochemical assessment of the collected samples. This additional analysis will bolster the robustness of our conclusions and enhance the scientific rigor of our study.

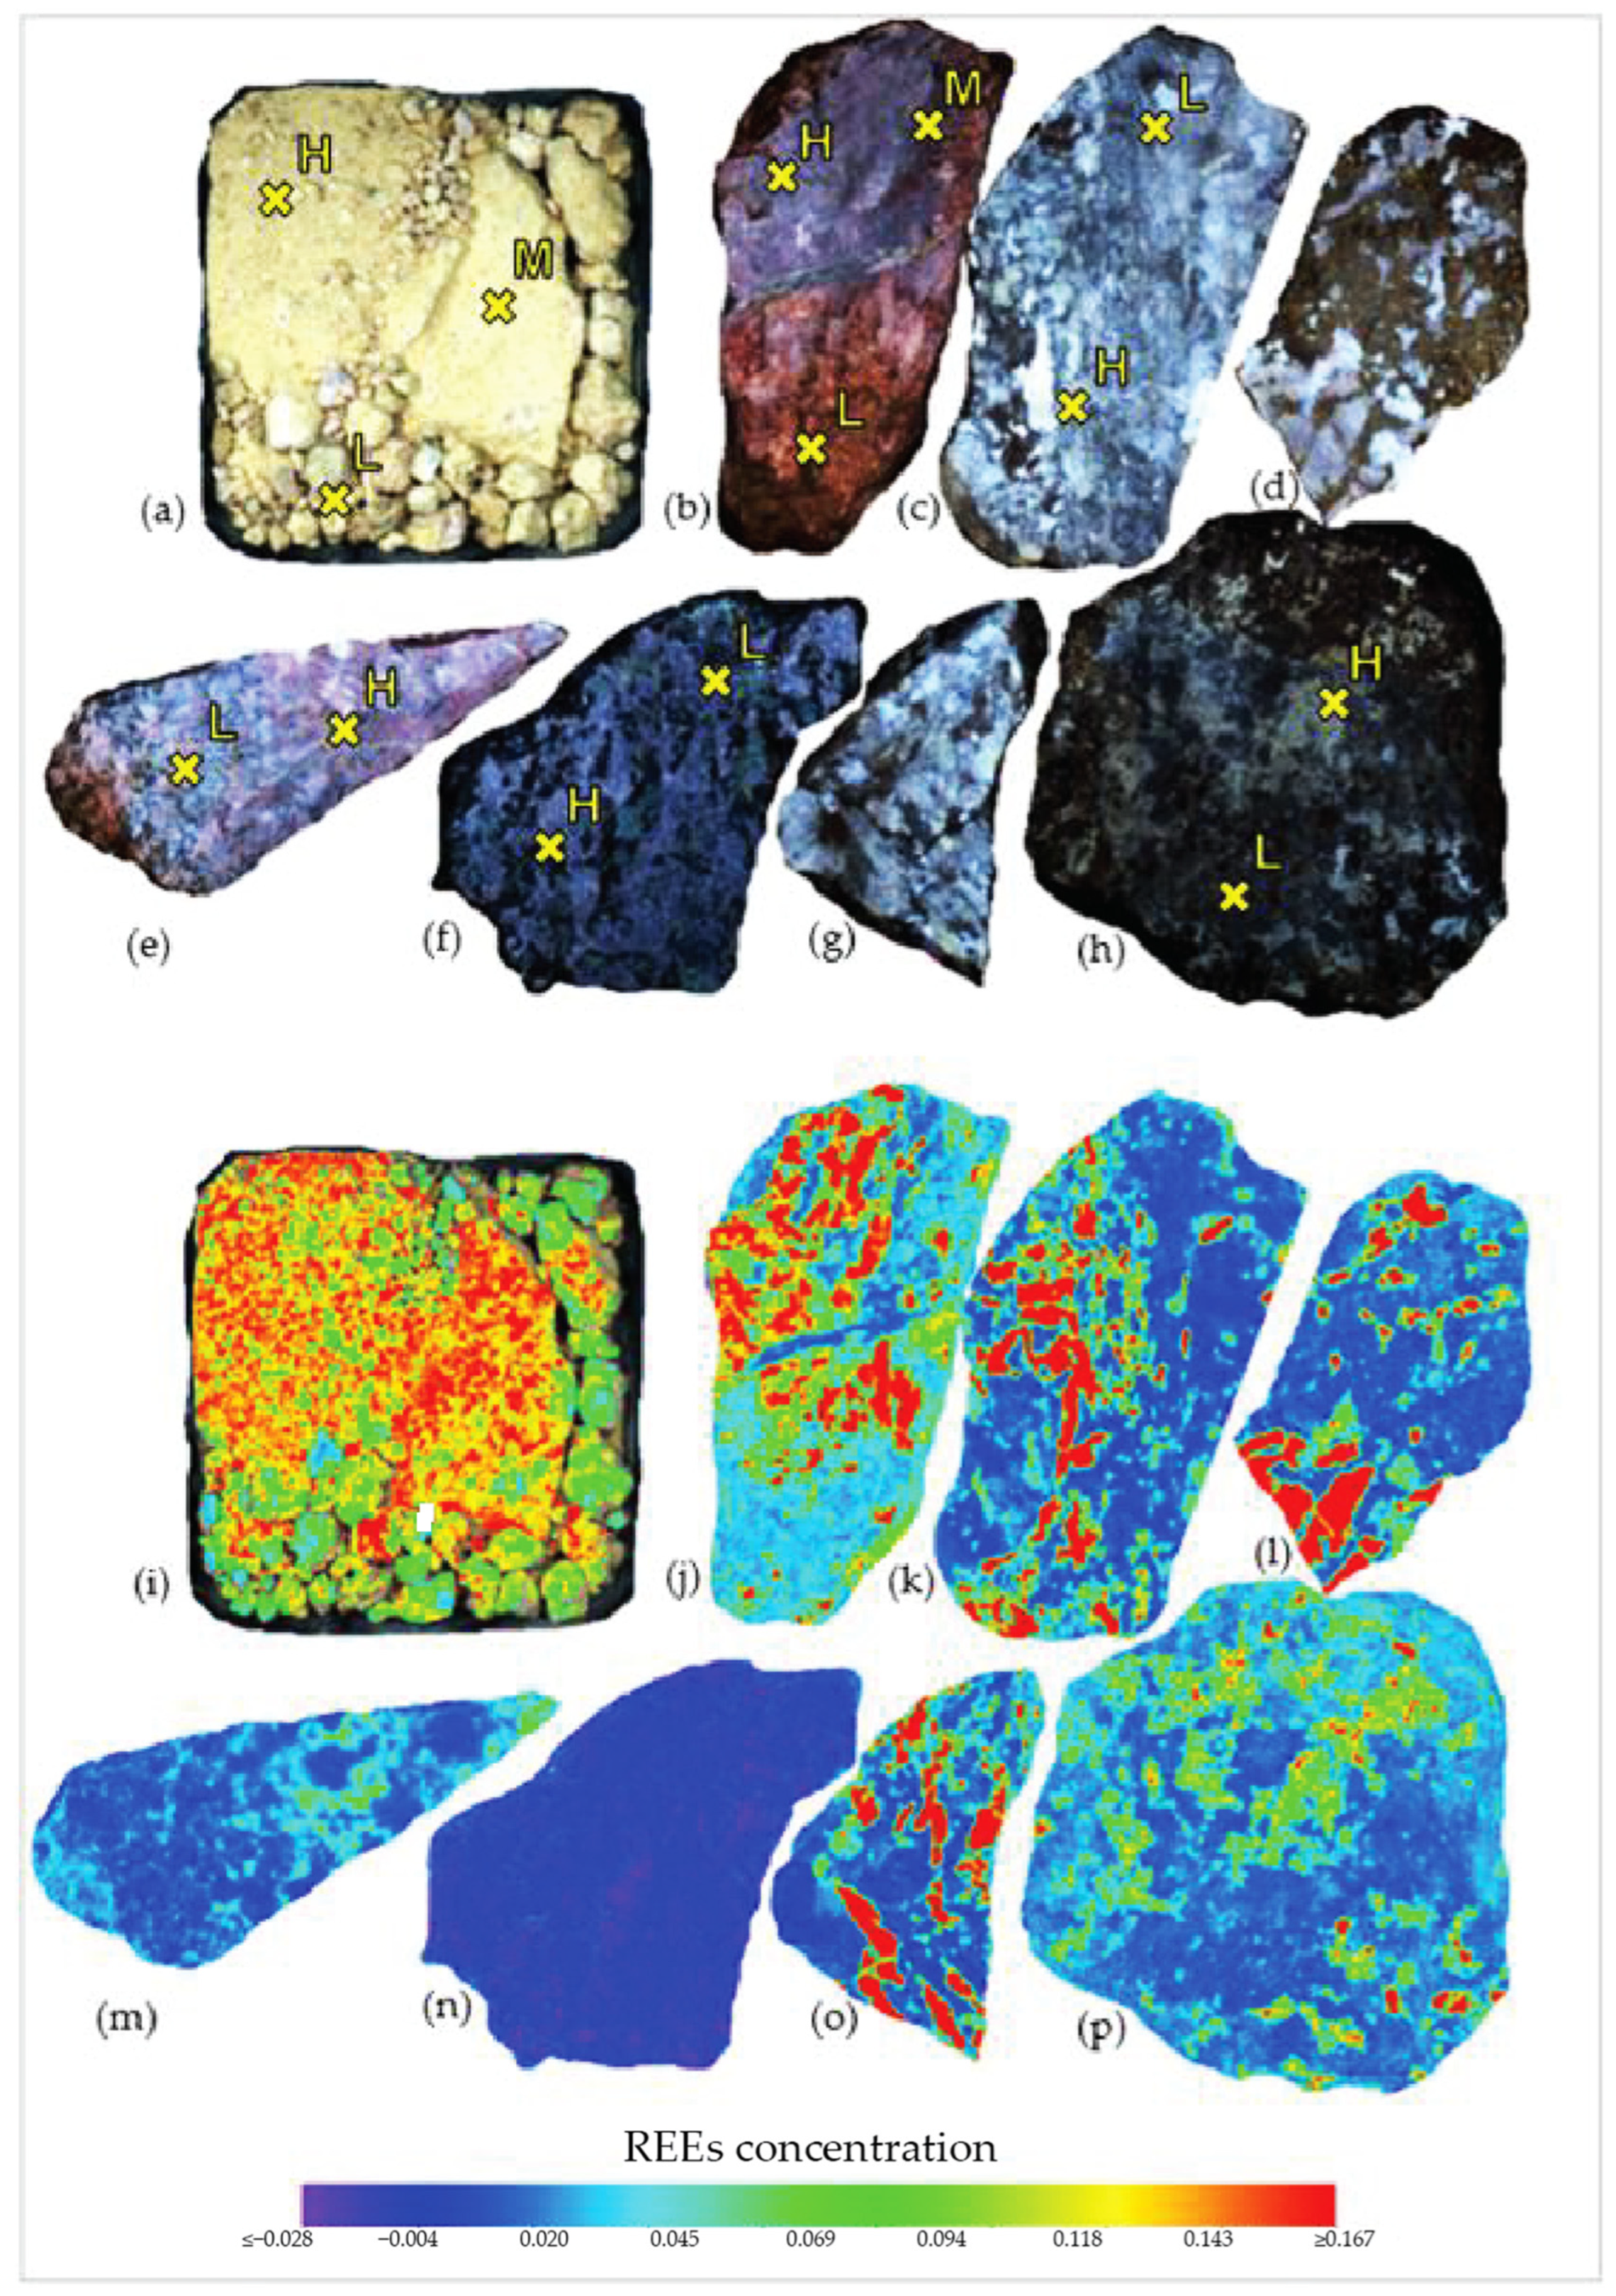
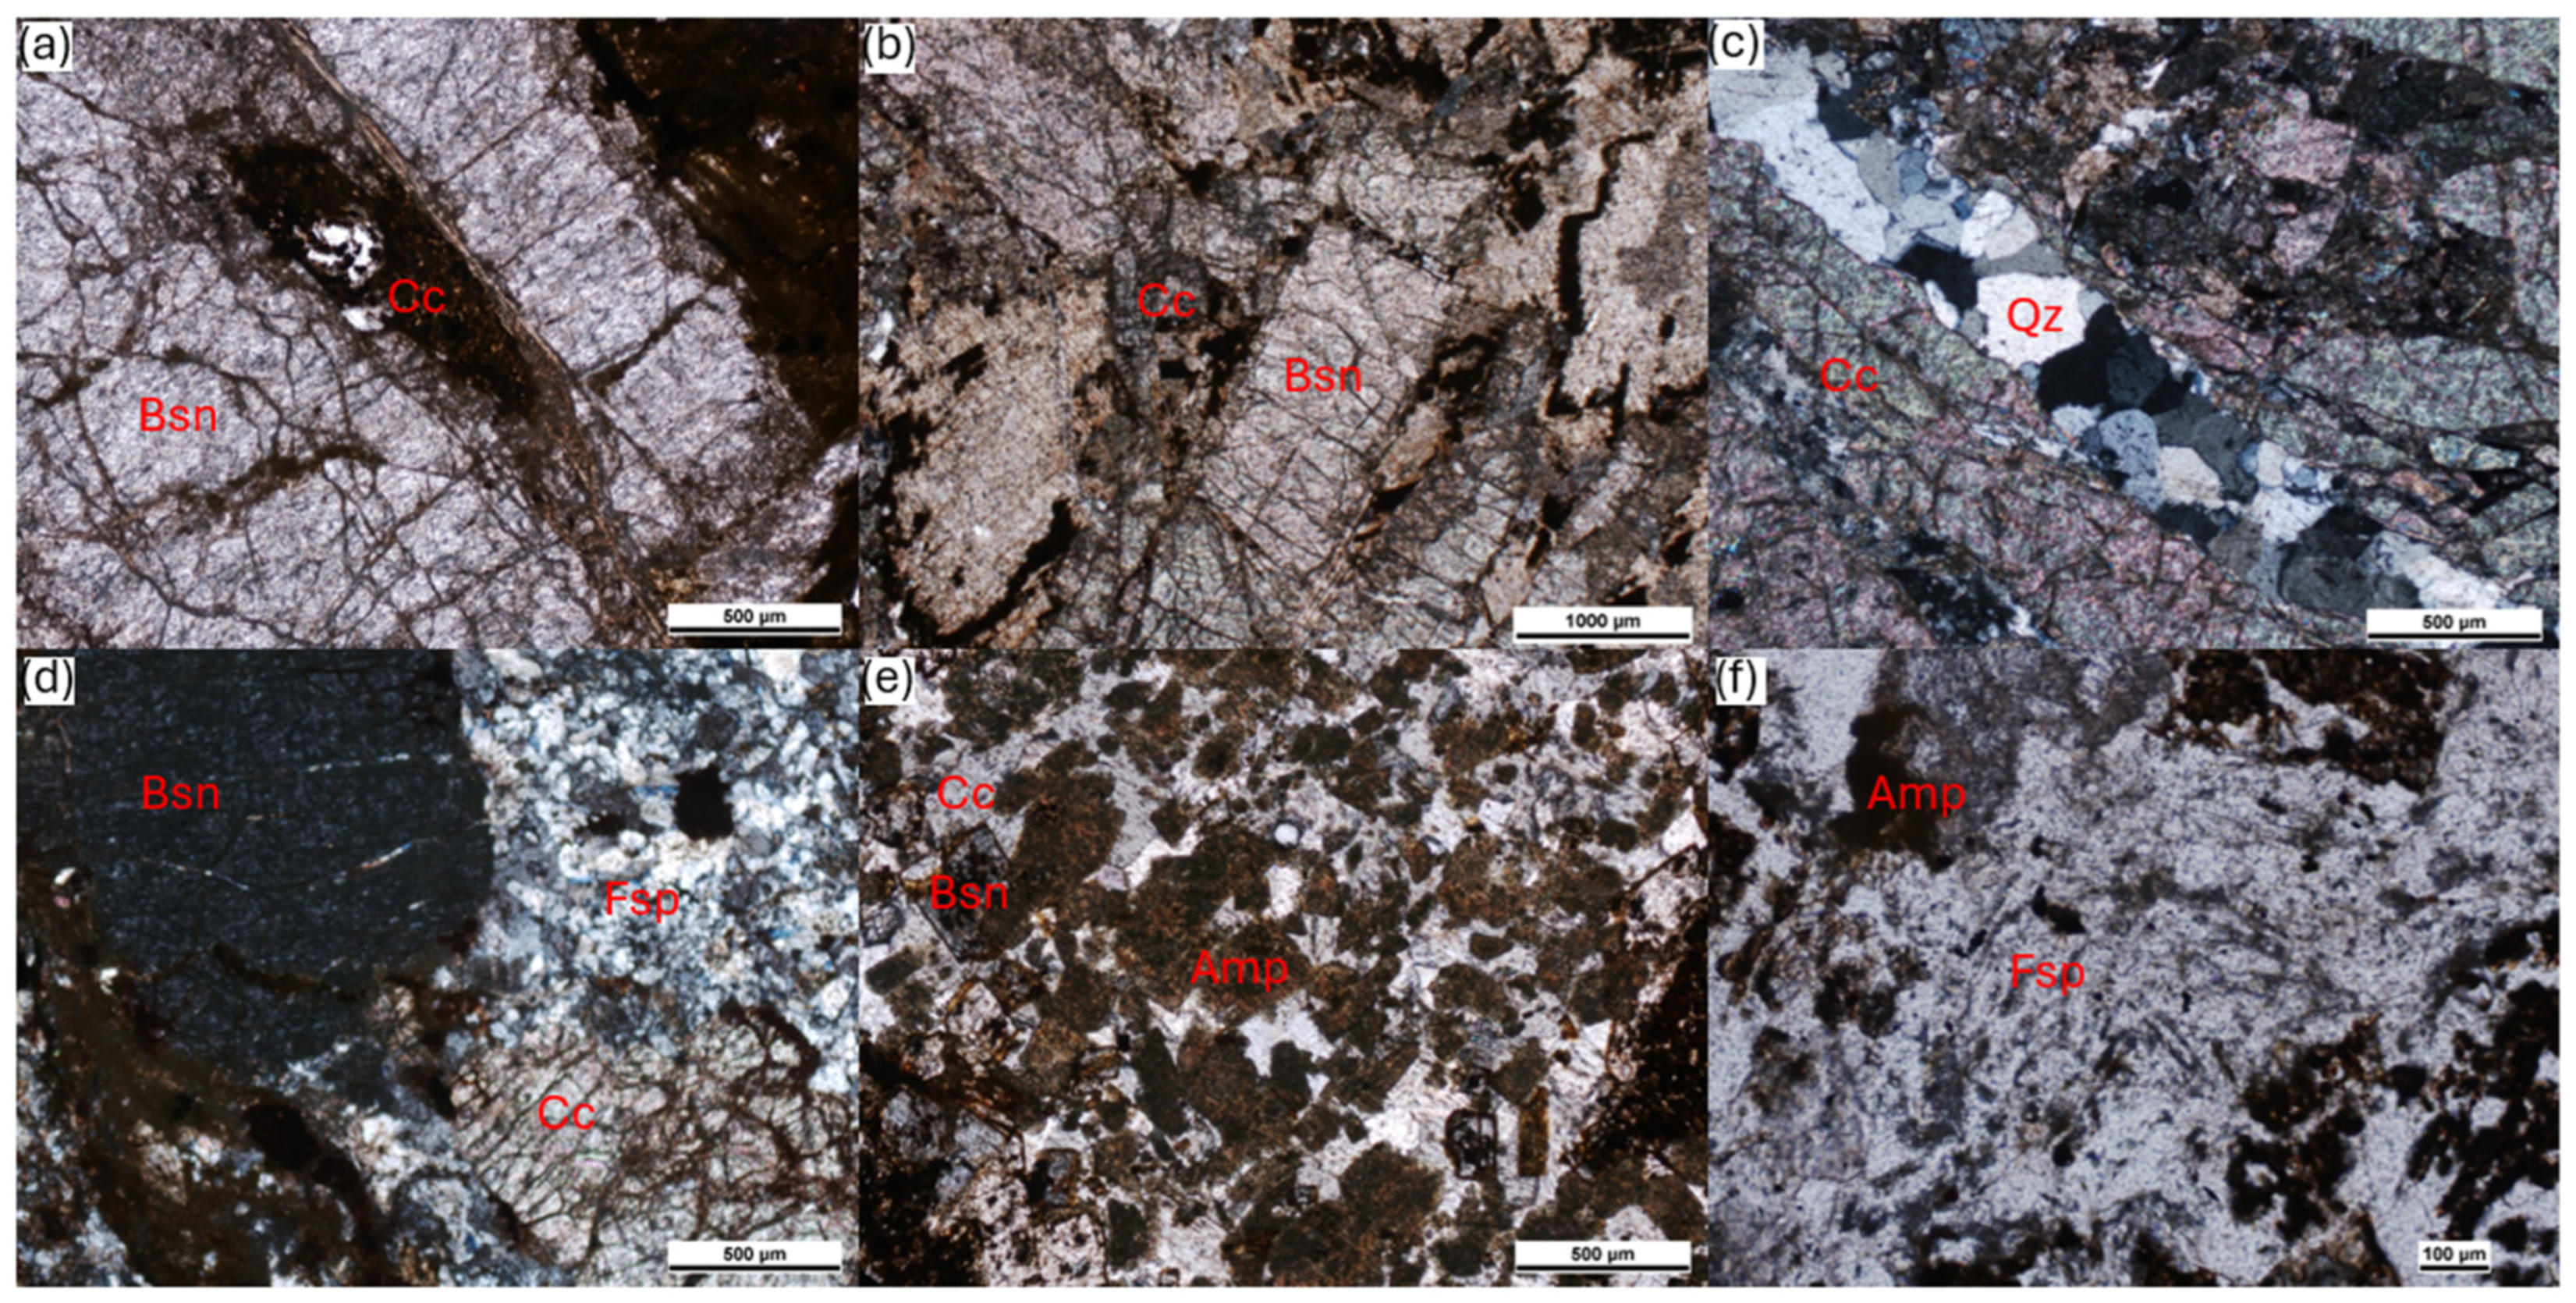
4.3. Close-Range Laboratory-Based Hyperspectral Analysis

We applied the BI on the hyperspectral data of the collected samples acquired via the SPECIM VNIR camera in a laboratory environment. The hyperspectral data extracted from the images is shown in Figure 12b,d. The spatial resolution of the hyperspectral images obtained with this setting is at the millimeter scale, enabling us to analyze the rock samples (Figure 13a–h) for their REEs distribution (Figure 13i–p). The bastnaesite distribution in these samples correlates with the distributions obtained from the tripod–Senop and the drone–Senop hyperspectral datasets acquired in the field.

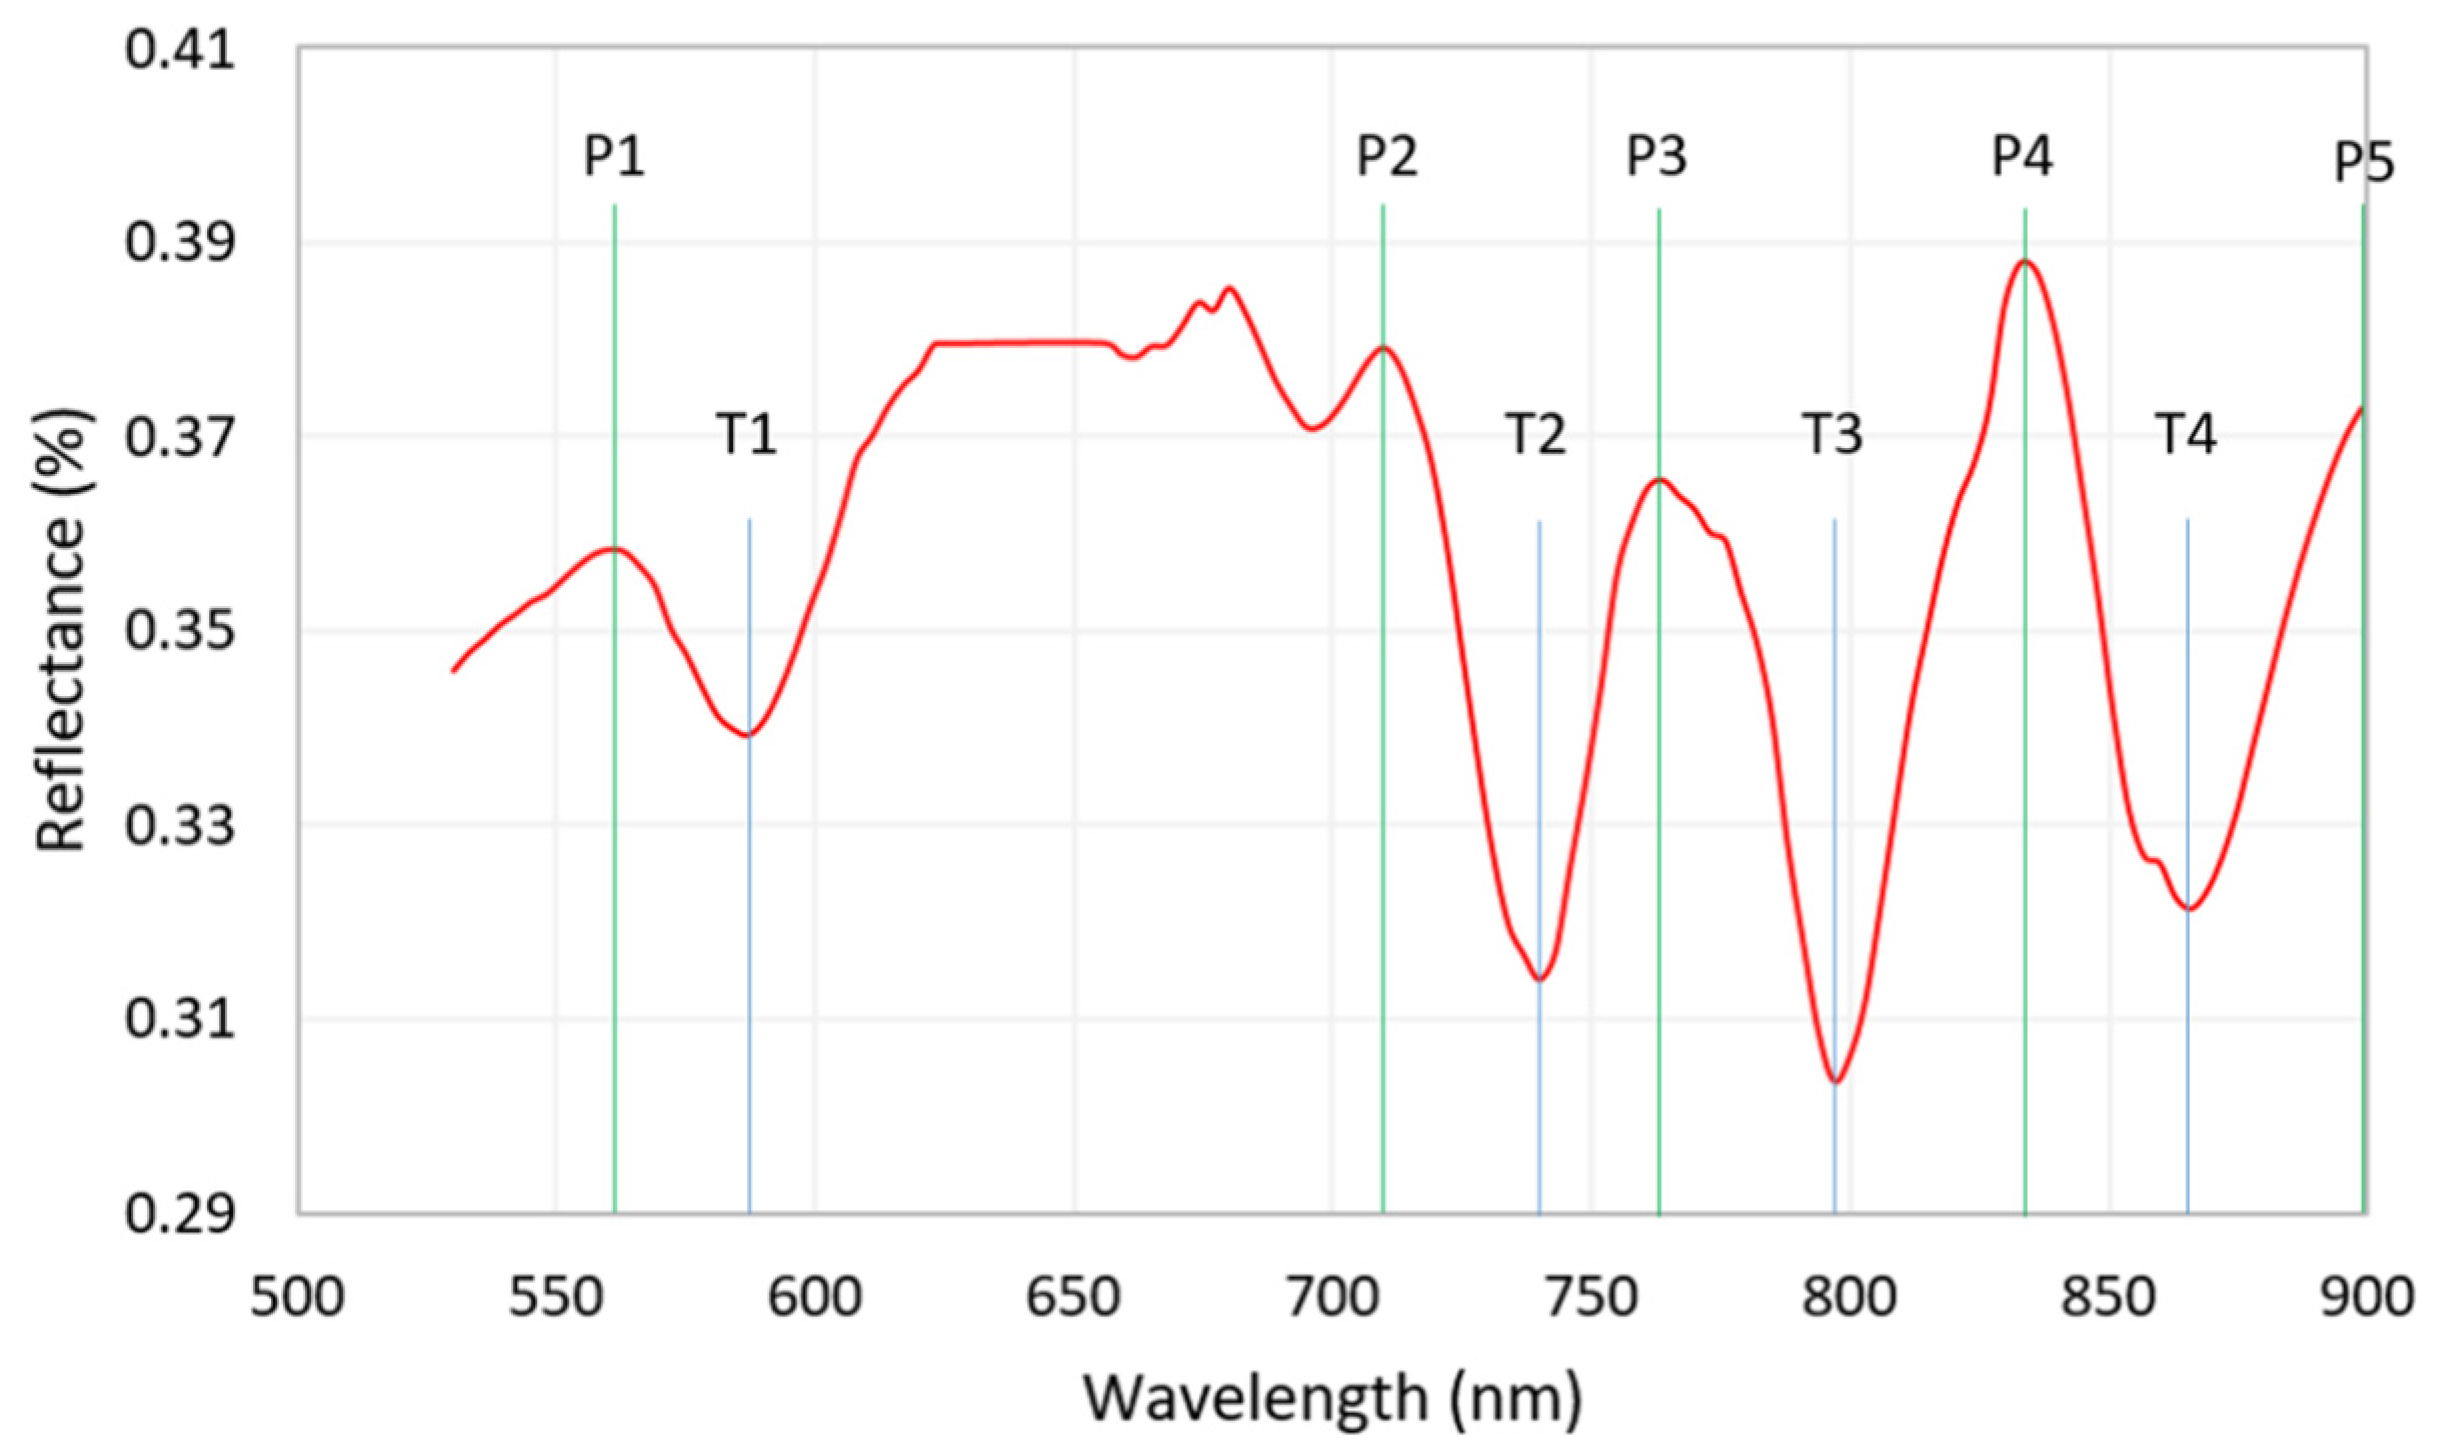
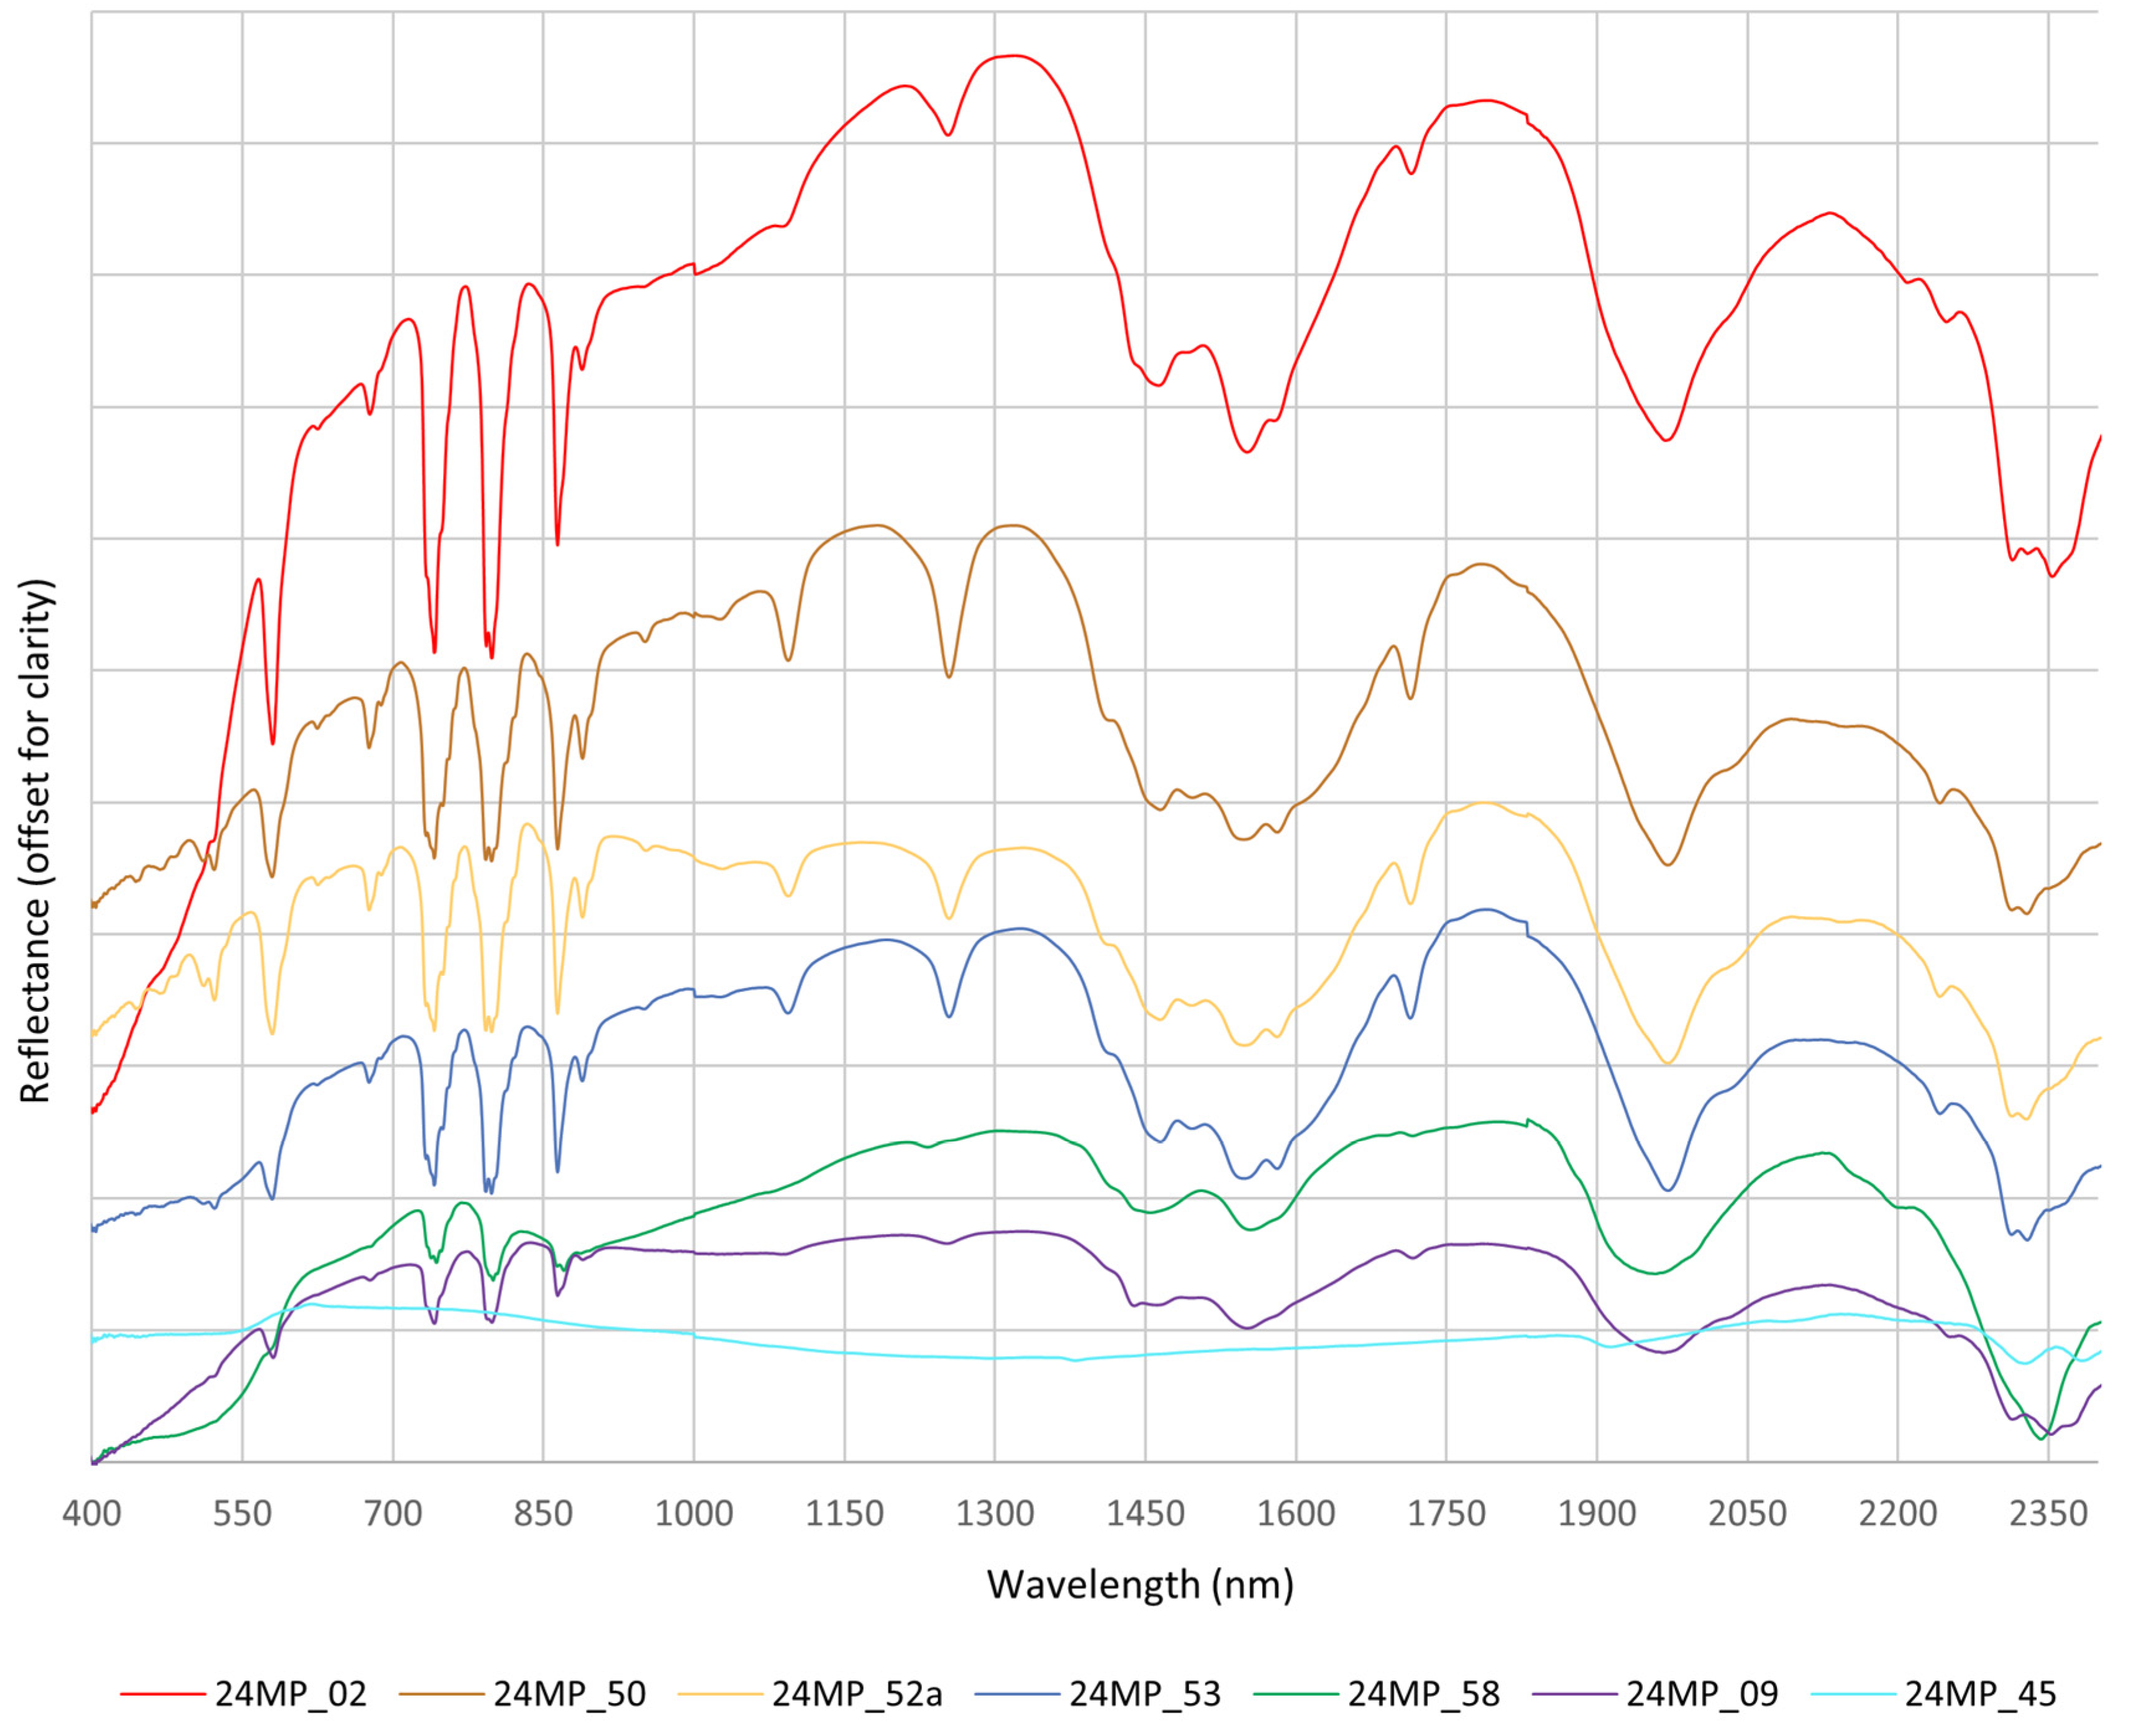
4.4. Point Spectral Analysis

The ASD spectral profiles (Figure 14) of nearly all the samples were consistent with the results obtained from the SPECIM hyperspectral camera and the Senop hyperspectral data. The deepest absorption features of the bastnaesite mineral in the spectral profiles of the carbonatite samples from both the Birthday site and the mine pit validate the highest concentration of bastnaesite in these rocks (Figure 14a–c,f). The syenite rock samples from the Birthday site, having a very low BI index in the SPECIM hyperspectral camera, gave a spectral profile with shallower absorption features (Figure 14d). However, we could not see any basnaesite in the thin section. We speculate that some of the carbonatite fluids rich in REE might have altered the syenite. The shonkinite sample from the Birthday stock did not show any of the four absorption features of the bastnaesite mineral in the ASD spectral profile (Figure 14e).
Previous remote sensing studies have shown that the depth of the absorption features in a spectral profile is directly proportional to the concentration of the mineral under focus. To compare the relative abundance of REEs in the samples from both sites (the Birthday shonkinite stock site and the Sulphide Queen mine pit), we constructed a single plot of all the ASD spectral profiles from areas with a high concentration of REEs in each sample (Figure 15). We aimed to compare the relative depth of the four diagnostic absorption features of the bastnaesite mineral in the VNIR portion of the electromagnetic spectrum from each sample.
Our findings indicate that the white carbonatite sample from the Sulphide Queen mine pit exhibits the most profound absorption features, thereby suggesting the highest concentration of REEs, while the carbonatite veins of the Birthday shonkinite stock have relatively lower concentrations of REEs.

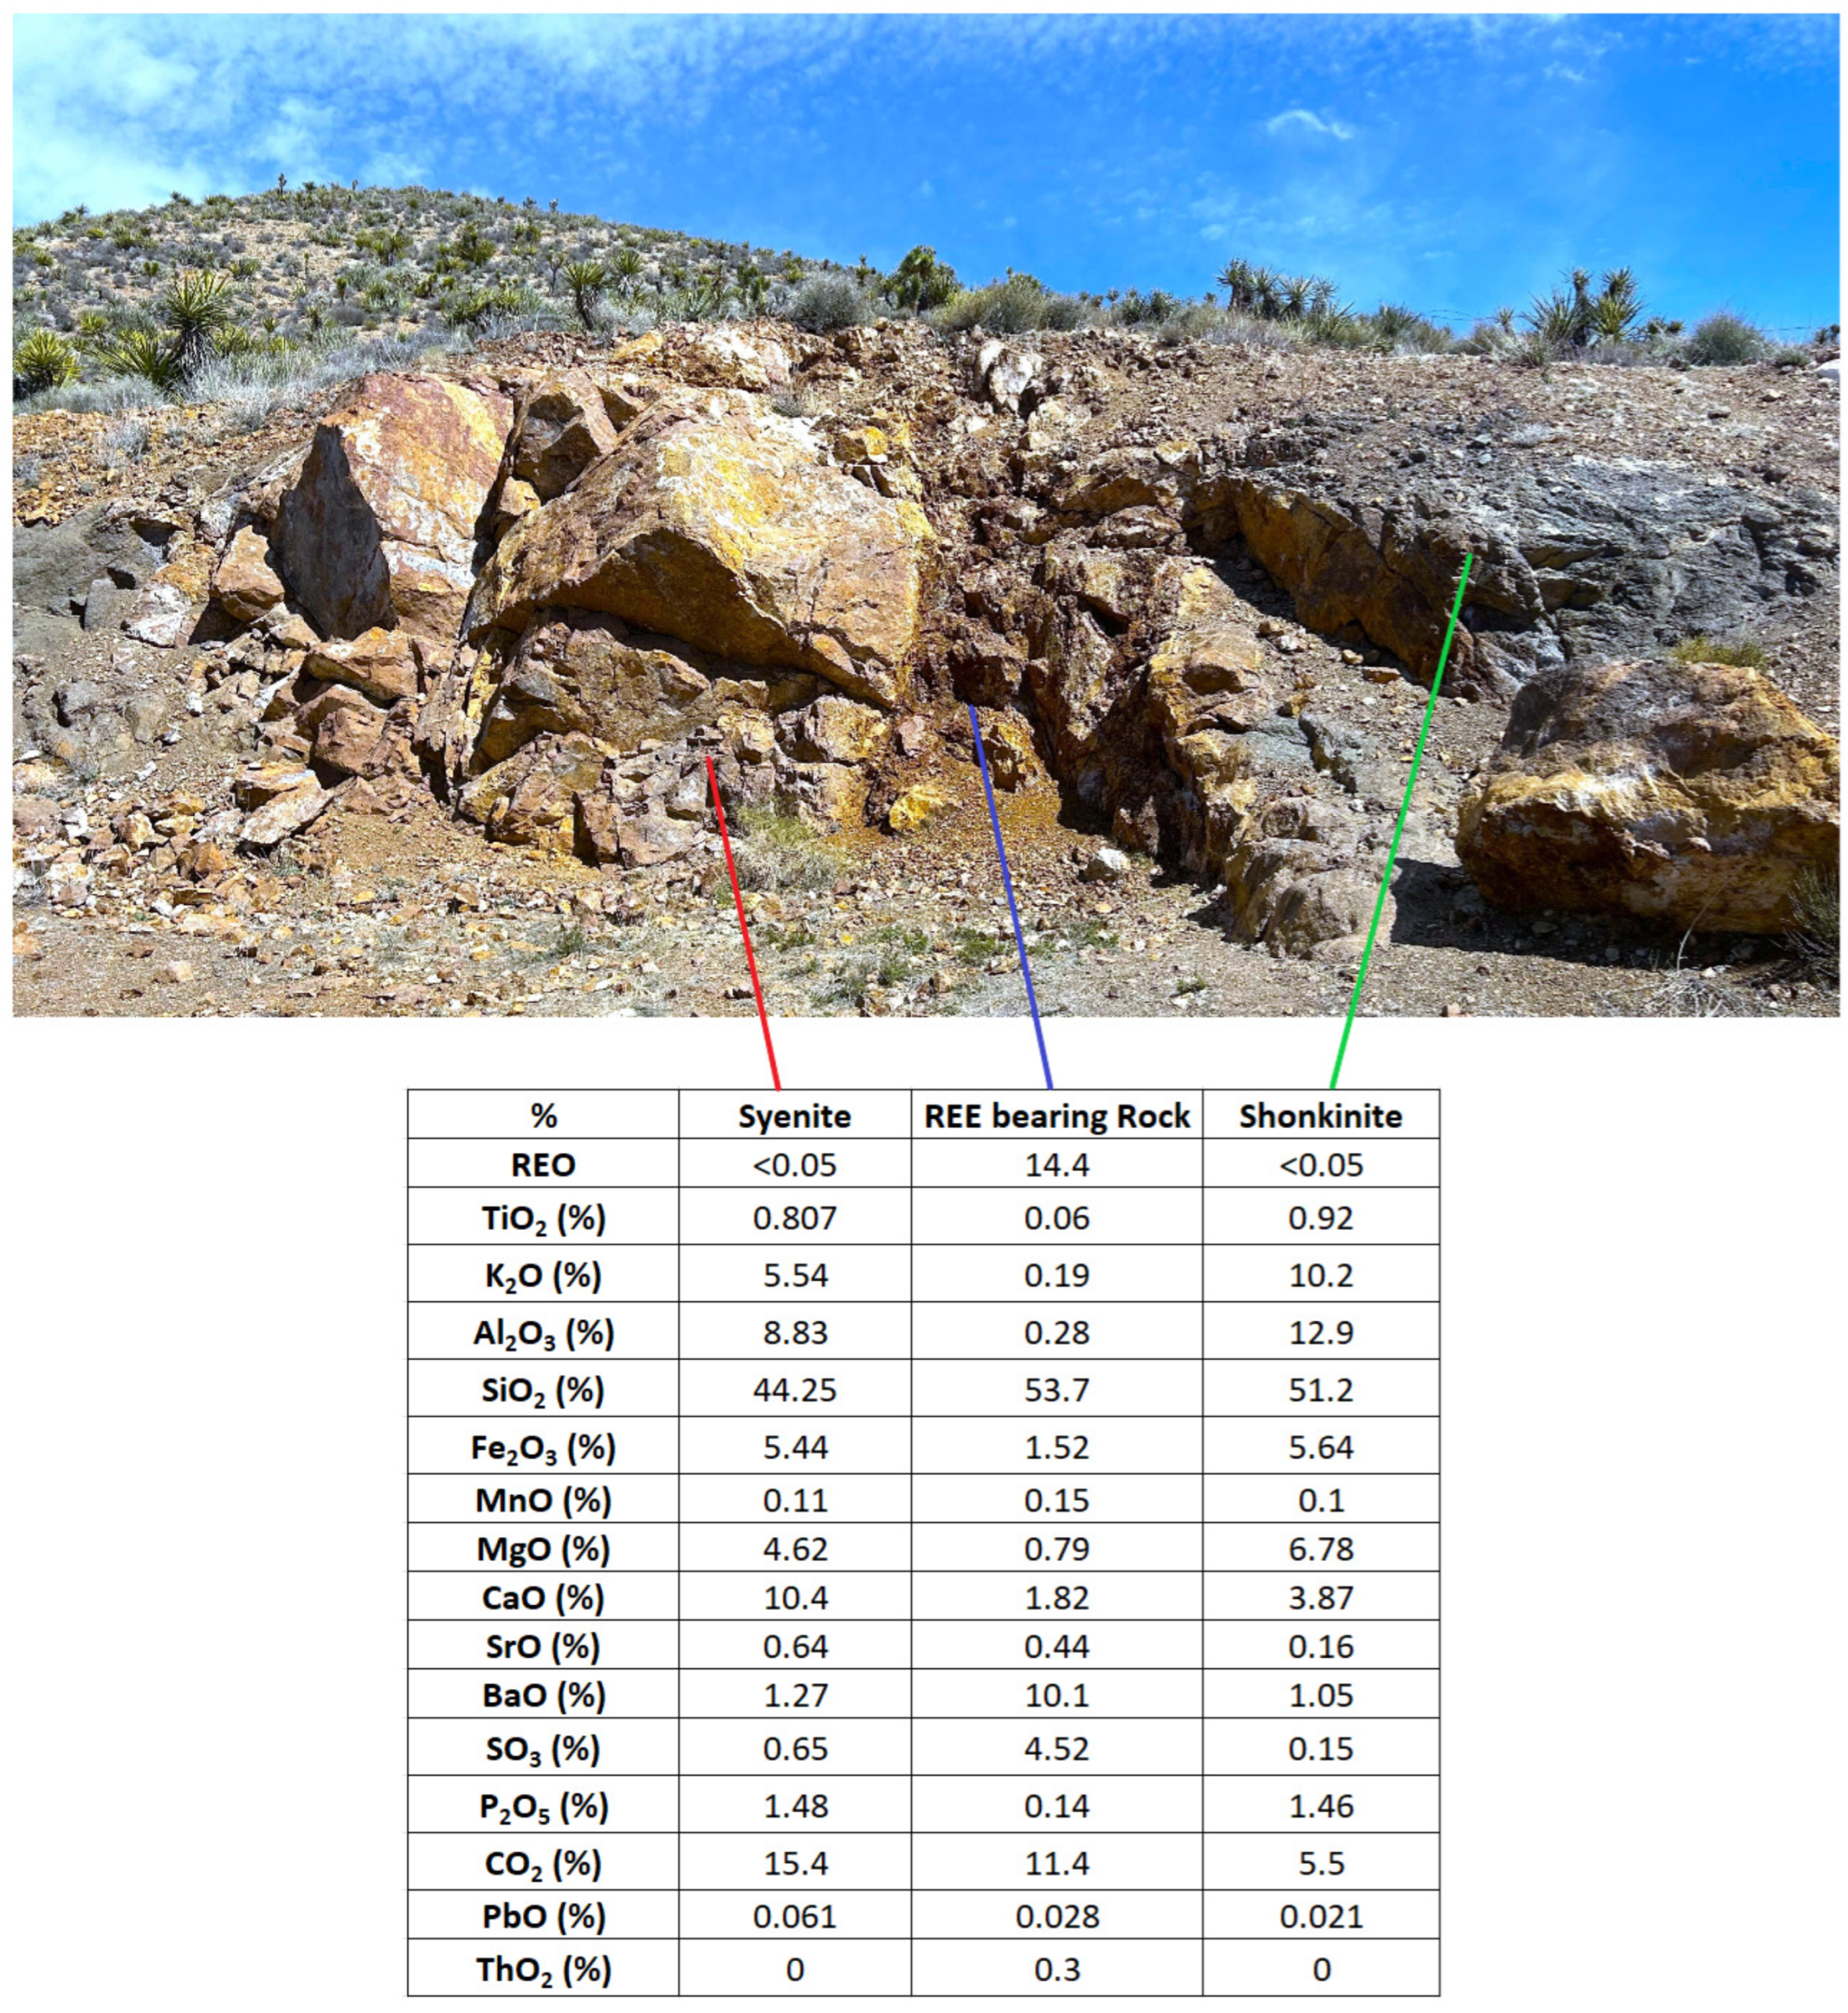
4.5. Published Geochemical Results

Numerous prior investigations have conducted geochemical analyses on the rocks of the Mountain Pass district [17,18,56,58,59,61]. The consensus from these studies is that syenite rocks contain lower REE concentrations than shonkinite. This finding contradicts the remote sensing results from our research, which indicate some REEs (probably bastnaesite) in syenite. Watts et al. [18] performed geochemical analyses on shonkinite and syenite samples in the Mountain Pass district, including the Birthday shonkinite stock. Their syenite sample is approximately 800 m west of the Birthday site. This sample displayed Ce concentration of 214 ppm and Nd concentration of 72 ppm, both of which are lower than those found in all seven shonkinite samples collected from the study area that includes the Birthday site and five other sites in the district, with one shonkinite sample displaying Ce and Nd concentrations of 996 ppm and 440 ppm, respectively.

5. Discussion

Upon comparing our results with those of previous studies, two potential inferences emerge that warrant further investigation:
  • The Ce and Nd concentrations in shonkinite samples may be consistently higher throughout the district, except for the Birthday shonkinite stock.
  • The only syenite sample we used for hyperspectral analysis may exhibit anomalously high concentrations of Ce and Nd. Therefore, additional syenite samples should be collected and tested to confirm this observation.
Nonetheless, the geochemical results of the carbonatite rocks, both in the Birthday shonkinite stock and the Sulphide Queen mine pit, confirm higher concentrations of the REEs in them. MP Materials reports similar geochemical results (Figure 16).
The results from the BI, the Birthday shonkinite stock, and the Sulphide Queen mine raise relevant geological questions, particularly about the index’s performance on altered rocks. Two samples, 24MP-02 and 24MP-53 (Figure 12), are highly altered rocks. The carbonatite deposit of the Sulphide Queen mine demonstrates genetic associations with the alkaline igneous plutons, which originated approximately 1.4 billion years ago [56]. However, the present powdery state of the rock signifies a substantial degree of alteration. The successful and efficient detection of REEs in the carbonatite using the BI suggests that this index is effective on altered rocks, provided the REEs are not mobilized during the alteration process. Thin-section analysis shows that most of the rocks have undergone significant weathering and alteration (Figure 17).
The one exception to this is the basnaestite, which is not altered. In the case of the syenite containing REEs, it is noteworthy that areas with sericite alteration coincide with slight enrichments of REE. It is important to note that despite this weathering, the results obtained remain reliable as bastnaesite is not altered. This further emphasizes the robustness of the BI in detecting REEs, even in highly altered rock samples. We recommend further testing the index on carbonatites from other deposits and under different alteration conditions to validate the BI’s effectiveness and reliability.

6. Conclusions

Our study evaluated the effectiveness of the BI when applied to higher spatial resolution hyperspectral data acquired via multiple platforms. Our primary objective was to map the relative concentration of bastnaesite within the carbonatite rocks of the Mountain Pass District using the hyperspectral data acquired at different scales and understand the carbonatite genesis and its REE potential.
The BI was applied to processed hyperspectral images to produce bastnaesite distribution maps, revealing the quantitative distribution of bastnaesite within the carbonatite dykes of both the Birthday shonkinite stock and the Sulphide Queen mine pit. The distribution maps produced promising results when cross-referenced with the results of geochemical analyses conducted by MP Materials and previous researchers and the results of ASD spectroradiometer analysis. The bastnaesite distribution maps of the Birthday shonkinite stock depict the distribution of bastnaesite within the carbonatite dykes of both the Birthday shonkinite stock and the Sulphide Queen mine pit.
The distribution maps, when cross-verified with the results of geochemical analyses conducted by MP Materials and previous researchers and the results of close-range laboratory-based hyperspectral studies of the rock samples collected from the study area, yielded promising outcomes. These results were further verified using the ASD spectroradiometer study of the collected rock samples. The bastnaesite maps indicated that the highest concentration of REEs is in the center of the carbonatite, with lower concentrations towards the contact with the host rock. Syenite rock hosts small and scattered REE-rich patches, suggesting that REE-rich fluids infiltrated and crystallized in the country rock’s fractures during the carbonatite intrusion. The shonkinite stock, which hosts both the syenite and the carbonatite, exhibits REE concentrations low enough to be detectable by remote sensing studies.
In summary, our findings demonstrate that the BI efficiently and remotely maps bastnaesite concentrations, providing valuable insights into the genesis of the carbonatite rocks. Furthermore, our streamlined workflow, leveraging drone-mounted hyperspectral cameras, demonstrates simplicity and effectiveness in acquiring and processing hyperspectral data to explore remotely the potential of rocks for critical minerals, especially the REEs. This advancement will significantly aid mining corporations in executing informed decision-making processes, conducting efficient explorations, and achieving substantial time, budget, and energy savings.

Author Contributions

Conceptualization, M.Q., S.D.K.; methodology, M.Q., S.D.K., V.S.; software, M.Q., S.D.K., U.O.; validation, M.Q., S.D.K., and V.S.; resources, S.D.K., L.X., N.F.; data curation, M.Q., S.D.K., V.S., L.X., N.F., P.G.; writing—original draft preparation, M.Q.; writing—review and editing, S.D.K., V.S., L.X., N.F.; supervision, S.D.K.; project administration, S.D.K. All authors have read and agreed to the published version of the manuscript.

Funding

Part of this work was funded by the ACS PRF (PRF# 66708-ND8) grant to S. D. Khan.

Data Availability Statement

Data can be requested by emailing the corresponding author.

Acknowledgments

We are grateful to MP Material for granting us permission to conduct fieldwork. Muhammad Qasim expresses gratitude to Otto Gadea and Jiajia Sun for their assistance and insightful discussions. Alex Robinson is thanked for allowing us to use the petrographic microscope.

Conflicts of Interest

The authors declare no conflicts of interest.

References

  1. Balaram, V. Rare Earth Elements: A Review of Applications, Occurrence, Exploration, Analysis, Recycling, and Environmental Impact. Geosci. Front. 2019, 10, 1285–1303. [Google Scholar] [CrossRef]
  2. Charalampides, G.; Vatalis, K.I.; Apostoplos, B.; Ploutarch-Nikolas, B. Rare Earth Elements: Industrial Applications and Economic Dependency of Europe. Procedia Econ. Financ. 2015, 24, 126–135. [Google Scholar] [CrossRef]
  3. Atwood, D.A. The Rare Earth Elements: Fundamentals and Applications; John Wiley & Sons: Hoboken, NJ, USA, 2013; ISBN 9781118632635. [Google Scholar]
  4. Golroudbary, S.R.; Makarava, I.; Kraslawski, A.; Repo, E. Global Environmental Cost of Using Rare Earth Elements in Green Energy Technologies. Sci. Total Environ. 2022, 832, 155022. [Google Scholar] [CrossRef] [PubMed]
  5. Smith Stegen, K. Heavy Rare Earths, Permanent Magnets, and Renewable Energies: An Imminent Crisis. Energy Policy 2015, 79, 1–8. [Google Scholar] [CrossRef]
  6. Humphries, M. Rare Earth Elements: The Global Supply Chain; DIANE Publishing: Darby, PA, USA, 2010; ISBN 9781437937985. [Google Scholar]
  7. Dent, P.C. Rare Earth Elements and Permanent Magnets (Invited). J. Appl. Phys. 2012, 111, 07A721. [Google Scholar] [CrossRef]
  8. Croat, J.J. Current Status and Future Outlook for Bonded Neodymium Permanent Magnets (Invited). J. Appl. Phys. 1997, 81, 4804–4809. [Google Scholar] [CrossRef]
  9. Grasso, V.B. Rare Earth Elements in National Defense: Background, Oversight Issues, and Options for Congress; Congressional Research Service: Washington, DC, USA, 2011.
  10. Gholz, E. Rare Earth Elements and National Security; JSTOR: New York, NY, USA, 2014. [Google Scholar]
  11. Daigle, B.; DeCarlo, S. Rare Earths and the US Electronics Sector: Supply Chain Developments and Trends; Office of Industries, US International Trade Commission: Washington, DC, USA, 2021.
  12. Chen, W.-Q.; Eckelman, M.J.; Sprecher, B.; Chen, W.; Wang, P. Interdependence in Rare Earth Element Supply between China and the United States Helps Stabilize Global Supply Chains. One Earth 2024, 7, 242–252. [Google Scholar] [CrossRef]
  13. Wang, P.; Yang, Y.-Y.; Heidrich, O.; Chen, L.-Y.; Chen, L.-H.; Fishman, T.; Chen, W.-Q. Regional Rare-Earth Element Supply and Demand Balanced with Circular Economy Strategies. Nat. Geosci. 2024, 17, 94–102. [Google Scholar] [CrossRef]
  14. Yang, J.; Song, W.; Liu, Y.; Zhu, X.; Kynicky, J.; Chen, Q. Mineralogy and Element Geochemistry of the Bayan Obo (China) Carbonatite Dykes: Implications for REE Mineralization. Ore Geol. Rev. 2024, 165, 105873. [Google Scholar] [CrossRef]
  15. Olson, J.C. Geologic Setting of the Mountain Pass Rare Earth Deposits, San Bernardino County, California. US Geol. Surv. Open File Rep. 1952, 52–110, 109. [Google Scholar] [CrossRef]
  16. Mariano, A.N.; Mariano, A. Rare Earth Mining and Exploration in North America. Elements 2012, 8, 369–376. [Google Scholar] [CrossRef]
  17. Poletti, J.E.; Cottle, J.M.; Hagen-Peter, G.A.; Lackey, J.S. Petrochronological Constraints on the Origin of the Mountain Pass Ultrapotassic and Carbonatite Intrusive Suite, California. J. Petrol. 2016, 57, 1555–1598. [Google Scholar] [CrossRef]
  18. Watts, K.E.; Haxel, G.B.; Miller, D.M. Temporal and Petrogenetic Links Between Mesoproterozoic Alkaline and Carbonatite Magmas at Mountain Pass, California. Econ. Geol. 2022, 117, 1–23. [Google Scholar] [CrossRef]
  19. Dushyantha, N.; Batapola, N.; Ilankoon, I.M.S.K.; Rohitha, S.; Premasiri, R.; Abeysinghe, B.; Ratnayake, N.; Dissanayake, K. The Story of Rare Earth Elements (REEs): Occurrences, Global Distribution, Genesis, Geology, Mineralogy and Global Production. Ore Geol. Rev. 2020, 122, 103521. [Google Scholar] [CrossRef]
  20. Dutta, T.; Kim, K.-H.; Uchimiya, M.; Kwon, E.E.; Jeon, B.-H.; Deep, A.; Yun, S.-T. Global Demand for Rare Earth Resources and Strategies for Green Mining. Environ. Res. 2016, 150, 182–190. [Google Scholar] [CrossRef] [PubMed]
  21. Edahbi, M.; Plante, B.; Benzaazoua, M. Environmental Challenges and Identification of the Knowledge Gaps Associated with REE Mine Wastes Management. J. Clean. Prod. 2019, 212, 1232–1241. [Google Scholar] [CrossRef]
  22. Haque, N.; Hughes, A.; Lim, S.; Vernon, C. Rare Earth Elements: Overview of Mining, Mineralogy, Uses, Sustainability and Environmental Impact. Resources 2014, 3, 614–635. [Google Scholar] [CrossRef]
  23. Zhang, X.; Pazner, M.; Duke, N. Lithologic and Mineral Information Extraction for Gold Exploration Using ASTER Data in the South Chocolate Mountains (California). ISPRS J. Photogramm. Remote Sens. 2007, 62, 271–282. [Google Scholar] [CrossRef]
  24. Battsengel, A.; Batnasan, A.; Narankhuu, A.; Haga, K.; Watanabe, Y.; Shibayama, A. Recovery of Light and Heavy Rare Earth Elements from Apatite Ore Using Sulphuric Acid Leaching, Solvent Extraction and Precipitation. Hydrometallurgy 2018, 179, 100–109. [Google Scholar] [CrossRef]
  25. Xu, T.; Zheng, X.; Ji, B.; Xu, Z.; Bao, S.; Zhang, X.; Li, G.; Mei, J.; Li, Z. Green Recovery of Rare Earth Elements under Sustainability and Low Carbon: A Review of Current Challenges and Opportunities. Sep. Purif. Technol. 2024, 330, 125501. [Google Scholar] [CrossRef]
  26. Fassnacht, F.E.; White, J.C.; Wulder, M.A.; Næsset, E. Remote Sensing in Forestry: Current Challenges, Considerations and Directions. Forestry 2023, 97, 11–37. [Google Scholar] [CrossRef]
  27. Ceccato, V.; Ioannidis, I. Using Remote Sensing Data in Urban Crime Analysis: A Systematic Review of English-Language Literature from 2003 to 2023. Int. Crim. Justice Rev. 2024, 10575677241237960. [Google Scholar] [CrossRef]
  28. Fu, L.-L.; Pavelsky, T.; Cretaux, J.-F.; Morrow, R.; Farrar, J.T.; Vaze, P.; Sengenes, P.; Vinogradova-Shiffer, N.; Sylvestre-Baron, A.; Picot, N.; et al. The Surface Water and Ocean Topography Mission: A Breakthrough in Radar Remote Sensing of the Ocean and Land Surface Water. Geophys. Res. Lett. 2024, 51, e2023GL107652. [Google Scholar] [CrossRef]
  29. Chen, W.; Li, X.; Qin, X.; Wang, L. Geological Remote Sensing: An Overview. In Remote Sensing Intelligent Interpretation for Geology: From Perspective of Geological Exploration; Chen, W., Li, X., Qin, X., Wang, L., Eds.; Springer: Singapore, 2024; pp. 1–14. ISBN 9789819989973. [Google Scholar]
  30. Lausch, A.; Selsam, P.; Pause, M.; Bumberger, J. Monitoring Vegetation- and Geodiversity with Remote Sensing and Traits. Philos. Trans. A Math. Phys. Eng. Sci. 2024, 382, 20230058. [Google Scholar] [CrossRef] [PubMed]
  31. Schilling, S.; Dietz, A.; Kuenzer, C. Snow Water Equivalent Monitoring—A Review of Large-Scale Remote Sensing Applications. Remote Sens. 2024, 16, 1085. [Google Scholar] [CrossRef]
  32. Peyghambari, S.; Zhang, Y. Hyperspectral Remote Sensing in Lithological Mapping, Mineral Exploration, and Environmental Geology: An Updated Review. J. Appl. Remote. Sens. 2021, 15, 031501. [Google Scholar] [CrossRef]
  33. Sabins, F.F. Remote Sensing for Mineral Exploration. Ore Geol. Rev. 1999, 14, 157–183. [Google Scholar] [CrossRef]
  34. Cudjoe, M.N.M.; Kwarteng, E.V.S.; Anning, E.; Bodunrin, I.R.; Andam-Akorful, S.A. Application of Remote Sensing and Geographic Information System Technologies to Assess the Impact of Mining: A Case Study at Emalahleni. NATO Adv. Sci. Inst. Ser. E Appl. Sci. 2024, 14, 1739. [Google Scholar] [CrossRef]
  35. Wang, Q.; Guo, H.; Chen, Y.; Lin, Q.; Li, H. Application of Remote Sensing for Investigating Mining Geological Hazards. Int. J. Digit. Earth 2013, 6, 449–468. [Google Scholar] [CrossRef]
  36. Pour, A.B.; Zoheir, B.; Pradhan, B.; Hashim, M. Editorial for the Special Issue: Multispectral and Hyperspectral Remote Sensing Data for Mineral Exploration and Environmental Monitoring of Mined Areas. Remote Sens. 2021, 13, 519. [Google Scholar] [CrossRef]
  37. Boesche, N.K.; Rogass, C.; Lubitz, C.; Brell, M.; Herrmann, S.; Mielke, C.; Tonn, S.; Appelt, O.; Altenberger, U.; Kaufmann, H. Hyperspectral REE (Rare Earth Element) Mapping of Outcrops-Applications for Neodymium Detection. Remote Sens. 2015, 7, 5160–5186. [Google Scholar] [CrossRef]
  38. Rowan, L.C.; Kingston, M.J.; Crowley, J.K. Spectral Reflectance of Carbonatites and Related Alkalic Igneous Rocks; Selected Samples from Four North American Localities. Econ. Geol. 1986, 81, 857–871. [Google Scholar] [CrossRef]
  39. Neave, D.A.; Black, M.; Riley, T.R.; Gibson, S.A.; Ferrier, G.; Wall, F.; Broom-Fendley, S. On the Feasibility of Imaging Carbonatite-Hosted Rare Earth Element Deposits Using Remote Sensing. Econ. Geol. 2016, 111, 641–665. [Google Scholar] [CrossRef]
  40. Tran, T.V.; Reef, R.; Zhu, X. A Review of Spectral Indices for Mangrove Remote Sensing. Remote Sens. 2022, 14, 4868. [Google Scholar] [CrossRef]
  41. Xue, J.; Su, B. Significant Remote Sensing Vegetation Indices: A Review of Developments and Applications. J. Sens. 2017, 2017, 1353691. [Google Scholar] [CrossRef]
  42. Radočaj, D.; Šiljeg, A.; Marinović, R.; Jurišić, M. State of Major Vegetation Indices in Precision Agriculture Studies Indexed in Web of Science: A Review. Agriculture 2023, 13, 707. [Google Scholar] [CrossRef]
  43. Prasad, A.D.; Ganasala, P.; Hernández-Guzmán, R.; Fathian, F. Remote Sensing Satellite Data and Spectral Indices: An Initial Evaluation for the Sustainable Development of an Urban Area. Sustain. Water Resour. Manag. 2022, 8, 19. [Google Scholar] [CrossRef]
  44. Ousmanou, S.; Fozing, E.M.; Kwékam, M.; Fodoue, Y.; Jeatsa, L.D.A. Application of Remote Sensing Techniques in Lithological and Mineral Exploration: Discrimination of Granitoids Bearing Iron and Corundum Deposits in Southeastern Banyo, Adamawa Region-Cameroon. Earth Sci. Inform. 2023, 16, 259–285. [Google Scholar] [CrossRef]
  45. Michałowska, K.; Pirowski, T.; Głowienka, E.; Szypuła, B.; Malinverni, E.S. Sustainable Monitoring of Mining Activities: Decision-Making Model Using Spectral Indexes. Remote Sens. 2024, 16, 388. [Google Scholar] [CrossRef]
  46. Montero, D.; Aybar, C.; Mahecha, M.D.; Martinuzzi, F.; Söchting, M.; Wieneke, S. A Standardized Catalogue of Spectral Indices to Advance the Use of Remote Sensing in Earth System Research. Sci. Data 2023, 10, 197. [Google Scholar] [CrossRef]
  47. Verstraete, M.M.; Pinty, B. Designing Optimal Spectral Indexes for Remote Sensing Applications. IEEE Trans. Geosci. Remote Sens. 1996, 34, 1254–1265. [Google Scholar] [CrossRef]
  48. Gadea, O.C.A.; Khan, S.D. Detection of Bastnäsite-Rich Veins in Rare Earth Element Ores Through Hyperspectral Imaging. IEEE Geosci. Remote Sens. Lett. 2023, 20, 1–4. [Google Scholar] [CrossRef]
  49. Gadea, O.; Khan, S.; Sisson, V. Estimating Rare Earth Elements at Various Scales with Bastnaesite Indices from Mountain Pass. Ore Geol. Rev. under review.
  50. Olson, J.C.; Shawe, D.R.; Pray, L.C.; Sharp, W.N. Rare-Earth Mineral Deposits of the Mountain Pass District, San Bernardino County, California. Science 1954, 119, 325–326. [Google Scholar] [CrossRef]
  51. Bennett, V.C.; Depaolo, D.J. Proterozoic Crustal History of the Western United States as Determined by Neodymium Isotopic Mapping. GSA Bull. 1987, 99, 674–685. [Google Scholar] [CrossRef]
  52. Wooden, J.L.; Miller, D.M. Chronologic and Isotopic Framework for Early Proterozoic Crustal Evolution in the Eastern Mojave Desert Region, SE California. J. Geophys. Res. 1990, 95, 20133–20146. [Google Scholar] [CrossRef]
  53. Whitmeyer, S.J.; Karlstrom, K.E. Tectonic Model for the Proterozoic Growth of North America. Geosphere 2007, 3, 220–259. [Google Scholar] [CrossRef]
  54. Multidisciplinary Investigations of REE Mineralization at Mountain Pass and in the Southeast Mojave Desert, California. Available online: https://www.usgs.gov/centers/gmeg/science/multidisciplinary-investigations-ree-mineralization-mountain-pass-and#overview (accessed on 27 August 2024).
  55. Denton, K.M.; Ponce, D.A.; Peacock, J.R.; Miller, D.M. Geophysical Characterization of a Proterozoic REE Terrane at Mountain Pass, Eastern Mojave Desert, California, USA. Geosphere 2020, 16, 456–471. [Google Scholar] [CrossRef]
  56. Castor, S.B. The Mountain Pass Rare-Earth Carbonatite and Associated Ultrapotassic Rocks, California. Can. Mineral. 2008, 46, 779–806. [Google Scholar] [CrossRef]
  57. Haxel, G. Ultrapotassic Mafic Dikes and Rare Earth Element- and Barium-Rich Carbonatite at Mountain Pass, Mojave Desert, Southern California: Summary and Field Trip Localities; US Geological Survey: Reston, VA, USA, 2005. [CrossRef]
  58. Watts, K.E.; Miller, D.M.; Ponce, D.A. Mafic Alkaline Magmatism and Rare Earth Element Mineralization in the Mojave Desert, California: The Bobcat Hills Connection to Mountain Pass. Geochem. Geophys. Geosyst. 2024, 25, e2023GC011253. [Google Scholar] [CrossRef]
  59. Verplanck, P.L.; Hitzman, M.W. Introduction: Rare Earth and Critical Elements in Ore Deposits; Society of Economic Geologists, Inc.: Littleton, CO, USA, 2016. [Google Scholar] [CrossRef]
  60. Verplanck, P.L.; Mariano, A.N.; Mariano, A. Rare Earth Element Ore Geology of Carbonatites; GeoScienceWorld: McLean, VA, USA, 2016. [Google Scholar] [CrossRef]
  61. Long, K.R.; Van Gosen, B.S.; Foley, N.K.; Cordier, D. The Principal Rare Earth Elements Deposits of the United States: A Summary of Domestic Deposits and a Global Perspective. In Non-Renewable Resource Issues: Geoscientific and Societal Challenges; Sinding-Larsen, R., Wellmer, F.-W., Eds.; Springer: Dordrecht, The Netherlands, 2012; pp. 131–155. ISBN 9789048186792. [Google Scholar]
  62. HSC-2 Hyperspectral Camera 450–800 nm. Available online: https://senop.fi/product/hsc-2-hyperspectral-camera-450-800nm/ (accessed on 18 August 2024).
  63. Products SPECIM. Available online: https://www.specim.com/products/ (accessed on 18 August 2024).
  64. Buy Matrice 600 Pro—DJI Store. Available online: https://store.dji.com/product/matrice-600-pro (accessed on 18 August 2024).
  65. Matrice 300 RTK—Industrial Grade Mapping Inspection Drones—DJI Enterprise. Available online: https://enterprise.dji.com/matrice-300 (accessed on 2 September 2024).
  66. Support for Zenmuse L1. Available online: https://www.dji.com/support/product/zenmuse-l1 (accessed on 2 September 2024).
  67. End-to-End 3D Drone Mapping Software. Available online: https://www.esri.com/en-us/cp/site-scan-for-arcgis-3d-drone-mapping-software/overview (accessed on 2 September 2024).
  68. Mavic 3 Multispectral Edition—See More, Work Smarter—DJI Agricultural Drones. Available online: https://ag.dji.com/mavic-3-m (accessed on 18 August 2024).
  69. ASD FieldSpec 4—High Resolution Spectroradiometer. Available online: http://www.malvernpanalytical.com/en/products/product-range/asd-range/fieldspec-range/fieldspec4-hi-res-high-resolution-spectroradiometer (accessed on 18 August 2024).
  70. Di Gennaro, S.F.; Toscano, P.; Gatti, M.; Poni, S.; Berton, A.; Matese, A. Spectral Comparison of DRONE-Based Hyper and Multispectral Cameras for Precision Viticulture. Remote Sens. 2022, 14, 449. [Google Scholar] [CrossRef]
  71. Sousa, J.J.; Toscano, P.; Matese, A.; Di Gennaro, S.F.; Berton, A.; Gatti, M.; Poni, S.; Pádua, L.; Hruška, J.; Morais, R.; et al. UAV-Based Hyperspectral Monitoring Using Push-Broom and Snapshot Sensors: A Multisite Assessment for Precision Viticulture Applications. Sensors 2022, 22, 6574. [Google Scholar] [CrossRef] [PubMed]
  72. Geospatial Solutions. Available online: https://www.nv5geospatialsoftware.com/Solutions/ENVI (accessed on 18 August 2024).
  73. Desktop GIS Software. Available online: https://www.esri.com/en-us/arcgis/products/arcgis-pro/overview (accessed on 18 August 2024).
Figure 1. Spectral profile of the neodymium in the VNIR part of the electromagnetic spectrum showing the four diagnostic absorption features. The troughs (T) of the absorption features and the peaks (P) or shoulders of these troughs are labeled. These peaks and troughs are used in the bastnaesite index used in this study. The spectrum is extracted from the acquired hyperspectral data using Senop and validated with the reference spectra of Nd available in the spectral libraries of USGS.
Remotesensing 16 03353 g001
Figure 2. A geological map of a part of the Mountain Pass District showing the generalized geology and the study areas, i.e., Birthday shonkinite stock and Sulphide Queen mine pit (map taken from [50,54]). The star in the inset map shows the study area.
Remotesensing 16 03353 g002
Figure 3. The Sulphide Queen mine pit with the white carbonatite stock (shown with arrow) that we targeted in the drone-based hyperspectral imaging.
Remotesensing 16 03353 g003
Figure 4. The Birthday shonkinite stock 800 m north of the Sulphide Queen mine pit, imaged with the Tripod–Senop system targeting the vertical carbonatite dike (shown in red arrow) intruding into the syenite stocks.
Remotesensing 16 03353 g004
Figure 5. A generalized workflow showing methods and tools used in this study.
Remotesensing 16 03353 g005
Figure 6. Drones used in the study: (a) DJI M600 with the Senop HSC-2 hyperspectral camera onboard; (b) DJI M300 with Zenmuse L1 lidar camera onboard; (c) DJI Mavic M3 Multispectral.
Remotesensing 16 03353 g006
Figure 7. (a) Senop HSC-2 hyperspectral camera with different connectors displayed; (b) the optics of HSC-2 camera based on the Fabry–Perot Interferometer (modified after [70]); (c) the spectral profile of the bastnaesite mineral extracted from the hyperspectral data collected using the Senop HSC-2 camera mounted on the drones, showing the data gap produced between 628 nm and 658 nm.
Remotesensing 16 03353 g007
Figure 8. (a) The SPECIM hyperspectral cameras mounted on a wall in the laboratory with samples placed on the moving stage; (b) The ASD spectroradiometer FieldSpec Pro FR and contact probe carrying halogen light source.
Remotesensing 16 03353 g008
Figure 9. (a) The mosaic of seven individual hyperspectral images of the Birthday shonkinite site captured by the Senop camera mounted on a tripod placed at about 30 m away from the outcrop; (b) the bastnaesite distribution map obtained by applying the bastnaesite index to the processed hyperspectral data showing higher concentrations of the bastnaesite in the carbonatite dyke which is intruded into the syenite stocks.
Remotesensing 16 03353 g009
Figure 10. One of the thirty-four hyperspectral images of the Sulphide Queen mine pit captured by the Senop HSC-2 camera onboard the DJI M600 Pro. Some of the collected images had a bad line resulting from the malfunctioning of the detectors in the sensor: (a) unregistered frames of the picture showing the displacement of the rocks in each frame due to the unstable drone platform of the camera; (b) registered frames of the image with the translational/rotational displacements of the frames removed and aligning the rock units captured in each frame.
Remotesensing 16 03353 g010
Figure 11. Senop hyperspectral data of the mine pit acquired via the Senop hyperspectral camera mounted on a DJI M600 Pro: (a) The mosaic of thirty-four hyperspectral images, with the high-resolution RGB orthomosaic in the background, partially covering the “white” carbonatite in the northwest corner of the Sulphide Queen mine pit; (b) BI applied to some of the individual images to map the bastnaesite concentration in the rocks of the mine pit. The highest concentration of bastnaesite is in the “white” and “black” carbonatites.
Remotesensing 16 03353 g011
Figure 12. The VNIR spectra were extracted from the hyperspectral data captured by drone-mounted Senop hyperspectral camera (a,c) and the laboratory-based wall-mounted SPECIM hyperspectral camera (b,d). The deeper absorption features of the bastnaesite in the spectra shown in (a,b) reflect the areas in the hyperspectral images where the bastnaesite concentration is higher as compared to the other area where the spectrum shows the shallower absorption features of the mineral (c,d).
Remotesensing 16 03353 g012
Figure 13. SPECIM hyperspectral image (ah) and the respective bastnaesite distribution maps (ip) obtained via the application of BI on the SPECIM hyperspectral images: (a) white carbonatite (24MP-02); (b) carbonatite (24MP-53); (c) carbonatite (24MP-52a); (d) carbonatite (24MP-50) from the contact of carbonatite dyke and syenite rock; (e) syenite (24MP-58); (f) shonkinite (24MP-45); (g) carbonatite (24MP-52b); (h) black carbonatite (24MP-09). The annotations (x) on some samples are the areas of potentially high concentrations (H), medium concentration (M), and low concentration (L) of bastnaesite where the ASD spectroradiometer data (shown in Figure 14) has been collected. Samples lacking annotations exhibit ASD spectral profiles similar to those with annotations, albeit with subtle variations in the depths of the bastnaesite absorption features.
Remotesensing 16 03353 g013
Figure 14. ASD spectral data of the low concentration (_L) bastnaesite areas, medium concentration (_M) bastnaesite areas, and high concentration (_H) bastnaesite areas (annotated in Figure 13) of some of the rock samples: (a) white carbonatite (24MP-02); (b) carbonatite (24MP-53); (c) carbonatite (24MP-52a); (d) syenite (24MP-58); (e) shonkinite (24MP-45); (f) black carbonatite (24MP-09). At wavelengths of ~570 nm, ~745 nm, ~800 nm, and ~860 nm, the absorption features in the spectral profiles of low-concentration areas are either absent or shallower as compared to those in the spectral profiles of the high-concentration areas.
Remotesensing 16 03353 g014
Figure 15. ASD spectral profiles of the points in all the rock samples where the bastnaesite concentrations are potentially high (as shown in Figure 13). The deepest absorption features observed in the white carbonatite sample (24MP-02) reflect that the sample has the relatively highest bastnaesite concentration of all samples.
Remotesensing 16 03353 g015
Figure 16. The results of geochemical analysis of the Birthday shonkinite stock bodies performed by MP Materials (unpublished).
Remotesensing 16 03353 g016
Figure 17. Cross-polarized photomicrographs of the 6 samples: Amp—amphibole, Bsn—basnaesite, Cc—calcite, Fsp—feldspar, Qz—Quartz: (a) Sample 24MP50 Carbonatite; (b) Sample 24MP52 Carbonatite; (c) Sample 24MP52 Carbonatite with a quartz vein; (d) Sample 24MP52 Carbonatite Contact; (e) Sample 24MP09 Black Carbonatite; (f) Sample 24MP58 Syenite.
Remotesensing 16 03353 g017
Table 1. Specifications of the Senop HSC-2 hyperspectral camera.
FeatureValueFeatureValue
Camera weight990 gField of View36.8°
Camera size (L × W × H)199.5 × 130.9 × 97.2 mmSpectral range500–900 nm
Storage capacity1 TB (built-in hard drive)Spectral bandsUp to 1000 bands
Image frame size1024 × 1024 pixelsFWHM bandwidth15 nm, 20 nm, 25 nm
GPSIntegrated in cameraFrame rate12-bit, 10-bit
Disclaimer/Publisher’s Note: The statements, opinions and data contained in all publications are solely those of the individual author(s) and contributor(s) and not of MDPI and/or the editor(s). MDPI and/or the editor(s) disclaim responsibility for any injury to people or property resulting from any ideas, methods, instructions or products referred to in the content.

