Article

Identifying Determinants of Spatiotemporal Disparities in Ecological Quality of Mongolian Plateau

1
School of Land Science and Technology, China University of Geosciences (Beijing), Beijing 100083, China
2
School of Mining and Coal, Inner Mongolia University of Science and Technology, Baotou 014010, China
3
School of Design and the Built Environment, Curtin University, Perth 6102, Australia
4
School of Electrical Engineering, Computing and Mathematical Sciences, Curtin University, Perth 6845, Australia
5
Chair of Cartography and Visual Analytics, Technical University of Munich, 80333 Munich, Germany
6
College of Earth and Environmental Sciences, Lanzhou University, Lanzhou 730000, China
7
Spatial Sciences Discipline, School of Earth and Planetary Sciences, Curtin University, Perth 6102, Australia
*
Author to whom correspondence should be addressed.
Remote Sens. 2024, 16(18), 3385; https://doi.org/10.3390/rs16183385
Submission received: 18 July 2024 / Revised: 24 August 2024 / Accepted: 10 September 2024 / Published: 12 September 2024
(This article belongs to the Section Earth Observation Data)

Abstract

:
Vegetation quality is crucial for maintaining ecological health, and remote sensing techniques offer precise assessments of vegetation’s environmental quality. Although existing indicators and remote sensing approaches provide extensive spatial coverage, challenges remain in effectively integrating diverse indicators for a comprehensive evaluation. This study introduces a comprehensive ecological quality index (EQI) to assess vegetation quality on the Mongolian Plateau from 2001 to 2020 and to identify the determinants of EQI variations over space and time. We developed the EQI using remotely sensed normalized difference vegetation index (NDVI) data and the net primary productivity (NPP). Our analysis revealed distinct spatial patterns, with high ecological quality concentrated in northern Mongolia and eastern Inner Mongolia. Temporal fluctuations, indicative of ecological shifts, were primarily observed in eastern Mongolia and specific zones of Inner Mongolia. We employed a Geographically Optimal Zones-based Heterogeneity (GOZH) model to analyze the spatial scales and interactions influencing EQI patterns. This study found that precipitation, with an Omega value of 0.770, was the dominant factor affecting the EQI, particularly at spatial scales of 40–50 km. The GOZH model provided deeper insights into the spatial determinants of the EQI compared with previous models, highlighting the importance of climatic variables and their interactions in driving ecological quality. This research enhanced our understanding of vegetation quality dynamics and established a foundation for ecosystem conservation and informed management strategies, emphasizing the critical role of climate, especially precipitation, in shaping ecological landscapes.

1. Introduction

Ecological quality encompasses the overall condition and resilience of ecosystems, with a particular focus on their capacity to sustain biodiversity, support life, and provide essential services such as clean air, water, and fertile soil [1,2]. The ecological quality index (EQI) is a crucial metric for evaluating the ability of natural environments to endure disturbances and maintain ecological functions [3]. Consequently, ecological quality is vital for environmental conservation, economic stability, and human well-being [4]. Maintaining high ecological quality is fundamental for sustainable development, as it balances human needs with preserving natural habitats [5]. Spatial and temporal analyses offer essential evidence for informed decision making to enhance ecosystems [6]. Such evidence can effectively guide direct restoration efforts, shape policies designed to preserve ecological security, and bolster the resilience of both urban and rural landscapes [7].
Methods for assessing ecological quality can be classified into three main categories: statistical trend analysis, spatial analysis models, and remote sensing-based indices. Statistical trend analysis methods, such as the Theil–Sen median and Mann–Kendall tests, provide a reliable framework for detecting and examining temporal variations in ecological quality [8]. In addition, spatial analysis models, such as geographically weighted regression [9], geographical detectors [10], and obstacle factor diagnosis models [11], allow for investigating spatial patterns and the factors which impact ecological quality in various regions. Finally, remote sensing-based indices utilize satellite imagery and advanced computing platforms such as Google Earth Engine to evaluate ecological conditions across large-scale regions [12]. These techniques provide comprehensive approaches to understanding environmental quality for sustainable ecosystem development.
The development of ecological indicators is crucial for the precise monitoring and management of ecological quality. Among these, vegetation serves as a critical indicator of ecosystem health, prompting the development and refinement of various methods to evaluate vegetation quality. In terrestrial ecosystems, vegetation forms the foundation and acts as a dynamic link connecting key environmental elements such as the atmosphere, water, biology, geology, and soil [13,14]. This complex system performs multiple essential functions, including carbon storage, water conservation, and climate response [15], thereby playing a crucial role in maintaining ecosystem balance. Human activities significantly influence vegetation ecological quality dynamics, with studies highlighting vegetation’s intricate interactions and the limitations of evaluations based solely on traditional indicators [16,17]. Consequently, understanding vegetation quality transcends academic interest and is fundamental for sustainable development, ecological management, and global change research.
While vegetation indicators and remote sensing techniques present innovative understandings, recent studies still face challenges in assessing and monitoring ecological quality indicators. One of the key challenges is the need for comprehensive environmental quality indicators. Many specific indicators primarily concentrate on vegetation coverage or a single aspect of the ecosystems. This needs to be revised as it overlooks the multidimensional nature of ecosystems and the need to adequately reflect ecological processes or the impacts of management actions. There is an urgent need for spatial determinant analysis which examines ecological quality comprehensively from a spatiotemporal perspective, including temporal variations and spatial heterogeneity [18]. The critical demand for analyzing spatial determinants of ecological indicators arises from the need to precisely capture the complex interactions and variability within ecosystems, identify nonlinear relationships and interactions, and thus improve the priority and efficiency of conservation efforts and predictive models for ecological quality. In particular, methods are increasingly required to more effectively identify the nonlinear relationships and interactions of spatial factors which affect ecological quality. Thus, comprehensive ecological quality assessment and spatiotemporal determinant analysis require improved methodologies and long-term evaluations of ecological quality.
The Mongolian Plateau, spanning parts of northern China and Mongolia, has diverse landscapes, including grasslands, deserts, and forests. This region is crucial for its unique biodiversity, significant carbon storage, and role in regional climate regulation. Over recent decades, the Mongolian Plateau has faced various environmental challenges, such as climate change, overgrazing, and land use changes, significantly impacting its ecological quality. Several studies have highlighted the importance of understanding the environmental dynamics of this region. One study analyzed the factors driving variations in net primary productivity across the ecological zones of the Mongolian Plateau, showing that both climatic conditions and human activities play a significant role in shaping ecosystem productivity [19]. A comprehensive survey using Landsat TM/OLI data effectively monitored environmental changes and managed natural resources while assessing the ecological and environmental quality of the Yellow River Basin in Inner Mongolia [20]. In addition, studies have identified five critical issues impacting the sustainability of social-ecological systems on the Mongolian Plateau: climate change, land use change, socioeconomic transitions, institutional challenges, and the need for integrated management approaches [21].
This study employs a comprehensive EQI to evaluate vegetation ecological quality and a Geographically Optimal Zones-based Heterogeneity (GOZH) model to explore the EQI’s determinants and their temporal trends. This study systematically analyzes its environmental quality and potential determinants from 2001 to 2020 using remote sensing data and geospatial methods. The EQI integrates data from the remotely sensed NDVI and NPP [22,23]. Developing innovative geospatial models is essential for spatial statistical inference, such as examining factors and predicting spatial patterns [24,25,26]. GOZH is a practical approach developed based on spatial stratified heterogeneity which examines if geographical attributes within individual strata are similar or different from those between strata [27,28]. Spatial stratified heterogeneity is common in real-world scenarios. It provides insights into natural cause patterns, such as those modeled by the interactive detector for spatial associations (IDSA) [29] and the robust geographical detector (RGD) [30]. The Mongolian Plateau, with its distinct geographical and geomorphic attributes, is an essential ecological location, as highlighted by prior studies [31,32].

2. Study Area

This study aims to analyze the ecological systems of the Mongolian Plateau, which spans from approximately 37° N to 52° N latitude and from 97° E to 120° E longitude, encompassing both Mongolia and the Inner Mongolia Autonomous Region in China (Figure 1). This expansive region boasts diverse ecosystems and landscapes, covering approximately 74% of it, with forests covering 11% and deserts and steppes covering the remainder [21]. Assessing the ecological quality of the Mongolian Plateau is crucial, particularly in light of frequent dust storms which have adversely affected the ecological environment, impacting the region and East Asia [33]. The region is a reservoir of ecological value which is vital for biodiversity conservation. It plays a significant role in climate regulation, as evident from the observed vegetation changes due to climate extremes [34]. Analyzing the dynamics of vegetation coverage, which is indicative of the ecological quality, and understanding the influences of climate on vegetation are essential for informing conservation and land management strategies [33,34]. These strategies are imperative for ensuring the sustained health of the Mongolian Plateau’s natural habitats and supporting the local communities, whose livelihoods are intertwined with the region’s ecological well-being [34].

3. Data and Methods

3.1. Remote Sensing Data of Vegetation

The ecological assessment of the Mongolian Plateau employs two satellite remotely sensed vegetation products, the normalized difference vegetation index (NDVI) and net primary productivity (NPP), which are derived from the 500 m resolution MODIS MOD13A1 V6.1 (https://doi.org/10.5067/MODIS/MOD13A1.061 (accessed on 1 December 2023)) and MOD17A3HGF V6.1 (https://doi.org/10.5067/MODIS/MOD17A3HGF.061 (accessed on 1 December 2023)) products, respectively. These products were provided by the National Aeronautics and Space Administration (NASA) and downloaded from Google Earth Engine (GEE). The MODIS MOD13A1 product provides detailed NDVI measurements, acting as a robust indicator of vegetation health and vigor, as demonstrated in studies on the Shennongjia Forestry District and the Mu Us Sandy Land [35,36]. The NDVI reveals plant growth, greenness, and overall vegetation coverage, which is essential in tracking land cover variations, desertification, and drought situations. In addition, the MOD17A3 product provides NPP data, showing how ecosystem plants produce net helpful chemical energy, reflecting the ecosystem’s productivity. The NPP data from MOD17A3 are computed based on the BIOME-BGC model, which is extensively utilized globally for ecological evaluations [37]. The insights derived from these reliable satellite products, MOD13A1 and MOD17A3, can comprehensively understand the ecological health and dynamics prevalent in the Mongolian Plateau.

3.2. Data of Explanatory Variables

This study collected four categories of explanatory variables for assessing ecological quality in the study area, including 12 variables, as shown in Table 1. These categories include soil, geographic, climatic, and human activity data, each crucial in evaluating the factors affecting vegetation ecological quality in the study area. The spatial distributions of these potential variables related to the ecological quality are shown in Figure 2. These variables can contribute to understanding the ecological scenario and identifying the region’s critical vegetation health and sustainability determinants.
In the first category, soil data consist of the bulk density, pH, and organic carbon content. We collected these variables from OpenLandMap data, which have a spatial resolution of 250 m and a detection depth of 200 cm [38,39]. Comprehending soil properties such as the bulk density, pH, and organic carbon content is essential for evaluating ecological quality because these variables fundamentally impact vegetation growth, nutrient cycling, and water filtration. The soil bulk density can affect the root penetration and availability of water and nutrients, while the soil pH level impacts nutrient availability and microorganism activity. Meanwhile, soil organic carbon is crucial in maintaining soil integrity, enhancing water retention, and promoting fertility. Thus, these factors thoroughly understand soil’s physical and chemical characteristics and directly or indirectly impact ecological quality. They also help in predicting how vegetation will respond to environmental challenges.
The second category, geography data, includes elevation, slope, and aspect. The data for these variables were sourced from the Shuttle Radar Topography Mission (SRTM) dataset, with a spatial resolution of 30 m [40].
The elevation metric influences the temperature, precipitation patterns, and atmospheric pressure, creating distinct climatic conditions at different altitudes. Higher elevations typically experience lower temperatures and different precipitation patterns compared with lower elevations. This variation affects the distribution and types of vegetation found at various altitudes.
The slope of the terrain impacts soil retention and water runoff, which in turn affects soil moisture levels and erosion rates. Steep slopes may lead to faster water runoff and more significant erosion, reducing soil fertility and affecting plant growth. Gentle slopes might retain more water, supporting different types of vegetation.
Aspect refers to the direction a slope faces and influences the amount of sunlight the terrain receives. For instance, south-facing slopes in the Northern Hemisphere receive more sunlight and tend to be warmer and drier than north-facing slopes. This difference in microclimatic conditions can lead to varied vegetation types on different slopes.
These geographic factors collectively determine an area’s micro-climatic conditions, soil types, and water availability. They play a significant role in shaping local vegetation patterns and health, thereby influencing the overall ecological quality of a region.
Climate data include the precipitation and temperature, sourced from the ERA5-Land data source, with a spatial resolution of 11,132 m and a temporal resolution of 1 month [41,42]. This dataset provides an annual summary of the total precipitation and a yearly temperature average at a distance of 2 m above the Earth’s surface. Climatic factors are critical in determining vegetation zones, growth patterns, and ecosystem health, directly influencing the region’s ecological quality.
Finally, the human activity data category includes the population, cropland area, night light data, and road length used to calculate the road density.
The nighttime light metric measures the settlement intensity and economic activity. High nighttime light levels indicate urbanization and industrial activities associated with increased energy consumption, pollution, and habitat disturbance. The nighttime light data were derived from extended NPP-VIIRS-like NTL data, with a spatial resolution of 500 m and a temporal resolution of 1 year [43], collected at the National Earth System Science Data Center of the National Science & Technology Infrastructure of China (http://www.geodata.cn).
Population density directly indicates human pressure on natural resources and ecosystems. Higher population densities often correlate with increased land use changes, pollution, and resource extraction. The population data were sourced from WorldPop gridded datasets, with a spatial resolution of 92.77 m and a temporal resolution of 1 year [44].
The extent of cropland reflects the degree of land conversion for agricultural purposes, which can lead to habitat loss, soil degradation, and water resource depletion. Cropland land area data were obtained from the MCD12Q1 V6.1 product, having a spatial resolution of 500 m and a temporal resolution of 1 year (https://doi.org/10.5067/MODIS/MCD12Q1.061 (accessed on 1 December 2023)). The variables of road length are sourced from OpenStreetMap data, with a temporal resolution of 1 year (https://www.openstreetmap.org/(accessed on 1 December 2023)). The data before 2014 were represented using 2014 data. Human activities significantly alter the landscape, leading to habitat loss, fragmentation, pollution, and other issues which closely affect ecological quality. By analyzing human activity data, we can gain insights into the anthropogenic pressures on the ecosystem and strategizes for sustainable land management practices to enhance ecological quality.

3.3. Ecological Quality Index

In this study, we utilized the EQI to assess the ecological quality of vegetation by synthesizing the critical parameters of the fraction of vegetation cover (FVC) and NPP. These parameters reflect the state and vitality of vegetation [45,46]. The annual average FVC in the kth year could be calculated using the time series NDVI within that year:
F V C k = 1 / m i = 1 m N D V I i N D V I s o i l N D V I m a x N D V I s o i l
where F V C k is the annual average FVC in the kth year, N D V I i is the ith observation of the NDVI in that year, N D V I m a x is the NDVI value in a pixel fully covered by vegetation, and N D V I s o i l is the NDVI value in a pixel fully covered by soil. According to China’s national standard “QX/T 494-2019, Grade of monitoring and evaluating for terrestrial vegetation meteorology and ecological quality” [23], the N D V I m a x and N D V I s o i l values could be set to 0.95 and 0.05, respectively.
The EQI is a composite index integrating the FVC and NPP into a unified quantitative measure which captures the ecosystem’s vegetation functionality and coverage status. The indicator of the EQI in the kth year was calculated as follows [22,23]:
E Q I k = 100 × f 1 × F V C k + f 2 × N P P k N P P m a x
where f 1 is the weight coefficient of land vegetation coverage, assigned a value of 0.5 for the Mongolian Plateau, f 2 is the weight coefficient of the NPP of terrestrial vegetation, also valued at 0.5 for the Mongolian Plateau, N P P k is the NPP of terrestrial vegetation in the kth year, and N P P m a x is the maximum NPP of land vegetation observed across the study period in different years.
The primary objective was to obtain a reliable and robust measure of the ecological quality of vegetation in the study area. Using the EQI, we aimed to identify trends and changes in vegetation health and productivity over time, assess the impact of environmental and anthropogenic factors on ecological quality, and provide insights for sustainable land management practices and conservation efforts. This approach allowed for a detailed and dynamic understanding of the environmental state of the region, supporting informed decision making for ecological preservation and enhancement.

3.4. Spatiotemporal Patterns of EQI

We analyzed the spatiotemporal patterns of the ecological quality index (EQI) on the Mongolian Plateau to assess ecological quality and conservation outcomes. Our approach involved three components: (1) spatial analysis of the EQI distribution and variability, where we calculated the yearly standard deviation of the EQI for each geographic grid to identify regions with varying ecological quality and stability, (2) temporal trend analysis, where we used grid-level linear regression to determine the EQI’s temporal trends from 2001 to 2020, with significance assessed at p < 0.05, and (3) spatial clustering analysis, where we employed the local indicator of spatial association (LISA) to identify spatial clusters of EQI trends, categorizing regions into hotspots (High-High) and coldspots (Low-Low). These methods provided a comprehensive assessment of the EQI’s regional distribution, temporal trends, and spatial clustering.

3.5. Geographically Optimal Zone-Based Heterogeneity (GOZH) for Determinant Exploration

This study employed a Geographically Optimal Zones-based Heterogeneity (GOZH) model to identify potential determinants of the spatial distributions of the ecological quality index (EQI) and its trends. The GOZH model investigates variables related to the EQI and its trends through spatial stratified heterogeneity, quantifying the power of determinants (PD) by comparing data variation within and between strata. The GOZH-based analysis of EQI determinants was conducted from the following perspectives: assessment of individual variables and their interactions, examination of spatial scale effects, and model evaluation. These parts are explained below.

3.5.1. Identifying Individual Variables and Variable Interactions

To analyze the distributions of the ecological quality index (EQI) and its trends, it was essential to examine a broad range of ecological and environmental determinants, each potentially impacting a region’s overall ecological quality. The Geographically Optimal Zones-based Heterogeneity (GOZH) model, an enhancement of the geographical detectors model, provided a systematic approach for evaluating the influence of each variable and quantifying its contribution to the EQI.
To determine a variable’s impact on the EQI, the geographical detectors model computed the power of determinants (PD) using the following equation [27]:
q = 1 h = 1 H N h σ h 2 N σ 2 = 1 S S W S S T
where N h and σ h 2 are the number and variance of the EQI observations within the hth stratum, respectively, N and σ 2 are the number and variance of the EQI over the entire study area, respectively, and S S W and S S T are the sum of squares and the total sum of squares, respectively. A higher PD value indicates a more important impact from the variable on the spatial distribution of the EQI, whereas a lower PD denotes a lesser impact.
The GOZH model significantly improved the geographical detectors model by solving issues through experimentation detecting parameters in spatial data discretization. The equations provide an optimization framework, which was as follows:
γ ( X , D ) = 1 S S W X , D S S T
where γ ( X , D ) is the variation in the target variable which was explained by the explanatory variable (X) and spatial strata (D), S S W X , D is the target variable’s within-strata variation in the strata indicated by X and the spatial strata D, and S S T is the target variable’s overall variance throughout the whole research region.
Thus, the PD examined by the GOZH model was calculated as follows [47]:
Ω = max ( γ ) = 1 min ( S S W X , D ) S S T
where Ω is the target variable’s highest explanatory power given all possible explanatory variables, which reflects the percentage of the target variable’s fluctuation that can be explained by any explanatory variable (X) and spatial strata (D). The term min ( S S W X , D ) captures the target variable’s minimal within-strata variance across all strata specified by X and D. Thus, the spatial data discretization process and the number of spatial strata were optimized by GOZH. This optimization ensures that the geographic characteristics included in the spatial explanatory variables are accurately captured by modeling the maximum PD values, revealing complex geographic relationships and patterns which traditional spatial data discretization cannot effectively model.
The GOZH model can identify the individual variables and their interactions (the interaction of all variables) which influence the EQI and its trends. It effectively identifies the key factors influencing ecological quality by revealing the type and strength of relationships between the determinants and EQI distributions. Thus, this understanding helps develop targeted ecological interventions and make informed decisions, ensuring that any actions carried out can be supported by accurate evidence.

3.5.2. Spatial Scale Effects

This section aims to evaluate the impact of the spatial scale on the explanatory power of various determinants influencing the ecological quality index (EQI) and its trend distributions. Understanding these effects is crucial for making accurate inferences in spatial analysis and ensuring that interpretations and subsequent decisions are well informed. This study examines the spatial scale impacts by assessing the determinants influencing the EQI and its trend distributions across various geographic scales. We seek to determine the impact of these determinants by examining the Ω values, which quantify the explanatory power of different variables on the EQI.
The power of determinants (PD), based on the spatial stratified heterogeneity, may vary with the spatial scale. This study evaluated these effects using alternative spatial scales, including 10 km, 20 km, 30 km, 40 km, and 50 km. Particular attention was given to identifying the “ideal scale” for analysis, defined as the scale at which the 75th percentile of Ω values for all explanatory variables was maximized. This scale represents the point at which most variables effectively account for changes in the EQI.
The scale optimization technique was developed in response to the realization that different scales of analysis may reveal diverse characteristics which significantly impact interpretations and decision making. By comparing the Ω values of all explanatory variables at various spatial scales and using their best discretization parameters, we aimed to understand the interaction between variables and scales. The goal was to identify the scale with the highest Ω values, indicating the most substantial explanatory power. Reaching the 75th percentile of Ω values for all explanatory variables across all scales provided a more comprehensive understanding of the determinants influencing the EQI. The ideal scale is where most variables offer the most information about the spatial distribution of the EQI and its trends.

3.5.3. Model Evaluation

This section aims to evaluate the Geographically Optimal Zones-based Heterogeneity (GOZH) model by comparing its performance with the widely used optimal parameters-based geographical detector (OPGD) model to validate the GOZH model and explore the relationships among variables affecting the ecological quality index (EQI) [48].
The OPGD model analyzes spatial stratified heterogeneity by examining the variance within and between the strata of explanatory variables to estimate the power of determinants (PD). While effective, it may struggle with detecting complex interactions involving multiple variables. Evaluating the OPGD model helps validate the GOZH model and understand variable relationships.
Although the OPGD model investigates heterogeneity and PD by analyzing the variance within and between strata, it may face challenges with complex variable interactions. This study addresses these limitations by using the GOZH model for a more comprehensive analysis of variable relationships and complex spatial interactions, enhancing the understanding of the determinants of ecological quality.
The assessment criteria included the number of spatial strata with variable interactions and the PD values of individual variables. The number of spatial strata indicates the effectiveness of spatial stratification in the models. A lower number of strata suggests that the model can effectively differentiate spatially stratified heterogeneity patterns with fewer strata. The PD values measure a model’s ability to explore the power of determinants, where higher PD values indicate that the model can more effectively explore the determinants of variables. This study estimated the PD values for the independent variables and their complex interactions using the OPGD model. Spatial discretization in OPGD was performed using the quantile breaks discretization approach, with values ranging from 4 to 10. The OPGD model was implemented using the “GD” package in R [48].

4. Results

4.1. Spatial and Temporal Patterns of NDVI and NPP

This study revealed a significant increase and regional disparities in the NDVI and NPP variations across the study area over the two-decade period. The spatial patterns of the annual mean values and trends for the NDVI and NPP over the Mongolian Plateau from 2001 to 2020 are illustrated in Figure 3. In the Mongolian Plateau, the annual mean NDVI spatial distribution, as shown in Figure 3A, revealed high NDVI values in the north and east, and the western areas displayed low values. Figure 3B shows the spatial distribution of local annual NDVI trends derived from linear regression at the grid level. Further analysis, as illustrated in Figure 3C, reveals that the NDVI in 95.9% of the land increased between 2001 and 2020, where 48.2% of these areas showed a significant increase (p < 0.05), while only 4.1% experienced a decrease in NDVI, where a mere 0.35% showed a considerable decline. The general trend for the entire plateau, as shown in Figure 3D, demonstrates a significantly increasing trajectory in the NDVI over the two decades.
Figure 3E shows the spatial distribution of the annual mean NPP, similar to the NDVI pattern, with relatively higher values in the north and east and lower values in the west. The distribution of the annual NPP trend (Figure 3F) indicates that the increasing trends were primarily distributed in the north, east, and south regions. A statistical summary in Figure 3G reveals a dominant positive trend across the plateau, where 99.6% of the land showed an increase in NPP from 2001 to 2020, with 78.0% showing a significant increase (p < 0.05). In contrast, only 0.38% of the areas had a decline in NPP, with just 0.04% showing a significant decrease. The overall NPP trend for the entire region (Figure 3H) emphasized the significantly increasing NPP over the studied period. The beta values shown in Figure 2 are regression coefficients, indicating changes in the NDVI and NPP over the period.
In summary, we observed a significant increase in the NDVI and NPP trends across the study area over the two-decade period. Regionally, areas with traditionally high NDVI and NPP values showed more significant increases. On the other hand, regions with historically lower values exhibited modest enhancements, with a few small areas even showing decreases. These observations indicate a positive trend, which shows that the plateau is experiencing ecological improvements and positive changes.
The spatial distributions of the EQI across the Mongolian Plateau from 2001 to 2020 were computed using the developed approach (Figure 4), consisting of the mean EQI, the variability in EQI quantified by the standard deviation (SD), and their relationships. Figure 4A shows the spatial distribution of the annual mean EQI over two decades. The EQI measures an ecosystem’s health and overall sustainability. Areas with high EQI values, showing better ecological quality, were mainly found in the northern part of Mongolia and the eastern part of Inner Mongolia in China. These spatial patterns help identify regions of ecological well-being or potential decline.
Figure 4B is a significant representation of the variability in the EQI across the plateau through the standard deviation. This measure is crucial as it reveals areas with changing ecological states compared with more stable conditions. The results clearly show regions with higher SD values, indicating significant ecological shifts, were observed in eastern Mongolia and some areas in the eastern and southern parts of Inner Mongolia, China. These areas might have considerable environmental changes spatially associated with natural events or human activities, underscoring the urgency of addressing potential environmental changes.
Figure 4C is a significant representation of the relationship between the mean and the variability in the EQI. This nonlinear relationship provides valuable insights into the ecological conditions of the Mongolian Plateau. It shows two different stages. In areas where the mean EQI is below 10, an increase in the mean is linked with rising variability, mainly in the western part of the study region. In areas where the mean EQI is above 10, the variability stabilizes around a value of 2, indicating a change to more stable ecological conditions. This figure provides a thorough view of the Mongolian Plateau’s ecological quality. It offers essential insights by showing the current ecological quality and its changes over 20 years. This understanding is essential for stakeholders such as policymakers, conservationists, and researchers, highlighting areas of stability, potential issues, and the overall patterns which have shaped the plateau’s ecological development.

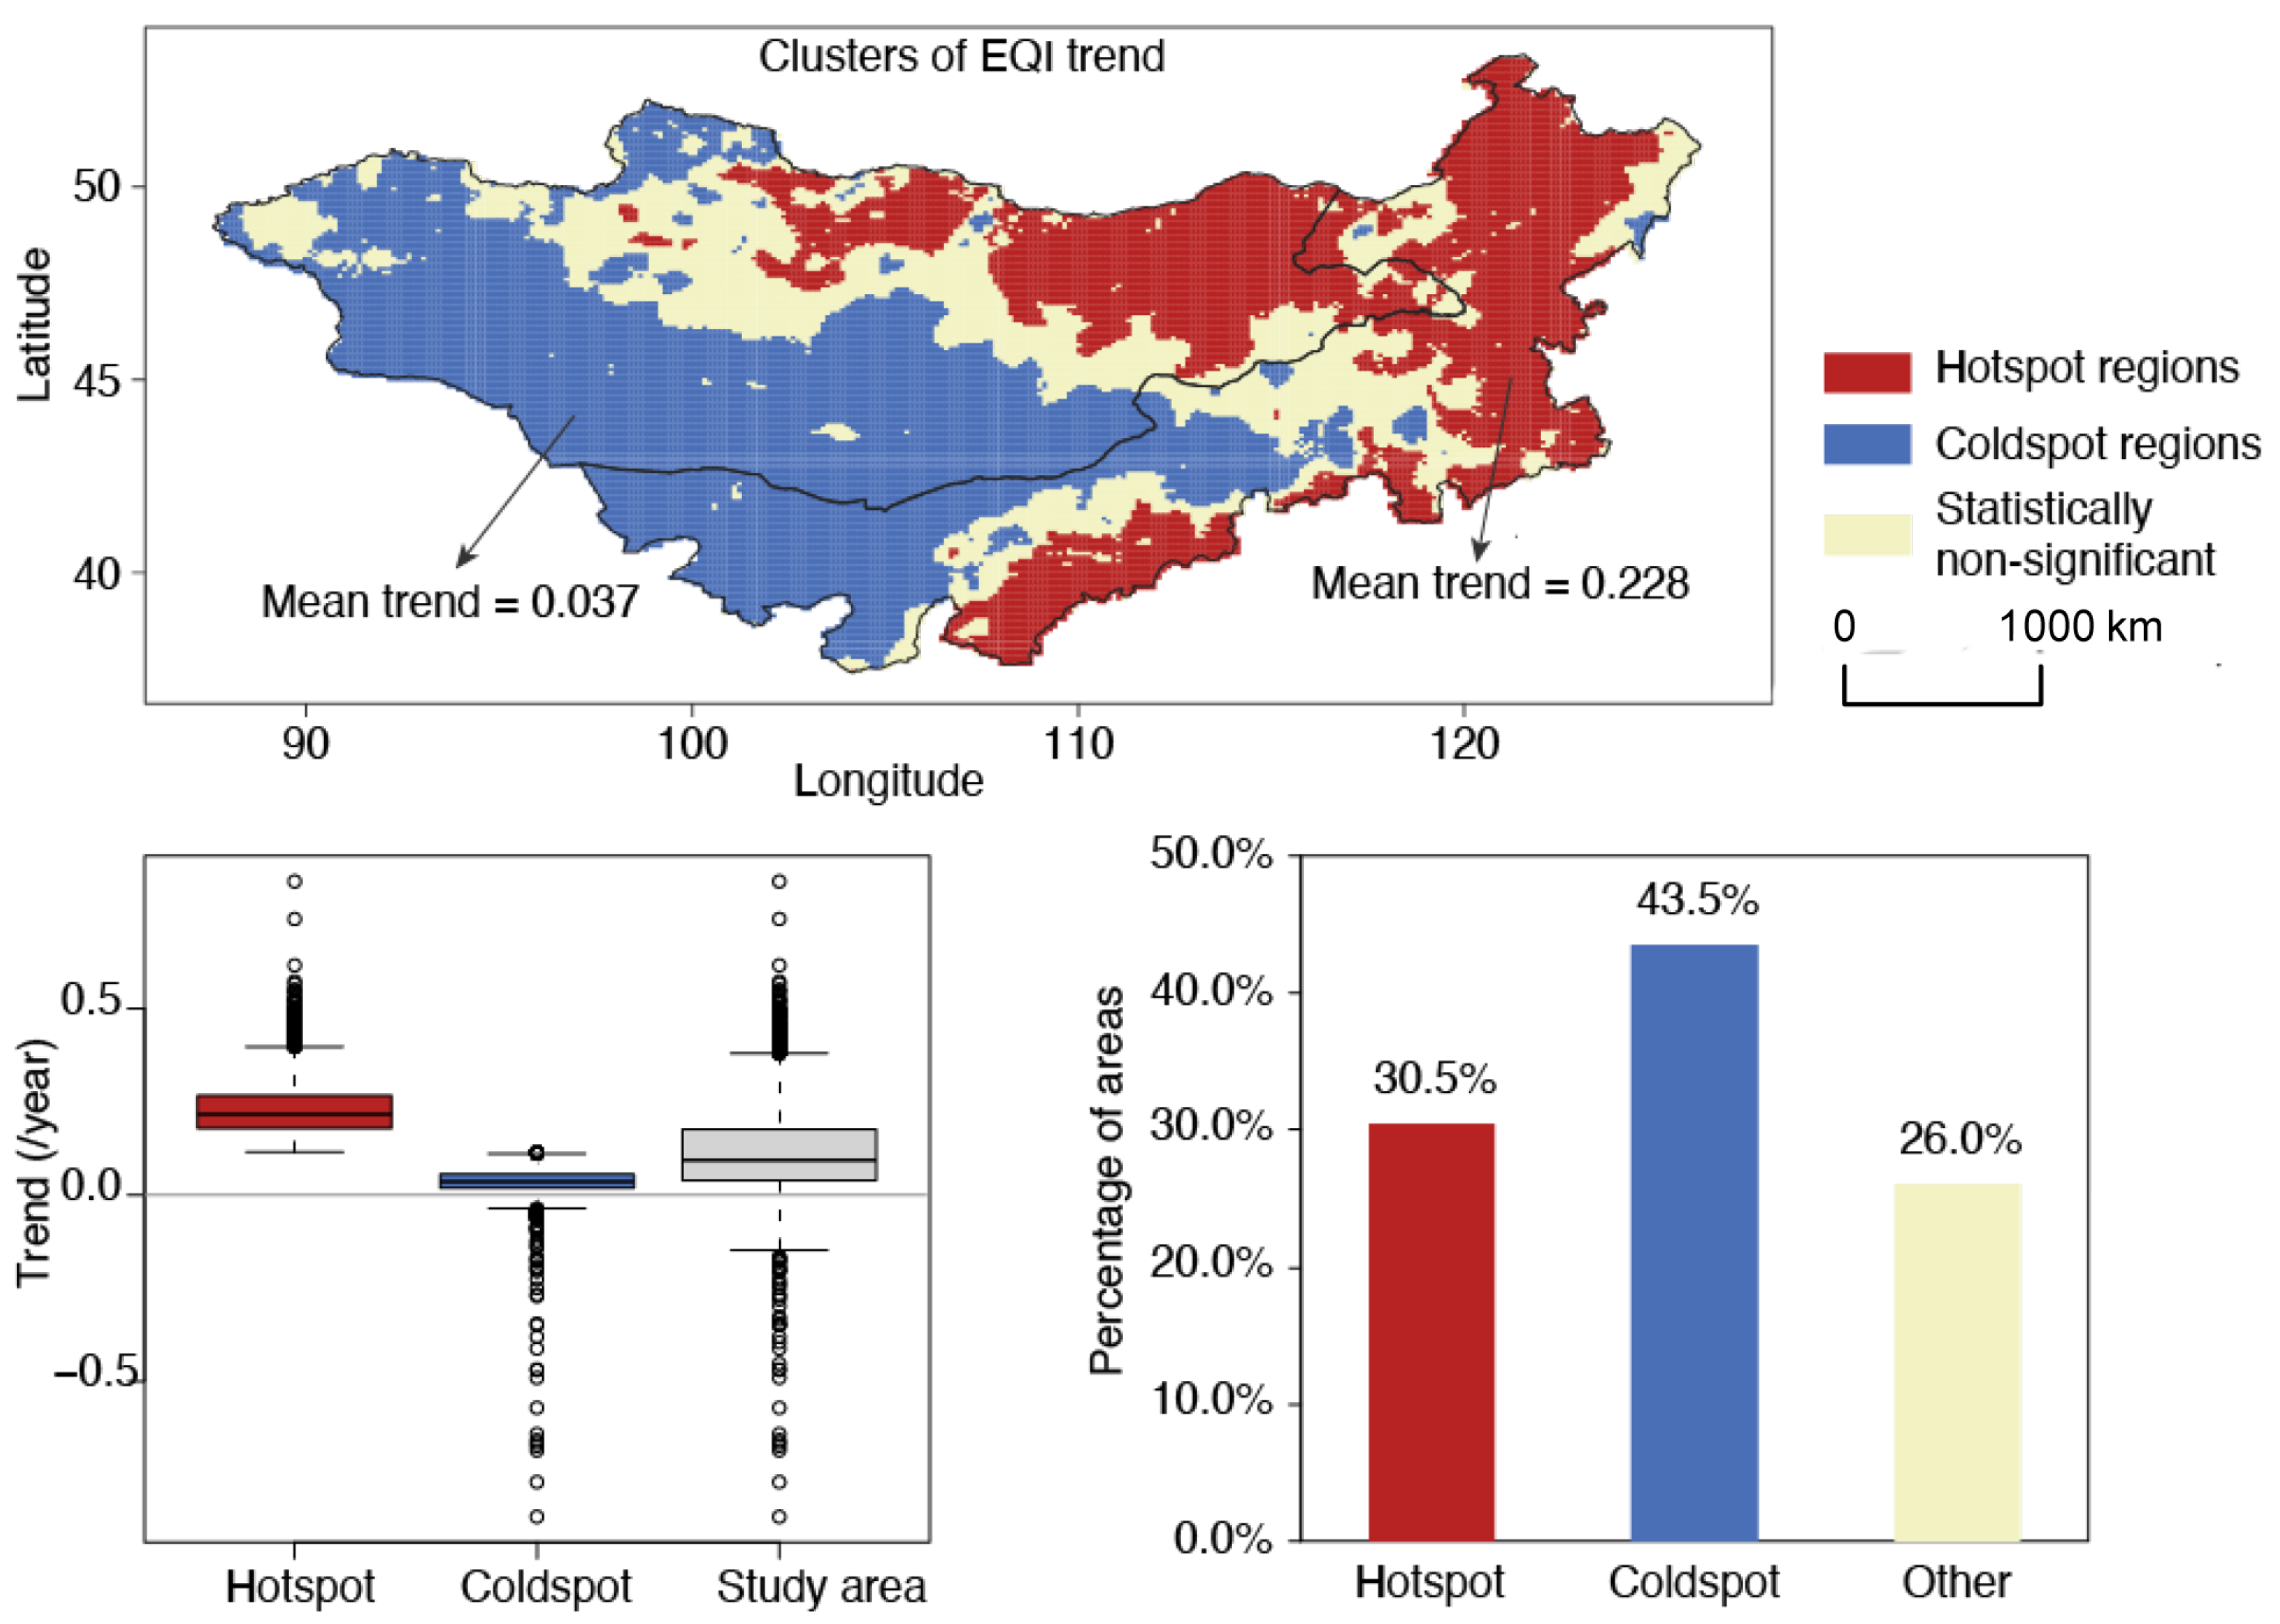
4.2. Spatial and Temporal Patterns of EQI

The temporal variations in the EQI over the past 20 years show a significant and promising overall improvement in the ecological quality of the Mongolian Plateau, with only a few places showing a decline. Figure 5 shows the temporal trends of the Mongolian Plateau’s EQI and a comprehensive time-based investigation from 2001 to 2020. Most regions have shown an increase in EQI over the past 20 years, as depicted in Figure 5A. The eastern and southern areas of Inner Mongolia and the northern and eastern regions of Mongolia experienced the most substantial growth. Figure 5B further reveals that western Inner Mongolia also showed an increase in EQI, though this growth was less pronounced compared with other areas.
Figure 5C illustrates a consistent and substantial increase in EQI from 2001 to 2020 across the entire Mongolian Plateau, indicating a general improvement in ecological quality. Figure 5D provides a more comprehensive perspective, showing that nearly 97.6% of the plateau observed an increase in EQI over the study period, with 59.6% showing a significant rise. Only 2.4% of the locations indicated a decline, with a negligible 0.22% experiencing a substantial decline.
Therefore, the trend analysis highlights the urgent need for comprehensive monitoring to preserve the positive EQI trends and address concerns for effective ecological management. The findings for the temporal trends in the EQI provide a baseline for evaluating the effectiveness of ecological measures, emphasizing the value of a data-driven strategy in future conservation efforts to protect the ecological integrity of the Mongolian Plateau.
The spatial clusters of the EQI trend over the Mongolian Plateau consist of hotspot and coldspot regions to understand the EQI dynamics, as shown in Figure 6. The geographical distributions and statistical summaries highlight a general trend: Both the hotspot and coldspot regions demonstrated increasing EQI trends. This overall positive trend indicates ecological transformations and enhancements taking place over the plateau, although there was a disparity in their geographical patterns and rates of increase.
Hotspot regions for the EQI trend accounted for 30.5% of the area, mostly located in northern and southern Mongolia and in eastern and southern Inner Mongolia. These regions likely benefited from robust ecological conditions and conservation efforts, given the positive EQI trajectory. Coldspot regions made up 43.5% of the total area. Despite being classified as coldspots, these areas showed an increase in EQI, albeit at lower rates. It is important to understand that, in this context, “coldspot” does not imply a decline but rather a slower rate of improvement compared with hotspots.
The EQI trends show a critical disparity between the hotspot and coldspot regions from a statistical perspective. The average EQI trend value in the hotspot regions was 0.228, which was 6.2 times higher than the average EQI trend value in the coldspot regions, estimated at 0.037. This significant disparity reveals varied rates of ecological development and raises concerns regarding the underlying causes of these differences.
In summary, Figure 5 and Figure 6 illustrate the Mongolian Plateau’s complex ecological history. Despite overall improvements, the differences in rates and regional distributions indicate a more intricate interaction of biological, environmental, and possibly human factors impacting ecological quality.

4.3. Spatial Determinants of EQI and Its Trends

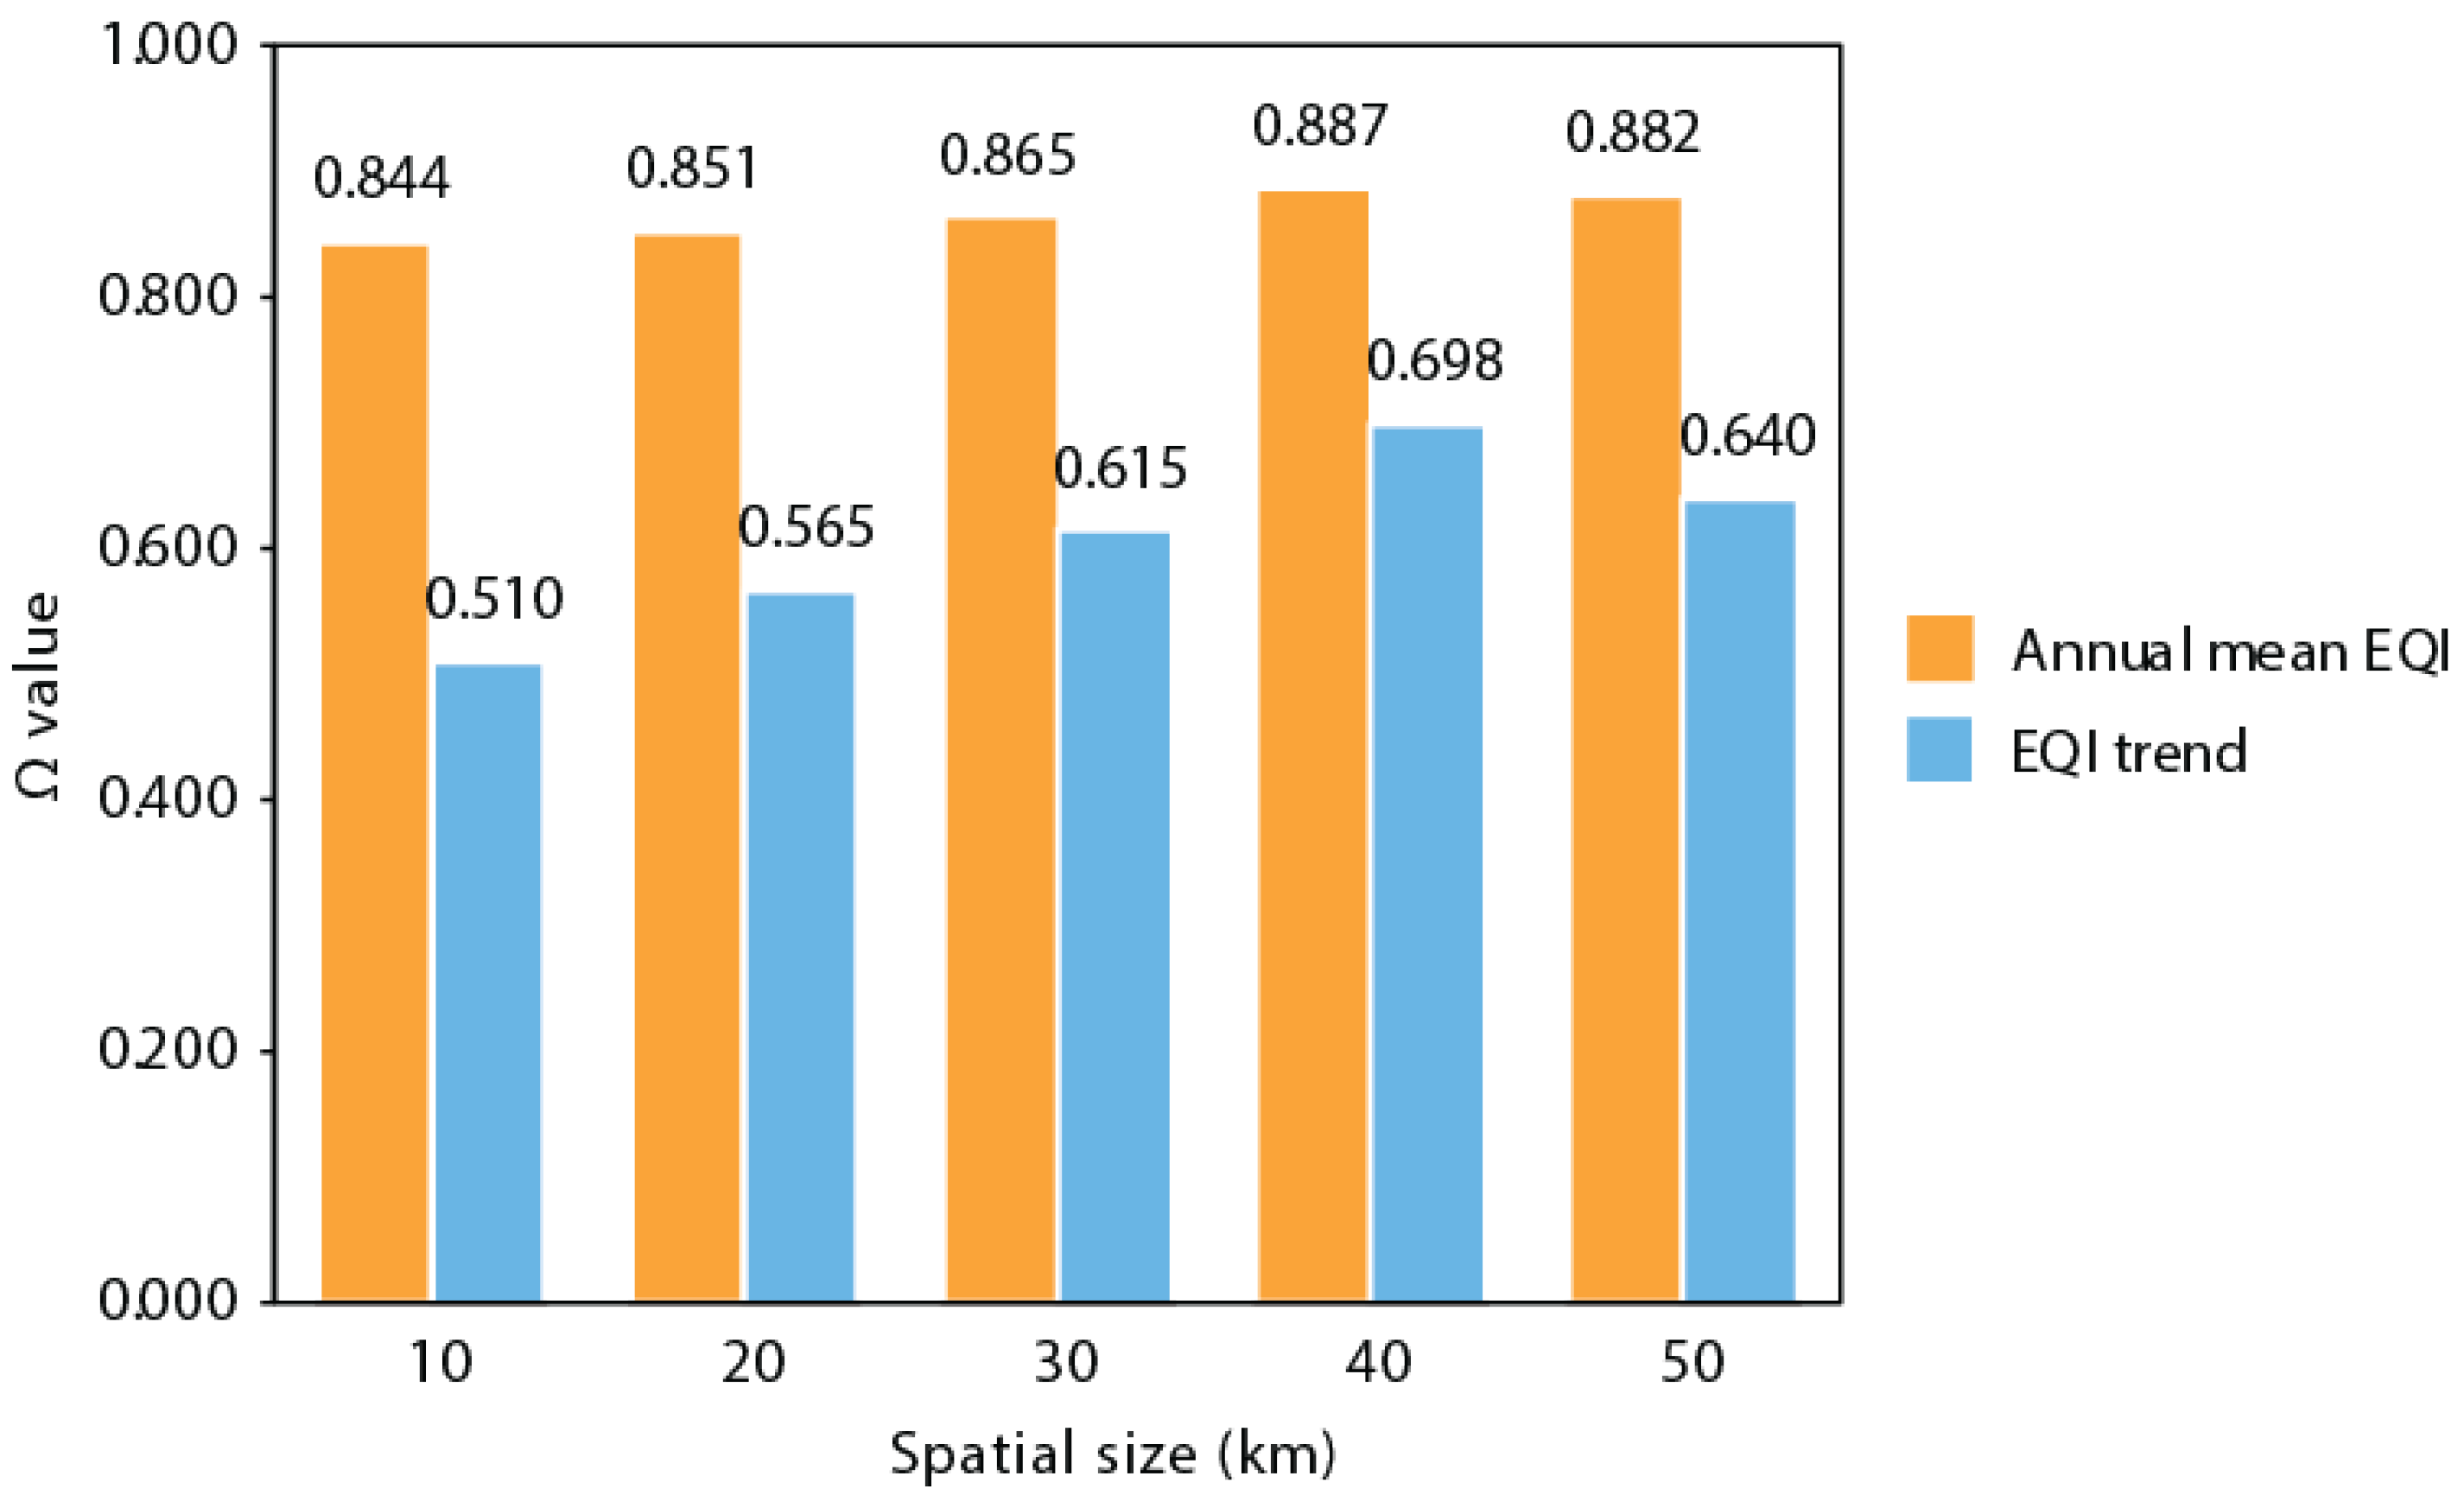
4.3.1. Spatial Scale Effects of Determinants Influencing EQI

Deriving appropriate inferences from spatial investigation depends critically on examining the spatial scales. Figure 7 shows how variables affect the EQI and the spatial distribution of its temporal trends at various spatial scales from 10 km to 50 km. The impacts of these factors on the EQI and EQI trends were shown in Figure 7A and Figure 7B, respectively.
The optimal scales for both the EQI and its trends are important findings. The ideal scale is one where variables have the highest PD for the EQI or its trends. The figure shows that 50 km was the perfect scale for the EQI, where it showed the highest 75% quantile of Ω values, and the determinants effectively accounted for its variability. The 40 km scale was the optimal scale for the EQI trends, since it could capture the highest 75% quantile of Ω values of the temporal EQI variations.
The differences in the ideal scales between the EQI and its trends demonstrate the complexity of spatial examinations of ecological quality. Variables which can significantly impact the EQI at one scale may have a different effect on its trends at another. Scale effects analysis is a valuable tool for researchers to target their investigations more accurately and provide more profound, more complicated findings by outlining these appropriate spatial scales. In summary, it emphasizes the significance of scale selection by demonstrating how choosing the proper scale may be crucial in revealing the health of vegetation ecology within the data.

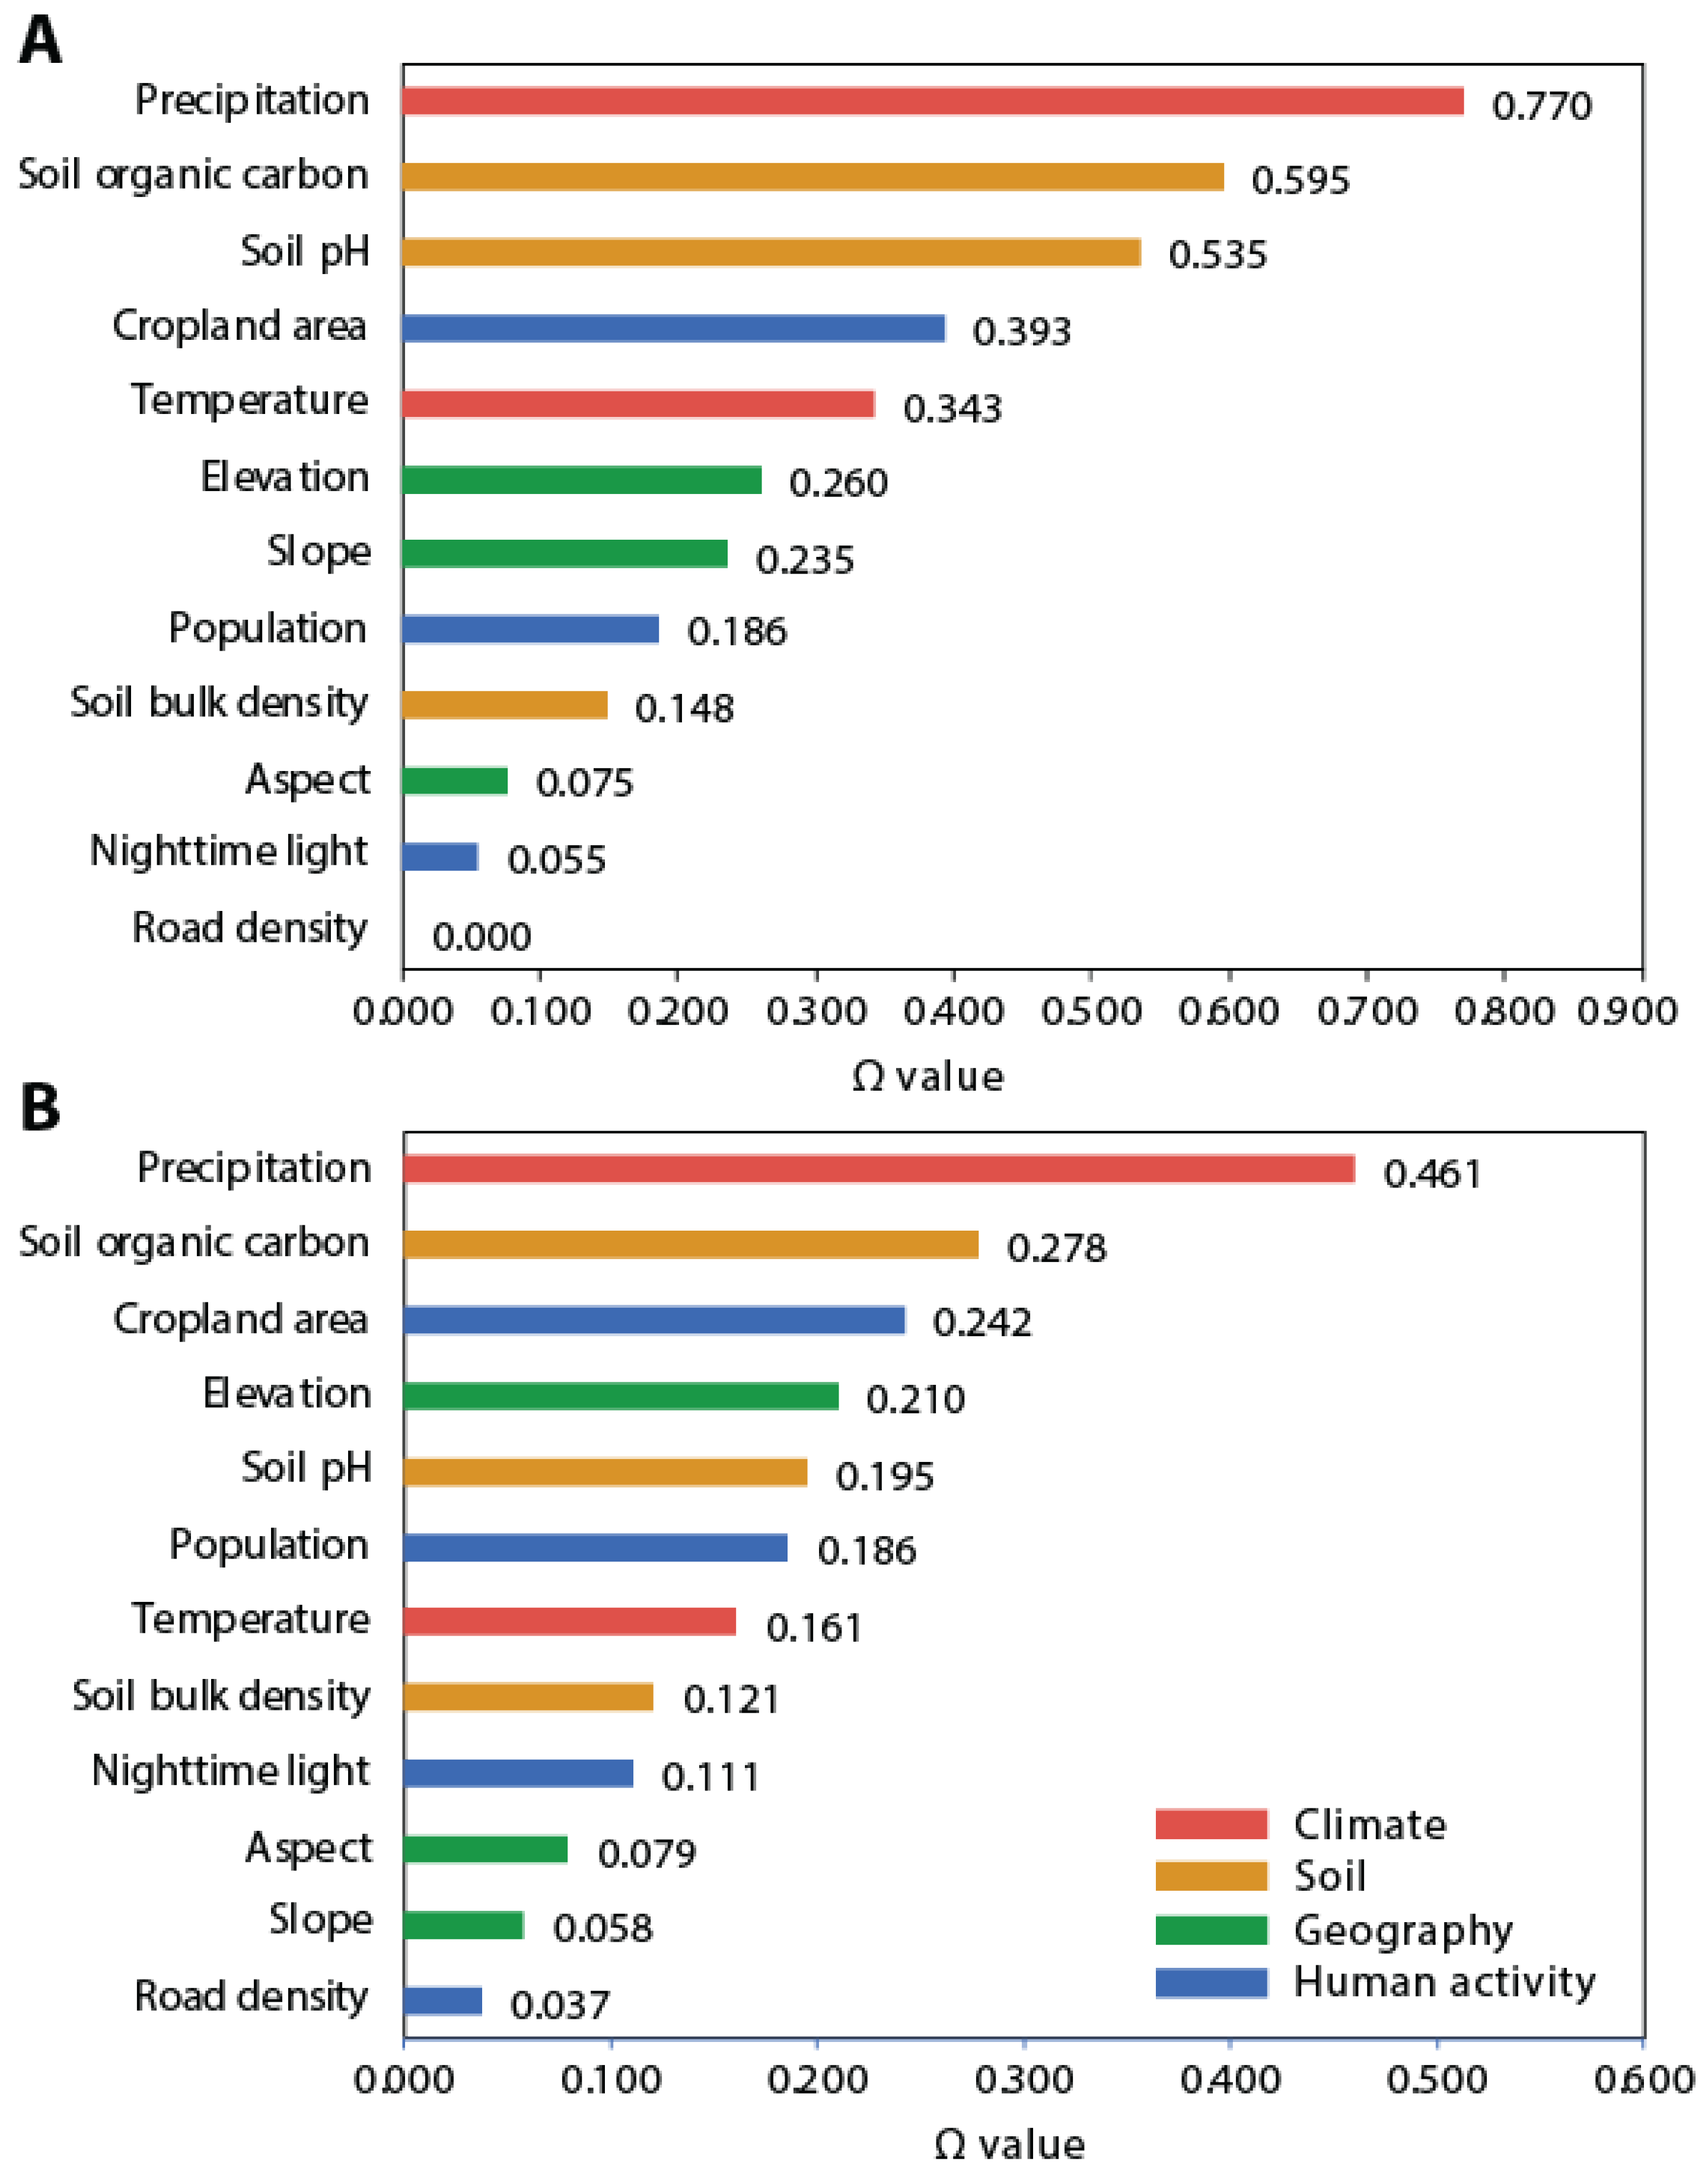
4.3.2. Power of Determinants of Individual Variables

The determinants which affect the EQI and its temporal patterns on the Mongolian Plateau were investigated in Figure 8. The EQI annual mean represents the average value of the ecological quality index over a specific period, summarizing the overall ecological quality during that time. Equally important, the EQI annual trend indicates the direction and rate of change in the EQI over several years, providing crucial insights into whether the ecological quality was improving, deteriorating, or remaining stable over time. This information is vital for understanding the long-term ecological health of the region.
Figure 8A demonstrates that climate variables, particularly precipitation, play a dominant role in influencing the EQI. Precipitation had an Ω value of 0.770, indicating its substantial impact on ecological quality. Changes in precipitation patterns, even minor ones, can significantly alter the ecological balance. This high Ω value suggests that water availability is a critical factor for maintaining ecological health in the region, likely due to its direct effect on vegetation growth, soil moisture, and overall biodiversity. Increased or decreased precipitation can lead to shifts in plant species composition, soil erosion rates, and water resource distribution, which are crucial for sustaining the ecological equilibrium. On the other hand, soil characteristics such as the organic carbon content and soil pH level, while significant for ecological quality, are generally considered constant over shorter time scales and thus do not directly explain the temporal trends in the EQI. For instance, soil organic carbon, with an Ω value of 0.595, is a crucial indicator of soil health and fertility, influencing plant growth and microbial activity. High soil organic carbon levels enhance the soil structure, water retention, and nutrient availability, thereby supporting a robust ecological system. Similarly, the soil pH level, with an Ω value of 0.535, affects nutrient availability and microbial activity, being critical for maintaining soil health and ecosystem productivity. However, these factors remain relatively stable over time and are more indicative of spatial variations rather than temporal changes.
Human activities, particularly agricultural practices, significantly influence the EQI. The cropland area, categorized under human activity, had an Ω value of 0.393, highlighting the impact of farming on ecological quality. Intensive agricultural activities, such as overgrazing, monoculture cropping, and chemical fertilizers and pesticides, can lead to soil degradation, loss of biodiversity, and changes in water regimes. These practices can disrupt the ecological balance by altering the natural nutrient cycles, reducing soil fertility, and increasing vulnerability to erosion and desertification. The expansion of cropland often involves the conversion of natural habitats, leading to habitat fragmentation and loss of native species. This conversion process affects the local biodiversity and alters the landscape’s ecological functions, such as water regulation, carbon sequestration, and soil stabilization. Therefore, managing agricultural practices sustainably is crucial for maintaining the ecological quality of the Mongolian Plateau.
The findings from Figure 8 suggest that both natural and human-induced factors significantly influence the ecological quality of the Mongolian Plateau. The positive trends in the EQI associated with favorable climate and soil conditions highlight the importance of preserving these natural determinants to enhance ecological resilience. Conversely, the negative impacts of intensive agricultural activities underscore the need for sustainable land management practices to mitigate human-induced ecological degradation. These trends provide valuable insights into the broader implications of global change. As climate change alters precipitation patterns and temperatures worldwide, regions like the Mongolian Plateau may experience increased ecological stress. Similarly, the growing demand for agricultural land to support a rising global population could exacerbate ecological degradation if not managed sustainably. Therefore, understanding the specific drivers of the EQI and their interactions is essential for developing effective conservation and management strategies to promote ecological sustainability in the face of global change.
Figure 8B shows the individual determinants of the EQI’s trend distribution. The significance of climate variables remains essential to the EQI’s temporal dynamics. Precipitation’s continuous importance, with an Ω value of 0.461, provides crucial information on the plateau’s vulnerability to climatic anomalies over time. This value indicates a medium-to-high sensitivity of EQI trends to precipitation variations, highlighting that fluctuations in rainfall patterns can substantially influence the long-term ecological quality of the region.
Precipitation is a critical determinant, consistently influencing the EQI trends. The Ω value of 0.461 demonstrates the plateau’s susceptibility to changes in precipitation, which can lead to shifts in vegetation cover, soil moisture content, and water availability [49]. These changes in turn affect the region’s overall ecological stability and health. The medium-to-high sensitivity of EQI trends to precipitation suggests that any deviation from standard rainfall patterns, such as prolonged droughts or increased frequency of heavy rainfall events, could have significant ecological consequences.
Soil organic carbon, with an Ω value of 0.278, remains a vital factor in determining EQI trends. Although its impact is slightly lower than that in the static EQI distribution, it still plays a crucial role in maintaining soil fertility and ecosystem productivity over time. Changes in soil organic carbon levels can influence plant growth, soil structure, and microbial activity, affecting the ecological quality’s temporal dynamics. The persistence of soil organic carbon as a significant determinant indicates its ongoing importance in supporting the ecological resilience of the Mongolian Plateau.
The cropland area, having an Ω value of 0.242, continues to be a significant factor in the temporal distribution of EQI trends. This value reflects the ongoing impact of agricultural practices on ecological quality. Intensive farming activities, land conversion for agriculture, and associated practices such as irrigation, fertilization, and pesticide use can lead to long-term soil degradation, water resource depletion, and biodiversity loss. The influence of cropland areas on EQI trends underscores the need for sustainable agricultural practices to mitigate negative ecological impacts and promote long-term ecological stability.
Elevation, included in the geography category with an Ω value of 0.210, revealed varying ecological challenges and adaptations at different altitudes. This factor indicates that altitudinal gradients can lead to distinct ecological characteristics, influencing vegetation types, climate conditions, and soil properties. The contribution of elevation to EQI trends suggests that ecosystems at different altitudes may respond differently to environmental changes, reflecting diverse ecological processes and adaptive strategies.
The above analysis not only presents the determinants but also reveals the complex temporal variations in the ecological patterns of the Mongolian Plateau. The varying influence of individual determinants on the EQI and its temporal trends highlights the intricate relationships between natural factors and human activities. These relationships underscore ecosystems’ ecological sensitivity and resilience or vulnerability to both climatic and anthropogenic influences. Understanding the power and interaction of these determinants is crucial for developing effective conservation and management strategies. By recognizing the key factors that drive ecological changes over time, policymakers and environmental managers can prioritize actions which enhance ecological resilience, mitigate adverse impacts, and promote sustainable development. This comprehensive understanding of the determinants of EQI trends provides a foundation for informed decision making to preserve the ecological integrity of the Mongolian Plateau in the face of ongoing environmental changes.

4.3.3. Power of Determinants of Variable Interactions

Figure 9 shows the influence of variable interactions on the EQI and its trends through the total Ω values, which indicate the interaction of multiple geospatial factors impacting the EQI and its temporal trends.
For the variable interactions of the EQI, an Ω value of 0.887 at a spatial scale of 40 km illustrates the relevance of this scale in terms of the cumulative influence of numerous factors on the EQI. Similarly, Ω values of 0.882 and 0.865 at 50 km and 30 km, respectively, followed closely, showing the substantial importance of variable interactions on the EQI at these scales. The high Ω values at these scales highlight the importance of the complex interaction of variables. The essential contributions of variable interactions imply that certain combinations of factors, like specific climatic conditions combined with certain soil types, enhance their overall impact on the EQI, providing a deeper insight into the ecological landscape than when analyzed individually.
The examination of the EQI trend determinants demonstrated Ω values of 0.698, 0.640, and 0.615 at the geographical scales of 40 km, 50 km, and 30 km, respectively. These findings demonstrate that the variable interactions at the 40 km scale significantly impacted the degree of EQI changes over time, with comparable but weaker effects reported at the 50 km and 30 km scales. The Ω values of the variable interactions affecting EQI trends at different spatial scales may be related to the spatial heterogeneity, scale sensitivity, data aggregation level, variable interactions, conservation efforts, and spatiotemporal dynamics of EQI trends on the Mongolian Plateau.
Therefore, the Ω values of variable interactions at different scales revealed the complex and interrelated nature of variables determining the spatial patterns of the EQI and its trends. Understanding these critical scales and their corresponding Ω values establishes the foundation for targeted and comprehensive ecological solutions. Exploring variable interactions ensures that efforts to maintain and enhance the EQI have their basis in an in-depth understanding of its driving causes, enabling an integrated approach to conserving and improving the ecological quality of the region.

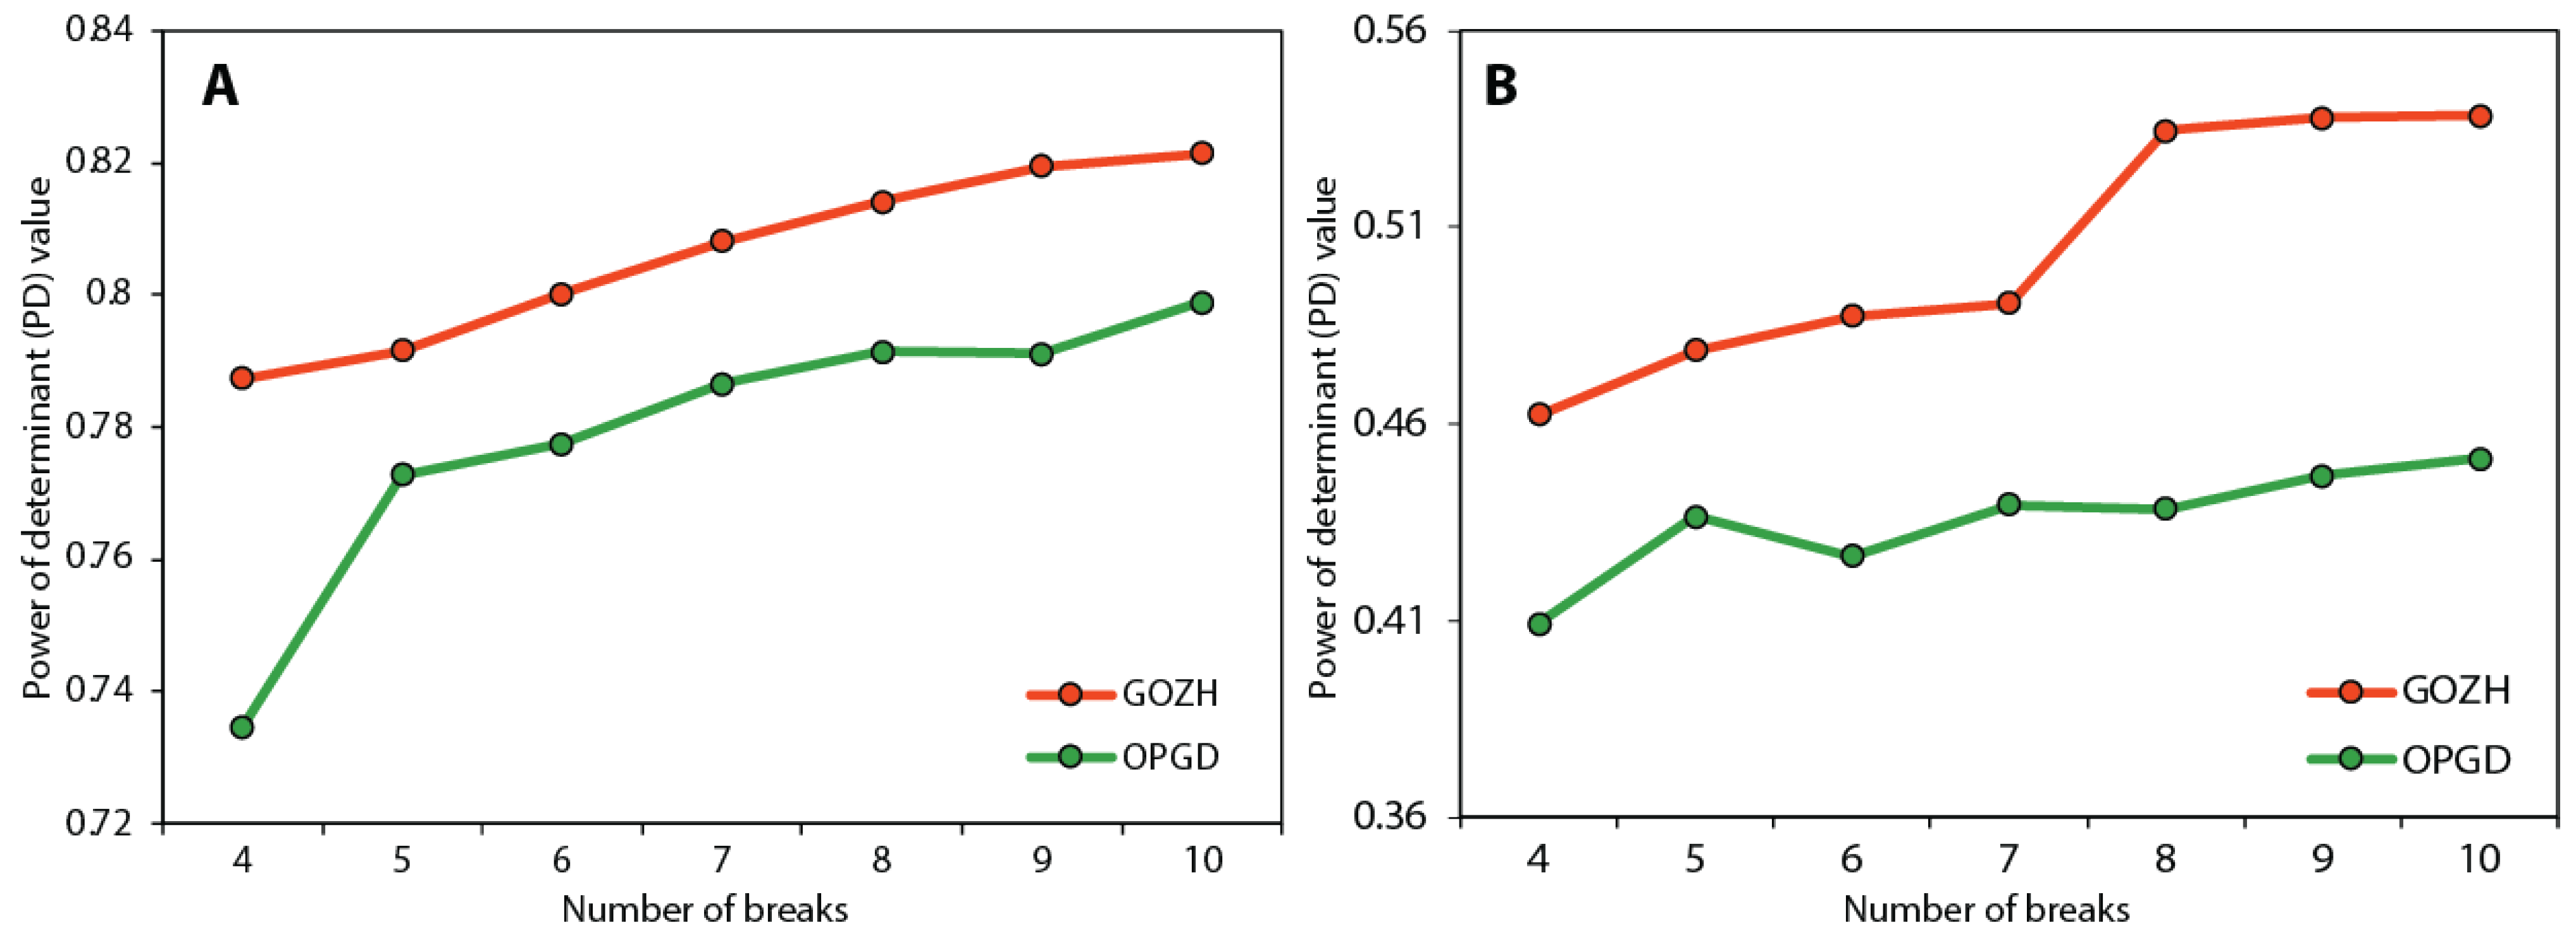
4.3.4. Model Evaluation

Determinants of the EQI and EQI trends were examined through a model performance comparison between the GOZH and OPGD models (Figure 10). In this study, precipitation, being the variable with the most substantial impact, served as a basis for evaluating the performance of the GOZH and OPGD models. The model evaluation consisted of the following findings. First, the GOZH model indicated higher reliability and robustness in describing the power of determinants of the variables. The results indicate constant growth in the PD values with an escalation in spatial strata within the GOZH models, which contrasted with the OPGD models, where the PD values changed with the increase in spatial strata.
In addition, the GOZH model was more effective in examining the determinants, a feature emphasized by the considerably higher PD values in the GOZH model compared with those in the OPGD model. This improved effectiveness originated from the GOZH model’s potential to probe into the maximal power of determinants of variables, thus providing an enhanced tool for spatial determinant analysis.
The advantages of GOZH extend to its greater ability to gain insight into the spatial stratified heterogeneity of data and the relationships between spatial response and the explanatory components, as examined in the OPGD model. The GOZH model employed an optimization approach for deriving the optimal spatial data discretization to improve the investigation of spatially stratified data heterogeneity. In summary, the GOZH model considerably outperformed the OPGD model in spatial determinant analysis for the EQI and EQI trends. The accurate and constant advance of PD values in the GOZH model and its effectiveness in the determinant investigation show its benefits in providing knowledge and an effective tool for examining the determinants affecting the EQI and its temporal patterns.

5. Discussion

In this study, we developed an ecological quality index (EQI) and employed geospatial models to comprehensively assess the spatial distributions and temporal trends in ecological quality across the Mongolian Plateau from 2001 to 2020. Our analysis revealed distinct spatial patterns where regions of high ecological quality were predominantly concentrated in northern Mongolia and eastern Inner Mongolia. Temporally, areas showing notable EQI fluctuations, indicative of ecological shifts, were primarily observed in eastern Mongolia and specific zones of Inner Mongolia. A critical aspect of our research was identifying the optimal spatial scales for analyzing individual EQI variables and their interactions. We found that a spatial scale of 50 km was suitable for examining individual EQI variables, while a scale of 40 km was optimal for analyzing the EQI’s temporal patterns and variable interactions. Climatic and soil factors, particularly precipitation, with an Omega value of 0.770, emerged as dominant influencers of the EQI within these scales. This underscores the sensitivity of ecological systems to climatic variations, particularly in relation to rainfall patterns, which can significantly impact ecological balance. Our study also highlighted the robustness of the generalized optimal zone hierarchical (GOZH) model compared with previous spatial models, like the optimal partitioning for geospatial data (OPGD) model [47,48,50]. The GOZH model provided more comprehensive insights into the spatial determinants affecting the EQI, offering a refined understanding of the complex relationships and interactions among variables across diverse spatial scales.
Comparing our findings with previous research underscores the significance of climate variables, such as precipitation, in shaping EQI dynamics. However, our study advances this understanding by emphasizing the spatial interactions of variables influencing the EQI and its temporal trends at various scales. This holistic approach enhances ecological quality assessment and informs practical management strategies, particularly in identifying regions for targeted conservation efforts and resource allocation. To further elaborate, our research underscores the critical role of precipitation in driving ecological quality, particularly in arid and semi-arid regions like the Mongolian Plateau. The Omega value of 0.770 for precipitation highlights its predominant influence, suggesting that even slight variations in rainfall can lead to significant ecological shifts. This finding is crucial for predicting future ecological scenarios under climate change, as alterations in precipitation patterns can drastically affect the region’s ecological balance. The superiority of the GOZH model in capturing the complexities of ecological quality determinants is another vital contribution of our study. By providing a more detailed understanding of how different factors interplay at various spatial scales, the GOZH model facilitates a more integrated approach to ecological management. This model’s ability to delineate the intricate relationships between climatic, soil, and vegetation variables makes it a valuable tool for ecological research and practical applications.
The implications of our findings extend beyond the Mongolian Plateau, providing a framework for assessing ecological landscapes in geographically diverse regions. By integrating EQI indicators and geospatial analyses, our study supports a data-driven approach to global ecological management, emphasizing the importance of adaptive strategies which consider both spatial and temporal dimensions of ecological change. In conclusion, our study contributes significantly to ecological quality assessment and conservation planning by providing robust methodologies and insights into the complex dynamics of the EQI. This discussion highlights the need for continued research to deepen our understanding of the interactions among environmental variables and their implications for ecosystem health and resilience. In summary, our research provides a comprehensive and innovative approach to understanding and managing ecological quality. By addressing the spatial and temporal dimensions of ecological variables, we offer valuable insights which can inform both regional and global conservation efforts. Continued research in this area will be essential for advancing our knowledge of ecological dynamics and developing effective strategies to preserve ecosystem health and resilience in the face of ongoing environmental challenges.

6. Conclusions

This study developed a comprehensive ecological quality index (EQI) to assess vegetation quality on the Mongolian Plateau from 2001 to 2020 using remote sensing techniques and geospatial models. By innovatively integrating diverse data indicators such as the normalized difference vegetation index (NDVI) and net primary productivity (NPP), we addressed the challenges of combining these indicators to evaluate environmental quality comprehensively. The results revealed significant determinants of EQI variations over space and time, particularly highlighting the profound impact of climatic variables, especially precipitation, on the EQI’s distribution and temporal trends. Application of the Geographically Optimal Zones-based Heterogeneity (GOZH) model effectively identified the key determinants of ecological quality and optimized the spatial scale for EQI analysis. This approach provides a more accurate analysis of the spatial heterogeneity and interactions among variables influencing vegetation quality. This study found that precipitation, with an Omega value of 0.770, was the dominant factor affecting the EQI, particularly at spatial scales of 40–50 km. Our findings contribute significantly to the understanding of vegetation quality dynamics and fill a critical gap in the current literature. Furthermore, these methods and discoveries advance ecological research on the Mongolian Plateau and demonstrate the benefits of emerging technologies in ecology and conservation science. This research lays a foundation for ecosystem conservation and the development of well-informed management strategies, enhancing our ability to maintain ecological health.

Author Contributions

Conceptualization, Z.W., Y.S. and Z.Z.; methodology, Z.W., Y.S., Z.Z. and P.L.; software, Z.W., Y.S., Z.Z. and P.L.; validation, Z.W. and Y.S.; formal analysis, Z.W., Y.S., Z.Z. and G.L.; investigation, Z.W. and X.Z.; resources, Z.W.; data curation, Z.W. and Z.Z.; writing—original draft preparation, Z.W., Y.S., G.L. and X.Z.; writing—review and editing, Z.W., Y.S., Z.Z., G.L., P.L. and X.Z.; visualization, Z.W., Y.S., P.L., X.Z. and Z.C.; supervision, Y.S. All authors have read and agreed to the published version of the manuscript.

Funding

This research received no external funding.

Data Availability Statement

Dataset available upon request from the authors.

Conflicts of Interest

The authors declare no conflicts of interest.

References

  1. Birk, S.; Chapman, D.; Carvalho, L.; Spears, B.M.; Andersen, H.E.; Argillier, C.; Auer, S.; Baattrup-Pedersen, A.; Banin, L.; Beklioğlu, M.; et al. Impacts of multiple stressors on freshwater biota across spatial scales and ecosystems. Nat. Ecol. Evol. 2020, 4, 1060–1068. [Google Scholar] [CrossRef] [PubMed]
  2. McPhearson, T.; Cook, E.M.; Berbes-Blazquez, M.; Cheng, C.; Grimm, N.B.; Andersson, E.; Barbosa, O.; Chandler, D.G.; Chang, H.; Chester, M.V.; et al. A social-ecological-technological systems framework for urban ecosystem services. One Earth 2022, 5, 505–518. [Google Scholar] [CrossRef]
  3. Zhang, Y.; Yang, Y.; Chen, Z.; Zhang, S. Multi-criteria assessment of the resilience of ecological function areas in China with a focus on ecological restoration. Ecol. Indic. 2020, 119, 106862. [Google Scholar] [CrossRef]
  4. Henderson, K.; Loreau, M. A model of Sustainable Development Goals: Challenges and opportunities in promoting human well-being and environmental sustainability. Ecol. Model. 2023, 475, 110164. [Google Scholar] [CrossRef]
  5. Ahmed, Z.; Ahmad, M.; Rjoub, H.; Kalugina, O.A.; Hussain, N. Economic growth, renewable energy consumption, and ecological footprint: Exploring the role of environmental regulations and democracy in sustainable development. Sustain. Dev. 2022, 30, 595–605. [Google Scholar] [CrossRef]
  6. Longato, D.; Cortinovis, C.; Albert, C.; Geneletti, D. Practical applications of ecosystem services in spatial planning: Lessons learned from a systematic literature review. Environ. Sci. Policy 2021, 119, 72–84. [Google Scholar] [CrossRef]
  7. Duan, H.; Xue, X.; Wang, T.; Kang, W.; Liao, J.; Liu, S. Spatial and temporal differences in alpine meadow, alpine steppe and all vegetation of the Qinghai-Tibetan Plateau and their responses to climate change. Remote Sens. 2021, 13, 669. [Google Scholar] [CrossRef]
  8. Zhang, Z.; Fan, Y.; Jiao, Z. Wetland ecological index and assessment of spatial-temporal changes of wetland ecological integrity. Sci. Total Environ. 2023, 862, 160741. [Google Scholar] [CrossRef]
  9. Wu, D. Spatially and temporally varying relationships between ecological footprint and influencing factors in China’s provinces Using Geographically Weighted Regression (GWR). J. Clean. Prod. 2020, 261, 121089. [Google Scholar] [CrossRef]
  10. Zhang, M.; Kafy, A.A.; Ren, B.; Zhang, Y.; Tan, S.; Li, J. Application of the optimal parameter geographic detector model in the identification of influencing factors of ecological quality in Guangzhou, China. Land 2022, 11, 1303. [Google Scholar] [CrossRef]
  11. Chen, Y.; Zhu, M.; Lu, J.; Zhou, Q.; Ma, W. Evaluation of ecological city and analysis of obstacle factors under the background of high-quality development: Taking cities in the Yellow River Basin as examples. Ecol. Indic. 2020, 118, 106771. [Google Scholar] [CrossRef]
  12. Huang, H.; Chen, W.; Zhang, Y.; Qiao, L.; Du, Y. Analysis of ecological quality in Lhasa Metropolitan Area during 1990–2017 based on remote sensing and Google Earth Engine platform. J. Geogr. Sci. 2021, 31, 265–280. [Google Scholar] [CrossRef]
  13. Hansen, M.C.; Potapov, P.V.; Moore, R.; Hancher, M.; Turubanova, S.A.; Tyukavina, A.; Thau, D.; Stehman, S.V.; Goetz, S.J.; Loveland, T.R.; et al. High-resolution global maps of 21st-century forest cover change. Science 2013, 342, 850–853. [Google Scholar] [CrossRef] [PubMed]
  14. Liu, Y.; Liu, X.; Hu, Y.; Li, S.; Peng, J.; Wang, Y. Analyzing nonlinear variations in terrestrial vegetation in China during 1982–2012. Environ. Monit. Assess. 2015, 187, 1–14. [Google Scholar] [CrossRef] [PubMed]
  15. Gao, J.; Bian, H.; Zhu, C.; Tang, S. The response of key ecosystem services to land use and climate change in Chongqing: Time, space, and altitude. J. Geogr. Sci. 2022, 32, 317–332. [Google Scholar] [CrossRef]
  16. Li, C.; Zhang, S.; Cui, M.; Wan, J.; Rao, T.; Li, W.; Wang, X. Improved Vegetation Ecological Quality of the Three-North Shelterbelt Project Region of China during 2000–2020 as Evidenced from Multiple Remotely Sensed Indicators. Remote Sens. 2022, 14, 5708. [Google Scholar] [CrossRef]
  17. Wang, T.; Zhao, M.; Gao, Y.; Yu, Z.; Zhao, Z. Analyzing Spatial-Temporal Change of Vegetation Ecological Quality and Its Influencing Factors in Anhui Province, Eastern China Using Multiscale Geographically Weighted Regression. Appl. Sci. 2023, 13, 6359. [Google Scholar] [CrossRef]
  18. Zhang, Z.; Li, Z.; Song, Y. On Ignoring the Heterogeneity in Spatial Autocorrelation: Consequences and Solutions. Int. J. Geogr. Inf. Sci. 2024, 1, 1–27. [Google Scholar] [CrossRef]
  19. Wang, J.; Brown, D.G.; Chen, J. Drivers of the Dynamics in Net Primary Productivity across Ecological Zones on the Mongolian Plateau. Landsc. Ecol. 2013, 28, 725–739. [Google Scholar] [CrossRef]
  20. Gao, W.; Zhang, S.; Rao, X.; Lin, X.; Li, R. Landsat TM/OLI-Based Ecological and Environmental Quality Survey of Yellow River Basin, Inner Mongolia Section. Remote Sens. 2021, 13, 4477. [Google Scholar] [CrossRef]
  21. Chen, J.; John, R.; Sun, G.; Fan, P.; Henebry, G.M.; Fernández-Giménez, M.E.; Zhang, Y.; Park, H.; Tian, L.; Groisman, P.; et al. Prospects for the Sustainability of Social-Ecological Systems (SES) on the Mongolian Plateau: Five Critical Issues. Environ. Res. Lett. 2018, 13, 123004. [Google Scholar] [CrossRef]
  22. Qian, S.; Yan, H.; Wu, M.; Cao, Y.; Xu, L.; Cheng, L. Dynamic monitoring and evaluation model for spatio-temporal change of comprehensive ecological quality of vegetation. Acta Ecol. Sin. 2020, 40, 6573–6583. [Google Scholar]
  23. Qian, S.; Cui, X.; Jiang, Y. Interpretation of QX/T 494-2019, Grade of monitoring and evaluating for terrestrial vegetation meteorology and ecological quality. Std. Sci. 2022, 7, 91–97. [Google Scholar]
  24. Song, Y. The second dimension of spatial association. Int. J. Appl. Earth Obs. Geoinf. 2022, 111, 102834. [Google Scholar] [CrossRef]
  25. Song, Y. Geographically optimal similarity. Math. Geosci. 2023, 55, 295–320. [Google Scholar] [CrossRef]
  26. Zhang, Z.; Song, Y.; Luo, P.; Wu, P. Geocomplexity explains spatial errors. Int. J. Geogr. Inf. Sci. 2023, 37, 1449–1469. [Google Scholar] [CrossRef]
  27. Wang, J.; Li, X.; Christakos, G.; Liao, Y.; Zhang, W.; Gu, X.; Zheng, X. Geographical detectors-based health risk assessment and its application in the neural tube defects study of the Heshun Region, China. Int. J. Geogr. Inf. Sci. 2010, 24, 107–127. [Google Scholar] [CrossRef]
  28. Wang, J.; Zhang, T.; Fu, B. A measure of spatial stratified heterogeneity. Ecol. Indic. 2016, 67, 250–256. [Google Scholar] [CrossRef]
  29. Song, Y.; Wu, P. An interactive detector for spatial associations. Int. J. Geogr. Inf. Sci. 2021, 35, 1676–1701. [Google Scholar] [CrossRef]
  30. Zhang, Z.; Song, Y.; Wu, P. Robust geographical detector. Int. J. Appl. Earth Obs. Geoinf. 2022, 109, 102782. [Google Scholar] [CrossRef]
  31. Miao, L.; Liu, Q.; Fraser, R.; He, B.; Cui, X. Shifts in vegetation growth in response to multiple factors on the Mongolian Plateau from 1982 to 2011. Phys. Chem. Earth Parts A/B/C 2015, 87, 50–59. [Google Scholar] [CrossRef]
  32. Guo, X.; Tong, S.; Ren, J.; Ying, H.; Bao, Y. Dynamics of Vegetation Net Primary Productivity and Its Response to Drought in the Mongolian Plateau. Atmosphere 2021, 12, 1587. [Google Scholar] [CrossRef]
  33. Yan, Y.; Xin, Z.; Bai, X.; Zhan, H.; Xi, J.; Xie, J.; Cheng, Y. Analysis of Growing Season Normalized Difference Vegetation Index Variation and Its Influencing Factors on the Mongolian Plateau Based on Google Earth Engine. Plants 2023, 12, 2550. [Google Scholar] [CrossRef] [PubMed]
  34. Li, C.; Leal Filho, W.; Wang, J.; Yin, J.; Fedoruk, M.; Bao, G.; Bao, Y.; Yin, S.; Yu, S.; Hu, R. An assessment of the impacts of climate extremes on the vegetation in Mongolian Plateau: Using a scenarios-based analysis to support regional adaptation and mitigation options. Ecol. Indic. 2018, 95, 805–814. [Google Scholar] [CrossRef]
  35. Li, S.; Xu, L.; Chen, J.; Jiang, Y.; Sun, S.; Yu, S.; Tan, Z.; Li, X. Monitoring vegetation dynamics (2010–2020) in Shengnongjia Forestry District with cloud-removed MODIS NDVI series by a spatio-temporal reconstruction method. Egypt. J. Remote Sens. Space Sci. 2023, 26, 527–543. [Google Scholar] [CrossRef]
  36. Gao, W.; Zheng, C.; Liu, X.; Lu, Y.; Chen, Y.; Wei, Y.; Ma, Y. NDVI-based vegetation dynamics and their responses to climate change and human activities from 1982 to 2020: A case study in the Mu Us Sandy Land, China. Ecol. Indic. 2022, 137, 108745. [Google Scholar] [CrossRef]
  37. Xi, Z.; Chen, G.; Xing, Y.; Xu, H.; Tian, Z.; Ma, Y.; Cui, J.; Li, D. Spatial and temporal variation of vegetation NPP and analysis of influencing factors in Heilongjiang Province, China. Ecol. Indic. 2023, 154, 110798. [Google Scholar] [CrossRef]
  38. OpenLandMap: Soil Property Maps of the World. Available online: https://openlandmap.org/ (accessed on 1 August 2023).
  39. OpenLandMap-SoilGrids. Available online: https://opengeohub.org/about-openlandmap/ (accessed on 1 August 2023).
  40. Jarvis, A.; Reuter, H.I.; Nelson, A.; Guevara, E. Hole-Filled SRTM for the Globe Version 4. CGIAR-CSI SRTM 90m Database. 2008. Available online: http://srtm.csi.cgiar.org/ (accessed on 1 December 2023).
  41. Muñoz, S.J. ERA5-Land Monthly Averaged Data from 1981 to Present. 2019. Copernicus Climate Change Service (C3S) Climate Data Store (CDS) Dataset. Available online: https://cds.climate.copernicus.eu/cdsapp#!/dataset/reanalysis-era5-land-monthly-means (accessed on 1 December 2023).
  42. Muñoz-Sabater, J.; Dutra, E.; Agustí-Panareda, A.; Albergel, C.; Arduini, G.; Balsamo, G.; Boussetta, S.; Choulga, M.; Harrigan, S.; Hersbach, H.; et al. ERA5-Land: A state-of-the-art global reanalysis dataset for land applications. Earth Syst. Sci. Data 2021, 13, 4349–4383. [Google Scholar] [CrossRef]
  43. Chen, Z.; Yu, B.; Yang, C.; Zhou, Y.; Yao, S.; Qian, X.; Wang, C.; Wu, B.; Wu, J. An extended time series (2000–2018) of global NPP-VIIRS-like nighttime light data from a cross-sensor calibration. Earth Syst. Sci. Data 2021, 13, 889–906. [Google Scholar] [CrossRef]
  44. Tatem, A.J. WorldPop, open data for spatial demography. Sci. Data 2017, 4, 1–4. [Google Scholar] [CrossRef]
  45. Lieth, H. Modeling the primary productivity of the world. Prim. Product. Biosph. 1975, 14, 237–263. [Google Scholar]
  46. Gitelson, A.A.; Kaufman, Y.J.; Stark, R.; Rundquist, D. Novel algorithms for remote estimation of vegetation fraction. Remote Sens. Environ. 2002, 80, 76–87. [Google Scholar] [CrossRef]
  47. Luo, P.; Song, Y.; Huang, X.; Ma, H.; Liu, J.; Yao, Y.; Meng, L. Identifying determinants of spatio-temporal disparities in soil moisture of the Northern Hemisphere using a geographically optimal zones-based heterogeneity model. ISPRS J. Photogramm. Remote Sens. 2022, 185, 111–128. [Google Scholar] [CrossRef]
  48. Song, Y.; Wang, J.; Ge, Y.; Xu, C. An optimal parameters-based geographical detector model enhances geographic characteristics of explanatory variables for spatial heterogeneity analysis: Cases with different types of spatial data. GISci. Remote Sens. 2020, 57, 593–610. [Google Scholar] [CrossRef]
  49. Luna, L.; Awange, J.; Song, Y.; Bui, L.K.; Zerihun, A.; Kuhn, M. Surface Water and Geomorphological Changes of the Blue Nile Dynamics Associated with the Grand Ethiopian Renaissance Dam (GERD): A Multi-Temporal Analysis. GISci. Remote Sens. 2024, 61, 2346383. [Google Scholar] [CrossRef]
  50. Zhang, Z.; Song, Y.; Karunaratne, L.; Wu, P. Robust interaction detector: A case of road life expectancy analysis. Spat. Stat. 2024, 59, 100814. [Google Scholar] [CrossRef]
Figure 1. The location and geographical condition of the study area, the Mongolian Plateau, for the analysis of spatiotemporal disparities in ecological quality.
Remotesensing 16 03385 g001
Figure 2. The spatial distribution of potential variables influencing the EQI includes soil, climate, geographical, and human activity variables.
Remotesensing 16 03385 g002
Figure 3. Spatiotemporal distributions and analysis of ecological quality metrics over the Mongolian Plateau from 2001 to 2020, with spatial distribution of the annual mean NDVI (A) and NDVI trend derived from linear regression (B), statistical summary of NDVI trends (C), annual NDVI trend for the entire region (D), spatial distribution of the annual mean NPP (E) and NPP trend derived from linear regression (F), statistical summary of NPP trends (G), and annual NPP trend for the entire region (H). The blue lines in (D,H) are the fitted linear trends.
Remotesensing 16 03385 g003
Figure 4. Spatial distribution of the estimated EQI of the Mongolian Plateau. (A) Annual mean EQI from 2001 to 2020. (B) Standard deviation (SD) of the EQI during the time period. (C) The relationship between the mean and SD of the EQI index. (The gradient from blue to yellow represents the observation density, increasing from low to high, and the red line illustrates the fitted nonlinear trend.).
Remotesensing 16 03385 g004
Figure 5. Distribution and analysis of the temporal trends in the EQI from 2001 to 2020 over the Mongolian Plateau: (A) spatial distribution of EQI trends; (B) spatial distribution of the significance levels of the EQI trends; (C) EQI trend for the entire study area (the blue line is the fitted linear trend); and (D) statistical summary of EQI trends.
Remotesensing 16 03385 g005
Figure 6. Spatial clusters of EQI trends across the Mongolian Plateau.
Remotesensing 16 03385 g006
Figure 7. Spatial scale effects of determinants for EQI (A) and EQI trends (B).
Remotesensing 16 03385 g007
Figure 8. The power of determinants of individual variables associated with the EQI (A) and EQI trends (B).
Remotesensing 16 03385 g008
Figure 9. The power of determinants of variable interactions associated with the EQI and EQI trends.
Remotesensing 16 03385 g009
Figure 10. Model performance comparison between GOZH and OPGD models for exploring determinants of EQI (A) and EQI trends (B).
Remotesensing 16 03385 g010
Table 1. Data descriptions of explanatory variables for ecological quality assessment.
CategoryVariableSourceTime Span (Years)
SoilSoil bulk densityOpenLandMap-
Soil pHOpenLandMap-
Soil organic carbon contentOpenLandMap-
GeographyElevationSRTM DEM-
SlopeSRTM DEM-
AspectSRTM DEM-
ClimatePrecipitationERA5-Land2001–2020
TemperatureERA5-Land2001–2020
Human activityPopulationWorldPop2001–2020
CroplandMCD12Q12001–2020
Nighttime lightExtended NPP-VIIRS-like NTL2001–2020
Road length (for calculating road density)OpenStreetMap2014–2020
Disclaimer/Publisher’s Note: The statements, opinions and data contained in all publications are solely those of the individual author(s) and contributor(s) and not of MDPI and/or the editor(s). MDPI and/or the editor(s) disclaim responsibility for any injury to people or property resulting from any ideas, methods, instructions or products referred to in the content.

