Article

Microphysical Characteristics of Monsoon Precipitation over Yangtze-and-Huai River Basin and South China: A Comparative Study from GPM DPR Observation

College of Meteorology and Oceanography, National University of Defense Technology, Changsha 410073, China
*
Author to whom correspondence should be addressed.
These authors contributed equally to this work.
Remote Sens. 2024, 16(18), 3433; https://doi.org/10.3390/rs16183433
Submission received: 23 August 2024 / Revised: 13 September 2024 / Accepted: 14 September 2024 / Published: 16 September 2024
(This article belongs to the Special Issue Synergetic Remote Sensing of Clouds and Precipitation II)

Abstract

:
It is rare to conduct a comparative analysis of precipitation characteristics across regions based on long-term homogeneous active satellite observations. By collocating the Global Precipitation Measurement Dual-frequency Precipitation Radar (GPM DPR) observations with European Centre for Medium-Range Weather Forecasts 5th Reanalysis (ERA5) data, this study comparatively examines the microphysics of monsoon precipitation in the rainy season over the Yangtze-and-Huai River Basin (YHRB) and South China (SC) from 2014 to 2023. The comparative analysis is made in terms of precipitation types and intensities, precipitation efficiency index (PEI), and ice phase layer (IPL) width. The results show that the mean near-surface precipitation rate and PEI are generally higher over SC (2.87 mm/h, 3.43 h−1) than over YHRB (2.27 mm/h, 3.22 h−1) due to the more frequent occurrence of convective precipitation. The DSD characteristics of heavy precipitation in the wet season for both regions are similar to those of deep ocean convection, which is associated with a greater amount of water vapor. However, over SC, there are larger but fewer raindrops in the near-surface precipitation. Moreover, moderate PEI precipitation is the main contributor to heavy precipitation (>8 mm/h). Stratiform precipitation over YHRB is frequent enough to contribute more than convective precipitation to heavy precipitation (8–20 mm/h). The combined effect of stronger convective available potential energy and low-level vertical wind favors intense convection over SC, resulting in a larger storm top height (STH) than that over YHRB. Consequently, it is conducive to enhancing the microphysical processes of the ice and melt phases within the precipitation. The vertical wind can also influence the liquid phase processes below the melting layer. Collectively, these dynamic microphysical processes are important in shaping the efficiency and intensity of precipitation.

1. Introduction

The Yangtze–Huai River Basin (YHRB) and South China (SC) are two climate regions profoundly affected by monsoon precipitation [1,2]. The frequent and heavy rainfall in the monsoonal season often leads to floods and other rain-related disasters [3]. Additionally, SC experiences its monsoonal season earlier than YHRB. Moreover, these regions, being densely populated with significant economic contributions, are particularly susceptible to precipitation-induced events [4,5]. Precise model parameterization and prediction require the accurate characterization of precipitation microphysics [6]. To improve the numerical weather prediction, this study investigates and compares the localized microphysical properties of precipitation over the two regions.
In previous studies, ground-based observations such as rain gauges, disdrometers, and weather radars were utilized to investigate the rainfall rate and raindrop size distribution (DSD) [7]. Although relatively accurate DSD parameters could be obtained, the previous results were restricted by incomplete coverage, sparse and uneven distribution, and difficult calibration of instruments [1,8].
Spaceborne precipitation radar, on the other hand, provides the quasi-global and accurate detection capabilities of rainfall that can make up for the above limitations [2,9]. Tropical Rainfall Measuring Mission (TRMM) was the first spaceborne precipitation radar dedicated to rainfall measurement [10]. Luo et al. [11] first reported rainfall characteristics and convective properties of monsoon precipitation systems over SC and YHRB using TRMM products and other datasets. Although TRMM precipitation radar provides a large-scale view of precipitation structure, there are still shortcomings in observing the microphysical properties of precipitation, such as insufficient single-frequency precipitation retrieval. Equipped with the spaceborne dual-frequency precipitation radar (DPR), the Global Precipitation Measurement (GPM) Core Observatory was launched in February 2014, assuming the observation responsibilities of TRMM. GPM DPR can provide the three-dimensional structure information of precipitation. By analyzing the differences in reflectivity obtained from two bands, GPM DPR can retrieve more accurate DSD parameters [12].
The good agreement of observation between GPM DPR and ground-based measurements has been verified in previous studies [2,13,14,15,16]. Using a volume-matching method, Huang et al. [13] validated that the reflectivity factor (Ze dBZ) and the mass-weighted mean diameter (Dm mm) from GPM DPR products are in good consistency with those of an S-band radar in SC, while the normalized scaling parameter for raindrop concentration (Nw mm−1m−3) might be underestimated. In addition, the detection results by GPM DPR exhibited the highest accuracy and dependency compared with TRMM and CMORPH over the Tianshan Mountain area [14].
The GPM DPR data have been utilized to characterize microphysical characteristics and processes in specific regions regarding the different precipitation types, the magnitude of precipitation efficiency index (PEI h−1), and the sensitivity of environmental factors. Using GPM DPR radar data, Li et al. [15] uncovered the vertical structure and microphysical characteristics of summer stratiform and convective precipitation in North China, revealing significant topographical impacts on precipitation frequency and intensity, with more intense precipitation over plains and higher frequency over mountains. Hu et al. [2] redefined PEI to analyze the precipitation microphysics for summer rainfall over YHRB, indicating that it exhibits a resemblance to those of tropical cyclone precipitation in the rainy season. Du et al. [16] utilized GPM DPR products to conduct a statistical analysis of the precipitation vertical characteristics over SC, pointing out that intensity is greatly related to the vertical microphysical processes. Based on a detailed classification of precipitation intensity, Sun et al. [17] further classified the precipitation into warm-/cold-topped to investigate the microphysical characteristics of precipitation over eastern China systematically. Their findings uncovered significant differences in the vertical structure of [2,13,16,17,18] particle size and precipitation rate between cold-topped and warm-topped precipitation. Moreover, it highlighted the close relationship between precipitation characteristics and meteorological conditions such as specific humidity and vertical velocity.
The precipitation microphysical properties of SC and YHRB have been investigated in previous studies, but the comparative analysis between the two regions is rarely conducted with the same criteria. Moreover, there are even fewer studies that consider the precipitation types, PEI, intensity, layering of the precipitation structure, and environmental factors simultaneously.
Utilizing the long-term homogeneous observations from the GPM DPR, this paper is the first to investigate the detailed comparative analysis of the monsoon precipitation vertical structure and microphysical properties over YHRB and SC. The GPM 2ADPR products for the rainy season of 2014–2023 are utilized in this study. The geographical coverage of SC is within 105–120°E, 18–26.5°N, while YHRB is within 110–122°E, 26.5–35°N. Both regions are shown in Figure 1.
The paper is organized as follows: Section 2 explains the datasets and the methodology used in this study. The results showing regional differences in monsoon precipitation microphysics between SC and YHRB are presented in Section 3. The conclusions are presented in Section 4. Section 5 discusses the limitations of the GPM DPR retrieval method and the plans for future investigations across several Chinese climatic zones.

2. Data and Methodology

2.1. Data

2.1.1. GPM DPR

Equipped with the world’s first DPR, operating at the Ku-band (13.6 GHz) and the Ka-band (35.5 GHz), GPM Core Observatory can cover tropical and subtropical areas, with its coverage extending up to 68°S–68°N. It orbits the Earth at an altitude of approximately 407 km, completing an orbit in about 93 min and conducting around 16 orbits per day [12].
The GPM 2ADPR (version 07A) data have a horizontal resolution of about 5 km at the nadir and a vertical resolution of 125 m. Utilizing the dual-frequency algorithm, the DPR classified precipitation into three categories: stratiform precipitation, convective precipitation (deep convective and shallow convective), and other precipitation [8]. The variables of radar reflectivity factor (Ze), rain rate (mm/h), Dm, Nw, storm top height (STH), and melting layer top height (MLTH) parameters from the GPM DPR with the dual-frequency algorithm were utilized in this study. The period of data is the rainy seasons from 2014 to 2023 for YHRB and SC.

2.1.2. ERA5

To examine the influence of meteorological factors on the precipitation over YHRB and SC, the convective available potential energy (CAPE) and vertical wind speed (w) data from the European Centre for Medium-Range Weather Forecasts 5th Reanalysis (ERA5) at a 0.25° × 0.25° grid were utilized in this study.
The amount of water vapor is a crucial factor in precipitation particle growth, indicating thermodynamic effects. Additionally, precipitation characteristics are significantly impacted by the intensity of convection, represented by w (m/s). A positive correlation between the Dm and specific humidity (q) has been found in the previous research [17]. However, the relationship between the Dm and meteorological conditions varies across atmospheric layers and is influenced by precipitation types and regions [6]. Weaker convection, as indicated by lower w, is typically associated with smaller raindrop size and reduced raindrop mass. The diminished size sorting effect and the decreased fragmentation of large raindrops are the underlying physical mechanisms contributing to the reduction [19].
The matching criterion from the previous study [17] is adopted in this study. The collocation between GPM and ERA5 data is considered if GPM data fall within the specified ERA5 grid’s latitude and longitude and within a one-hour time window.

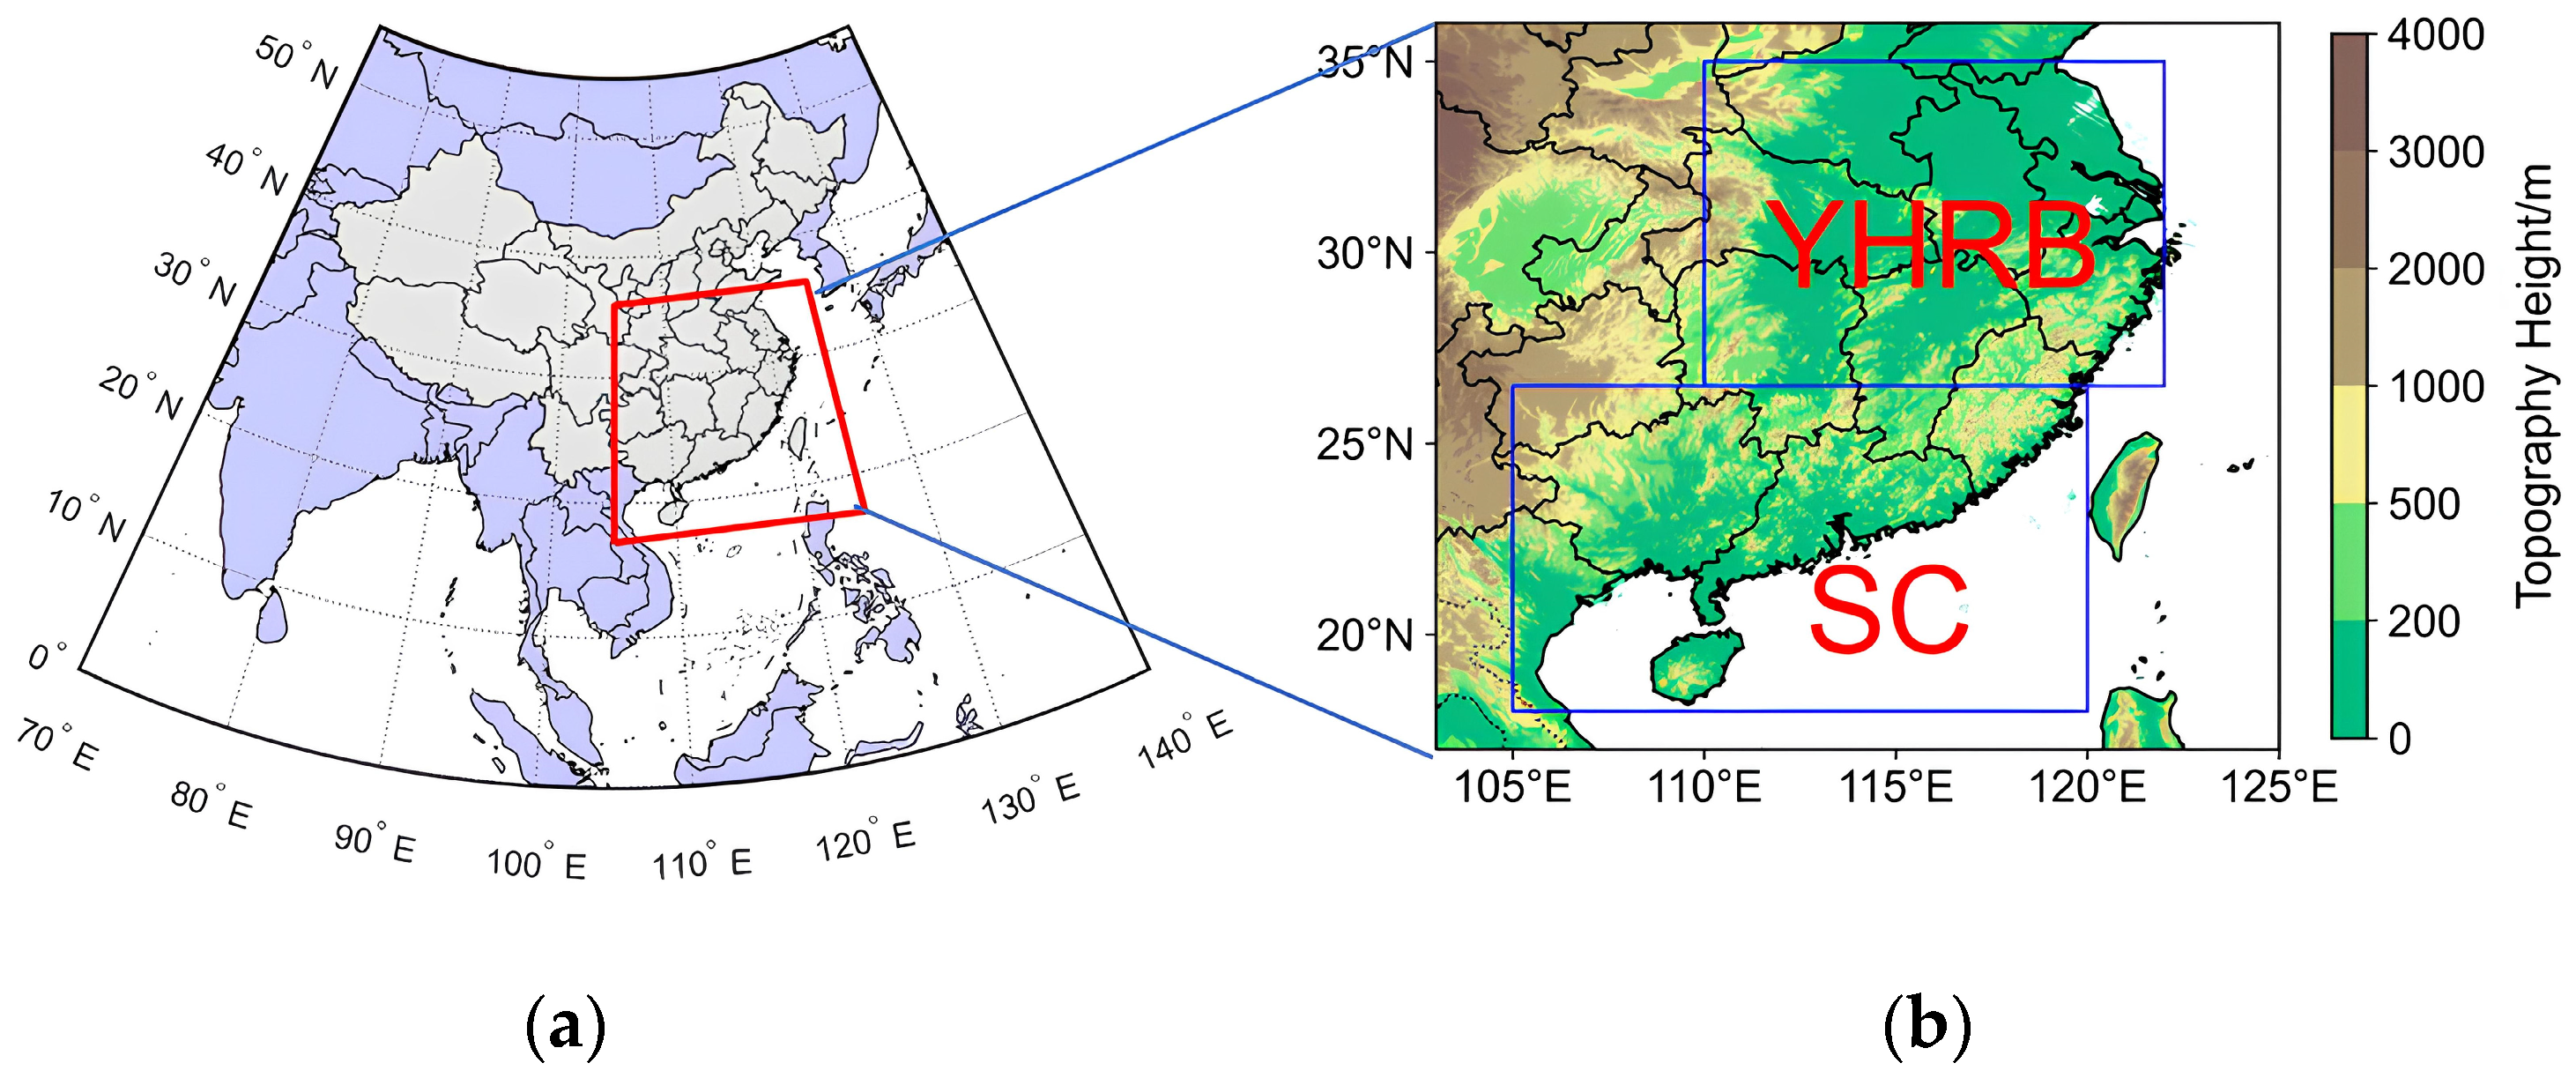
2.2. Rainy Season Dates of YHRB and SC

The Mei-yu period, characterized by an extended period of continuous rainfall, typically lasts from June to July over YHRB. On the other hand, SC experiences its first rainy season earlier between April and June. However, the onset/ending dates and intensity of the rainy season differ significantly from year to year, as shown in Table 1. Researchers primarily divide the rainy season based on fluctuations in precipitation [20]. With the developments in operation, the rainy period is determined by assessing whether the average precipitation intensity at specific stations and the percentage of rainy days satisfy particular requirements [21,22].
The subsequent table presents the onset and ending dates of the Mei-yu period over YHRB and the monsoonal period over SC from 2014 to 2023, as documented in China’s climate bulletins [23].

2.3. The Precipitation Systems, Rainfall Intensity, and Precipitation Efficiency Index

Considering that the precipitation system is characterized by a continuous distribution of pixels in space, the 8-connected component labeling has been utilized for pixel screening (each pixel: about 5 km × 5 km). Large continuous precipitation systems have been the primary focus of the previous research (defined as systems covering more than 100 continuous pixels, with each pixel’s near-surface precipitation not less than 0.5 mm/h [24]).
However, precipitation systems with smaller scales also contribute to precipitation events, which may affect people’s daily life. To prevent noise errors due to an excessive number of samples and to select precipitation systems of all scales, we adopt a connectivity domain filtering threshold of 10 pixels. The monsoon precipitation over YHRB and SC land areas is the focus of this study, so the pixels distributed over the ocean should be excluded. After the screening process, a total of 414,680/394,480 monsoon precipitation pixels within YHRB/SC were identified by GPM DPR from 2014 to 2023.
The impact of different intensities of precipitation on human activities varies significantly, highlighting the importance of categorizing it based on intensity. The hourly rain rates from GPM 2ADPR have been used.
Drawing on the classification standards for hourly precipitation levels in short-term weather forecasts, the intensity of hourly precipitation can be broadly categorized into four levels: drizzle (0–2 mm/h), light rain (2–3.9 mm/h), moderate rain (4–7.9 mm/h), and heavy rain (>8 mm/h). Moreover, the heavy rain category can be further subdivided into three sub-categories: heavy rain (8–19.9 mm/h), extreme rain (20–50 mm/h), and most extreme severe rain (>50 mm/h) [25].
Previous studies defined the precipitation efficiency index (PEI h−1) to measure the extent of precipitation adequacy in the precipitating system [2,26,27]. The previous definition of PEI proposed by Hu et al. [2] is adopted in this study due to the similarity between the selected regions.
PEI = n s R R C W P = n s R R L W P + I W P
where nsRR (mm/h) represents the near-surface rain rate, and CWP (g/m2) is the cloud water path. LWP (g/m2) and IWP (g/m2) denote liquid water path and non-liquid water path, respectively.
The PEI in Figure 2d exhibits a skewed normal distribution within the range of 0–10 h−1. We have chosen to categorize the PEI into three bins average, allowing meaningful comparisons and analyses of different PEI categories. A similar categorization method has been adopted in the previous study [2], according to the defined intervals for the PEI based on its distribution traits. These intervals (0, 3) h−1, (3, 6) h−1, and (6, ∼) h−1 are designated as low, moderate, and high PEI precipitation categories, respectively.

3. Results

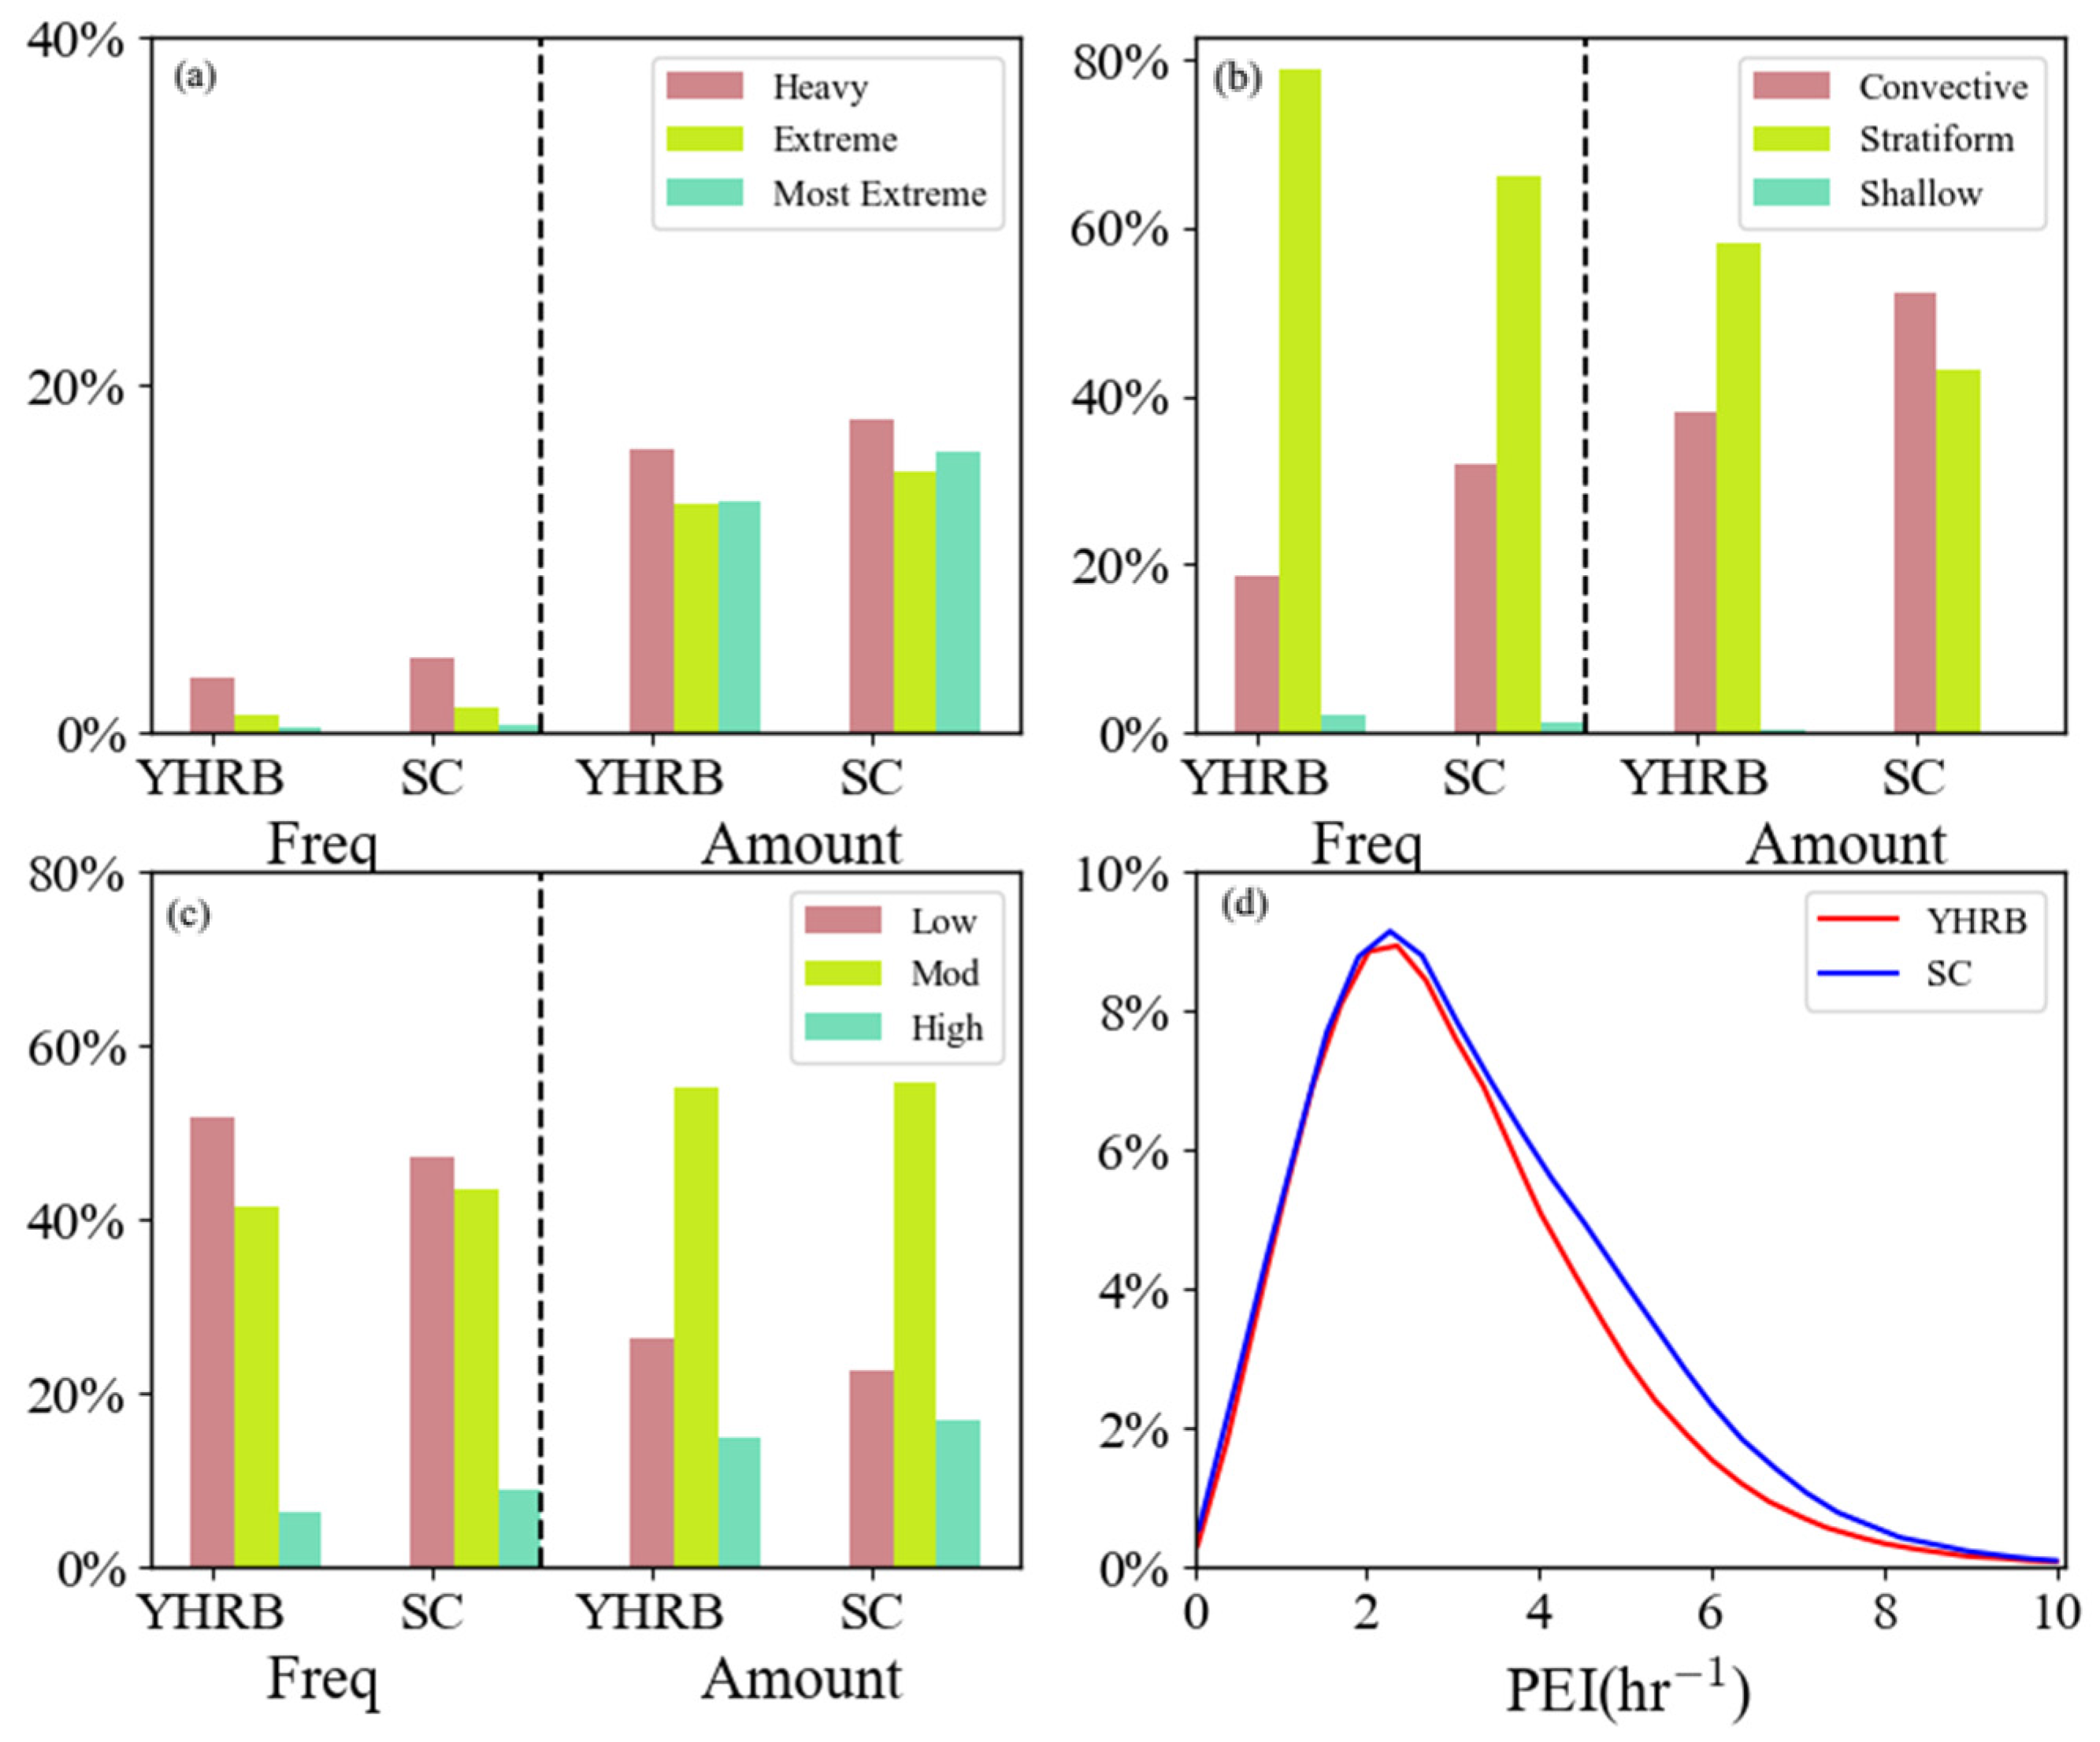
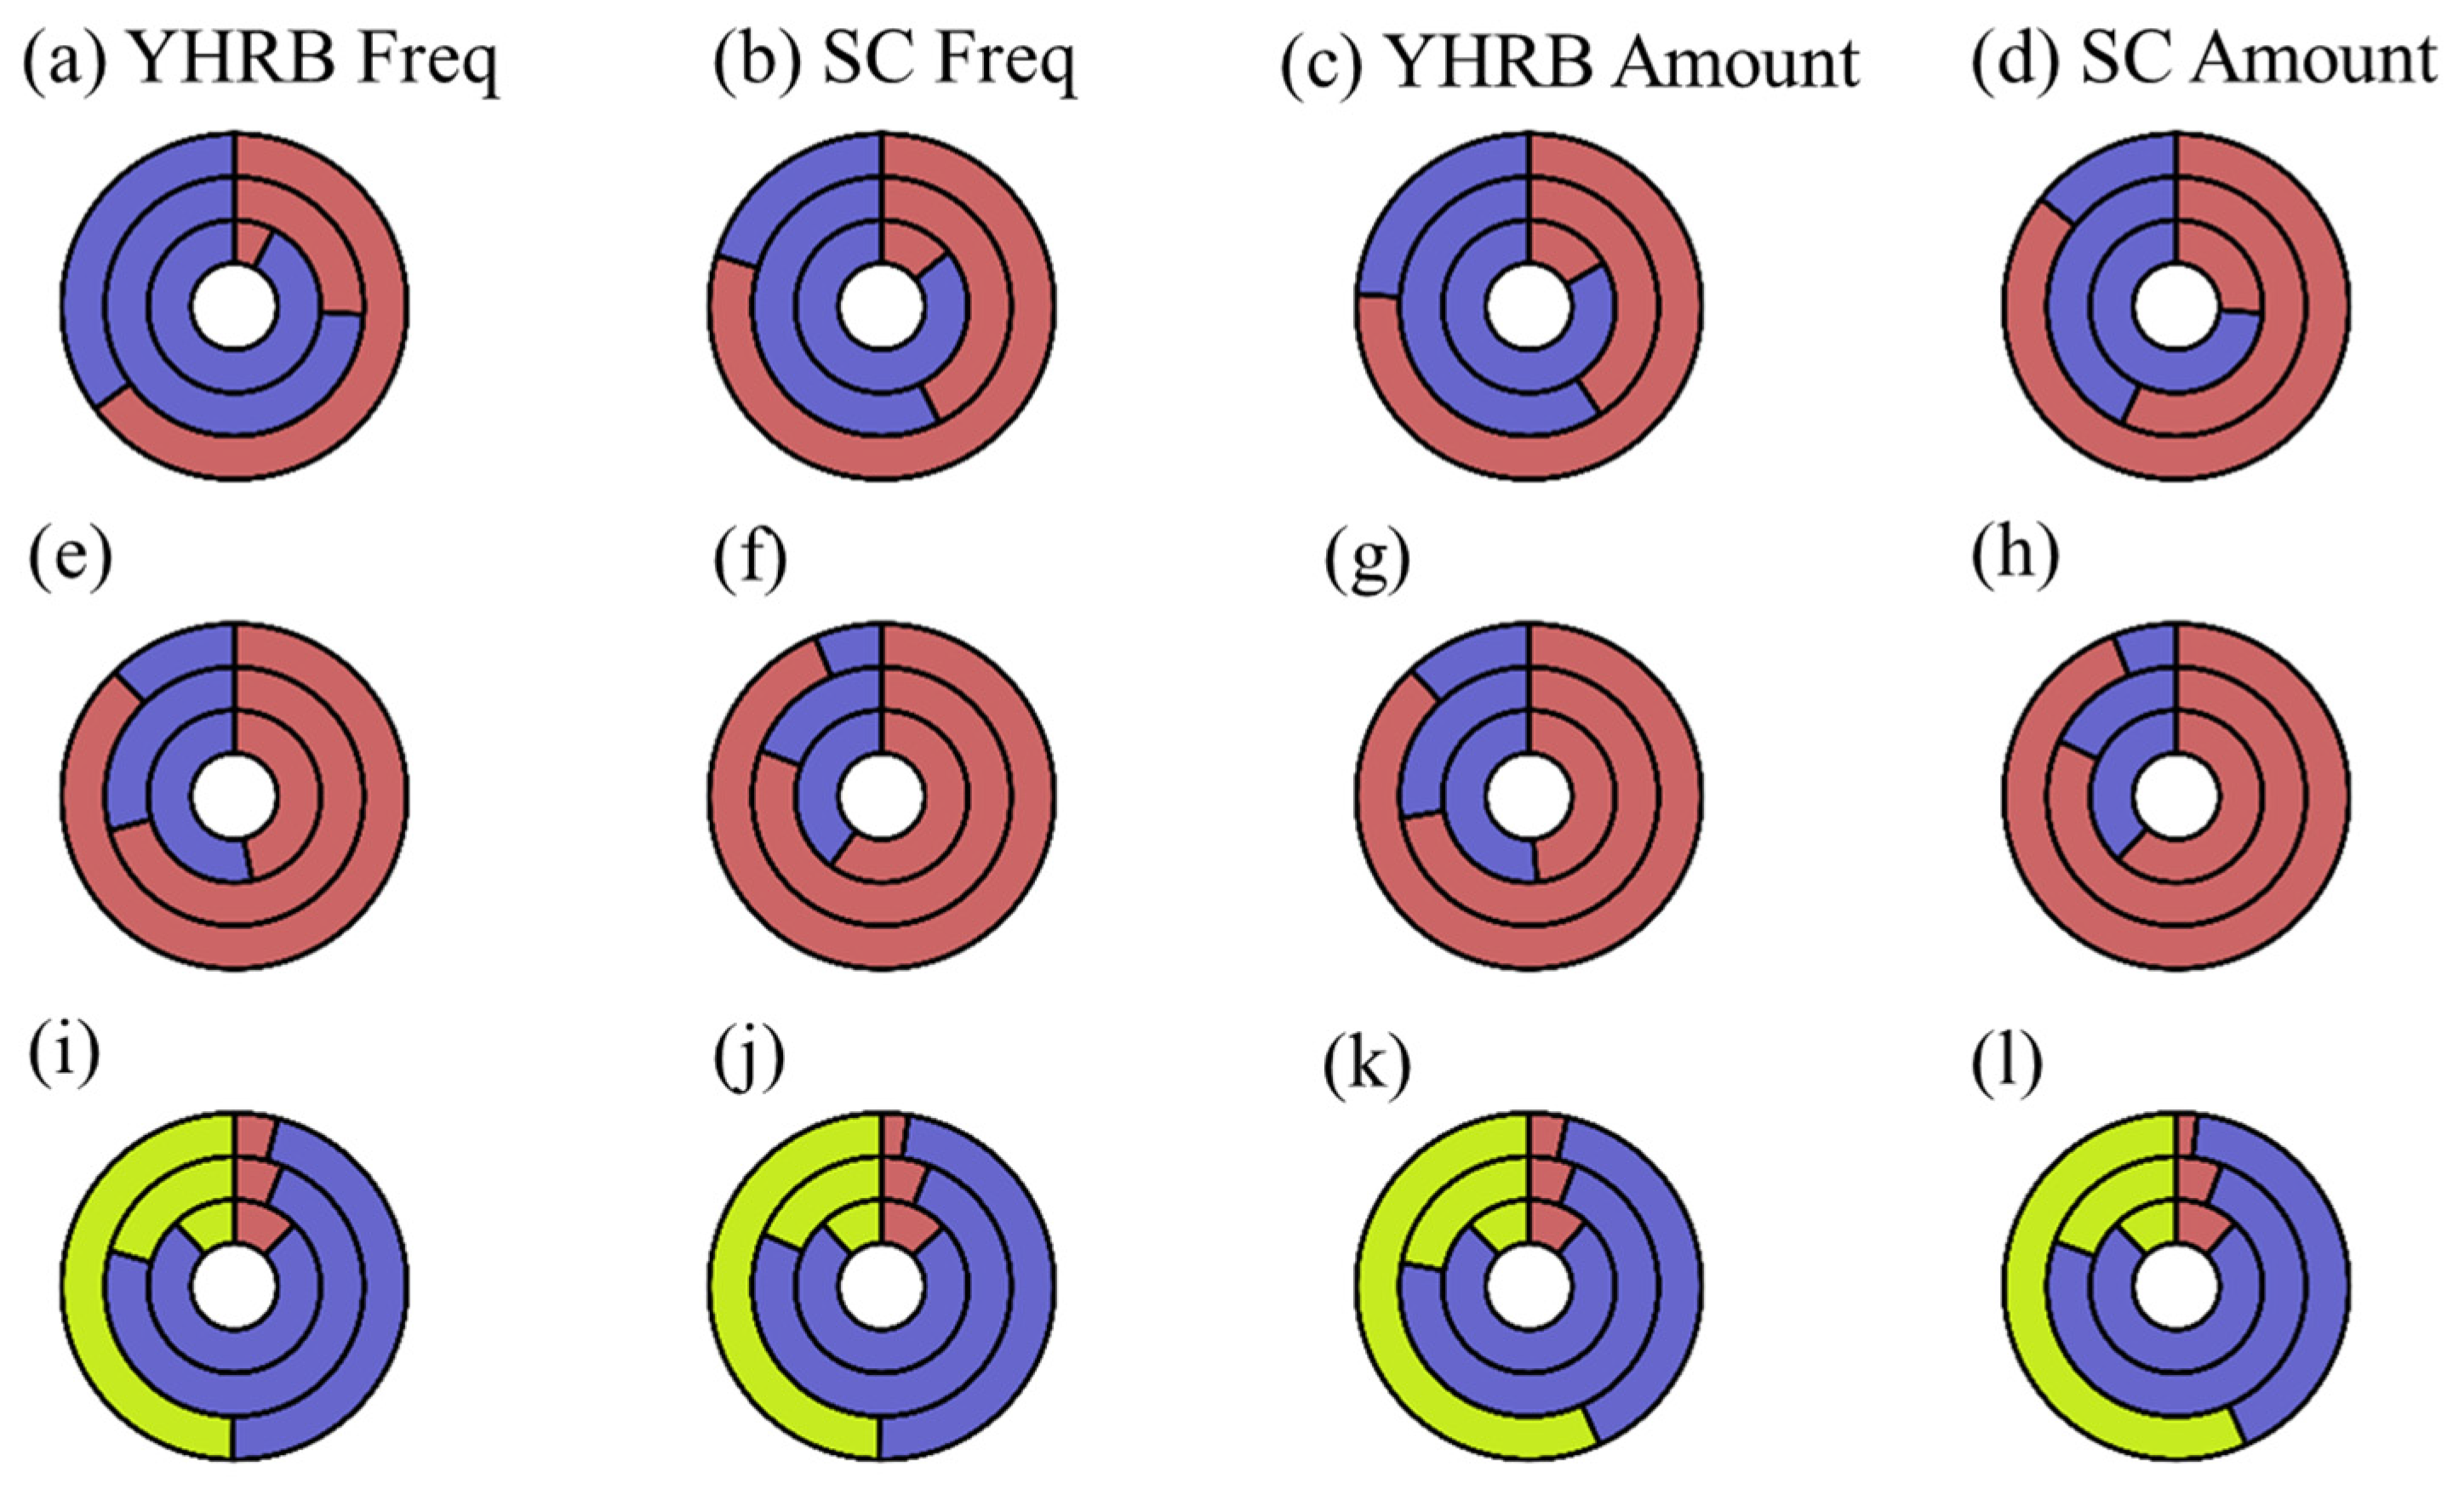
3.1. The Distribution of Various Precipitation Intensities, Types, and PEIs

The statistical results of convective, stratiform, and shallow precipitation samples are shown in Table 2. The average nsRR over SC (2.87 mm/h) is typically greater than that over YHRB (2.27 mm/h) [11]. Moreover, it is revealed that a higher proportion of convective precipitation is at 33%, compared to the 18% observed over YHRB. Moreover, convective precipitation tends to be more intense. A larger frequency/amount (6%/49%) of strong precipitation (>8 mm/h) is observed over SC compared to that (4%/42%) over YHRB. Additionally, a greater proportion of moderate and high PEI precipitation over SC is found to be consistent with the previous findings that convective precipitation tends to have a higher PEI [26]. The frequency/amount contributions of moderate and high precipitation are 52%/73% (48%/70%) over SC (YHRB).
Generally, stratiform precipitation predominates in amount/frequency contribution but with a significantly lower average rain rate compared to convective precipitation. The nsRR of convective precipitation over YHRB/SC is 4.92/4.99 mm/h, while the nsRR of stratiform precipitation is 1.68/1.86 mm/h. Shallow convective precipitation constitutes a very minor proportion, accounting for only 2%/1% of the total pixels over YHRB/SC. Therefore, it will not be included in our detailed analyses.
The Dm at 1 km altitude is utilized by this study to examine the size distribution of near-surface raindrops to mitigate the potential impact of surface obstacles causing droplet fragmentation. The Dm of precipitation over SC is typically larger than that over YHRB, while the Nw is generally smaller, indicating that the precipitation features larger droplets with a lower concentration.
Figure 2a–c show the frequency/amount contribution of precipitation with different intensities/types/PEIs. Overall, the frequency contribution of heavy precipitation is minimal, accounting for only about 5%, yet its amount contribution is considerable, exceeding 40% over both regions. The pattern of low occurrence frequencies and high amounts of contributions is particularly evident in extreme and the most extreme precipitation.
For precipitation with different PEI, the amount contributions of moderate and high PEI precipitation are greater than their frequency contributions, while the pattern for low PEI precipitation is reversed. It can be verified easily according to the definition of PEI.
Figure 2d sketches the approximate Gaussian normal distribution of PEI both for YHRB precipitation and SC precipitation. PEI is mainly distributed between 0 and 8 h−1 in the precipitation of both regions. When the PEI is between 3 h−1 and 8 h−1, the PEI distribution probability of SC precipitation is greater than that of YHRB precipitation. The average PEI of precipitation over SC is larger than that of precipitation over YHRB, with 3.43 h−1 to 3.22 h−1. Although in Table 2, YHRB excels in PEI of convective, stratiform, and shallow precipitation, SC has a higher average precipitation efficiency index due to the high proportion and high efficiency of convective precipitation.
At the same PEI level, Figure 3a–d show that a lower frequency/amount contribution of convective precipitation is observed over YHRB compared to SC. An increase in the proportion of convective precipitation may lead to a higher intensity of the PEI. Convective precipitation is predominant in the most efficient rainfall, with a frequency proportion of 65% (80%) and an amount proportion of 76% (86%) over YHRB (SC). The result represents that convective precipitation with greater overall precipitation adequacy over SC is observed to occur more frequently and contributes more to the total precipitation amount. Stratiform precipitation, on the other hand, is dominant in low and moderate PEI precipitation. Interestingly, for moderate PEI precipitation, the contribution of convective and stratiform precipitation is comparable over SC.
At the same precipitation intensity, the contribution of convective and stratiform precipitation to the total precipitation amount and frequency are almost equal over different regions. The frequency/amount contribution of convective is larger than that of stratiform precipitation at a relatively high intensity (>20 mm/h), which is consistent with the greater intensity of convective precipitation. Additionally, a greater contribution from convective precipitation is observed over SC compared to YHRB. Moreover, convective precipitation dominates in the most extreme rainfall, with frequency/amount proportions of 88% (94%) over YHRB (SC). It is worth noting that the contribution of convective precipitation in heavy precipitation over YHRB is slightly less than that of stratiform precipitation.
The above results show that most of the strong precipitation is caused by convective precipitation. However, the stratiform precipitation over YHRB can also lead to heavy precipitation (8–20 mm/h).
Among all the intensity classifications, the frequency and amount of contributions of low PEI precipitation are the lowest, while the contributions over YHRB are higher than those over SC. High PEI precipitation is likely to exhibit greater intensity due to its higher frequency and amount of contributions in intense precipitation. It is similar to the conclusion of Hu et al. [2]. Overall, moderate PEI precipitation is the primary contributor across all intensity levels; for example, over SC, it accounts for 88%, 80%, and 49% of heavy, extreme, and most extreme precipitation.

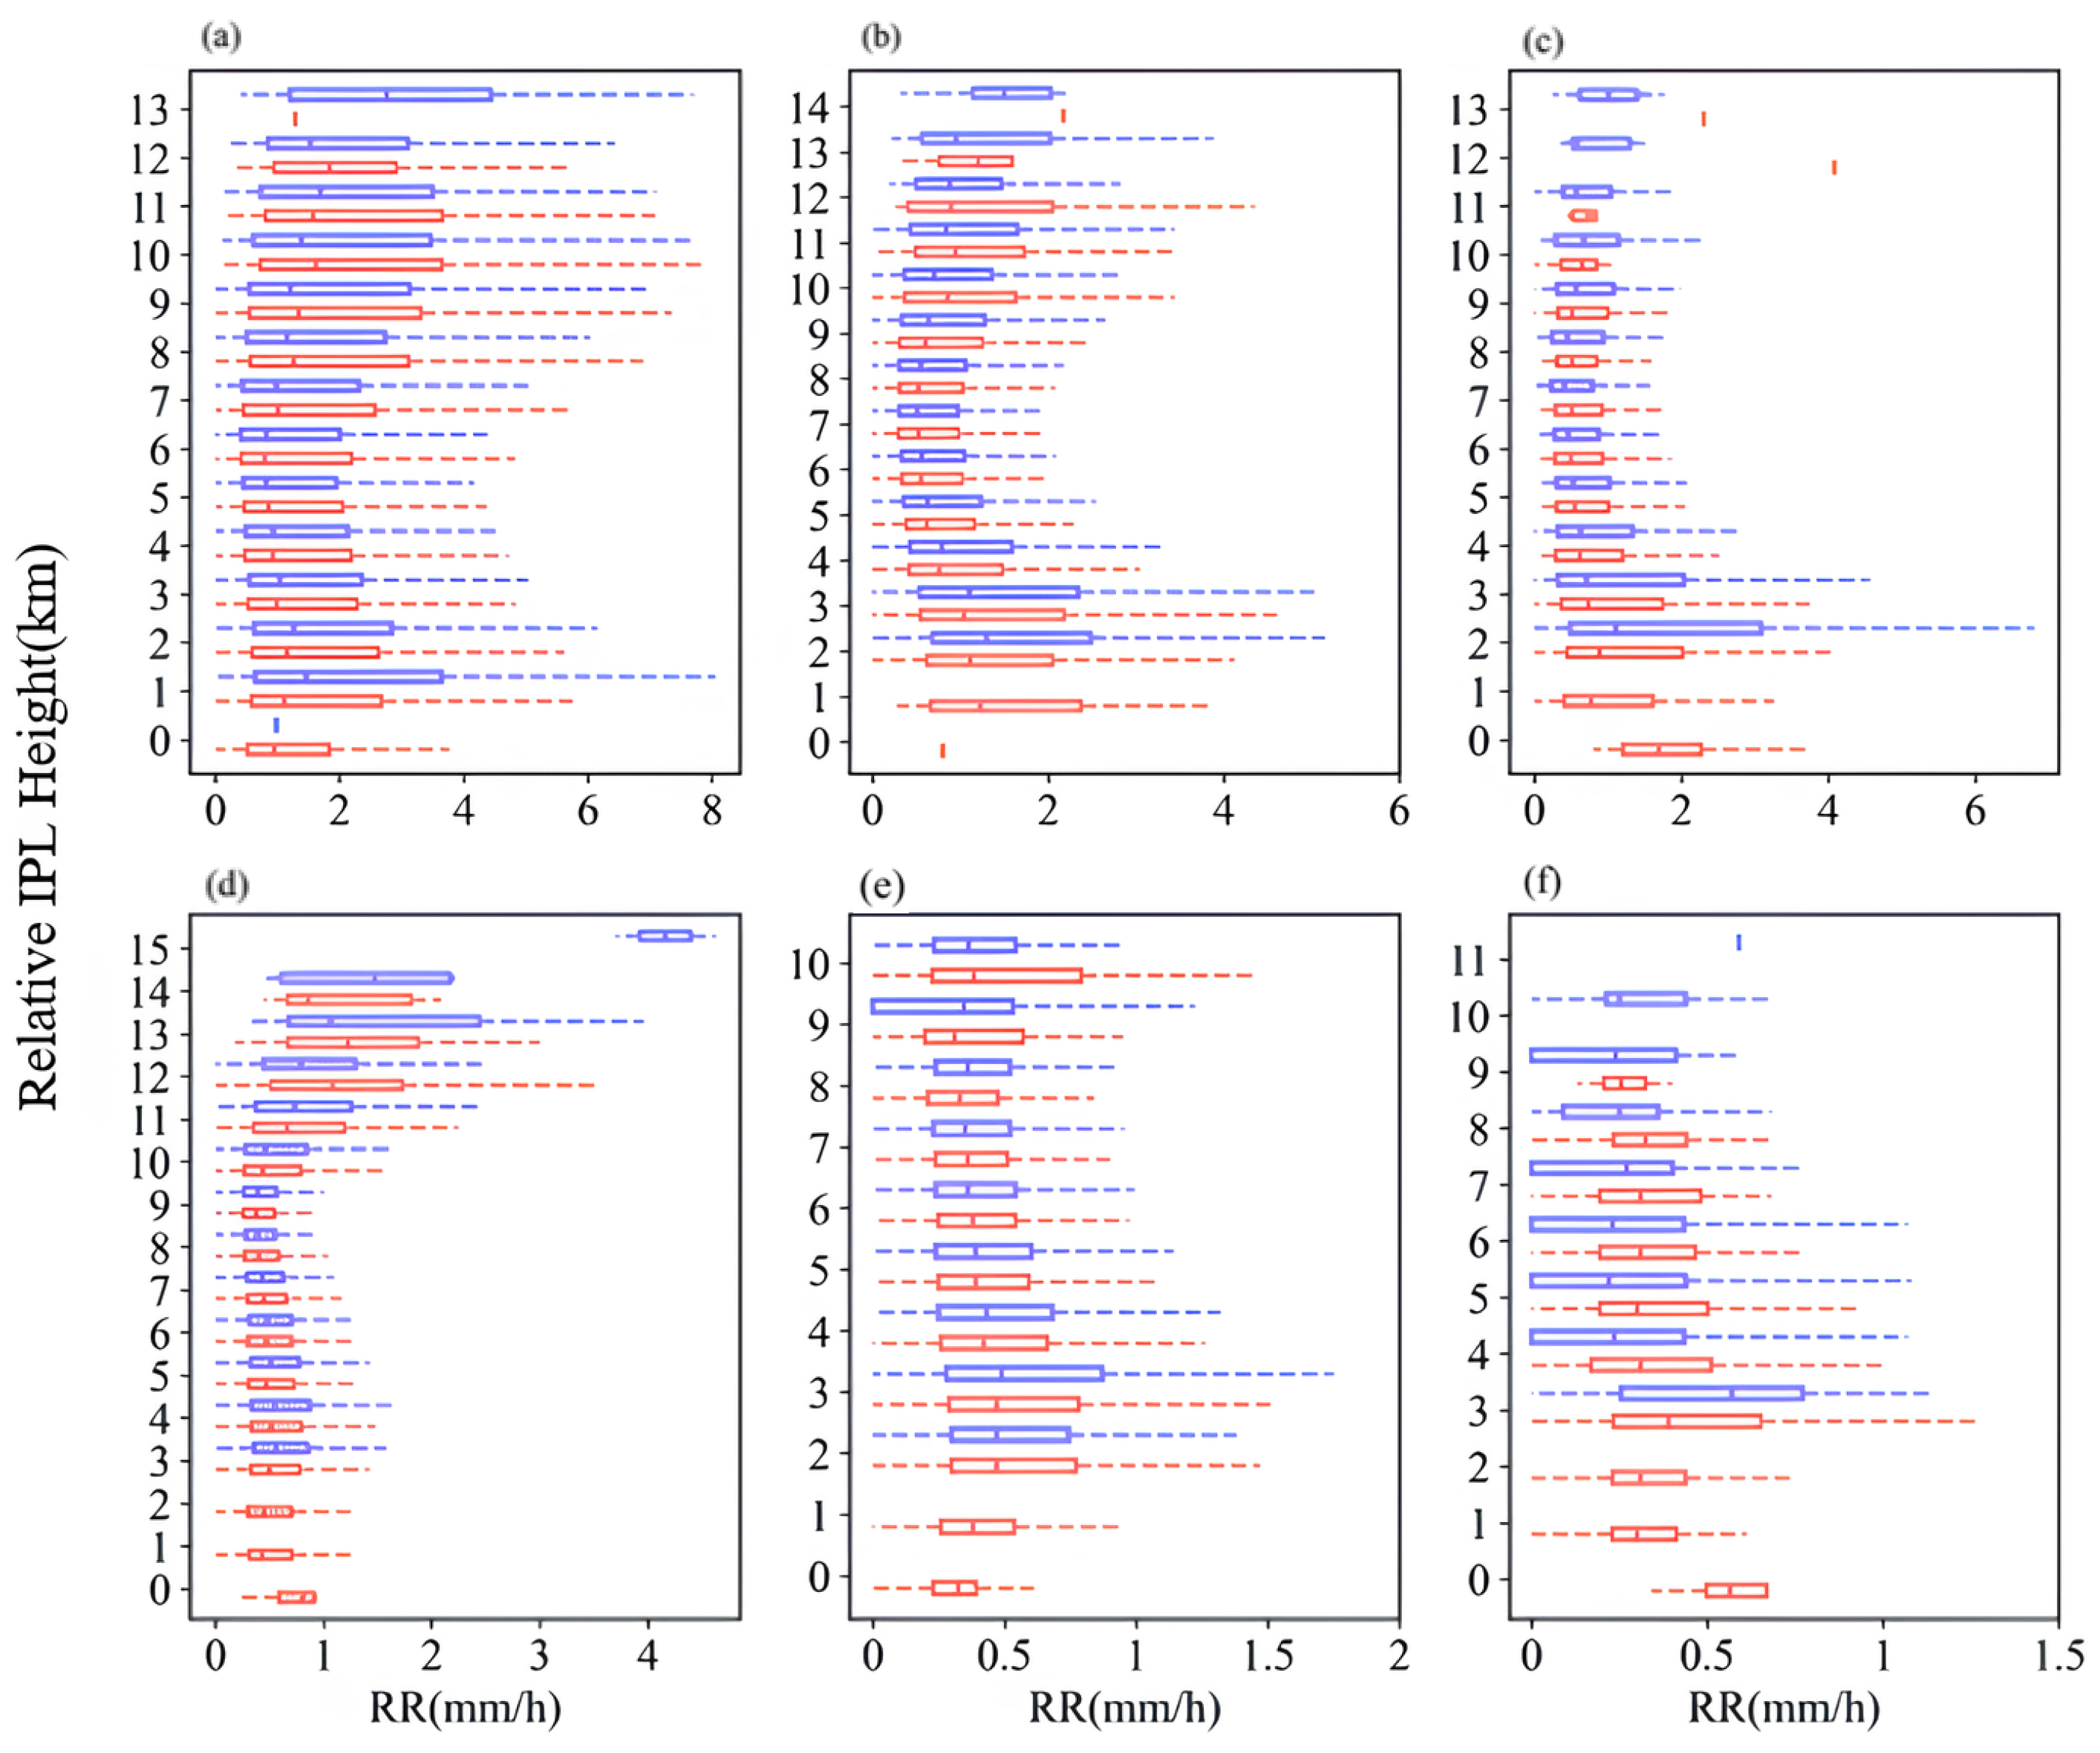
3.2. The DSD and Vertical Structure of Precipitation

Scatterplots were employed to illustrate the distribution of Dm − log10Nw pairs at a height of 1 km for the three types of precipitation (Figure 4a,b). As can be seen, the Dm − log10Nw pairs for convective precipitation spanned a wider range than those of stratiform and shallow convective precipitation. Bringi et al. [28] proposed that the DSDs can be identified as “maritime-like” and “continental-like” clusters in convective precipitation. The maritime cluster [28] was populated with Dm versus Nw pairs for convective and stratiform precipitation over the two regions.
In Figure 4c, the distribution plots of average Dm and log10Nw pairs for the three types of precipitation indicate that the convective Dm – log10Nw pair distribution range is the broadest, with stratiform precipitation following, and shallow convective has the thinnest range. The Dm − log10Nw pairs of the entire precipitation samples are more similar to stratiform precipitation, particularly over YHRB, where stratiform precipitation constitutes a significant portion of the total precipitation, accounting for nearly 79%. The variation in distribution ranges suggests that the convective DSDs undergo more complex microphysical processes, while the shallow convective microphysical processes are relatively simple.
All three types of precipitation over both regions, as well as the overall precipitation, are situated to the left of the stratiform line [28]. The mean and standard deviation of Dm and Nw decrease progressively from convective stratiform to shallow precipitation. Compared to SC, there are smaller Dm and larger Nw within the three types of precipitation over YHRB.
After selecting strong precipitation samples with nsRR exceeding 10, the average DSD values for both regions have been computed. Their DSD characteristics are similar to those of the maritime cluster. The strong precipitation over both regions is categorized as deep maritime convection, as the categorization by Ryu et al. [29]. The primary probable reason is that the monsoon precipitation over SC and YHRB contains a substantial volume of water vapor, which could be the underlying factor for their distinct maritime-like microphysical characteristics [26,30,31].
As shown in Figure 5a, the Dm of precipitation over YHRB is more tightly clustered around the peak, with the distribution values at the peak of convective (stratiform) precipitation reaching 10.5% (17.5%), whereas for SC, they are only 8.3% (13.1%). Compared to YHRB, the data distribution is more scattered for convective and stratiform precipitation over SC. It is noteworthy that both regions show a significant decrease in the PDF at a Dm value of approximately 1.25 mm. Considering Figure 5a,b, and Table 2, there are larger near-ground raindrops but fewer in number over SC, while the pattern is reversed over YHRB. Figure 5b shows that both convective and shallow precipitation exhibit bimodal distributions over SC. For convective precipitation, the first peak occurs at 3.8 mm−1m−3, and the second peak is at around 3.4 mm−1m−3.
Figure 6 shows the vertical structure of average Dm, Nw, and Ze. It can be calculated that the storm top height of convective precipitation is around 15 km, while stratiform precipitation is around 12 km. It shows that the vertical updraft in convective precipitation is sufficiently intense to elevate clouds to a greater altitude compared to stratiform precipitation. The vertical profiles of Dm, Nw, and Ze can indicate vertical evolutions of mean sizes and concentrations of hydrometeors, suggesting various microphysical processes during hydrometeors dropping.
Dm, Nw, and Ze vary with changes in PEI and precipitation intensity. Both a decrease in PEI and an increase in precipitation intensity led to an increase in convective precipitation Dm. Conversely, an increase in PEI and a decrease in precipitation intensity result in an increase in stratiform precipitation Dm. In the profiles of Nw, both a decrease in PEI and an increase in precipitation intensity can lead to an increase in convective precipitation (above 8 km) and stratiform precipitation.
The convective precipitation Ze profile changes with the PEI and precipitation intensity are consistent with the Dm profile, indicating that Dm plays a major role in the variation of the convective precipitation reflectivity factor. It is necessary to integrate the effects of Dm and Nw to analyze the variations of stratiform precipitation Ze profiles. The positive impact of Dm growth on Ze profiles is greater than the negative impact of Nw reduction as PEI increases, indicating that Dm is predominantly influential in the variation of Ze. Similarly, it is observed that Nw is the primary factor affected by changes in precipitation intensity for the variation of Ze.
There are some differences between YHRB and SC. The near-surface Dm of low PEI precipitation over YHRB is greater than that over SC, which may be associated with the relatively weak collisional break-up in the falling process below the melting layer, resulting in less decrease in Dm as the height falls. Moreover, it is worth noting that YHRB lacks M-ExL stratiform precipitation samples.
The vertical structure of precipitation can reflect thermal and dynamic stratification characteristics and microphysical characteristics of precipitation clusters [32].
There is a stronger trend of decreasing Dm and increasing Nw as the height falls in convective precipitation over SC from 15 km to 10 km. The result may represent that the deposition process in the rising parcels of air is stronger over SC than over YHRB [10]. Additionally, the decrease in Ze over the two regions with increasing height is associated with the smaller and fewer ice particles lifted to higher heights [11].
From 10 to 5 km, there is a sudden increase in Dm of low PEI extreme precipitation and the most extreme precipitation as height falls. The Dm increases by 0.81 and 0.96 mm, respectively, corresponding to a sudden decrease in Nw. This may indicate the formation mechanism of extreme precipitation with low PEI conditions: small ice particles with high concentration grow into large particles with low concentration through deposition and aggregation processes [33]. However, there is sufficient water vapor to allow the diameter and concentration of particles to increase simultaneously for precipitation with relatively high precipitation efficiency. Moreover, the Ze profile of convective precipitation with low PEI shows evident bright band (BB) characteristics. As can be seen, there is a maximum value of Ze at around 5 km. The explanation for it may be the combined effect of collision–coalescence above the melting layer and collisional break-up below it.
In contrast to convective precipitation, the Dm of stratiform precipitation over YHRB decreases as height falls from 12 km to 8 km, indicating a stronger deposition and aggregation process. The Nw profile of stratiform precipitation does not show a sudden decrease but steadily increases as height falls. During the process of the Ze profile from the STH to the melting layer, the profiles of different types of precipitation are very close. They only separate below the melting layer. It is because precipitation with high Dm often has low Nw, and the dilemma of Dm and Nw makes Ze of different precipitation equal in the previous process. Variations in lower atmospheric moisture content and temperature lead to fluctuations in the Dm profile of precipitating clouds in the latter process. According to the dependence of Ze on the sixth power of Dm, it contributes significantly to the variation of Ze [28].
In the area above the melting layer, the DSD and Ze variations of different precipitation classifications may be caused by ice phase layer (IPL) processes and STH. Additionally, we think that there are significant factors that can also influence the process below the MLT, such as MLTH, melting layer bottom height (MLBH), and melting layer width (MLW).
The IPL is an important region of physical processes for precipitation. Its position, width, and intensity of the ice phase processes affect the phase, size, and concentration of precipitation particles, thereby influencing the intensity of precipitation and the value of Ze [32].
Figure 7 shows the changes in the vertical structure of rain rate within the IPL over YHRB and SC. The zero point on the vertical axis represents the height of the IPL bottom over YHRB, while the maximum point represents the height of the IPL top over SC.
Compared to YHRB, the height of the IPL over SC is higher for the same precipitation type. When the height of the IPL is higher, the rain rate in its lower layers is larger. This may be because higher altitude means lower temperature, which promotes the growth process of precipitation particles in the IPL. The maximum precipitation intensity within the IPL generally occurs at the 0–3 km IPL width over SC, further verifying that the IPL processes are more active. Interestingly, the maximum precipitation intensity in high PEI precipitation over SC is lower than that over YHRB. Compared to other classifications, there is a significant leftward shift in its rain rate profile.
The convective precipitation has a greater precipitation intensity within the IPL, reaching up to 8 mm/h, and the distribution range of precipitation intensity is also wider. The maximum width of the IPL in the convective precipitation over the two regions is generally the same. However, YHRB has a larger width of the IPL in the stratiform precipitation. The IPL width of stratiform precipitation with PEI > 6 h−1 is smaller than that of corresponding convective precipitation. It is worth noting that the IPL width of the stratiform precipitation with smaller PEI is abnormally large.
Figure 8a–f show that the STH peak over SC is usually larger than that over YHRB, and the frequency of high STH distribution is also higher. Apart from the high PEI stratiform precipitation, its STH is smaller than YHRB. From the results in Figure 9, it can be seen that the rain rate structure within its IPL also exhibits prominent differences. As PEI increases, the peak of STH becomes smaller and is more concentrated in the peak region, indicating a decrease in STH.
The distribution characteristics of STH in different classifications and regions are consistent with the characteristics of the rain rate vertical structure in the IPL in Figure 9. This may indicate a certain correlation between STH and the IPL processes. It is assumed that the higher the STH, the more beneficial it is for the upward growth of the IPL, and there is sufficient space for the precipitation to grow into large particles through condensation and riming, which contributes significantly to the higher precipitation intensity in the lower layer of the IPL over SC.
The analyses of MLTH of convective and stratiform precipitation with different PEI were performed over SC and YHRB in Figure 8g–l and Figure 9. Generally, it should be highlighted that the means of MLTH over SC is larger than that over YHRB. The MLTH peaks are concentrated within the height range of 6–6.5 km over SC, indicating a more centralized distribution pattern. Comparatively, there is an approximate bimodal characteristic in the MLTH distribution over YHRB, with the first peak occurring around 5 km and the second near 6.5 km. In detail, the MLTH over SC ranges from 5 km to 7 km, while the range over YHRB is wider (3–7 km). Specifically, YHRB exhibits the most extensive distribution in Figure 8l.
As can be seen from Figure 9, the means of MLTH and MLBH of precipitation over SC are approximately 0.5 km higher than those over YHRB. It is consistent with the previous investigations suggesting that the height of the melting layer decreases with the increase in latitude [34,35]. Specifically, MLTH (MLBH) generally exceeds 4.5 km (3 km) over YHRB, while they are above 5 km (3.6 km) over SC. There are several obvious maximum value centers over YHRB for MLTH (MLBH). Conversely, only a notable high-value center exists in southern Fujian over SC. Minimum values for SC’s MLTH (MLBH) occur along the coastlines, eastern Guangxi, southern Jiangxi, and the northeastern coast of Hainan Island. The distribution of MLW of precipitation over these two regions is relatively centralized. It is mainly distributed between 1.3 mm and 1.6 mm, and there are scattered maximum value centers (yellow areas). Those over SC have a larger coverage area. Moreover, the means of MLW of precipitation over SC is greater.
The average STH of precipitation over SC is higher. A closer inspection of the figure shows that the distribution for the four parameters, MLTH, MLBH, MLW, and STH, is more concentrated over SC.
CAPE represents atmospheric instability, and an increase in CAPE indicates a positive trend in the upward velocity and the development of convection. As shown in Figure 9i,j, over YHRB, the maximum CAPE value appears in the northern part of Jiangxi, the northern part of Fujian, and the eastern coastal area of Fujian and Zhejiang. This is consistent with the locations of the maximum MLTH, MLBH, and STH in Figure 9. Over SC, the CAPE in the northern part is smaller and more evenly distributed, while the CAPE values gradually increase toward the southern part, with the maximum value appearing in the northeastern part of Hainan Island. This is very similar to the distribution of the maximum MLW in Figure 9.
In summary, the result may represent that the increase in atmospheric instability energy is conducive to elevating MLTH, MLBH, and STH.

3.3. Precipitation Microphysical Properties

There are significant differences between the STH and MLT in the two regions, whereas the vertical structure of precipitation is closely related to the occurrence of surface precipitation [16]. To further reveal the differences in microphysical processes in the vertical direction of precipitation between the two regions, this study classifies the precipitation structure into the IPL (corresponding to the height from STH to −5 °C), the melting layer (corresponding to the height from −5 °C to 5 °C), and the liquid phase layer (corresponding to the height from 5 °C to the ground) from top to bottom [32]. This section aims to investigate the microphysical processes that occur within each layer and their influence on the overall precipitation microphysics.
To achieve a deeper comprehension of the microphysical processes during the rainy season’s precipitation evolution over YHRB and SC, Figure 10 shows a two-dimensional PDF between ΔDm and ΔZe for convective precipitation and stratiform precipitation with different PEIs. Defined as the differences between 1 km and 3 km, ΔZe and ΔDm facilitate the observation of microphysical processes. These two values can be calculated as ΔZe = Ze1kmZe3km and ΔDm = Dm1kmDm3km. The increase (decrease) in Ze and Dm are indicative of dominant collision–coalescence processes, while a rise in Ze with falling Dm points to a balance between break-up and coalescence. Conversely, a drop in Ze and a rise in Dm signal dominant evaporation or size sorting [26].
As can be seen from Figure 10, the center of gravity of the probability density shifts to the upper right as the PEI increases, from the negative quadrant to the positive quadrant, representing a shift in the main microphysical processes from collisional break-up to collision–coalescence. The break-up of raindrops is the dominant microphysical process in the stratiform precipitation, with PEI ranging from 0 to 3 h−1, accounting for 67.8% (68.1%) over YHRB (SC). Moreover, the minimum value of ΔDm is smaller than −0.5 mm, and that of ΔZe is smaller than −10 dB Ze in the stratiform precipitation. The probable explanation is that the falling process dominated by collisional break-up leads to smaller near-surface raindrops. Collision–coalescence processes dominate in the precipitation with PEI larger than 3 h−1, especially when PEI is larger than 6 h−1 in the convective precipitation, where they account for 86.9% (87.8%) over YHRB (SC). The high PEI convective precipitation with larger maximum values of ΔDm and ΔZe can result in larger near-surface raindrops through the collision–coalescence.
Despite all the similarities, there are still differences between precipitation over YHRB and SC for a given PEI. The most significant difference between the two regions lies in the convective precipitation with low PEI. The proportion of the break-up processes over YHRB is 7.7% higher than that over SC, while the collision–coalescence processes over YHRB are 7.2% less. We define the condition as a positive phase when the frequency in the positive quadrant is higher over SC and the frequency in the negative quadrant is higher over YHRB. Therefore, convective precipitation with PEI ranging from 0 to 6 h−1 is in the positive phase, while it is in the negative phase at high PEI (>6 h−1). Conversely, stratiform precipitation is in the negative phase when PEI is 0–6 h−1. Both the break-up and coalescence processes are more intense in the precipitation with high PEI over SC. The microphysical processes of convective and stratiform precipitation in the two regions show a symmetrically opposite relationship with the change in PEI.
The width of the IPL in convective precipitation is significantly greater than that in stratiform precipitation, reaching a staggering width of up to 13–14 km. The IPL width of convective precipitation is mainly distributed between 0 and 10 km, while that of stratiform precipitation is distributed between 0 and 6 km. As the PEI increases, the IPL width in precipitation in both regions tends to concentrate toward lower values, with the maximum IPL width decreasing.
Overall, there is a trend of decreasing IPL width when PEI increases. The width of the IPL in precipitation in SC is slightly greater than that in YHRB for both convective and stratiform precipitation. Especially, for low PEI and low precipitation intensity in YHRB, the distribution is concentrated at 2 km and 5 km. In contrast, the precipitation distribution in SC is more scattered. In stratiform precipitation, the IPL width in YHRB is concentrated between 0 and 3 km, while in SC, the IPL width is more dispersed, with a significant distribution between 0 and 6 km.
With the purpose of further studying the differences in the microphysical properties of precipitating clouds in terms of different IPL widths, we defined the intervals of IPL width to classify precipitation samples into three types for classification and statistics. Those intervals are the (0, 5) km, (5, 10) km, and (10, ∼) km, which are defined as low, moderate, and high IPL width precipitation, respectively. As shown in Figure 11, the proportion of precipitation samples classified into three width grades constitute the following percentages within the six categories of precipitation classified by PEI values and rain types.
As can be seen from Figure 12, a greater proportion of precipitation samples with IPL width ranging from 5 km to 10 km is observed over SC. Low-width precipitation samples (0–3 km) are dominant in stratiform precipitation, accounting for over 90%, which may imply that the IPL width in stratiform precipitation is generally smaller. Moreover, the proportion of low-width precipitation samples increases as the PEI increases.
A higher PEI is associated with an increase in nsRR for a given IPL width. Moreover, an increase in IPL width leads to a greater nsRR when the PEI is stable. The maximum nsRR appears in the HCM classification of SC. Except for this classification of precipitation, the nsRR in other classifications is greater over YHRB than over SC. It is noteworthy that the HCH, MSH, and HSH classifications lack corresponding samples.
Overall, the IPL width is often smaller in high PEI precipitation, which makes it challenging for precipitation to have both high PEI and large IPL width simultaneously. A larger IPL width may lead to more intense surface rainfall for a given PEI. A possible explanation is that a greater fall distance may allow for more complete IPL processes such as deposition, aggregation, and riming.
Figure 13 shows the relationship between IPL physical processes and near-surface precipitation. The main distribution range of convective precipitation is larger than that of stratiform precipitation. Taking low PEI precipitation as an example, the IPL width of convective precipitation is mainly distributed in the range of 0–6 km, with near-surface precipitation reaching 2 mm/h, while the IPL width of stratiform precipitation is mainly distributed in the range of 0–2.5 km.
The distribution for both types tends to flatten with an increased occurrence probability of more intense near-surface precipitation as the PEI increases. It is noteworthy that the distribution concentration regions exhibit a characteristic of bulging upward to the right, indicating a positive correlation between IPL width and precipitation intensity.
Over YHRB and SC, the most significant difference in precipitation is observed in precipitation with an IPL width smaller than 10 km. The concentration area of the sample distribution over SC is characterized by a clear upward bulging, indicating that the IPL width of precipitation samples is larger.
Overall, the physical processes within the IPL can significantly contribute to the increase in nsRR, and they are more active over SC.
ΔZi represents the change in radar reflectivity intensity detected by the DPR after precipitation passes through the melting layer, which can be calculated using the following formula ΔZi = ZeSTH+500mZeMLT−500m. The larger the ΔZi, the greater the increase in reflectivity factor after precipitation passes through the melting layer, implying a stronger role. The sample distribution shapes also exhibit a bulge to the right and upward, implying that ΔZi may be proportional to near-surface precipitation. Overall, the distribution characteristics of raindrops in Figure 13 and Figure 14 are quite similar, suggesting that the IPL and melting layer have a similar promoting effect on the increase in near-surface rainfall intensity.
As shown in Figure 15, the maximum value of w occurs in the range of 4–8 km. Specifically, the w applied in PEI precipitation with PEI larger than 6 h−1 causes fluctuations to occur. The peak of the w applied in stratiform precipitation with high PEI appears near 1 km over SC. Above a critical altitude, the w in YHRB precipitation is greater than that in SC, while below this critical height, SC has a higher w.
Interestingly, for moderate PEI stratiform precipitation, the wind profile displays a four-stage pattern: above 9 km, the w is higher over YHRB; from 9 km to 6 km, it is higher over SC; from 6 km to 4.5 km, it is the same as the first stage; and below 4.5 km, SC has a higher w. For low PEI convective precipitation and for high PEI convective and stratiform precipitation, the deviation between the two regions’ profiles is significant, with the maximum w difference at the given altitude reaching 0.05 m/s.

4. Conclusions

With the purpose of further understanding monsoon precipitation characteristics, the comparative analyses of precipitation microphysics during the rainy season over YHRB and SC have been investigated based on GPM DPR observations from 2014 to 2023. The comparison includes the general distribution characteristics, vertical structure, and microphysical processes of precipitation. The main conclusions are summarized as follows.
  • The comparative analyses present the general precipitation characteristics and uncover the interrelationships among these characteristics. The mean near-surface rain rate and PEI are typically greater over SC, which may be associated with the more frequent occurrence of convective precipitation. When precipitation intensity or PEI remains nearly constant and the other is increasing, the proportion of convective precipitation increases as the rise in precipitation intensity or PEI, verifying the larger intensity and PEI owned by convective precipitation. It was found that although convective precipitation is dominant in the strong precipitation (>8 mm/h), stratiform precipitation can also be a significant contributor to the less intense strong precipitation (8–20 mm/h), accounting for 60% over YHRB. Specifically, moderate PEI precipitation is the primary contributor to strong precipitation (>8 mm/h) rather than high PEI precipitation;
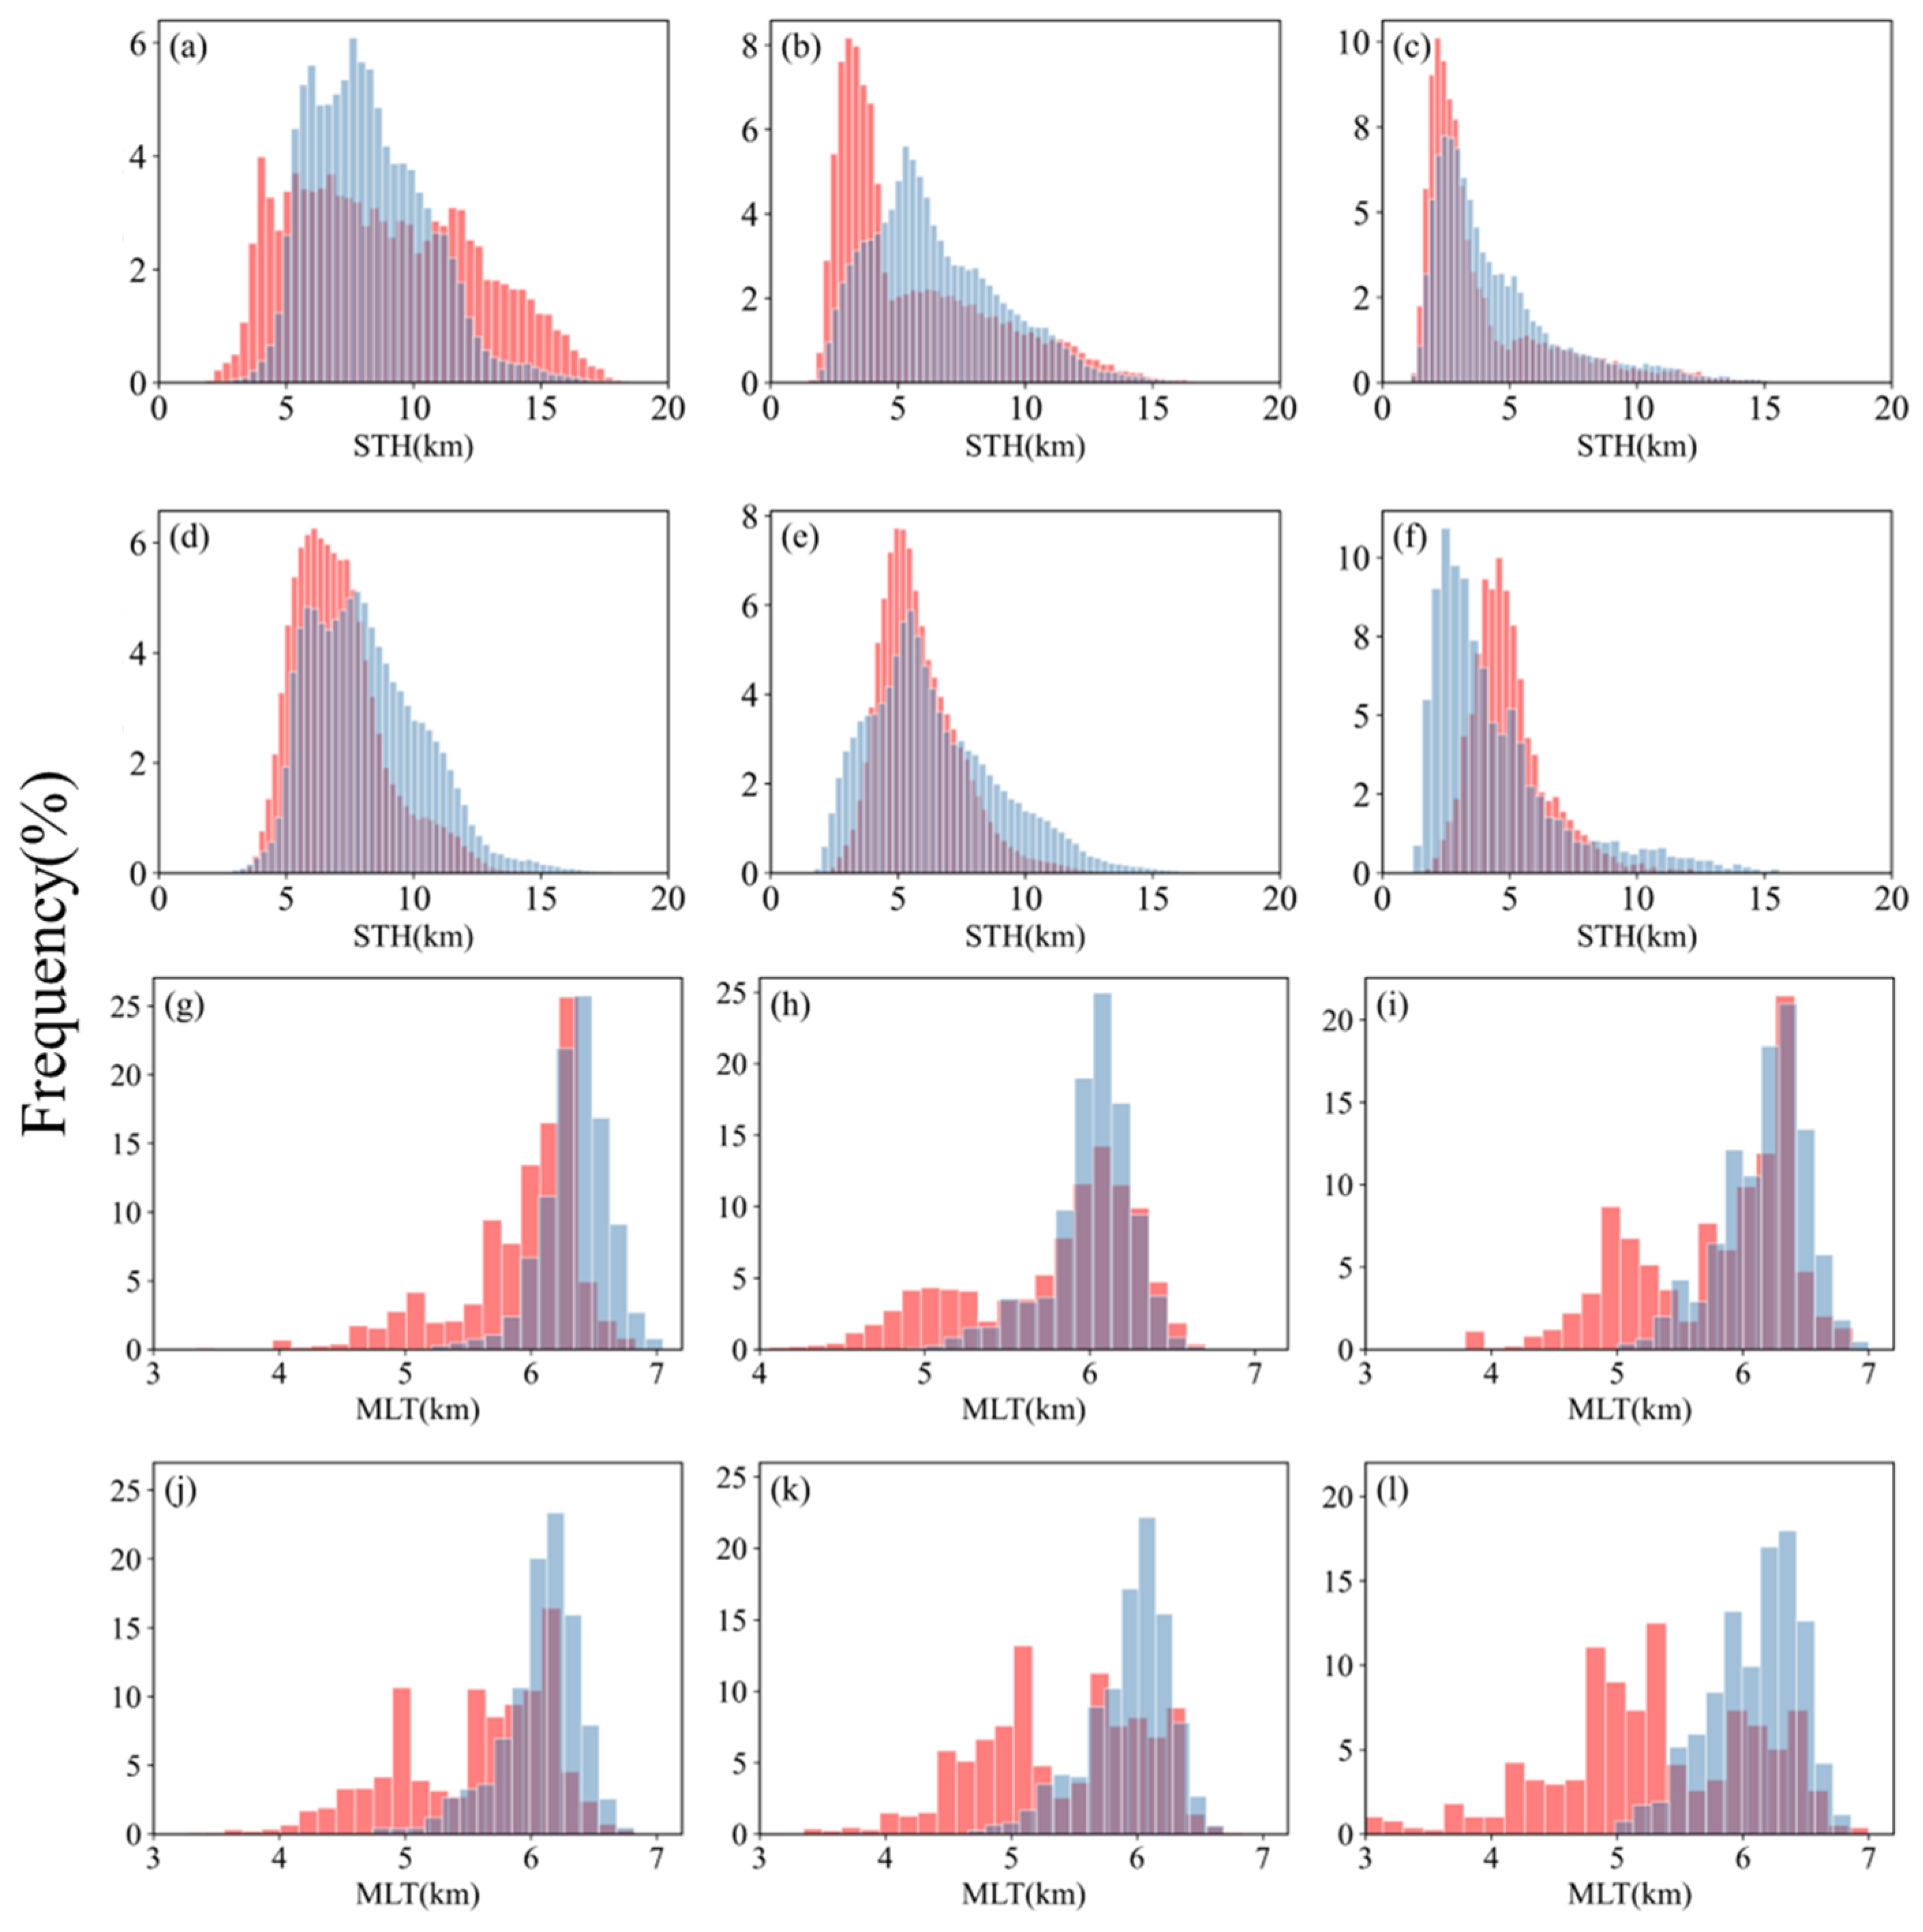
  • There are similarities and differences in the DSD characteristics between YHRB and SC. The DSD characteristics of strong precipitation (>8 mm/h) over the two regions are similar to that of deep ocean convection, with a possible explanation being that the monsoon precipitation contains a large amount of water vapor. However, the Dm at 1 km altitude over SC is generally larger, while the Nw is smaller, indicating that SC is featured by fewer and larger raindrop particles in the near-surface precipitation. However, there are more and smaller raindrop particles over YHRB;
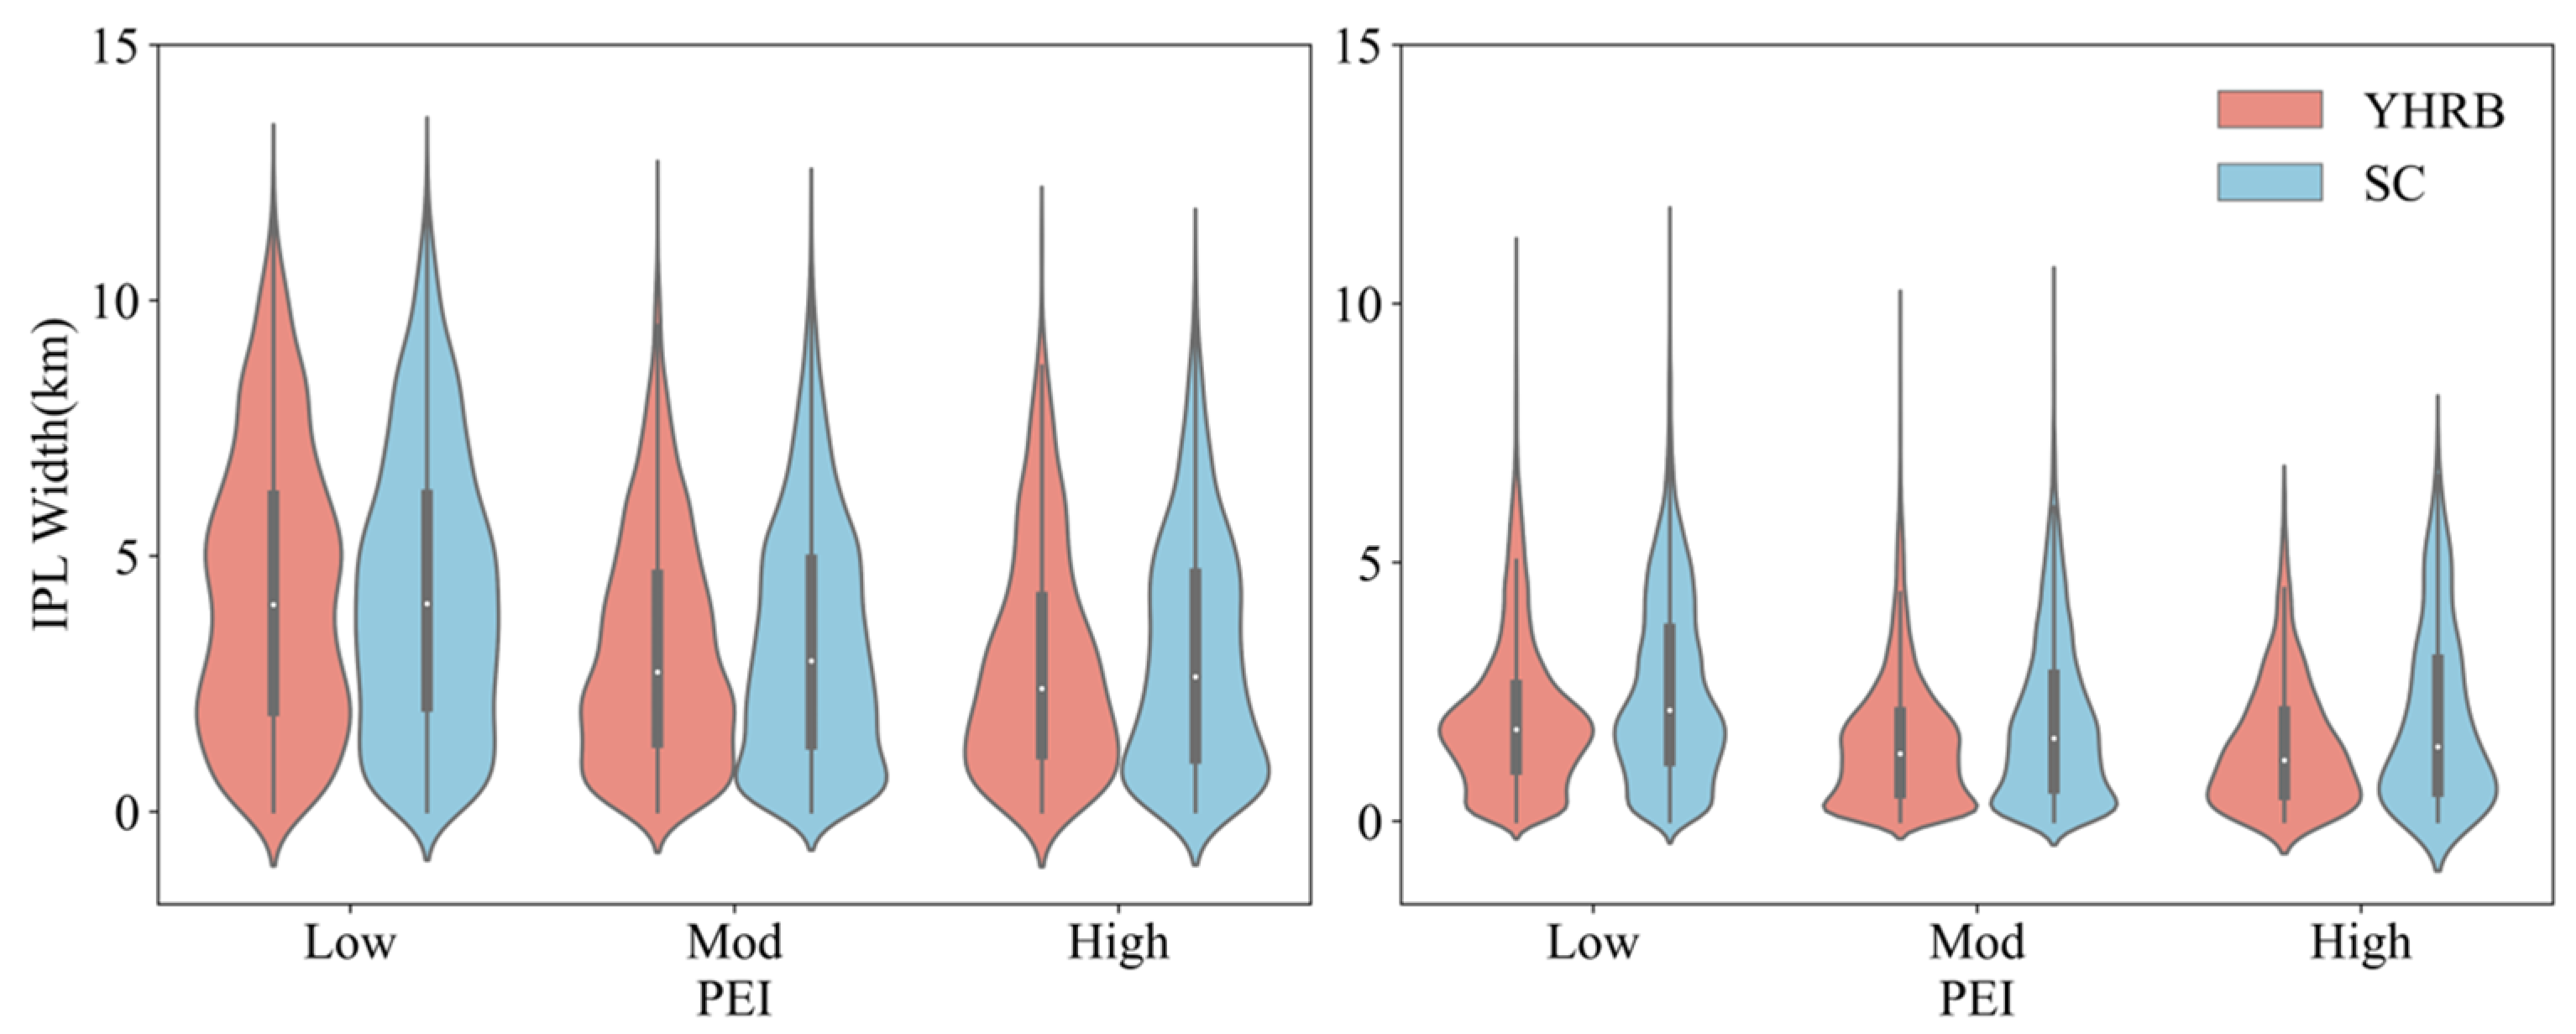
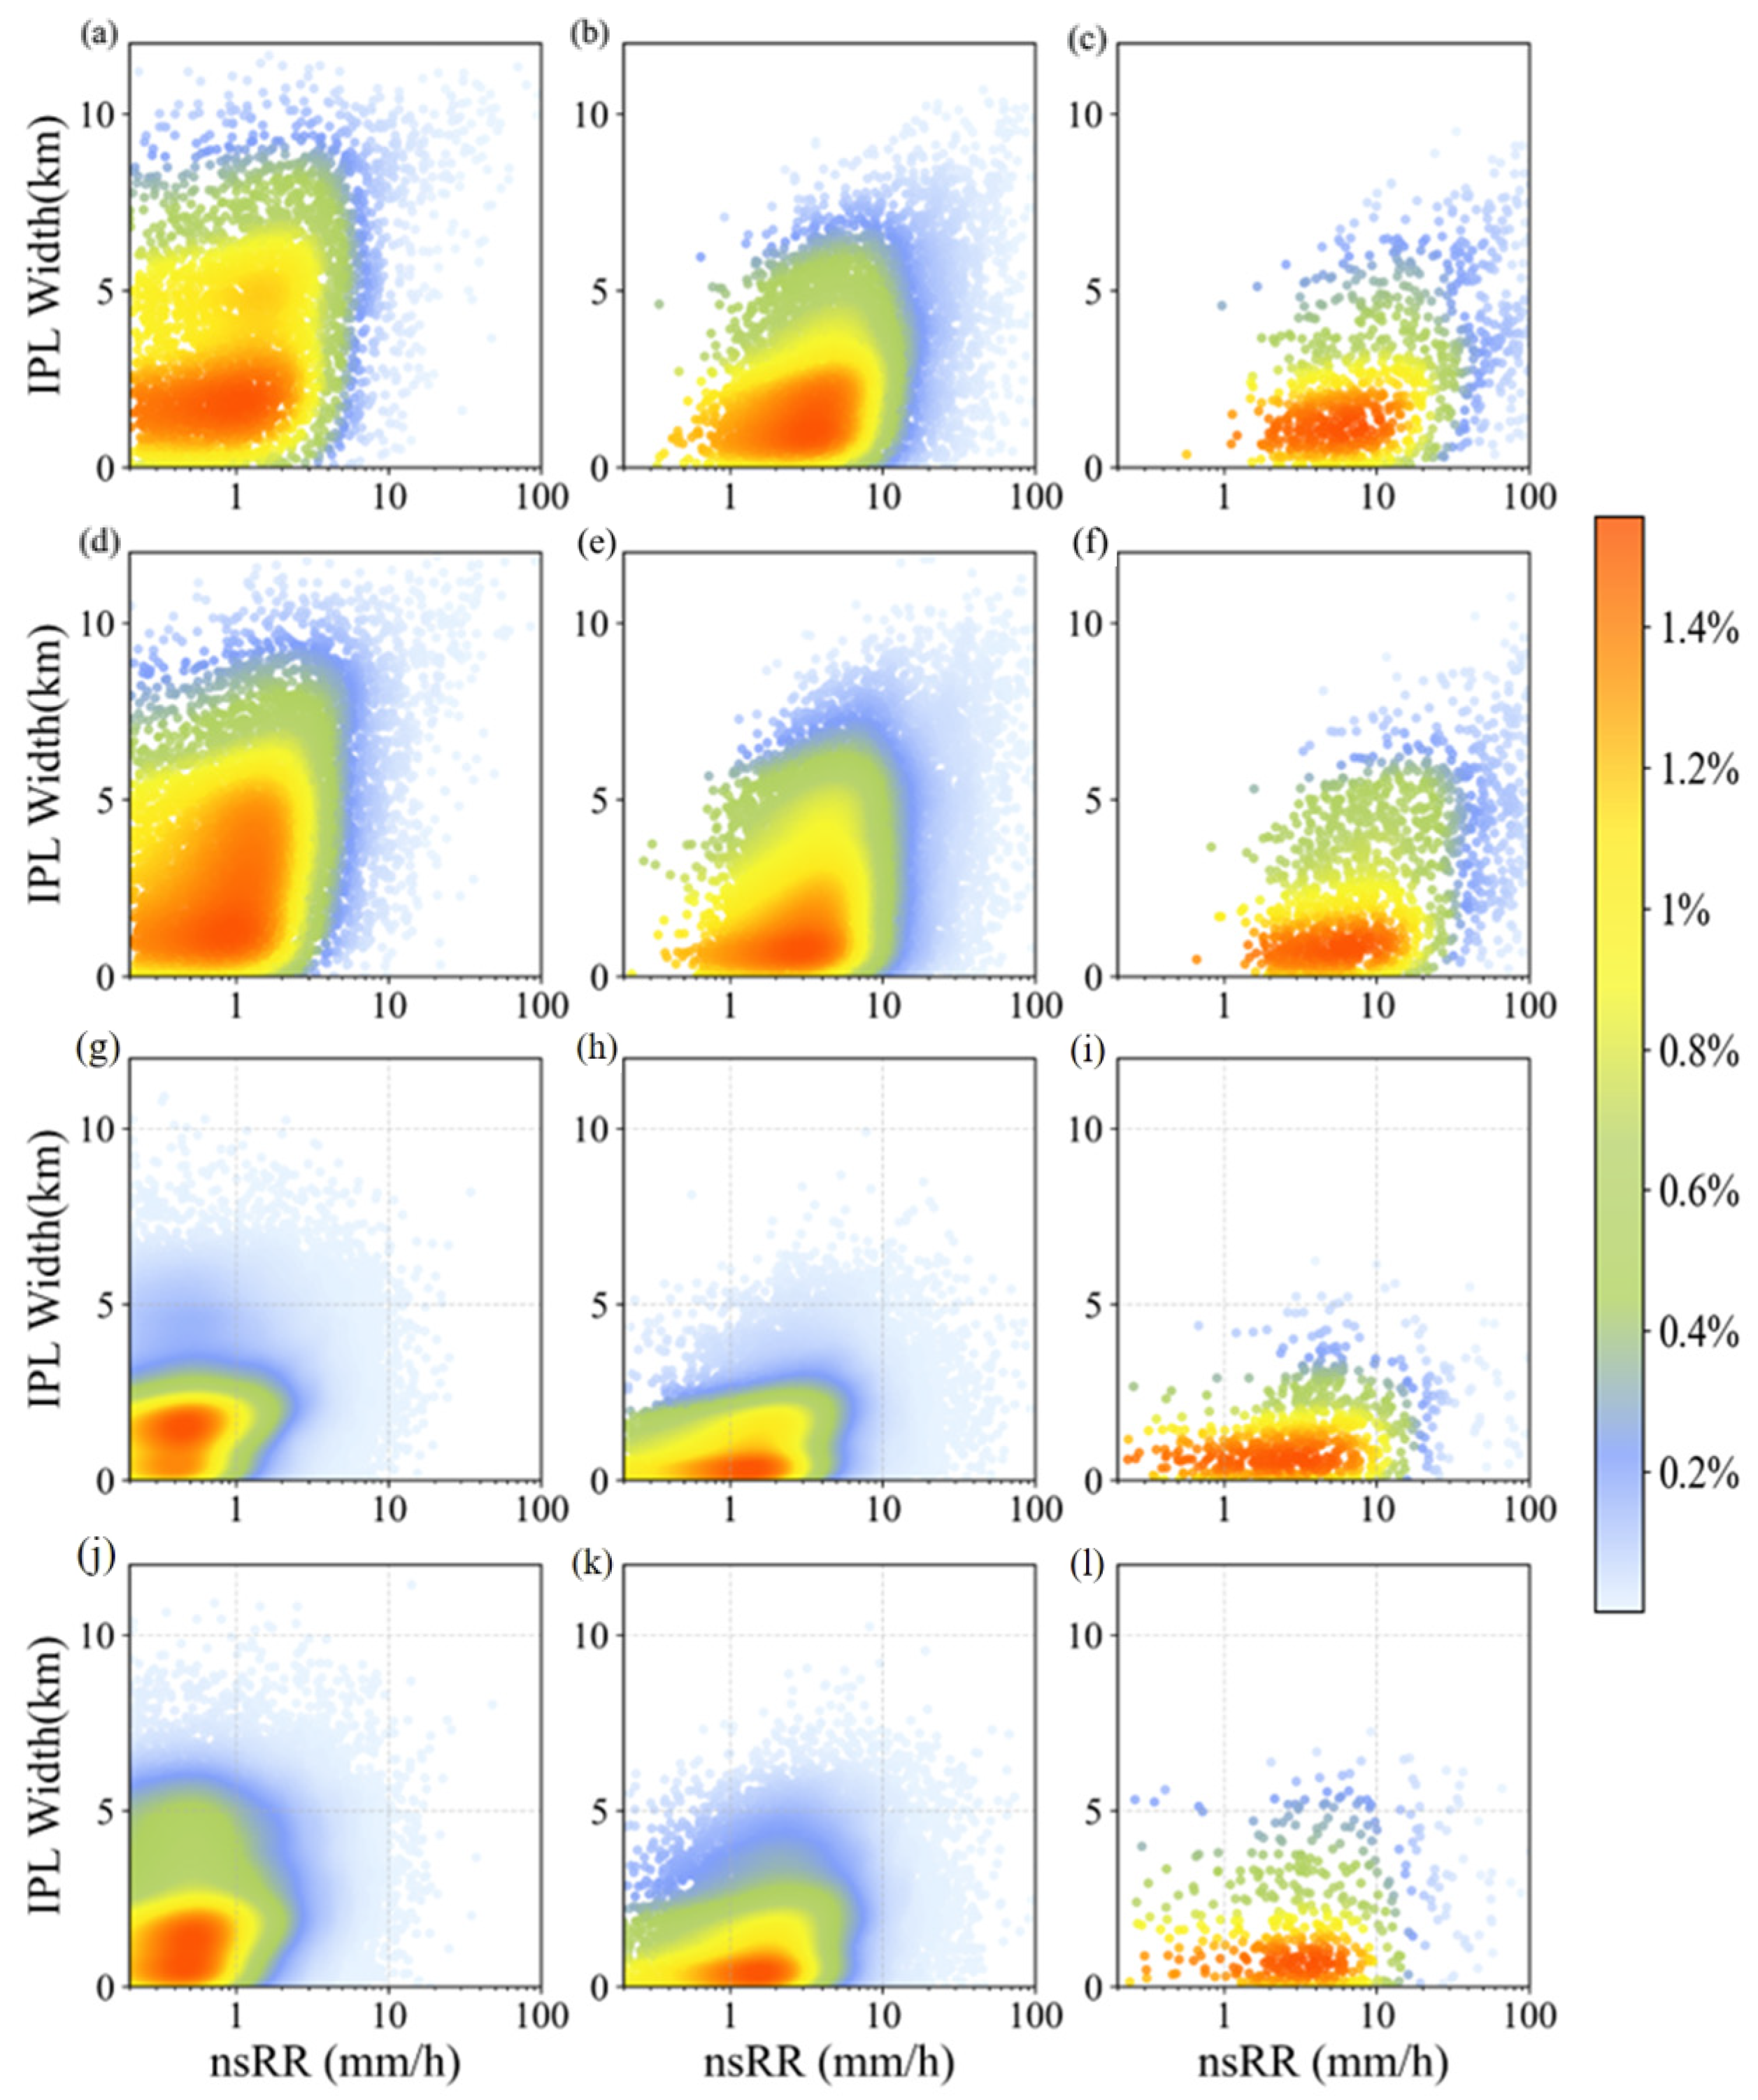
  • Smaller IPL width is often associated with higher precipitation efficiency. This relationship exhibits different characteristics in convective and stratiform precipitation. In convective precipitation, a thinner IPL indicates weaker ice phase processes, which typically leads to a reduction in condensation and aggregation processes, resulting in a decrease in the size of raindrops near the ground. In contrast, the formation mechanism of stratiform precipitation differs from convective precipitation, and the role of the IPL in its formation may not be as significant. Even with a reduction in IPL, the Dm in stratiform precipitation may increase due to the highly efficient precipitation process. This increase may be attributed to the enhancement of collision–coalescence process below the melting layer;
  • The vertical structure characteristics of precipitation are affected by microphysical processes within the different layers and environmental factors, which may shape the efficiency and intensity characteristics of precipitation;
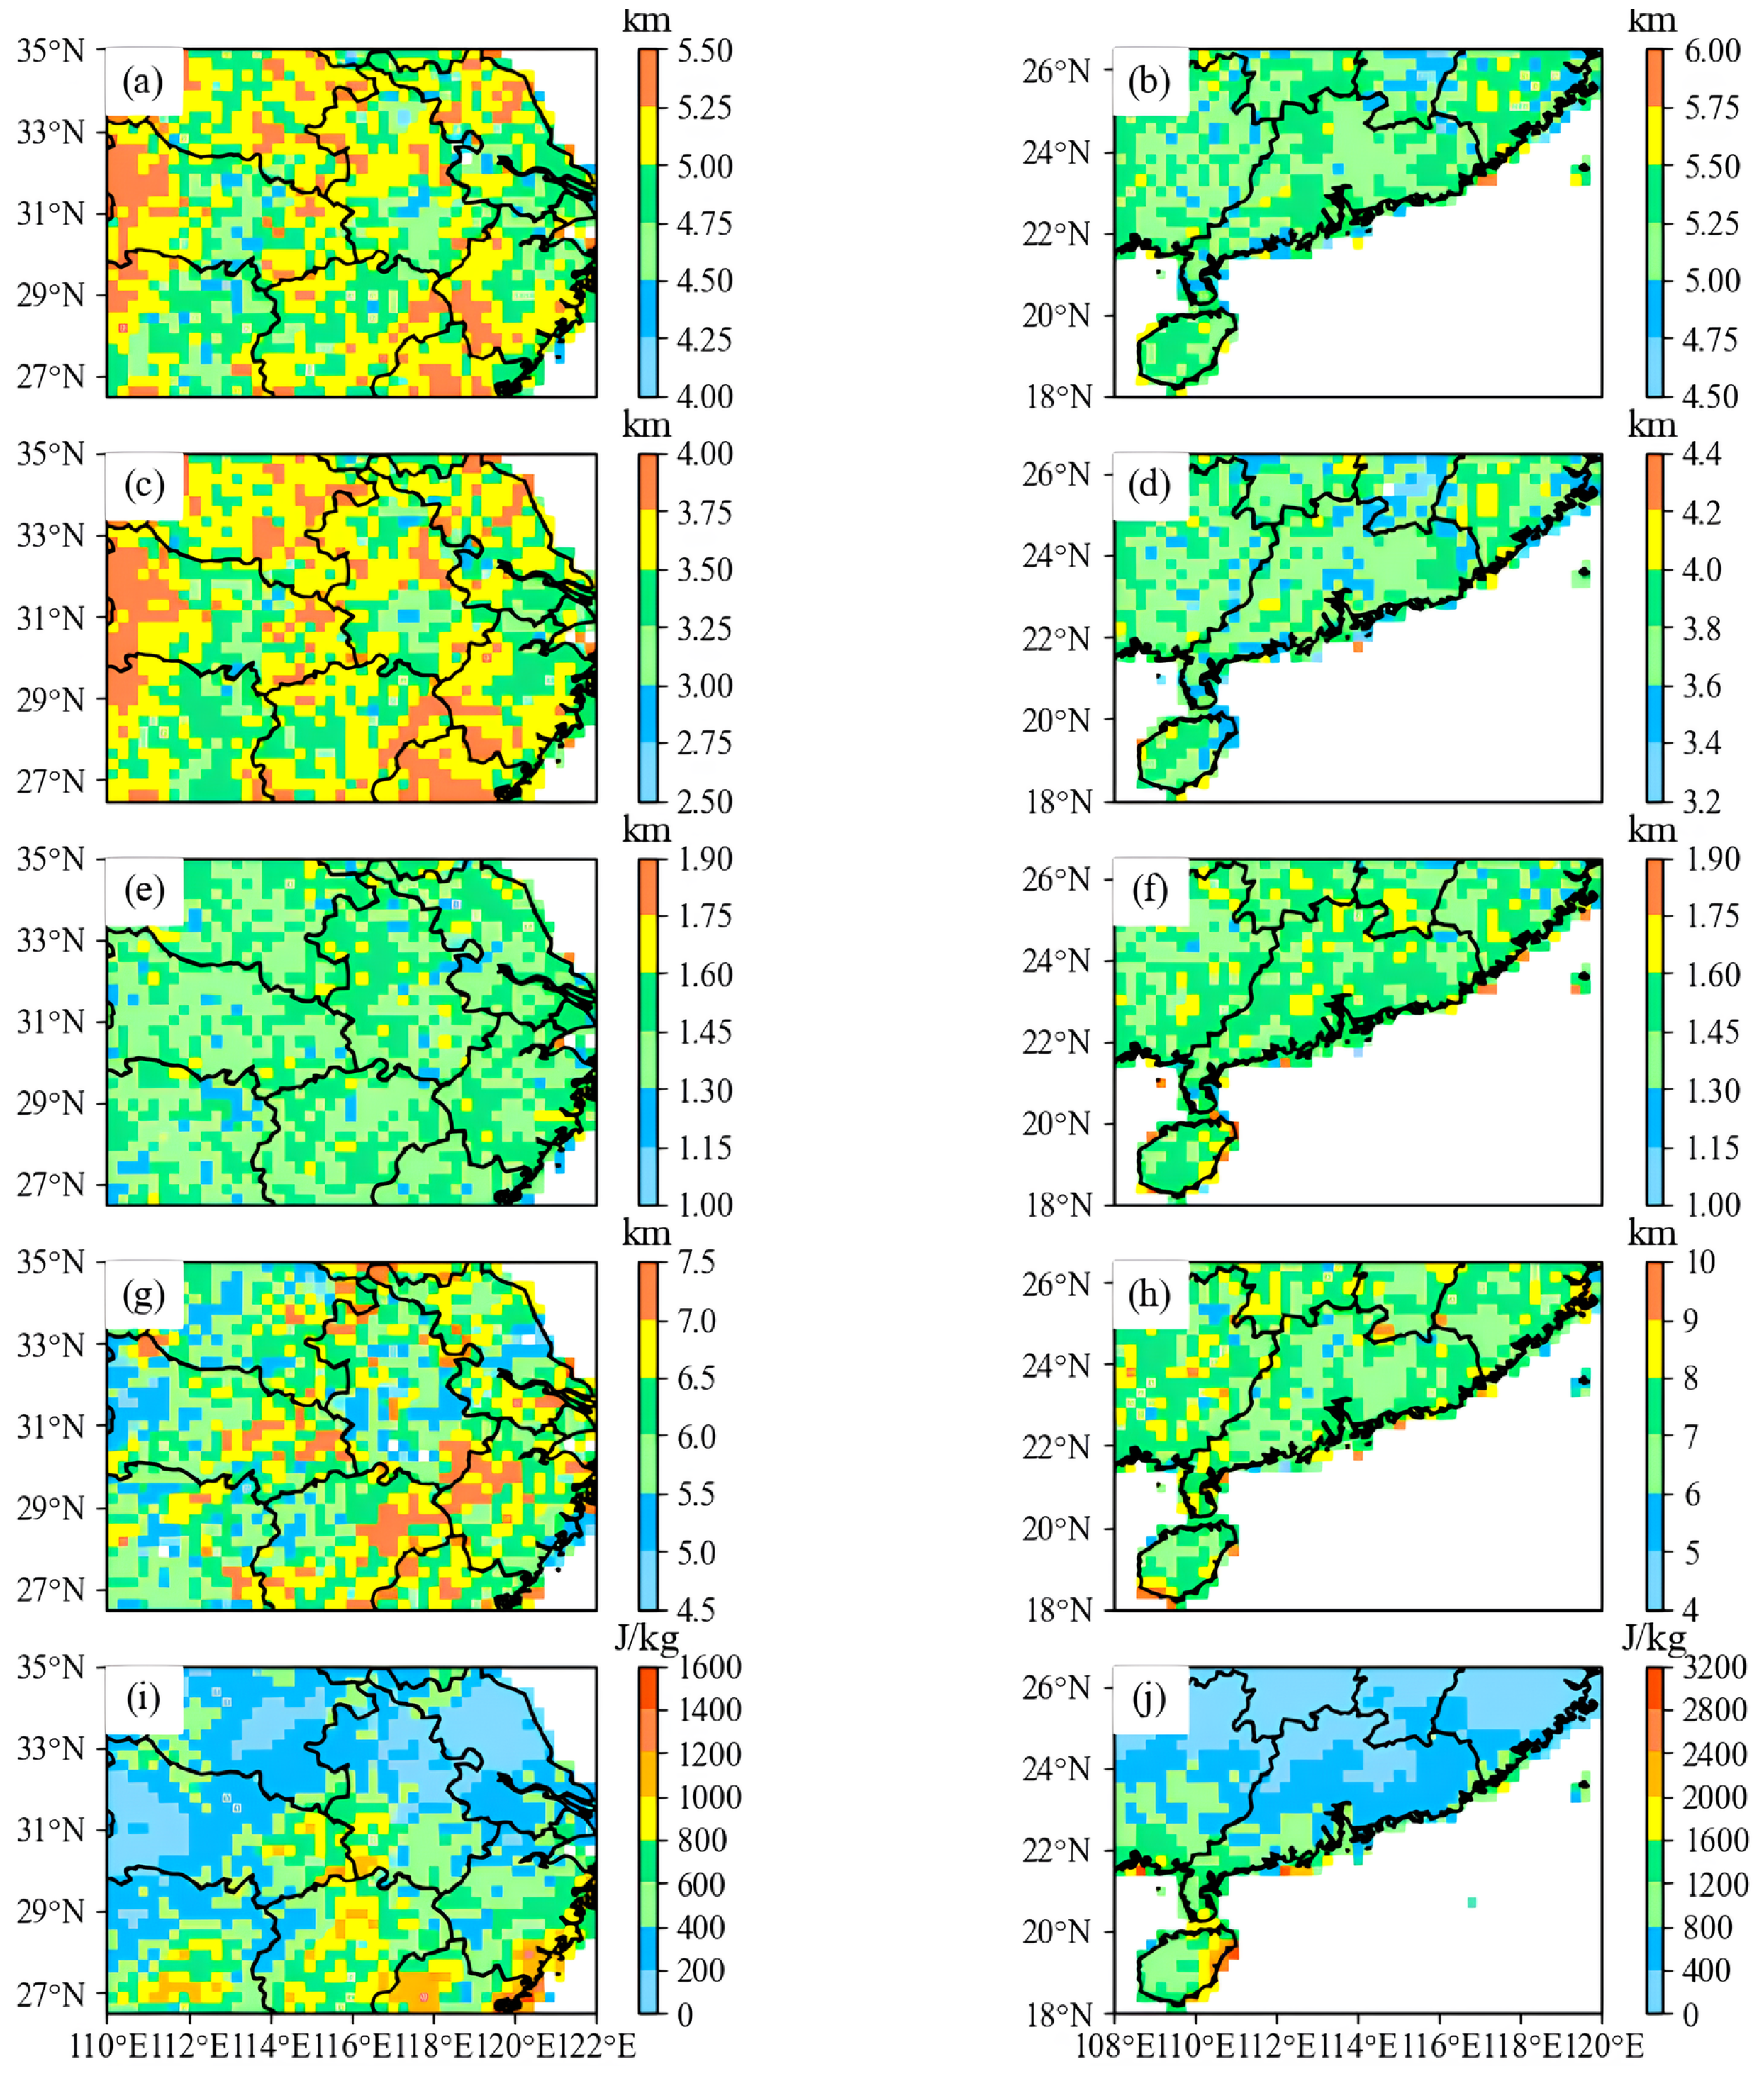
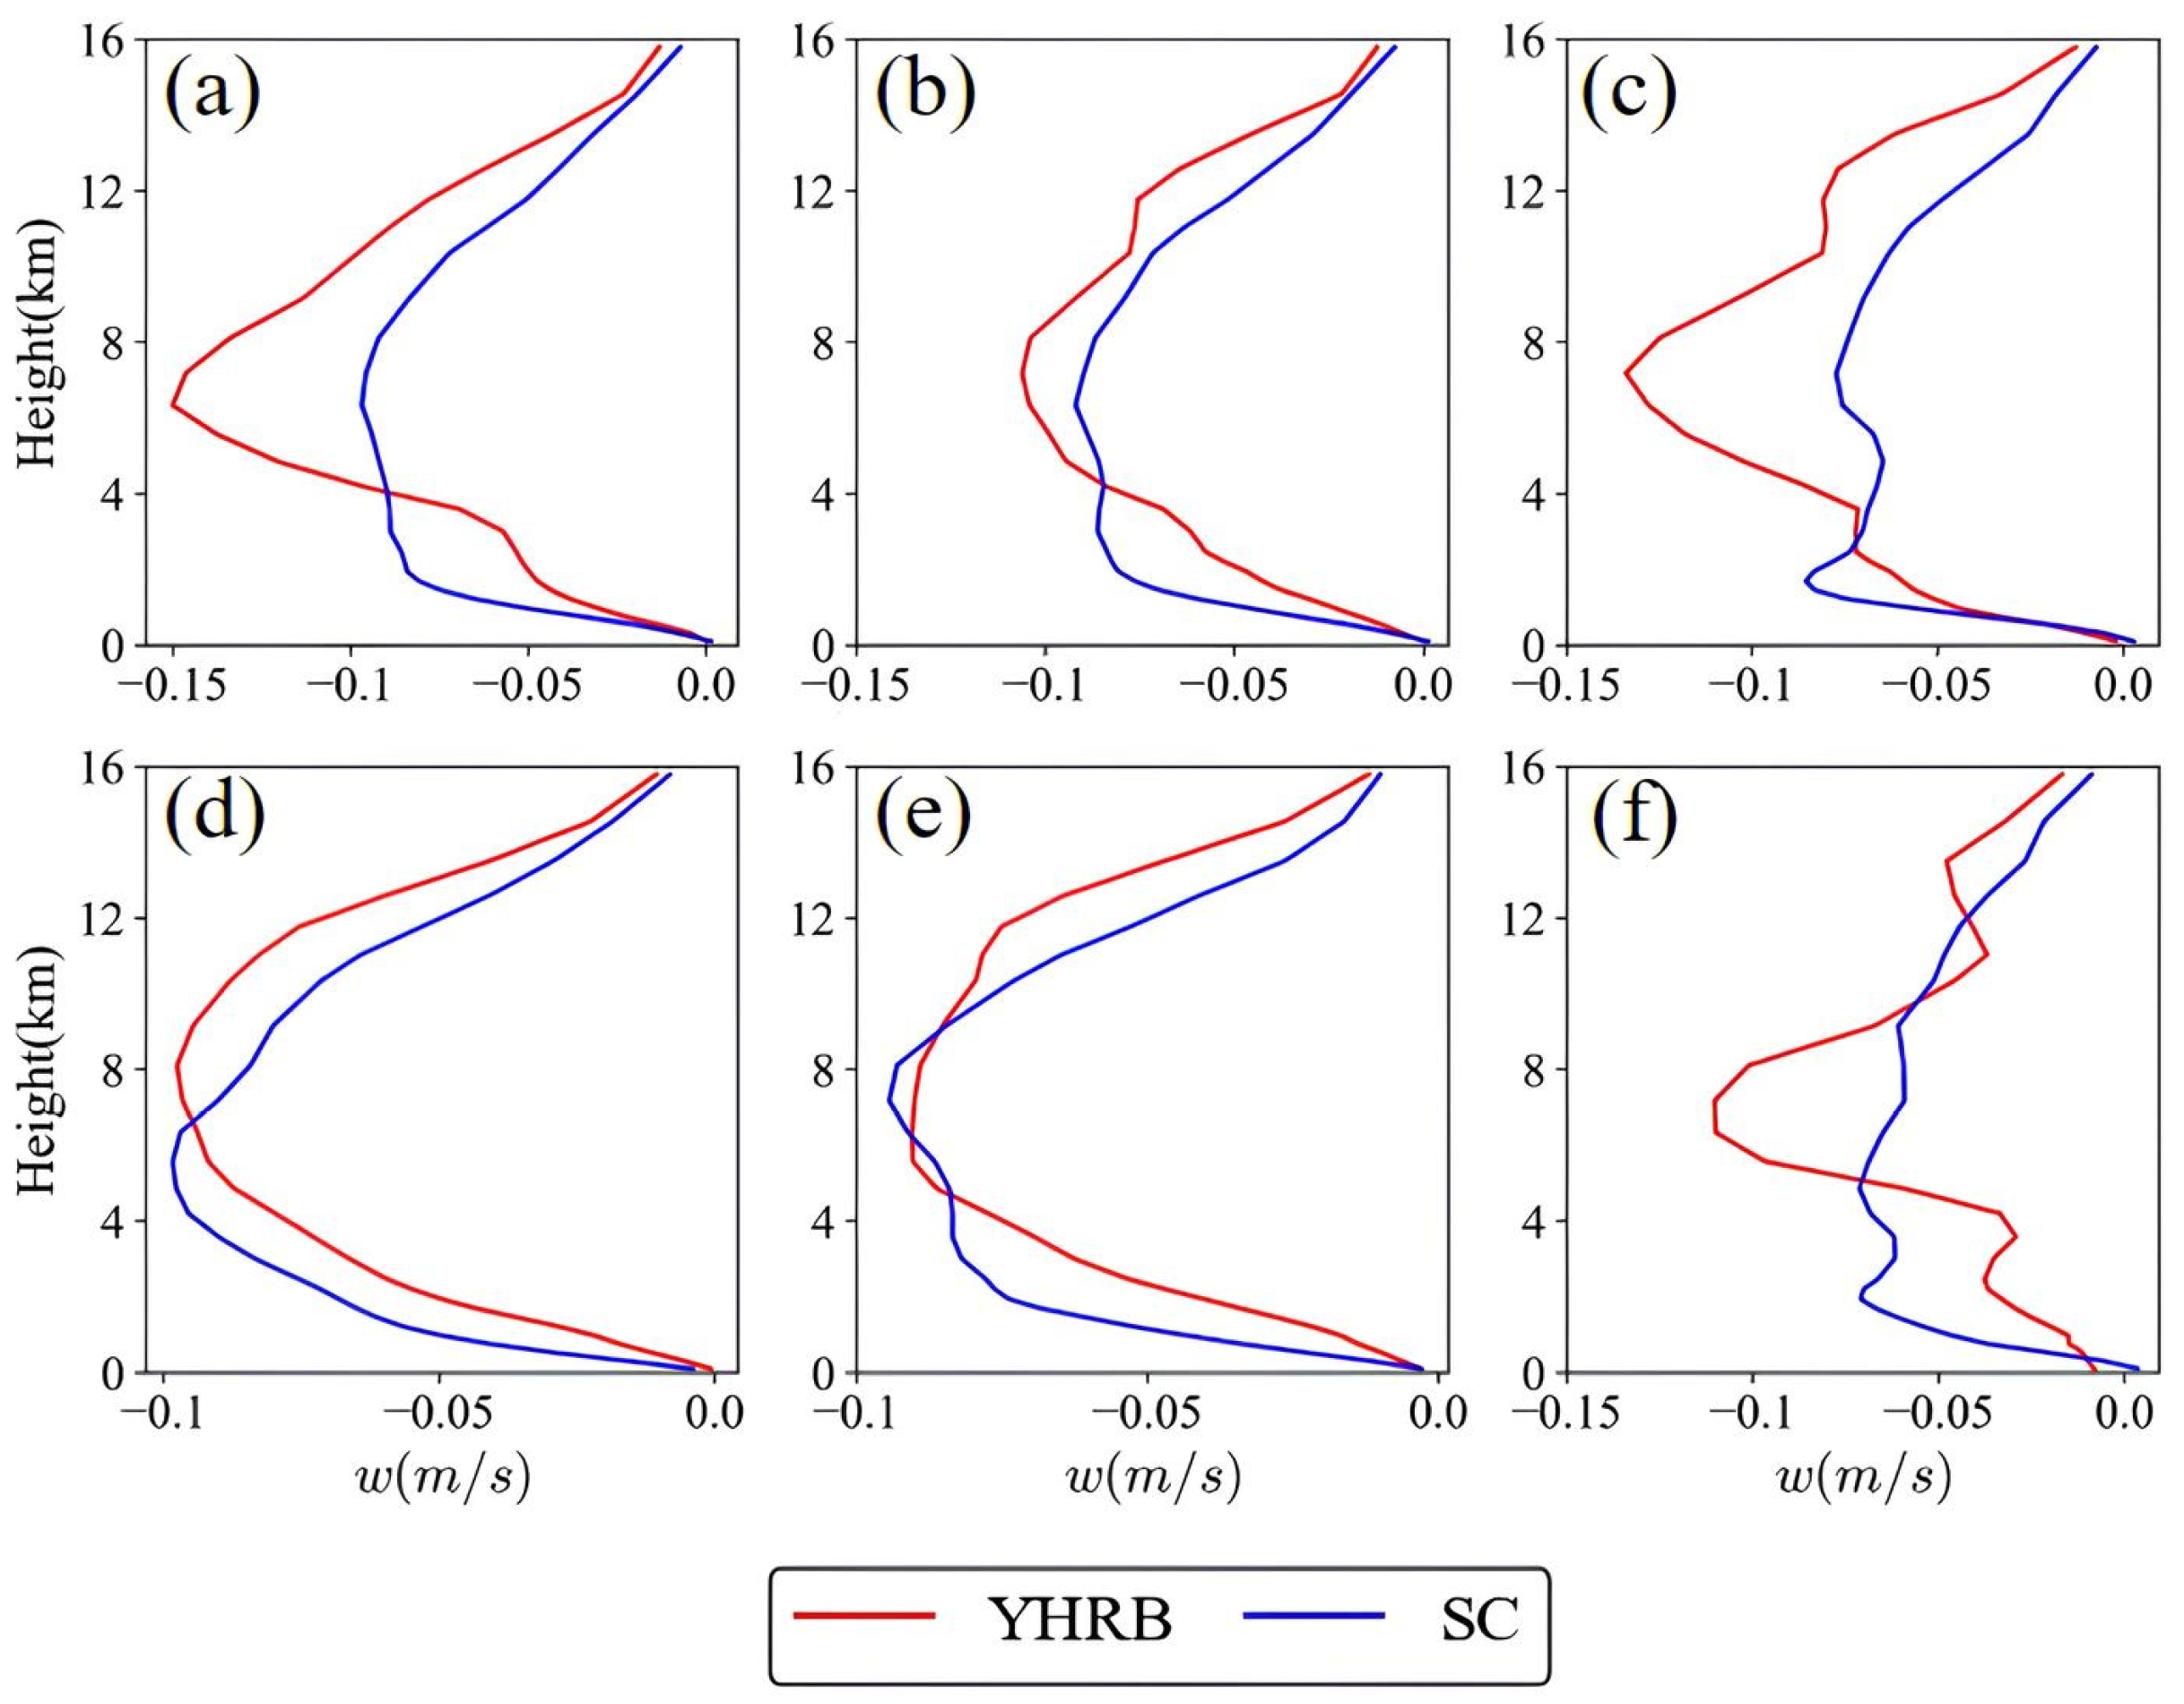
  • Over SC, a stronger trend of particle aggregation is observed in convective precipitation, with Dm increasing with altitude in the upper layers while Nw decreases. Additionally, the growth rate of Dm near the melting layer is higher in stratiform precipitation. This can be explained by the fact that the average vertical wind velocity in the lower layers and the average CAPE is greater over SC, indicating more intense convective activity. As a result, the average STH is approximately 0.63 km higher than YHRB. This leads to a more expansive IPL and melting layer, which reach greater heights and widths. Such an environment is conducive to more vigorous aggregation and deposition processes in the IPL, as well as more pronounced melting and collision–coalescence processes in the melting layer;
  • At the same time, the microphysical processes occurring within both the IPL and the melting layer likely contribute to the enhancement of near-surface precipitation. However, Ze near the surface for both convective and stratiform precipitation over SC is not significantly different from and is even slightly lower than that over YHRB. This discrepancy is likely due to the significant influence of liquid phase processes below the melting layer on the vertical structure of precipitation. The stronger collisional break-up processes over SC lead to a reduction in Dm below the melting layer. Given that Ze is directly proportional to the sixth power of Dm, this reduction significantly offsets any potential enhancement in reflectivity.

5. Discussion

It is also necessary and important to clarify some limitations of this study. Although the GPM DPR exhibits high reliability in the retrieval of Dm, there may be underestimations in Nw [13]. In order to mitigate the negative influence, a decade of precipitation samples is adopted. Moreover, ΔDm and ΔZe are used to reveal microphysical processes, which are not sensitive to retrieval errors [32]. Furthermore, this study did not consider topographical and other climatic factors, such as humidity characteristics.
Incorporating both airborne radar and ground-based detection technologies, our forthcoming research endeavors to expand the scope of the investigation to encompass a comparative analysis of precipitation microphysical properties across diverse climatic zones and weather systems within China (e.g., Southwest China, Northeast China, and Offshore Typhoon). This comprehensive study aims to elucidate the regional disparities in precipitation processing mechanisms, thereby contributing valuable insights for the refinement of regional numerical models through informed parameterization.

Author Contributions

Conceptualization, X.H. and W.A.; methodology, X.H. and Z.W.; software, Z.W.; validation, J.Q., X.H. and W.A.; formal analysis, X.H. and Z.W.; investigation, Z.W. and X.H.; resources, X.H.; data curation, X.H.; writing—original draft preparation, Z.W. and X.H.; writing—review and editing, Z.W., X.H. and W.A.; visualization, Z.W.; supervision, W.A. and X.Z.; project administration, W.A. and X.Z.; X.H. and Z.W. contributed equally to this work and should be considered co-first authors. All authors have read and agreed to the published version of the manuscript.

Funding

This research received no external funding.

Data Availability Statement

The DPR Level-2A product from the Global Precipitation Measurement (GPM) mission can be downloaded from https://doi.org/10.5067/GPM/DPR/GPM/2A/07, accessed on 13 July 2024. ECMWF Reanalysis v5 (ERA5) was provided by the European Centre for Medium-Range Weather Forecasts (ECMWF, https://www.ecmwf.int, accessed on 13 July 2024).

Acknowledgments

The authors thank the anonymous reviewers for their constructive comments and suggestions that greatly improved this paper.

Conflicts of Interest

The authors declare no conflicts of interest.

References

  1. Chen, F.; Zheng, X.; Wen, H.; Yuan, Y. Microphysics of Convective and Stratiform Precipitation during the Summer Monsoon Season over the Yangtze–Huaihe River Valley, China. J. Hydrometeorol. 2022, 23, 239–252. [Google Scholar] [CrossRef]
  2. Hu, X.; Han, D.; Hu, S.; Ai, W.; Qiao, J.; Yan, W. Microphysics of Summer Precipitation over Yangtze-Huai River Valley Region in China Revealed by GPM DPR Observation. Earth Space Sci. 2022, 9, e2021EA002021. [Google Scholar] [CrossRef]
  3. Ding, Y.; Liu, Y.; Hu, Z.-Z. The Record-breaking Mei-yu in 2020 and Associated Atmospheric Circulation and Tropical SST Anomalies. Adv. Atmos. Sci. 2021, 38, 1980–1993. [Google Scholar] [CrossRef] [PubMed]
  4. Xie, J.; Hsu, P.-C.; Hu, Y.; Lin, Q.; Ye, M. Disastrous Persistent Extreme Rainfall Events of the 2022 Pre-Flood Season in South China: Causes and Subseasonal Predictions. J. Meteorol. Res. 2023, 37, 469–485. [Google Scholar] [CrossRef]
  5. Yin, L.; Ping, F.; Mao, J.; Jin, S. Analysis on precipitation efficiency of the “21.7” Henan extremely heavy rainfall event. Adv. Atmos. Sci. 2023, 40, 374–392. [Google Scholar] [CrossRef]
  6. Zhang, G.; Sun, J.; Brandes, E.A. Improving Parameterization of Rain Microphysics with Disdrometer and Radar Observations. J. Atmos. Sci. 2006, 63, 1273–1290. [Google Scholar] [CrossRef]
  7. Willis, P.T. Functional Fits to Some Observed Drop Size Distributions and Parameterization of Rain. J. Atmos. Sci. 1984, 41, 1648–1661. [Google Scholar] [CrossRef]
  8. Wen, L.; Chen, G.; Yang, C.; Zhang, H.; Fu, Z. Seasonal variations in precipitation microphysics over East China based on GPM DPR observations. Atmos. Res. 2023, 293, 106933. [Google Scholar] [CrossRef]
  9. Yamaji, M.; Takahashi, H.G. Seasonal Differences of Precipitation and Microphysical Characteristics over the Asian Monsoon Region Using Spaceborne Dual-Frequency Precipitation Radar. J. Atmos. Sci. 2023, 80, 2115–2128. [Google Scholar] [CrossRef]
  10. Battaglia, A.; Kollias, P.; Dhillon, R.; Roy, R.; Tanelli, S.; Lamer, K.; Grecu, M.; Lebsock, M.; Watters, D.; Mroz, K.; et al. Spaceborne Cloud and Precipitation Radars: Status, Challenges, and Ways Forward. Rev. Geophys. 2020, 58, e2019RG000686. [Google Scholar] [CrossRef]
  11. Luo, Y.; Wang, H.; Zhang, R.; Qian, W.; Luo, Z. Comparison of Rainfall Characteristics and Convective Properties of Monsoon Precipitation Systems over South China and the Yangtze and Huai River Basin. J. Clim. 2013, 26, 110–132. [Google Scholar] [CrossRef]
  12. Hou, A.Y.; Kakar, R.K.; Neeck, S.; Azarbarzin, A.A.; Kummerow, C.D.; Kojima, M.; Oki, R.; Nakamura, K.; Iguchi, T. The Global Precipitation Measurement Mission. Bull. Am. Meteorol. Soc. 2014, 95, 701–722. [Google Scholar] [CrossRef]
  13. Huang, H.; Zhao, K.; Fu, P.; Chen, H.; Chen, G.; Zhang, Y. Validation of Precipitation Measurements from the Dual-Frequency Precipitation Radar Onboard the GPM Core Observatory Using a Polarimetric Radar in South China. IEEE Trans. Geosci. Remote Sens. 2022, 60, 4104216. [Google Scholar] [CrossRef]
  14. Jin, X.; Shao, H.; Zhang, C.; Yan, Y. Applicability Analysis of GPM Satellite Precipitation Data in the Tianshan Mountain Area. J. Nat. Resour. 2016, 31, 2074–2085. [Google Scholar]
  15. Li, D.; Qi, Y.; Li, H. Statistical characteristics of convective and stratiform precipitation during the rainy season over South China based on GPM-DPR observations. Atmos. Res. 2024, 301, 107267. [Google Scholar] [CrossRef]
  16. Du, S.; Wang, D.H.; Li, G.P.; Cai, Q.B.; Xu, X.C. Analysis of Precipitation Vertical Structure Characteristics in South China Based on Dual-Frequency Satellite-Borne Precipitation Radar GPM Data. J. Trop. Meteorol. 2020, 36, 115–130. [Google Scholar] [CrossRef]
  17. Sun, Y.; Zhao, C.; Fan, H. Microphysical Characteristics of Precipitation over Eastern China and Its Coastal Regions. J. Geophys. Res. Atmos. 2024, 129, e2023JD039817. [Google Scholar] [CrossRef]
  18. Sun, N.; Lu, G.; Fu, Y. Microphysical characteristics of precipitation within convective overshooting over East China observed by GPM DPR and ERA5. Atmos. Chem. Phys. 2024, 24, 7123–7135. [Google Scholar] [CrossRef]
  19. Yu, S.; Luo, Y.; Wu, C.; Zheng, D.; Liu, X.; Xu, W. Convective and Microphysical Characteristics of Extreme Precipitation Revealed by Multisource Observations over the Pearl River Delta at Monsoon Coast. Geophys. Res. Lett. 2022, 49, e2021GL097043. [Google Scholar] [CrossRef]
  20. Qiang, X.M.; Xuemin, Q.; Yang, X.Q.; Xiuqun, Y.; Sun, C.Y.; Chengyi, S. A Review of Methods for Determining the Start and End Dates of the Pre-Flood Season Precipitation in South China. Int. J. Meterol. 2008, 3, 10–15. [Google Scholar]
  21. GB/T 33671-2017; Meiyu Monitoring Indices. China Meteorological Press: Beijing, China, 2017.
  22. QX/T 395—2017; Monitoring Indices of Rainy Season in China: Flood Season in South China. China Meteorological Press: Beijing, China, 2017.
  23. China Climate Bulletin; China Meteorological Administration National Climate Center: Beijing, China, 2014.
  24. Masaki, T.; Kubota, T.; Oki, R.; Furukawa, K.; Kojima, M.; Miura, T.; Iguchi, T.; Hanado, H.; Kai, H.; Yoshida, N.; et al. Current status of GPM/DPR level 1 algorithm development and DPR calibration. In Proceedings of the 2015 IEEE International Geoscience and Remote Sensing Symposium (IGARSS), Milan, Italy, 26–31 July 2015; pp. 2615–2618. [Google Scholar]
  25. T/CMSA 0013—2019; The Grade of Rainfall in Short Time Weather Service. China Meteorological Press: Beijing, China, 2019.
  26. Huang, H.; Chen, F. Precipitation Microphysics of Tropical Cyclones over the Western North Pacific Based on GPM DPR Observations: A Preliminary Analysis. J. Geophys. Res. Atmos. 2019, 124, 3124–3142. [Google Scholar] [CrossRef]
  27. Sui, C.-H.; Li, X.; Yang, M.-J. On the Definition of Precipitation Efficiency. J. Atmos. Sci. 2007, 64, 4506–4513. [Google Scholar] [CrossRef]
  28. Bringi, V.N.; Chandrasekar, V.; Hubbert, J.; Gorgucci, E.; Randeu, W.L.; Schoenhuber, M. Raindrop Size Distribution in Different Climatic Regimes from Disdrometer and Dual-Polarized Radar Analysis. J. Atmos. Sci. 2003, 60, 354–365. [Google Scholar] [CrossRef]
  29. Ryu, J.; Song, H.; Sohn, B.; Liu, C. Global Distribution of Three Types of Drop Size Distribution Representing Heavy Rainfall from GPM/DPR Measurements. Geophys. Res. Lett. 2021, 48, e2020GL090871. [Google Scholar] [CrossRef]
  30. Chen, F.; Fu, Y.; Yang, Y. Regional Variability of Precipitation in Tropical Cyclones over the Western North Pacific Revealed by the GPM Dual-Frequency Precipitation Radar and Microwave Imager. J. Geophys. Res. Atmos. 2019, 124, 11281–11296. [Google Scholar] [CrossRef]
  31. Sun, Y.; Dong, X.; Cui, W.; Zhou, Z.; Fu, Z.; Zhou, L.; Deng, Y.; Cui, C. Vertical Structures of Typical Meiyu Precipitation Events Retrieved from GPM-DPR. J. Geophys. Res. Atmos. 2020, 125, e2019JD031466. [Google Scholar] [CrossRef]
  32. Zhou, L.; Xu, G.; Xiao, Y.; Wan, R.; Wang, J.; Leng, L. Vertical structures of abrupt heavy rainfall events over southwest China with complex topography detected by dual-frequency precipitation radar of global precipitation measurement satellite. Int. J. Climatol. 2022, 42, 7628–7647. [Google Scholar] [CrossRef]
  33. Houze, R.A.; Rasmussen, K.L.; Zuluaga, M.D.; Brodzik, S.R. The variable nature of convection in the tropics and subtropics: A legacy of 16 years of the Tropical Rainfall Measuring Mission satellite. Rev. Geophys. 2015, 53, 994–1021. [Google Scholar] [CrossRef]
  34. Hu, X.; Ai, W.; Qiao, J.; Yan, W. Insight into global climatology of melting layer: Latitudinal dependence and orographic relief. Theor. Appl. Climatol. 2024, 155, 4863–4873. [Google Scholar] [CrossRef]
  35. Wu, Y.; Hu, X.; Ai, W.; Qiao, J.; Zhao, X. Seasonal variations in microphysics of convective and stratiform precipitation over North China revealed by GPM dual-frequency precipitation radar. Theor. Appl. Climatol. 2024, 155, 7275–7284. [Google Scholar] [CrossRef]
Figure 1. (a) China: Located in the Northern Hemisphere, within the latitudes of 0°N to 53°N and longitudes of 70°E to 140°E. Red rectangle: the central and eastern regions of China. (b) The elevation distribution and topography of Yangtze–Huai River Basin (110°E–122°E, 26.5°N–35°N) and South China (105°E–120°E, 18°N–26.5°N, unit: m).
Remotesensing 16 03433 g001
Figure 2. The frequency and amount contribution (%) of different intensity (heavy, extreme, the most extreme) (a), different types (convective, stratiform, and shallow) (b), different PEI (low, moderate, and high) (c) precipitation to total precipitation over YHRB and SC. The left/right six columns are for precipitation frequency/amount contributions. “Freq” is an abbreviation for frequency. Probability density functions (PDFs) (%) of the (d) precipitation efficiency index (PEI) over YHRB and SC (red and blue line).
Remotesensing 16 03433 g002
Figure 3. (Top) Convective (red) and stratiform (purple) precipitation contributions by frequency and amount across precipitation PEI categories over (a,c) YHRB and (b,d) SC. From the inside to the outside, circles represent the precipitation cases: low, moderate, and high. (Middle) The same for different precipitation intensities over (e,g) YHRB and (f,h) SC. (Bottom) Low (red), moderate (purple), and high (green) PEI precipitation contributions by intensity over (i,k) YHRB and (j,l) SC. From the inside to the outside, circles denote precipitation intensity cases: heavy, extreme, and most extreme.
Remotesensing 16 03433 g003
Figure 4. Distribution of Dm versus Nw pairs for convective (red dots), stratiform (blue dots), and shallow (green dots) rain types at 1 km height during the rainy season over YHRB (a) and SC (b) and (c) averaged Dm versus Nw pairs of different precipitation types for the two regions. The Dm and Nw are from 2ADPR product, which belongs to GPM’s L2-level product. The square, triangle, cross, dot, and star represent convective precipitation, stratiform precipitation, shallow precipitation, and all precipitation.
Remotesensing 16 03433 g004
Figure 5. Probability density functions (PDFs) of (a,d) Dm; (b,e) Nw at 1 km, and (c,f) PEI over YHRB (the first row) and SC (the second row) during the rainy seasons (2014–2023). Abbreviations: PDF—probability density function; PEI—precipitation efficiency index.
Remotesensing 16 03433 g005
Figure 6. The vertical profiles of (a,d,g,j) Dm (mm), (b,e,h,k) Nw (dB), and (c,f,i,l) Ze (dBZ) (radar reflectivity factor) for (af) convective precipitation and (gl) stratiform precipitation in terms of different PEIs and intensities in rainy season over (ac), (gi) YHRB and (df), (jl) SC. Blue/yellow/pink lines represent heavy/extreme/the most extreme precipitation. Solid/dotted/dashed lines represent low/moderate/high PEI precipitation.
Remotesensing 16 03433 g006
Figure 7. The box–whisker plots the vertical structure of rain rate (RR) within the ice phase layer (IPL) for convective (ac) and stratiform precipitation (df) precipitation in terms of different PEIs (low, moderate, and high; from the left column to the right column) in the rainy season over YHRB (red boxes) and SC (blue boxes). The y-axis depicts the relative IPL height, with 0 representing the height of the minimum IPL bottom. The center of the box represents the 50% percentile value, the lower quartile (25%) and the upper quartile (75%) are the left and right boundaries of the box, and the whiskers correspond to the 5% and 95% values.
Remotesensing 16 03433 g007
Figure 8. Histogram of the STH (af) and MLT (gl) for (ac), (gi) convective precipitation and (df), (jl) stratiform precipitation in terms of different PEIs (low, moderate, and high; from the left column to the right column) in rainy season precipitation systems over YHRB and SC from 2014 to 2023.
Remotesensing 16 03433 g008
Figure 9. The spatial distributions of melting layer top height (MLTH) (a,b), melting layer bottom height (MLBH) (c,d), melting layer width (MLW) (e,f), and storm top height (STH) (g,h), CPAE (i,j) over YHRB (a,c,e,g,i), and SC (b,d,f,h,j).
Remotesensing 16 03433 g009
Figure 10. The frequency pattern in two-dimensional space of ΔDm and ΔZe for (af) convective precipitation and (gl) stratiform precipitation at different PEI of (a,e) 0–3 h−1, (b,f) 3–6 h−1, and (c,g) >6 h−1 in rainy season precipitation systems over YHRB (ac,gi) and SC (df,jl) from 2014 to 2023.
Remotesensing 16 03433 g010
Figure 11. The violin plots for the IPL width of convective (left) and stratiform precipitation (right) in the rainy season over YHRB (red) and SC (blue).
Remotesensing 16 03433 g011
Figure 12. The amount contribution of low (pink), moderate (purple), and high (red) IPL width precipitation in different types of precipitation ((ac) are convective precipitation, (df) are stratiform precipitation) under different PEIs (low, moderate, and high, from the top to the bottom) over YHRB (inside circle) and SC (outside circle). (g) The box–whisker plots for the distribution of convective and stratiform near-surface precipitation rates with different IPL widths under different PEIs. LC, MC, HC, LS, MS, and HS represent low convective, moderate convective, high convective, low stratiform, moderate stratiform, and high stratiform, respectively. For instance, in LCL, where the first L stands for PEI grade, the C stands for convective precipitation, and the last L stands for IPL thickness grade. LCL is characterized by low PEI and low IPL width in convective precipitation.
Remotesensing 16 03433 g012
Figure 13. Two-dimensional kernel density estimation of ice phase layer (IPL) width and near-surface rain (nsRR) for (af) convective precipitation and (gl) stratiform precipitation in terms of different PEIs (from left to right, low PEI, moderate PEI, and high PEI) in rainy season precipitation systems over YHRB (ac,gi) and SC (df,jl) from 2014 to 2023.
Remotesensing 16 03433 g013
Figure 14. Two-dimensional kernel density estimation of the radar reflectivity (ΔZe) and near-surface rain rate (nsRR) for (af) convective precipitation and (gl) stratiform precipitation in terms of different PEIs (from left to right, low PEI, moderate PEI, and high PEI) in rainy season precipitation systems over YHRB (ac,gi) and SC (df,jl) from 2014 to 2023.
Remotesensing 16 03433 g014
Figure 15. The vertical velocity (w) of environmental wind applied in convective precipitation (ac) and stratiform precipitation (df) with different PEIs (from left to right, low, moderate, and high). The negative direction of velocity is from the ground to the sky.
Remotesensing 16 03433 g015
Table 1. Onset and ending dates of the monsoon period over SC and YHRB in 2014–2023.
YearSCYHRB
201430 March–7 July16 June–20 July
20155 May–25 June26 May–27 July
201621 March–19 June25 May–21 July
201720 April–30 June4 June–11 July
20187 May–27 June19 June–13 July
20199 March–26 July16 June–17 July
202025 March–27 June29 May–2 August
202126 April–2 July9 June–11 July
202224 March–22 June29 May–8 July
202326 March–28 June16 June–2 July
Table 2. Samples, proportion of samples, the average nsRR, Dm, and Nw at 1 km in altitude, and PEI for rainy season precipitation systems over YHRB and SC from 2014 to 2023.
Characteristic Convective StratiformShallow
Convective
YHRB
No. of samples76,648326,6858664
Proportion (%)18.48 78.78 2.09
nsRR (mm/h)4.92 1.68 0.29
Dm (mm)1.34 1.24 0.97
Nw35.03 33.37 32.69
PEI (h−1)4.70 2.89 2.43
SC
No. of samples128,550261,7824148
Proportion (%)32.59 66.36 1.05
nsRR (mm/h)4.99 1.86 0.28
Dm (mm)1.42 1.30 0.97
Nw34.14 33.00 32.54
PEI (h−1)4.66 2.86 2.30
Disclaimer/Publisher’s Note: The statements, opinions and data contained in all publications are solely those of the individual author(s) and contributor(s) and not of MDPI and/or the editor(s). MDPI and/or the editor(s) disclaim responsibility for any injury to people or property resulting from any ideas, methods, instructions or products referred to in the content.

