

Assessing Air Quality Dynamics during Short-Period Social Upheaval Events in Quito, Ecuador, Using a Remote Sensing Framework


Abstract
:1. Introduction
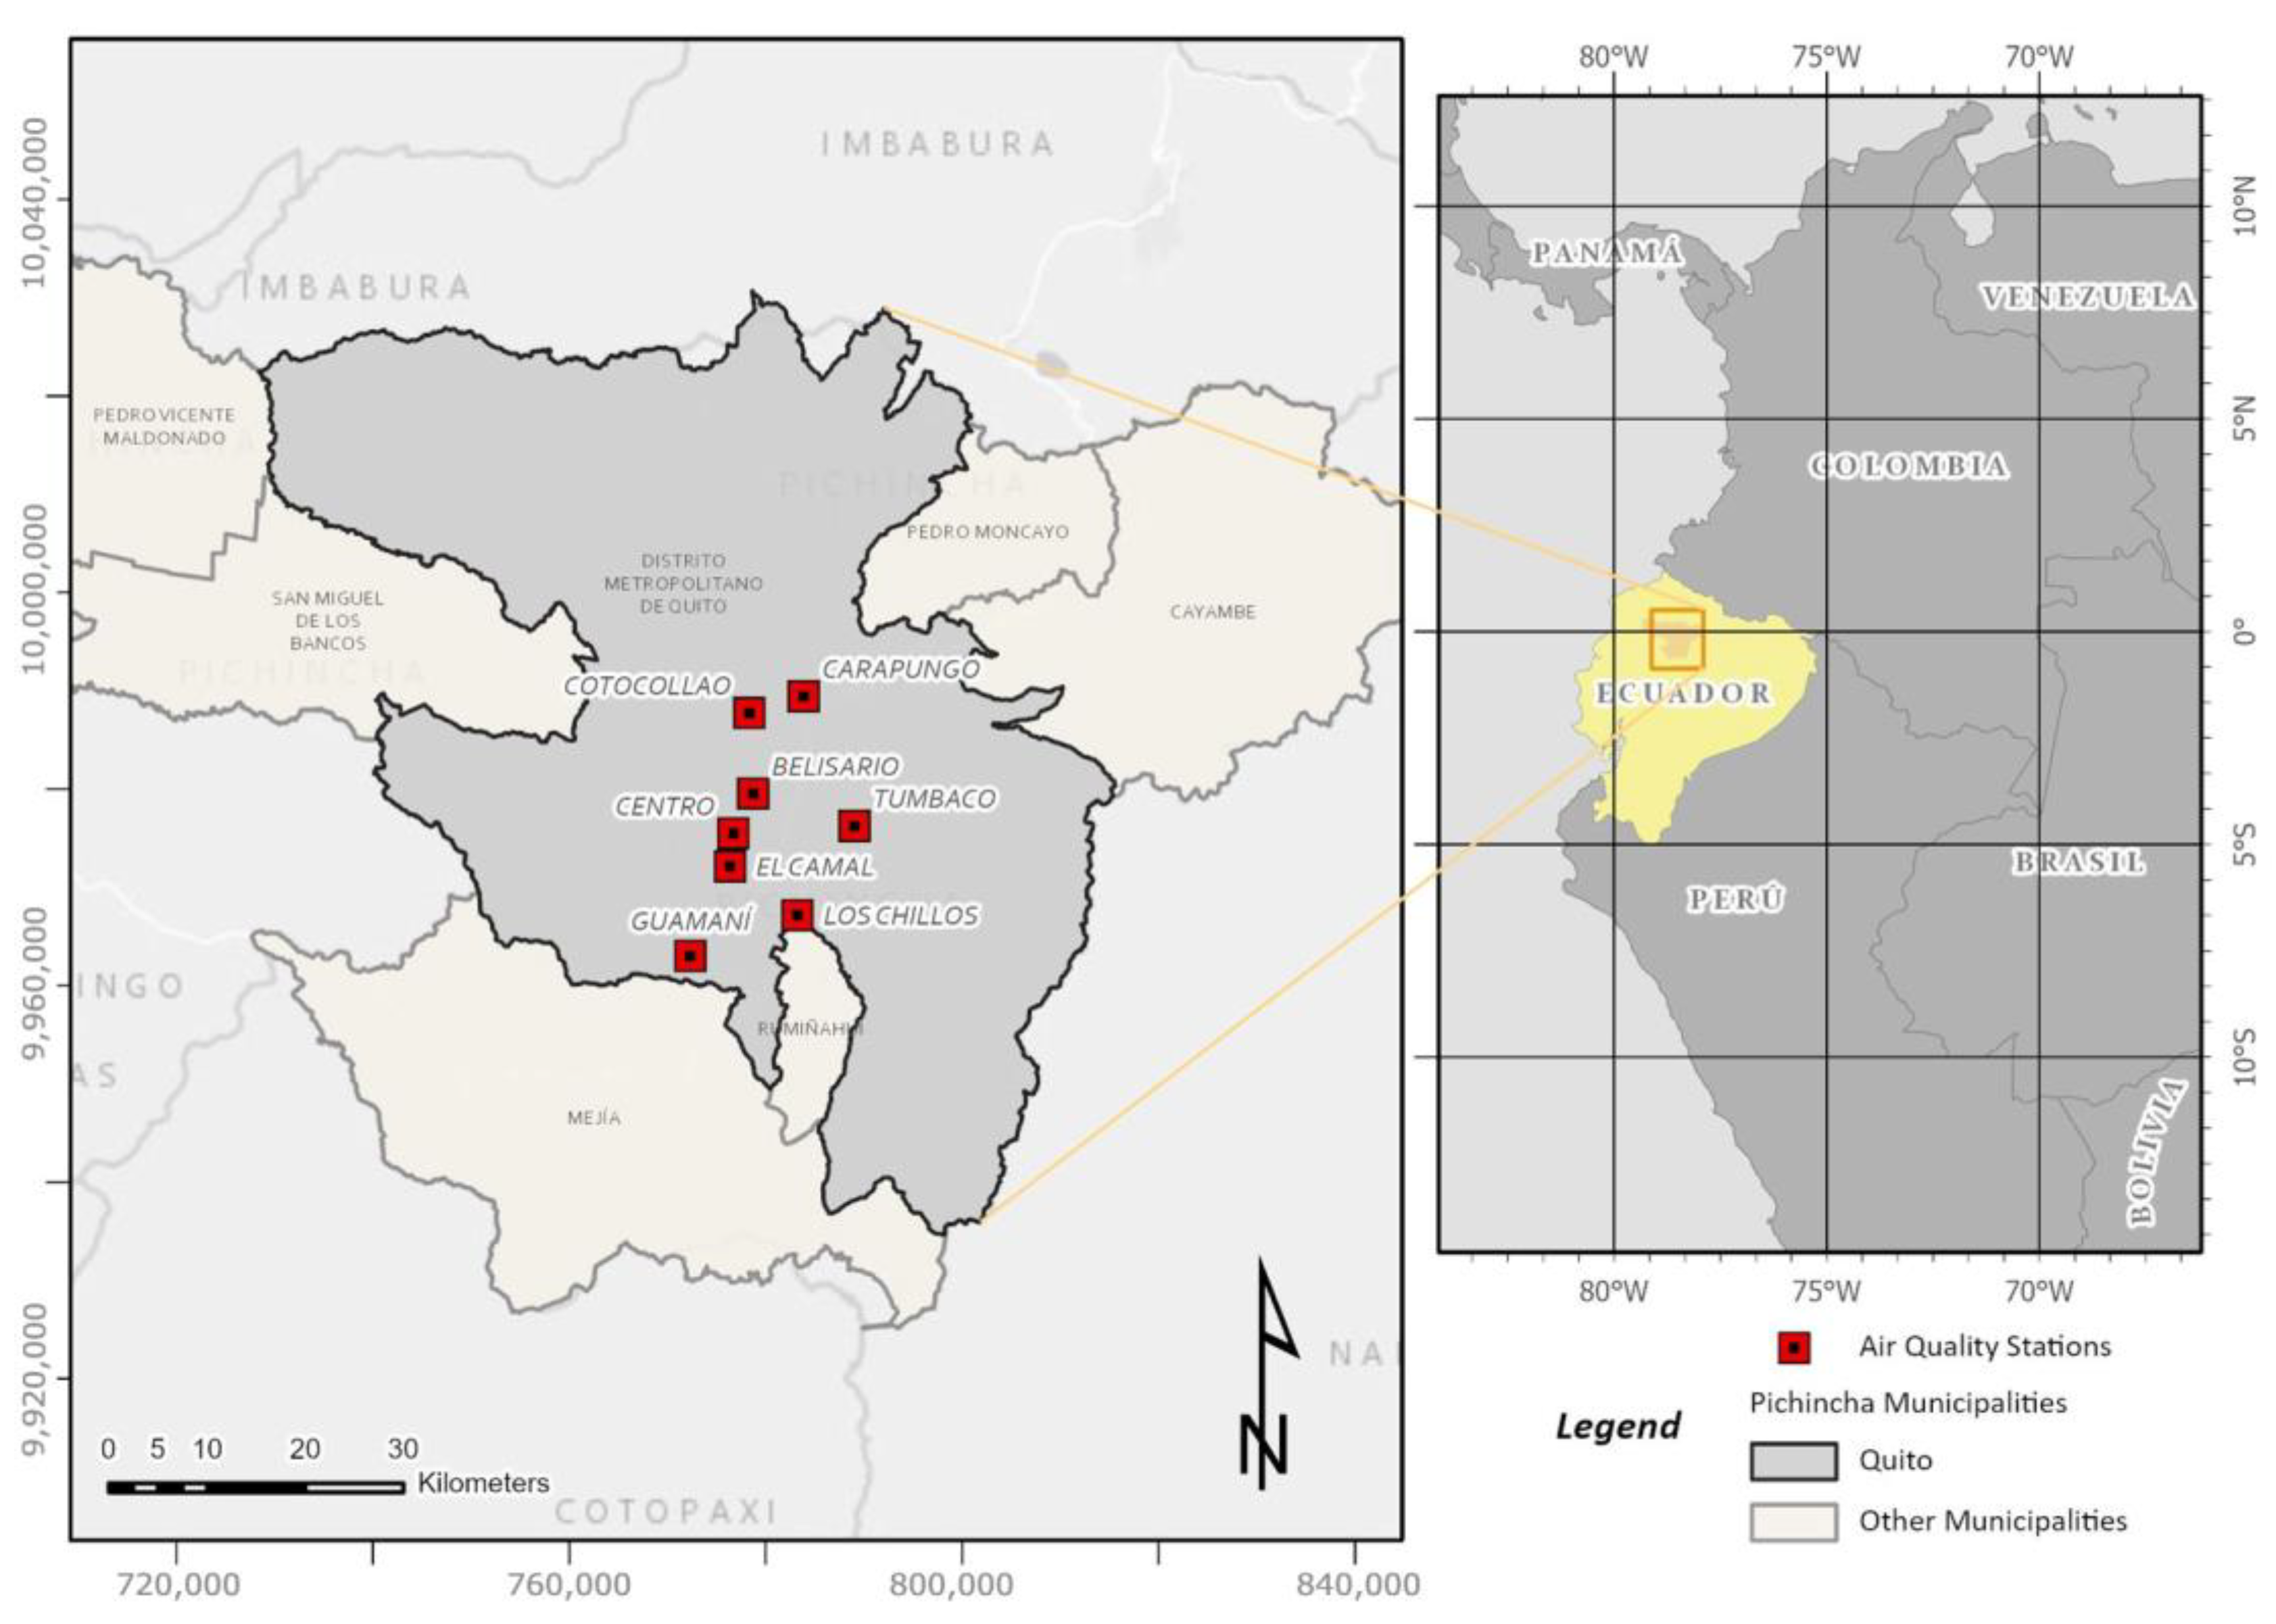
2. Study Area
3. Materials and Methods
3.1. The TROPOMI S5P Dataset
3.2. S5P and REEMAQ Stations Correlations
4. Results
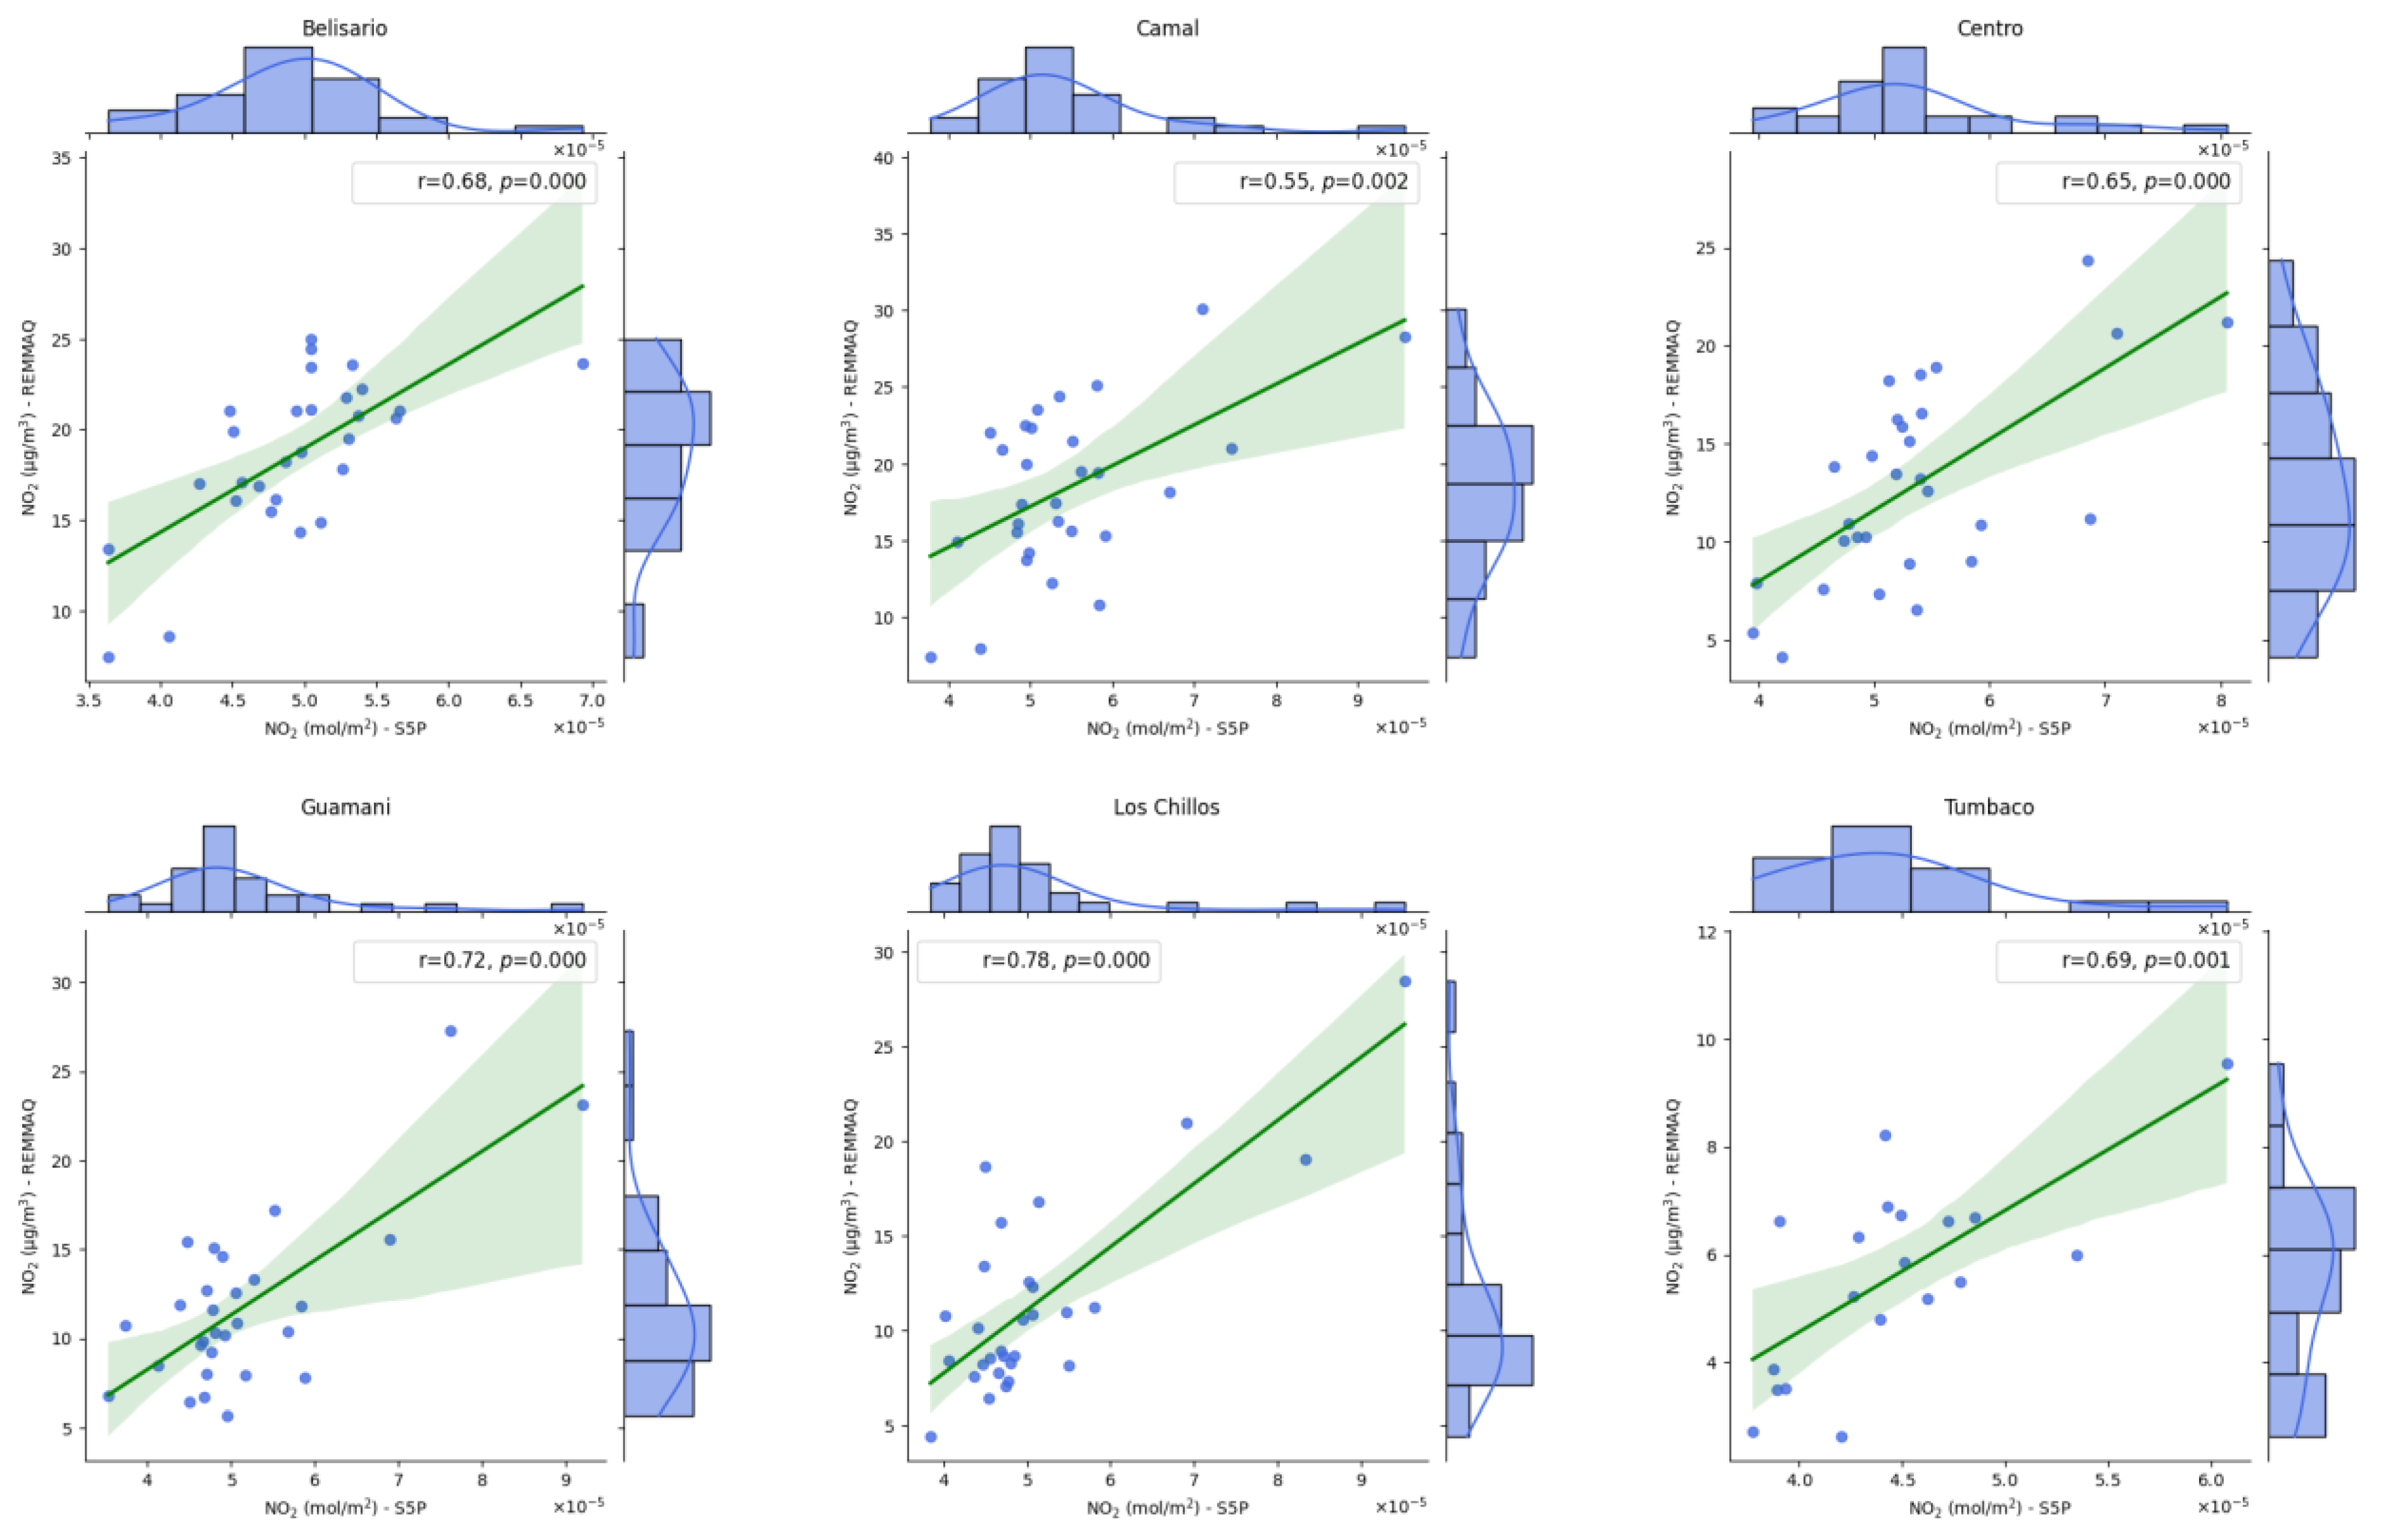
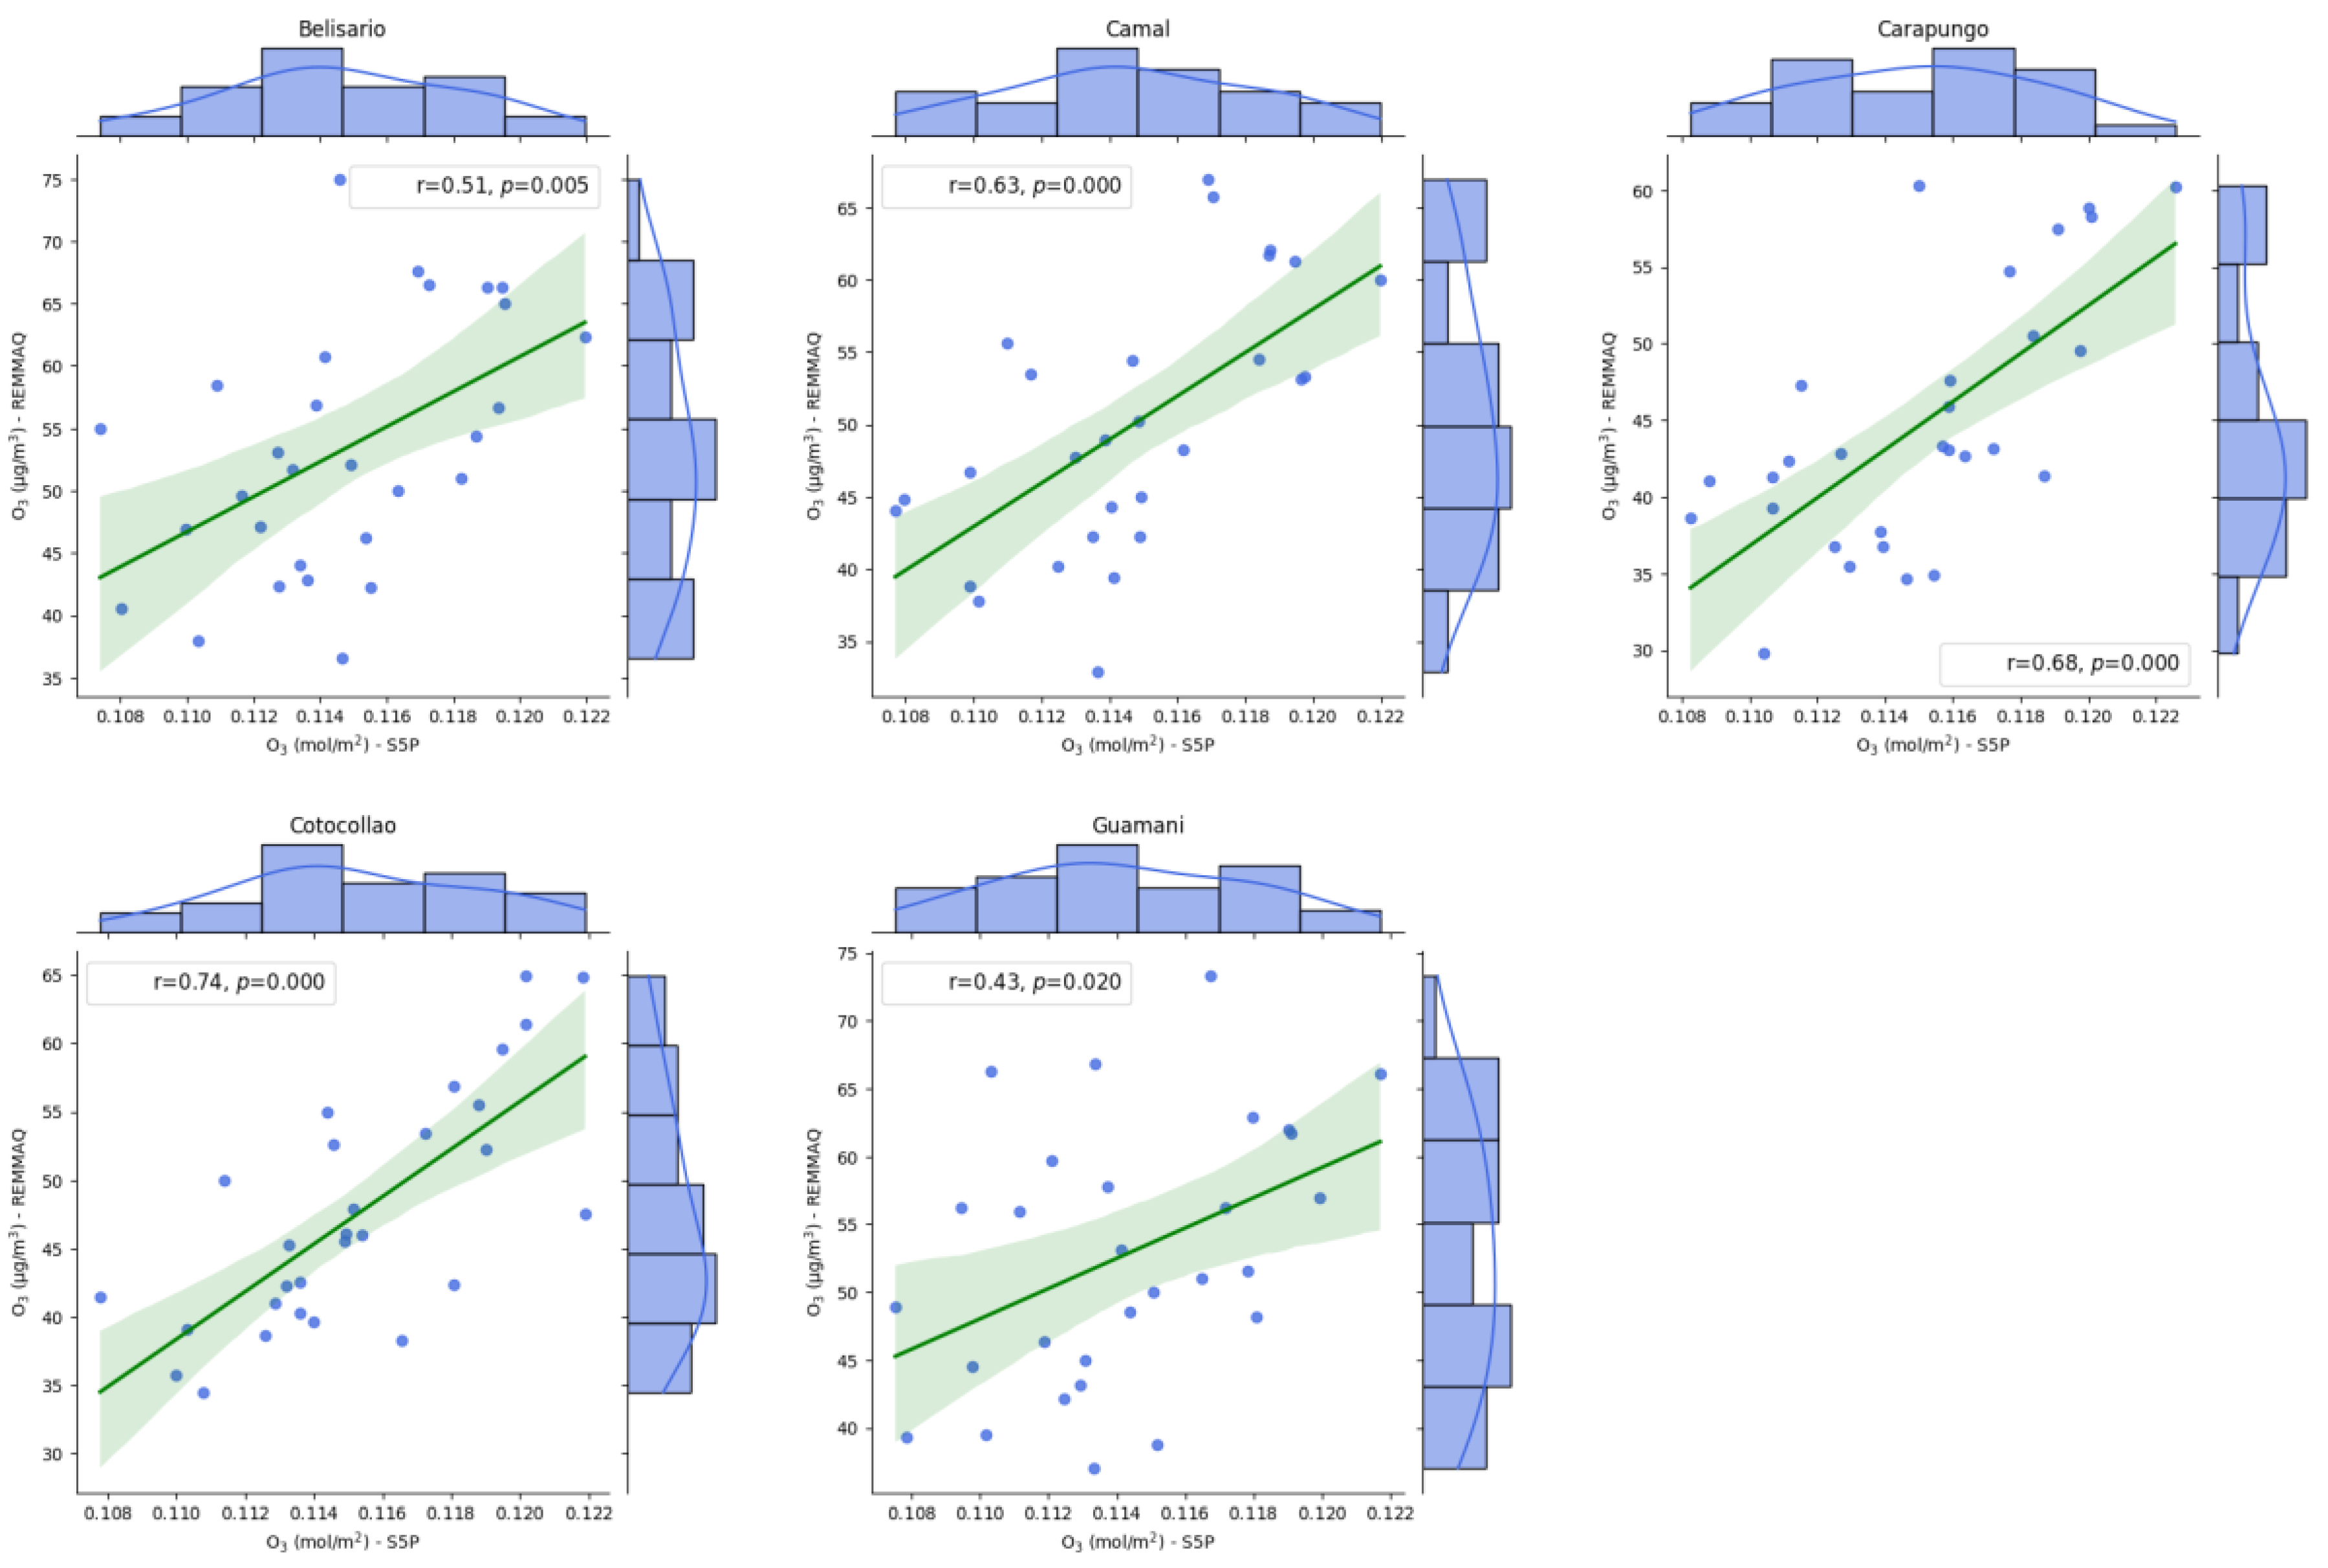
4.1. Correlation between S5P Data and In Situ Observations
4.2. T-Test Evaluations
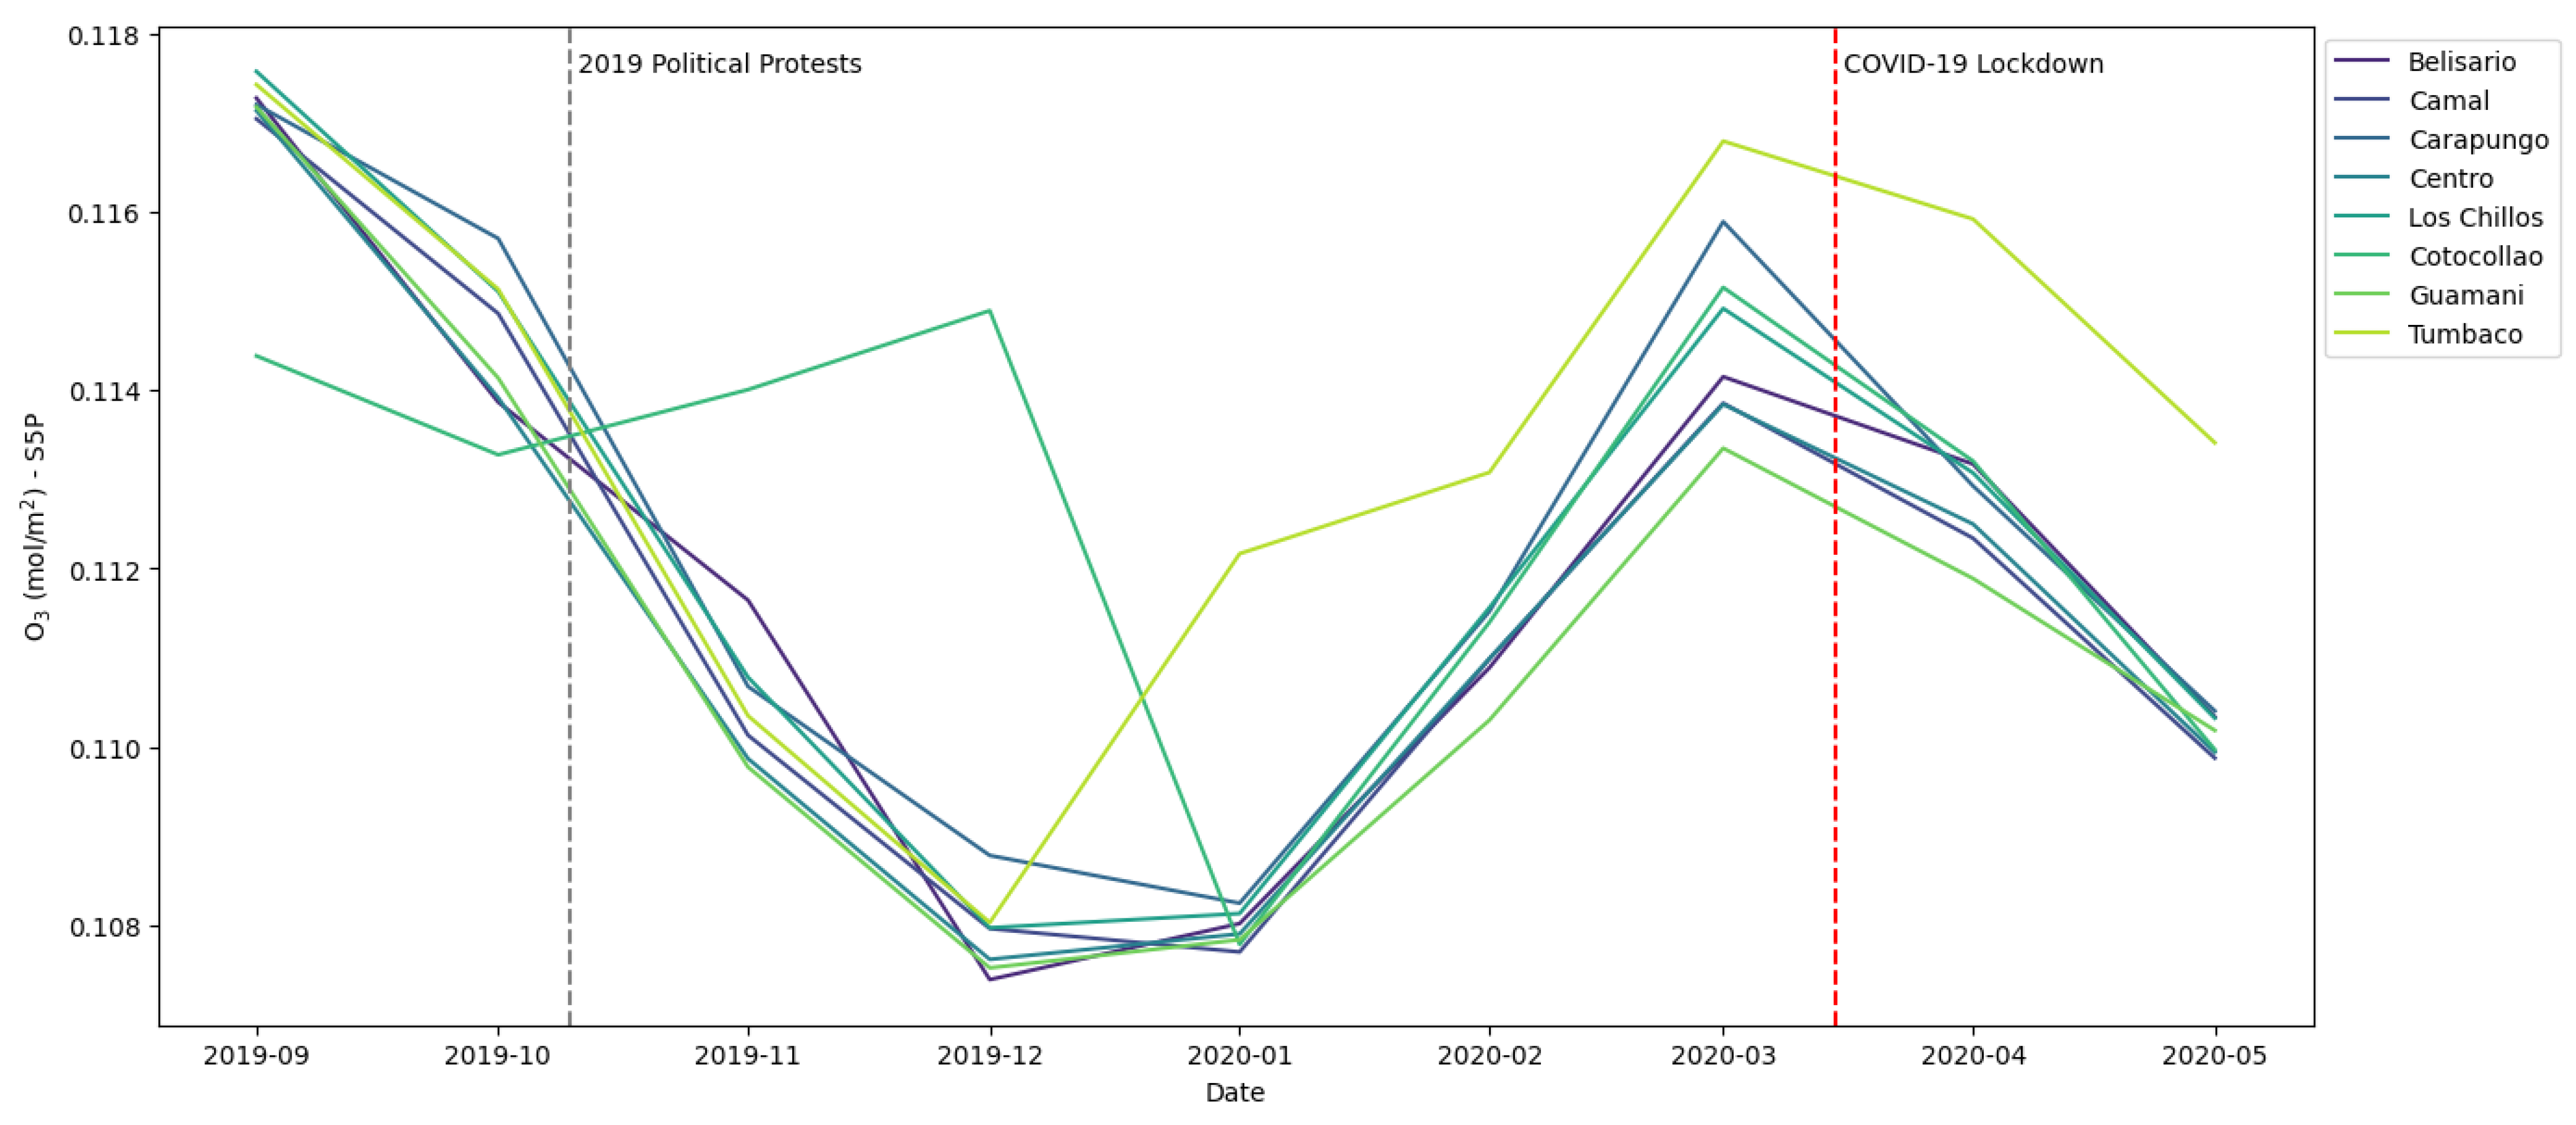
4.3. Incidence of Social Upheaval Events on Air Quality
4.4. Mapping and Comparing Air Quality Using Remotely Sensed Data
5. Discussion
6. Conclusions
Author Contributions
Funding
Data Availability Statement
Acknowledgments
Conflicts of Interest
References
- Diffenbaugh, N.; Field, C.; Appel, E.; Azevedo, I.; Baldocchi, D.; Burke, M.; Burney, J.; Ciais, P.; Davis, S.; Fiore, A.M.; et al. The COVID-19 Lockdowns: A Window into the Earth System. Nat. Rev. Earth Environ. 2020, 1, 470–481. [Google Scholar] [CrossRef]
- Luginaah, I.; Fung, K.; Gorey, K.; Shahedul, K. The Impact of 9/11 on the Association of Ambient Air Pollutions with Daily Respiratory Hospital Admissions in a Canada-US Border City, Windsor, Ontario. Int. J. Environ. Stud. 2006, 63, 501–5014. [Google Scholar] [CrossRef] [PubMed]
- Beck, M.J.; Hensher, D.A. Insights into the Impact of COVID-19 on Household Travel and Activities in Australia—The Early Days under Restrictions. Transp. Policy 2020, 96, 76–93. [Google Scholar] [CrossRef] [PubMed]
- Du, J.; Rakha, H.; Filali, F.; Eldardiry, H. COVID-19 Pandemic Impacts on Traffic System Delay, Fuel Consumption and Emissions. Int. J. Transp. Sci. Technol. 2021, 10, 184–196. [Google Scholar] [CrossRef]
- Nižetić, S. Impact of Coronavirus (COVID-19) Pandemic on Air Transport Mobility, Energy, and Environment: A Case Study. Int. J. Energy Res. 2020, 44, 10953–10961. [Google Scholar] [CrossRef]
- Kinver, M. Then and Now: Pandemic Clears the Air. BBC 2021. Available online: https://www.bbc.com/news/science-environment-57149747 (accessed on 29 October 2023).
- Franzosi, R. One Hundred Years of Strike Statistics: Methodological and Theoretical Issues in Quantitative Strike Research. ILR Rev. 1989, 42, 348–362. [Google Scholar] [CrossRef]
- Meinardi, S.; Nissenson, P.; Barletta, B.; Dabdub, D.; Rowland, S.; Blake, D. Influence of the Public Transportation System on the Air Quality of a Major Urban Center. A Case Study: Milan, Italy. Atmos. Environ. 2008, 42, 7915–7923. [Google Scholar] [CrossRef]
- Zalakeviciute, R.; Alexandrino, K.; Mejia, D.; Bastidas, M.G.; Oleas, N.H.; Gabela, D.; Chau, P.N.; Bonilla-Bedoya, S.; Diaz, V.; Rybarczyk, Y. The Effect of National Protest in Ecuador on PM Pollution. Sci. Rep. 2021, 11, 17591. [Google Scholar] [CrossRef]
- Cornejo, D.; Rodriguez, F.; Guasumba, A.; Toulkeridis, T. Contrasting Effects of Air Pollution Asessment in Two Areas of the Quito Metropolitan District, Ecuador. La Granja 2022, 36, 98–112. [Google Scholar] [CrossRef]
- Connolly, R.E.; Yu, Q.; Wang, Z.; Chen, Y.H.; Liu, J.Z.; Collier-Oxandale, A.; Papapostolou, V.; Polidori, A.; Zhu, Y. Long-Term Evaluation of a Low-Cost Air Sensor Network for Monitoring Indoor and Outdoor Air Quality at the Community Scale. Sci. Total Environ. 2022, 807, 150797. [Google Scholar] [CrossRef]
- Mancero Chicaiza, E.J.; Mancero Chicaiza, E.J. Evaluación de La Calidad Del Aire Durante El Tiempo de Protestas En Ciudades Sudamericanas. Rev. Geogr. Norte Gd. 2023, 2023, 159–176. [Google Scholar] [CrossRef]
- Bauernschuster, S.; Hener, T.; Rainer, H. When Labor Disputes Bring Cities to a Standstill: The Impact of Public Transit Strikes on Traffic, Accidents, Air Pollution, and Health. Am. Econ. J. Econ. Policy 2017, 9, 1–37. [Google Scholar] [CrossRef]
- Bauwens, M.; Stavrakou, T.; Müller, J.F.; De Smedt, I.; Van Roozendael, M.; Van Der Werf, G.R.; Wiedinmyer, C.; Kaiser, J.W.; Sindelarova, K.; Guenther, A. Nine Years of Global Hydrocarbon Emissions Based on Source Inversion of OMI Formaldehyde Observations. Atmos. Chem. Phys. 2016, 16, 10133–10158. [Google Scholar] [CrossRef]
- Baldasano, J.M. COVID-19 Lockdown Effects on Air Quality by NO2 in the Cities of Barcelona and Madrid (Spain). Sci. Total Environ. 2020, 741, 140353. [Google Scholar] [CrossRef] [PubMed]
- Huang, G.; Sun, K. Non-Negligible Impacts of Clean Air Regulations on the Reduction of Tropospheric NO2 over East China during the COVID-19 Pandemic Observed by OMI and TROPOMI. Sci. Total Environ. 2020, 745, 141023. [Google Scholar] [CrossRef]
- The National Academy of Sciences. Climate Change Evidence and Causes: Update 2020; The National Academy of Sciences: Washington, DC, USA, 2020. [Google Scholar]
- EPA Basic Information about NO2|US EPA. Available online: https://www.epa.gov/no2-pollution/basic-information-about-no2 (accessed on 29 October 2023).
- Reddington, C.L.; Conibear, L.; Knote, C.; Silver, B.J.; Li, Y.J.; Chan, C.K.; Arnold, S.R.; Spracklen, D.V. Exploring the Impacts of Anthropogenic Emission Sectors on PM2.5 and Human Health in South and East Asia. Atmos. Chem. Phys. 2019, 19, 11887–11910. [Google Scholar] [CrossRef]
- Khalaf, E.M.; Mohammadi, M.J.; Sulistiyani, S.; Ramírez-Coronel, A.A.; Kiani, F.; Jalil, A.T.; Almulla, A.F.; Asban, P.; Farhadi, M.; Derikondi, M. Effects of Sulfur Dioxide Inhalation on Human Health: A Review. Rev. Environ. Health 2022, 39, 331–337. [Google Scholar] [CrossRef]
- Zhang, Z.; Zhu, L. A Review on Unmanned Aerial Vehicle Remote Sensing: Platforms, Sensors, Data Processing Methods, and Applications. Drones 2023, 7, 398. [Google Scholar] [CrossRef]
- Turner, M.C.; Jerrett, M.; Pope, C.A.; Krewski, D.; Gapstur, S.M.; Diver, W.R.; Beckerman, B.S.; Marshall, J.D.; Su, J.; Crouse, D.L.; et al. Long-Term Ozone Exposure and Mortality in a Large Prospective Study. Am. J. Respir. Crit. Care Med. 2016, 193, 1134–1142. [Google Scholar] [CrossRef]
- Mollocana, J.; Álvarez, C.; Jaramillo, L. Assessment of Fuel Related Data in the Metropolitan District of Quito for Modeling and Simulation of Wildfires, Case Study: Atacazo Hill Wildfire. La Granja 2021, 34, 45–62. [Google Scholar]
- Thies, B.; Bendix, J. Satellite Based Remote Sensing of Weather and Climate: Recent Achievements and Future Perspectives. Meteorol. Appl. 2011, 18, 262–295. [Google Scholar] [CrossRef]
- Marć, M.; Tobiszewski, M.; Zabiegała, B.; Guardia, M.; Namieśnik, J. Current Air Quality Analytics and Monitoring: A Review. Anal. Chim. Acta 2015, 853, 116–126. [Google Scholar] [CrossRef]
- Faltynkova, A.; Johnsen, G.; Wagner, M. Hyperspectral Imaging as an Emerging Tool to Analyze Microplastics: A Systematic Review and Recommendations for Future Development. Microplastics Nanoplastics 2021, 1, 13. [Google Scholar] [CrossRef]
- Alvarez-Mendoza, C.I.; Teodoro, A.; Freitas, A.; Fonseca, J. Spatial Estimation of Chronic Respiratory Diseases Based on Machine Learning Procedures—An Approach Using Remote Sensing Data and Environmental Variables in Quito, Ecuador. Appl. Geogr. 2020, 123, 102273. [Google Scholar] [CrossRef]
- Álvarez, C. The Use of Remote Sensing in Air Pollution Control and Public Health. In Socio-Environmental Research in Latin America. The Latin American Studies Book Series; Springer: Berlin/Heidelberg, Germany, 2023; pp. 139–157. ISBN 978-3-031-22679-3. [Google Scholar]
- Jain, S.; Sharma, T. Social and Travel Lockdown Impact Considering Coronavirus Disease (COVID-19) on Air Quality in Megacities of India: Present Benefits, Future Challenges and Way Forward. Aerosol Air Qual. Res. 2020, 20, 1222–1236. [Google Scholar] [CrossRef]
- Forster, T.; Santini, G. Reinforcing Rural-Urban Linkages Resilient Food Systems. 2015. Available online: https://openknowledge.fao.org/server/api/core/bitstreams/9ff9bb27-ec9a-49c4-9f7e-81253ee28c9f/content (accessed on 29 October 2023).
- Duan, Y.; Ji, T.; Lu, Y.; Wang, S. Environmental Regulations and International Trade: A Quantitative Economic Analysis of World Pollution Emissions. J. Public Econ. 2021, 203, 104521. [Google Scholar] [CrossRef]
- Díaz, F.; Palacio, M. Inequality and the Socioeconomic Dimensions of Mobility in Protests: The Cases of Quito and Santiago. Glob. Policy 2021, 12, 78–90. [Google Scholar] [CrossRef]
- Zalakeviciute, R.; Vasquez, R.; Bayas, D.; Buenano, A.; Mejia, D.; Zegarra, R.; Diaz, V.; Lamb, B. Drastic Improvements in Air Quality in Ecuador during the COVID-19 Outbreak. Aerosol Air Qual. Res. 2020, 20, 1783–1792. [Google Scholar] [CrossRef]
- Alava, J.J.; Guevara, A. A Critical Narrative of Ecuador’s Preparedness and Response to the COVID-19 Pandemic. Public Health Pract. 2021, 2, 1–3. [Google Scholar] [CrossRef]
- Hoff, R.M.; Christopher, S.A. Remote Sensing of Pariculate Pollution from Space: Have We Reached the Promised Land? J. Air. Waste Manag. Assoc. 2009, 129, 645–675. [Google Scholar] [CrossRef]
- Chattopadhyay, S.; Gupta, S.; Saha, R.N. Spatial and Temporal Variation of Urban Air Quality: A GIS Approach. J. Environ. Prot. (Irvine Calif.) 2010, 01, 264–277. [Google Scholar] [CrossRef]
- Wong-Parodi, G.; Dias, M.B.; Taylor, M. Effect of Using an Indoor Air Quality Sensor on Perceptions of and Behaviors toward Air Pollution (Pittsburgh Empowerment Library Study): Online Survey and Interviews. JMIR mHealth uHealth 2018, 6, e8273. [Google Scholar] [CrossRef] [PubMed]
- Zambrano, M.; Ruano, M. Has Air Quality Improved in Ecuador during the COVID-19 Pandemic? A Parametric Analysis. Air Qual. Atmos. Health 2020, 13, 929–938. [Google Scholar] [CrossRef]
- Heue, K.P.; Loyola, D.; Romahn, F.; Zimmer, W.; Chabrillat, S.; Errera, Q.; Ziemke, J.; Kramarova, N. Tropospheric Ozone Retrieval by a Combination of TROPOMI/S5P Measurements with BASCOE Assimilated Data. Atmos. Meas. Tech. 2022, 15, 5563–5579. [Google Scholar] [CrossRef]
- Gorelick, N.; Hancher, M.; Dixon, M.; Ilyushchenko, S.; Thau, D.; Moore, R. Google Earth Engine: Planetary-Scale Geospatial Analysis for Everyone. Remote Sens. Environ. 2017, 202, 18–27. [Google Scholar] [CrossRef]
- Grzybowski, P.T.; Markowicz, K.M.; Musiał, J.P. Estimations of the Ground-Level NO2 Concentrations Based on the Sentinel-5P NO2 Tropospheric Column Number Density Product. Remote Sens. 2023, 15, 378. [Google Scholar] [CrossRef]
- UNDP. COVID-19 Impact on Air Quality in Ukraine and the Republic of Moldova Work Order; UNDP: New York, NY, USA, 2020. [Google Scholar]
- Kelly, J.; Zhao, J.; Xing, J.; Zhang, Y.; Han, S.; Kundhikanjana, W.; Towashiraporn, P.; Stratoulias, D. Interpolation-Based Fusion of Sentinel-5P, SRTM, and Regulatory-Grade Ground Stations Data for Producing Spatially Continuous Maps of PM2.5 Concentrations Nationwide over Thailand. Atmosphere 2022, 13, 161. [Google Scholar] [CrossRef]
- Morillas, C.; Alvarez, S.; Serio, C.; Masiello, G.; Martinez, S. TROPOMI NO2 Sentinel-5P Data in the Community of Madrid: A Detailed Consistency Analysis with in Situ Surface Observations. Remote Sens. Appl. Soc. Environ. 2024, 33, 101083. [Google Scholar] [CrossRef]
- Soleimany, A.; Grubliauskas, R.; Šerevičienė, V. Application of Satellite Data and GIS Services for Studying Air Pollutants in Lithuania (Case Study: Kaunas City). Air Qual. Atmos. Health 2021, 14, 411–429. [Google Scholar] [CrossRef]
- Han, S.; Bian, H.; Feng, Y.; Liu, A.; Li, X.; Zeng, F.; Zhang, X. Analysis of the Relationship between O3, NO and NO2 in Tianjin, China. Aerosol Air Qual. Res. 2011, 11, 128–139. [Google Scholar] [CrossRef]
- Zoran, M.A.; Savastru, R.S.; Savastru, D.M.; Tautan, M.N. Assessing the Relationship between Ground Levels of Ozone (O3) and Nitrogen Dioxide (NO2) with Coronavirus (COVID-19) in Milan, Italy. Sci. Total Environ. 2020, 740, 140005. [Google Scholar] [CrossRef] [PubMed]
- World Health Organization (WHO). WHO Global Air Quality Guidelines; WHO: Geneva, Switzerland, 2021. [Google Scholar]
- Targino, A.C.; Harrison, R.M.; Krecl, P.; Glantz, P.; de Lima, C.H.; Beddows, D. Surface Ozone Climatology of South Eastern Brazil and the Impact of Biomass Burning Events. J. Environ. Manag. 2019, 252, 109645. [Google Scholar] [CrossRef] [PubMed]
- Ravina, M.; Caramitti, G.; Panepinto, D.; Zanetti, M. Air Quality and Photochemical Reactions: Analysis of NOx and NO2 Concentrations in the Urban Area of Turin, Italy. Air Qual. Atmos. Health 2022, 15, 541. [Google Scholar] [CrossRef]
- Atiaga, O.; Guerrero, F.; Páez, F.; Castro, R.; Collahuazo, E.; Nunes, L.M.; Grijalva, M.; Grijalva, I.; Otero, X.L. Assessment of Variations in Air Quality in Cities of Ecuador in Relation to the Lockdown Due to the COVID-19 Pandemic. Heliyon 2023, 9, e17033. [Google Scholar] [CrossRef] [PubMed]
- Berman, J.D.; Ebisu, K. Changes in U.S. Air Pollution during the COVID-19 Pandemic. Sci. Total Environ. 2020, 739, 139864. [Google Scholar] [CrossRef]
- Alvarez-Mendoza, C.I.; Lopez, S.; Vasquez, D. Monitoring Air Quality Using Remote Sensing Based on a Google Earth Engine Application in Countries with Limited Air Quality Data and Control Policies: A Case Study in Ecuador. Remote Sens. Technol. Appl. Urban Environ. VIII 2023, 12735, 80–85. [Google Scholar] [CrossRef]
- Kumar, P.; Singh, A.B.; Arora, T.; Singh, S.; Singh, R. Critical Review on Emerging Health Effects Associated with the Indoor Air Quality and Its Sustainable Management. Sci. Total Environ. 2023, 872, 162163. [Google Scholar] [CrossRef]
- Tran, H.M.; Tsai, F.J.; Lee, Y.L.; Chang, J.H.; Chang, L.T.; Chang, T.Y.; Chung, K.F.; Kuo, H.P.; Lee, K.Y.; Chuang, K.J.; et al. The Impact of Air Pollution on Respiratory Diseases in an Era of Climate Change: A Review of the Current Evidence. Sci. Total Environ. 2023, 898, 166340. [Google Scholar] [CrossRef] [PubMed]
- Alvarez, C.; Teodoro, A.; Torres, N.; Vivanco, V. Assessment of Remote Sensing Data to Model PM10 Estimation in Cities with a Low Number of Air Quality Stations: A Case of Study in Quito, Ecuador. Environments 2019, 6, 85. [Google Scholar] [CrossRef]
- Lane, T.P.; King, A.D.; Perkins-Kirkpatrick, S.E.; Pitman, A.J.; Alexander, L.V.; Arblaster, J.M.; Bindoff, N.L.; Bishop, C.H.; Black, M.T.; Bradstock, R.A.; et al. Attribution of Extreme Events to Climate Change in the Australian Region—A Review. Weather Clim. Extrem. 2023, 42, 100622. [Google Scholar] [CrossRef]
- Xu, R.; Yu, P.; Liu, Y.; Chen, G.; Yang, Z.; Zhang, Y.; Wu, Y.; Beggs, P.J.; Zhang, Y.; Boocock, J.; et al. Climate Change, Environmental Extremes, and Human Health in Australia: Challenges, Adaptation Strategies, and Policy Gaps. Lancet Reg. Health-West. Pacific 2023, 40, 100936. [Google Scholar] [CrossRef] [PubMed]
- Jones, G.S.; Stott, P.A.; Christidis, N. Attribution of Observed Historical Near-Surface Temperature Variations to Anthropogenic and Natural Causes Using CMIP5 Simulations. J. Geophys. Res. Atmos. 2013, 118, 4001–4024. [Google Scholar] [CrossRef]


| Parameter (Unit)—Source | N | Mean | Median | Std. Dev. | Min | Max |
|---|---|---|---|---|---|---|
| NO2 (μg/m3)—REMMAQ | 222 | 11.987455 | 10.855000 | 6.391611 | 1.390000 | 30.080000 |
| NO2 (mol/m2)—S5P | 222 | 0.000050 | 0.000049 | 0.000009 | 0.000035 | 0.000096 |
| O3 (μg/m3)—REMMAQ | 221 | 50.510452 | 49.510000 | 10.497901 | 29.770000 | 80.160000 |
| O3 (mol/m2)—S5P | 222 | 0.114695 | 0.114584 | 0.003601 | 0.107391 | 0.122577 |
| Period | Trace Gas | Month, Year | Mean (mol/m2) | Var | Pearson Corr. | Mean Diff. | t Stat | p-Value | Change Direction | Percent Change | |
|---|---|---|---|---|---|---|---|---|---|---|---|
| T1 | O3 | Sep 2019 | 0.115887 | 0.000000 | 0.22 | −0.006380 | 59.39 | 0.000 | ++ | − | −5.51% |
| T2 | Nov 2019 | 0.109507 | 0.000000 | - | - | - | - | ||||
| T1* | Mar 2020 | 0.112569 | 0.000000 | 0.52 | −0.003555 | 43.59 | 0.000 | ++ | − | −3.16% | |
| T2* | May 2020 | 0.109013 | 0.000000 | - | - | - | - | ||||
| T1 | NO2 | Sep 2019 | 0.000043 | 0.000000 | 0.56 | 0.000007 | −5.96 | 0.000 | ++ | + | 15.15% |
| T2 | Nov 2019 | 0.000050 | 0.000000 | - | - | - | - | ||||
| T1* | Mar 2020 | 0.000038 | 0.000000 | 0.59 | 0.000004 | −8.17 | 0.000 | ++ | + | 9.72% | |
| T2* | May 2020 | 0.000042 | 0.000000 | - | - | - | - | ||||
| T1 | O3 | Sep 2019 | 0.115887 | 0.000000 | 0.34 | −0.006874 | 69.11 | 0.000 | ++ | − | −5.93% |
| T2* | May 2020 | 0.109013 | 0.000000 | ||||||||
| T1 | NO2 | Sep 2019 | 0.000043 | 0.000000 | 0.53 | −0.000002 | 2.64 | 0.013 | + | − | −3.62% |
| T2* | May 2020 | 0.000042 | 0.000000 |
Disclaimer/Publisher’s Note: The statements, opinions and data contained in all publications are solely those of the individual author(s) and contributor(s) and not of MDPI and/or the editor(s). MDPI and/or the editor(s) disclaim responsibility for any injury to people or property resulting from any ideas, methods, instructions or products referred to in the content. |
© 2024 by the authors. Licensee MDPI, Basel, Switzerland. This article is an open access article distributed under the terms and conditions of the Creative Commons Attribution (CC BY) license (https://creativecommons.org/licenses/by/4.0/).
Share and Cite
Alvarez, C.I.; López, S.; Vásquez, D.; Gualotuña, D. Assessing Air Quality Dynamics during Short-Period Social Upheaval Events in Quito, Ecuador, Using a Remote Sensing Framework. Remote Sens. 2024, 16, 3436. https://doi.org/10.3390/rs16183436
Alvarez CI, López S, Vásquez D, Gualotuña D. Assessing Air Quality Dynamics during Short-Period Social Upheaval Events in Quito, Ecuador, Using a Remote Sensing Framework. Remote Sensing. 2024; 16(18):3436. https://doi.org/10.3390/rs16183436
Chicago/Turabian StyleAlvarez, Cesar Ivan, Santiago López, David Vásquez, and Dayana Gualotuña. 2024. "Assessing Air Quality Dynamics during Short-Period Social Upheaval Events in Quito, Ecuador, Using a Remote Sensing Framework" Remote Sensing 16, no. 18: 3436. https://doi.org/10.3390/rs16183436