Article

Proximal Sensing for Characterising Seaweed Aquaculture Crop Conditions: Optical Detection of Ice-Ice Disease

1
Institut des Substances et Organismes de la Mer (ISOMer), Nantes Université, UR 2160, F-44000 Nantes, France
2
Marine Science Department, Marine Science and Fisheries Faculty, Hasanuddin University, Makassar 90245, Indonesia
3
Research and Development Center for Marine, Coast, and Small Island, Hasanuddin University, Jl. Perintis Kemerdekaan Km.10, Makassar 90245, Indonesia
4
Department of Remote Sensing and Geographic Information Systems, Vocational Faculty, Hasanuddin University, Jl. Perintis Kemerdekaan Km.10, Makassar 90245, Indonesia
*
Author to whom correspondence should be addressed.
Remote Sens. 2024, 16(18), 3502; https://doi.org/10.3390/rs16183502
Submission received: 17 June 2024 / Revised: 12 September 2024 / Accepted: 19 September 2024 / Published: 21 September 2024
(This article belongs to the Special Issue Innovative UAV Applications)

Abstract

:
Crop monitoring is a fundamental practice in seaweed aquaculture. Seaweeds are vulnerable to several threats such as ice-ice disease (IID) causing a whitening of the thallus due to depigmentation. Crop condition assessment is important for minimizing yield losses and improving the biosecurity of seaweed farms. The recent influence of modern technology has resulted in the development of precision aquaculture. The present study focuses on the exploitation of spectral reflectance in the visible and near-infrared regions for characterizing the crop condition of two of the most cultivated Eucheumatoids species: Kappaphycus alvareezi and Eucheuma denticulatum. In particular, the influence of spectral resolution is examined towards discriminating: (a) species and morphotypes, (b) different levels of seaweed health (i.e., from healthy to completely depigmented) and (c) depigmented from silted specimens (thallus covered by a thin layer of sediment). Two spectral libraries were built at different spectral resolutions (5 and 45 spectral bands) using in situ data. In addition, proximal multispectral imagery using a drone-based sensor was utilised. At each experimental scenario, the spectral data were classified using a Random Forest algorithm for crop condition identification. The results showed good discrimination (83–99% overall accuracy) for crop conditions and morphotypes regardless of spectral resolution. According to the importance scores of the hyperspectral data, useful wavelengths were identified for discriminating healthy seaweeds from seaweeds with varying symptoms of IID (i.e., thalli whitening). These wavelengths assisted in selecting a set of vegetation indices for testing their ability to improve crop condition characterisation. Specifically, five vegetation indices (the RBNDVI, GLI, Hue, Green–Red ratio and NGRDI) were found to improve classification accuracy, making them recommended for seaweed health monitoring. Image-based classification demonstrated that multispectral library data can be extended to photomosaics to assess seaweed conditions on a broad scale. The results of this study suggest that proximal sensing is a first step towards effective seaweed crop monitoring, enhancing yield and contributing to aquaculture biosecurity.

Graphical Abstract

1. Introduction

Macroalgae farming has experienced significant advancements in recent decades [1,2]. Recently, state-of-the-art technology has been introduced for remotely monitoring macroalgae growth and water environmental parameters at various scales [3,4,5,6,7]. This is true for Eucheumatoids macroalgae cultivated in the tropics, which are of high economic significance due to their carrageenan content [1,8]. These recent developments have initiated precision aquaculture techniques using unmanned system technologies [9,10]. An important aspect of effective aquaculture management is crop condition monitoring, related to biomass quality control to achieve maximum crop yields [8,11,12].
Regular crop condition assessment (e.g., daily or weekly) involves collecting macroscopic information about the health of the macroalgae thallus, typically through visual examination or photographs. Various management decisions can be made based on visible crop condition indicators [12]. This assessment is crucial for the early detection of health issues in macroalgae. In Eucheumatoids algae of the genus Kappaphycus sp. and Eucheuma sp., the main signs include (a) silting, (b) epiphytes or epizoa, (c) grazing marks and (d) disease-causing colour changes. They can directly or indirectly make crops vulnerable to pathogens or indicate disease symptoms affecting the thallus [13,14]. Silting occurs in poorly circulating, turbid waters and directly impacts the photosynthetic ability of macroalgae, leading to reduced yields. Under stressed conditions, it can also promote the development of ice-ice disease (IID) [11,15]. Epiphytes and endophytes impact both the quantity and quality of the biomass [16,17]. Grazing is a major cause of yield loss, contributing to macroalgae stress and disease, as mechanical injuries on the thalli open the way for pathogens [14,15]. IID is the most common syndrome in Eucheumatoids, caused by unfavourable environmental conditions (temperature and salinity) followed by a bacterial infestation [14,15]. Its main symptom is loss of pigmentation, leading to a gradual whitening and hardening of the thalli [11,12,13]. IID is a major yield-limiting factor and has caused significant economic damage recently [14,15,17]. Although there are several studies on IID in Eucheumatoids, no effective approach has been developed for the early detection of IID symptoms using optical sensors. A regular and automated crop condition assessment would be important to increase biomass yield and strengthen the biosecurity of macroalgae aquaculture [12,13,15,18,19].
Modern technological advances in drone and sensor equipment have resulted in the development of a new sector, that of ‘precision aquaculture’ [9], and a growing demand for automated procedures in aquaculture production [3,10,20,21]. For example, [3] estimated the canopy area of offshore-farmed kelp species using drone imagery, while [22] applied this technique to monitor green macroalgae cultivation in the Yellow Sea. Using a multispectral drone, [9] evaluated macroalgae biomass and carrageenan yield at the spatial resolution of single cultivation lines. Reference [23] used the same drone technology to accurately distinguish between different types of shallow water macroalgae, while [24] utilised in situ spectrometry and multispectral drone data to characterise Sargassum accumulations onshore. In particular, they distinguished Sargassum at different decomposition stages, proposing an effective approach for monitoring phenotypic properties. Similarly, [25] quantified the decay level of stranded Sargassum using in situ spectrometry to inform coastal management decision makers. Several studies have shown that macroalgae taxa can be spectrally discriminated due to their characteristic photosynthetic and accessory pigments using spectral libraries for analysing and quantifying macroalgae optical properties [26,27,28,29,30,31]. These examples highlight numerous potential applications for spectral reflectance and image analysis approaches in seaweed aquaculture.
This study aims to evaluate the utility of visible near-infrared (VIS-NIR) spectroradiometry in remotely characterising the loss of thallus pigmentation for Eucheuma denticulatum and Kappaphycus alvarezii using proximal sensing techniques. A spectroradiometer was used to measure the hyperspectral spectral signatures (or shapes) of cultivated macroalgae over various crop conditions spanning from healthy to various levels of depigmentation, including silted and fully whitened specimens. We employed linear spectral mixing between healthy and whitened specimens to enhance the dataset for characterising thallus whitening. Spectral signatures were degraded at a drone multispectral sensor resolution to assess the potential loss of information at a lower spectral resolution. Two spectral libraries were built at a hyper- and multispectral resolution. Applying machine learning classifications, the most suitable bands and spectral indices for effective crop condition monitoring were identified. A raster-based classification was further applied to assess the performance of crop condition discrimination using a drone multispectral sensor.

2. Methodology

2.1. In Situ Data Acquisition

Macroalgae samples were collected from a nearshore farm at Punaga village (5°35′2.257′S, 119°25′52.058”E; South-West Sulawesi, Indonesia) in order to create a baseline spectral library. Hyperspectral visible and near-infrared measurements were recorded using a field-portable Lamba NIR spectroradiometer (Japan). After removing the dark current noise, the radiance of a 99% reflective Spectralon® (Labsphere, North Sutton, NH, USA) reference panel was measured to convert each radiance measurement into reflectance. Measurements were obtained using a fiber-optic cable. Mean reflectance was calculated from at least six spectra replicates for each sample. Spectral signatures were subsampled at 10 nm intervals in the 400–850 nm range for further examination. The samples included: (a) E. denticulatum, (b) E. denticulatum covered with silt, (c) depigmented thallus of E. denticulatum, (d) green morphotype of K. alvarezii and (e) brown morphotype of K. alvarezii (Figure 1). The average spectra along with one standard deviation (SD) boundaries are presented in the Supplementary Materials (Figures S1–S5).
The hyperspectral signatures were further degraded to the five bands of a DJI Phantom 4 multispectral drone presented with more details in a previous study [9]. The multispectral bands are monochrome sensors with a spectral range including blue (450 nm ± 16 nm), green (560 nm ± 16 nm), red (650 ± 16 nm), red edge (730 nm ± 16 nm) and near-infrared (840 nm ± 26 nm) wavelengths. Proximal images were taken 1.5 m above the macroalgae samples, and composite photomosaics were produced using the Pix4D software v4.5.6. Camera-specific geometric and radiometric corrections were applied using the EXIF metadata regarding sun angle and incoming solar radiance. After processing, the photomosaics were imported to SAGA GIS for image analysis and the extraction of multispectral signatures.

2.2. Experimental Scenarios

In order to obtain a wider variability of crop condition cases, a set of synthetic spectra was produced by combining the spectra of healthy thalli with the depigmented specimen spectrum through linear spectral mixing. In this way, the initial spectral library was augmented, allowing for a more comprehensive examination of thallus whitening conditions. A set of four additional mixed spectra (i.e., 10% White, 25% White, 50% White and 75% White) was produced for E. denticulatum and K. alvareezi using Equation (1).
Rmix = a × Rhealthy + b × Rwhite
where R is reflectance, and a and b are percentage factors (a + b = 1).
A spectral library was set up to cover different thallus whitening of E. denticulatum and K. alvareezi (Table 1). The Random Forest (RF) algorithm was utilised to classify crop conditions (outside water) using this spectral library. This classification was performed at both hyperspectral (46 spectral bands) and multispectral (5 spectral bands) resolutions, along with a set of 14 spectral indices commonly employed in vegetation mapping (Table 2; [32]). RF was preferred for its high accuracy, insensitivity to overfitting and availability in several standard software [33]. It has been successfully applied in numerous studies for marine vegetation mapping and seafloor characterisation [34,35,36,37,38]. The concept of the RF algorithm is based on an ensemble procedure of multiple random subsets (classification trees) of the explanatory variables (bands or spectral indices in this study) for generating a classification model describing the variability of the dependent variable (classes of crop condition). Training data are essential in the RF process and should encompass the full range of variability for each class (Table 1). A particularly useful aspect of RF is that it estimates the importance of each spectral band, providing useful insights regarding the suitability of specific wavelengths or indices in classifying crop conditions. This study used the RF implementation from VIGRA in SAGA GIS, growing 200 trees and sampling with replacement during model training. Variable importance was estimated by permuting one variable at each training cycle and measuring the (out-of-bag) error change in the classification results. The larger the error, the greater the importance of this particular variable. The formula (Equation (2)) for the relative importance metric is given by [39]. Let B ¯ ( t ) be the out-of-bag sample for a tree t. Then, the variable importance of variable Xj in tree t is:
V I t ( X j ) = i B ¯ ( t ) I ( y i ( t ) ) / B ¯ ( t ) i B ¯ ( t ) I ( y i , π j ( t ) ) / B ¯ ( t )
where y i ( t ) is the predicted class for observation i before, and y i , π j ( t ) is the predicted class for observation i after permuting its value of variable Xj.
The variable importance metric was estimated for the hyperspectral and indices variables. The importance scores from the hyperspectral data classification assisted in selecting vegetation indices (Table 2). The vegetation indices were preselected based on the availability of the multispectral bands of the drone sensor.
In addition to the spectral libraries, the RF classification was applied to multispectral images captured using the hand-held DJI Phantom 4 multispectral drone. The multispectral bands were also combined to compute vegetation indices (Table 2), and the indices with the highest importance scores were used for an RF classification. Classification results from tabular and photomosaic data were evaluated by constructing the respective confusion matrices for each experimental case (Table 1).

3. Results

The spectral signatures of the three Eucheumatoids species with no signs of white discolouration of the thallus (hereafter referred to as healthy) showed absorption in the visible region, a marked reflectance feature in the red edge and a constant reflectance in the NIR region (Figure 2A). The green morphotype of K. alvareezi was characterised by a higher reflectance at 550 nm responsible for the green colour of the macroalgae. The brown morphotype had high reflectance shifted to longer wavelengths between 600 and 650 nm. E. denticulatum showed a similar higher reflectance between 600 and 650 nm, giving the characteristic dark brown colour of the thallus. The wavelengths of importance to discriminate the green morphotype of Kappaphycus from E. denticulatum and the brown morphotype of Kappaphycus was 530–560 nm (Figure 2B). The blue wavelengths were more important for differentiating E. denticulatum from the Kappaphycus brown morphotype.

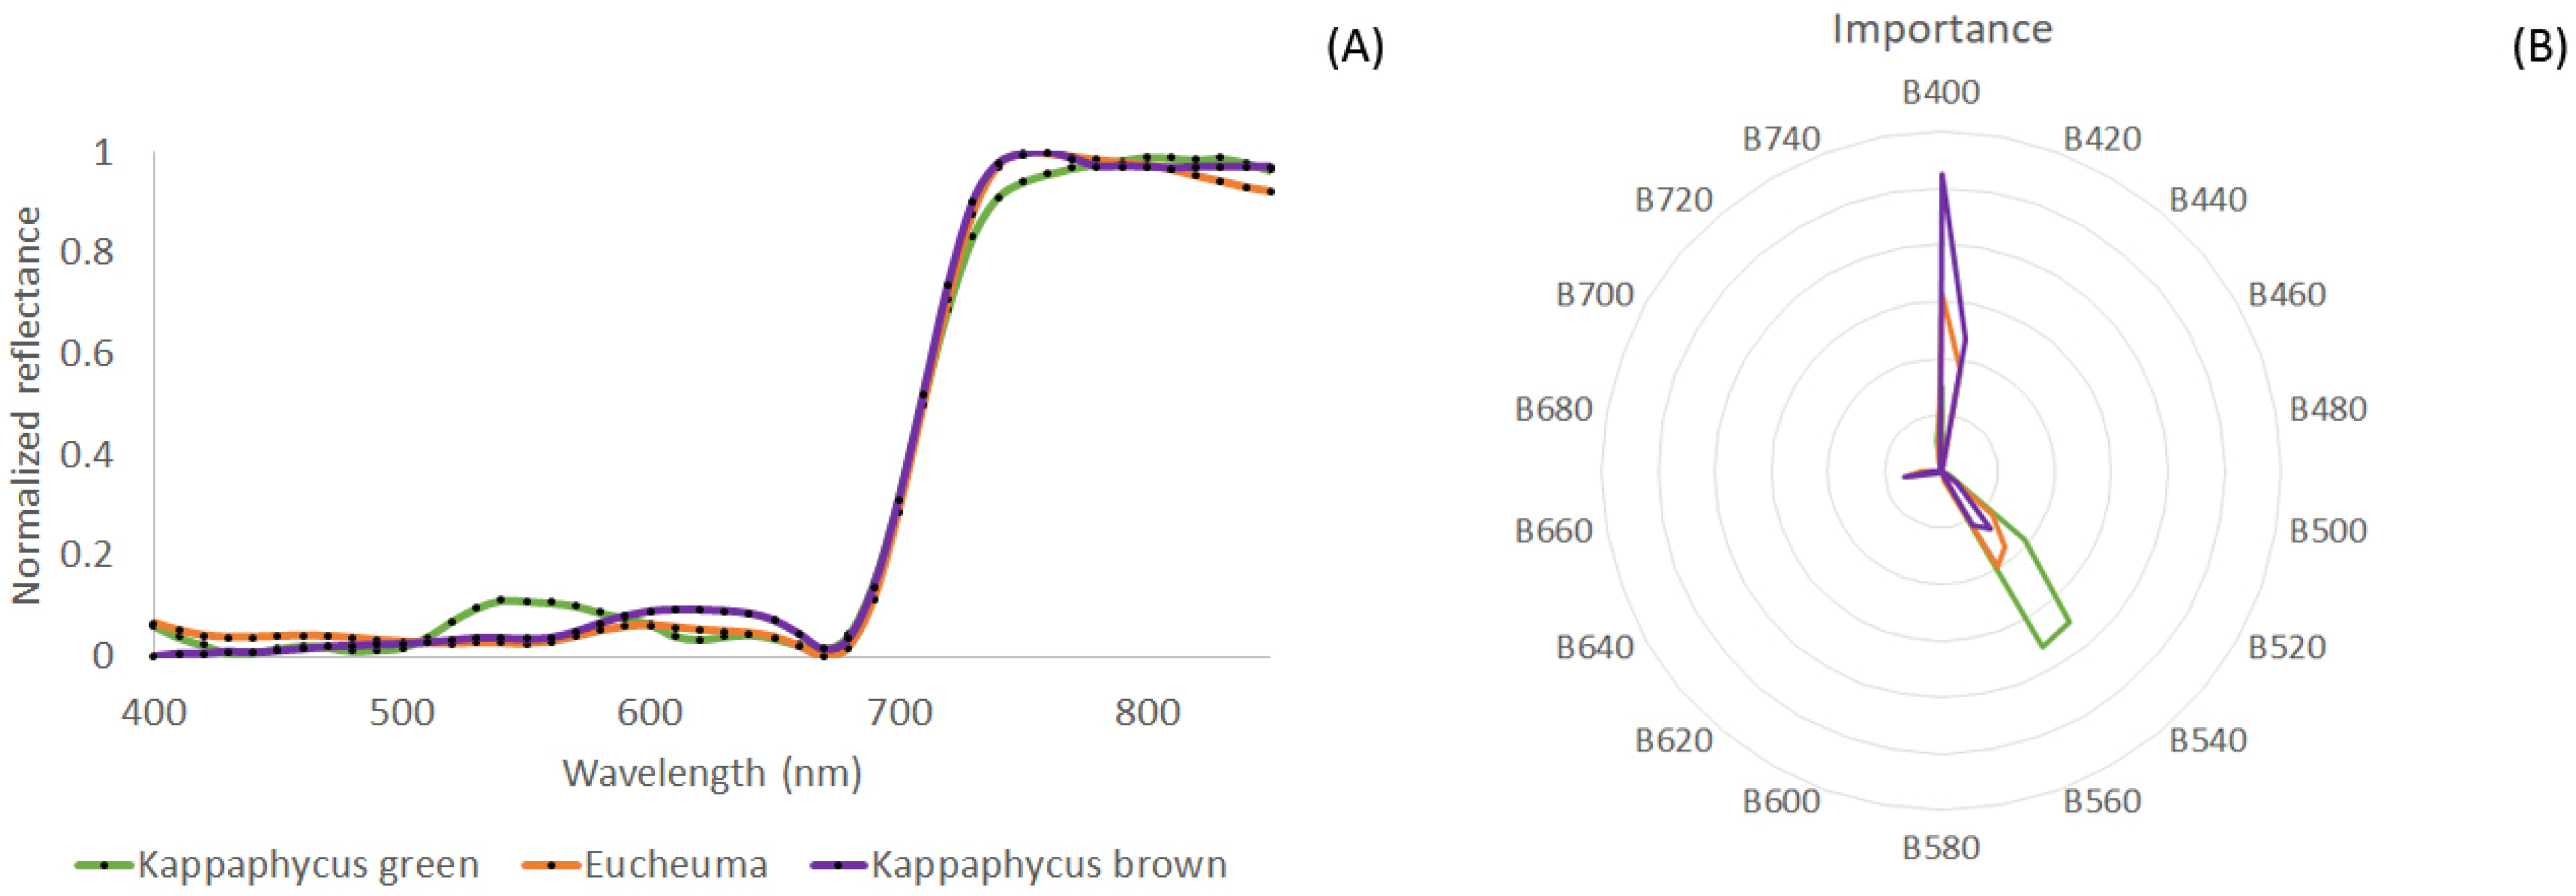
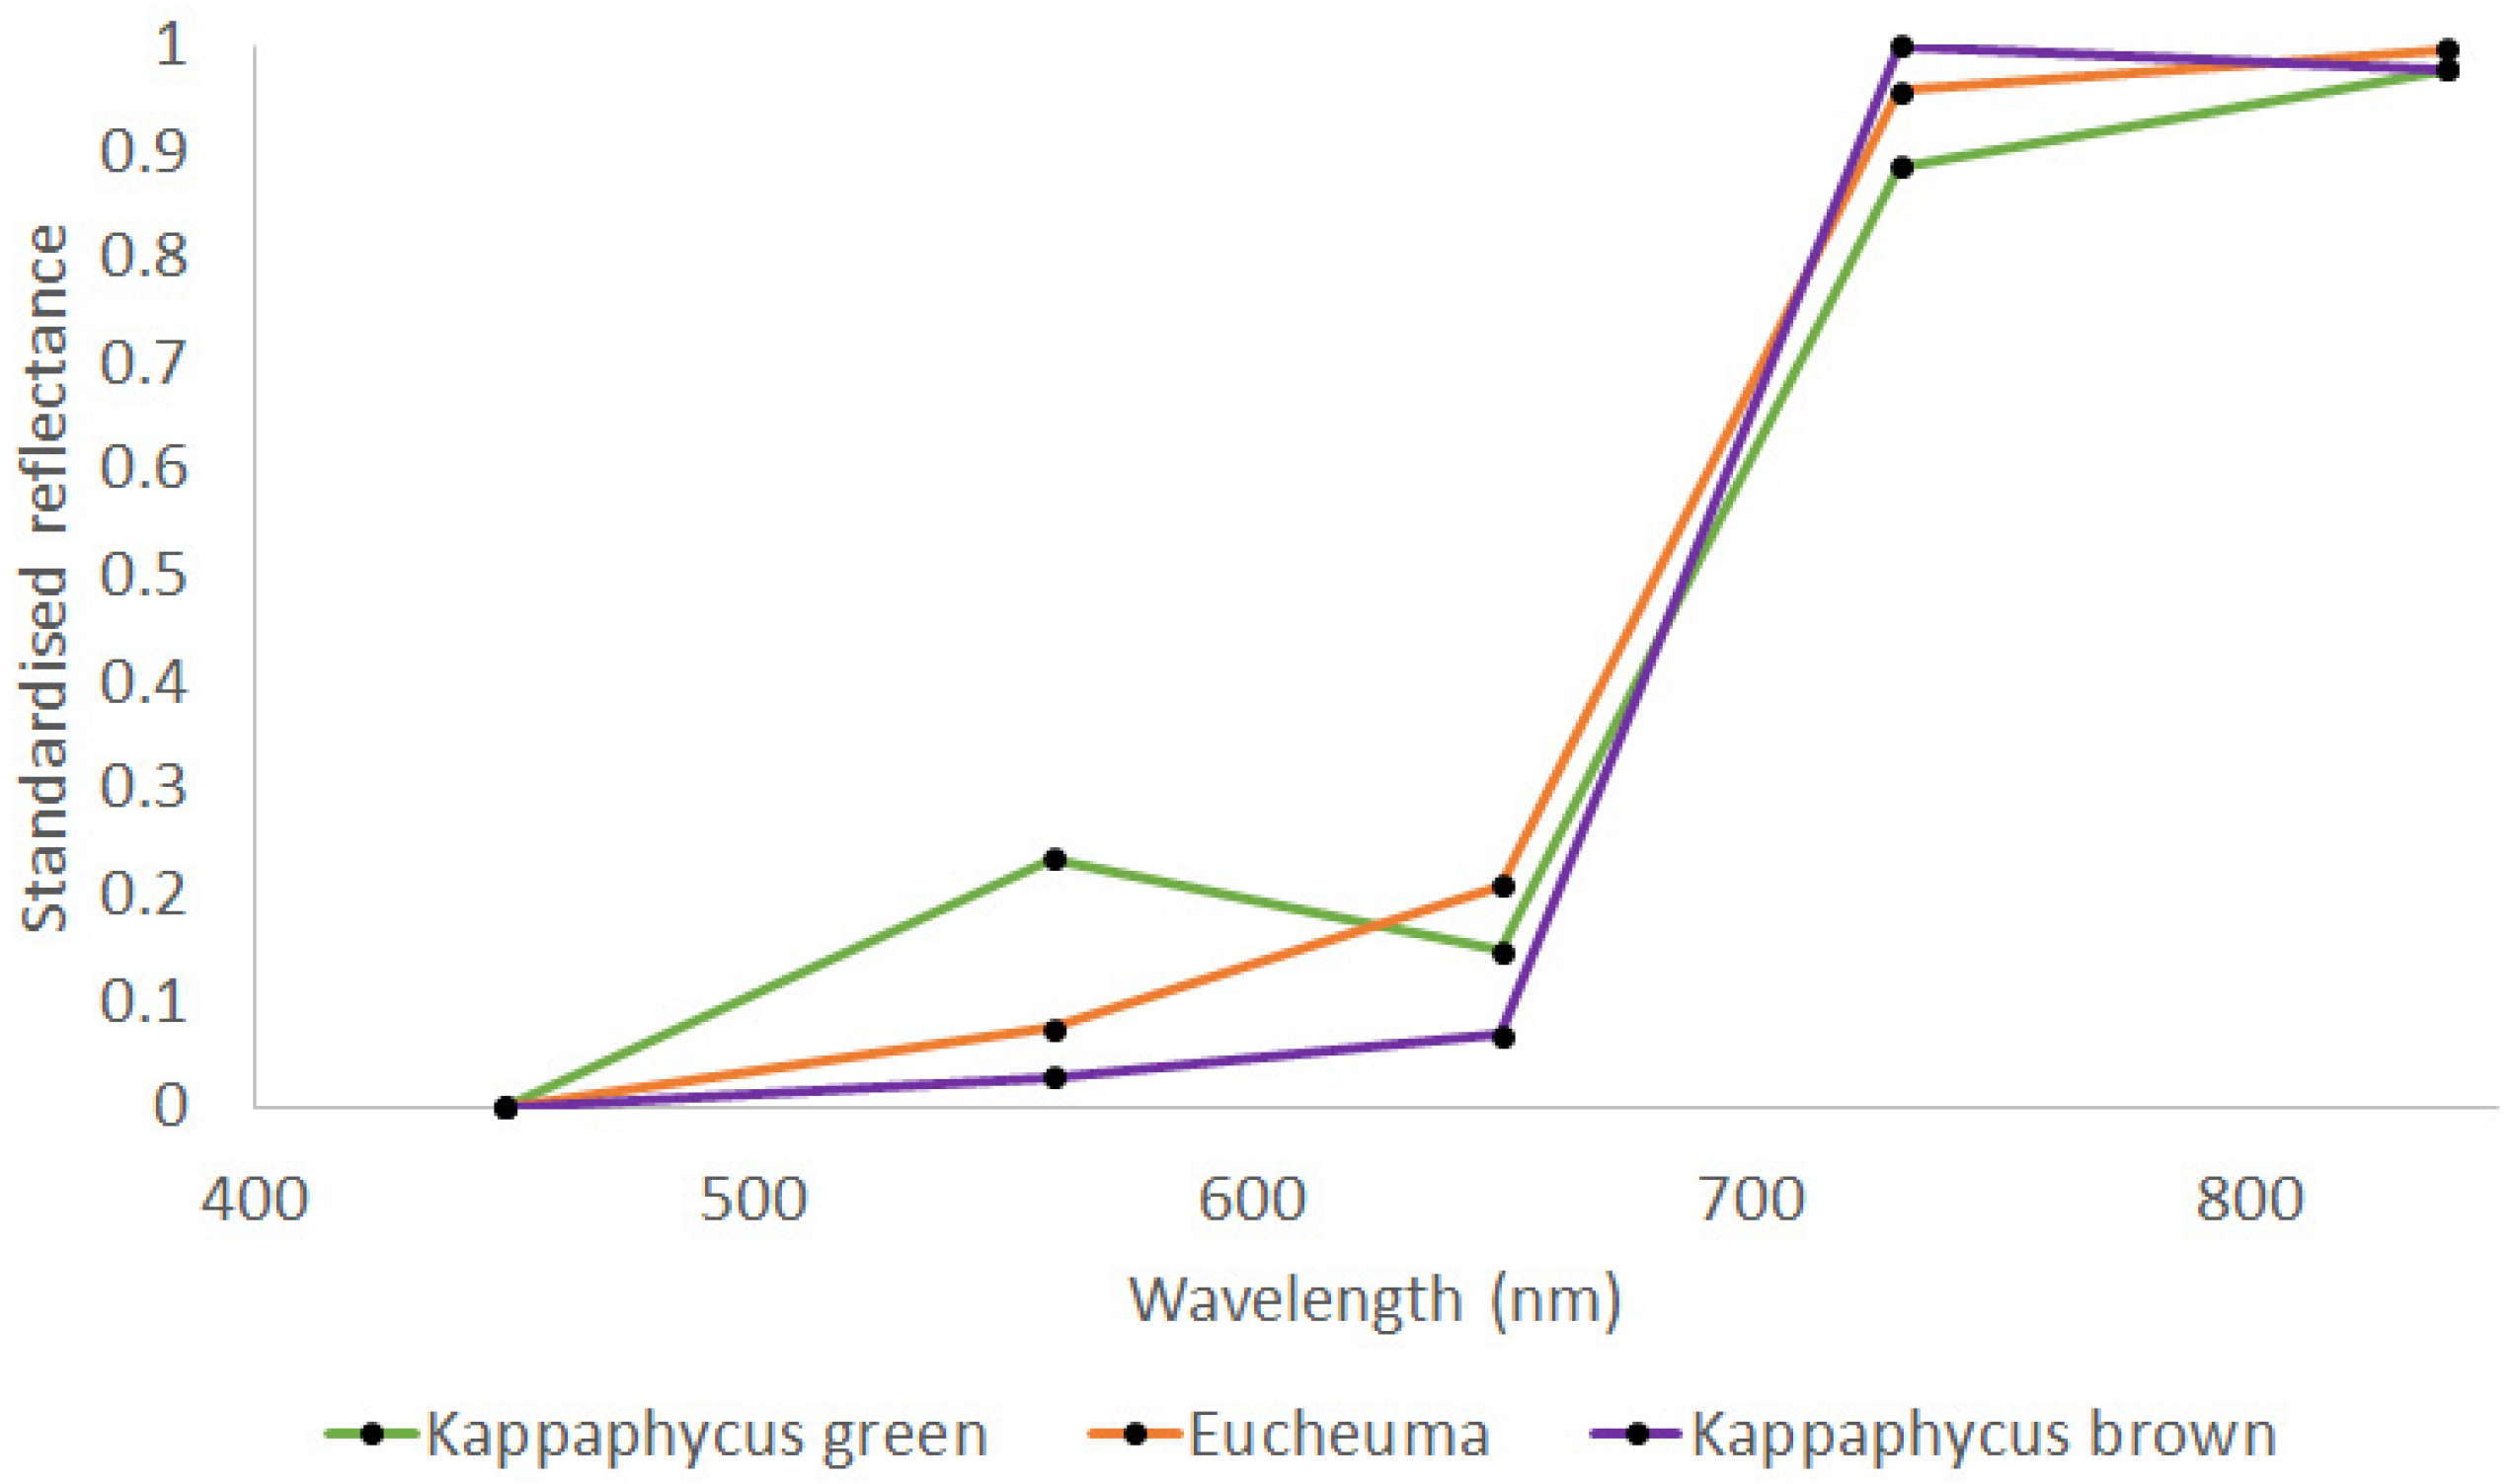
3.1. Spectral Library Classification

Classifications were applied to hyperspectral and multispectral data to discriminate healthy, silted and depigmented E. denticulatum and K. alvareezi samples (Figure 3 and Figure 4). In addition, a classification was examined to differentiate silted from depigmented Eucheuma samples (Figure 5). The same scenarios were examined using spectral indices (Figure 6, Figure 7, Figure 8 and Figure 9).

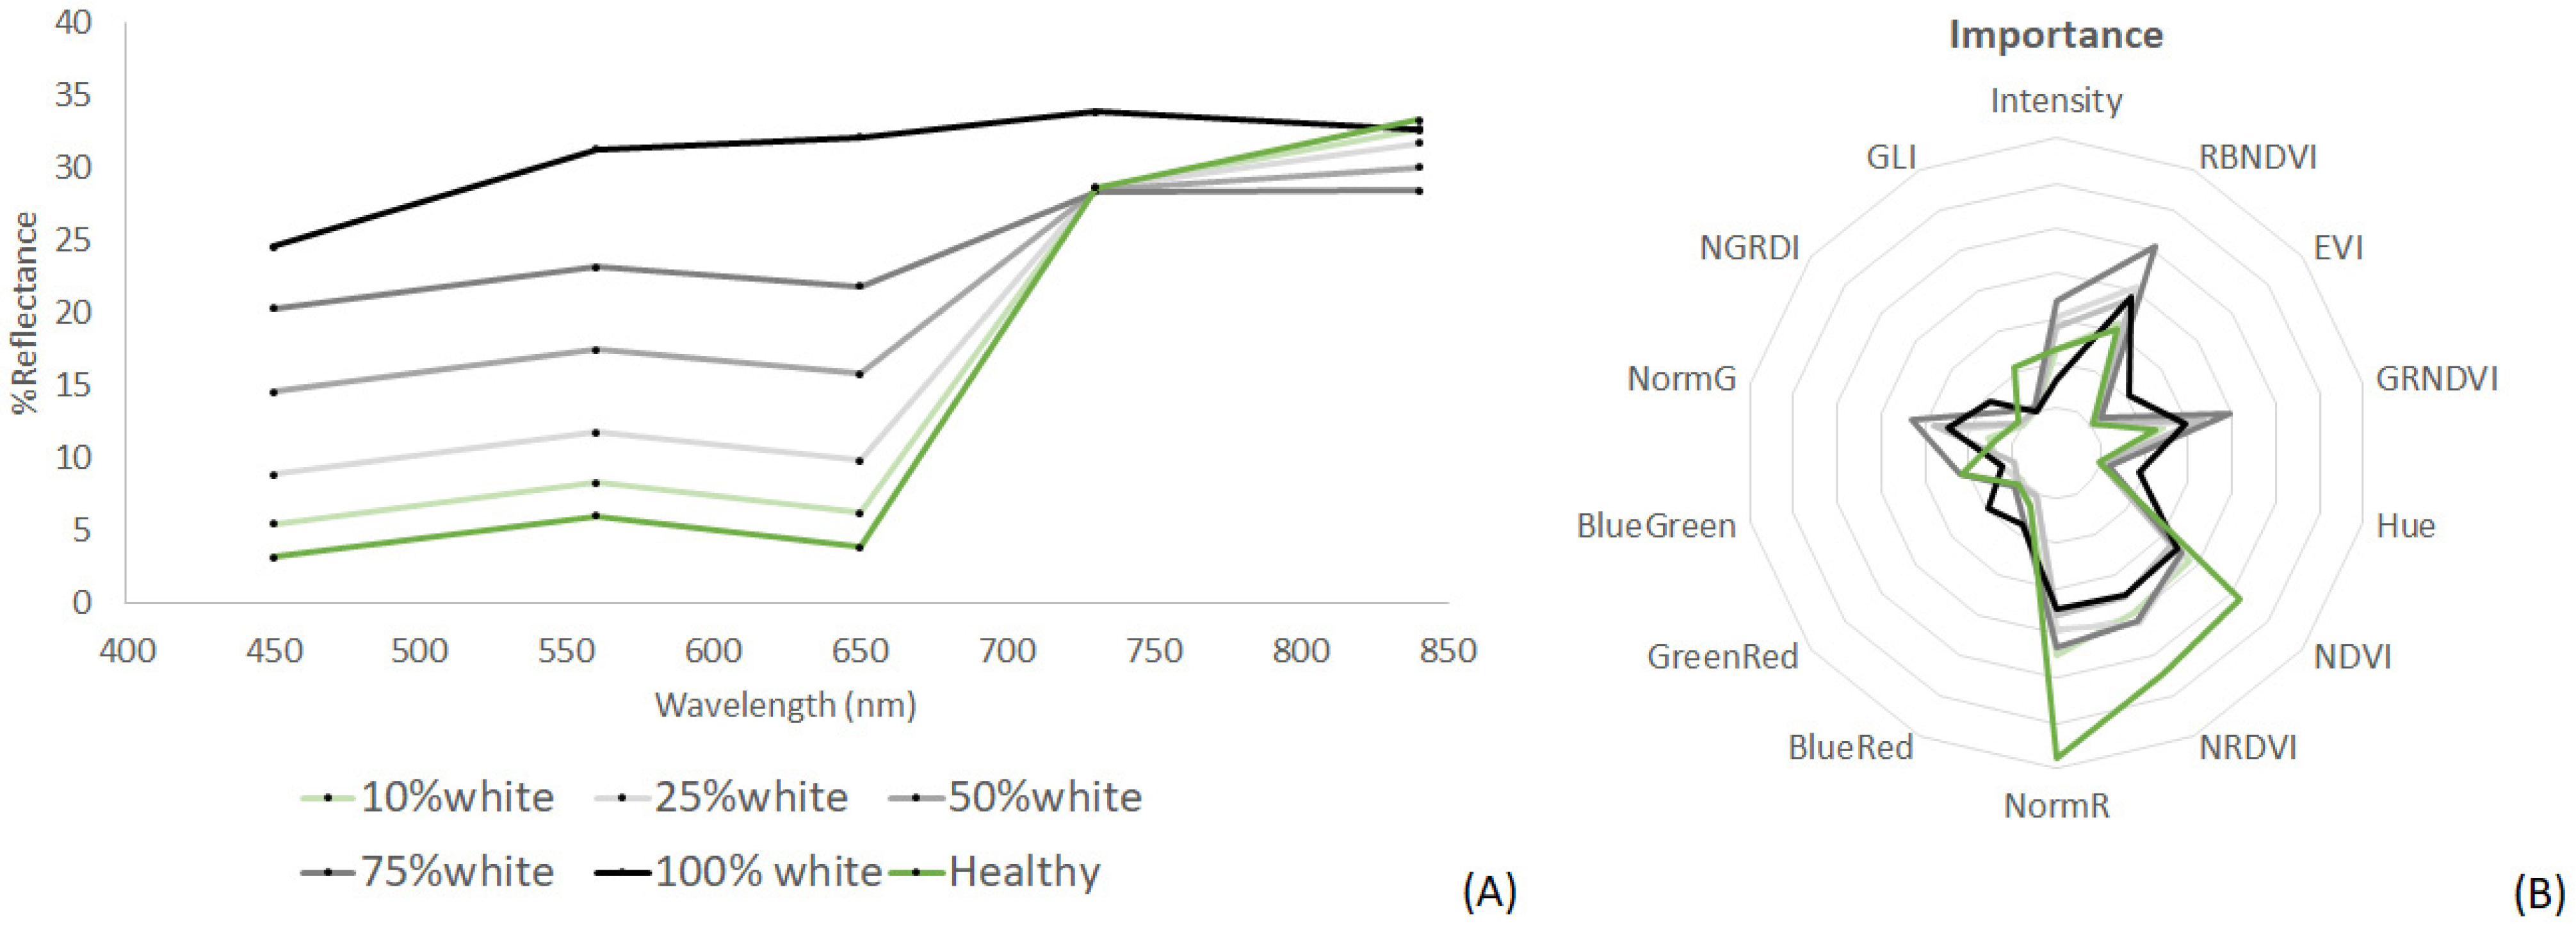
3.2. Hyperspectral Data

A gradient of E. denticulatum spectra was obtained, ranging from healthy thalli with no signs of whitening to those totally depigmented (Figure 3). A white thallus was characterised by a monotonous flat spectral shape in the VIS-NIR range and a higher albedo (Figure 3A). Wavelengths in the blue (400–440 nm), green (540–560 nm) and red (650–670 nm) parts of the visible spectrum showed the greatest importance in differentiating healthy, mixed and white Eucheuma thalli (Figure 3B). In particular, green and red wavelengths were associated with discriminating healthy Eucheuma, while blue and red wavelengths were more important for classifying intermediate stages of depigmentation.
According to the confusion matrix shown in Table A1 (Appendix A), the overall accuracy for classifying the crop condition of Eucheuma samples with in situ hyperspectral data was high (83.2%). However, the 10% White and 100% White classes showed the lowest Producer Accuracy (PA) scores. This occurred because the 10% White class was misclassified as healthy, and the 100% White class was not always discerned from intermediate whitening stages.
Regarding the discrimination of Kappaphycus thallus discolouration, wavelengths in the blue region (400–490 nm) had the greatest importance scores (Figure 4A). From 440 to 480 nm, these wavelengths were useful to identify healthy thalli. Shorter blue (400 to 420 nm) and red (660–680 nm) wavelengths can be used for separating intermediate whitening stages. The overall accuracy of Kappaphycus thallus whitening classification was very high (95.9%), with a small fraction of misclassifications only occurring between the healthy and the 10% White classes, and the100%White class (Table A2, Appendix A).
The spectral signature of a discoloured white thallus showed a higher albedo than a thallus covered with a fine layer of silt particles (Figure 5A). The silted thallus had a flat spectrum, but the spectral shape of the red edge between the VIS and the NIR regions was still visible. This was consistent with the identification of the wavelengths of importance to discriminate depigmented from silted E. denticulatum thallus: 700–740 nm in the red edge region and 640–690 nm at red wavelengths (Figure 5B). The overall classification accuracy between the two classes was 86.1% (Table A4, Appendix A).

3.3. Multispectral Data

When classifying the thallus condition of E. denticulatum at a multispectral resolution (Figure 6A), the greatest misclassifications occurred for the 100% White and the 10% White classes, while the overall accuracy was 85.1% (Table A5, Appendix A). When the spectral indices were applied, the overall classification accuracy was greatly improved (99%), and misclassifications were drastically minimized (Table A6, Appendix A). The most important spectral indices for classifying the thallus discolouration of E. denticulatum were the GLI, the NormGreen, the RBNDVI and the GRNDVI (Figure 6B).
In classifying the crop condition of Kappaphycus at a multispectral resolution (Figure 7A), the overall accuracy was 96% with minor misclassification (Table A7, Appendix A). The overall accuracy when using the vegetation indices was 98.9%, and each class had an optimal accuracy (Table A8, Appendix A). The indices of greatest importance were the NormRed, the NRDVI, the NDVI, the GRNDVI, the RBNDVI and the NormGreen (Figure 7B).
The differentiation of E. denticulatum from K. alvareezi morphotypes at a multispectral resolution (Figure 8) showed an overall accuracy of 86.2% (Table A9, Appendix A). The slightly lower performance in separating K. alvareezi morphotypes (Table A9, Appendix A) is due to internal variability of the samples, meaning that some green morphotypes had similar responses with the brown morphotypes, leading to overestimation of the green morphotype (PA = 100%, UA = 83.3%).
The reflectance spectra of depigmented and silted Eucheuma at a degraded multispectral resolution kept contrasting spectral shapes despite the loss of spectral resolution (Figure 9A). The classification of the two classes showed an overall accuracy of 86.1%. When applying the spectral indices, the overall accuracy increased to 94.4% (Table A11, Appendix A). The most important indices for separating silted from depigmented Eucheuma were the RBNDVI, the Hue, the Green-to-Red ratio and the NGRDI (Figure 9B).

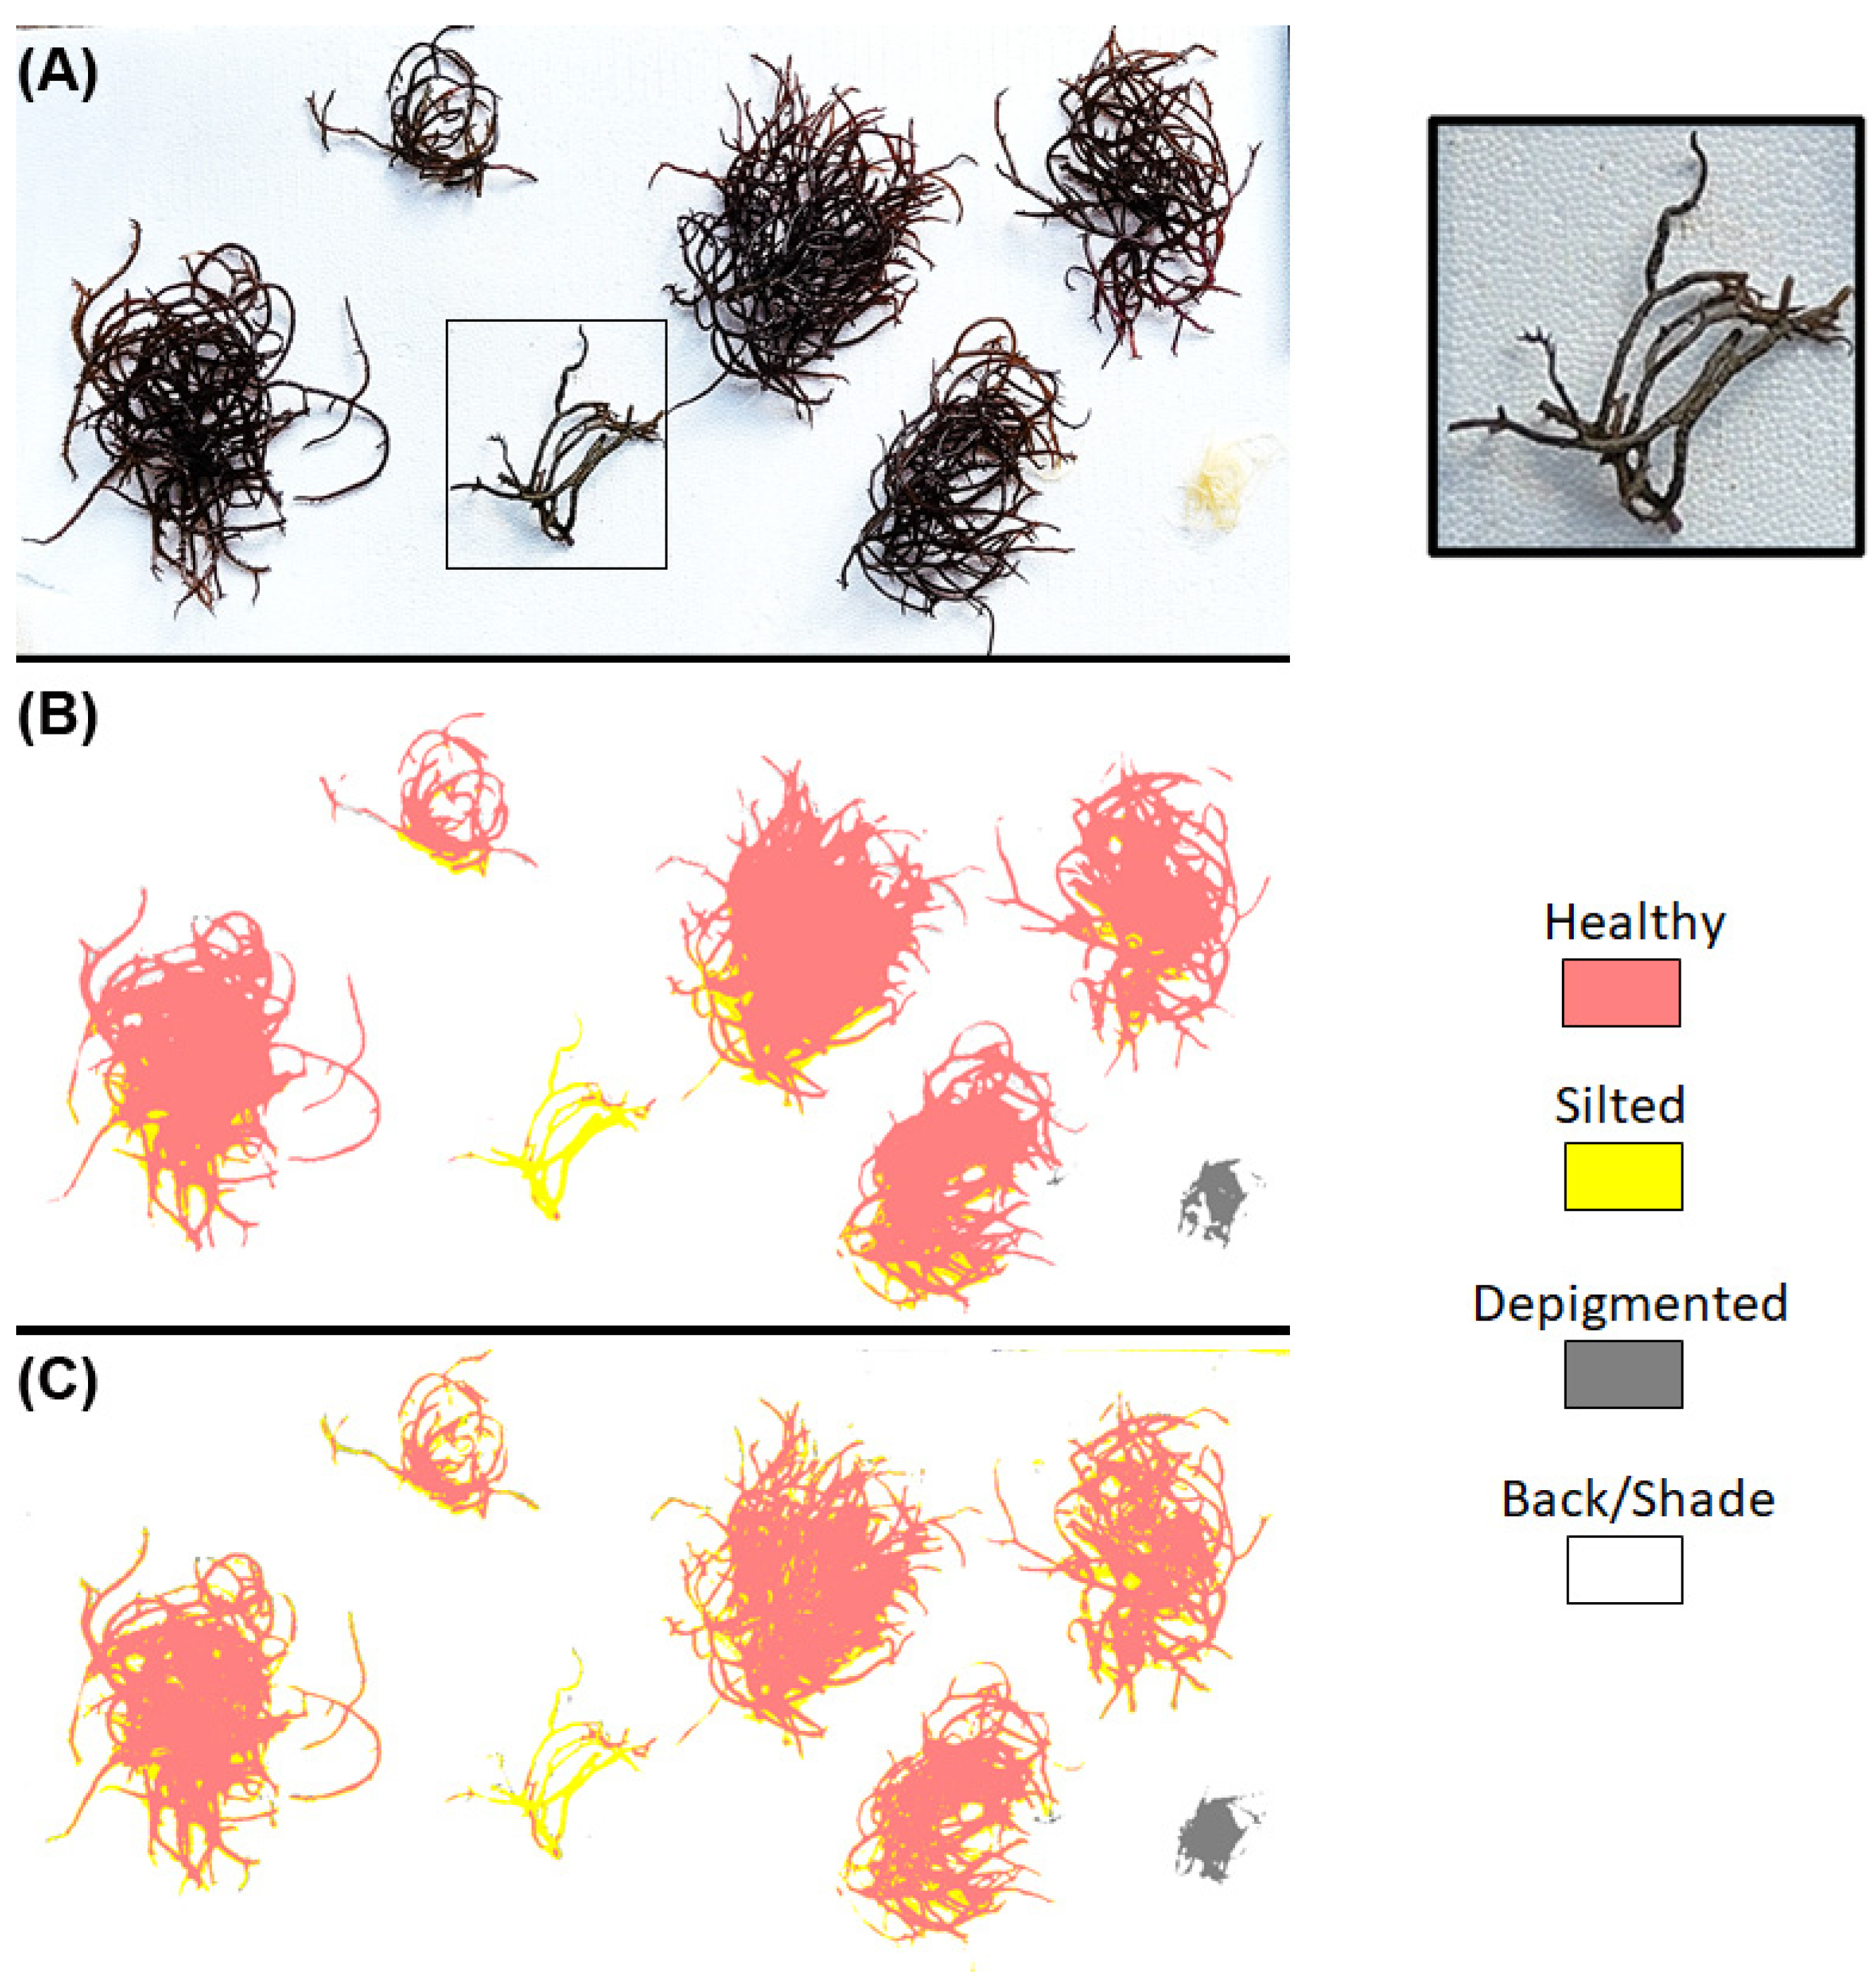
3.4. Image-Based Classification

The scenario of differentiating healthy, silted and depigmented Eucheuma thallus was further tested by applying classifications to a multispectral image collected with the drone, hand-held at a 1.5 m distance from the ground (Figure 10). When the five multispectral bands were used, the overall accuracy was 91% with silted thalli being misclassified as healthy more often (Table A12, Appendix A). When the spectral indices (RBNDVI, Hue, Green-to-Red ratio, NGRDI) identified in the previous experiment were used (Figure 9A), the overall accuracy improved significantly (97.9%) and each class achieved maximum accuracy (Table A13, Appendix A).

4. Discussion

This study demonstrated that in situ proximal spectroscopy in the visible and near-infrared regions could effectively differentiate crop conditions for two species of Eucheumatoid seaweeds, E. denticulatum and K. alvareezi, cultivated worldwide. Specific wavelengths proved more effective than others in distinguishing between species and morphotypes and characterizing thallus discolouration. The reduction in spectral resolution from the 42 bands of a spectroradiometer to the five bands of a multispectral sensor was not the primary limitation. Additionally, using specific vegetation indices significantly improved the machine learning classifications in some cases.

4.1. Species Discrimination

The colour of seaweed is determined by its pigment composition, which absorbs light within the visible wavelength range (400 to 700 nm). The different taxonomic classes, Chlorophyceae (green seaweed), Phaeophyceae (brown seaweed) and Rhodophyceae (red seaweed), can be discriminated by their spectral reflectance [31]. At a hyperspectral resolution, it is possible to achieve discrimination at the taxonomic species level [28,30]. In the near-infrared region (700 to 900 nm), light is reflected by the tissue structure, similar to what is observed in angiosperms [31,46]. The genera Eucheuma sp. and Kappaphycus sp. belong to the class Rhodophyceae. They all contain chlorophyll a and the characteristic pigments of this class: phycoerythrin, phycocyanin and allophycocyanin. K. alvarezii exhibits numerous colour morphotypes [47] including a green morphotype characterized by a lower concentration of phycoerythrin [48]. Different species and morphotypes are often cultivated in the same area, making it crucial to identify the spatial distribution of each one. Using hyperspectral resolution, E. denticulatum and the two morphotypes of Kappaphycus were effectively distinguished. Notably, the blue (400 nm) and green (550 nm) wavelengths were particularly important for differentiating the green from the brown Kappaphycus morphotypes. In contrast, the blue wavelength was more critical for separating E. denticulatum from the brown Kappaphycus. The green morphotype’s spectral signature resembles green angiosperm spectra [31], reflecting more light in the 500–600 nm green region. These wavelengths were more important for separating E. denticulatum from the green Kappaphycus. Similarly, [26] reported that green and brown macroalgae taxa (from temperate areas) exhibited the greatest separability in the visible range, around the 600 nm wavelength. When multispectral data were used for classification, the overall accuracy decreased, with the brown Kappaphycus showing the lowest accuracy (PA = 75%, UA = 82.2%). This is likely due to the following reasons: (a) the small number of representative training samples (n = 20) for the brown strain, (b) the loss of characteristic shape details at the multispectral resolution, and (c) the spectral similarity with part of the green strains in the NIR area. Therefore, further and more detailed experiments are required for evaluating the discrimination of green from brown Kappaphycus strains using a multispectral sensor.

4.2. Detecting and Quantifying Thallus Depigmentation

Ice-ice disease (IID) is a major cause of depigmentation in Eucheumatoids [47]. This disease primarily occurs due to changes in environmental factors, such as water temperature and salinity, which induce stress and promote the development of pathogens [13,14,15]. The most prominent symptom of IID is the loss of pigments, which can lead to the gradual whitening of the tissues. This typically occurs during prolonged stress (lasting several days) and can affect the entire cultivation area. Therefore, it is a critical indicator of crop condition in seaweed aquaculture [12,15]. With increasing thallus whitening, the reflectance in the VIS range increases progressively, leading to an almost monotonous flat response across the VIS-NIR range (Figure 2 and Figure 3). When the thallus is totally depigmented, there are no more absorption features in the VIS region. The spectral detection of whitening was possible even when a small fraction of the thallus was white (i.e., 10%), but better results were obtained for at least 50%. This was the case for both the hyperspectral and the multispectral resolution. The classification accuracy did not decrease significantly when multispectral data were used. This indicates that utilising five spectral bands across the VIS-NIR range is adequate for characterizing thallus whitening. Based on the importance scores derived from classifications using both hyper- and multispectral data, wavelengths predominantly within the blue spectrum (400–480 nm), followed by those in the red range (640–680 nm), were the most suitable for detecting whitening. The detection was the most efficient with the green morphotype of Kappaphycus. For E. denticulatum, the classification accuracy was improved when using vegetation indices (see Section 4.3).

4.3. Discriminating Thallus Covered by Silt Particles

Cultivation sites near estuaries are characterised by high concentrations of suspended particulate matter that can negatively impact seaweed growth [12]. Fine inorganic particles can accumulate on the seaweed thalli, forming a thin, whitish layer. Farmers regularly shake the lines in these areas to remove the deposited silt particles [49]. As a result of silting, the spectral characteristics of E. denticulatum and K. alvareezi are altered and tend to resemble the spectrum of silt, which is characterized by a flat, monotonous reflectance across the VIS-NIR ranges. Discerning thallus whitening caused by depigmentation from silt deposition is important to avoid misidentification of the causal processes. However, these two processes can be related, as silted crops may develop IID and become depigmented if not treated properly [15]. The primary challenge in distinguishing depigmented from silted thalli lies in the similarity of their spectral shapes, which lack distinct features. Importance scores indicated that red and red edge wavelengths were more effective for differentiating the two cases at a hyperspectral resolution. Thalli covered by silt particles retain a slight red edge spectral shape, which no longer exists with depigmented thalli. The same applies when using multispectral resolution, as classification accuracy remained consistent, indicating that a multispectral sensor can effectively discriminate between silted and depigmented thalli. The use of vegetation indices significantly enhanced the classification accuracy. The following indices were the most suitable: (a) the Hue, (b) the Green–Red ratio, (c) the NGRDI and (d) the RBNDVI. Previous studies employed various indices for detecting and quantifying seaweed in situ [41,50]. In particular, [24] used the NDVI and NGRDI indices to distinguish between fresh and recently stranded Sargassum sp. Most of the indices identified in this study are based on wavelengths in the VIS (only the RBNDVI uses the red edge). This spectral range is better suited for mapping emerged or partially submerged/floating seaweed [26,51] owing to the significant attenuation of NIR wavelengths by water.

4.4. Spectral Constraints

The spectral library used for classifications considers ideal cases of spectral shapes without interference from environmental effects. Such effects include water layer effects, background albedo and challenging illumination [51]. In particular, the results from this study are valid for emerging macroalgae, i.e., when spectral sampling occurs in the air. Eucheumatoids can be exposed at low tide but are often submerged in the sub-surface when cultivated. The spectral shape can be significantly influenced by water depth and constituents, particularly in the NIR range [51,52]. Therefore, specific radiometric corrections are necessary for accurately detecting and quantifying crop conditions in submerged situations [26,51,53]. The background albedo poses another challenge in accurately characterising macroalgae. Nearby objects surrounding the specimens under examination will likely affect the classification results if they exhibit a similar spectral response. This problem commonly arises when seaweeds are cultivated alongside other algae or seagrasses on the seabed. Illumination is another crucial factor in characterising seaweed with spectral data. Poor illumination means that low reflectance samples (e.g., brown Kappaphycus or silted macroalgae) may be incorrectly identified. Over-illumination is the opposite problem, where high-intensity responses interfere with the spectral shapes. This typically occurs in aerial imaging when the sun glint from the water surface contaminates the image [51,52]. Despite these constraints, the spectral approach proposed in this study should be tested at the scale of cultivation plots using hyper- or multispectral drones at a very high spatial resolution [9].

4.5. Drone Crop Condition Monitoring

This work shows the potential of spectral reflectance for the seaweed aquaculture sector by providing a tool for crop condition assessment that could be automated to improve yield and strengthen biosecurity [18]. Early and accurate detection of thallus whitening signs due to depigmentation or silting would lead to timely decision making that minimizes the cost and risk of further crop loss [15,18]. A potential upscaling of the presented approach would be using drones to map farming areas. At low flight altitudes of approximately 20 to 30 m, drone imagery can capture fine-scale details of seaweeds attached to long lines [9]. Drone surveys offer centimetre-resolution imagery that can be conducted on-demand and is unaffected by cloud cover. However, drone applications should focus on farming areas with adequate water clarity and where the background bottom has a distinctively different albedo from the cultivated seaweed to avoid misclassifications [26,53]. A multispectral, drone-based sensor could potentially identify E. denticulatum and K. alvareezi morphotypes along large-scale cultivation areas, providing complementary information to satellite remote sensing in describing aquaculture practices [4]. Co-cultivation of the two species happens, supposedly minimising the risk for IID [14]. E. denticulatum is a less valuable species than K. alvareezi [8] but was reported to be less susceptible to ice-ice disease [15]. The most important perspective of drone remote sensing would be to detect early signs of thallus depigmentation, providing an early warning for potential ice-ice outbreaks.

5. Conclusions

This study underscores the significance of specific wavelengths in spectrally identifying seaweed species, morphotypes and crop conditions in Eucheumatoids’ aquaculture. Additionally, combining these wavelengths, vegetation indices effectively enhanced crop condition characterisation. These indices can be constructed using hyper- or multispectral data, providing a viable alternative when spectral discrimination is challenging. It is suggested that particular spectral indices combing visible wavelengths can be utilised to develop seaweed health indices. These indices proved effective not only in distinguishing between E. denticulatum, and green and brown morphotypes of K. alvareezi but also in detecting thalli depigmentation while avoiding confusion with silted specimens. Proximal spectral imaging enables effective monitoring of seaweed crops, providing timely information about crop health. Thus, spectral data are considered an integral part of the precision aquaculture of seaweeds, and further trials using drone platforms are recommended.

Supplementary Materials

The following supporting information can be downloaded at: https://www.mdpi.com/article/10.3390/rs16183502/s1. Figure S1: Mean spectrum of healthy Eucheuma denticulatum samples (n = 43, continuous line) and ±1SD boundaries (shaded area), Figure S2: Mean spectrum of healthy, green morphotype of Kappaphycus alvareezi samples (n = 43, continuous line) and ±1SD boundaries (shaded area), Figure S3: Mean spectrum of healthy, brown morphotype of Kappaphycus alvareezi samples (n = 40, continuous line) and ±1SD boundaries (shaded area), Figure S4: Mean spectrum of silted Eucheuma denticulatum samples (n = 45, continuous line) and ±1SD boundaries (shaded area), Figure S5: Mean spectrum of depigmented Eucheuma denticulatum samples (n = 27, continuous line) and ±1SD boundaries (shaded area).

Author Contributions

Conceptualization, E.A. and L.B.; data curation, E.A., N.N., A.A. and L.B.; formal analysis, E.A.; funding acquisition, N.N. and L.B.; investigation, E.A. and A.A.; methodology, E.A., A.A. and L.B.; project administration, N.N. and L.B.; resources, N.N., A.A. and L.B.; software, E.A. and A.A.; supervision, L.B.; validation, E.A. and L.B.; visualization, N.N. and L.B.; writing—original draft, E.A.; writing—review and editing, E.A., N.N., A.A. and L.B. All authors have read and agreed to the published version of the manuscript.

Funding

This work was partially supported by the “PHC NUSANTARA” program (project number: 47060PG), funded by the French Ministry for Europe and Foreign Affairs, the French Ministry for Higher Education and Research and the Ministry of Education and Culture, Riset and Technology of Indonesia (partner).

Data Availability Statement

The raw data supporting the conclusions of this article will be made available by the authors on request.

Conflicts of Interest

The authors declare no conflicts of interest.

Appendix A

Table A1. Confusion matrix for the classification results regarding the crop condition of Eucheuma using HS data. Overall accuracy in bold. UA = User Accuracy; PA = Producer Accuracy.
PREDICTION
Healthy10% White25% White50% White75% White100% White PA%
OBSERVATIONHealthy151100088.2
10% White613100065
25% White011410087.5
50% White0001900100
75% White0000160100
100% White00213753.8
UA%71.486.777.890.584.210083.2
Table A2. Confusion matrix for the classification results regarding the crop condition of Kappaphycus using HS data. Overall accuracy in bold. UA = User Accuracy; PA = Producer Accuracy.
PREDICTION
OBSERVATION Healthy10% White25% White50% White75% White100% White PA%
Healthy1700000100
10% White218000090
25% White0016000100
50% White0001900100
75% White0000160100
100% White11000981.8
UA%8594.710010010010095.9
Table A3. Confusion matrix for the classification results regarding the differentiation between Eucheuma from Kappaphycus strains (green and brown) using HS data. Overall accuracy in bold. UA = User Accuracy; PA = Producer Accuracy.
PREDICTION
Kappaphycus greenEucheumaKappaphycus brownPA%
OBSERVATIONKappaphycus green170194
Eucheuma0170100
Kappaphycus brown0016100
UA%10010094.1
Table A4. Confusion matrix for the classification results regarding the differentiation of 100% White and silted Eucheuma using HS data. Overall accuracy in bold. UA = User Accuracy; PA = Producer Accuracy.
OBSERVATIONPREDICTION
100% WhiteSiltedPA%
100% White10376.9
Silted22191.3
UA%83.387.586.1
Table A5. Confusion matrix for the classification results regarding the crop condition of Eucheuma using MS data. Overall accuracy in bold. UA = User Accuracy; PA = Producer Accuracy.
OBSERVATIONPREDICTION
Healthy10% White25% White50% White75% White100% WhitePA%
Healthy151100088.2
10% White612200060
25% White021310081.3
50% White0001900100
75% White0000160100
100% White002001184.6
UA%71.48072.29510010085.1
Table A6. Confusion matrix for the classification results regarding the crop condition of Eucheuma using spectral indices. Overall accuracy in bold. UA = User Accuracy; PA = Producer Accuracy.
PREDICTION
Healthy10% White25% White50% White75% White100% WhitePA%
OBSERVATIONHealthy161000094.1
10% White0200000100
25% White0016000100
50% White0001900100
75% White0000160100
100% White0000013100
UA%10095.210010010010099.0
Table A7. Confusion matrix for the classification results regarding the crop condition of Kappaphycus using MS data. Overall accuracy in bold. UA = User Accuracy; PA = Producer Accuracy.
PREDICTION
OBSERVATION Healthy10% White25% White50% White75% White100% WhitePA%
Healthy1700000100
10% White218000090
25% White0016000100
50% White0001900100
75% White0000160100
100% White11000981.8
UA%8594.710010010010096
Table A8. Confusion matrix for the classification results regarding the crop condition of Kappaphycus using spectral indices. Overall accuracy in bold. UA = User Accuracy; PA = Producer Accuracy.
PREDICTION
Healthy10% White25% White50% White75% White100% WhitePA%
OBSERVATIONHealthy161000094.1
10% White0200000100
25% White0016000100
50% White0001900100
75% White0000160100
100% White0000011100
UA%10095.210010010010098.9
Table A9. Confusion matrix for the classification results regarding the differentiation of Eucheuma from Kappaphycus strains (green and brown) using MS data. Overall accuracy in bold. UA = User Accuracy; PA = Producer Accuracy.
PREDICTION
Kappaphycus GreenEucheumaKappaphycus BrownPA%
OBSERVATIONKappaphycus green2000100
Eucheuma115283
Kappaphycus brown321575
UA%83.388.288.286.2
Table A10. Confusion matrix for the classification results regarding the differentiation of silted from 100% White Eucheuma using MS bands. Overall accuracy in bold. UA = User Accuracy; PA = Producer Accuracy.
PREDICTION
100% WhiteSiltedPA%
OBSERVATION100% White10376.9
Silted22191.3
UA%83.387.586.1
Table A11. Confusion matrix for the classification results regarding the differentiation of silted from 100% White Eucheuma using spectral indices. Overall accuracy in bold. UA = User Accuracy; PA = Producer Accuracy.
PREDICTION
100% WhiteSiltedPA%
OBSERVATION100% White130100
Silted22191.3
UA%86.710094.4
Table A12. Confusion matrix for the classification results regarding the crop condition of Eucheuma using MS photomosaics. Overall accuracy in bold. UA = User Accuracy; PA = Producer Accuracy.
PREDICTIONS
HealthySilted100% WhiteBackShadePA%
OBSERVATIONSHealthy29000293.5
Silted61100064.7
100% White00110191.7
Back000110100
Shade000029100
UA%82.810010010090.691
Table A13. Confusion matrix for the classification results regarding the crop condition of Eucheuma using spectral indices photomosaics. Overall accuracy in bold. UA = User Accuracy; PA = Producer Accuracy.
PREDICTIONS
HealthySilted100% WhiteBackShadePA%
OBSERVATIONSHealthy27100193.1
Silted016000100
100% White001100100
Back000110100
Shade000031100
UA%10094.110010096.997.9

References

  1. Cai, J. Seaweeds and Microalgae: An Overview for Unlocking Their Potential in Global Aquaculture Development; FAO Fisheries and Aquaculture Circular; FAO: Rome, Italy, 2021; ISBN 978-92-5-134710-2. [Google Scholar]
  2. Campbell, R.; Hotchkiss, S. Carrageenan Industry Market Overview. In Tropical Seaweed Farming Trends, Problems and Opportunities: Focus on Kappaphycus and Eucheuma of Commerce; Hurtado, A.Q., Critchley, A.T., Neish, I.C., Eds.; Developments in Applied Phycology; Springer International Publishing: Cham, Switzerland, 2017; pp. 193–205. ISBN 978-3-319-63498-2. [Google Scholar]
  3. Bell, T.W.; Nidzieko, N.J.; Siegel, D.A.; Miller, R.J.; Cavanaugh, K.C.; Nelson, N.B.; Reed, D.C.; Fedorov, D.; Moran, C.; Snyder, J.N.; et al. The Utility of Satellites and Autonomous Remote Sensing Platforms for Monitoring Offshore Aquaculture Farms: A Case Study for Canopy Forming Kelps. Front. Mar. Sci. 2020, 7, 520223. [Google Scholar] [CrossRef]
  4. Langford, A.; Waldron, S.; Sulfahri; Saleh, H. Monitoring the COVID-19-Affected Indonesian Seaweed Industry Using Remote Sensing Data. Mar. Policy 2021, 127, 104431. [Google Scholar] [CrossRef]
  5. Meng, D.; Yang, X.; Wang, Z.; Liu, Y.; Zhang, J.; Liu, X.; Liu, B. Spatial Distribution and Differentiation Analysis of Coastal Aquaculture in China Based on Remote Sensing Monitoring. Remote Sens. 2024, 16, 1585. [Google Scholar] [CrossRef]
  6. Pratama, I.; Albasri, H. Mapping and Estimating Harvest Potential of Seaweed Culture Using Worldview-2 Satellite Images: A Case Study in Nusa Lembongan, Bali − Indonesia. Aquat. Living Resour. 2021, 34, 15. [Google Scholar] [CrossRef]
  7. Setyawidati, N.; Liabot, P.O.; Perrot, T.; Radiarta, N.; Deslandes, E.; Bourgougnon, N.; Rossi, N.; Stiger-Pouvreau, V. In Situ Variability of Carrageenan Content and Biomass in the Cultivated Red Macroalga Kappaphycus alvarezii with an Estimation of Its Carrageenan Stock at the Scale of the Malasoro Bay (Indonesia) Using Satellite Image Processing. J. Appl. Phycol. 2017, 29, 2307–2321. [Google Scholar] [CrossRef]
  8. Hurtado, A.Q.; Critchley, A.T.; Neish, I.C. (Eds.) Tropical Seaweed Farming Trends, Problems and Opportunities: Focus on Kappaphycus and Eucheuma of Commerce; Springer International Publishing: Cham, Switzerland, 2017; ISBN 978-3-319-63497-5. [Google Scholar]
  9. Nurdin, N.; Alevizos, E.; Syamsuddin, R.; Asis, H.; Zainuddin, E.N.; Aris, A.; Oiry, S.; Brunier, G.; Komatsu, T.; Barillé, L. Precision Aquaculture Drone Mapping of the Spatial Distribution of Kappaphycus alvarezii Biomass and Carrageenan. Remote Sens. 2023, 15, 3674. [Google Scholar] [CrossRef]
  10. Ubina, N.A.; Cheng, S.-C. A Review of Unmanned System Technologies with Its Application to Aquaculture Farm Monitoring and Management. Drones 2022, 6, 12. [Google Scholar] [CrossRef]
  11. Kumar, Y.N.; Poong, S.-W.; Gachon, C.; Brodie, J.; Sade, A.; Lim, P.-E. Impact of Elevated Temperature on the Physiological and Biochemical Responses of Kappaphycus alvarezii (Rhodophyta). PLoS ONE 2020, 15, e0239097. [Google Scholar] [CrossRef]
  12. Neish, I.C. Monograph No. HB2F 1008 V3 GAP; SEAPlant.net: Kuala Lumpur, Malaysia, 2008. [Google Scholar]
  13. Largo, D.B.; Chung, I.K.; Phang, S.-M.; Gerung, G.S.; Sondak, C.F.A. Impacts of Climate Change on Eucheuma-Kappaphycus Farming. In Tropical Seaweed Farming Trends, Problems and Opportunities: Focus on Kappaphycus and Eucheuma of Commerce; Hurtado, A.Q., Critchley, A.T., Neish, I.C., Eds.; Developments in Applied Phycology; Springer International Publishing: Cham, Switzerland, 2017; pp. 121–129. ISBN 978-3-319-63498-2. [Google Scholar]
  14. Pang, T.; Liu, J.; Liu, Q.; Li, H.; Li, J. Observations on Pests and Diseases Affecting a Eucheumatoid Farm in China. J. Appl. Phycol. 2015, 27, 1975–1984. [Google Scholar] [CrossRef]
  15. Ward, G.M.; Faisan Jr, J.P.; Cottier-Cook, E.J.; Gachon, C.; Hurtado, A.Q.; Lim, P.E.; Matoju, I.; Msuya, F.E.; Bass, D.; Brodie, J. A Review of Reported Seaweed Diseases and Pests in Aquaculture in Asia. J. World Aquac. Soc. 2020, 51, 815–828. [Google Scholar] [CrossRef]
  16. Hayashi, L.; Reis, R.P.; dos Santos, A.A.; Castelar, B.; Robledo, D.; de Vega, G.B.; Msuya, F.E.; Eswaran, K.; Yasir, S.M.; Ali, M.K.M.; et al. The Cultivation of Kappaphycus and Eucheuma in Tropical and Sub-Tropical Waters. In Tropical Seaweed Farming Trends, Problems and Opportunities: Focus on Kappaphycus and Eucheuma of Commerce; Hurtado, A.Q., Critchley, A.T., Neish, I.C., Eds.; Developments in Applied Phycology; Springer International Publishing: Cham, Switzerland, 2017; pp. 55–90. ISBN 978-3-319-63498-2. [Google Scholar]
  17. Loureiro, R.R.; Hurtado, A.Q.; Critchley, A.T. Impacts of AMPEP on Epiphytes and Diseases in Kappaphycus and Eucheuma Cultivation. In Tropical Seaweed Farming Trends, Problems and Opportunities: Focus on Kappaphycus and Eucheuma of Commerce; Hurtado, A.Q., Critchley, A.T., Neish, I.C., Eds.; Developments in Applied Phycology; Springer International Publishing: Cham, Switzerland, 2017; pp. 111–119. ISBN 978-3-319-63498-2. [Google Scholar]
  18. Kambey, C.S.B.; Campbell, I.; Sondak, C.F.A.; Nor, A.R.M.; Lim, P.E.; Cottier-Cook, E.J. An Analysis of the Current Status and Future of Biosecurity Frameworks for the Indonesian Seaweed Industry. J. Appl. Phycol. 2020, 32, 2147–2160. [Google Scholar] [CrossRef]
  19. Cottier-Cook, E.J.; Cabarubias, J.P.; Brakel, J.; Brodie, J.; Buschmann, A.H.; Campbell, I.; Critchley, A.T.; Hewitt, C.L.; Huang, J.; Hurtado, A.Q.; et al. A New Progressive Management Pathway for Improving Seaweed Biosecurity. Nat. Commun. 2022, 13, 7401. [Google Scholar] [CrossRef] [PubMed]
  20. Che, S.; Du, G.; Wang, N.; He, K.; Mo, Z.; Sun, B.; Chen, Y.; Cao, Y.; Wang, J.; Mao, Y. Biomass Estimation of Cultivated Red Algae Pyropia Using Unmanned Aerial Platform Based Multispectral Imaging. Plant Methods 2021, 17, 12. [Google Scholar] [CrossRef] [PubMed]
  21. Solvang, T.; Bale, E.S.; Broch, O.J.; Handå, A.; Alver, M.O. Automation Concepts for Industrial-Scale Production of Seaweed. Front. Mar. Sci. 2021, 8, 613093. [Google Scholar] [CrossRef]
  22. Xing, Q.; An, D.; Zheng, X.; Wei, Z.; Wang, X.; Li, L.; Tian, L.; Chen, J. Monitoring Seaweed Aquaculture in the Yellow Sea with Multiple Sensors for Managing the Disaster of Macroalgal Blooms. Remote Sens. Environ. 2019, 231, 111279. [Google Scholar] [CrossRef]
  23. Tait, L.; Bind, J.; Charan-Dixon, H.; Hawes, I.; Pirker, J.; Schiel, D. Unmanned Aerial Vehicles (UAVs) for Monitoring Macroalgal Biodiversity: Comparison of RGB and Multispectral Imaging Sensors for Biodiversity Assessments. Remote Sens. 2019, 11, 2332. [Google Scholar] [CrossRef]
  24. Fidai, Y.A.; Botelho Machado, C.; Dominguez Almela, V.; Oxenford, H.A.; Jayson-Quashigah, P.-N.; Tonon, T.; Dash, J. Innovative Spectral Characterisation of Beached Pelagic Sargassum towards Remote Estimation of Biochemical and Phenotypic Properties. Sci. Total Environ. 2024, 914, 169789. [Google Scholar] [CrossRef]
  25. Chandler, C.J.; Ávila-Mosqueda, S.V.; Salas-Acosta, E.R.; Magaña-Gallegos, E.; Mancera, E.E.; Reali, M.A.G.; de la Barreda-Bautista, B.; Boyd, D.S.; Metcalfe, S.E.; Sjogersten, S.; et al. Spectral Characteristics of Beached Sargassum in Response to Drying and Decay over Time. Remote Sens. 2023, 15, 4336. [Google Scholar] [CrossRef]
  26. Casal, G.; Kutser, T.; Domínguez-Gómez, J.A.; Sánchez-Carnero, N.; Freire, J. Assessment of the Hyperspectral Sensor CASI-2 for Macroalgal Discrimination on the Ría de Vigo Coast (NW Spain) Using Field Spectroscopy and Modelled Spectral Libraries. Cont. Shelf Res. 2013, 55, 129–140. [Google Scholar] [CrossRef]
  27. Chao Rodríguez, Y.; Domínguez Gómez, J.A.; Sánchez-Carnero, N.; Rodríguez-Pérez, D. A Comparison of Spectral Macroalgae Taxa Separability Methods Using an Extensive Spectral Library. Algal Res. 2017, 26, 463–473. [Google Scholar] [CrossRef]
  28. Douay, F.; Verpoorter, C.; Duong, G.; Spilmont, N.; Gevaert, F. New Hyperspectral Procedure to Discriminate Intertidal Macroalgae. Remote Sens. 2022, 14, 346. [Google Scholar] [CrossRef]
  29. Fuller, K.; Martin, R.E.; Asner, G.P. Spectral Signatures of Macroalgae on Hawaiian Reefs. Remote Sens. 2024, 16, 1140. [Google Scholar] [CrossRef]
  30. Olmedo-Masat, O.M.; Raffo, M.P.; Rodríguez-Pérez, D.; Arijón, M.; Sánchez-Carnero, N. How Far Can We Classify Macroalgae Remotely? An Example Using a New Spectral Library of Species from the South West Atlantic (Argentine Patagonia). Remote Sens. 2020, 12, 3870. [Google Scholar] [CrossRef]
  31. Davies, B.F.R.; Gernez, P.; Geraud, A.; Oiry, S.; Rosa, P.; Zoffoli, M.L.; Barillé, L. Multi- and Hyperspectral Classification of Soft-Bottom Intertidal Vegetation Using a Spectral Library for Coastal Biodiversity Remote Sensing. Remote Sens. Environ. 2023, 290, 113554. [Google Scholar] [CrossRef]
  32. Xue, J.; Su, B. Significant Remote Sensing Vegetation Indices: A Review of Developments and Applications. J. Sens. 2017, 2017, 1353691. [Google Scholar] [CrossRef]
  33. Belgiu, M.; Drăguţ, L. Random Forest in Remote Sensing: A Review of Applications and Future Directions. ISPRS J. Photogramm. Remote Sens. 2016, 114, 24–31. [Google Scholar] [CrossRef]
  34. Brunier, G.; Oiry, S.; Gruet, Y.; Dubois, S.F.; Barillé, L. Topographic Analysis of Intertidal Polychaete Reefs (Sabellaria alveolata) at a Very High Spatial Resolution. Remote Sens. 2022, 14, 307. [Google Scholar] [CrossRef]
  35. Oiry, S.; Barillé, L. Using Sentinel-2 Satellite Imagery to Develop Microphytobenthos-Based Water Quality Indices in Estuaries. Ecol. Indic. 2021, 121, 107184. [Google Scholar] [CrossRef]
  36. Stephens, D.; Diesing, M. A Comparison of Supervised Classification Methods for the Prediction of Substrate Type Using Multibeam Acoustic and Legacy Grain-Size Data. PLoS ONE 2014, 9, e93950. [Google Scholar] [CrossRef]
  37. Xiao, Y.; Liu, R.; Kim, K.; Zhang, J.; Cui, T. A Random Forest-Based Algorithm to Distinguish Ulva Prolifera and Sargassum From Multispectral Satellite Images. IEEE Trans. Geosci. Remote Sens. 2022, 60, 4201515. [Google Scholar] [CrossRef]
  38. Zhang, C. Applying Data Fusion Techniques for Benthic Habitat Mapping and Monitoring in a Coral Reef Ecosystem. ISPRS J. Photogramm. Remote Sens. 2015, 104, 213–223. [Google Scholar] [CrossRef]
  39. Strobl, C.; Boulesteix, A.-L.; Kneib, T.; Augustin, T.; Zeileis, A. Conditional Variable Importance for Random Forests. BMC Bioinformatics 2008, 9, 307. [Google Scholar] [CrossRef] [PubMed]
  40. Escadafal, R. Soil Spectral Properties and Their Relationships with Environmental Parameters—Examples from Arid Regions. In Imaging Spectrometry—A Tool for Environmental Observations; Hill, J., Mégier, J., Eds.; Springer: Dordrecht, The Netherlands, 1994; pp. 71–87. ISBN 978-0-585-33173-7. [Google Scholar]
  41. Cavanaugh, K.C.; Cavanaugh, K.C.; Bell, T.W.; Hockridge, E.G. An Automated Method for Mapping Giant Kelp Canopy Dynamics from UAV. Front. Environ. Sci. 2021, 8, 587354. [Google Scholar] [CrossRef]
  42. Tucker, C.J. Red and Photographic Infrared Linear Combinations for Monitoring Vegetation. Remote Sens. Environ. 1979, 8, 127–150. [Google Scholar] [CrossRef]
  43. Louhaichi, M.; Borman, M.M.; Johnson, D.E. Spatially Located Platform and Aerial Photography for Documentation of Grazing Impacts on Wheat. Geocarto Int. 2001, 16, 65–70. [Google Scholar] [CrossRef]
  44. Zarco-Tejada, P.J.; Miller, J.R.; Noland, T.L.; Mohammed, G.H.; Sampson, P.H. Scaling-up and Model Inversion Methods with Narrowband Optical Indices for Chlorophyll Content Estimation in Closed Forest Canopies with Hyperspectral Data. IEEE Trans. Geosci. Remote Sens. 2001, 39, 1491–1507. [Google Scholar] [CrossRef]
  45. Huete, A.; Didan, K.; Miura, T.; Rodriguez, E.P.; Gao, X.; Ferreira, L.G. Overview of the Radiometric and Biophysical Performance of the MODIS Vegetation Indices. Remote Sens. Environ. 2002, 83, 195–213. [Google Scholar] [CrossRef]
  46. Slaton, M.R.; Raymond Hunt, E., Jr.; Smith, W.K. Estimating Near-Infrared Leaf Reflectance from Leaf Structural Characteristics. Am. J. Bot. 2001, 88, 278–284. [Google Scholar] [CrossRef]
  47. Hayashi, L.; Hurtado, A.Q.; Msuya, F.E.; Bleicher-Lhonneur, G.; Critchley, A.T. A Review of Kappaphycus Farming: Prospects and Constraints. In Seaweeds and their Role in Globally Changing Environments; Seckbach, J., Einav, R., Israel, A., Eds.; Springer: Dordrecht, The Netherlands, 2010; pp. 251–283. ISBN 978-90-481-8569-6. [Google Scholar]
  48. Dawes, C.J. Irradiance Acclimation of the Cultured Philippine Seaweeds, Kappaphycus alvarezii and Eucheuma denticulatum. Bot. Mar. 1992, 35, 189–196. [Google Scholar] [CrossRef]
  49. Mateo, J.P.; Campbell, I.; Cottier-Cook, E.J.; Luhan, M.R.J.; Ferriols, V.M.E.N.; Hurtado, A.Q. Analysis of Biosecurity-Related Policies Governing the Seaweed Industry of the Philippines. J. Appl. Phycol. 2020, 32, 2009–2022. [Google Scholar] [CrossRef]
  50. Hu, C. A Novel Ocean Color Index to Detect Floating Algae in the Global Oceans. Remote Sens. Environ. 2009, 113, 2118–2129. [Google Scholar] [CrossRef]
  51. Silva, T.S.F.; Costa, M.P.F.; Melack, J.M.; Novo, E.M.L.M. Remote Sensing of Aquatic Vegetation: Theory and Applications. Environ. Monit. Assess. 2008, 140, 131–145. [Google Scholar] [CrossRef] [PubMed]
  52. Selvaraj, S. Development of Novel Image Analysis Approaches for Seaweed Discrimination—Species Level Study Using Field Spectroscopy and UAV Multispectral Remote Sensing. Ph.D. Thesis, Auckland University of Technology, Auckland, New Zealand, 2021. [Google Scholar]
  53. Vahtmäe, E.; Kutser, T.; Martin, G.; Kotta, J. Feasibility of Hyperspectral Remote Sensing for Mapping Benthic Macroalgal Cover in Turbid Coastal Waters—A Baltic Sea Case Study. Remote Sens. Environ. 2006, 101, 342–351. [Google Scholar] [CrossRef]
Figure 1. Characteristic end-member spectra used for the spectral library with various crop types: (A) E. denticulatum with deep purple/brown thalli, typical in healthy specimens, (B) silted E. denticulatum, with thalli in beige colour patches due to accumulation of silt particles, (C) depigmented E. denticulatum, that is the typical appearance of deceased seaweed, (D) green morphotype of K. alvareezi, with branching thalli and (E) brown morphotype of K. alvareezi with light brown/orange thalli.
Remotesensing 16 03502 g001
Figure 2. Spectral signatures of E. denticulatum and K. alvareezi green and brown morphotypes: (A) Average spectra of healthy thallus with no signs of depigmentation. (B) Diagram of wavelengths’ relative importance for discriminating Eucheuma and Kappaphycus morphotypes.
Remotesensing 16 03502 g002
Figure 3. Hyperspectral signatures of E. denticulatum showing a gradient of white discolouration of the thallus: (A) Average spectra of healthy, mixed and entirely white Eucheuma thallus. (B) Diagram of wavelengths’ relative importance for characterising thallus whitening.
Remotesensing 16 03502 g003
Figure 4. Hyperspectral signatures of K. alvareezi showing a gradient of white discolouration of the thallus: (A) Average spectra of healthy, mixed and entirely white thallus. (B) Diagram of wavelengths’ relative importance for characterising thallus whitening.
Remotesensing 16 03502 g004
Figure 5. (A) Comparison of silted and depigmented E. denticulatum spectra. (B) Diagram of relative wavelengths’ importance for differentiating silted and depigmented thallus.
Remotesensing 16 03502 g005
Figure 6. Spectral signatures of E. denticulatum degraded at the multispectral resolution of a DJI Phantom 4 multispectral sensor. (A) Average spectra of healthy, mixed and fully depigmented thallus. (B) Diagram of wavelengths’ relative importance for characterising the thallus whitening.
Remotesensing 16 03502 g006
Figure 7. Spectral signatures of K. alvareezi degraded at the multispectral resolution of a DJI Phantom 4 multispectral sensor. (A) Average spectra of healthy, mixed and fully depigmented thallus. (B) Diagram of wavelengths’ relative importance for characterising the thallus whitening.
Remotesensing 16 03502 g007
Figure 8. Spectral signatures of E. denticulatum and K. alvareezi morphotypes degraded at the multispectral resolution of a DJI Phantom 4 multispectral sensor.
Remotesensing 16 03502 g008
Figure 9. (A) Comparison of silted and depigmented E. denticulatum spectra degraded at the multispectral resolution of a DJI Phantom 4 multispectral sensor. (B) Diagram of relative wavelengths’ importance for differentiating silted and depigmented thallus.
Remotesensing 16 03502 g009
Figure 10. (A) True-color RGB image of healthy, silted and depigmented Eucheuma samples obtained with a DJI Phantom 4 multispectral drone hand-held 1.5 m above the ground. (B) Random Forest classification output using the drone’s five multispectral bands. (C) Random classification output using the four indices with the greatest importance described in Figure 9A. The image in the black rectangle is shown in the zoom-in frame to the right to illustrate better the silted specimen.
Remotesensing 16 03502 g010
Table 1. Spectral library covering different thallus conditions of E. denticulatum and K. alvareezi at two spectral resolutions: H: healthy, S: silted, mixed: linear mixing between healthy and white (=depigmented), W: white. Number of reflectance spectra used for training/validating the machine learning algorithm. * Multispectral photomosaics obtained with the DJI Phantom 4 multispectral sensor.
Thallus ConditionsSpectral ResolutionTraining SamplesValidation Samples
Eucheuma/Kappaphycus green/brownHyperspectral7551
Eucheuma (H, mixed, W)Hyperspectral141101
Kappaphycus (H, mixed, W)Hyperspectral14399
Eucheuma (S, W)Hyperspectral3636
Eucheuma (H, mixed, W)Multispectral141101
Indices Eucheuma (H, mixed, W)Multispectral141101
Kappaphycus (H, mixed, W)Multispectral14399
Indices Kappaphycus (H, mixed, W)Multispectral14399
Eucheuma/Kappaphycus green/brown)Multispectral7058
Eucheuma (S, W)Multispectral3636
Indices Eucheuma (S, W)Multispectral3636
Eucheuma (H, S, W) *Multispectral303100
Indices Eucheuma (H, S, W) *Multispectral30398
Table 2. Vegetation indices tested in this study.
Index NameFormulaReference
Intensity(R + G + B)/30.5[40]
Huearctan[(G − B) × (2 × R − G − B/30.5)][40]
Blue–Red ratioB/R[41]
Green–Red ratioG/R
Blue–Green ratioB/G
Norm RedR/(NIR + R + G)
Norm GreenG/(NIR + R + G)
Normalised Difference Vegetation Index (NDVI)(NIR − R)/(NIR + R)[42]
Normalised Ratio Vegetation Index (NRVI)[(R/NIR) − 1]/[(R/NIR) + 1][32]
Normalized Difference Green–Red Index (NGRDI)(G − R)/(G + R)[32]
Green Leaf Index (GLI)(2 × − R − B)/(2 × G + R + B)[43]
Green–Red NDVI (GRNDVI)[NIR − (G + R)]/[NIR + (G + R)][44]
Enhanced Vegetation Index (EVI)[2.5 × (NIR − R)]/[(NIR + 6 × R − 7.5 × B) + 1][45]
Red–Blue NDVI (RBNDVI)[REDEDGE − (R − B)]/[REDEDGE + (R + B)]
Disclaimer/Publisher’s Note: The statements, opinions and data contained in all publications are solely those of the individual author(s) and contributor(s) and not of MDPI and/or the editor(s). MDPI and/or the editor(s) disclaim responsibility for any injury to people or property resulting from any ideas, methods, instructions or products referred to in the content.

