Article

UAV Swarm Target Identification and Quantification Based on Radar Signal Independency Characterization

by
Jia Liu
1,*,
Qun-Yu Xu
2,
Min Su
3 and
Wei-Shi Chen
4
1
State Key Laboratory of CNS/ATM, School of Electronic Information Engineering, Beihang University, Beijing 100191, China
2
The Research Institute of Civil Aviation Law, Regulation and Standardization, China Academy of Civil Aviation Science and Technology, Beijing 100028, China
3
The College of Electronic Engineering, Guangxi Normal University, Guilin 541004, China
4
The Airport Research Institute, China Academy of Civil Aviation Science and Technology, Beijing 100028, China
*
Author to whom correspondence should be addressed.
Remote Sens. 2024, 16(18), 3512; https://doi.org/10.3390/rs16183512
Submission received: 13 August 2024 / Revised: 14 September 2024 / Accepted: 18 September 2024 / Published: 21 September 2024
(This article belongs to the Special Issue Technical Developments in Radar—Processing and Application)

Abstract

:
Radar surveillance of noncooperative UAV swarm is challenging and is involved in many critical surveillance scenarios. The multimodality property of dynamic UAV swarm targets presents larger radar signature complexity and elevates the radar detection difficulty. The swarm unit number ambiguity from dense UAV grouping also inhibits radar monitoring accuracy. Inspired by the coherent integration essence of swarm target signals, this paper proposes a radar signal processing framework based on complex valued independent component analysis (cICA) for swarm target identification and quantification. The target detection threshold is determined from pure clutter signals after cICA processing. A customized clustering algorithm is applied on independent components for swarm target quantification. Target detection and quantification methods are verified with various multimodality UAV swarm flight plans. The results indicate that the detection performance of the proposed method is comparable with conventional CFAR algorithms with better stability performance. The target quantification procedure could estimate swarm unit numbers with acceptable numerical deviations. More discussions are given on the relevance between quantification accuracy and swarm configurations with respect to signal independency mechanisms. Efficiency discussions reveal the bottleneck of the proposed method for future optimization works.

1. Introduction

Unmanned aerial vehicle (UAV) technologies and systems have achieved booming development in recent years due to unique platform and dimension advantages [1,2,3]. Low costs and deployment convenience advantages motivate UAV swarm developments in multiple operational scenarios, especially in military domains. Accurate and efficient surveillance techniques for noncooperative UAV swarm targets are necessary to accommodate this new kind of threat in current and future battle fields [4,5].
Radar systems are currently considered as the most effective remote sensing solutions to achieve all-weather and long-range UAV swarm target surveillance. Principal challenges of radar surveillance on UAV swarm targets come from their multimodality characters. Target quantities present fast variations like flickering for dense formulated swarm targets, and UAVs might distribute along multiple neighboring resolution cells in radial and cross dimensions. This elevates difficulties in target detection, tracking, and recognition [6,7,8]. Raising radar bandwidths and resolutions could overcome these limitations by transforming difficulties into group target surveillance problems [9]. However, wideband radar systems are currently also not applicable in practical UAV surveillance scenarios due to costs and spectrum considerations. Narrowband radar systems are currently the most plausible choice for low-altitude noncooperative target surveillance like birds and UAVs. This also limits the applicability of radar imaging techniques due to limited imaging quality and integration time [10,11].
Micro-doppler signature-based recognition methods are currently the most popular solution for UAV target surveillance, especially for UAVs with rotor blades like drones. Existing research works verify the effectiveness of micro-doppler signatures in classifications between birds and drones [12,13,14]. Various target detection and recognition techniques are developed based on advanced machine learning models [15,16,17]. However, for swarm targets with multiple UAVs within one radar resolution volume, their doppler signatures are ambiguous. There are no published works discussing doppler signature differences between single drones and swarm drones. Theoretically, there exist complicated mutual couplings among swarm units in electromagnetic scattering and signal levels. Corresponding micro-doppler signatures might be distorted by coupling interferences from neighboring units. Moreover, specific integration time and range requirements also limit the applicability of micro-doppler signatures for swarm target surveillance. Besides effective radar target detection and recognition, existing signal processing solutions consider a swarm target within one resolution volume as one extended target, and it is difficult to identify targets between single and swarm modalities.
Motivated by insufficiencies of existing methods in swarm target detection and modality identification, this paper presents a method aiming at effective swarm target detection and quantification. From the electromagnetic scattering viewpoint, swarm targets within a radar resolution volume could be modeled as non-rigid deformable extended targets. Their radar echo signals are equivalent to coherent integrations of all UAV units [18]. Therefore, radar signals of swarm targets are considered as mixtures of several independent swarm unit signals and clutter signals. If these independent sources could be extracted and identified accurately, UAV swarms could be detected and quantified effectively. This functionality could prominently elevate the degree of refined target identification for radar systems. This idea inspires exploration of swarm target radar signal independency characterization. Independent component analysis (ICA) is a representative independency extraction solution. It originated from the cocktail party problem to decompose mixed voice signals into identifiable independent voice sources [19,20,21]. Mixed signals are modeled as feature vectors for higher-order statistical character extraction. Projected feature vectors from ICA are decorrelated and statistically independent. ICA has successful application in fields like voice separation, face recognition, and radar target recognition, with good noise tolerance and robustness [22,23,24]. The essence of UAV swarm echo signal possesses similarity to the ICA principle. This hints the possibility of characterizing UAV swarm signals using ICA. Considering the complex number property of radar signal, the complex-valued ICA (cICA) [25,26,27,28] is a better choice.
This paper proposes a radar signal-processing method based on cICA for UAV swarm target detection and quantification. Signals in reference cells and cell-under-test (CUT) are processed with cICA. Scale and shape parameters of clutter signals are extracted for detection threshold determination. The quantification functionality is the second stage of target detection. The method is validated using a dynamic UAV radar signal simulation platform. Flight plans are designed for single UAV and UAV swarms, respectively. Conventional CFAR algorithms [29,30,31] and an advanced signal processing method [32] are selected and reproduced for validation. The results indicate that the new method provides more stable detection performance on UAV swarms with complicated modality transformations. A particular experiment is designed to validate the feasibility of the swarm quantification strategy. Quantification results indicate that the method could provide reasonable swarm quantity evaluation with acceptable numerical deviations.

2. Materials and Methods

2.1. Radar Signal Modeling and Independency Extraction

Assume there are N groups of independent complex signal sources s i t = s i R t + i · s i I t (i = 1,2,…,N). The measured signal x t is a mixture of N groups of signals:
x t = M · s t ,
In many problems, independent signal sources s i t are unknown and only measurement signals x t are available. The unknown matrix M interprets signal composition. The principle of ICA is separating x t to approximate an independent source as:
z t = W · x t ,
where W is a demixing matrix and z t are independent signal components. This paper uses the complex independent component analysis (cICA) to process measured signals and acquire the demixing matrix. In following contents, signals x t and z t are symbolized in matrix formulation as X and Z for conciseness. The fundamental general cICA algorithm is composed of the following steps:
  • STEP 1: Signal Centralization
The first step is the signal centralization for X, which is the subtraction of its average value as in (3). The centralized signal possesses a zero mean value:
X = X E X ,
  • STEP 2: Signal Whitening
A whitening transformation matrix B is introduced to transform data within matrix X. The signal correlation matrix becomes an identity matrix after whitening:
Y = B · X ,
The matrix after whitening satisfies E Y · Y T = I . The auto-adjust algorithm is adopted to select whitening transformation B by introducing a cost function:
J = 1 2 I E Y Y H F 2 ,
in which · F 2 is the 2-norm. The 2-norm for complex signals is · F 2 = t r · · H . The tr operator indicates the sum of all diagonal elements. The iterative formulation for B is:
B k + 1 = B k μ B = B k μ E Y · Y H I · B k ,
  • STEP 3: Blind Source Separation
The auto-adjusting algorithm calculates separation matrix W with the cost function:
J W = E G W H Y 2 ,
A nonlinear function is used to approximate a high-order statistical term. W = w 1 , w 2 , , w n T indicates an n-dimensional complex component. G is the nonlinear even function for smoothing:
G y = log a + y ,
Assuming the amplitude of source signal is 1, there is:
E W H Y 2 = E W H Y Y H W = W H W = 1 ,
The simplified cost function is formulated as:
J W = E G W H Y 2 G E W H Y 2 1 ,
Iteration formulations for W generation are:
W k + 1 = E Y W k H Y G W k H Y 2 E G W k H Y 2 + W k H Y 2 G W k H Y 2 W k ,
W k + 1 = W k + 1 W k + 1 ,
Independent component signals after blind-source separation are:
Z = W · Y ,
The framework of cICA is presented in Figure 1.

2.2. Swarm Target Detection and Quantification

This section introduces the swarm target detection and quantification method. The method is composed of two stages. The first stage aims at target detection according to signals in CUT and reference cells within one coherent processing interval (CPI). Based on the precondition of target detection within several continuous CPIs, the second stage quantifies UAVs within the CUT using cICA.
In target detection, cICA is applied on signals from CUT and reference cells to extract independent components. Clutter signal interferences are non-negligible for low-altitude UAV detection. In most cases, radar echo signals from UAVs are mixture of target echo and clutter, as well as noise signals. The demixing functionality of cICA makes it possible to distinguish UAV echo signals and clutter interferences. Independent components’ characters for environmental clutter signals are theoretically different from UAV echo signals due to their intrinsic scattering mechanism differences. This provides a chance to use independent components for target detection. The framework of the proposed method is presented in Figure 2. Technical details are presented in following sections.

2.2.1. Radar Signal Collection

For a cell under test (CUT), pulse train signals within the ith CPI are formulated as:
x i t = x i 1 , x i 2 , , x i N ,
In which N denotes the number of pulses within one CPI. If a CUT contains M UAVs, the composition of signal s i t is modeled as:
x i t = m = 1 M x i U m , t + x C t ,
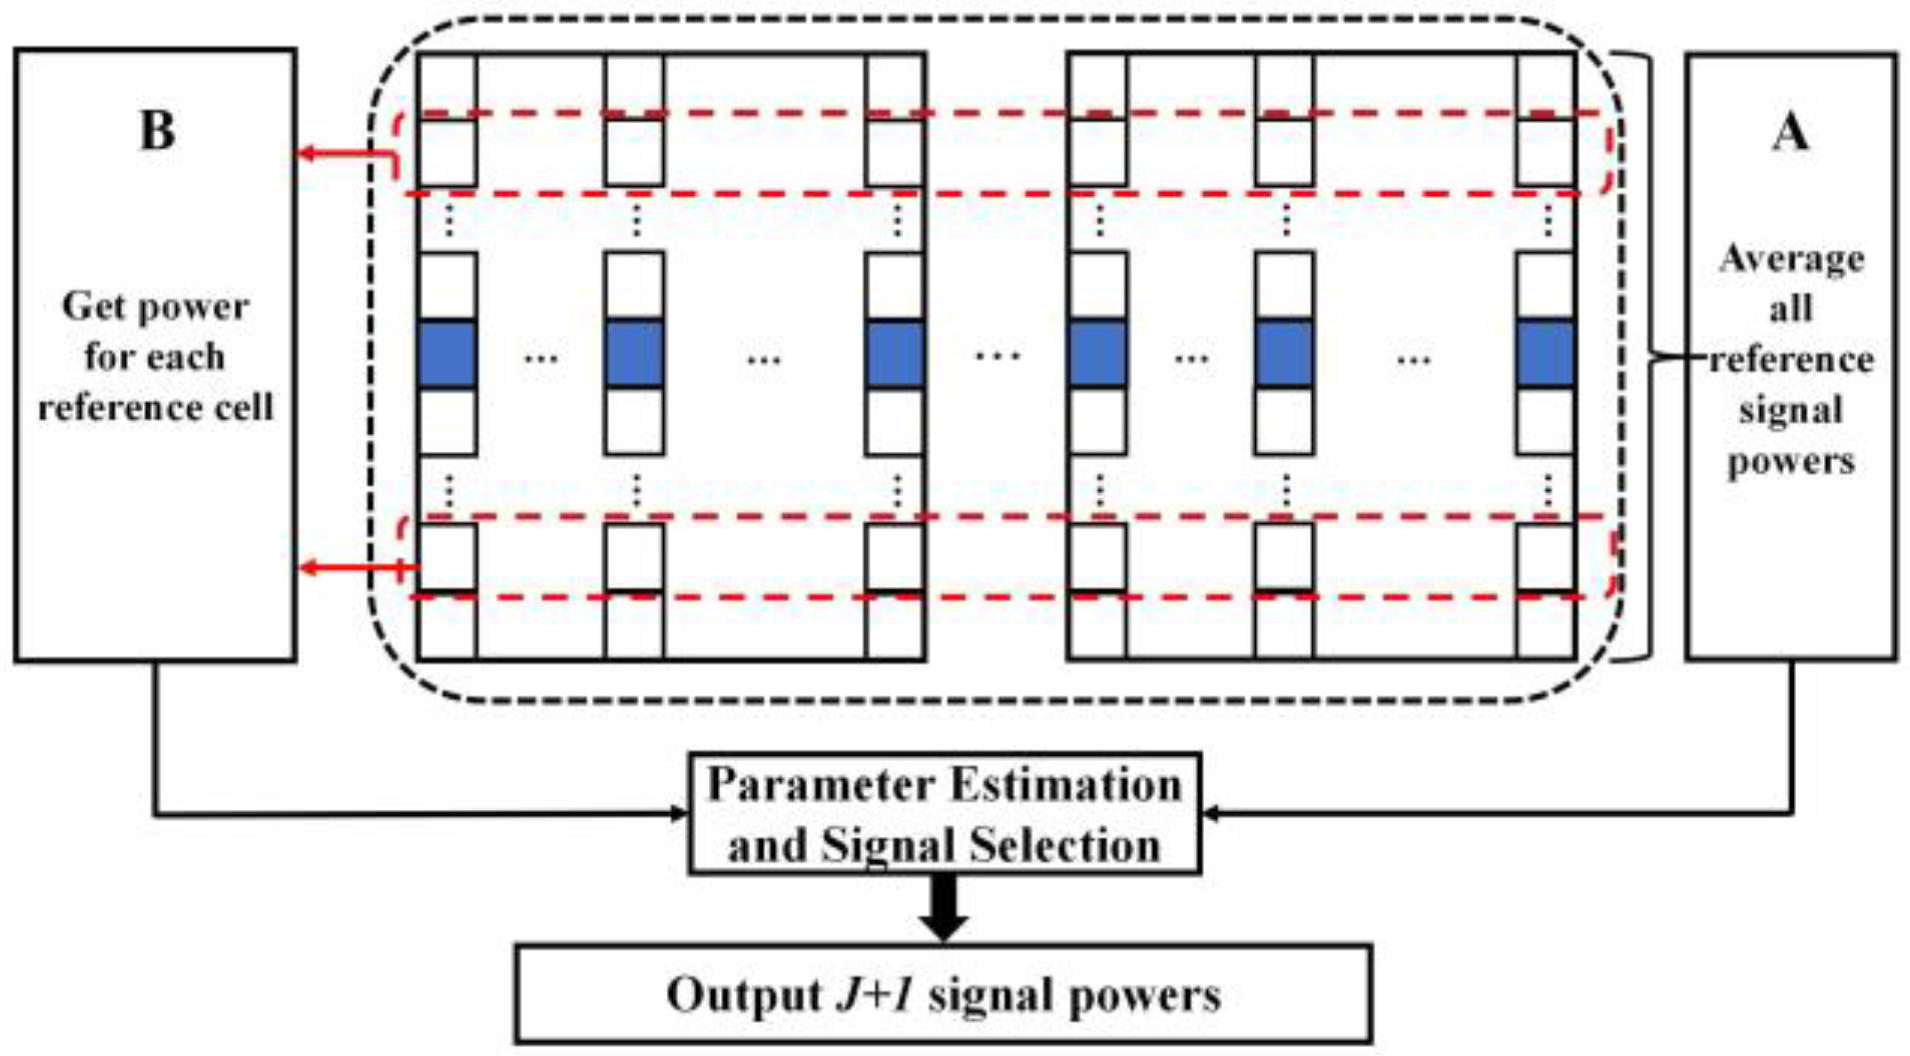
Noise terms are omitted here as they make minor contributions to signal independency characterization. Signals collected from a CUT are temporarily stored in the dataset, which is utilized for target detection according to thresholds calculated from reference cells. Not all reference signals are selected. Reference signals are processed in two parts. The first one is involved in average operation over all signals and calculates the averaged power. The second part processes signals at each reference cell. Compared with conventional CFAR algorithms, the method uses shape and scale parameters as signal descriptors instead of power information. Shape parameters are taken during detection threshold determination.
Shape and scale parameters are related to signal statistical distributions. This paper uses clutter signals following K-distribution [33] to exemplify the procedures of reference signal selection and detection threshold definition. The procedures are applicable for clutter signals following other statistical distributions like Weibull and compound-Gaussian models [34,35]. The probability density function for K-distribution is:
p x C t = 4 v / b 2 v 1 Γ v 4 v b x t v Κ v 1 4 v b x t ,
where x C t satisfies 0 x C t < . The function Γ · is the gamma function, and Κ v 1 ( · ) is the modified third kind Bessel function of order v − 1. The term v is the shape parameter and b is the scale parameter [36]. They are calculated using the method of moments by calculating first and second theoretical moments [37,38]:
x i t = x i 1 , x i 2 , , x i N ,
4 v π Γ v Γ v + 1 / 2 = E x t 2 E x t 2
In which E x t 2 is the expected value of signal powers within one CPI. A shape parameter depicts the general shape of a distribution; it is utilized to quantify two distributions’ similarity. A scale parameter interprets the degree of stretching or squeezing for a distribution. Shape and scale parameters could basically specify the uniqueness of a statistical distribution. The kth order moment in (16) is replaced by its sample estimation:
E ^ x t k = 1 T C P I t = 1 T C P I x t k E x t k
Figure 3 presents the framework of reference signal selection and parameter estimation. Scale and shape parameters are calculated for each reference cell in block B. Two parameters are also generated based on signals averaged from all reference cells in block A, and they are taken as the threshold for reference signal selection. Reference signals whose shape parameters are smaller than the threshold are selected from block B. The number of selected reference signals is denoted as J. Signals selected from block B and the averaged reference signal from block A compose reference signals for target detection.

2.2.2. Detection Threshold Selection

The detection threshold is determined from selected reference signals. This paper uses a radar signal simulation platform to guarantee signal sufficiency. To reach the desired probability of false alarm (PFA), Monte Carlo tests are conducted for threshold detection. The number of Monte Carlo simulations is (100/PFA). Our experiment defines PFA as 10−3, and Monte Carlo simulations are conducted for 100/PFA = 100,000 times. This means 100,000 groups of reference signals are collected for threshold determination.
cICA is applied on selected reference signals from each Monte Carlo simulation. N groups of independent components are extracted. Shape parameters are calculated for each independent component, and a shape parameter dataset is generated. The detection threshold is extracted from this dataset by finding the one corresponding to the (1-PFA)% percentile. The reason for selecting shape parameter as a threshold is based on the analysis of measurement signals. Existing analysis on clutter distributions like K distribution and Weibull distribution reveals that a prominent difference between target presence and absence is that shape parameters are commonly larger for the case of target presence. One reasonable explanation is that RCS fluctuations of UAVs and birds usually do not follow K distribution or Weibull distribution. When UAV/bird signals are mixed with clutter signals, differences between mixed signals and pure clutter signals are reflected by larger shape parameters. This means shape parameters are applicable to indicate the presence of UAV/bird targets within clutter backgrounds.

2.2.3. Target Detection

As clutter signals and UAV/bird signals are statistically independent, it is reasonable to use the cICA algorithm to characterize their differences. The cICA is applied on x i t from N continuous CPIs with N extracted independent components. The detection procedure takes independent source estimation as the input. Shape parameters are calculated for each independent component. The existence of UAV targets is determined by comparing the shape parameter of each independent component with the threshold. If there is more than one shape parameter larger than the threshold, it indicates the target presence. This criterion is empirically designed according to massive numerical analysis. It is also fundamental for swarm target quantification.

2.2.4. Swarm Target Quantification

The quantification method is based on a precondition of target detections within N continuous CPIs at the same CUT. The reason is to ensure signal sufficiency for cICA processing. Pulse signals from N continuous CPIs possess larger dimensions, which is favorable for independent component distinguishing between targets and clutters. This precondition is based on a reasonable assumption, since swarm targets composed of multiple units are more easily detected by radar. Other radar target detection algorithms are also applicable to suit this precondition. This makes the quantification method adjustable and flexible as a complement functionality.
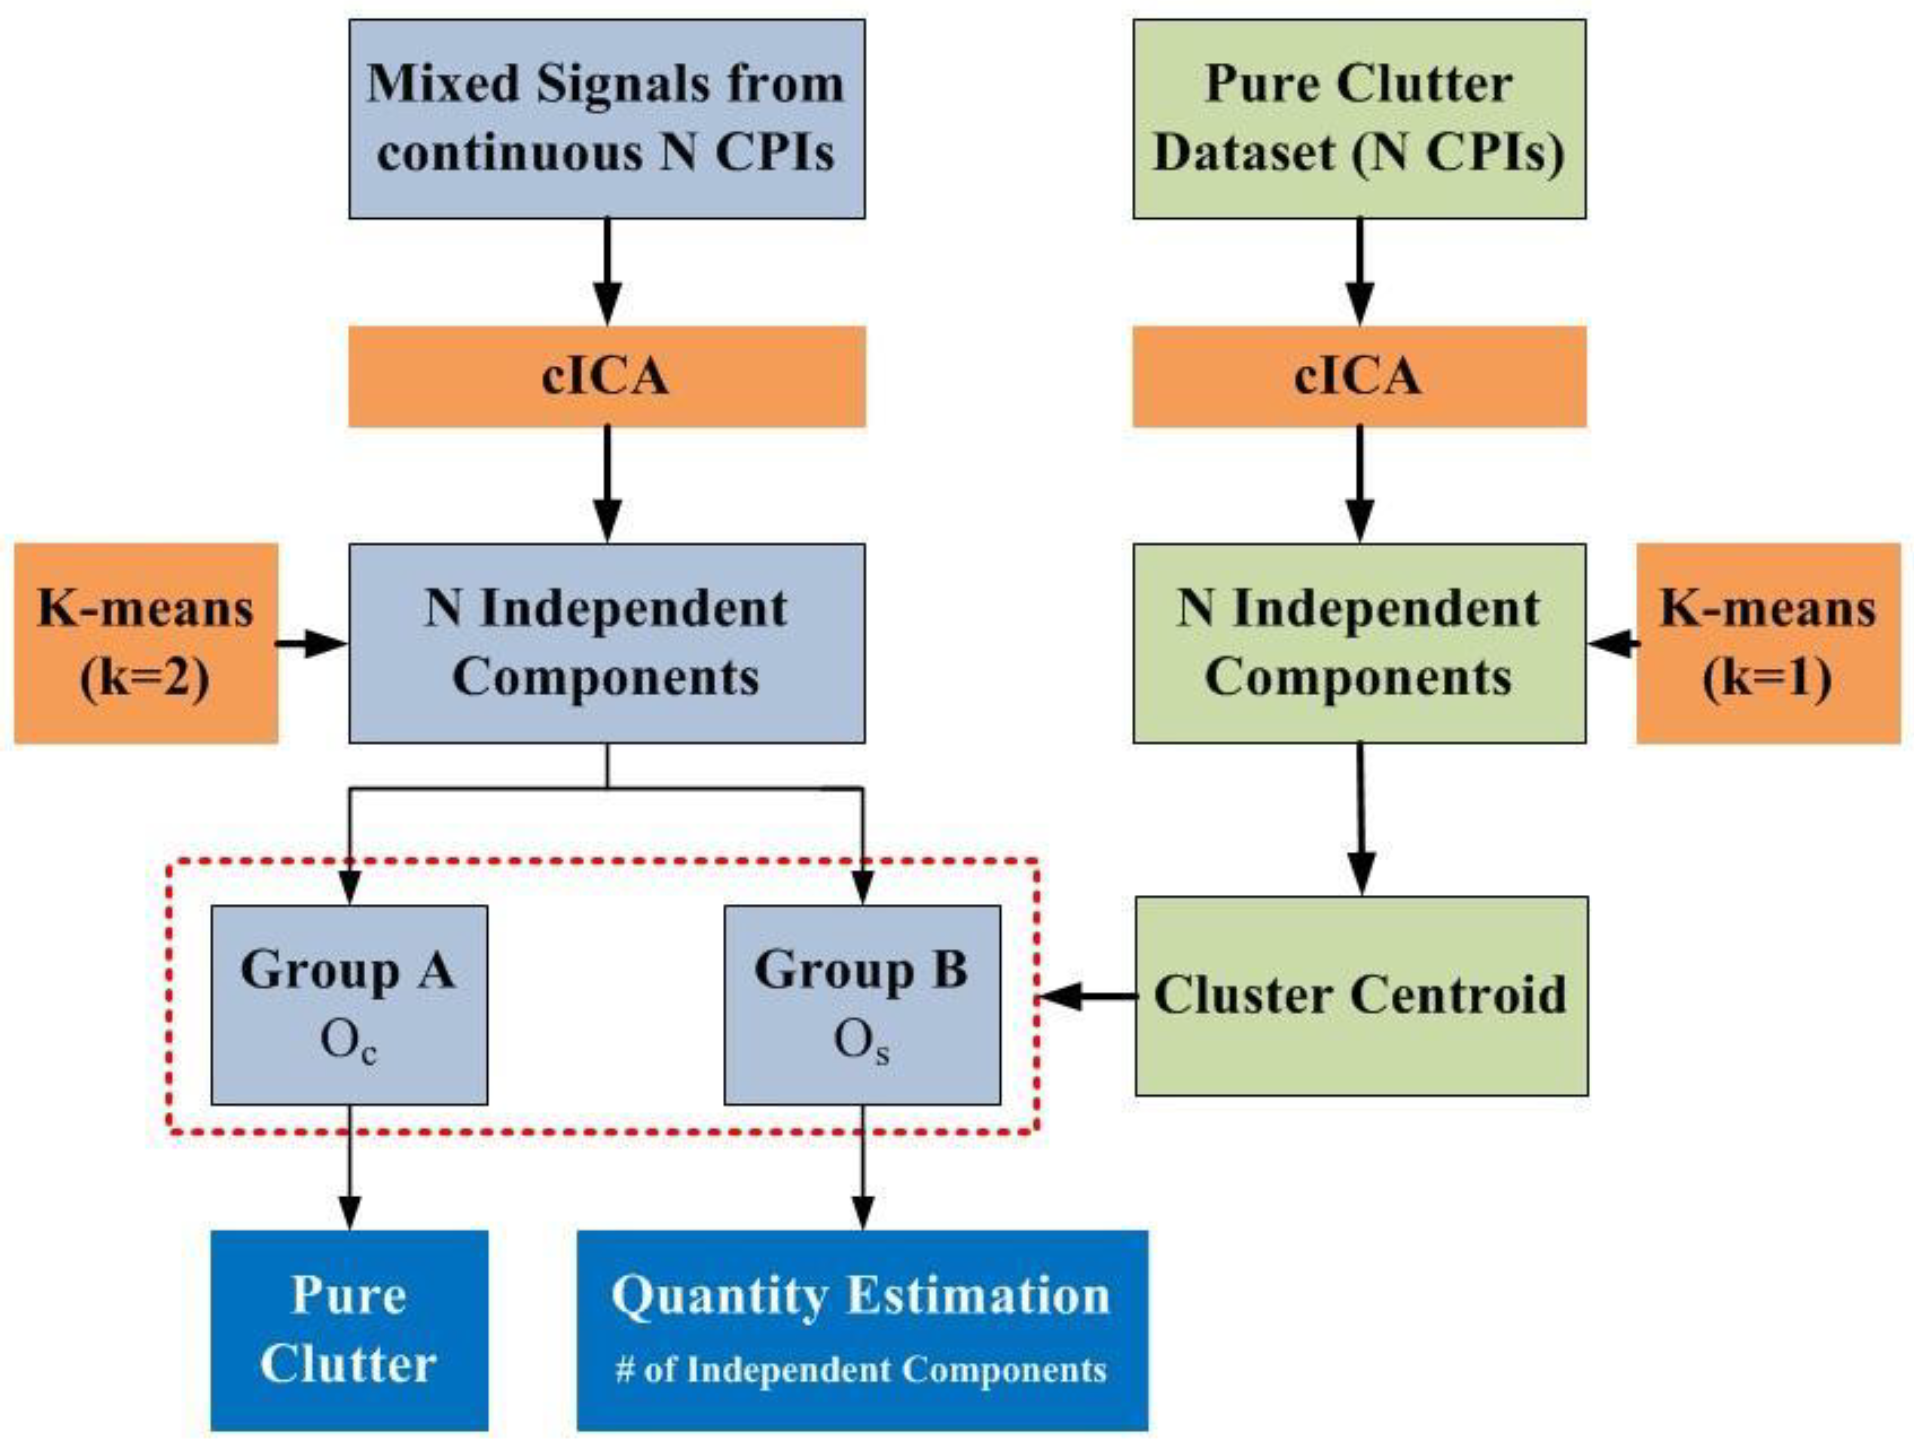
Signals from N continuous CPIs are equivalent to N measurements and independent components. N groups of independent sources are extracted as Z = Z 1 , Z 2 , , Z N , in which Z i = Z i 1 , Z i 2 , , Z i T . The k-means clustering algorithm [39] is taken to classify independent components. The parameter k is set to 2 with an arbitrarily selected initial clustering centroid. Two clusters are denoted as Ψ c and Ψ s , with centroids O c and O s . The KL-divergence is the metric to quantify statistical differences between independent components. According to essence differences between UAV/bird signals and clutter signals, Ψ c and Ψ s should be related to swarm targets and environmental clutters. To identify their affiliations, a pure clutter signal dataset is built by following the N continuous CPIs sampling principle and extracting corresponding independent components. The k-means algorithm with k = 1 is applied on the pure clutter signal dataset to generate a cluster Ψ c with the clustering centroid as O c . All independent components within Ψ c have their distance with O c . The clustering radius is denoted as R c , and 90% of independent components in Ψ c have distances with O c smaller than R c .
Affiliations of Ψ c and Ψ s are identified using centroid distance with O c . The one whose centroid is closer to O c indicates the clutter signal cluster. The ideal case is that the distance between O c and O c is smaller than R c . In contrast, the other cluster should be affiliated to the swarm target’s radar signals. Figure 4 demonstrates the target quantification framework. Group A contains independent components of clutter signals. Independent components in group B represent swarm target radar signals, and the number of components is the swarm unit number. This quantification strategy is theoretically supported by signal independencies among UAVs and clutters and verified through experiments. Even though numerical deviations are inevitable, this method could give reasonable swarm unit number estimations.

3. Results

This section presents experimental results for verification and discussion. Radar signals are generated from the UAV signal simulation platform. Detection performances for single UAV and dynamic multimodality UAV swarm are evaluated, respectively. A numerical study is presented to discuss the reasonability of target quantification. Quantification accuracy and efficiency performance are discussed at multiple scenarios.

3.1. Experiment Setup

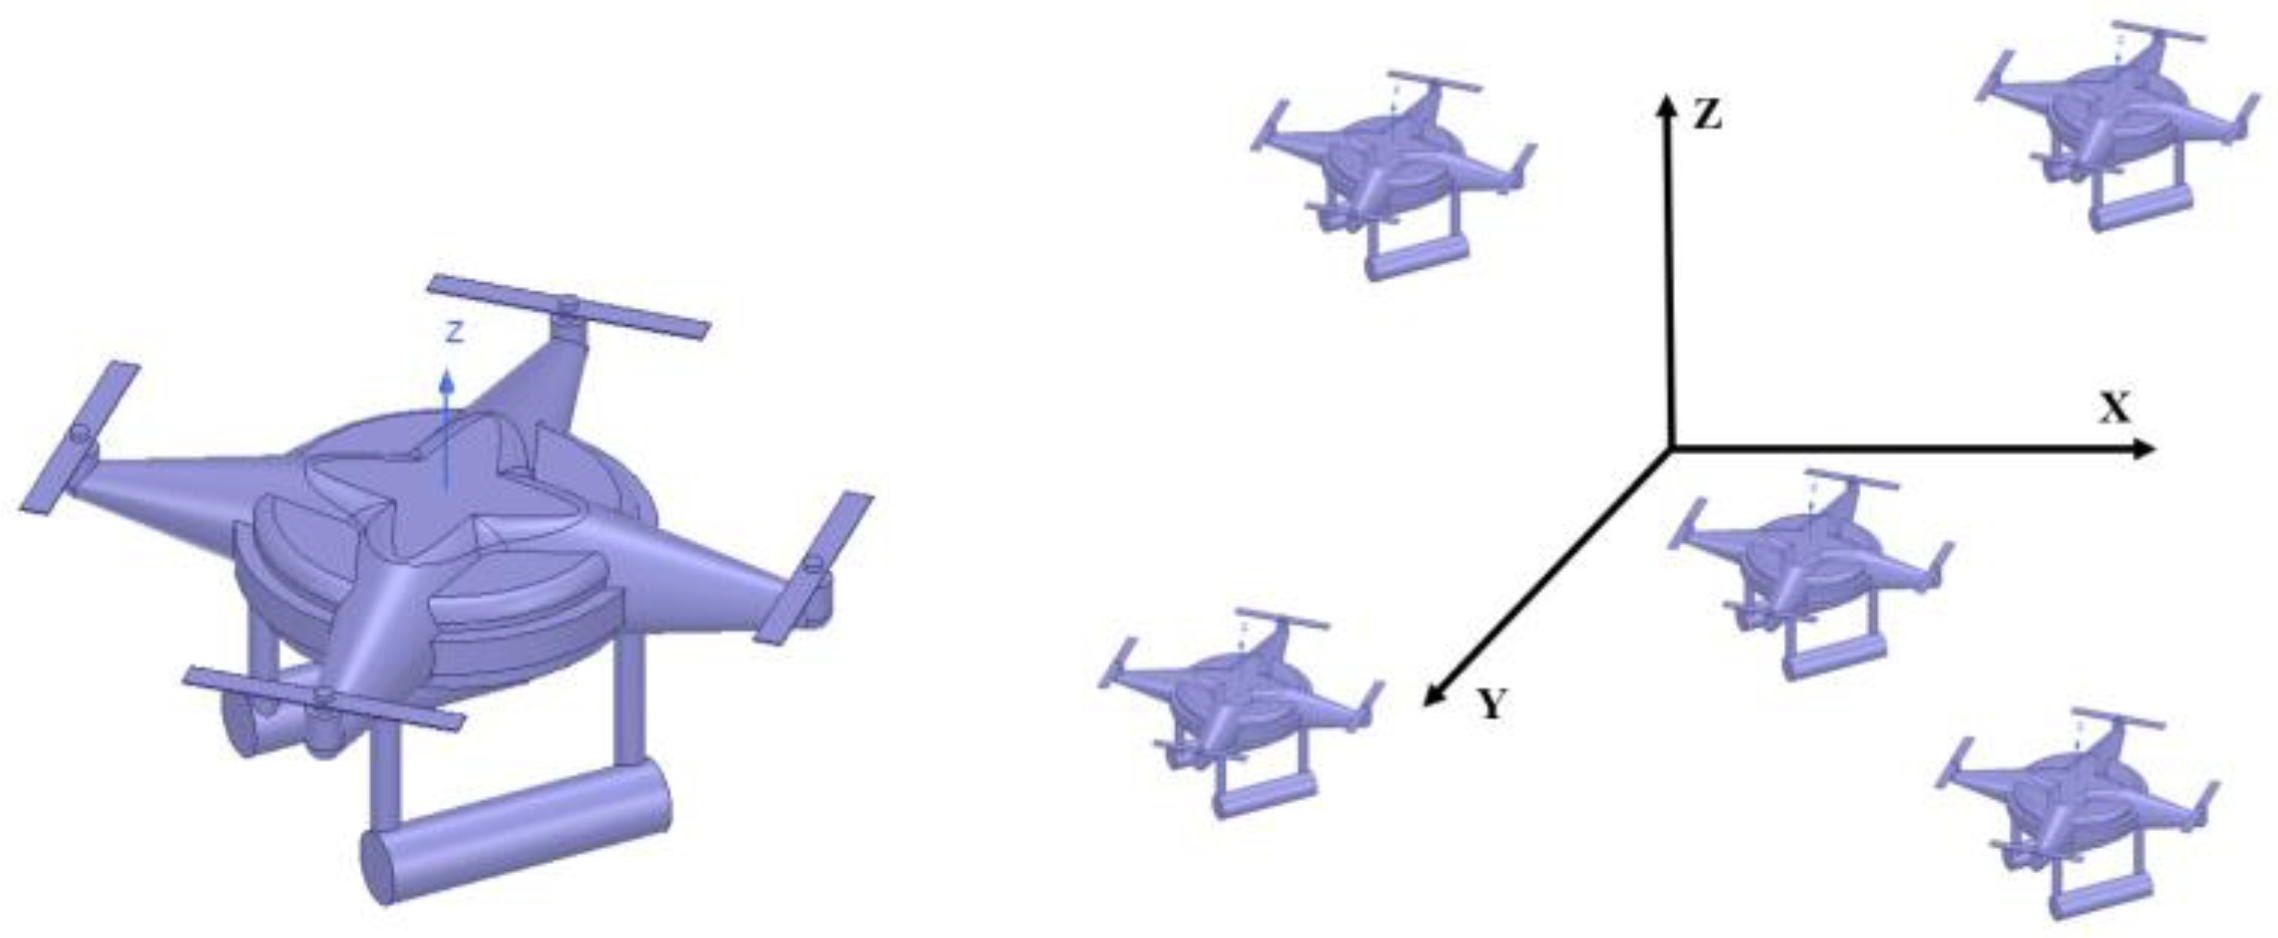
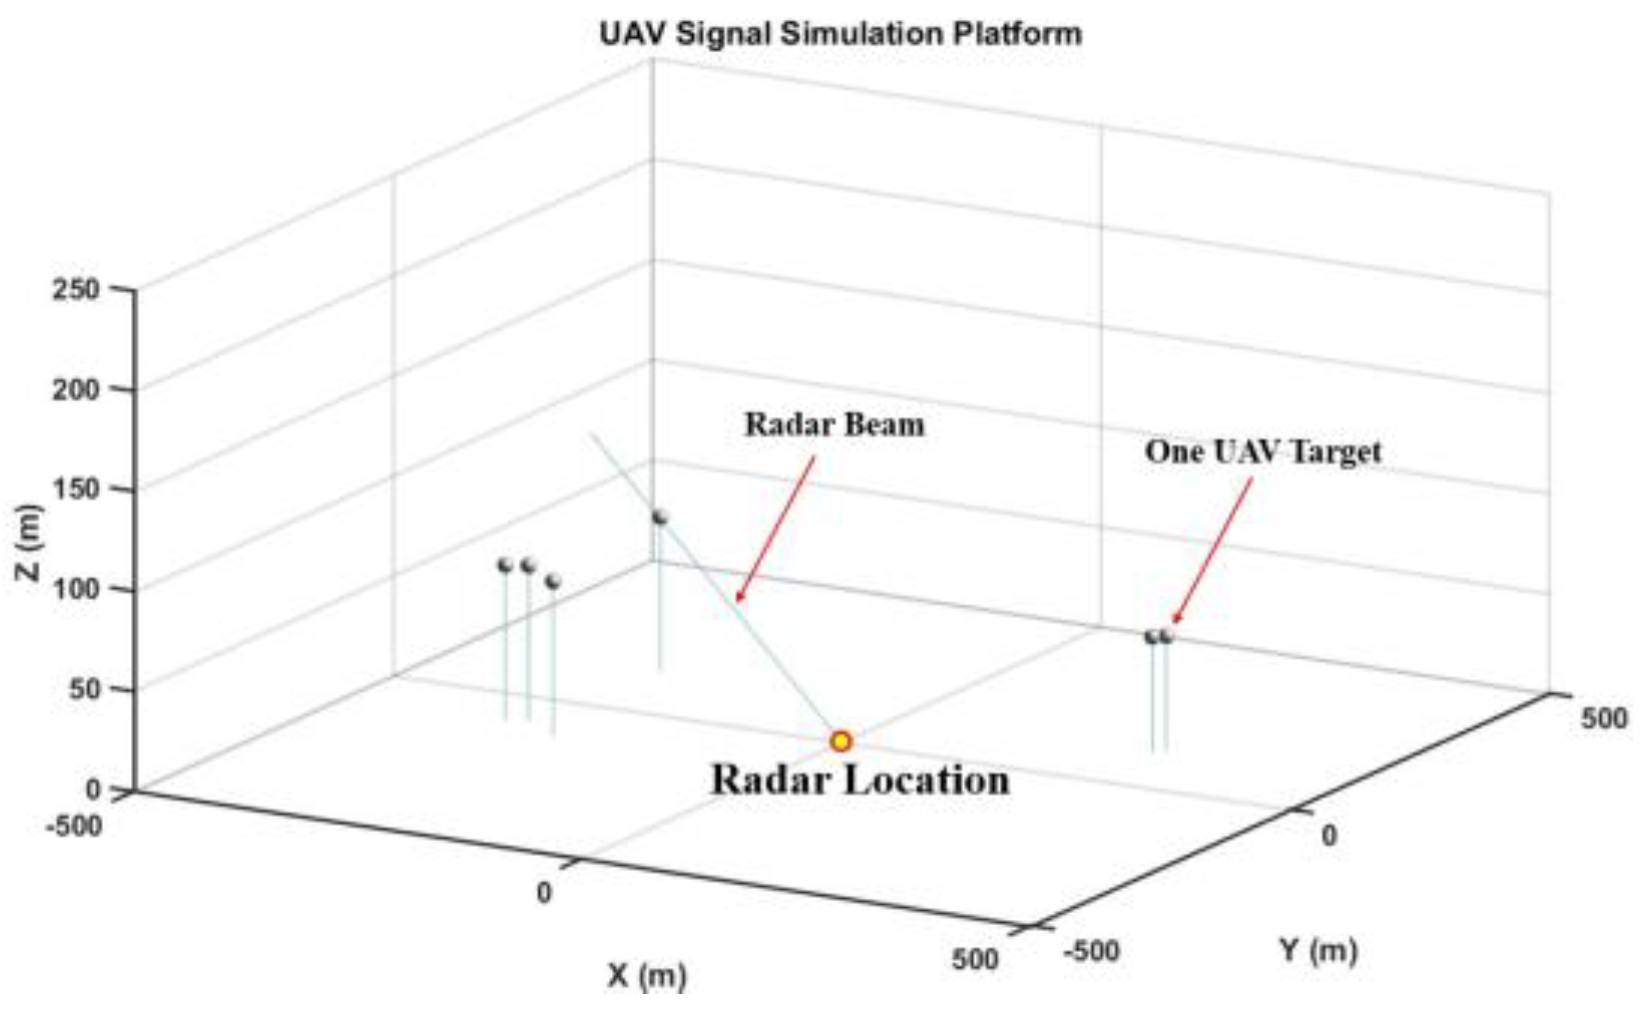
A quadcopter drone model was designed for the experiment. Its geometry pattern and swarm formulation are illustrated in Figure 5. The model is composed of ABS plastic and carbon fiber materials. The FEKO(2020) [40] software simulates target RCS information. The UAV signals’ simulation platform interface is given in Figure 6. The extended line from radar represents a radar scanning beam. The radar beam scanning strategy could be arbitrarily customized. Grey dots represent dynamic UAVs. The radar signal takes linear frequency modulation. The center frequency is 9.4GHz. The pulse repetition frequency is 1200 Hz and the pulse width is 200 us. The radar bandwidth is 20 MHz. The pulse number is T = 128. Clutter signals are generated using Monte Carlo simulation, and the shape parameters for the K-distribution model vary randomly between 0.1 and 2.
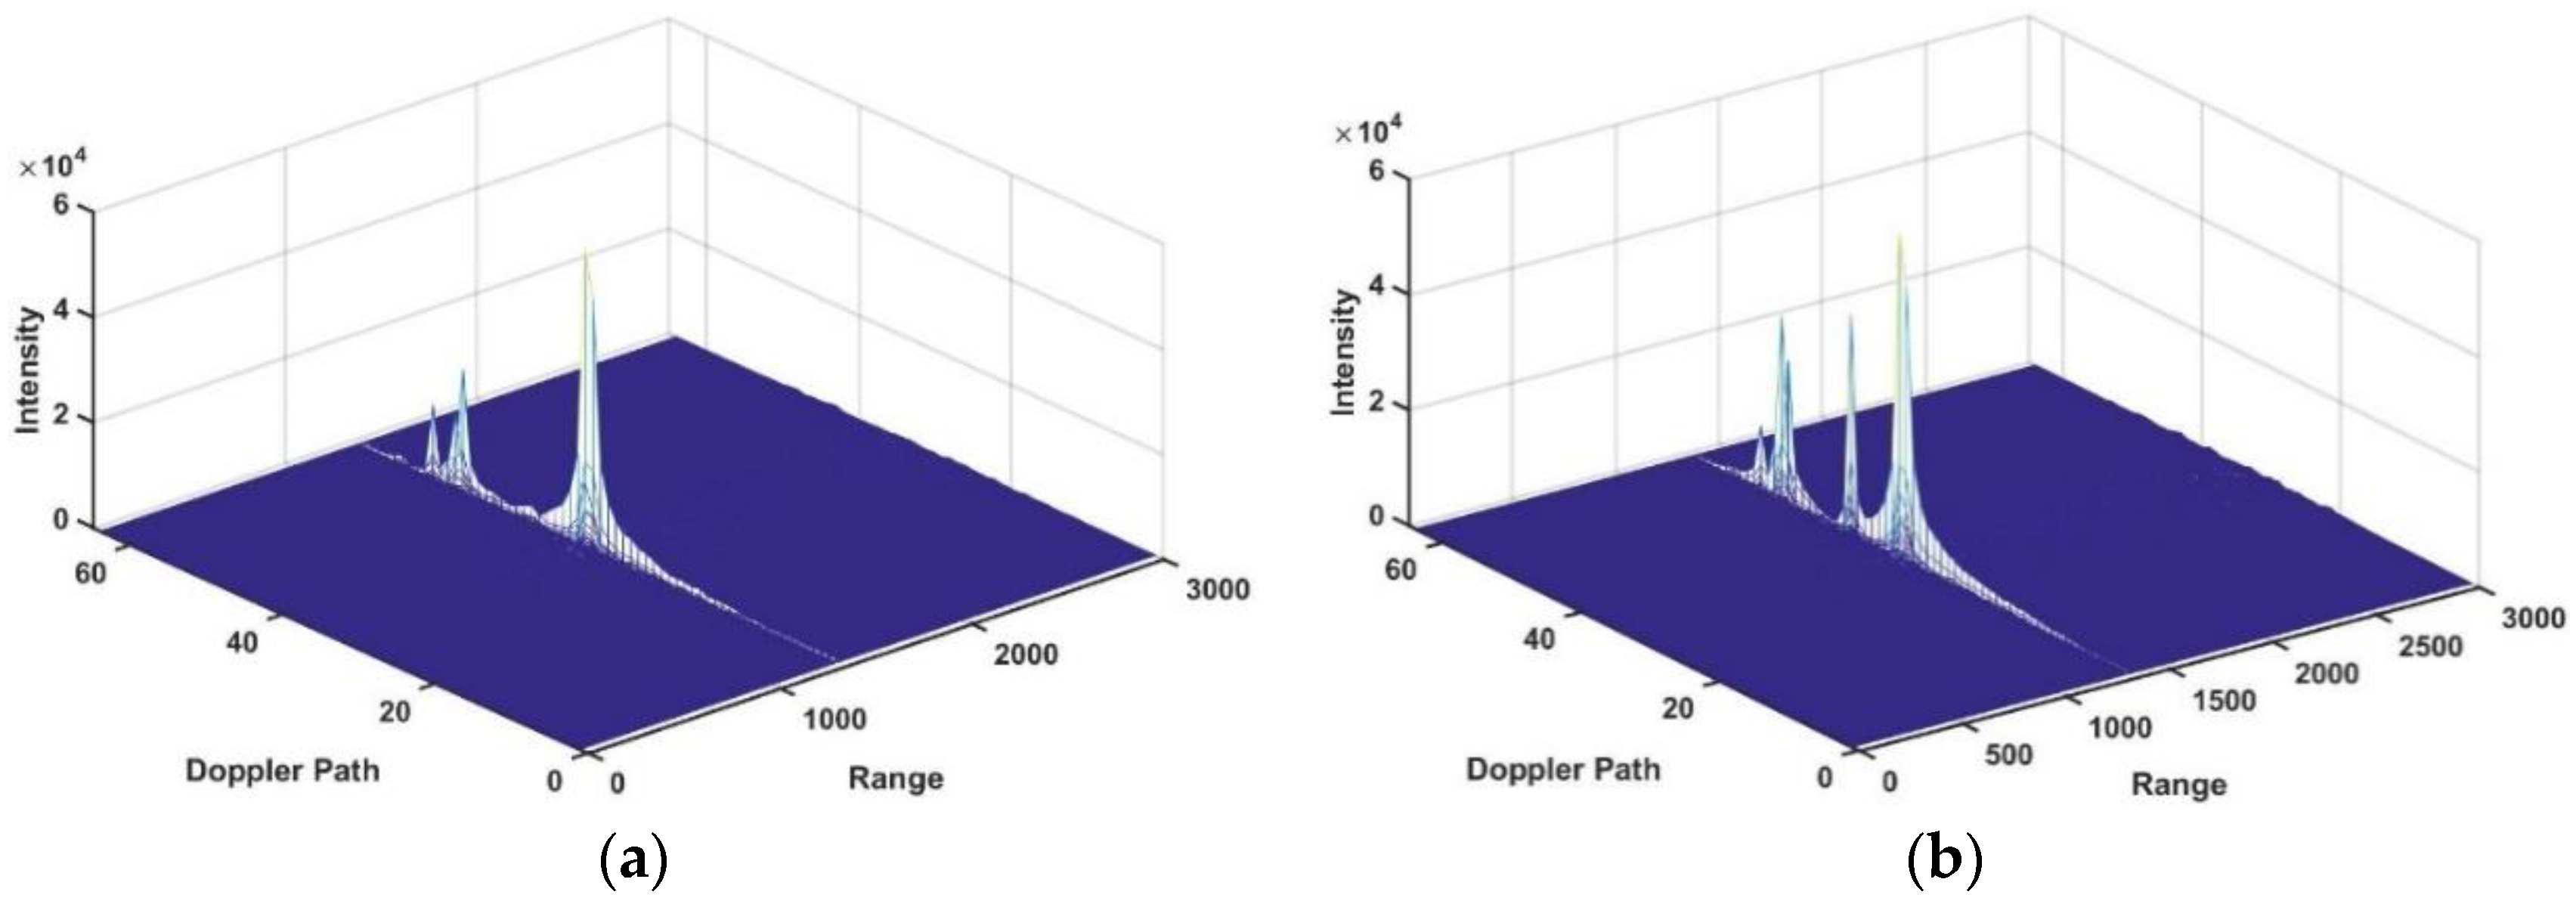
Classical signal processing methods like pulse compression, moving target identification (MTI), and moving target detection (MTD) are developed in the platform. These functionalities provide preliminary target detection capability for dynamic swarm targets. Figure 7 demonstrates range-doppler images after MTD processing for UAV swarms composed of four and six UAVs, respectively. UAVs are distributed within one range resolution cell or across multiple neighboring cells. The existing MTD method could basically distinguish different UAV velocities with a velocity resolution of 0.31 m/s. Therefore, the range-doppler images in Figure 7 are only presented for functionality demonstration; interferences from clutter signals are much more intensive, and the multimodality property of dynamic UAV swarm proposes great challenges for detection threshold determination and velocity distinguishment.

3.2. Target Detection Performance Evaluation

Two representative CFAR algorithms (CA-CFAR and OS-CFAR) are applied as a mutual comparison to validate the proposed method. Another advanced signal processing method from [32] is also reproduced for mutual verification. Detection performances for single and swarm UAVs are evaluated, respectively.

3.2.1. Single UAV Detection

Flight trajectories of a single dynamic UAV are generated according to real UAV flight data. Monte Carlo simulations generate massive detection results for performance evaluation. Figure 8 demonstrates probabilities of detection for four methods using the same track dataset. A total of 500 groups of detection results are generated at each SCR level. All detection performances are positively correlated with SCR levels. The high complexity of the K-distribution clutter signals limits the overall detection performance. The results in Figure 8 indicate that the new method presents a comparable detection performance within conventional detection algorithms. Its applicability is guaranteed for complicated surveillance problems.

3.2.2. UAV Swarm Detection

Swarm target flights involve cooperations of multiple units. Their formulations and modalities are time-variant. If a swarm target flies along a simple trajectory and maintains similar relative positions, its detection is easier for existing radar systems. Clustered UAVs generate one or multiple large targets in the radar viewpoint, and the corresponding signal intensity is larger than a single UAV. In this case, the detection performance is better. However, this simple flight strategy is not comprehensive enough to include all scenarios for practical dynamic UAV swarms.
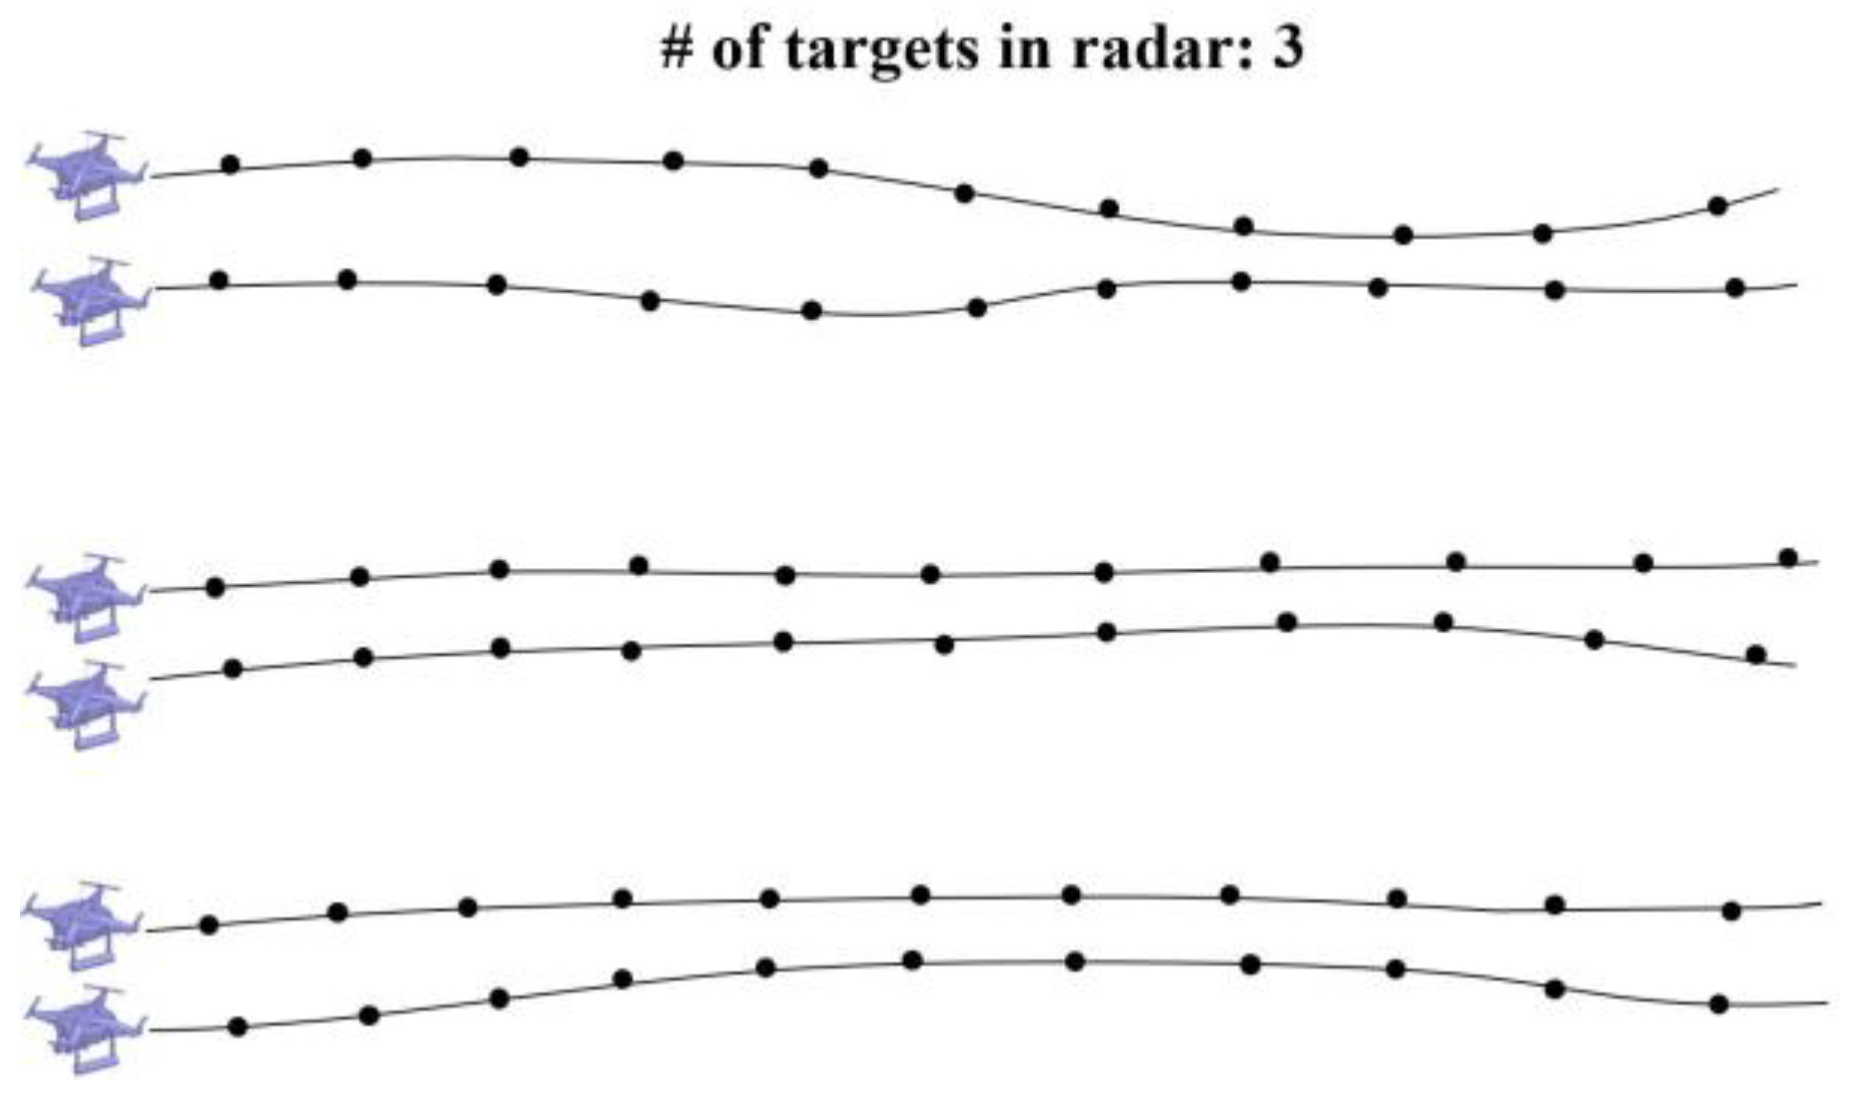
Challenges of swarm target detection come from their multimodality. Since each swarm unit can move independently, swarm target trajectories and modalities have large degrees of freedom. The simplest flight mode is a group of UAVs flying in the same direction while maintaining a smooth modality variation and formulation. Figure 9 demonstrates two-dimensional flight trajectories for six UAVs with a simple flight strategy, and the track plots are marked. Six UAVs are divided into three groups; three targets are present in the radar as two neighboring UAVs are within the same radar resolution volume. Figure 10 presents probabilities of detections under different SCR levels. The problem in Figure 9 is a representative group target detection problem, and the OS-CFAR algorithm possesses performance advantages. In this scenario, detection performance differences are minor. However, this single-modality flight is insufficient to cover all practical UAV swarm motion characters comprehensively.
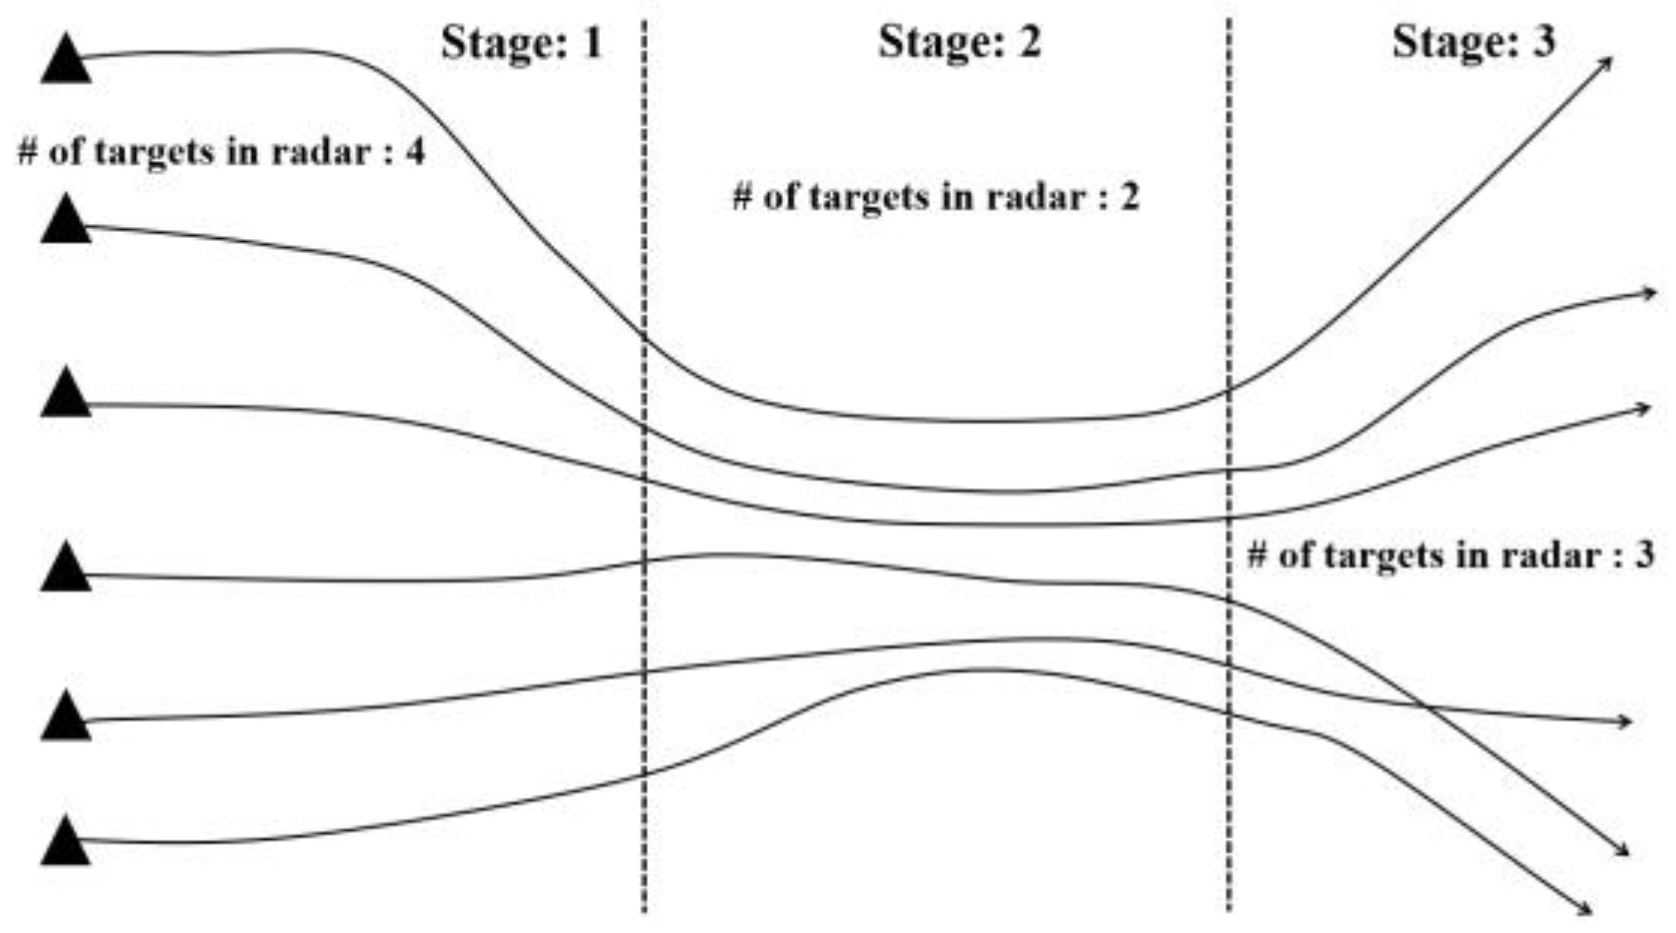
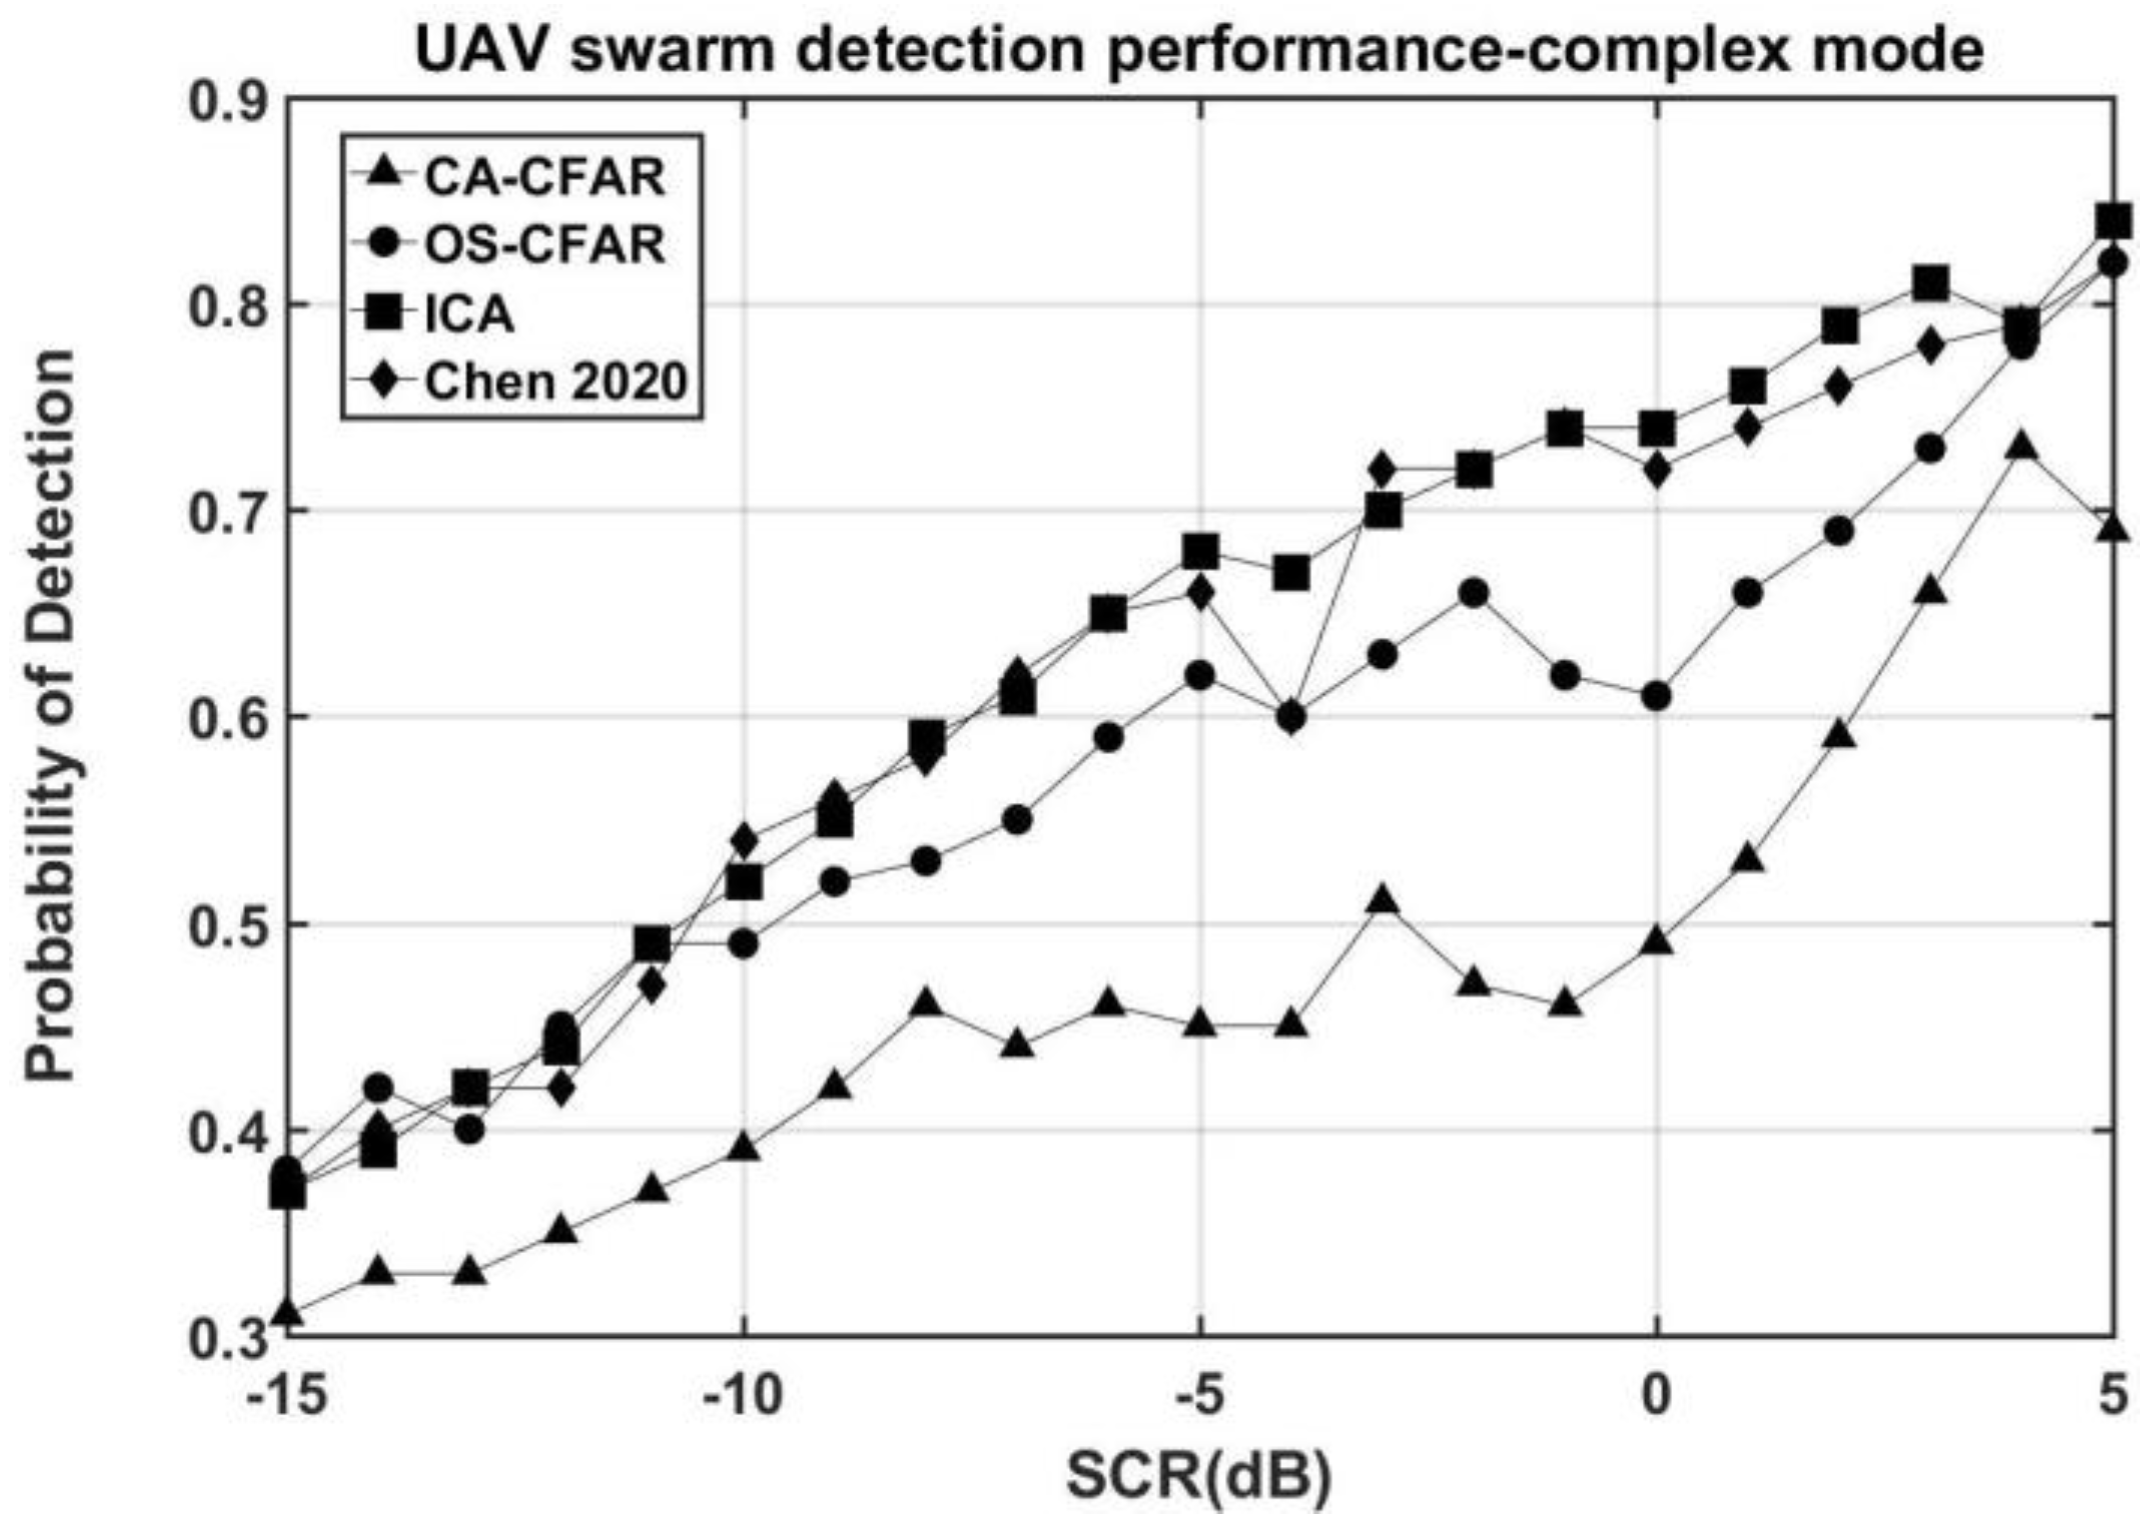
Figure 11 presents a more complicated multimodality flight plan, including three stages, i.e., clustering–grouping–spreading. This plan is designed to verify the target detection capability under complicated modality variations, which result in swarm unit number ambiguity in radar. The swarm unit numbers in three stages are 4, 2, and 3. Detection probabilities in Figure 12 are averaged values from three stages. The fast swarm reformulation brings more challenges for CFAR-based solutions. The high complexity of the multimodality flight pattern results in detection performance fluctuation. The OS-CFAR algorithm facilitates the multiple target detection problem with slight advantages over CA-CFAR, but possesses instability due to modality variation. The advanced target detection method from [32] presents better accuracy and stability. In contrast, the new detector demonstrates advantages for its robustness to swarm modality variations, and PD levels are comparable with [32]. This is due to the mechanism that the detection threshold of the method is independent on single- or multiple-target detection properties in reference cells. Detection advantages become more distinctive at higher SCR levels, and PD curves are smoother than conventional algorithms. Moreover, unlike conventional detection methods, which define the detection threshold based on the signal amplitude, the new method uses cICA to characterize differences between the target and clutters at higher dimensional spaces with more distinctive differences. This enables better detection performance.

4. Discussion

4.1. Quantification Strategy Reasonability Discussion

This section discusses the reasonability of the swarm quantification strategy. In the swarm target, mutual electromagnetic coupling effects among swarm units are weak, and signals of each swarm unit could be approximated as independent. Theoretically, cICA should be capable of extracting independent sources, and the number of sources has a close relevance with swarm unit numbers. However, it should be noted that swarm unit numbers are unknown in signal collections for noncooperative targets, and the CPI number definition does not have any prior knowledge support. This means that CPI numbers should be larger than swarm unit numbers. This paper takes an oversaturation strategy by defining the CPI number as N = 12, while it configures swarm unit numbers smaller than 12. For a swarm target with unit number M (M < N), an ideal case is that M independent components correspond to UAV unit signal contributions, and the rest of N-M independent components come from unknown sources like environmental clutters and noises.
To verify this more clearly, two groups of experiments are designed. Radar signals are generated without clutter interferences. This is intended to construct an ideal environment to verify cICA in independency extraction.
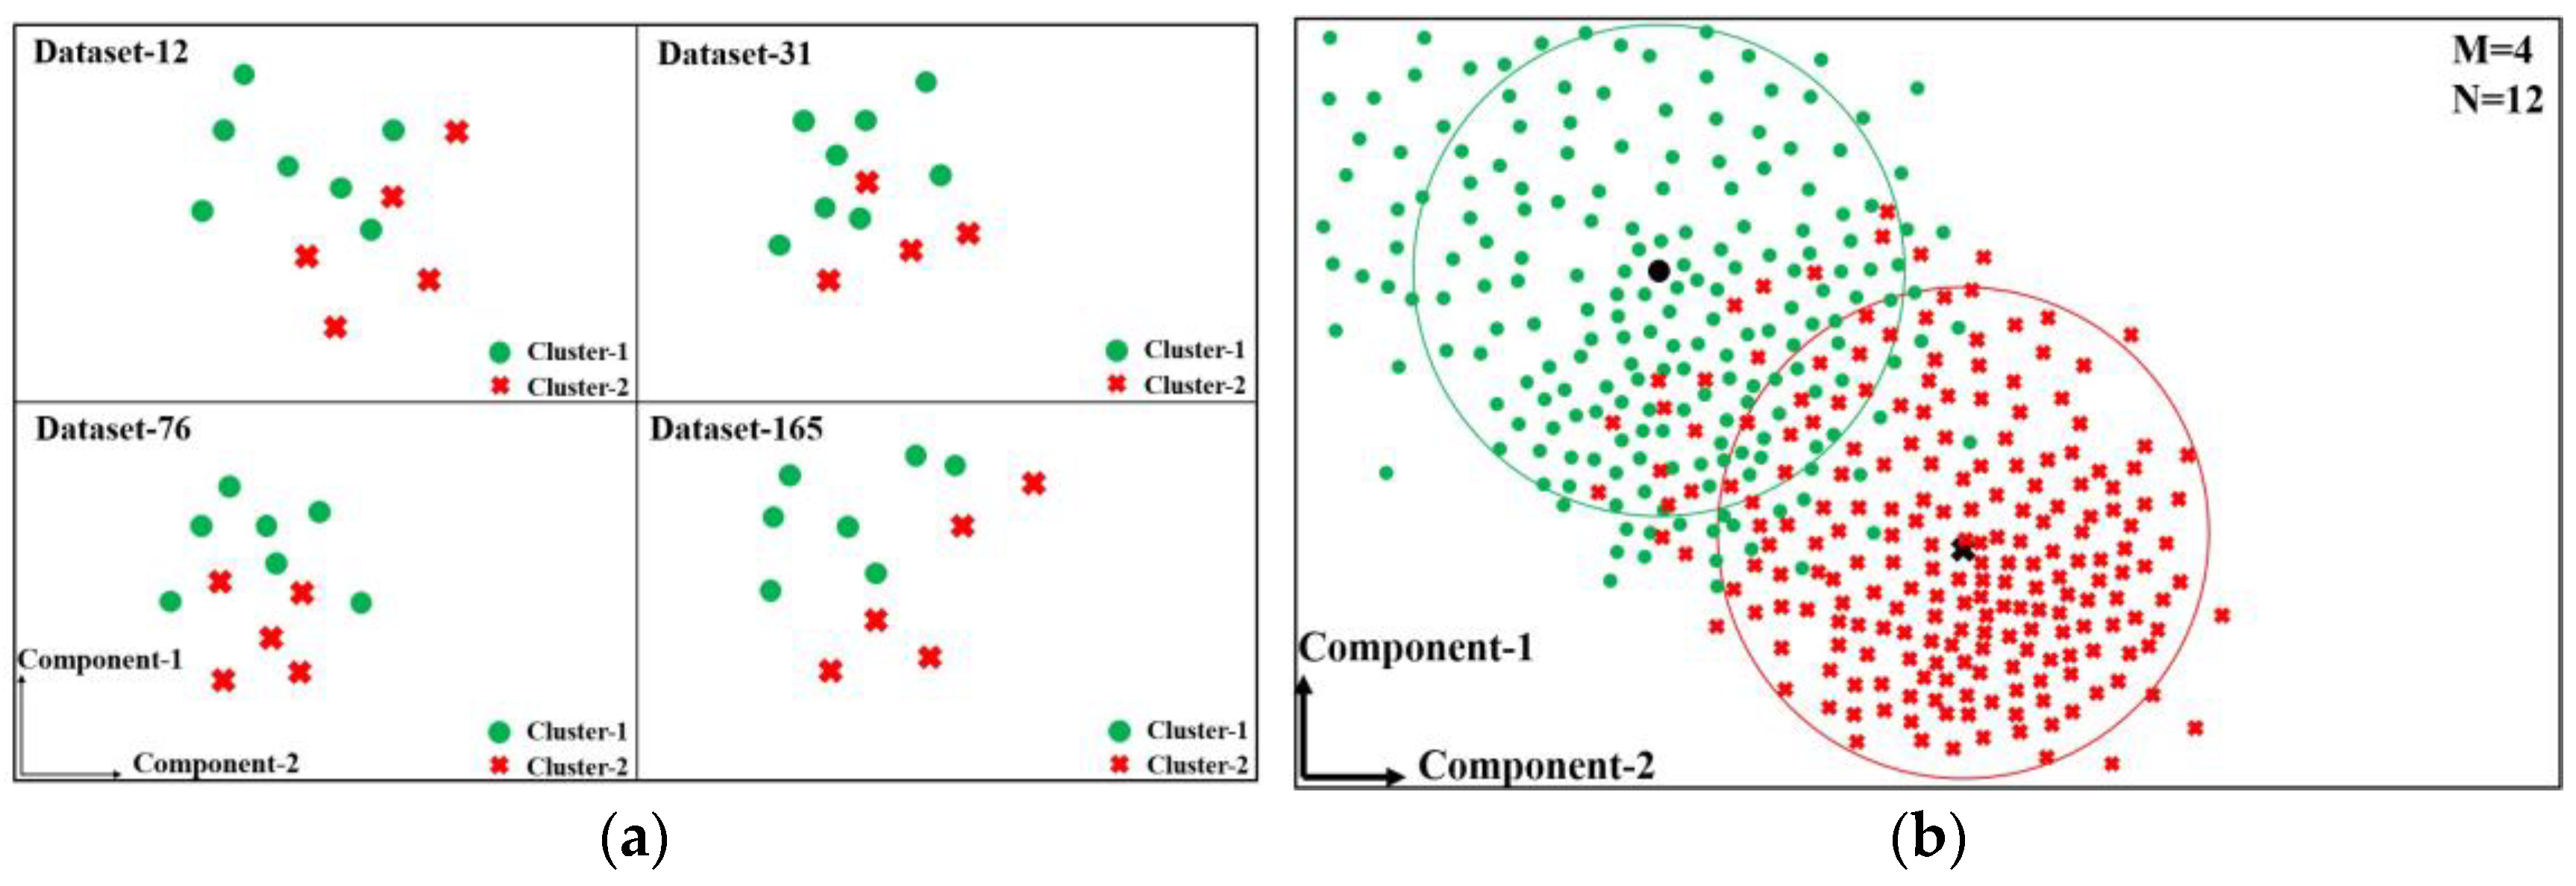
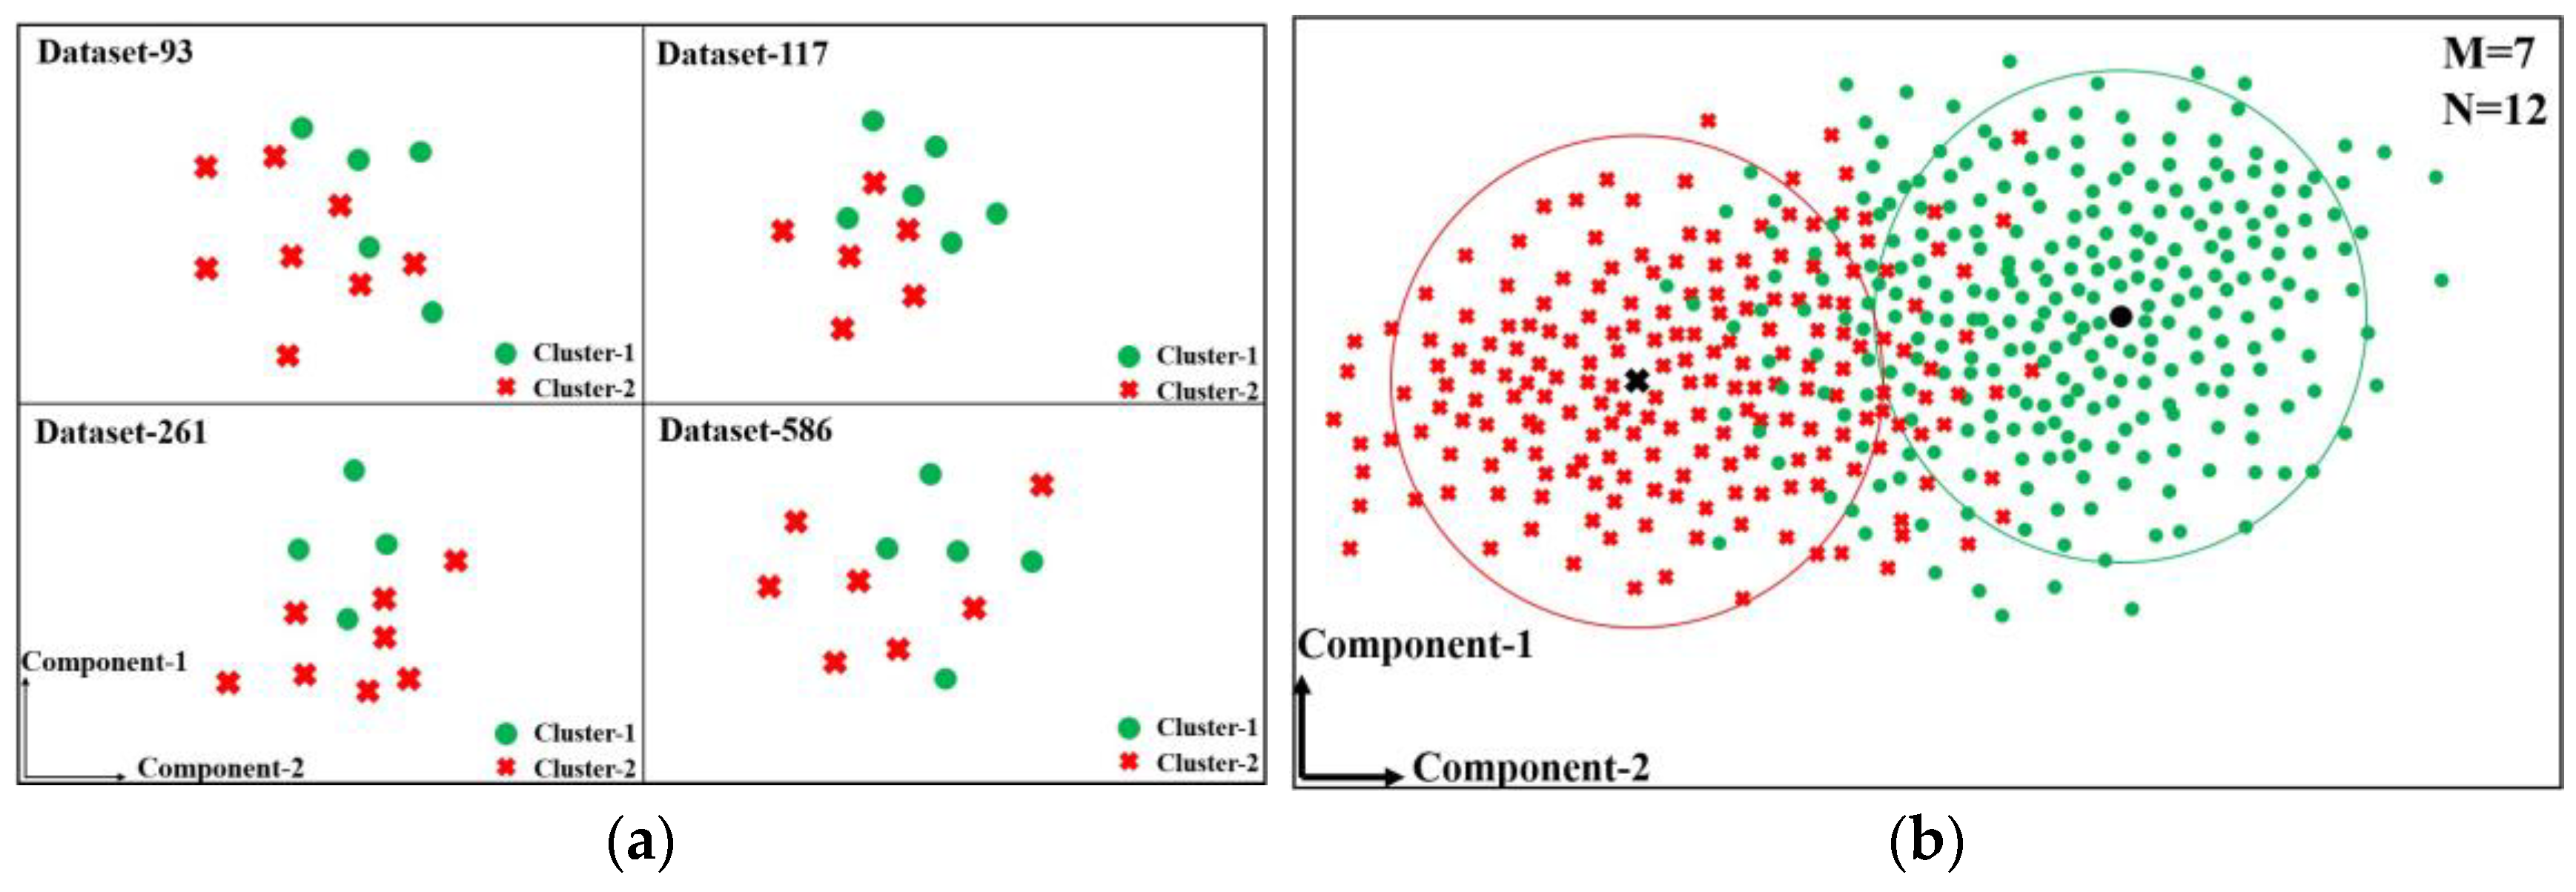
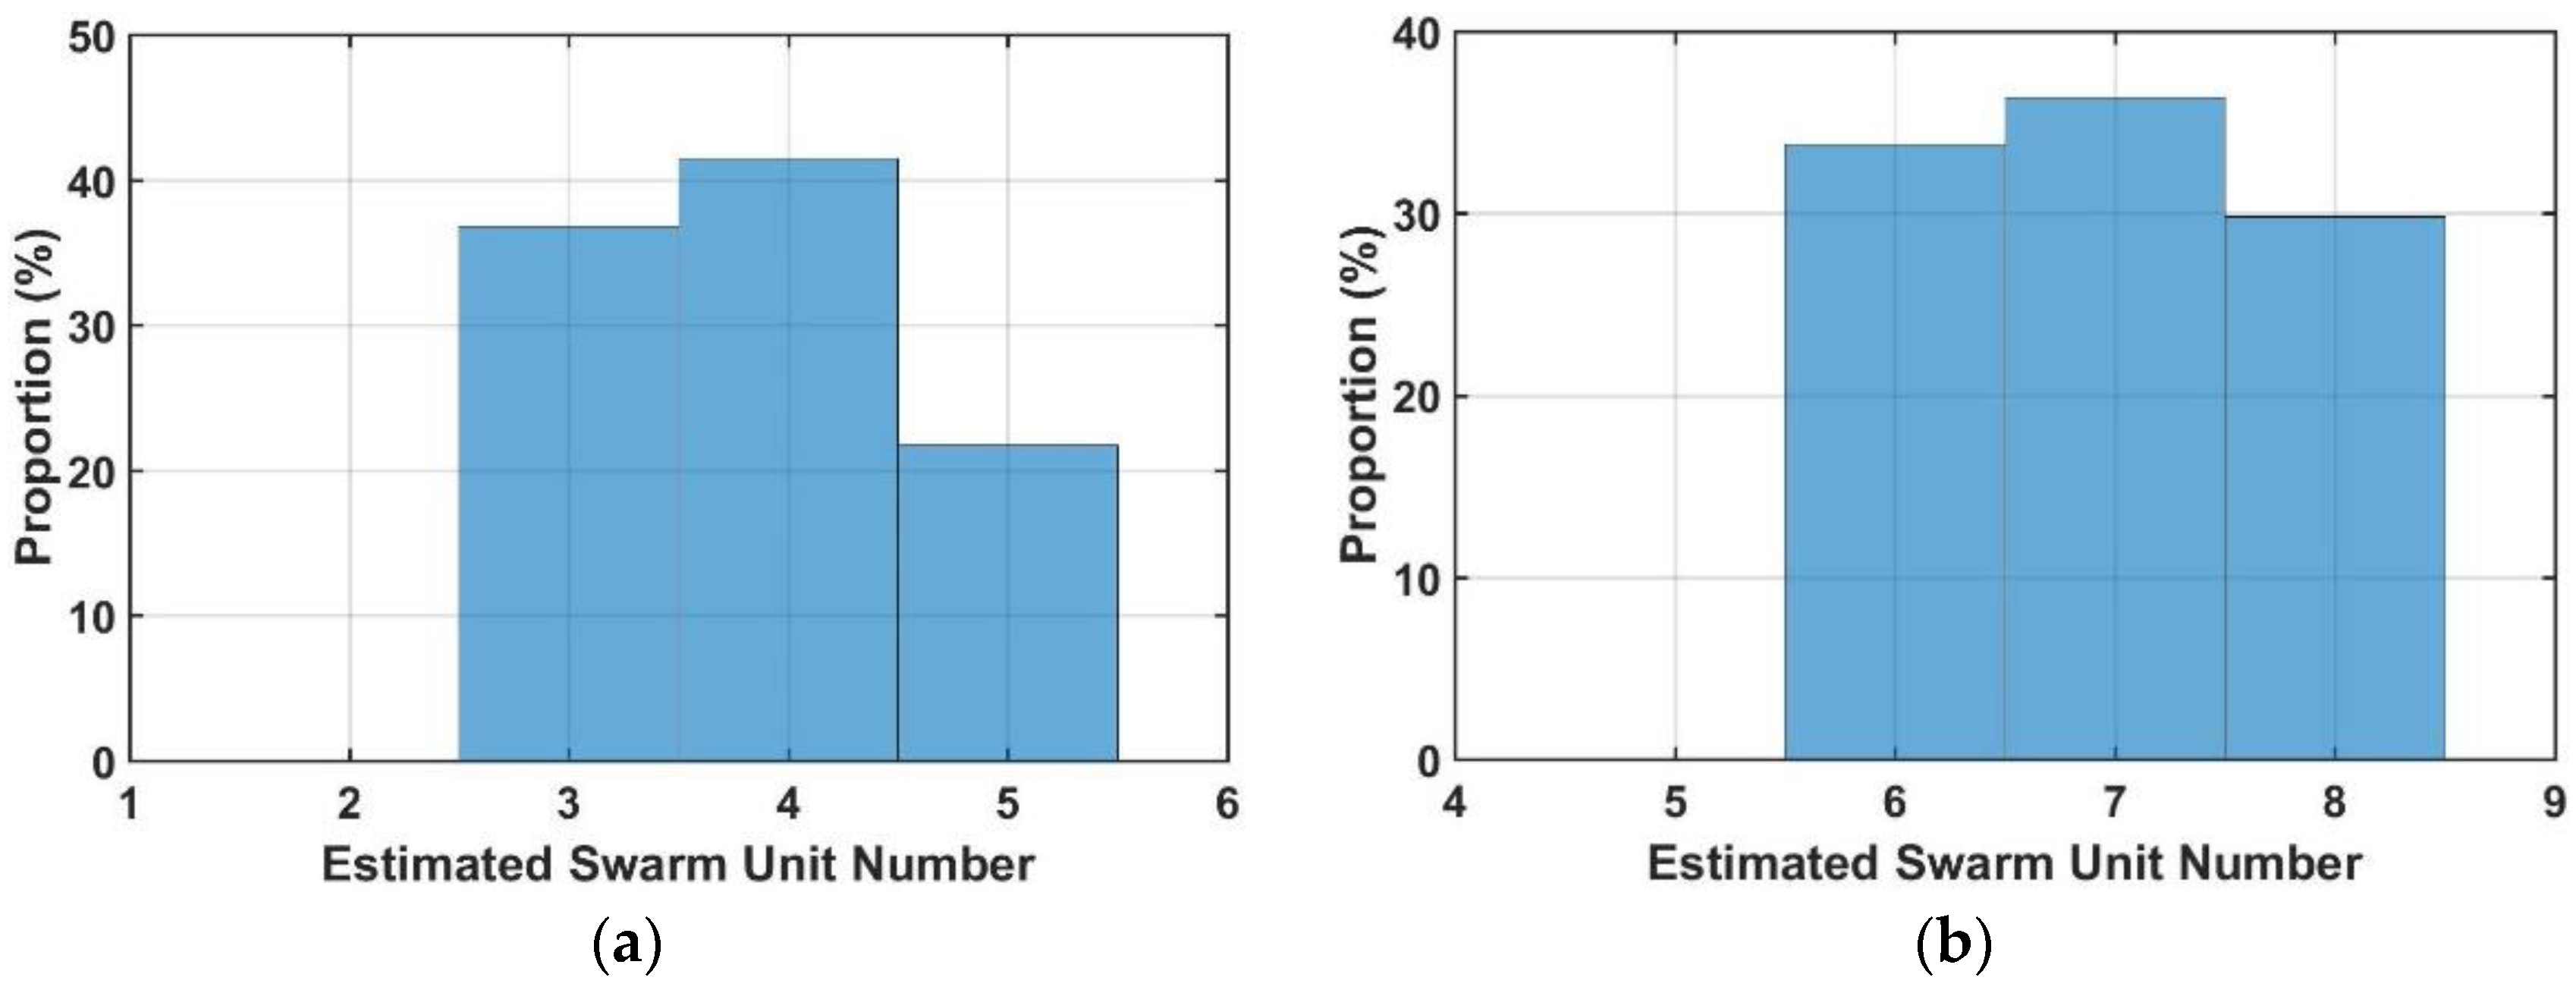
Swarm unit numbers for two groups of experiments are M = 4 and M = 7, with a CPI number of N = 12. The cICA solver is applied with 12 extracted independent components. Theoretically, there should be M independent components related with swarm unit contributions, and the rest of the N-M components are unknown. Therefore, a k-means algorithm is applied on these N independent components to observe if two effective clusters can be generated. A total of 500 sets of signals are generated for each group of experiments. The principal component analysis (PCA) method is applied on independent components to project independent components into a two-dimensional plane, as in Figure 13 and Figure 14. Figure 13a and Figure 14a present one set of arbitrarily selected signal clustering results. Two clusters are distinctive, and the number of cluster units is close to the swarm unit numbers. In contrast, Figure 13b and Figure 14b demonstrate all cluster units, black symbols denote cluster centers. The clustering effect is more distinctive with more abundant sample supports. Figure 15 demonstrates histograms of cluster unit numbers for two groups of experiments. Estimated swarm unit numbers are basically distributed around real swarm unit numbers with Gaussian distribution models. This indicates that the cICA extraction and clustering strategy could give reasonable swarm unit number estimations. This provides confidence in experiments with clutter signal interferences.

4.2. Swarm Target Quantification Performance

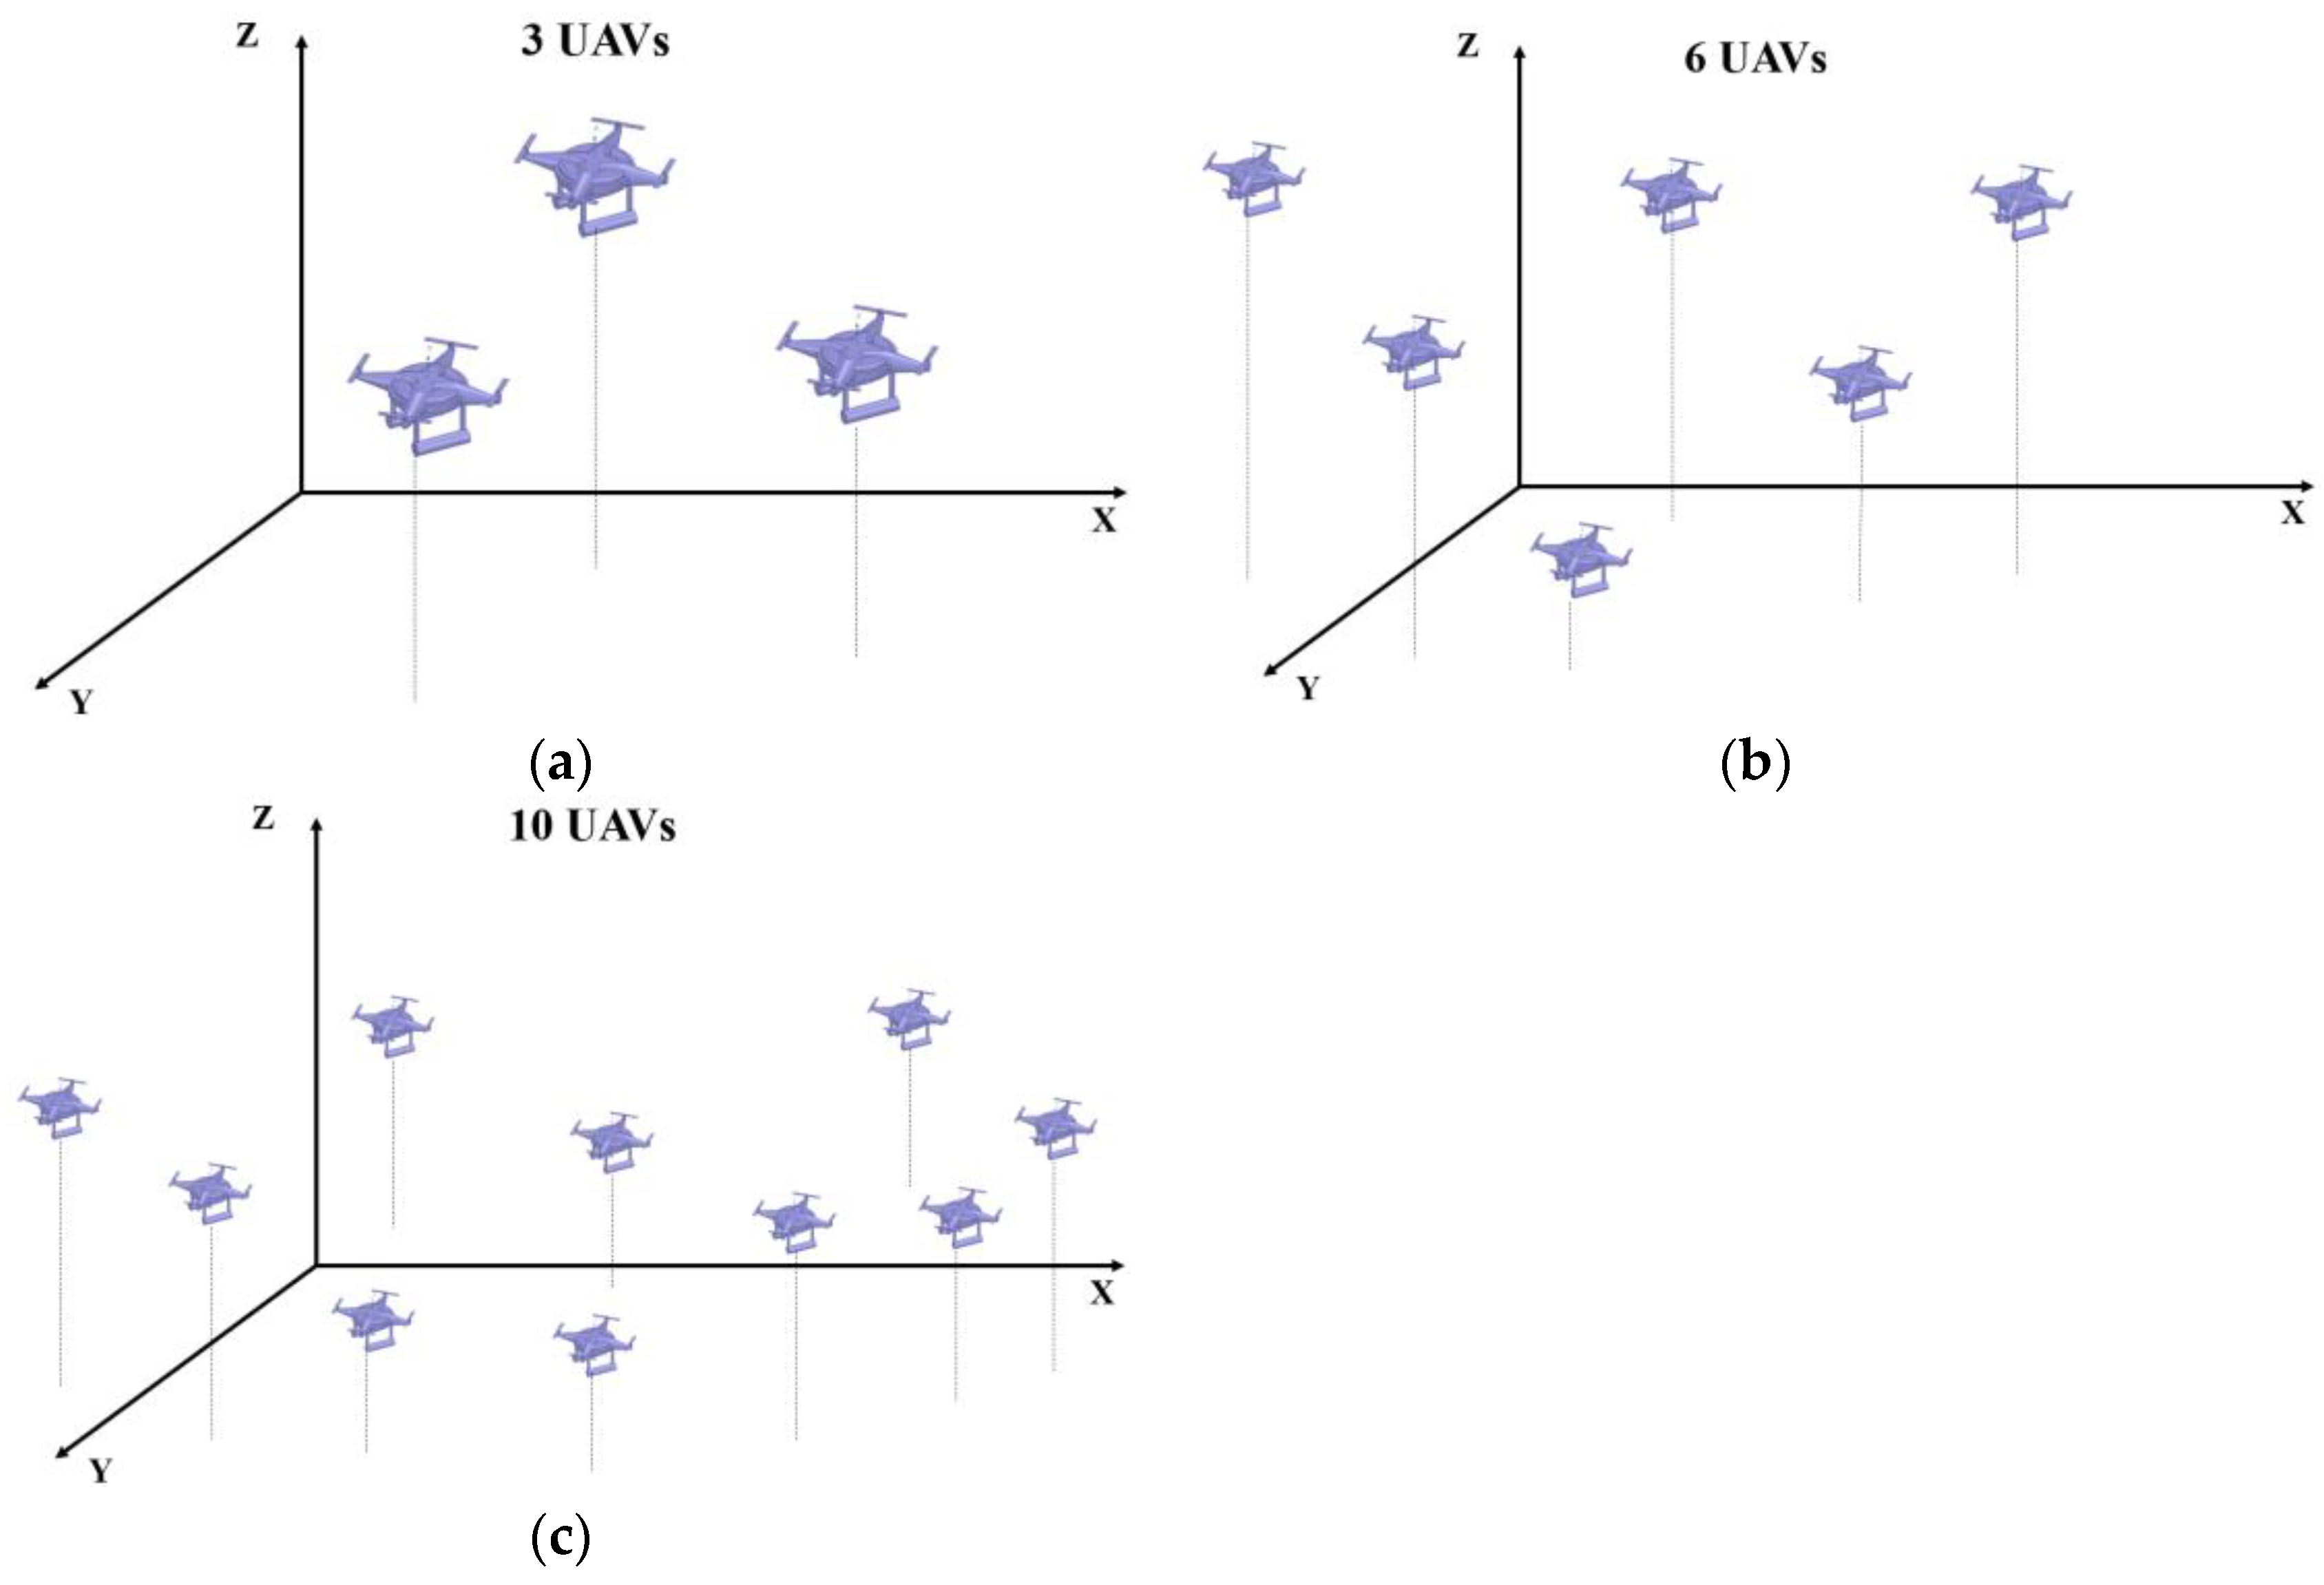
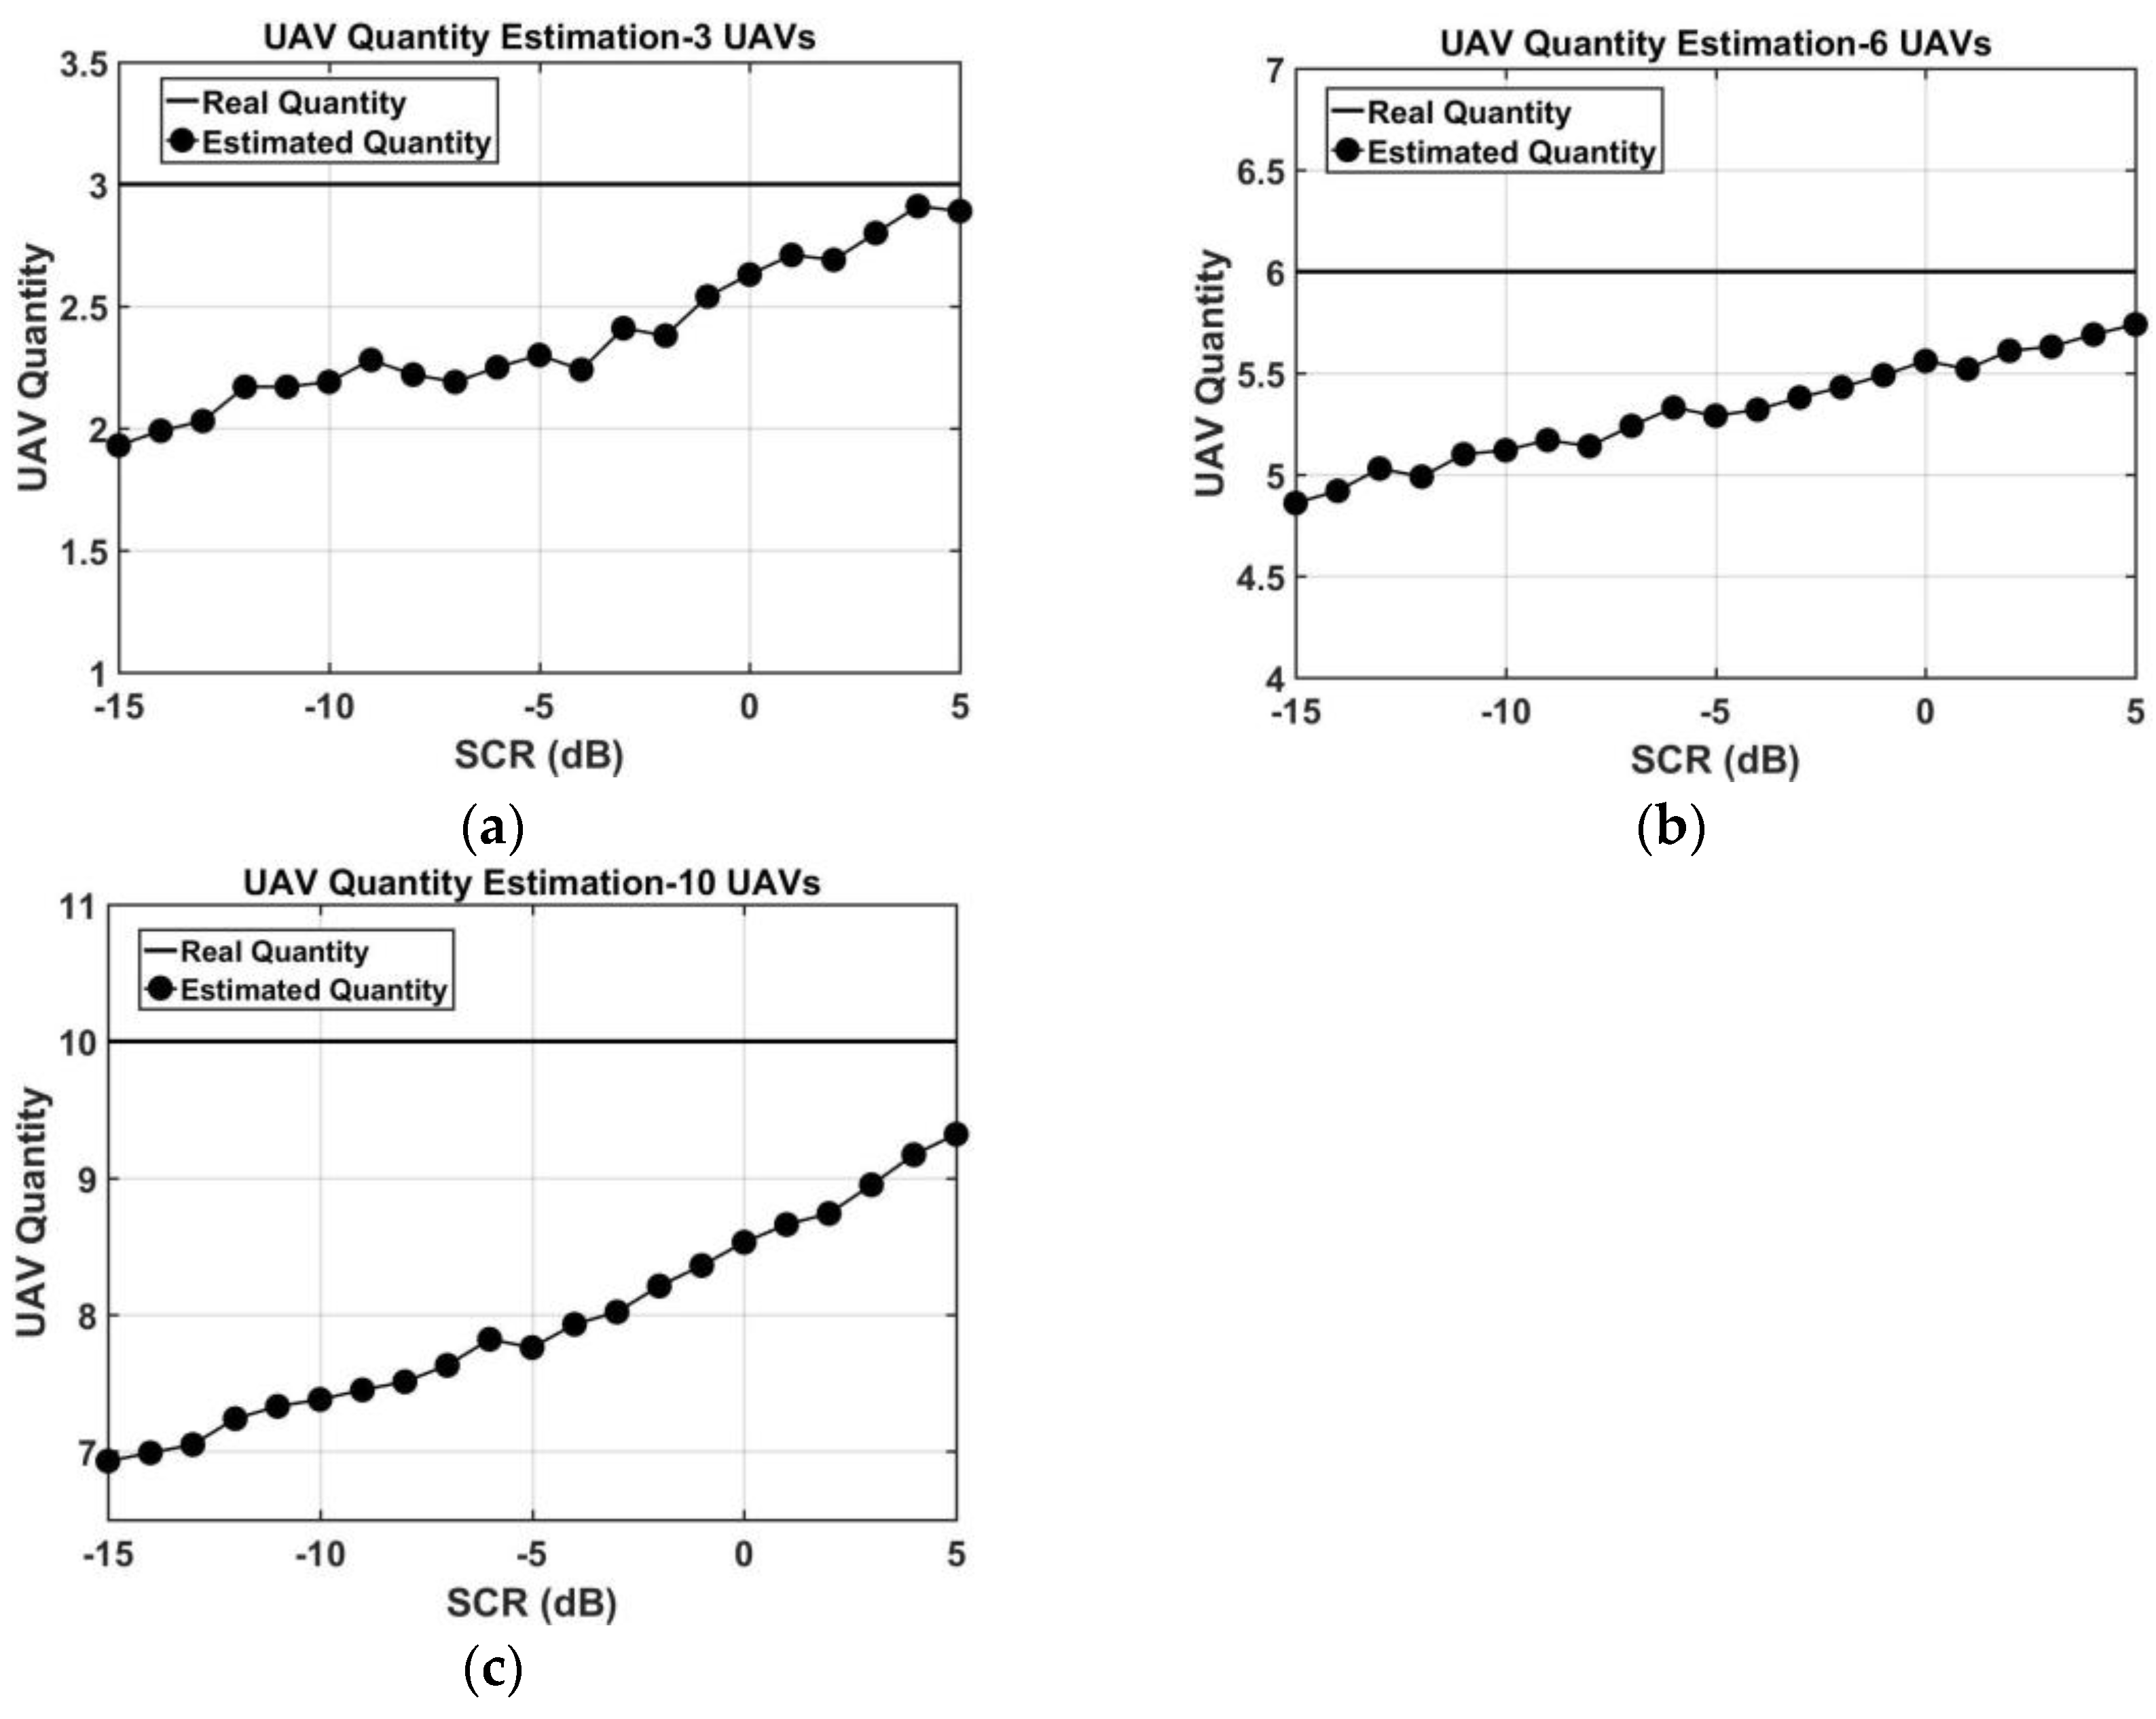
This section presents specific swarm quantification performance evaluation results for a dynamic drone swarm target. Figure 16 presents three representative swarm modality snapshots. Inter-UAV spacings are randomly varied in horizontal and vertical dimensions within [4,8] meters. Clutter signals are generated to cover an SCR range within [−15,5] dB. The required number of continuous detections is 20. This configuration is reasonable since densely formulated UAV swarms usually reflect much larger RCS than single ones with larger SCR and better detection performance. Quantification results at different SCR levels are presented in Figure 17. Estimated quantities are averaged values from the results of 100 modalities. Real swarm unit numbers are presented as a benchmark. Numerical deviations are within acceptable ranges, and the accuracy is positively correlated with SCR. This is convincible, as the better detection performance is a necessary support for more accurate UAV quantity estimation with fewer clutter interferences.
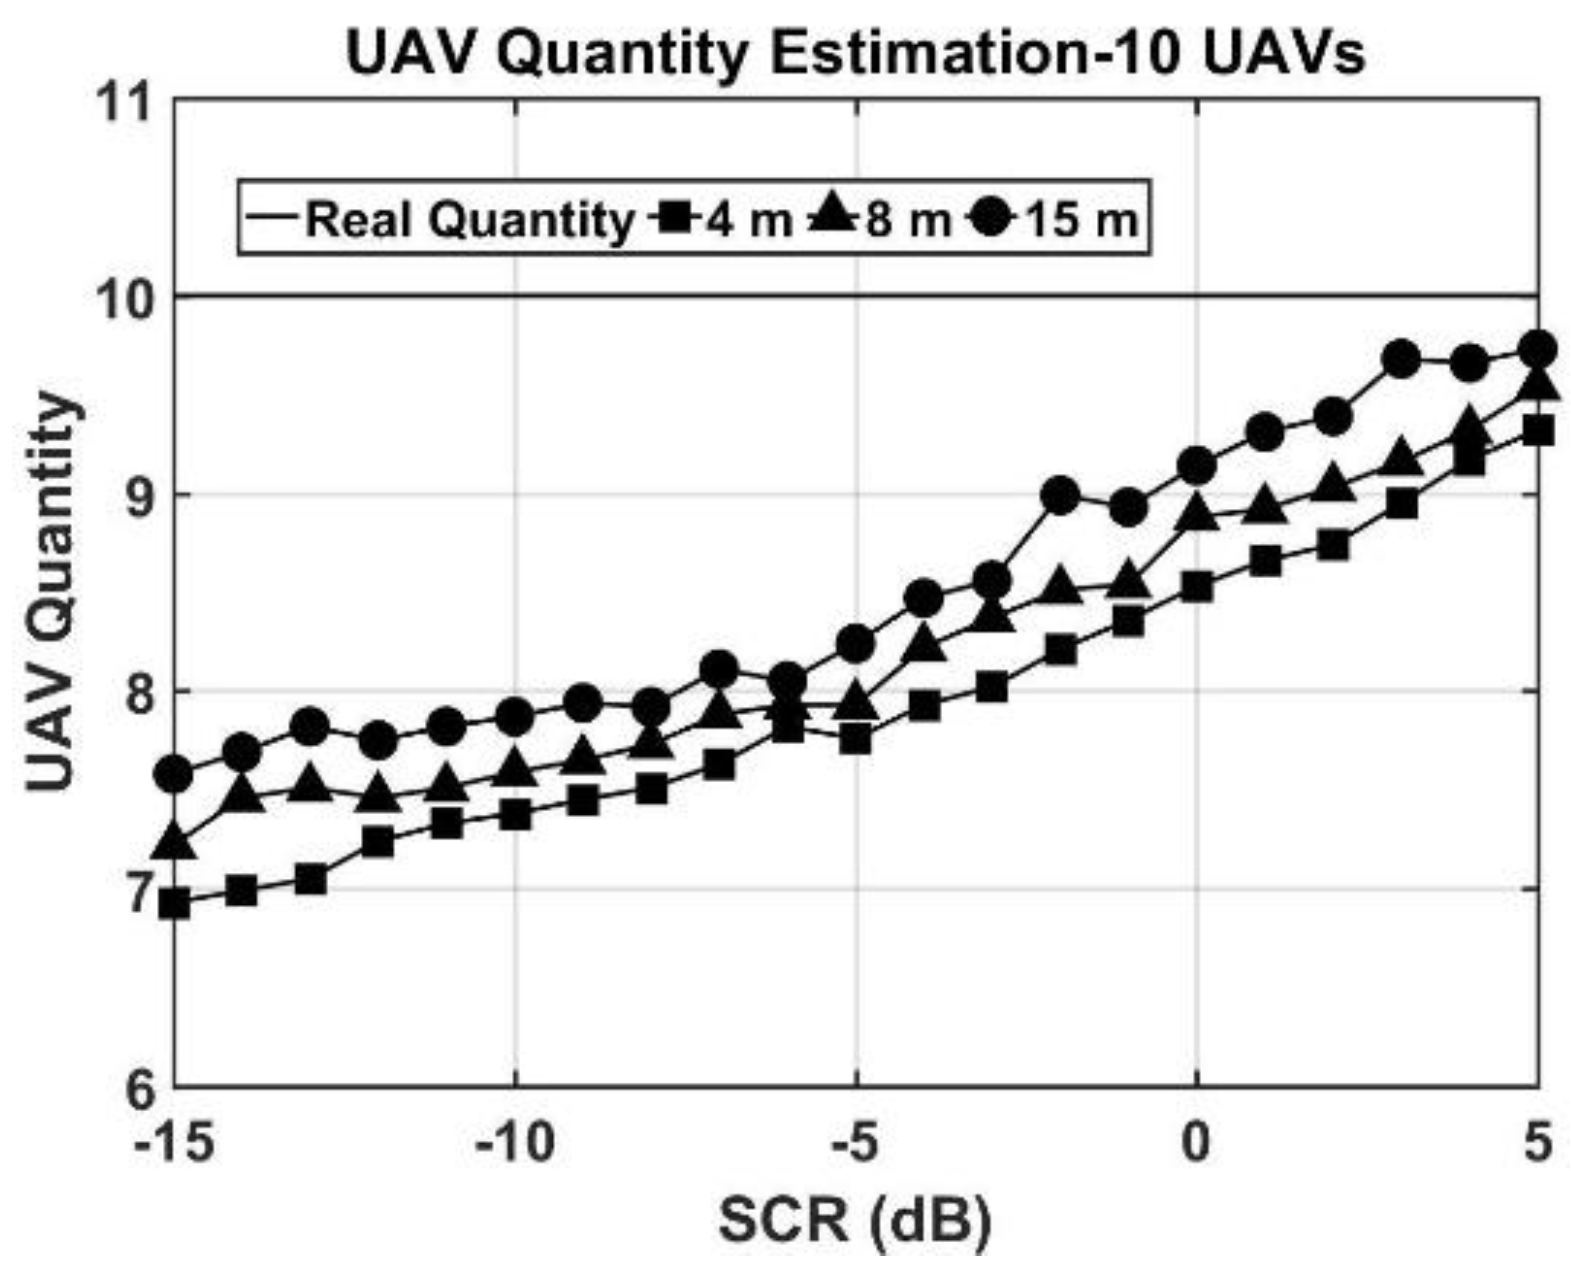
Massive quantification results from Monte Carlo simulations reveal a positive correlation relevance between quantification accuracy and inter-UAV spacings. This character is verified by a particular experiment. A swarm target composed of 10 UAVs is designed with averaged spacings of 4, 8, and 15 m. Quantification results are presented in Figure 18. A better quantification performance is observed from larger inter-UAV spacings.
This positive correlation is related with signal independency among UAVs. When radar signals are applied on a swarm target, each swarm unit scatters signals in an omnidirectional pattern. Signal couplings among swarm units grow weaker with increasing spacings, which elevates signal independencies. Since the integration of swarm unit signals is equivalent to a signal mixture, the increasing independency is favorable for ICA. This explains the better quantification estimations for swarm targets with sparse configurations. Moreover, it should be noted that there exists the case of an estimated quantity larger than the real quantity. The proportion of this mistake is low and the overall estimation accuracy is not influenced prominently. This over-quantifying is probably from the divergence in demixing matrix generation. A particular database collected from over-quantifying mistakes could be built for analysis to optimize the robustness of the cICA algorithm.

4.3. Efficiency Discussion

The method demonstrates its feasibility in swarm target detection. The quantification estimation further enriches radar surveillance functionality. However, as the kernel of the method, the cICA algorithm has its efficiency limitation. Both detection and quantification procedures require parameter estimations from cICA. In contrast, CFAR algorithms require much fewer resources. Efficiency comparisons among CA-CFAR, OS-CFAR, the advanced signal processing method in [32], and the new method are discussed according to computation time and RAM consumption aspects, as demonstrated in Table 1. The computation time does not include the quantity estimation procedure. The RAM consumption also includes the MATLAB simulation platform operation. Two CFAR algorithms have similar computation times and RAM consumptions. The advanced signal processing method from [32] also consumes limited resources to guarantee its application significance.
Compared with other methods, the new method has an efficiency bottleneck due to its adoption of the cICA algorithm. Besides detection, the quantification procedure needs cICA supports as well. The precondition indicates that the cICA algorithm needs to process data from N continuous CPIs. Therefore, the computation complexity of cICA is critical in efficiency evaluation. Most ICA algorithms consist of two main steps: the pre-processing stage, including centering and whitening, and a second stage, being an optimization loop. The whitening stage includes the covariance matrix calculation, the eigenvalue decomposition (ED), and the computation of whitened signals, where the ED dominates the computational complexity through the entire pre-processing stage. The optimization stage is primarily an iterative loop consisting mainly of calculating the gradient matrix of the cost function and updating the separation matrix via matrix exponential. According to [41], the numerical complexity of cICA could be approximated as O(n2), in which n is the dimension of signals. In contrast, the numerical complexities for other three detection methods are basically independent of signal dimension, which could be approximated as O(1). This is the origin of their efficiency differences.
Therefore, even though the involvement of cICA characterizes swarm target signal independency effectively with distinctive detection and quantification functionality, the efficiency problem cICA is still a bottleneck, limiting its applicability. A more efficient cICA solver is critical for its applicability. Moreover, the method’s robustness on more complicated clutter backgrounds needs more validation work.

5. Conclusions

Swarm formulations are new derivations of UAVs with important application significance. Radar systems require more comprehensive and refined surveillance capabilities for noncooperative swarm targets. Dominant challenges focus on detection stability and quantification capability under environmental interferences. Inspired by the coherent signal integration essence from swarm target signals, relevance between the swarm target signal and the independent component analysis principle is explored. This paper introduces a swarm target detection and quantification method based on the cICA algorithm and signal independency characterization. Detection thresholds are statistically extracted from shape parameters of clutter signals decomposed by cICA. The swarm quantification procedure is activated based on continuous target detections. A clustering procedure is applied on independent components for swarm unit number estimations. A UAV swarm radar signal simulation platform is designed for validation. Different UAV swarm flight plans are designed for evaluation. Compared with existing detection methods, the new method is more stable for multimodality swarm target detection. The quantification functionality is verified from multiple aspects with acceptable numerical deviations. A particular experiment is designed to verify the quantification reasonability. The quantification accuracy relevance with swarm configurations is further explored. Inter-UAV spacings and quantification accuracy present positive correlation relevance, which is consistent with UAV signal independency. The results indicate that the new method provides a new solution to refined surveillance of swarm targets. However, its efficiency bottleneck limits its application significance. An efficient cICA solver and intelligent online–offline integration strategies will be involved in our future work to elevate its applicability.

Author Contributions

Conceptualization, J.L. and W.-S.C.; methodology, J.L. and Q.-Y.X.; software, J.L. and M.S.; validation, W.-S.C.; formal analysis, M.S. and W.-S.C.; investigation, W.-S.C.; resources, J.L. and W.-S.C.; data curation, Q.-Y.X.; writing—original draft preparation, J.L. and Q.-Y.X.; writing—review and editing, M.S. and W.-S.C.; visualization, M.S.; supervision, W.-S.C.; project administration, J.L. and W.-S.C.; funding acquisition, J.L. and W.-S.C. All authors have read and agreed to the published version of the manuscript.

Funding

This paper is supported by National Natural Science Foundation of China (NSFC) under Grant 62371018 and 62361006, and National Natural Science Foundation of China (NSFC) and Civil Aviation Administration of China (CAAC) (U2133216), National Key Research and Development Program (2023YFB2604103).

Data Availability Statement

The original contributions presented in the study are included in the article, further inquiries can be directed to the corresponding author/s.

Conflicts of Interest

The authors declare no conflicts of interest.

References

  1. Ezuma, M.; Anjinappa, C.K.; Funderburk, M.; Guvenc, I. Radar Cross Section Based Statistical Recognition of UAVs at Microwave Frequencies. IEEE Trans. Aerosp. Electron. Syst. 2022, 58, 27–46. [Google Scholar] [CrossRef]
  2. Shakhatreh, H.; Sawalmeh, A.H.; Al-Fuqaha, A.; Dou, Z.; Almaita, E.; Khalil, I.; Othman, N.S.; Khreishah, A.; Guizani, M. Unmanned Aerial Vehicles (UAVs): A Survey on Civil Applications and Key Research Challenges. IEEE Access 2019, 7, 48572–48634. [Google Scholar] [CrossRef]
  3. Pandey, G.K.; Gurjar, D.S.; Nguyen, H.H.; Yadav, S. Security Threats and Mitigation Techniques in UAV Communications: A Comprehensive Survey. IEEE Access 2022, 10, 112858–112897. [Google Scholar] [CrossRef]
  4. Yun, J.; Anderson, D.; Fioranelli, F. Parametric Investigation on Simulated Staring FMCW Radar for Anti-Drone Swarms. In Proceedings of the 2020 IEEE Radar Conference (RadarConf20), Florence, Italy, 21–25 September 2020; pp. 1–6. [Google Scholar] [CrossRef]
  5. Chen, W.; Meng, X.; Liu, J.; Guo, H.; Mao, B. Countering Large-Scale Drone Swarm Attack by Efficient Splitting. IEEE Trans. Veh. Technol. 2022, 71, 9967–9979. [Google Scholar] [CrossRef]
  6. Li, Y.; Fu, M.; Sun, H.; Deng, Z.; Zhang, Y. Radar-Based UAV Swarm Surveillance Based on a Two-Stage Wave Path Difference Estimation Method. IEEE Sens. J. 2022, 22, 4268–4280. [Google Scholar] [CrossRef]
  7. Johnson, Z.W.; Romero, R.A. Adaptive Beamsteering Cognitive Radar With Integrated Search-and-Track of Swarm Targets. IEEE Access 2021, 9, 50652–50666. [Google Scholar] [CrossRef]
  8. Easthope, P.F. Tracking Simulated UAV Swarms Using Particle Filters. In Proceedings of the IET Conference on Data Fusion & Target Tracking 2014: Algorithms and Applications, Liverpool, UK, 30 April 2014; p. 90. [Google Scholar] [CrossRef]
  9. Zheng, J.; Chen, R.; Yang, T.; Liu, X.; Liu, H.; Su, T.; Wan, L. An Efficient Strategy for Accurate Detection and Localization of UAV Swarms. IEEE Internet Things J. 2021, 8, 15372–15381. [Google Scholar] [CrossRef]
  10. Zhang, L.; Qiao, Z.; Xing, M.-D.; Yang, L.; Bao, Z. A Robust Motion Compensation Approach for UAV SAR Imagery. IEEE Trans. Geosci. Remote Sens. 2012, 50, 3202–3218. [Google Scholar] [CrossRef]
  11. Lee, W.-K.; Song, K.-M. Enhanced ISAR Imaging for Surveillance of Multiple Drones in Urban Areas. In Proceedings of the 2018 International Conference on Radar (RADAR), Brisbane, QLD, Australia, 27–31 August 2018; pp. 1–4. [Google Scholar] [CrossRef]
  12. Ritchie, M.; Fioranelli, F.; Borrion, H.; Griffiths, H. Multistatic micro-Doppler radar feature extraction for classification of unloaded/loaded micro-drones. IET Radar Sonar Navig. 2017, 11, 116–124. [Google Scholar] [CrossRef]
  13. Gong, J.; Yan, J.; Li, D.; Chen, R. Comparison of radar signatures based on flight morphology for large birds and small birds. IET Radar Sonar Navig. 2020, 14, 1365–1369. [Google Scholar] [CrossRef]
  14. Ciattaglia, G.; Iadarola, G.; Senigagliesi, L.; Spinsante, S.; Gambi, E. UAV Propeller Rotational Speed Measurement through FMCW Radars. Remote Sens. 2023, 15, 270. [Google Scholar] [CrossRef]
  15. Lee, D.-Y.; Lee, J.-I.; Seo, D.-W. Drone movement classification based on deep learning using micro-Doppler signature images. J. Adv. Mar. Eng. Technol. 2021, 45, 213–217. [Google Scholar] [CrossRef]
  16. Dale, H.; Baker, C.; Antoniou, M.; Jahangir, M.; Atkinson, G.; Harman, S. SNR-dependent drone classification using convolutional neural networks. IET Radar Sonar Navig. 2021, 16, 22–33. [Google Scholar] [CrossRef]
  17. Roldan, I.; del-Blanco, C.R.; Duque de Quevedo, Á.; Ibañez Urzaiz, F.; Gismero Menoyo, J.; Asensio López, A.; Berjón, D.; Jaureguizar, F.; García, N. DopplerNet: A convolutional neural network for recognising targets in real scenarios using a persistent range–Doppler radar. IET Radar Sonar Navig. 2020, 14, 593–600. [Google Scholar] [CrossRef]
  18. Chen, X.; Guan, J.; Liu, N.; He, Y. Maneuvering Target Detection via Radon-Fractional Fourier Transform-Based Long-Time Coherent Integration. IEEE Trans. Signal Process. 2014, 62, 939–953. [Google Scholar] [CrossRef]
  19. Delac, K.; Grgic, M.; Grgic, S. Statistics in face recognition: Analyzing probability distributions of PCA, ICA and LDA performance results. In Proceedings of the 4th International Symposium on Image and Signal Processing and Analysis, Zagreb, Croatia, 15–17 September 2005; pp. 289–294. [Google Scholar] [CrossRef]
  20. Dagher, I.; Nachar, R. Face recognition using IPCA-ICA algorithm. IEEE Trans. Pattern Anal. Mach. Intell. 2006, 28, 996–1000. [Google Scholar] [CrossRef]
  21. Dobson, J.; Cawley, P. Independent Component Analysis for Improved Defect Detection in Guided Wave Monitoring. Proc. IEEE 2016, 104, 1620–1631. [Google Scholar] [CrossRef]
  22. Isomura, T.; Toyoizumi, T. A Local Learning Rule for Independent Component Analysis. Sci. Rep. 2016, 6, 28073. [Google Scholar] [CrossRef]
  23. Déniz, O.; Castrillón, M.; Hernández, M. Face recognition using independent component analysis and support vector machines. Pattern Recognit. Lett. 2003, 24, 2153–2157. [Google Scholar] [CrossRef]
  24. Nakanishi, T.; Hirose, A. Proposal of Adaptive Search-and-Rescue Radar System with online Complex-Valued Frequen-cy-Domain Independent Component Analysis. In Proceedings of the IGARSS 2019—2019 IEEE International Geoscience and Remote Sensing Symposium, Yokohama, Japan, 28 July–2 August 2019; pp. 9431–9434. [Google Scholar] [CrossRef]
  25. Chuang, C.-F.; Shih, F.Y. Recognizing facial action units using independent component analysis and support vector machine. Pattern Recognit. 2006, 39, 1795–1798. [Google Scholar] [CrossRef]
  26. Hyv, A.; Karhunen, J.; Oja, E. Independent Component Analysis; John Wiley & Sons: Hoboken, NJ, USA, 2001. [Google Scholar]
  27. Moreau, E.; Adali, T. Blind Identification and Separation of Complex-Valued Signals; Wiley: Hoboken, NJ, USA, 2013. [Google Scholar]
  28. Fu, G.-S.; Phlypo, R.; Anderson, M.; Adalı, T. Complex Independent Component Analysis Using Three Types of Diversity: Non-Gaussianity, Nonwhiteness, and Noncircularity. IEEE Trans. Signal Process. 2015, 63, 794–805. [Google Scholar] [CrossRef]
  29. Zhou, W.; Xie, J.; Xi, K.; Du, Y. Modified cell averaging CFAR detector based on Grubbs criterion in non-homogeneous background. IET Radar Sonar Navig. 2019, 13, 104–112. [Google Scholar] [CrossRef]
  30. Watts, S. Cell-averaging CFAR gain in spatially correlated K-distributed clutter. IET Radar Sonar Navig. 1996, 143, 321–327. [Google Scholar] [CrossRef]
  31. Shor, M.; Levanon, N. Performances of order statistics CFAR. IEEE Trans. Aerosp. Electron. Syst. 1991, 27, 214–224. [Google Scholar] [CrossRef]
  32. Chen, X.; Guan, J.; Chen, W.; Zhang, L.; Yu, X. Sparse long-time coherent integration-based detection method for radar low-observable manoeuvring target. IET Radar Sonar Navig. 2020, 14, 538–546. [Google Scholar] [CrossRef]
  33. Coluccia, A.; Ricci, G. Radar detection in K-distributed clutter plus thermal noise based on KNN methods. In Proceedings of the 2019 IEEE Radar Conference (RadarConf), Boston, MA, USA, 22–26 April 2019; pp. 1–5. [Google Scholar] [CrossRef]
  34. Sangston, K.J.; Gini, F.; Greco, M.S. Coherent Radar Target Detection in Heavy-Tailed Compound-Gaussian Clutter. IEEE Trans. Aerosp. Electron. Syst. 2012, 48, 64–77. [Google Scholar] [CrossRef]
  35. Haykin, S. Adaptive Radar Signal Processing; John Wiley & Sons: Hoboken, NJ, USA, 2007. [Google Scholar]
  36. Abramowitz, M.; Stegun, I.A. Handbook of Mathematical Functions with Formulas, Graphs, and Mathematical Tables, 9th ed.; Dover: New York, NY, USA, 1972. [Google Scholar]
  37. Miettinen, J.; Taskinen, S.; Nordhausen, K.; Oja, H. Fourth Moments and Independent Component Analysis. Stat. Sci. 2015, 30, 372–390. [Google Scholar] [CrossRef]
  38. García, M.L.L.; García-Ródenas, R.; Gómez, A.G. K-means algorithms for functional data. Neurocomputing 2015, 151, 231–245. [Google Scholar] [CrossRef]
  39. Blömer, J.; Lammersen, C.; Schmidt, M.; Sohler, C. Theoretical Analysis of the k-Means Algorithm—A Survey. In Algorithm Engineering. Lecture Notes in Computer Science; Kliemann, L., Sanders, P., Eds.; Springer: Cham, Switzerland, 2016; Volume 9220. [Google Scholar] [CrossRef]
  40. Schoeman, M.; Marchand, R.; van Tonder, J.; Jakobus, U.; Aguilar, A.; Longtin, K.; Vogel, M.; Alwajeeh, T. New Features in Feko/WinProp 2019. In Proceedings of the 2020 International Applied Computational Electromagnetics Society Symposium (ACES), Monterey, CA, USA, 22–26 March 2020; pp. 1–2. [Google Scholar] [CrossRef]
  41. Mika, D. Fast gradient algorithm for complex ICA and its application to the MIMO systems. Sci. Rep. 2023, 13, 11633. [Google Scholar] [CrossRef]
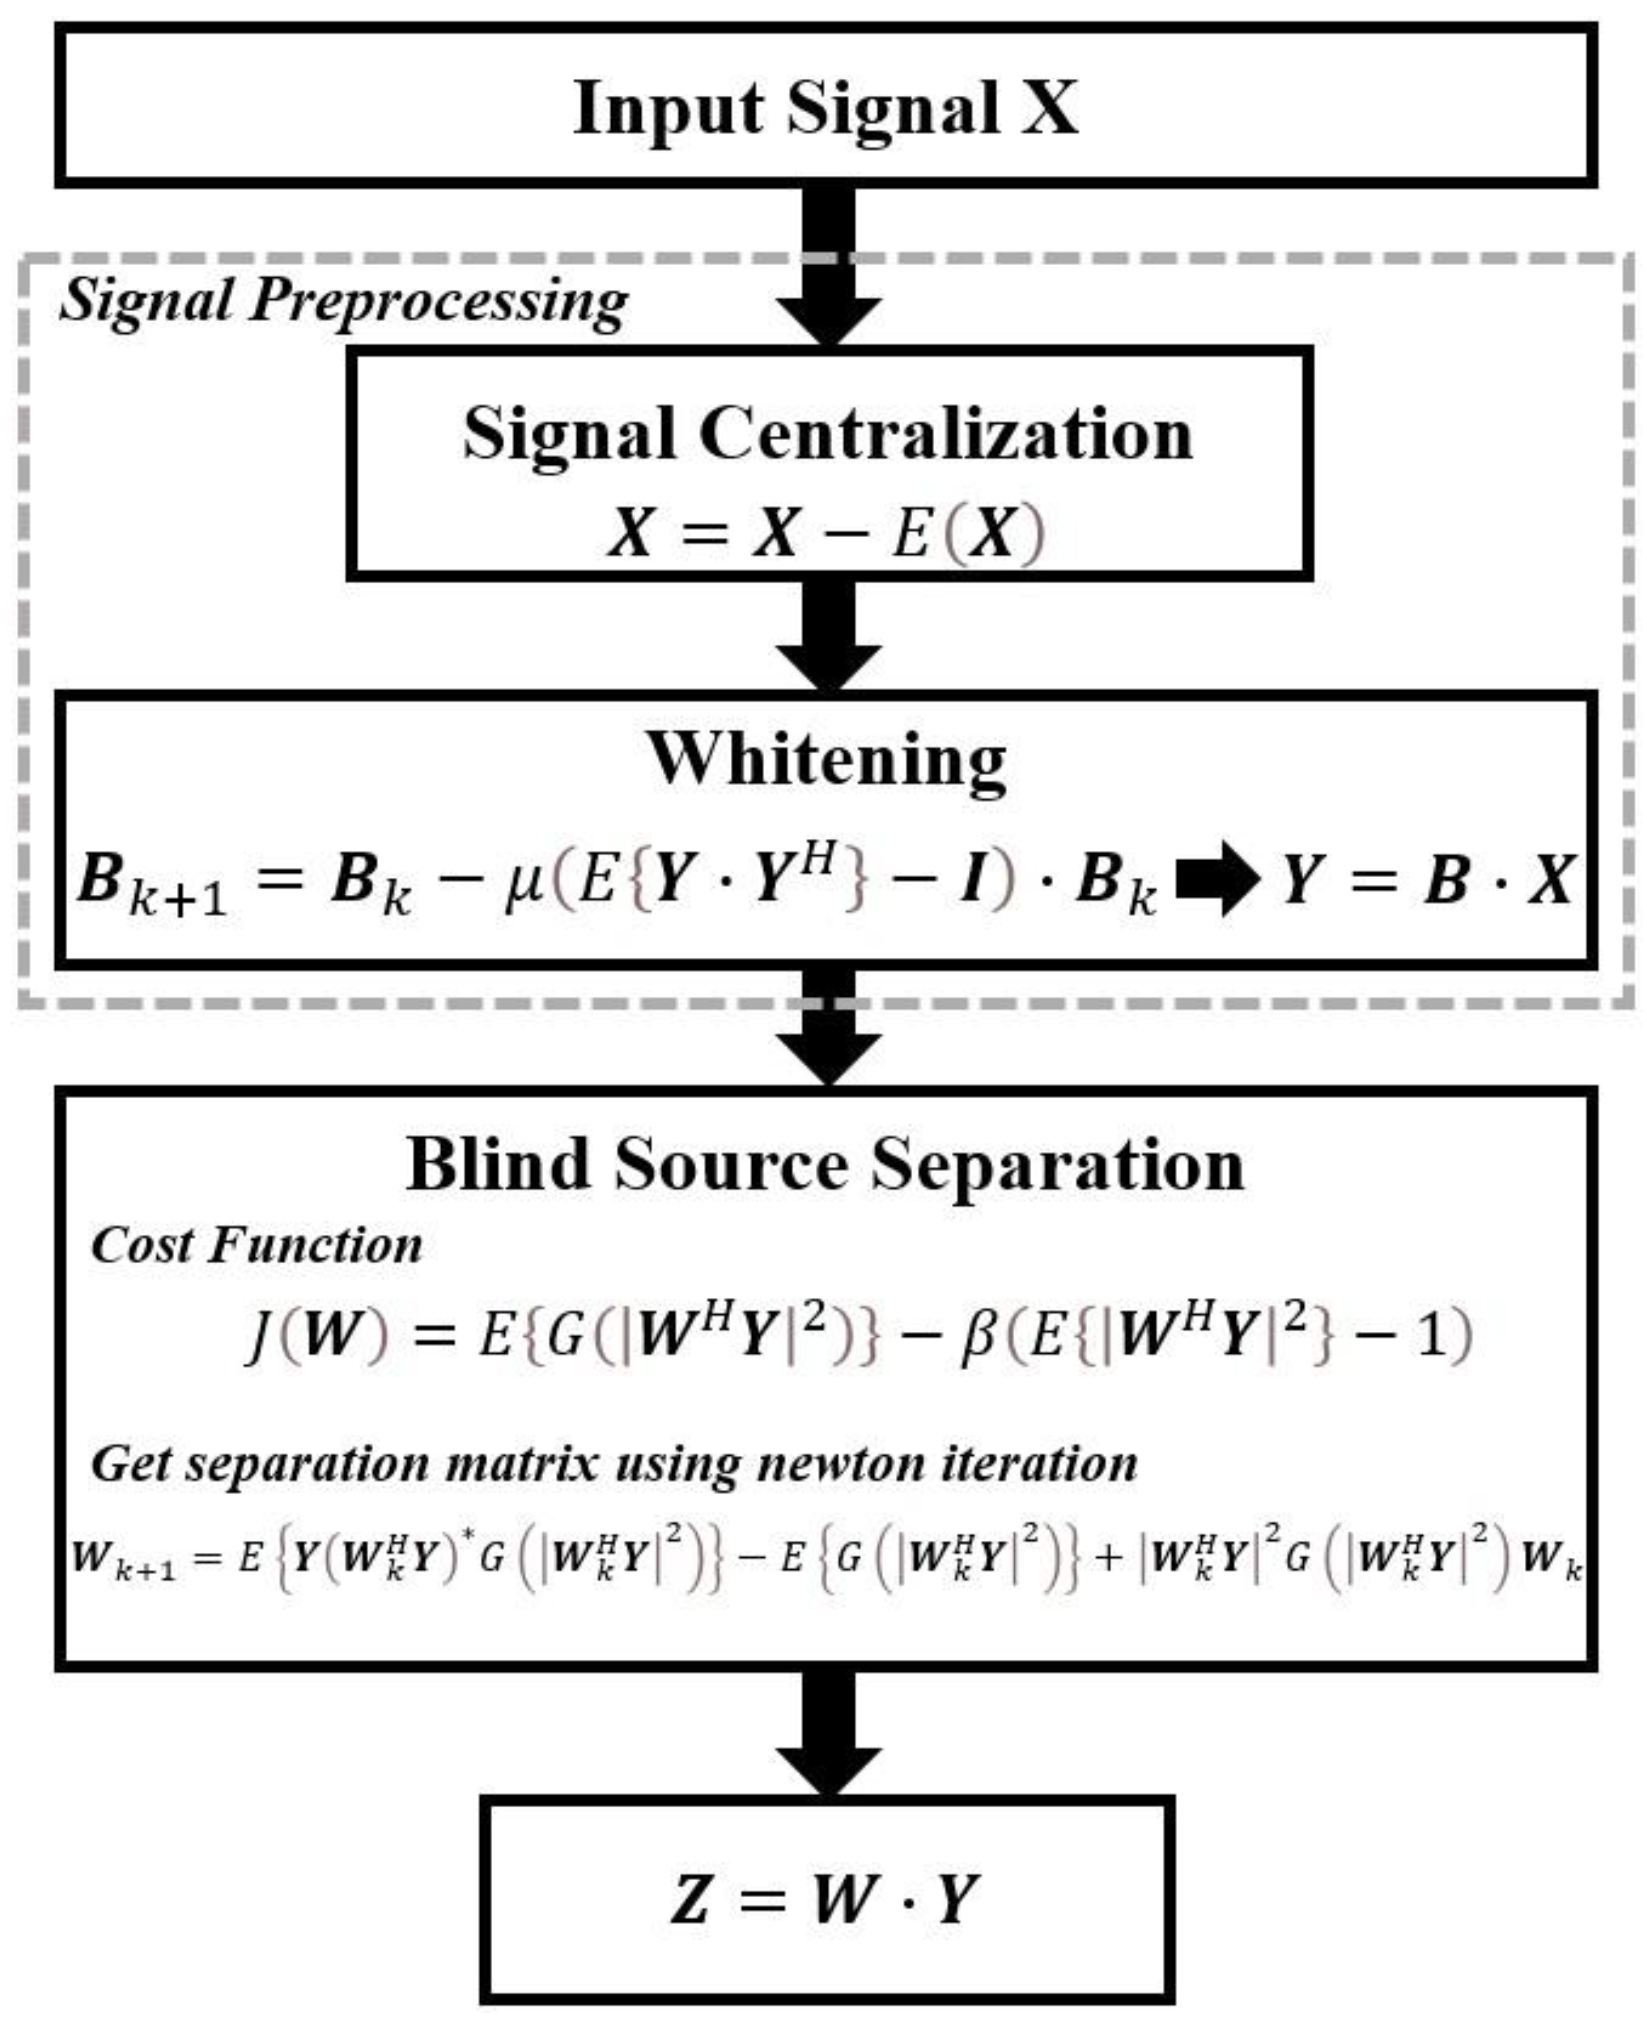
Figure 1. Principle of cICA algorithm.
Remotesensing 16 03512 g001
Figure 2. Framework of swarm target detection and quantification method.
Remotesensing 16 03512 g002
Figure 3. Framework of reference signal extraction.
Remotesensing 16 03512 g003
Figure 4. Framework of UAV quantification procedure.
Remotesensing 16 03512 g004
Figure 5. Geometry profiles for single and swarm drones.
Remotesensing 16 03512 g005
Figure 6. Interface of UAV radar signal simulation platform.
Remotesensing 16 03512 g006
Figure 7. MTD processing results for UAV swarms. (a) Four UAVs. (b) Six UAVs.
Remotesensing 16 03512 g007
Figure 8. Probability of detection for single UAV target [32].
Remotesensing 16 03512 g008
Figure 9. Dynamic UAV swarm trajectory—simple modality.
Remotesensing 16 03512 g009
Figure 10. Probability of detection for dynamic UAV swarm—simple Modality [32].
Remotesensing 16 03512 g010
Figure 11. Dynamic UAV swarm trajectory—complex modality.
Remotesensing 16 03512 g011
Figure 12. Probability of detection for dynamic UAV swarm—complex modality [32].
Remotesensing 16 03512 g012
Figure 13. Principal component distribution of clustered independent components, M = 4. (a) Arbitrarily selected four signal sets. (b) All signal sets.
Remotesensing 16 03512 g013
Figure 14. Principal component distribution of clustered independent components, M = 7. (a) Arbitrarily selected four signal sets. (b) All signal sets.
Remotesensing 16 03512 g014
Figure 15. Histograms of estimated swarm unit number. (a) M = 4. (b) M = 7.
Remotesensing 16 03512 g015
Figure 16. Graphical demonstration of various UAV swarm compositions. (a) 3 UAVs. (b) 6 UAVs. (c) 10 UAVs.
Remotesensing 16 03512 g016
Figure 17. Quantification results evaluations for different UAV swarm configurations. (a) 3 UAVs. (b) 6 UAVs. (c) 10 UAVs.
Remotesensing 16 03512 g017
Figure 18. Quantification performance evaluation for different inter-UAV spacing configurations.
Remotesensing 16 03512 g018
Table 1. Efficiency performance evaluation of target detection methods.
MethodTime (ms)RAM (MB)
CA-CFAR9536
OS-CFAR10341
Method in [32]15857
New Method683105
Disclaimer/Publisher’s Note: The statements, opinions and data contained in all publications are solely those of the individual author(s) and contributor(s) and not of MDPI and/or the editor(s). MDPI and/or the editor(s) disclaim responsibility for any injury to people or property resulting from any ideas, methods, instructions or products referred to in the content.