Article

Fiducial Reference Measurement for Greenhouse Gases (FRM4GHG)

by
Mahesh Kumar Sha
1,*,
Martine De Mazière
1,
Justus Notholt
2,
Thomas Blumenstock
3,
Pieter Bogaert
1,
Pepijn Cardoen
1,
Huilin Chen
4,
Filip Desmet
1,
Omaira García
5,
David W. T. Griffith
6,
Frank Hase
3,
Pauli Heikkinen
7,
Benedikt Herkommer
3,
Christian Hermans
1,
Nicholas Jones
6,
Rigel Kivi
7,
Nicolas Kumps
1,
Bavo Langerock
1,
Neil A. Macleod
8,
Jamal Makkor
2,
Winfried Markert
2,
Christof Petri
2,
Qiansi Tu
3,9,
Corinne Vigouroux
1,
Damien Weidmann
8 and
Minqiang Zhou
1,10
add Show full author list remove Hide full author list
1
Royal Belgian Institute for Space Aeronomy, Ringlaan-3, 1180 Brussels, Belgium
2
Institute of Environmental Physics, University of Bremen, Otto-Hahn-Allee 1, 28359 Bremen, Germany
3
Institute of Meteorology and Climate Research, Karlsruhe Institute of Technology, Hermann-von-Helmholtz-Platz 1, 76344 Leopoldshafen, Germany
4
Joint International Research Laboratory of Atmospheric and Earth System Sciences, School of Atmospheric Sciences, Nanjing University, Nanjing 210023, China
5
State Meteorological Agency of Spain (AEMet), La Marina-20, 38001 Santa Cruz de Tenerife, Spain
6
Centre for Atmospheric Chemistry, School of Earth, Atmospheric and Life Sciences, University of Wollongong, Wollongong, NSW 2522, Australia
7
Finnish Meteorological Institute, Space and Earth Observation Centre, Tähteläntie 62, 99600 Sodankylä, Finland
8
Space Science and Technology Department, STFC Rutherford Appleton Laboratory, Harwell Campus, Didcot OX11 0QX, UK
9
School of Mechanical Engineering, Tongji University, 4800 Caoan Road, Jiading District, Shanghai 201804, China
10
Institute of Atmospheric Physics, Chinese Academy of Sciences, Beichenxilu 81, Chaoyang, Beijing 100029, China
*
Author to whom correspondence should be addressed.
Remote Sens. 2024, 16(18), 3525; https://doi.org/10.3390/rs16183525
Submission received: 25 July 2024 / Revised: 5 September 2024 / Accepted: 17 September 2024 / Published: 23 September 2024

Abstract

:
The Total Carbon Column Observing Network (TCCON) and the Infrared Working Group of the Network for the Detection of Atmospheric Composition Change (NDACC-IRWG) are two ground-based networks that provide the retrieved concentrations of up to 30 atmospheric trace gases, using solar absorption spectrometry. Both networks provide reference measurements for the validation of satellites and models. TCCON concentrates on long-lived greenhouse gases (GHGs) for carbon cycle studies and validation. The number of sites is limited, and the geographical coverage is uneven, covering mainly Europe and the USA. A better distribution of stations is desired to improve the representativeness of the data for various atmospheric conditions and surface conditions and to cover a large latitudinal distribution. The two successive Fiducial Reference Measurements for Greenhouse Gases European Space Agency projects (FRM4GHG and FRM4GHG2) aim at the assessment of several low-cost portable instruments for precise measurements of GHGs to complement the existing ground-based sites. Several types of low spectral resolution Fourier transform infrared (FTIR) spectrometers manufactured by Bruker, namely an EM27/SUN, a Vertex70, a fiber-coupled IRCube, and a Laser Heterodyne spectro-Radiometer (LHR) developed by UK Rutherford Appleton Laboratory are the participating instruments to achieve the Fiducial Reference Measurements (FRMs) status. Intensive side-by-side measurements were performed using all four instruments next to the Bruker IFS 125HR high spectral resolution FTIR, performing measurements in the NIR (TCCON configuration) and MIR (NDACC configuration) spectral range. The remote sensing measurements were complemented by AirCore launches, which provided in situ vertical profiles of target gases traceable to the World Meteorological Organization (WMO) reference scale. The results of the intercomparisons are shown and discussed. Except for the EM27/SUN, all other instruments, including the reference TCCON spectrometer, needed modifications during the campaign period. The EM27/SUN and the Vertex70 provided stable and precise measurements of the target gases during the campaign with quantified small biases. As part of the FRM4GHG project, one EM27/SUN is now used as a travel standard for the verification of column-integrated GHG measurements. The extension of the Vertex70 to the MIR provides the opportunity to retrieve additional concentrations of N2O, CH4, HCHO, and OCS. These MIR data products are comparable to the retrieval results from the high-resolution IFS 125HR spectrometer as operated by the NDACC. Our studies show the potential for such types of spectrometers to be used as a travel standard for the MIR species. An enclosure system with a compact solar tracker and meteorological station has been developed to house the low spectral resolution portable FTIR systems for performing solar absorption measurements. This helps the spectrometers to be mobile and enables autonomous operation, which will help to complement the TCCON and NDACC networks by extending the observational capabilities at new sites for the observation of GHGs and additional air quality gases. The development of the retrieval software allows comparable processing of the Vertex70 type of spectra as the EM27/SUN ones, therefore bringing them under the umbrella of the COllaborative Carbon Column Observing Network (COCCON). A self-assessment following the CEOS-FRM Maturity Matrix shows that the COCCON is able to provide GHG data products of FRM quality and can be used for either short-term campaigns or long-term measurements to complement the high-resolution FTIR networks.

1. Introduction

Satellite-based Earth observational data require proper calibration (Cal) and validation (Val) with comprehensive uncertainty assessment to ensure that it provides reliable information on the measured variables. This is also to ensure that the use of the satellite data will provide added value to the current understanding of the addressed topic. The absence of the dedicated Cal/Val and its continuation during the lifetime of the satellite mission to improve further and reduce the uncertainties of the satellite products will make the data less usable and perhaps even redundant. Therefore, there is a critical need to provide a coordinated and comprehensive assessment of the quality, bias, and uncertainty of the observations made by the satellite missions. Reduction in cost, complexity, and robustness of mission-specific organization of the Cal/Val has encouraged the space agencies to improve coordination and generalization of methods and infrastructure through internationally recognized bodies such as the Committee on Earth Observation Satellites (CEOS). In addition to the cost benefits, this effort has also improved harmonization and interoperability between sensors.
The Quality Assurance Framework for Earth Observation (QA4EO) is a community-led initiative created by The Group on Earth Observations (GEO) of the CEOS Working Group Cal/Val (WGCV) and World Meteorological Organization (WMO) Global Space-based Inter-Calibration System (GSICS). It provides a set of principles, guidance, and specific tools to encourage the provision of internationally consistent quality indicators on the delivered data. QA4EO requires the Cal/Val of satellite data to be collected through an independent dataset that provides comparable observations. This requires that the independent dataset itself and the associated uncertainties must be fully characterized and documented in compliance with the QA4EO principles. These reference data are recognized by the scientific community and ideally tied to the international system of units (SI) and are referred to as Fiducial Reference Measurement (FRM) [1]. Goryl et al., 2023, state the definition of FRM to be “a suite of independent, fully characterised, and traceable (to a community agreed reference, ideally SI) measurements of a satellite relevant measurand, tailored specifically to address the calibration/validation needs of a class of satellite borne sensor and that follow the guidelines outlined by the GEO/CEOS Quality Assurance framework for Earth Observation (QA4EO)”.
In this paper, we focus primarily on the aspect of fiducial reference measurements for the Cal/Val of atmospheric greenhouse gas composition missions (e.g., currently operational missions like Sentinel-5 Precursor, OCO-2, GOSAT, … and upcoming planned missions like Sentinel-5, CO2M, MicroCarb, …). The Total Carbon Column Observing Network (TCCON) [2] is a network of ground-based Fourier transform infrared (FTIR) spectrometers performing direct solar absorption measurements in the near-infrared (NIR) spectral range at a spectral resolution of 0.02 cm−1 and providing total column concentrations of greenhouse gases (GHGs), namely carbon dioxide (CO2) and methane (CH4) amongst other gases, with high precision and accuracy (traceable to the WMO reference scale). A set of about 28 TCCON stations distributed globally is considered the reference network for satellite validation of the measured total column GHG concentrations (e.g., GOSAT, OCO-2, Sentinel-5 Precursor) [3,4,5]. The InfraRed Working Group of the Network for the Detection of Atmospheric Composition Change (NDACC-IRWG) is another reference network performing solar absorption measurements in the mid-infrared (MIR) spectral region at high spectral resolution using FTIR spectrometers. The spectra are used to retrieve the atmospheric concentrations of a number of gaseous atmospheric constituents, including methane (CH4), nitrous oxide (N2O), and carbon monoxide (CO), amongst other gases (https://www2.acom.ucar.edu/irwg, accessed on 1 March 2024) [6]. The retrieval of the spectra in the MIR allows the derivation of low vertical resolution profiles (from 1 to 5 degrees of freedom, depending on the target species) along with the total columns. A set of about 25 NDACC FTIR stations distributed globally is providing data for the validation of satellites and models. The majority of the TCCON and NDACC-IRWG (hereby referred to as NDACC) stations are located in North America, Europe, and Japan, and only a few stations are located in the Southern Hemisphere. This leaves a large gap in the reference dataset for the Cal/Val in terms of geographical coverage and the full range of measurement variables that affect the data quality of the derived satellite products. A denser distribution of such reference measurements is desired around the source areas of interest (e.g., at the facility or city scale) to measure how GHGs are released into the atmosphere, specifically through human activity, and to validate the corresponding satellite measurements. An extension of the networks in terms of fixed and campaign-based stations is limited due to the high start-up, maintenance, and operational costs, as well as difficulties in transportability. Furthermore, the maintenance of these spectrometers requires skilled and experienced personnel. These factors resulted in the development of a number of low-cost, portable, easy maintenance and operation instruments. They will help complement the high-resolution FTIR networks to cover a large range of measurand space in terms of influencing parameters of the satellite retrievals to give a comprehensive basis for reference measurements. The performance and quality of these instruments need proper characterization and comparison against reference measurements. The goal of the FRM4GHG projects is the characterization of low-cost and portable spectrometers to complement the high-resolution FTIR spectrometers for the establishment of a denser and wider network.
In this context, the European Space Agency (ESA) initiated the Fiducial Reference Measurements for GreenHouse Gases (FRM4GHG) project in 2016 to create high-quality reference measurements of greenhouse gases (GHGs) to support satellite validation. As part of this project, several portable, low-cost instruments have been tested, and their data products are compared against collocated reference TCCON (for gases retrieved in the NIR spectral range) and NDACC (for gases retrieved in the MIR spectral range) datasets. The extension possibility to cover a large spectral range either in the NIR or even to the MIR for the tested instruments is of added benefit both for the Cal/Val of satellite products of GHGs and other species measured by the same instruments (e.g., TROPOMI onboard Sentinel-5 Precursor) as well as for the scientific evaluation of the target products. An example is the use of a formaldehyde product derived from one of the tested spectrometers from the MIR spectra for the validation of the TROPOMI formaldehyde product. Likewise, the retrieved carbonyl sulfide from the same MIR spectra will be useful for the carbon cycle studies due to its strong link with the sources and sinks of carbon dioxide. To our surprise, the reference measurements performed with the TCCON were found to be affected by the non-linearity of the detector. This was identified during the first year of the campaign (see [7] for details on the identification and curation of the data), and steps were taken to avoid this for the following consecutive years. The multi-year campaign was therefore supported to check the long-term stability and consistency of the instruments and their products. Furthermore, it proved to be greatly beneficial for several of the tested instruments, which have been improved significantly during the campaign; for some other instruments, further improvements are still ongoing to bring them to the level of FRM. This is the first of a set of papers reporting on the scientific outcomes of the campaign with several portable, low-cost instruments, testing their performance and their evaluation towards providing FRM quality data for greenhouse gases. The ultimate goal of this work is to provide a tailored and accurate FRM4GHG dataset and to support the Cal/Val of greenhouse gas as well as some of the other commonly retrieved gases from satellite missions. The paper is organized as follows: Section 2 provides a description of the instruments under evaluation and a description of the campaign setup for the intercomparison of the instruments against reference measurements. Section 3 provides the results from the intercomparison campaign and specific upgrades for both hardware and software to bring the instruments toward the FRM status. Section 4 presents a self-assessment of the FRM status of COCCON using the CEOS-FRM Maturity Matrix. The paper ends with a discussion and outlook presented in Section 5.

2. Materials and Methods

The FRM4GHG project started in 2016 with the aim of establishing and maintaining additional greenhouse gas FRMs for satellite-derived greenhouse gas product validation. The goal was to assess the performance of different spectrometric instruments for remote sensing observations and quantify their performances regarding precise measurements of column-averaged dry-air mole fractions of carbon dioxide (CO2), methane (CH4), and carbon monoxide (CO) against reference data from TCCON with predefined protocols to ensure consistency between them. The total column measurements from the remote sensing instruments were complemented by AirCore measurements providing vertical profiles of the target gases [8]. The intercomparison included a blind phase at the beginning of the first year of the campaign, followed by an open review of the datasets. The campaign was performed over all available seasons to evaluate the source of biases/uncertainties under different operational conditions. The results of the first year of the campaign were promising, and many important lessons were learned [7]; however, several of the instruments showed further need for optimization to achieve the FRM status. Therefore, the campaign has been extended and is still ongoing. Several important achievements have already been made to bring some of the tested instruments to the FRM level. The combined results and the corresponding developments are discussed in detail in this paper.

2.1. FRM4GHG Campaign Overview

The campaign started at the beginning of 2017 in Sodankylä at the TCCON facility (67.3668°N, 26.6310°E; 188 m a.s.l.) of the Finnish Meteorological Institute (FMI). The site was ideal as there was the possibility to launch AirCore, availability of a dedicated container and other infrastructures to host all participating instruments, availability of surface-based in situ GHG measurements, and local support by scientists and engineers who are well-trained for such instrumentations in case of problems occurring during the campaign. Further details on the Sodankylä site and the adaptation for the FRM4GHG campaign can be found in Sha et al., 2020 [7] and the references therein.
The instruments under investigation joining the campaign in Sodankylä were a EM27/SUN, a Vertex70, a IRCube, and a homemade Laser Heterodyne spectro-Radiometer (LHR). The EM27/SUN, the Vertex70 and the IRCube were all manufactured by Bruker Optics GmbH & Co. KG in Ettlingen, Germany. The LHR was manufactured at the STFC Rutherford Appleton Laboratory, Harwell Campus in Oxfordshire, UK. The four spectrometers work with different resolutions and different techniques. The first three instruments are Bruker low spectral resolution Fourier transform spectrometers with similar optomechanical designs, all sharing the same basis of a RockSolidTM corner-cube pendulum interferometer manufactured by Bruker Optics GmbH & Co. KG in Ettlingen, Germany. This allows for comparable sampling quality and robustness. However, they differ in the design of the surrounding imaging optics, geometric arrangements resulting in having different fields of view and instrumental line shapes (ILS), the position of the center burst allowing single-sided or double-sided interferogram acquisitions, and possibilities for additional detector extensions covering a wider spectral range to measure additional trace gases of interest that are linked to or help in the understanding of GHG emissions. The instruments used different options of solar tracker systems for performing direct sun solar absorption measurements.
The campaign at the Sodankylä site was performed with the same set of instruments for two full years (2017 and 2018). The third year of the campaign was a distributed campaign, with the IRCube performing side-by-side measurements next to the TCCON stations in Wollongong and Darwin while the rest of the instruments remained in Sodankylä. This facilitated the IRCube operators from the University of Wollongong to make changes and adaptations more frequently. The details of the instrumental setups and changes performed during the three years of the campaign and after are discussed in the next section.

2.2. Instrument Description and Adaptation to Achieve FRM Status

Sha et al., 2020 [7] describe the details of the instrumental properties of the participating instruments in the campaign. Here, only a summary and the most relevant modifications are described.

2.2.1. Bruker IFS 125HR

The operation, maintenance, and data analysis of the measurements collected by the reference TCCON instrument “Bruker IFS 125HR” spectrometer (Bruker Optics GmbH & Co. KG, Ettlingen, Germany) at the site were performed by the Finnish Meteorological Institute (FMI) at Sodankylä [9]. The measurements were performed following the standard TCCON protocol. The spectrometer is also equipped with a liquid-nitrogen-cooled (LN2) indium antimonide (InSb) detector (Bruker Optics GmbH & Co. KG, Ettlingen, Germany) and performs measurements in the MIR spectral range with selected band-pass filters. The analysis of the first year of measurements in 2017 showed that they were affected by non-linearity [7]. The non-linearity effect of the TCCON room temperature (RT) operated indium gallium arsenide (InGaAs) detector (Bruker Optics GmbH & Co. KG, Ettlingen, Germany) was subsequently investigated, and the effect was minimized by reducing the signal intensity on the detector. Several tests were performed with alternative approaches, and the final choice was the installation of an aperture stop after the input window at the instrument entrance, reducing it from 32 mm to 16 mm in diameter. This setting, which was implemented at the beginning of 2018, led to satisfactory results without non-linear effects and has not been changed since then. The measurements of 2017 were corrected for non-linearity effects [7] and are henceforth called TCCONmod in this paper. The data from 2018 onwards are of good quality and are used directly as the reference data generated with GGG2014 [10] for intercomparison with other datasets. The TCCON retrieval used a nonlinear least square spectral fitting subroutine “GFIT” that iteratively scales the a priori atmospheric amounts to generate forward-modeled spectra that best fit the data. In this process, the shape of the a priori profiles remains fixed. The non-linearity effect detected first in the Sodankylä TCCON data is not the only isolated case in the whole network. However, this is also not the standard norm and is seen at all the sites. Laughner et al., 2023 [11] describe in detail how the non-linearity checks have been implemented in the TCCON data analysis software and a correction method implemented.

2.2.2. Bruker EM27/SUN

The EM27/SUN was developed by the Karlsruhe Institute of Technology (KIT) in cooperation with Bruker starting in 2011 [12,13]. The EM27/SUN deployed in the campaign is part of the Collaborative Carbon Column Observing Network (COCCON; https://www.imk-asf.kit.edu/english/COCCON.php, accessed on 1 March 2024). The spectrometer is equipped with two room temperature (RT) InGaAs detectors (covering 5500–11,000 cm−1 and 4000–5500 cm−1), which record double-sided DC coupled interferograms making an average of 10 scans in about 58 s at a spectral resolution of 0.5 cm−1. The PROFFAST retrieval code was used to derive column-averaged dry-air mole fractions of carbon dioxide (XCO2), methane (XCH4), carbon monoxide (XCO), and water vapor (XH2O). PROFFAST uses a least-square fitting algorithm, which adjusts the trace gas amounts by scaling atmospheric a priori profiles without changing their shape. Further information on the instrument characterization and bias correction applied to the XCO2 and XCH4 products based on the extensive COCCON development is described in Sha et al. [7] and the references therein. As EM27/SUN was the most developed and tested instrument amongst the participating instruments, the bias correction was performed only for this instrument following the COCCON processing chain and not for the other test datasets. The spectrometer was operated outside the FRM4GHG container, which was hosting all other instruments, at ambient conditions for the whole campaign period. This showed the capability of the instrument to be able to perform well even under harsh campaign conditions at high latitudes. The EM27/SUN showed very good and consistent results (see next section), and no changes were necessary for the entire duration of the three-year campaign.

2.2.3. Bruker Vertex70

The Vertex70 was purchased from Bruker and installed inside the FRM4GHG container, coupled with a large home-built solar tracker installed on the roof to track and guide the sunlight to the instrument. The setup, operation, and maintenance were shared by the University of Bremen (UB) and the Royal Belgian Institute for Space Aeronomy (BIRA-IASB). The spectrometer is equipped with an extended RT InGaAs detector (3500–11,000 cm−1), and an LN2-cooled InSb detector (1880–11,000 cm−1). Therefore, it has the advantage of measuring also in the MIR spectral range. The spectrometer records single-sided DC-coupled interferograms, making an average of two scans in about 17.3 s at a spectral resolution of 0.2 cm−1. Three forward and three backward scans were co-added, corresponding to a measurement time of about 52 s to record one file. The measurements were performed in an automated way, allowing us to collect data on every occasion with good weather conditions. The data analysis of the NIR measurements was performed by UB using the GGG2014 retrieval code to derive column-averaged dry-air mole fraction of XCO2, XCH4, XCO, and XH2O; details are provided in Sha et al. [7]. In this paper, the results of the MIR measurements are also presented (see Section 3.3).
After the blind intercomparison phase, on 6 July 2017, an additional aperture stop of 20 mm diameter with a variable iris was installed (reducing it from 40 mm) in the parallel light beam of the Vertex70 spectrometer. This instrument modification improved the ILS compared to the initial factory settings, but it also resulted in too high a signal, causing a high scatter in the data. The aperture stop was then further reduced to 8–9 mm on 12 September 2017. Between 10 and 12 April 2018, tests were performed using a non-extended InGaAs detector. The original extended InGaAs detector was rebuilt, and the additional aperture was set to 13 mm. A semi-extended InGaAs detector was used between 17 May and 12 August 2018. However, the results were less favorable, so the original extended InGaAs detector was rebuilt on 13 August 2018. This configuration was kept until the end of the campaign in 2019.
The InSb detector was originally equipped with a cut-off filter at 3500 cm−1 installed inside the Dewar, which is optimal for CO measurements. However, during the second year of the campaign, the filter was removed from the inside (in August 2018), and the detector operated since 10 September 2018 with a filter covering the region around 2700 cm−1 to enable measuring formaldehyde (HCHO). To improve the SNR in specific regions, two filters have been installed in the internal filter wheel before the start of the measurement season in 2019. The automated measurement procedure was configured to run alternating InGaAs and InSb measurements using two filters. The measurement procedure started with performing six scans and collecting data using the InGaAs detector without a filter (3800–11,000 cm−1), followed by measurements with 12 co-added scans using the InSb detector with filter 1 (3950–5100 cm−1), followed by measurements with 12 co-added scans using InSb detector without a filter (1880–11,000 cm−1). At the end of the measurement sequence, measurements were taken with 12 co-added scans using the InSb detector with filter 2 (2400–3300 cm−1). In the third and final year of the campaign at Sodankylä (2019), the Vertex70 was operating without problematic issues or out-times.
The above-mentioned changes to the optical configuration of the Vertex70 during the FRM4GHG campaign led to the final configuration in which the instrument was operated and tested during the full year of 2019. This configuration gave the best results compared to the reference data, and the retrieval of the NIR data showed stable results compared to the other reference instruments (see Section 3). It was therefore recommended to include such types of spectrometers under the umbrella of COCCON. Further details on this are provided in Section 3.

2.2.4. Bruker IRCube

The IRCube is the most compact of the FTIR systems tested in the FRM4GHG campaign. It was set up by the University of Wollongong (UoW) at the Sodankylä site inside the FRM4GHG container coupled to a fiber-optic feed from an independent solar tracker (STR-21G, Eko Instruments Co., Ltd., Tokyo, Japan) mounted on top of the container. The IRCube used in the campaign contains a flex-pivot RockSolid® interferometer with a 25 mm beam diameter and quartz beamsplitter capable of recording 1 cm−1 resolution double-sided or 0.5 cm−1 single-sided interferograms. It accepts an input beam focused onto a 0.5 mm aperture and collimated into the interferometer by a 69 mm off-axis paraboloidal mirror. The parallel output beam is focused onto an InGaAs detector with a short (25 mm) focal length off-axis paraboloidal mirror. Optical alignments and adjustments inside the IRCube are very limited, and the field-of-view (FOV) and instrument ILS are defined by the alignment of the input aperture and optics.
Solar absorption measurements were made using a 50 mm diameter, 350 mm focal length glass-lens telescope mounted on an Ekotracker STR21G solar tracker of Tokyo Japan and coupled to the IRCube by a fiber optic with a core diameter of 0.55 mm, numerical aperture (NA) of 0.22 and 20 m long (Thorlabs fiber FG550, Newton, NJ, USA). The output beam from the fiber was focused into the IRCube input aperture by a glass lens. The coupling of the light from the optical fiber to the IRCube was chosen carefully to match the power from the fiber-optic cable to the spectrometer so that the SNR is comparable to the TCCON while avoiding unwanted spectral features in the NIR optical fiber. This configuration has the benefit that the IRCube can be housed anywhere within the length of the used fiber-optic cable. This allows the spectrometer to be operated from an environment (e.g., weatherproof enclosure) far away from the solar tracker. The spectrometer is equipped with an RT InGaAs detector (covering 4500–11,000 cm−1), recording single-sided DC-coupled interferograms that are an average of 33 scans in about 1.7 min at a spectral resolution of 0.5 cm−1. The GGG2014 retrieval code was used to derive column-averaged dry-air mole fractions of XCO2 and XCH4 [7].
The fiber cable of the solar tracker was broken one week after the installation (24 March 2017) at the campaign site. A new fiber cable was installed on 24 April 2017, and the external optics were realigned to bring the solar image centered on the input aperture. The reference laser was replaced on 17 May 2017. After these initial changes, the instrument measured in the same configuration till the end of 2018. The IRCube was transported at the end of 2018 from Sodankylä (Finland) to Wollongong (Australia). The spectrometer was set up in mid-January 2019 in the laboratory next to the TCCON IFS 125HR spectrometer, and the solar tracker with fiber-optic (FO) coupling was mounted on the roof of the laboratory building (approximately 5 m above the IRCube). From mid-January to mid-February, a number of sensitivity tests were run (optical bench iris aperture, spectrometer field stop, and FO rotation). The normal mode of operation commenced on 18 February 2019 with the optimized settings till 23 August 2019. After that, it was packed and shipped to the TCCON site in Darwin to take part in a campaign.
The IRCube was installed in Darwin on 12 September 2019 inside the shipping container, also hosting the TCCON instrument. The sun tracker was installed on the roof of the container. The spectrometer ran without any issues from the start until the end of 2019. The results of the IRCube from the beginning of 2017 until the end of 2019 are shown in Section 3. These results show there is still room for further improvement in the optical alignment. Since the beginning of 2021, the instrument has been operating next to the TCCON station at Wollongong, and several changes have been made to find the best setting for operations. The details of these changes and the corresponding results are given in Section 3.4.

2.2.5. Laser Heterodyne Spectro-Radiometer (LHR)

LHR provides high-spectral resolution and ideally shot noise limited optical detection in a compact package well-suited for the development of autonomous ground-based solar occultation remote sounders [14]. LHRs are particularly attractive in the thermal infrared (TIR) part of the spectrum; they maintain an excellent trade-off between signal-to-noise ratio (SNR) and resolving power [15] and can provide additional information on the vertical distribution of atmospheric constituents [16,17] complementary to the column derived from NIR observations. During the first phase of the FRM4GHG project, a compact TIR LHR was designed, assembled, and autonomously deployed at the campaign site in Sodankylä to measure CO2 and CH4 profiles in ground-based solar occultation viewing mode [7]. The spectral resolution of the LHR is determined by electronic filters. For the FRM4GHG campaign, the spectral resolution was set to 0.02 cm−1. The deployment and remote operation were led by the Spectroscopy Group of the Space Science and Technology Department of the Rutherford Appleton Laboratory (RAL). The LHR was installed inside the FRM4GHG container for the three years of the campaign (2017–2019) and used a part of the solar beam coming into the container from the Vertex70 coupled solar tracker. Yearly spring visits for manual intervention on the instrument systems were performed by the RAL team. After the first two years of deployment, unexpected scatter and large biases were found in the retrieved CO2 and CH4 columns (see Section 3.2). As a result, a review of some of the instrumental components and the data processing algorithms, including retrieval, was conducted to address some of the issues identified.
During the first year of the three-year FRM4GHG deployment (2017), the LHR was solely measuring CO2 and H2O at 953 cm−1. The SNR at the instrument level for a single spectrum was within expectation (~140 at mid-spectrum for a total spectrum acquisition of 30 s and a solar elevation of ~40°). The random noise observed on the diurnal trace of XCO2, after a quadratic polynomial detrending, was Gaussian with a standard deviation of 2.6 ppm. However, large diurnal drifts up to ~20 ppm over 10 h were observed, with no obvious correlations identified at that time.
At the end of the summer of 2017, an additional CH4 channel was installed operating over a 1 cm−1 narrow window centered at 1233.5 cm−1. The LHR optical system was altered to include (1) a switching mirror, allowing the automated sequential selection between the two channel local oscillators (LO); (2) a high-pass optical filter (>900 cm−1) to replace the 130 cm−1 passband optical filter centered at 980 cm−1, to allow solar radiation at both 953 and 1233.5 cm−1 to be transmitted within the LHR; and (3) an input automated optical shutter to allow the recording of a “dark” input scene for reference. In 2018, after these instrument changes, the single spectrum SNR of the CO2 channel was found to be degraded to ~70, a 50% drop compared to the previous year. That of the CH4 channel was found to be ~40, which also was below expectations. The LHR was operated in these conditions for one year (2018), during which a gradual degradation of the XCH4 was observed due to slight optical alignment drifts in the LO collimation lens.
At the end of the summer of 2018, given the significant performance degradation, an overhaul was attempted, primarily on the detector and detector back-end system. The photodetector was replaced to increase the detectivity (from 1.2 × 10⁹ to 3.8 × 109 cm H z /W), leading to a single-spectrum SNR of 93 and 77 for the CO2 and CH4 channels, respectively. SNR was improved, but, as far as XCO2 is concerned, not to the level observed during the first campaign year, suggesting that the implementation of the CH4 channel had adverse effects on the instrument performance. In addition, good-quality data from 2018 were scarce due to an unstable field of view originating from the shared sun tracker, which led to the rejection of most of the spectra.
In the course of the three-year campaign, the data processors (level 1 and level 2) were also updated. The level 1 processor is made of the following functional tasks [17]: Calculation of the solar elevation angles from the timestamps; calculation of the relative frequency scale of the spectrum; determination of level 0 data quality flags; optimization of the in-phase and quadrature heterodyne signals; calculation of the absolute frequency scale of the spectrum; correction of signal backgrounds; determination of spectral baseline a priori parameters; spectrum trimming and re-gridding through linear interpolation. The level 2 processor is the retrieval scheme deriving vertical profiles of atmospheric species from the quality-checked and frequency-calibrated atmospheric transmission spectra. It is based on optimal estimation [15,16].
The analysis of the 2017 and 2018 data has led to two critical updates to the level 1 processor. After the 2018 changes to accommodate both channels, the actual radiometric baseline was identified to be different from the dark scene signal, as evidenced by saturating lines. This effect is shown in Figure 1. The spectrum (in black) shown in the figure corresponds to the CH4 channel and is taken at low solar elevation (6.6°) to ensure saturation of the main CH4 line. What was believed to be the background measurement (no LO) and the actual radiometric “zero” are both indicated in the figure. Therefore, the background removal procedure was updated to correct this effect. The second update introduced a linear correction to minimize the instrument temperature effects on the measured gas column. A linear dependence of 3.8 ppm/K for XCO2 was derived from the dataset and corrected.
Since the return of the LHR to RAL at the end of the first phase of the FRM4GHG campaign in 2019, several modifications and tests have been made to improve both the hardware and software side. The Harwell TCCON station started its operation in September 2020 and, therefore, provides a good reference point for further comparisons with the improvements made to the LHR. Once the tests are successful, the LHR has the great potential to provide not only the column concentrations but vertical profiles of the target gases as well. However, it will take some time and testing till this can be achieved.

2.2.6. AirCore

The AirCore technique allows us to accurately measure profiles of atmospheric concentrations of CO2 and CH4 [8], with capacity for several other species being developed. The AirCore system can be lifted by a meteorological balloon up to an altitude of 30–35 km. After the balloon bursts, the payload descends under a large parachute, while a continuous sample is collected by passive filling of a long steel tube. After landing, the AirCore is typically returned to the laboratory within a few hours, where its contents are analyzed. In this way, it is possible to obtain accurate profile measurements from altitudes higher than those of aircraft measurements. The highest usable sample is typically from 20 to 25 km; the amount of air collected at higher altitudes is generally not sufficient for analysis.
Within the FRM4GHG project, our main focus was first to obtain accurate measurements of CO2, CH4, and CO. The AirCore instrument used at Sodankylä is built as a 100 m long stainless-steel tubing, consisting of two pieces of tubing with different diameters. Outer diameters are ¼ in. (6.4 mm and about 40 m long) and 1/8 in. (3.2 mm and 60 m long). The wall thickness for both parts is 0.01 in. (0.25 mm). The tubes were coated with SilcoNert®1000 ( SilcoTek, Bellefonte, PA, USA). The air volume of the AirCore is approximately 1400 mL. The payload package additionally includes (i) a data logger to record the temperature of the AirCore tubing, ambient pressure, and temperature, (ii) electronics to operate the inlet valve, and (iii) a Vaisala RS92-SGPL radiosonde (Vaisala Oyj, Vantaa, Finland) [18]. Positioning was obtained using redundant systems: a radiosonde, an iridium device, a GPS–GSM tracker (Incutex Germany GmbH, Augsburg, Germany), and a transponder required for the air traffic. A meteorological balloon, Totex Tx3000 (TOTEX Corporation, Ageo-Shi, Japan), was used to lift the payload.
Measurements of CO2, CH4, and CO were performed using a Picarro G2401 cavity ring-down spectrometer (CRDS; in the case of the Sodankylä campaign with precision and accuracy of 0.05/0.1 ppm, 0.5/1 ppb, and 8/3 ppb, respectively; Picarro, Santa Clara, CA, USA). Absolute trace gas mole fractions were derived from the calibration of the analyzer using gas standards traceable to current WMO scales.

3. Results

3.1. First Phase of the Intercomparison Campaign

In this section, the results of the first phase of the campaign, which spanned the period from 2017 to 2019, are presented. The idea behind extending the campaign beyond the initial year of 2017 is twofold. In the first instance, it is absolutely necessary to perform a multi-year campaign and check the long-term stability and consistency of the instruments and their derived products. We also discovered during the first year that some of the tested instruments, as well as the reference TCCON instrument, needed modifications to achieve the FRM status. It was in the second and third years of the joint campaign, referred to here as the first phase, where targeted modifications were made to some of the instruments, and further long-term datasets were collected for comparison against reference data. Furthermore, during this phase, the spectral range of one of the spectrometers was extended to measure the mid-infrared region using a liquid nitrogen-cooled InSb detector. These measurements provided the possibilities for the exploitation of new species like formaldehyde and carbonyl sulfide and a comparison to the data from reference high-resolution instruments. Due to the location of the Sodankylä campaign site at high latitude, measurements with small solar zenith angles are only possible from the beginning of February till early November. Due to differences in the data acquisition time for the different instruments, while doing the intercomparison, the data from each instrument were sorted, and all data within the time interval of a 5 min sequence were averaged and associated with the respective start time of the bin. The time stamp of the reference dataset, in this case TCCON, was matched with the time stamp of the other instruments participating in the campaign to find the coincident data pairs. These pairs were used to calculate the differences and correlations between them. The remote sensing data showed a strong airmass dependence for measurements with solar zenith angle (SZA) > 75°. Therefore, only data below this limit were considered in the intercomparison work. The filtering of the higher SZA measurements removed only a very limited number of datasets. The data analysis was performed following the standard procedure and using the TCCON a priori as the common a priori. The results shown here are based on the TCCON GGG2014 retrieval because GGG2014 was the operational software used during the field measurements in 2017–2019.

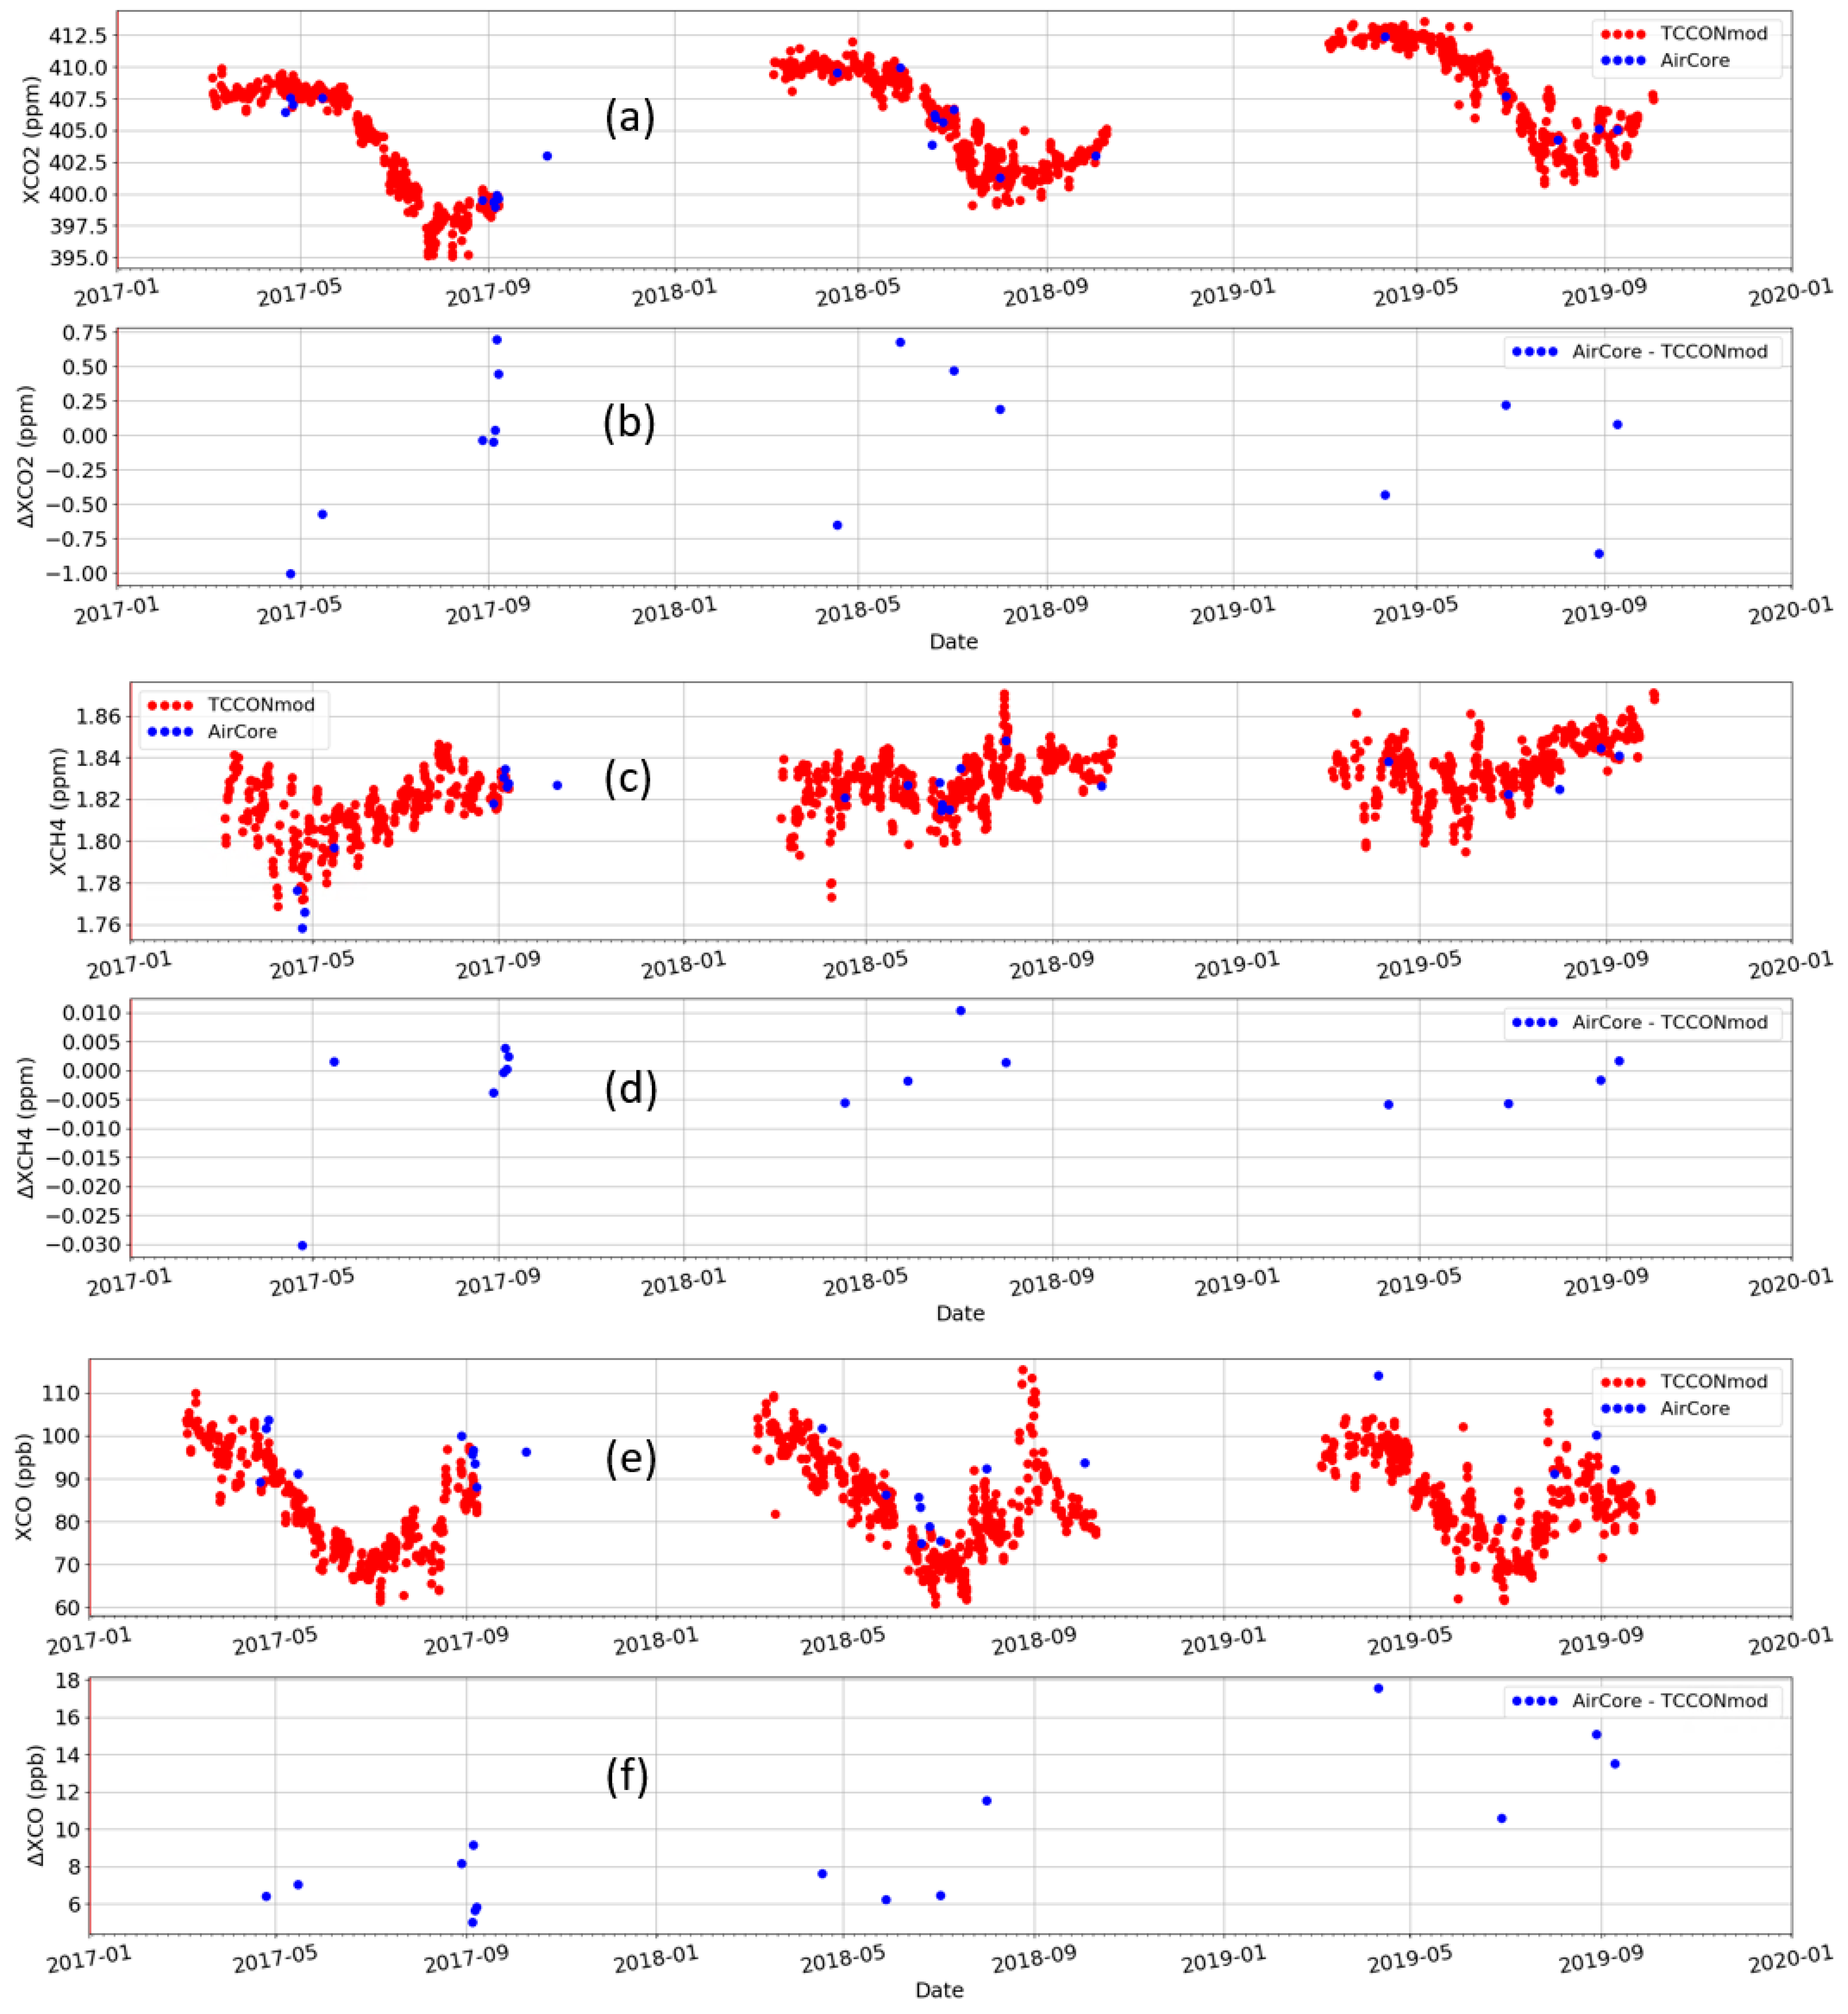
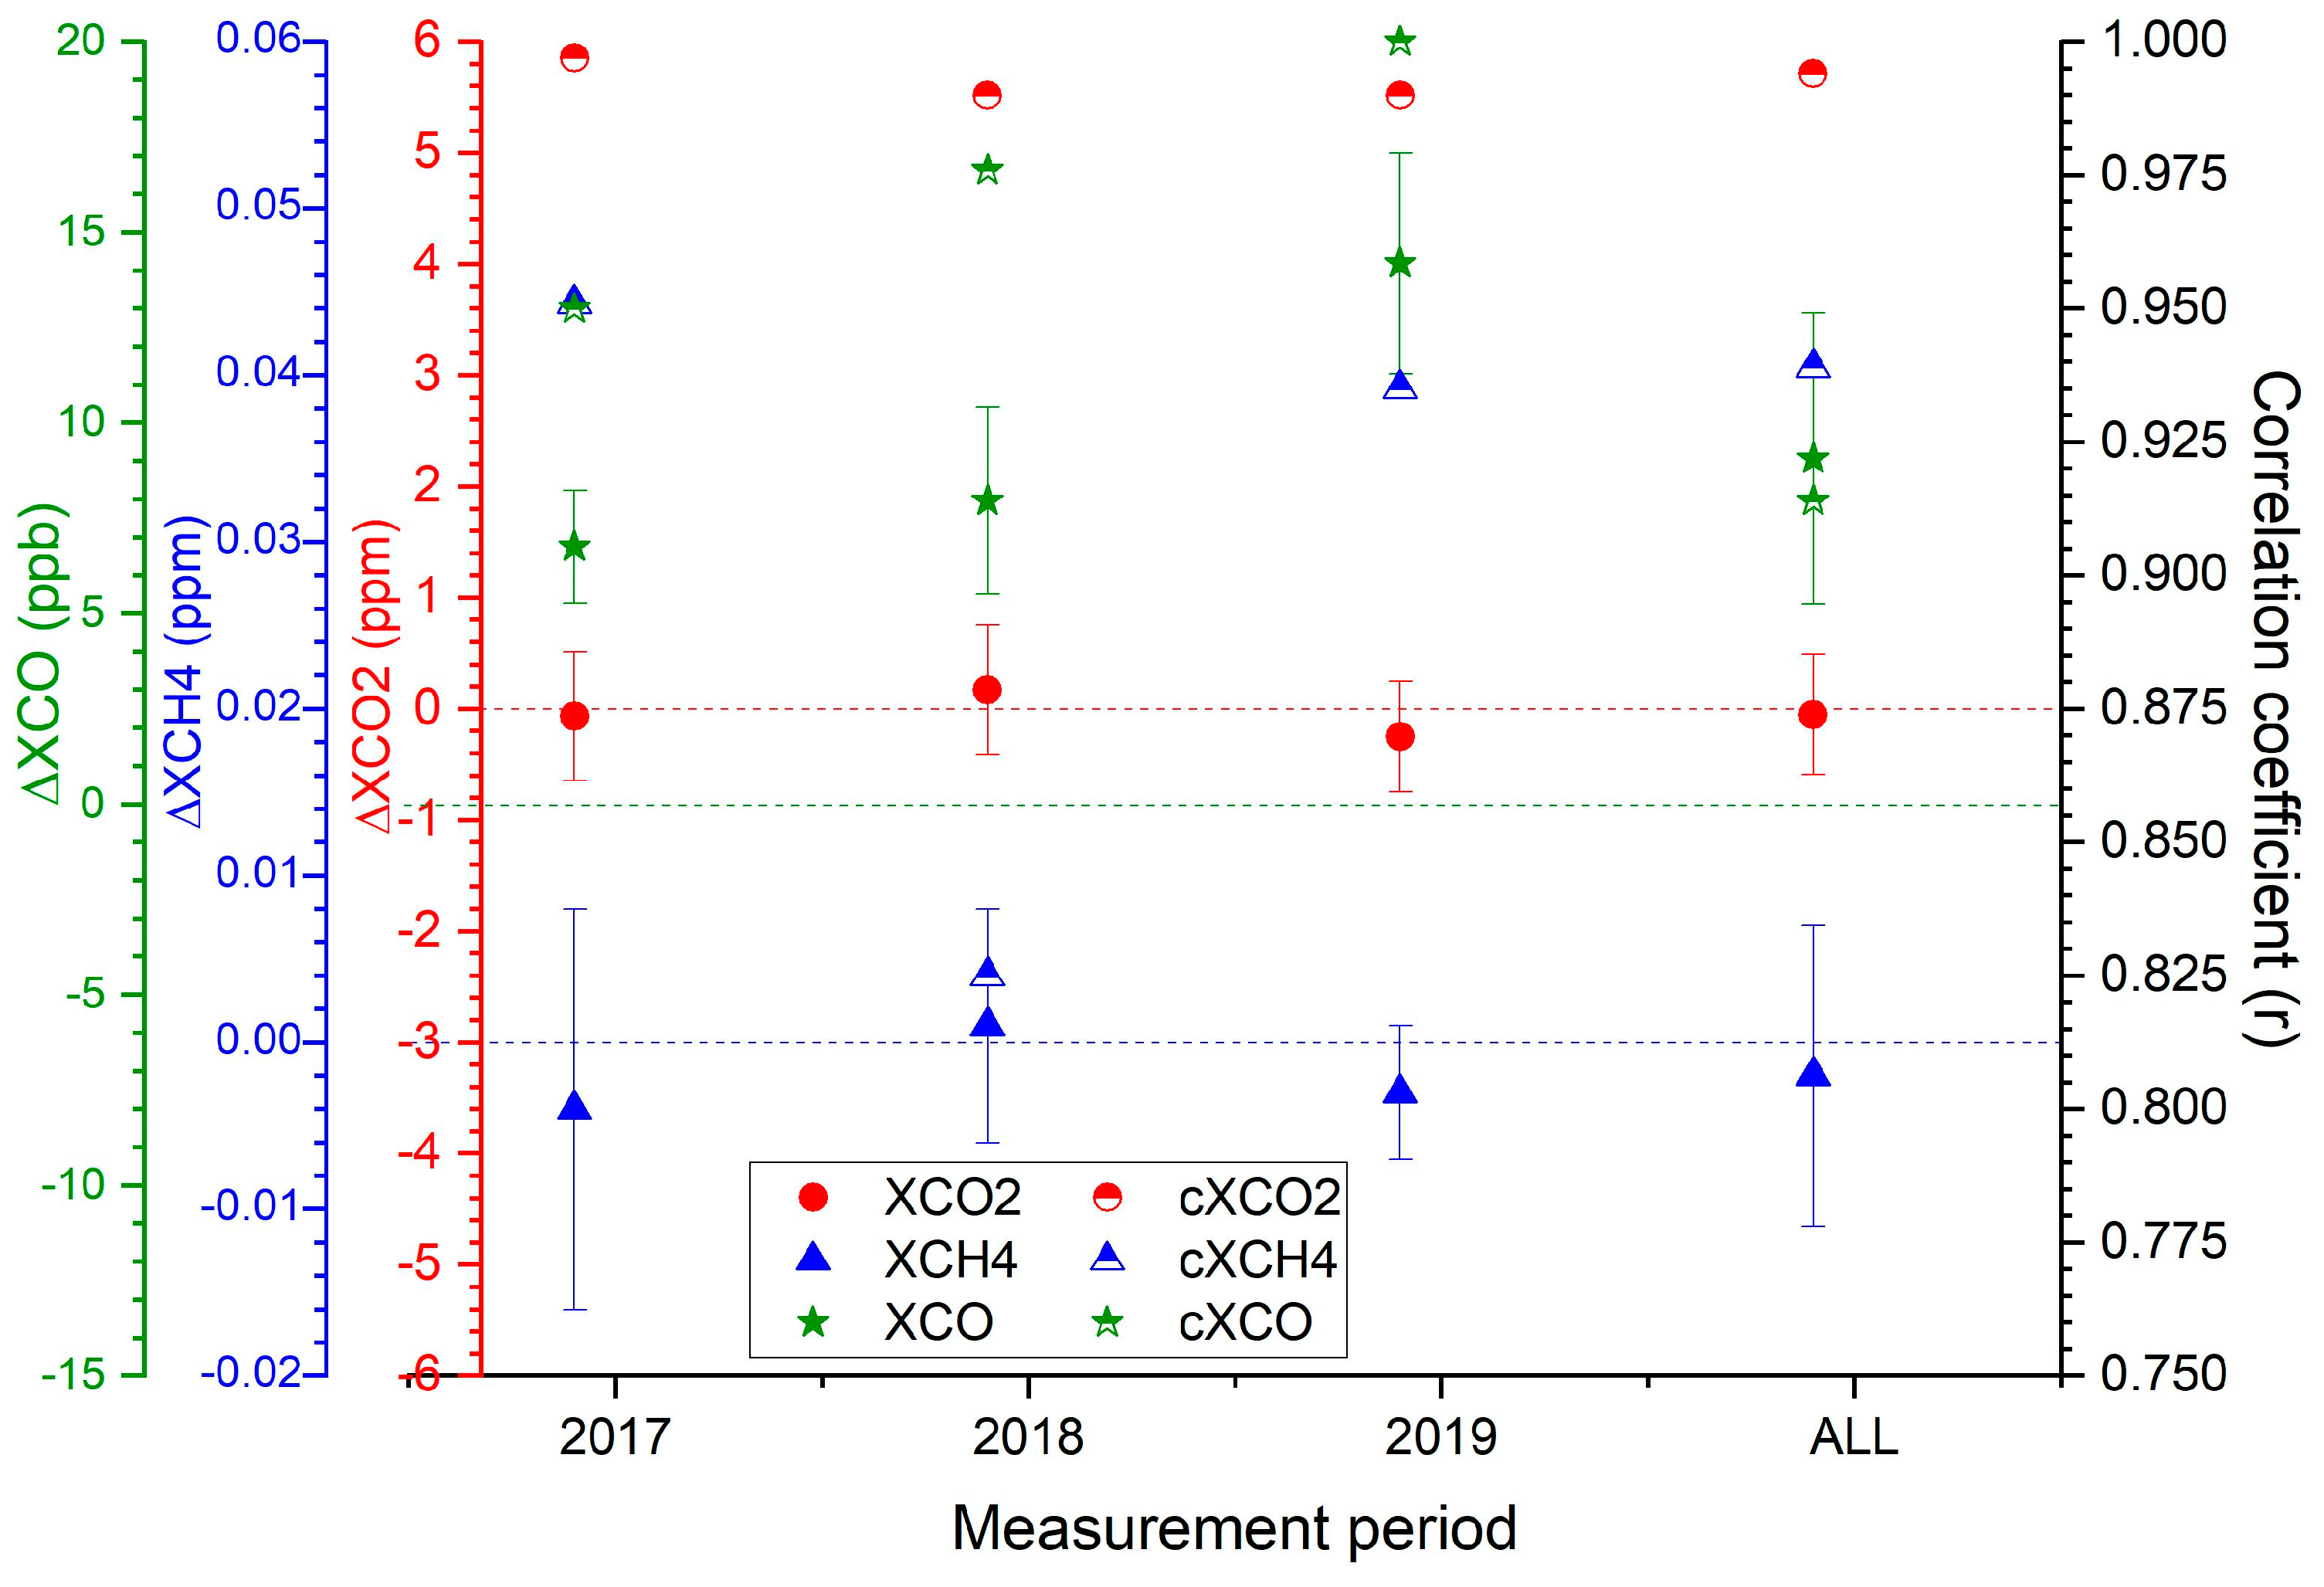
3.1.1. Intercomparison Results of the Total Column from AirCore and TCCON

A total of 10, 9, and 6 AirCore launches were performed during 2017, 2018, and 2019, respectively. The AirCore profiles typically cover the altitude range from about 25 km to almost the ground level. This is extended by replacing the lowermost layer of the AirCore profile with the in situ measurements performed at 2 m of height above ground level at a nearby forest measurement site. The upper part of the profile was further extended up to 70 km of altitude by a scaled TCCON a priori profile [7]. The modified AirCore profiles were used to calculate the Xgas values using the TCCON averaging kernels (AKs). These AirCore Xgas values are then used to compare to the Xgas values retrieved from the TCCON spectra. The acquisition time corresponding to 90% of the profile acquisition time starting at the top of the atmosphere is taken as the AirCore time stamp for the intercomparison. A time window of 3 h around the AirCore measurement time was used as the coincidence limit. This setting of the time window gives a good representation of the AirCore measurement. All TCCON measurements within this time window were averaged and considered as the coincident data for the intercomparison with the AirCore data. A stricter time window resulted in the reduction of collocated measurements, and relaxing the time window introduced the true variability of the atmospheric state in the remote sensing data (after averaging). We have seven, four, and four AirCores that were found to be of good quality and match the colocation criterion for the 2017, 2018, and 2019 campaign years in Sodankylä, respectively.
The time series of XCO2, XCH4, and XCO retrieved from the extended AirCore and TCCON measurements and their difference (AirCore—TCCONmod) are shown in Figure 2a–f. There is a clear indication of seasonality seen in the bias of XCH4. The large difference in XCH4 between the two datasets in the springtime is due to the difference between the a priori and the true state of the atmosphere. This is typical of the springtime polar vortex conditions at the Sodankylä site and not so usual for standard TCCON sites at mid-latitudes. The AirCore performing the in situ sampling of the vertical column of the atmosphere provides the true variability of the atmosphere in the sampled altitude range, while the modeled a priori used for the scaling retrieval of the TCCON measurements might not always be able to capture the full range of atmospheric variability as seen by the high bias in XCH4 during the springtime polar vortex conditions. The large difference in the XCO between the two datasets in 2019 is due to the AirCore data set of 2019 having some problems with the CO analysis that is still under investigation. While some of the TCCON XCO2 data matches very well with the AirCore, there are others where we see a large bias. The XCO2 comparison shows a large scatter of about ±0.542 ppm (1 sigma). Some of this is related to the TCCON a priori not being able to represent the true atmospheric state, while the others are related to the effect of the air-mass dependence for measurements performed at high solar zenith angles.
The mean bias and standard deviation of the differences and correlation coefficient between the Xgas values calculated from the AirCore and the collocated TCCON data for each year as well as the average over the three years, are plotted in Figure 3. The XCO2 mean bias between AirCore and TCCON is −0.051 ± 0.542 ppm with a correlation coefficient of 0.994. The XCH4 mean bias between AirCore and TCCON is −0.002 ± 0.009 ppm with a correlation coefficient of 0.939. The XCO mean bias between AirCore and TCCON is 9.062 ± 3.815 ppb with a correlation coefficient of 0.914.

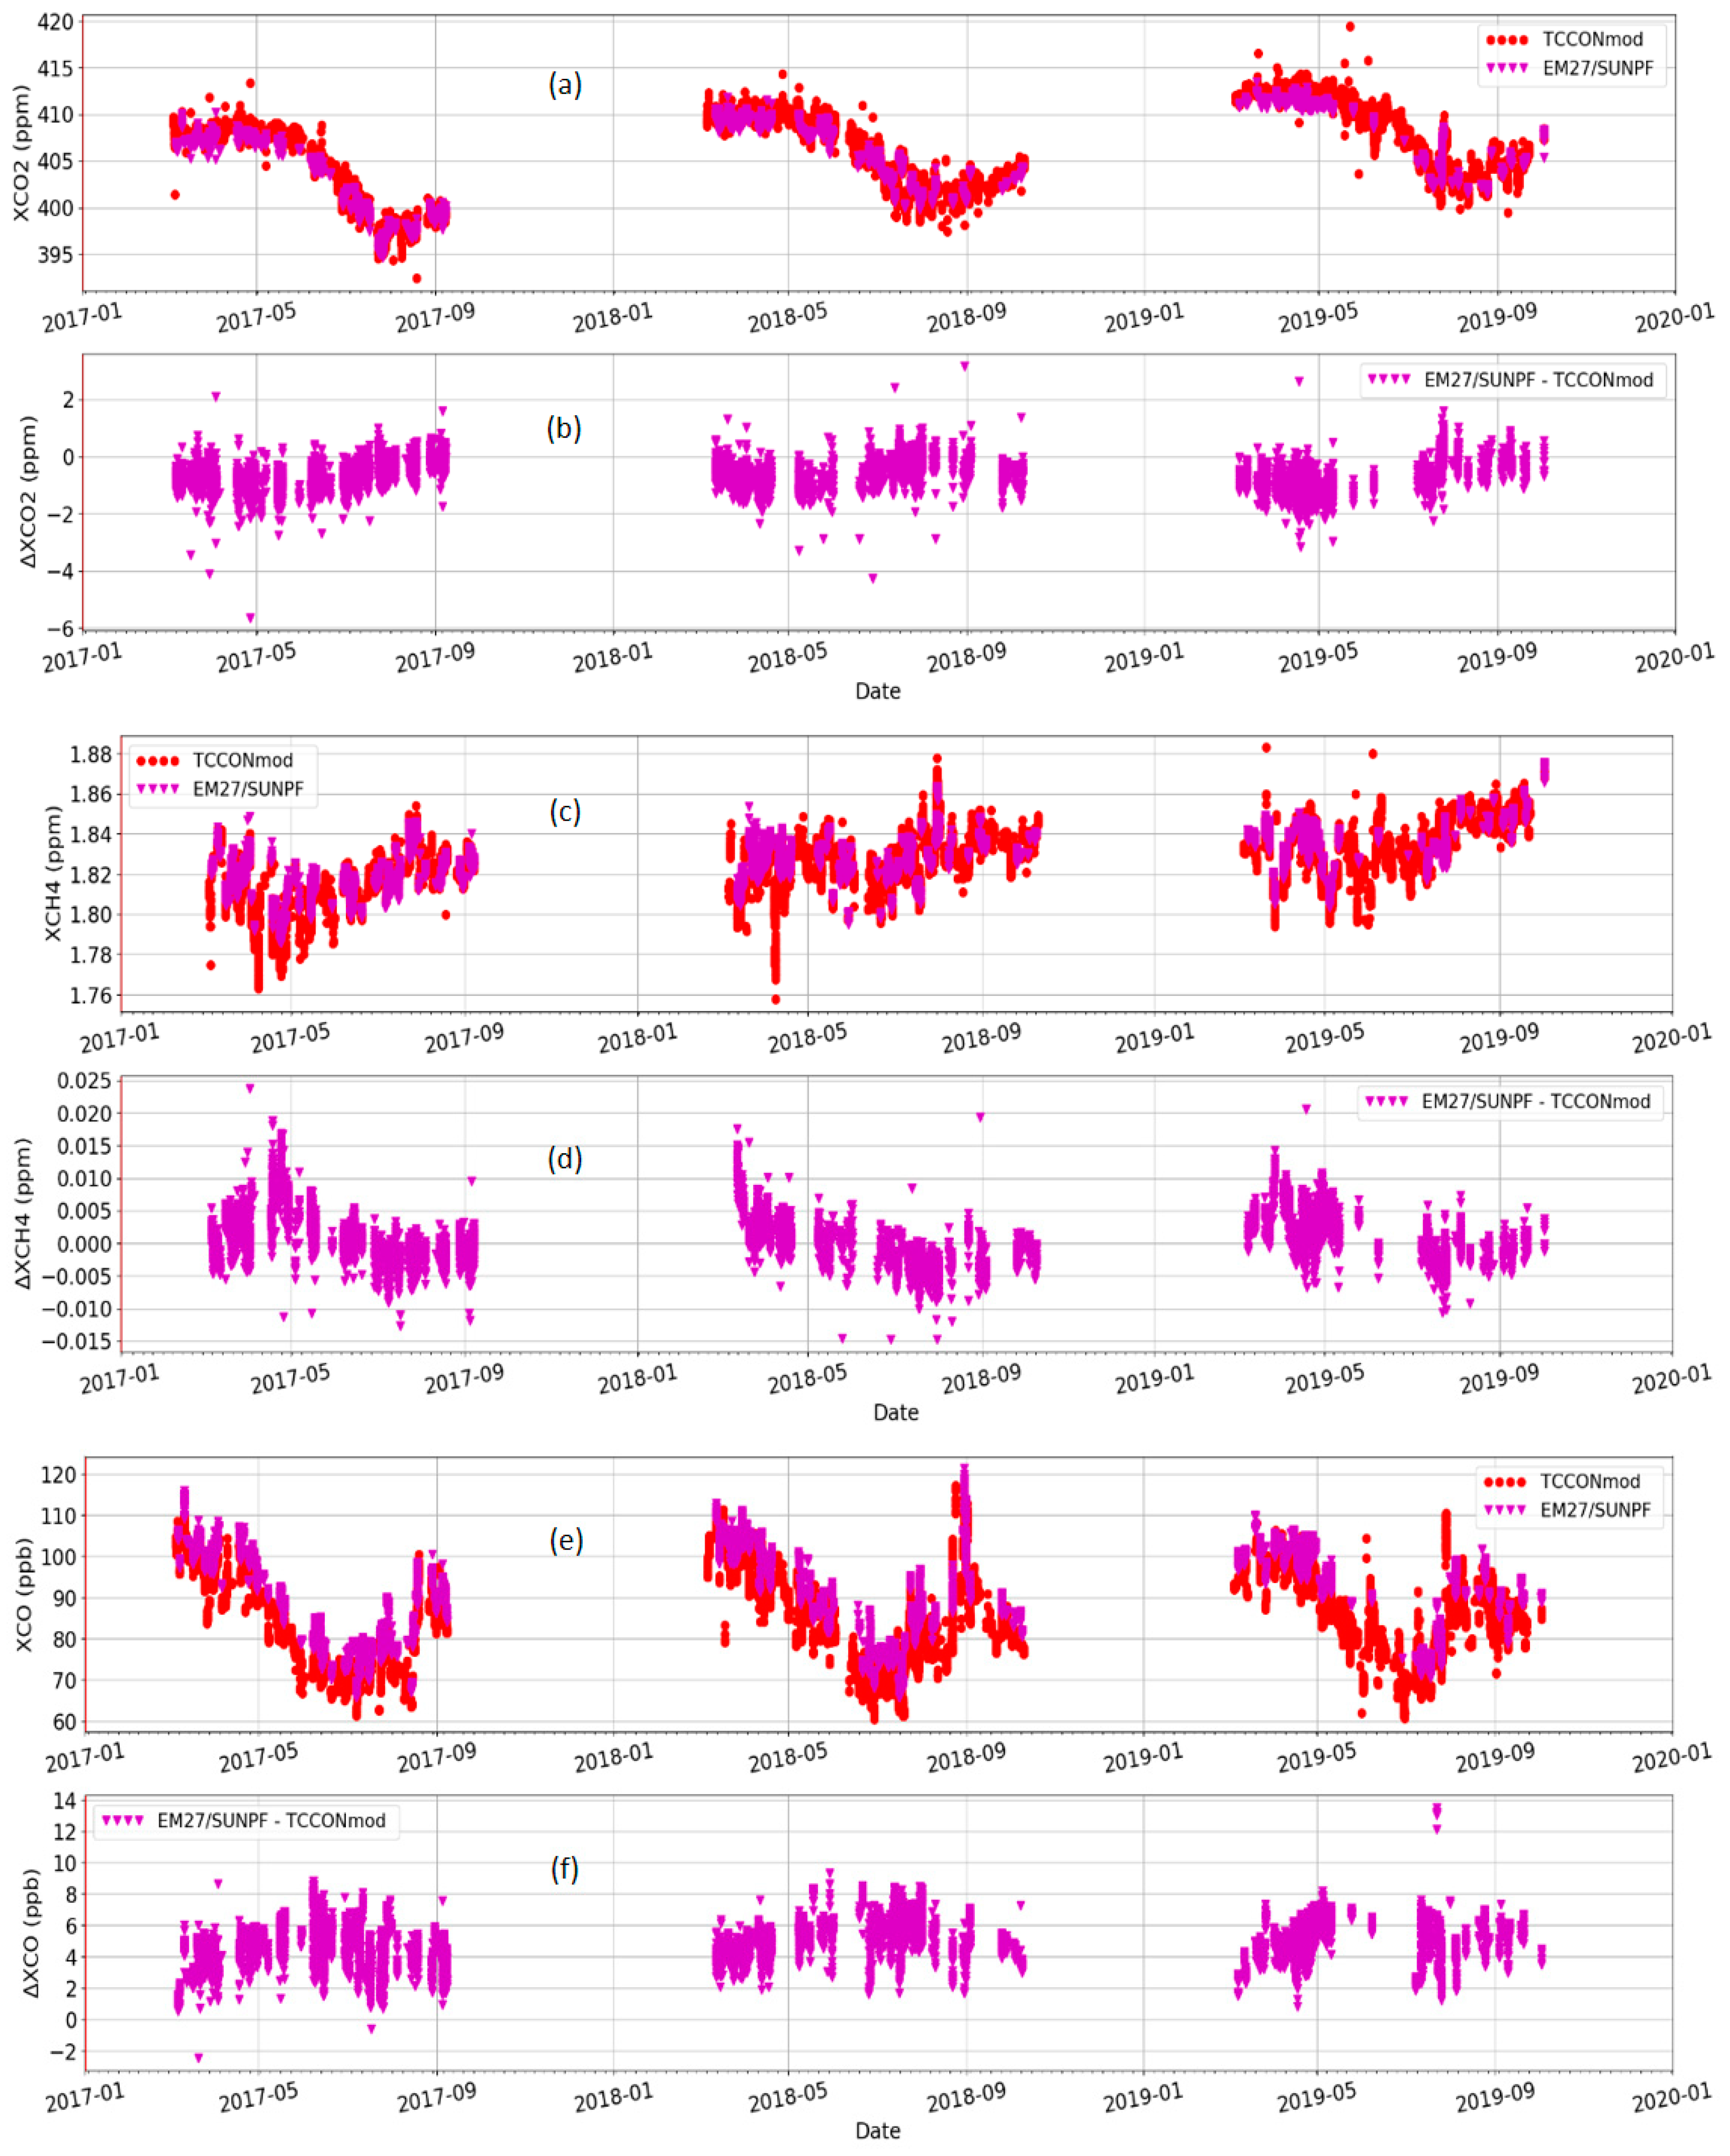
3.1.2. Intercomparison Results of the Total Column from EM27/SUN and TCCON

The EM27/SUN was operated during the three years of the campaign period with the same spectrometer settings without needing any adjustments. The time series of XCO2, XCH4, and XCO retrieved from the EM27/SUN using PROFFAST v1 and TCCON measurements and their differences (EM27/SUN—TCCON) are shown in Figure 4a–f. The XCO2 values are high during the early winter and low during the summer season, which represents the annual seasonal cycle at the site with a drawdown in the summer (Figure 4a). The bias (Figure 4b) shows seasonality with an amplitude of about 1 ppm. This is significant and comparable to the accuracy requirement (0.25%) of TCCON. The seasonal bias between TCCON and low-resolution EM27/SUN is not a drawback. It is understood and happens due to different instrument sensitivities (AKs) and the a priori difference from the true atmospheric state [7]. As the satellite sensors tend to use low spectral resolution, the sensitivity match is better, and therefore, the smoothing error in the validation would be smaller for low-resolution (LR) spectrometers. The seasonality of the bias for other sites will depend on the variability of the vertical profile shape during the year and their difference from the true atmospheric state. The XCH4 values are high during the later winter period, which is then followed by a dip during the spring and a rise during the summer period (Figure 4c). The bias (Figure 4d) shows a seasonality with about a 10 ppb increase during the springtime (polar vortex conditions). During the rest of the year, the seasonality is reduced with an amplitude of about 3 to 5 ppb. This is significant and comparable to the accuracy requirement (0.2%) of TCCON. The XCO values are high during the late winter, followed by a dip during summer and rising values during the late summer period (Figure 4e). The bias (Figure 4f) shows a seasonality with an amplitude of about 2 to 4 ppb. This is significant and comparable to the accuracy requirement of TCCON (2%). In general, the EM27/SUN is able to capture very well all of the features seen in the TCCON time series, including the seasonal cycle, specific events of enhanced CO (due to fire plumes passing over the site), and features in the CO2 and CH4 signal seen as small enhancements.
The mean bias, standard deviation of the difference, and correlation coefficient of the Xgas values calculated from the EM27/SUN relative to the TCCON for each year and the average of the three years are plotted in Figure 5. The XCO2 mean bias between EM27/SUN and TCCON is −0.722 ± 0.510 ppm and a correlation coefficient of 0.995. The XCH4 mean bias between EM27/SUN and TCCON is 0.001 ± 0.004 ppm and a correlation coefficient of 0.963. The XCO mean bias between EM27/SUN and TCCON is 4.738 ± 1.321 ppb and a correlation coefficient of 0.994. The year-to-year variability for the three years of comparison results for XCO2 is 0.137 ppm (0.03%) with a standard deviation of 0.5 ppm (1σ), for XCH4 is 0.001 ppm (0.05%) with a standard deviation of 0.004 ppm (1σ), and for XCO is 0.363 ppm (0.4%) with a standard deviation of 1.32 ppm (1σ). These results are very well below the TCCON precision requirements for XCO2 to be <0.25% (<1 ppm), for XCH4 to be <0.5% (<0.009 ppm), and for XCO to be <4% (<4 ppm). The year-to-year variability results are very promising, showing how stable the EM27/SUN was during the three years of its operation. Similar findings are also reported by Frey et al., 2019 [19] where the comparison of about 3.5 years of side-by-side measurements using EM27/SUN and TCCON at the Karlsruhe TCCON site showed year-to-year variability of the XCO2 as 0.02 ppm (0.005%) with a standard deviation of 0.6 ppm (1σ), for XCH4 as 0.001 ppm (0.05%) with a standard deviation of 0.004 ppm (1σ). Note that in these comparisons, the standard deviation of the bias and the year-to-year variability of the bias are the key parameters. The absolute value of the bias should remain constant over the years and will be scaled out using a calibration factor calculated from the intercomparison exercise performed with the EM27/SUN against TCCON spectrometers (Karlsruhe, Sodankylä, …). This will tie the EM27/SUN to the TCCON scale, which is then traceable to the WMO reference scale, thereby making the EM27/SUN also indirectly traceable to the WMO reference scale.

3.1.3. Intercomparison Results of the Total Column from Vertex70 and TCCON

Several instrumental modifications were performed to the Vertex70 spectrometer (see Section 2.2.3) to improve its performance and provide high-quality GHG data. The modifications helped to better understand the operation of the spectrometer, and finally, the configuration with the best results was selected towards the end of the second year, and measurements were continued with the same settings in the third year to have at least one full year of measurements without any instrument modification. The time series of XCO2 retrieved from the Vertex70 and TCCON measurements and their difference (Vertex70—TCCON) are shown in Figure 6a,b. The shaded areas represent the periods of measurements where the instrument settings were not optimal and are therefore removed from the analysis. They are shown here to highlight the effects seen as a change in bias (step change), occurrence of slope in the bias (possible effect of non-linearity due to too strong signal entering the detector), and high scatter (poor precision). The XCO2 values from the Vertex70 show a similar seasonal cycle as the TCCON (Figure 6a). The bias (Figure 6b) shows a seasonality similar to the comparison with the EM27/SUN spectrometer but with slightly reduced amplitude. This is due to the slightly higher spectral resolution (0.2 cm−1) of the Vertex70 as compared to the EM27/SUN (0.5 cm−1).
The mean bias and standard deviation of the differences and correlation coefficient between Xgas values calculated from the Vertex70 (with data only from the period with optimized instrument configuration) and the TCCON instrument for each year as well as the averages over the three years, are plotted in Figure 7. The XCO2 mean bias between Vertex70 and TCCON is −0.636 ± 0.558 ppm with a correlation coefficient of 0.996. The XCH4 mean bias between Vertex70 and TCCON is 0.009 ± 0.003 ppm with a correlation coefficient of 0.968. The XCO mean bias between Vertex70 and TCCON is 0.856 ± 0.961 ppb with a correlation coefficient of 0.995. It is difficult to give a number for the year-to-year variability as measurements with the optimized setting are available only for one full year. However, the standard deviations of the biases and the correlation coefficients for the three gases are comparable to the results of the comparison of the EM27/SUN with the TCCON. The Vertex70 was, therefore, able to achieve the same level of performance as the EM27/SUN for the XCO2, XCH4, and XCO data.

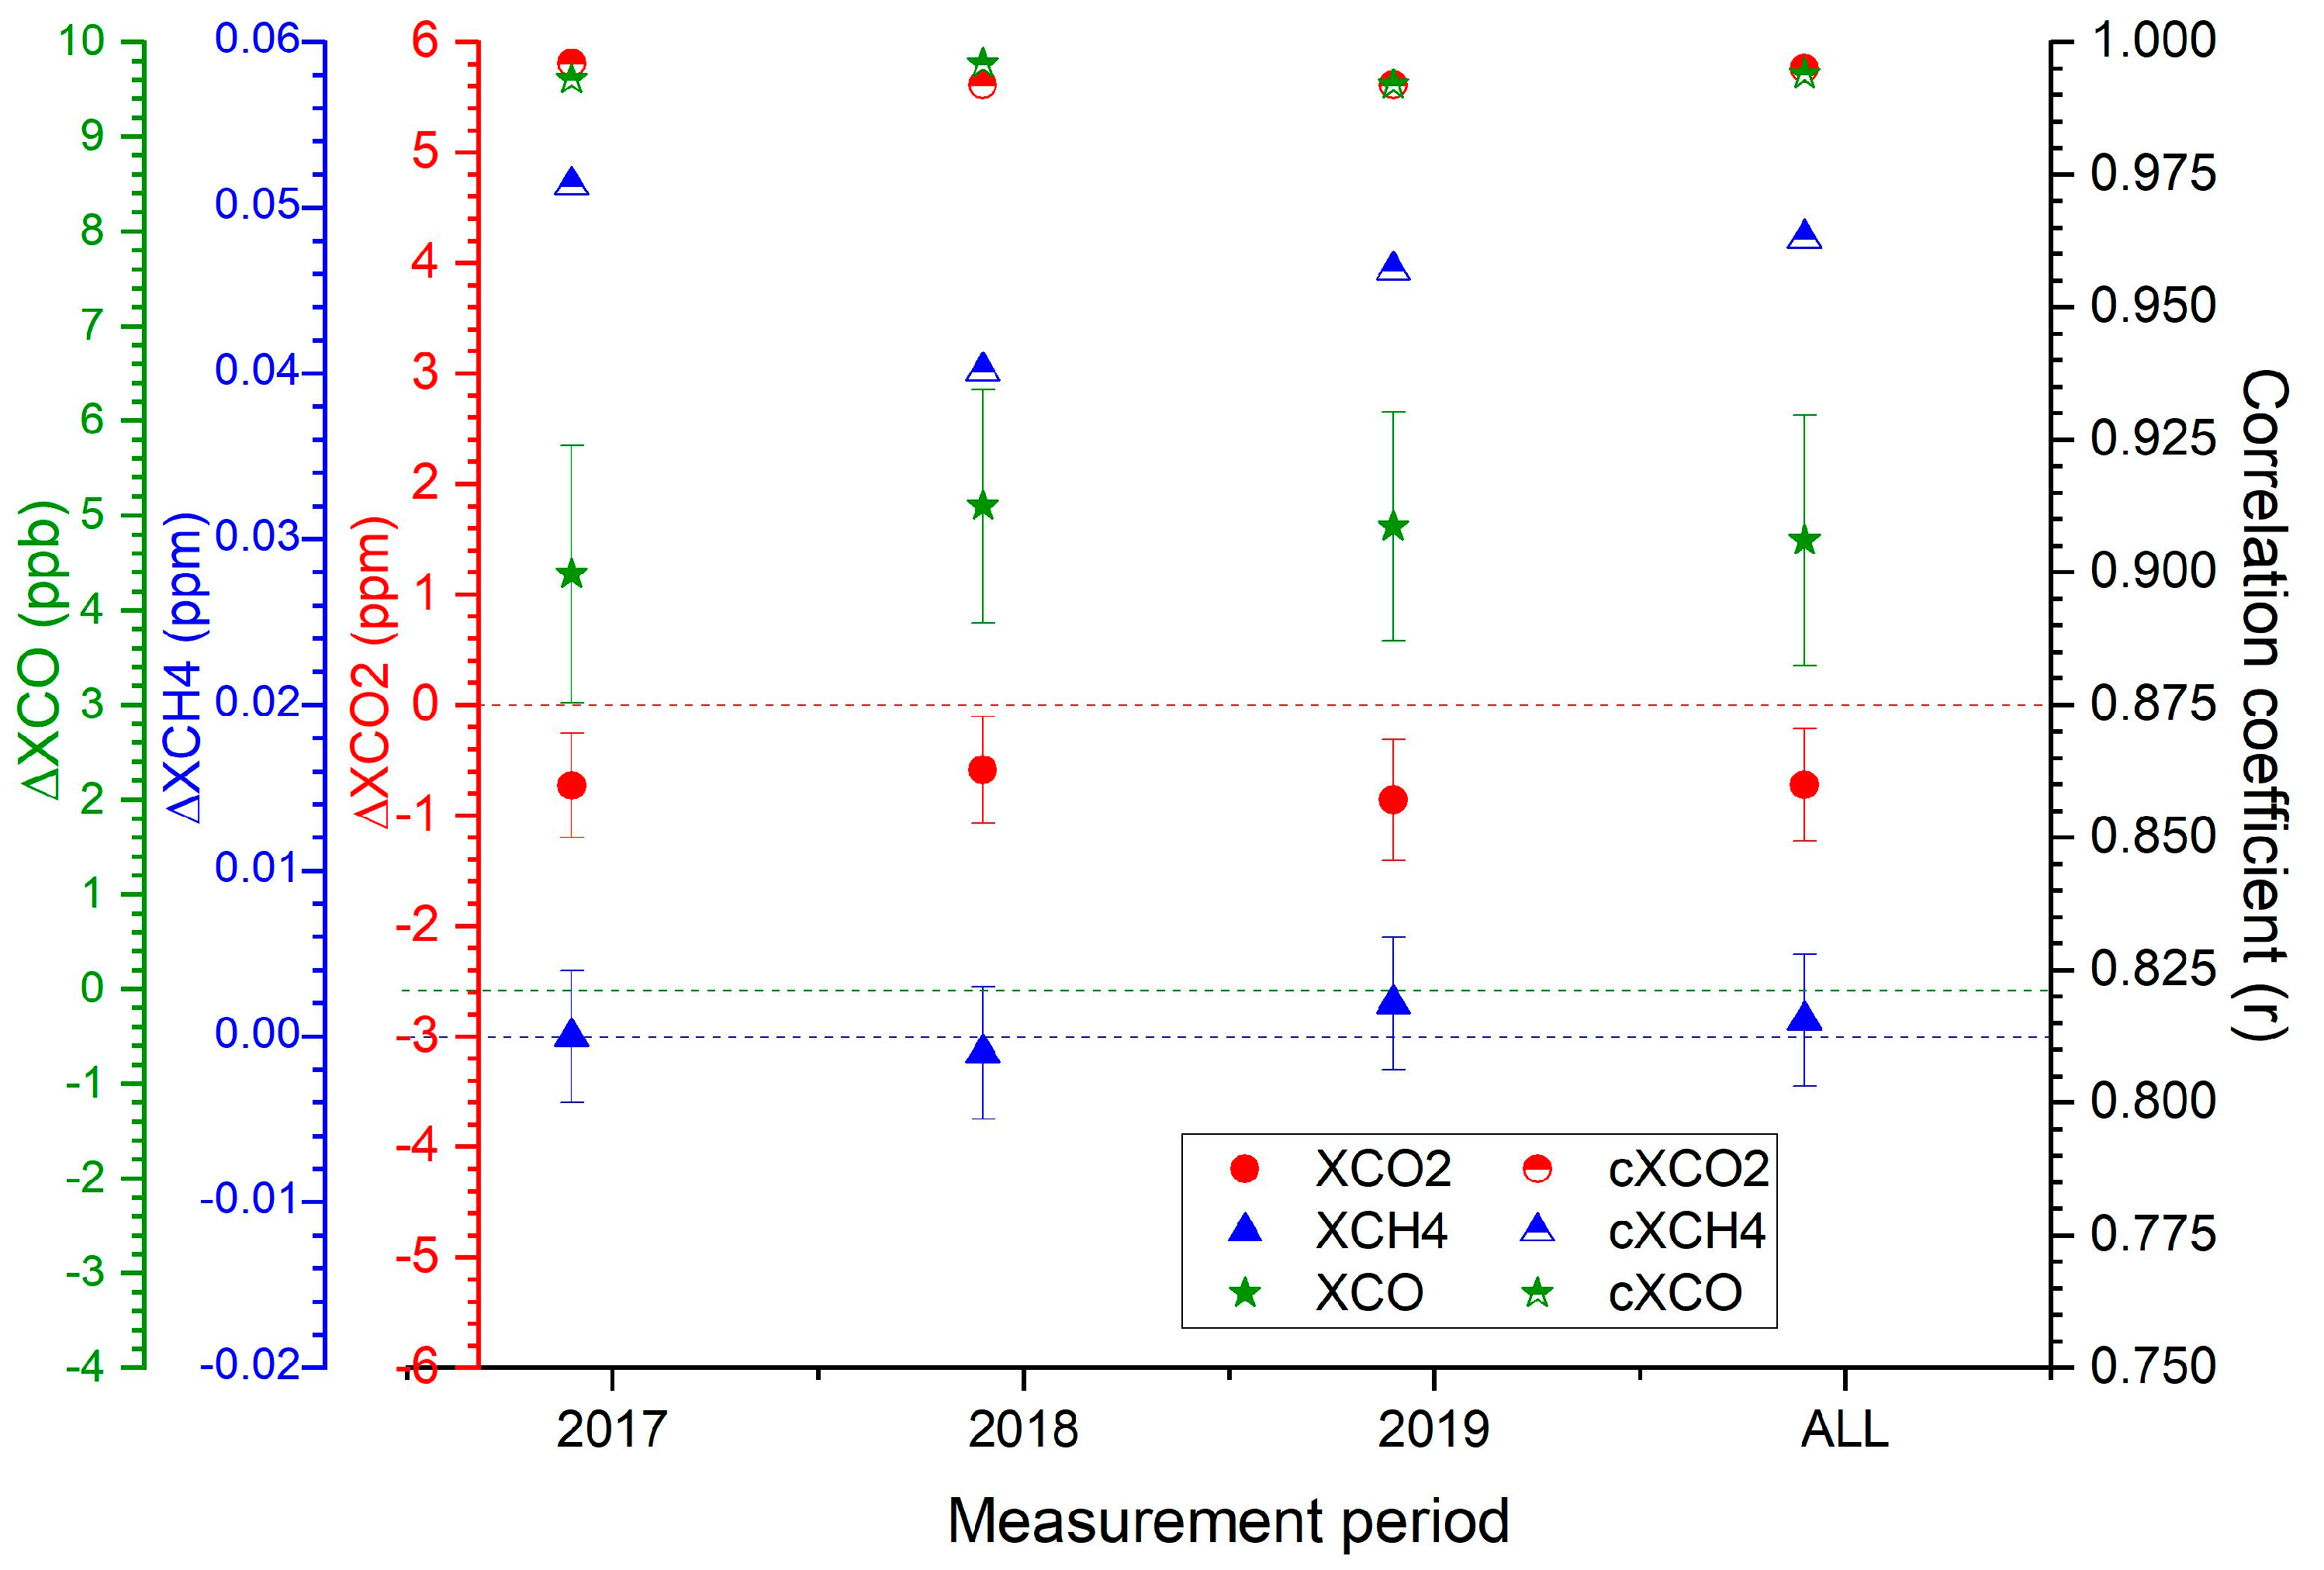
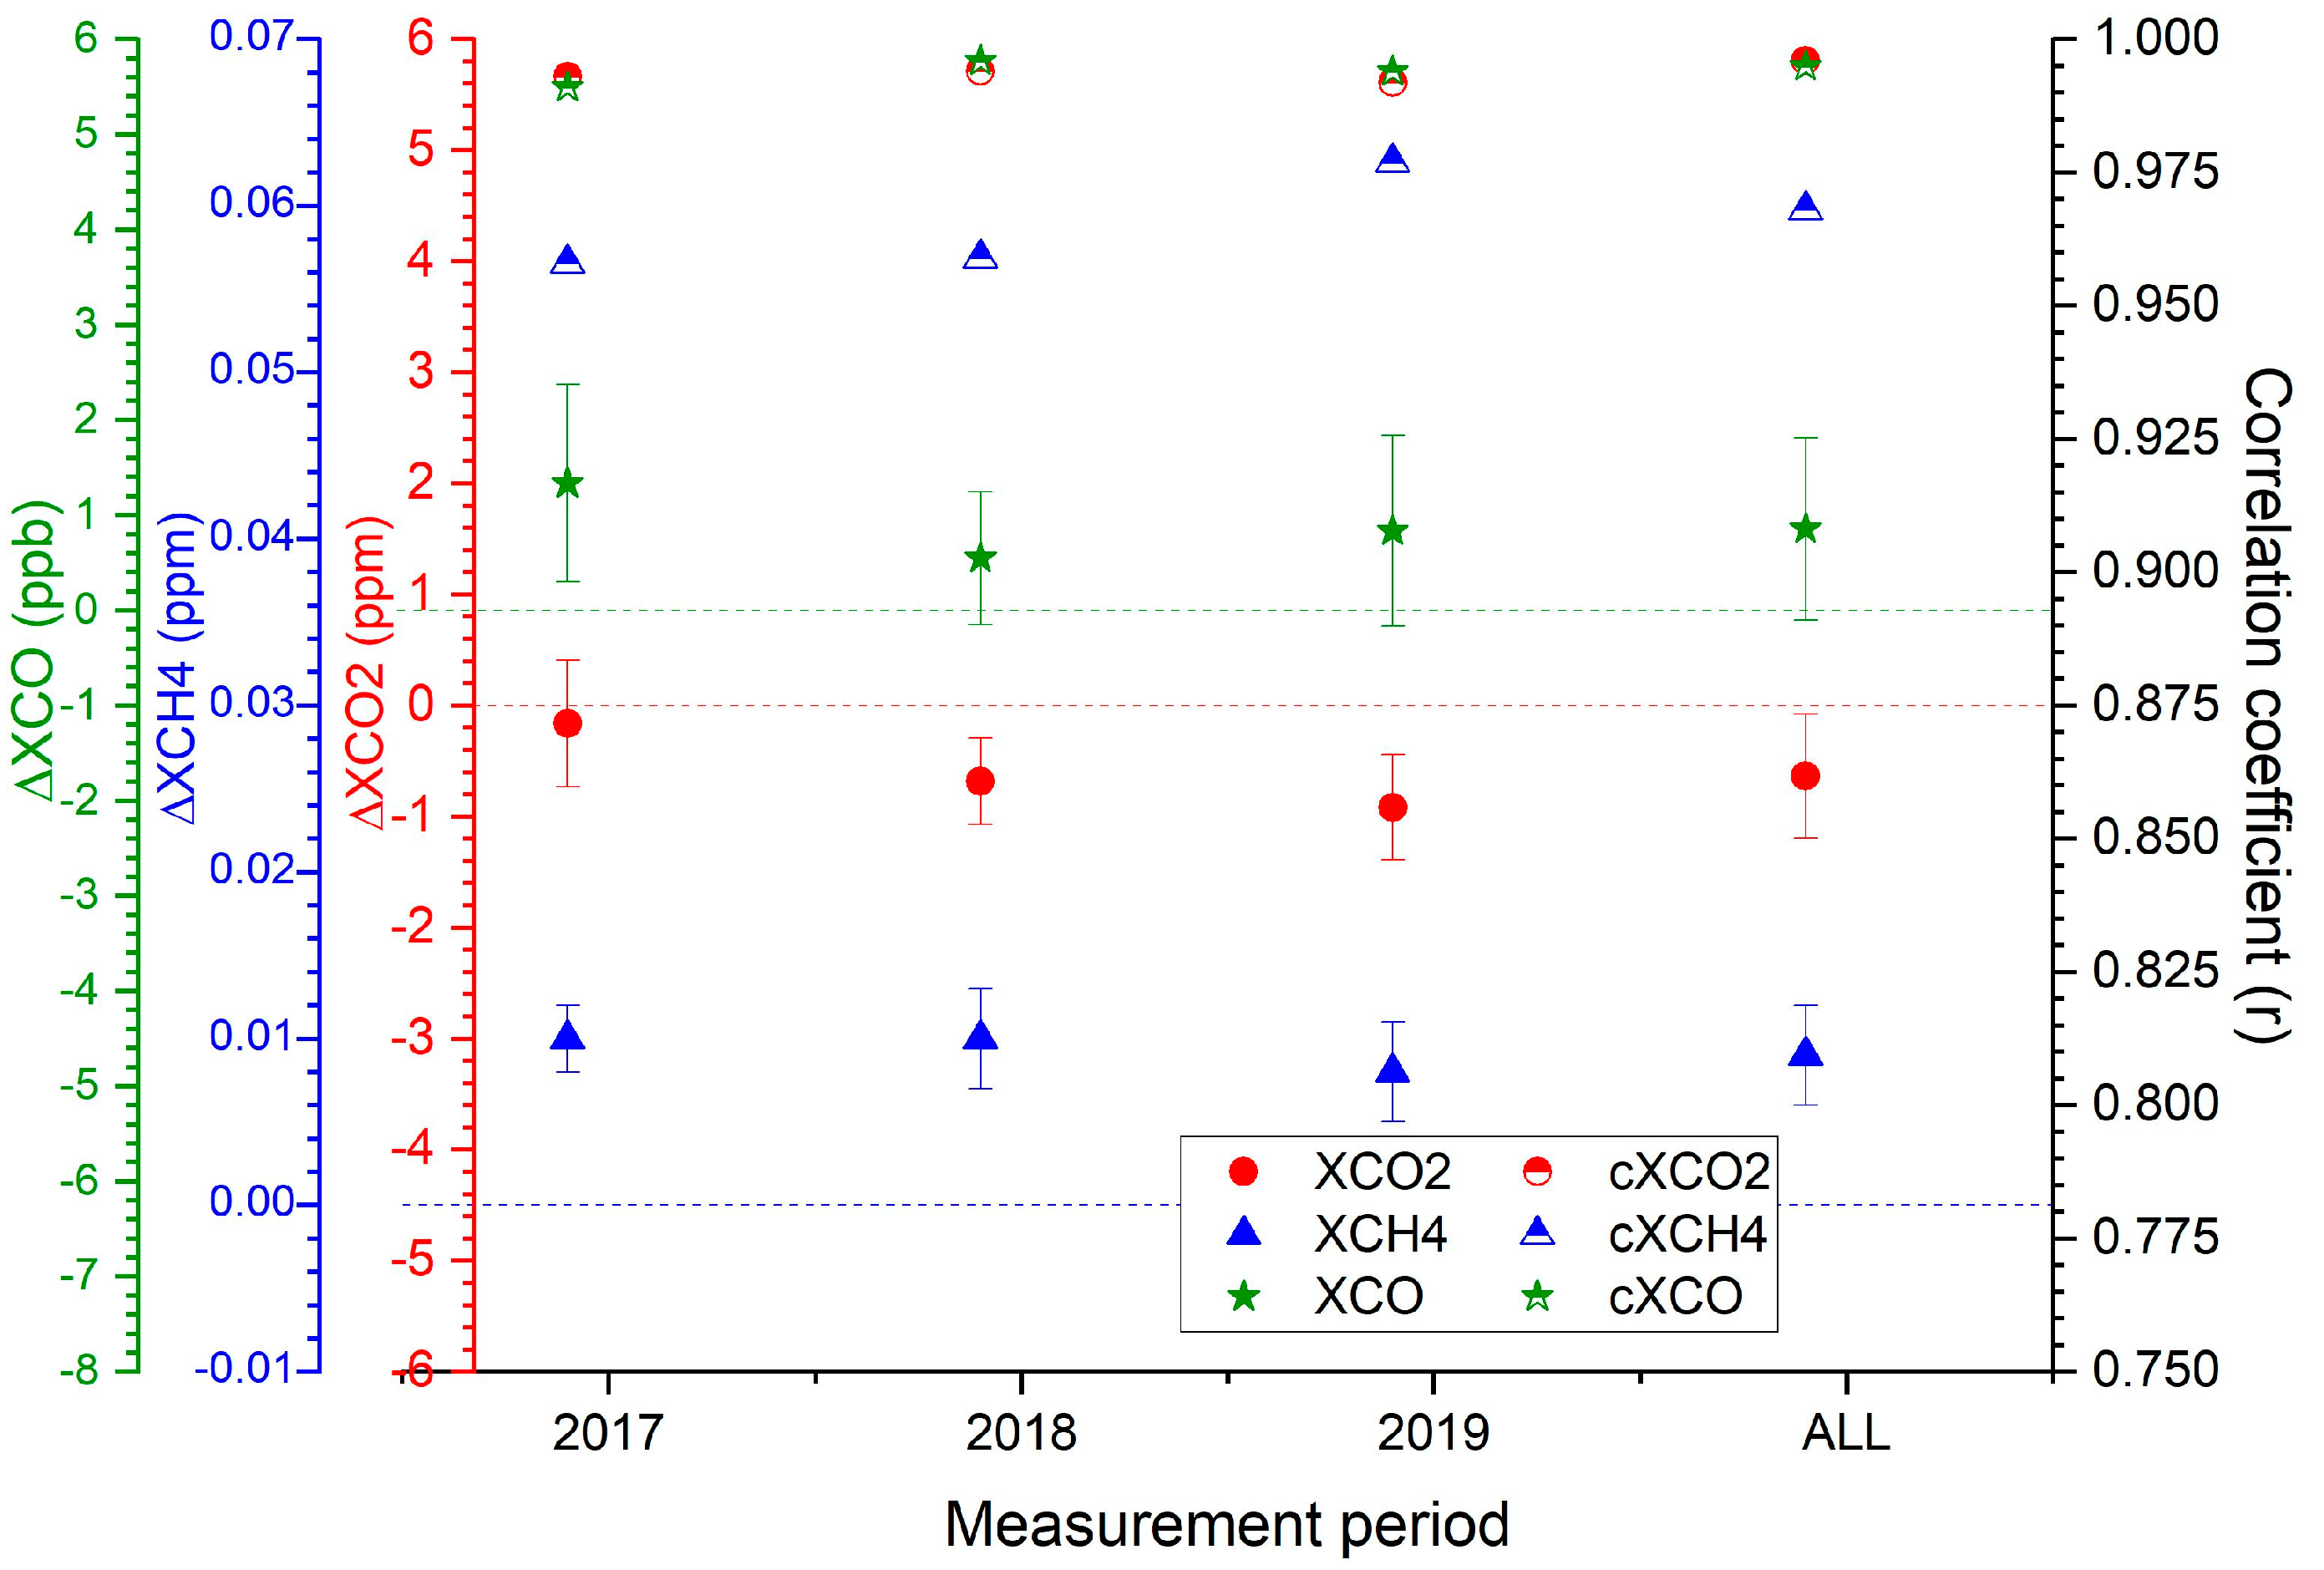
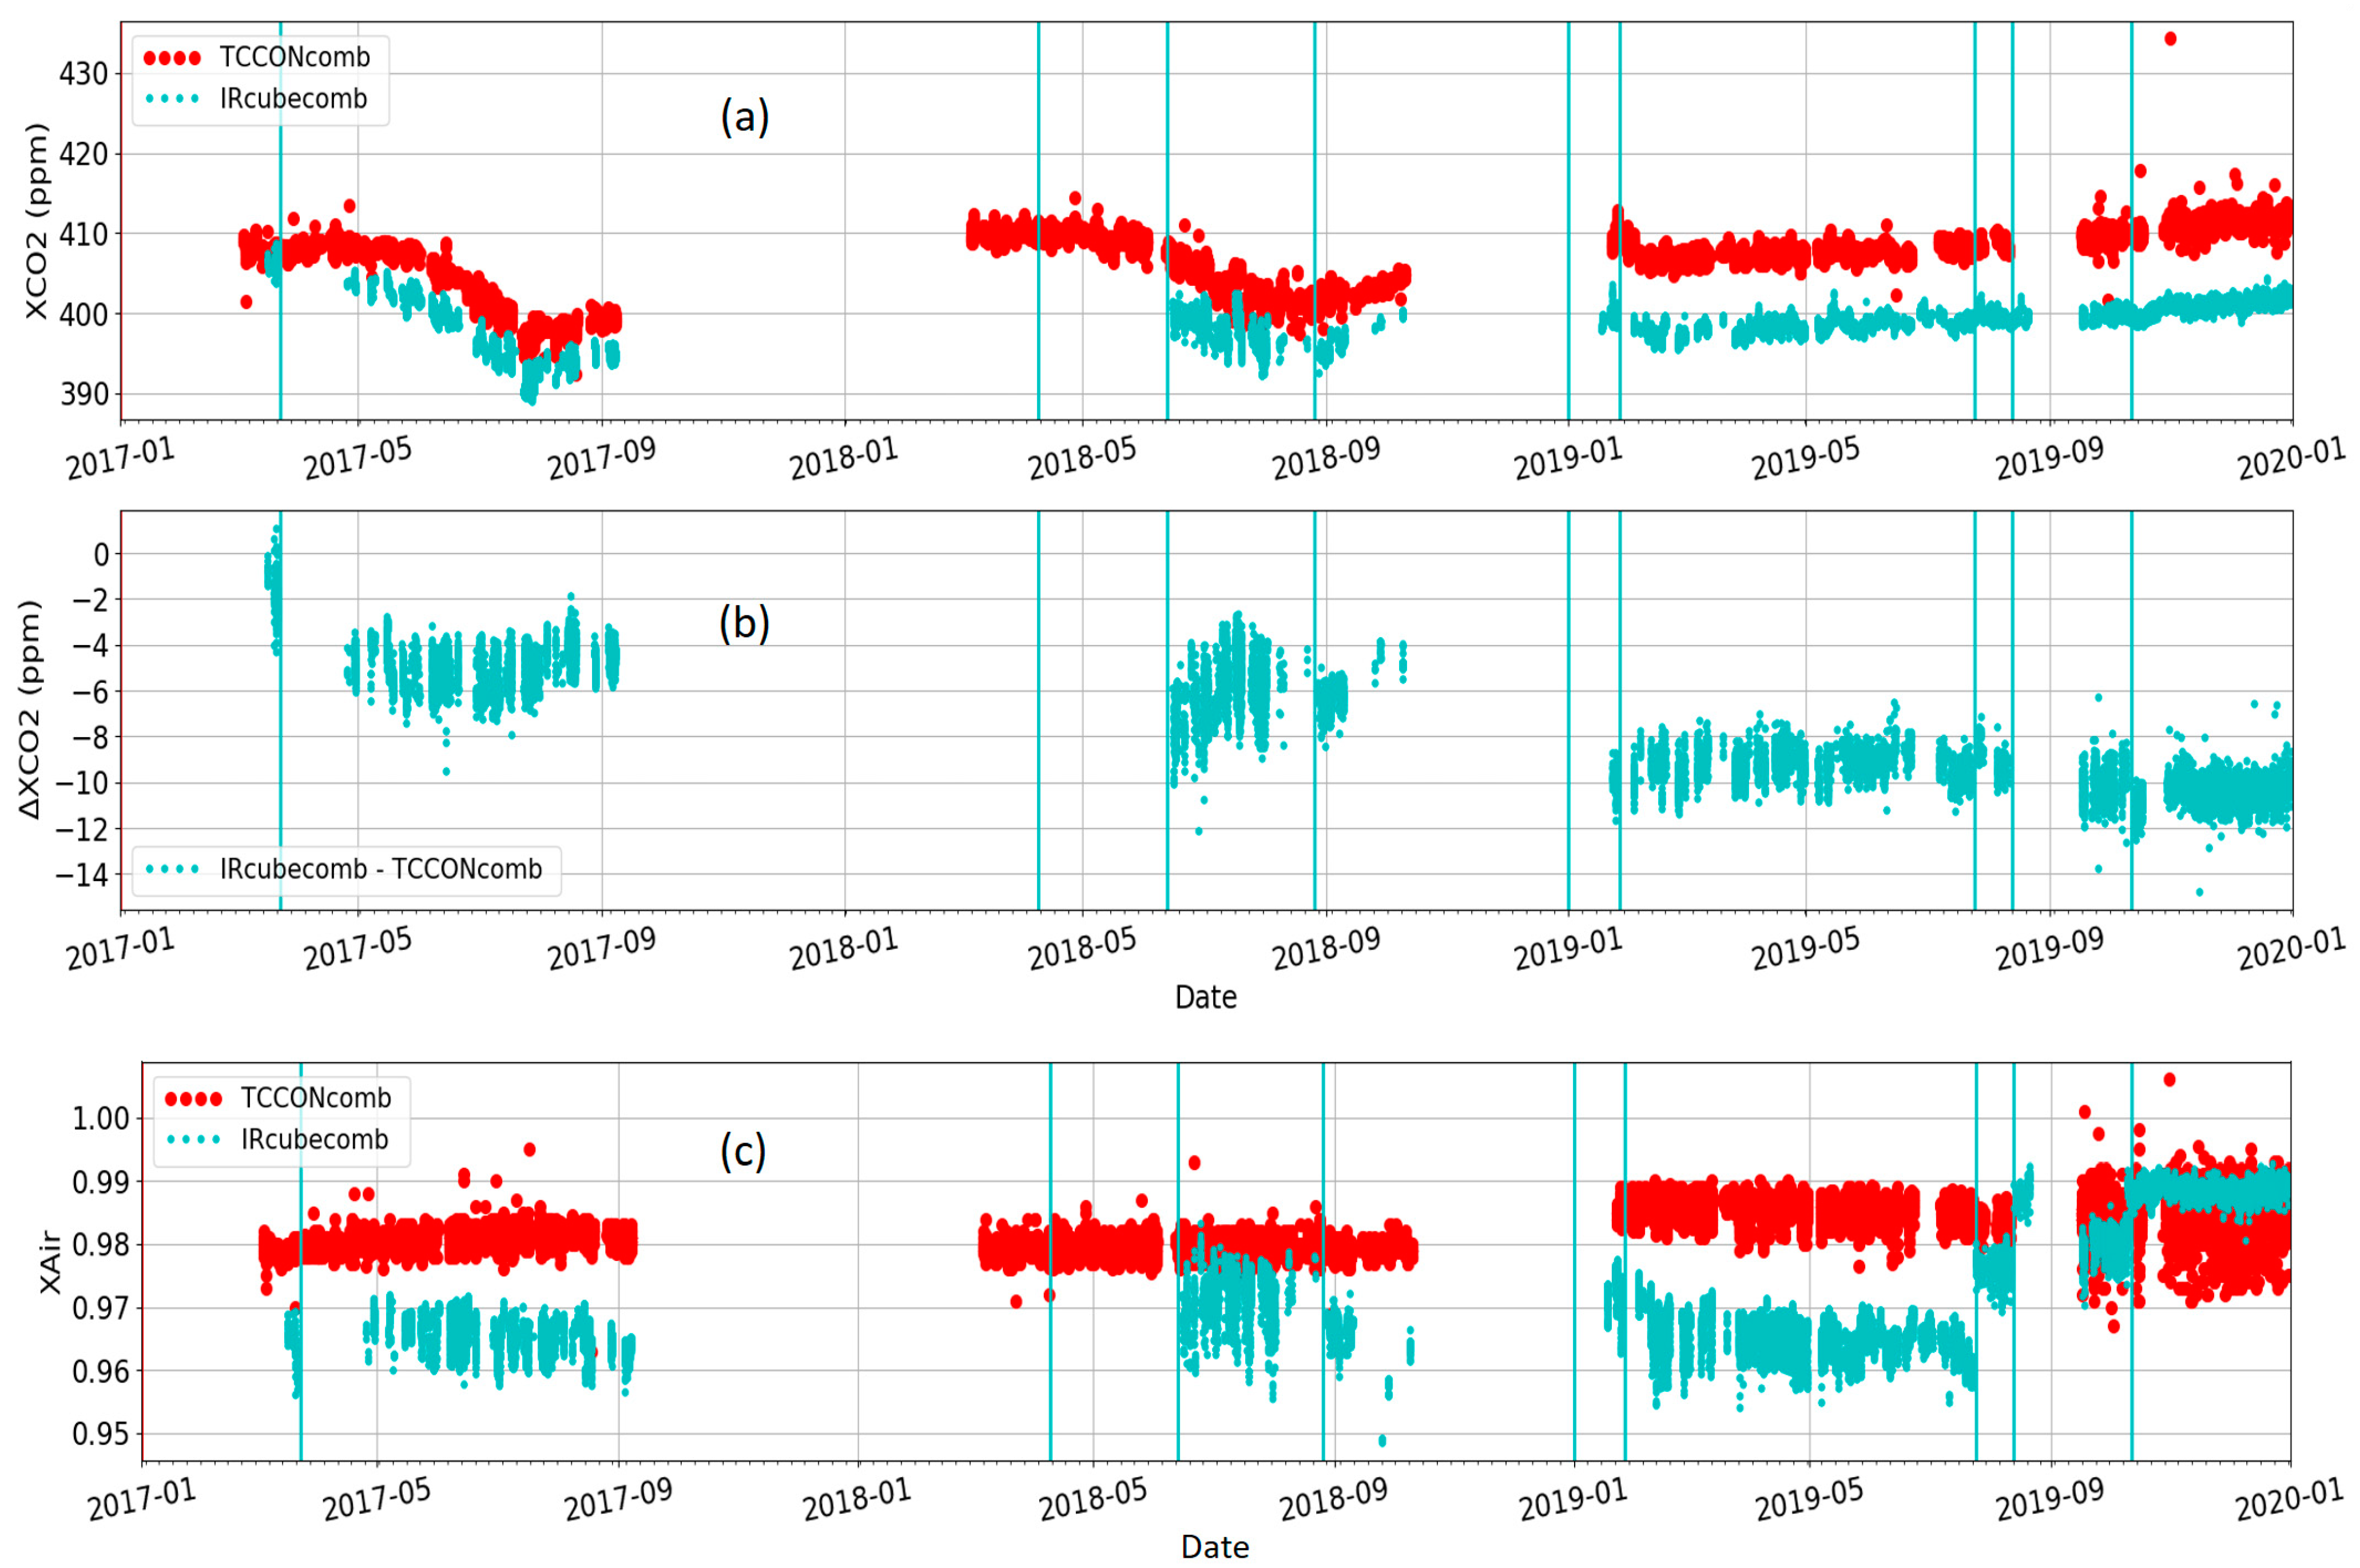
3.1.4. Intercomparison Results of the Total Column from IRCube and TCCON

The IRCube underwent several modifications, as described in Section 2.2.4, to improve its performance and to better understand the operation of the spectrometer with the fiber optic coupling. The time series of XCO2 retrieved from the IRCube and TCCON measurements and their difference (IRCube—TCCON) are shown in Figure 8a,b. The data from 2017 and 2018 were collected in Sodankylä, while the first part of the data from 2019 (until the end of August) was collected in Wollongong, and the second part (starting in September) was collected in Darwin. The IRCube is able to capture the seasonal cycle, as seen by the TCCON instrument, to some extent. However, there are several jumps in the data showing high and low biases due to some of the modifications. The bias in the XCO2 is strongly dependent on the modifications. The cause of these bias changes is under investigation and discussed in Section 3.4. However, the scatter in the data has improved over time and is the best for the measurements performed in Darwin. The precision for XCO2 is 0.597 ppm, and that for XCH4 is 0.003 ppm for the comparisons performed in Darwin relative to the TCCON. The XAir (column-averaged dry-air mole fraction of dry air) for the IRCube is also plotted in Figure 8c, along with XAir from the TCCON measurements. XAir is a measure of the instrument’s performance. The jumps seen in the XAir data of the IRCube are clear indications of all instrumental changes (also shown as vertical lines in the plot). The XAir plots for the Darwin data also show significant improvement in the scatter of the IRCube data since the beginning of the campaign in Sodankylä, and other modifications have been performed ever since.
The mean bias, standard deviation of the difference, and correlation coefficient of the Xgas values calculated from the IRCube relative to the TCCON for each year and the average of the three years are plotted in Figure 9. The variability of the XCO2 bias was already clear in Figure 8b. Figure 9 also shows the variability of the bias in the XCH4 values from the IRCube measurements relative to the TCCON at the different locations and the poor correlation coefficients. The bias in the XCH4 for Darwin is close to zero (0.002 ppm), while the XCO2 bias is very high (−10.487 ppm). At the end of the three-year campaign, IRCube data were not comparable to the reference TCCON or the EM27/SUN, and therefore, further work is needed to improve its performance. This is discussed in Section 3.4.

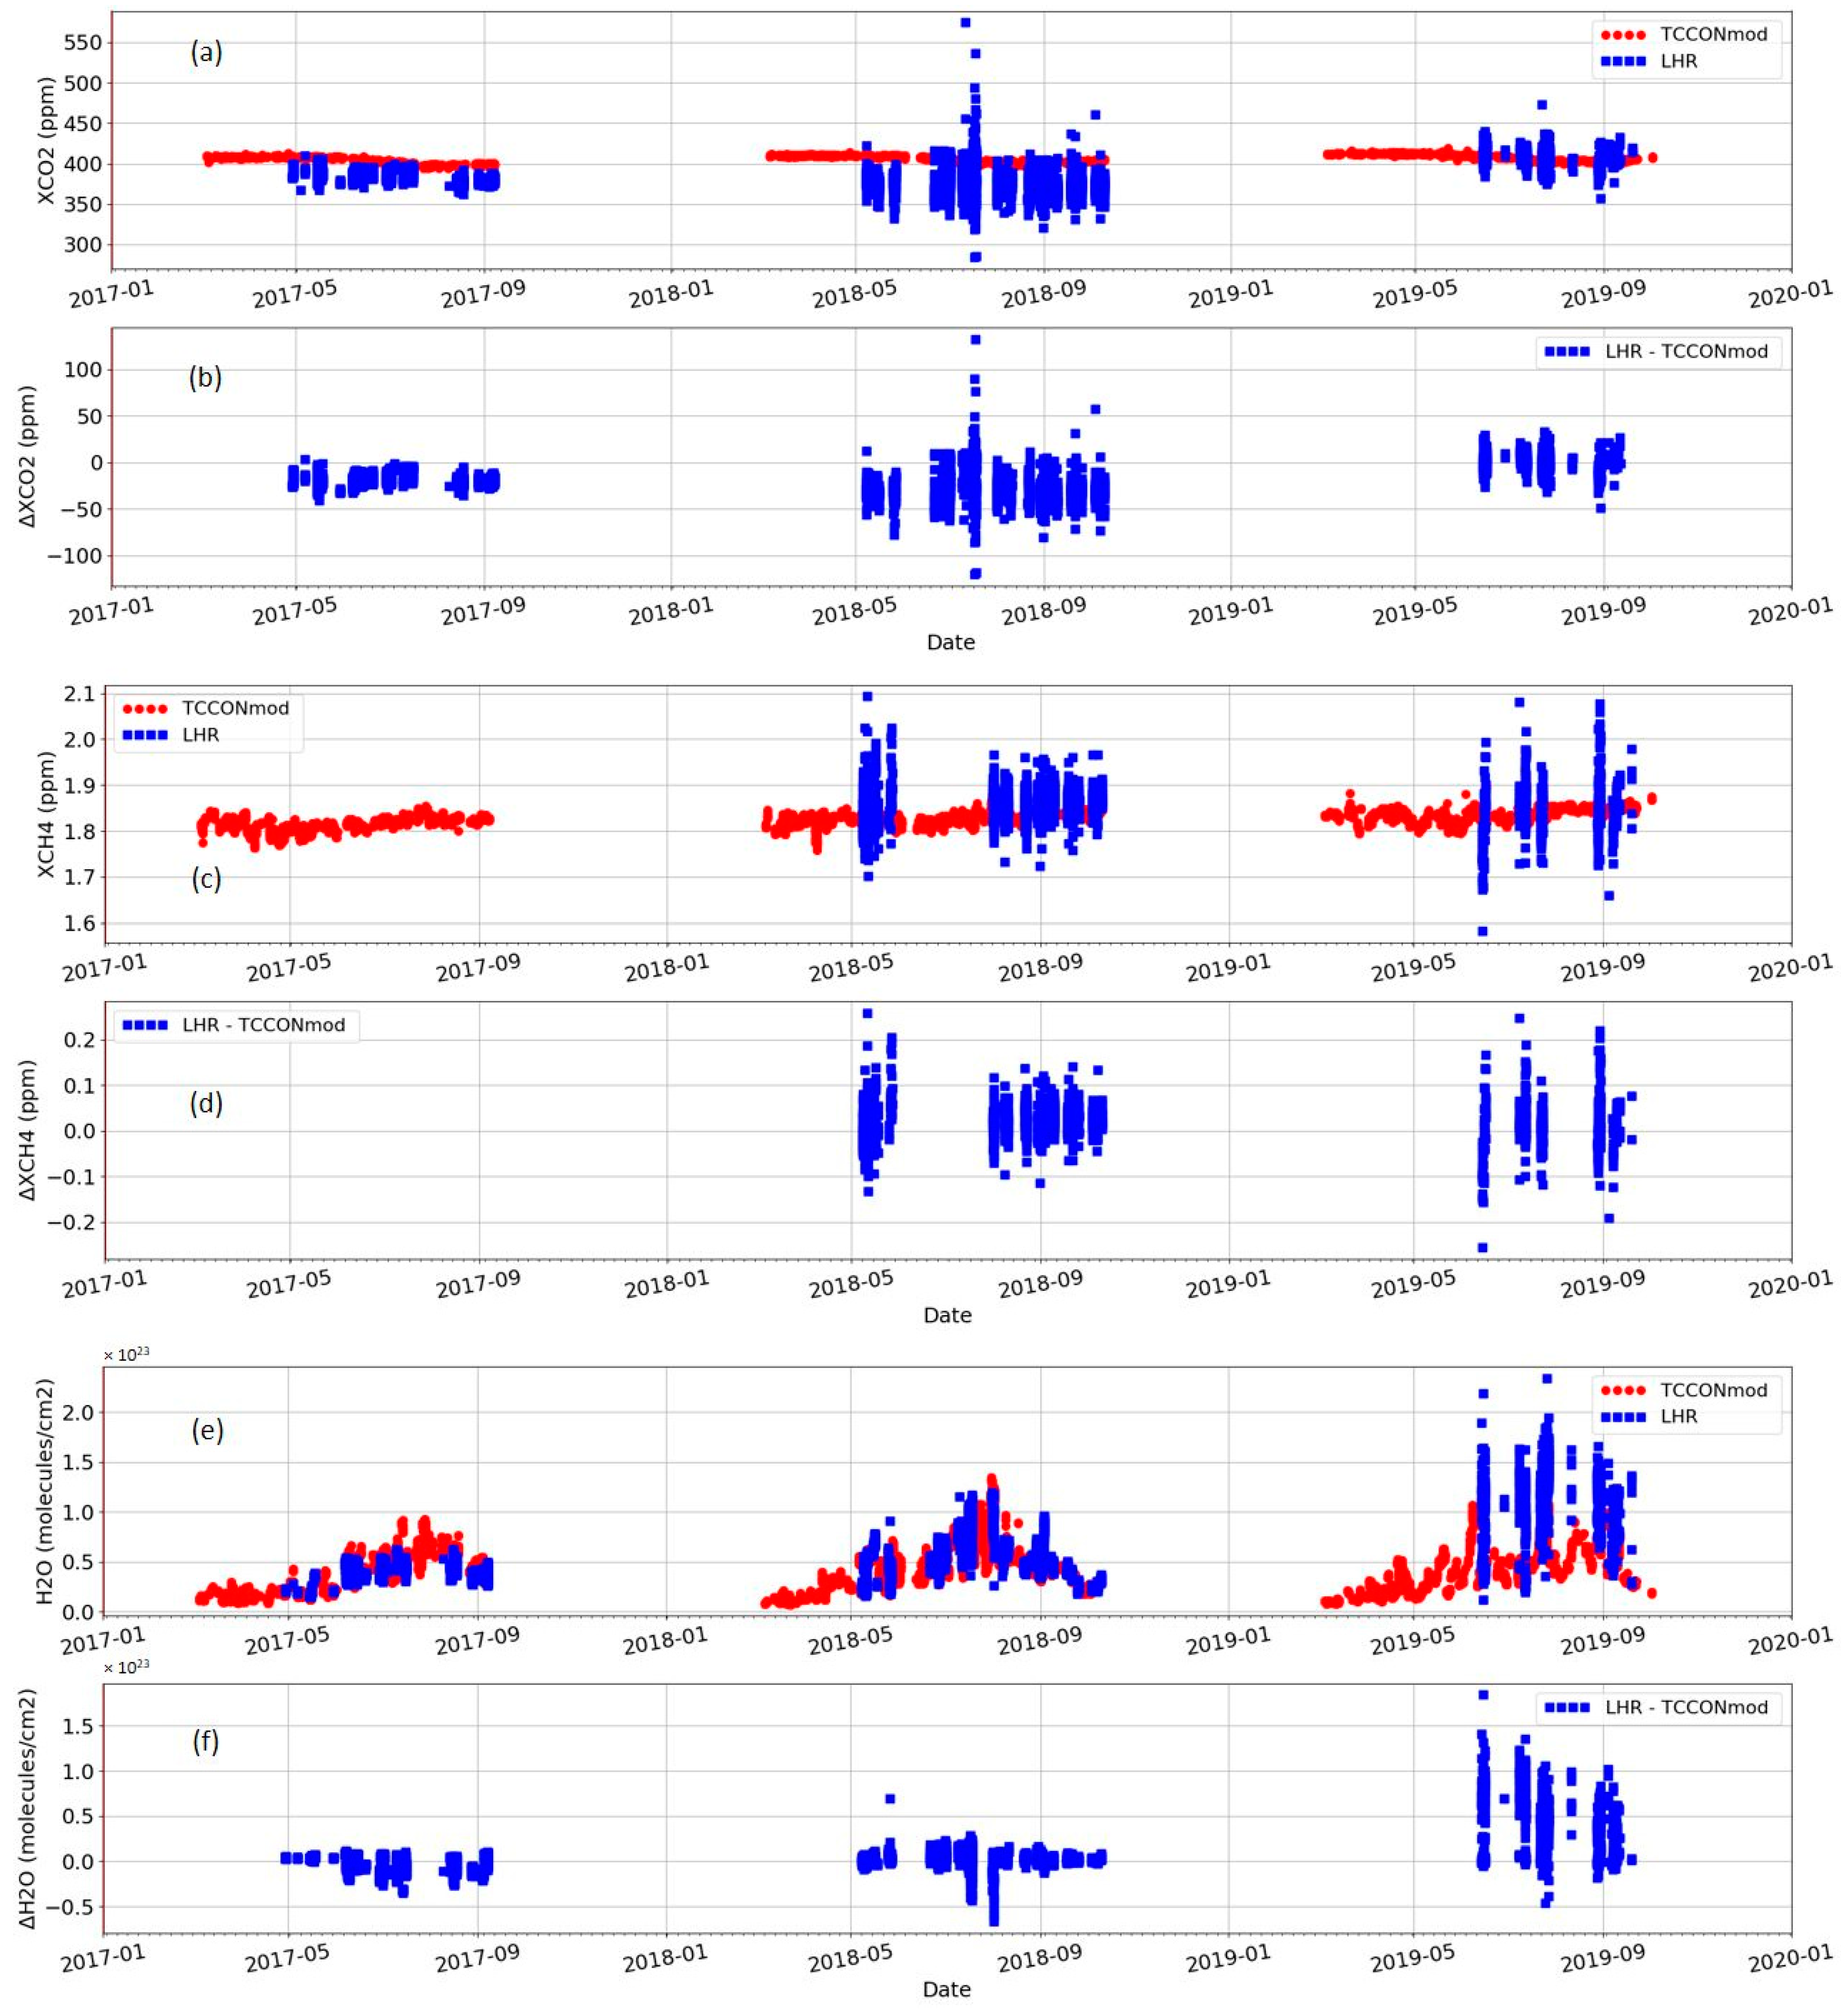
3.2. Laser Heterodyne Spectro-Radiometer

The summary plots of LHR measurements of the gas column against TCCON for the three years of deployment are given in Figure 10. Systematic offset and large diurnal biases affect the XCO2 LHR measurements at the onset. The installation of the second channel for XCH4 in the second year clearly deteriorates the situation. The offset is still present, and the scatter has increased significantly. The last year has limited exploitable data, but for the period that is exploitable, the scatter is still present and slightly reduced. The systematic offset has, however, been addressed.
The lessons learned from the first-ever long-term remote, autonomous deployment of the thermal infrared LHR are the following:
  • A dedicated solar tracker using the internal camera of the LHR for the FOV control feedback is needed to fully decouple the LHR FOV from other instruments’ settings. A miniature one-inch aperture alt-azimuth tracker has been developed and tested; it will be part of any subsequent measurement campaigns;
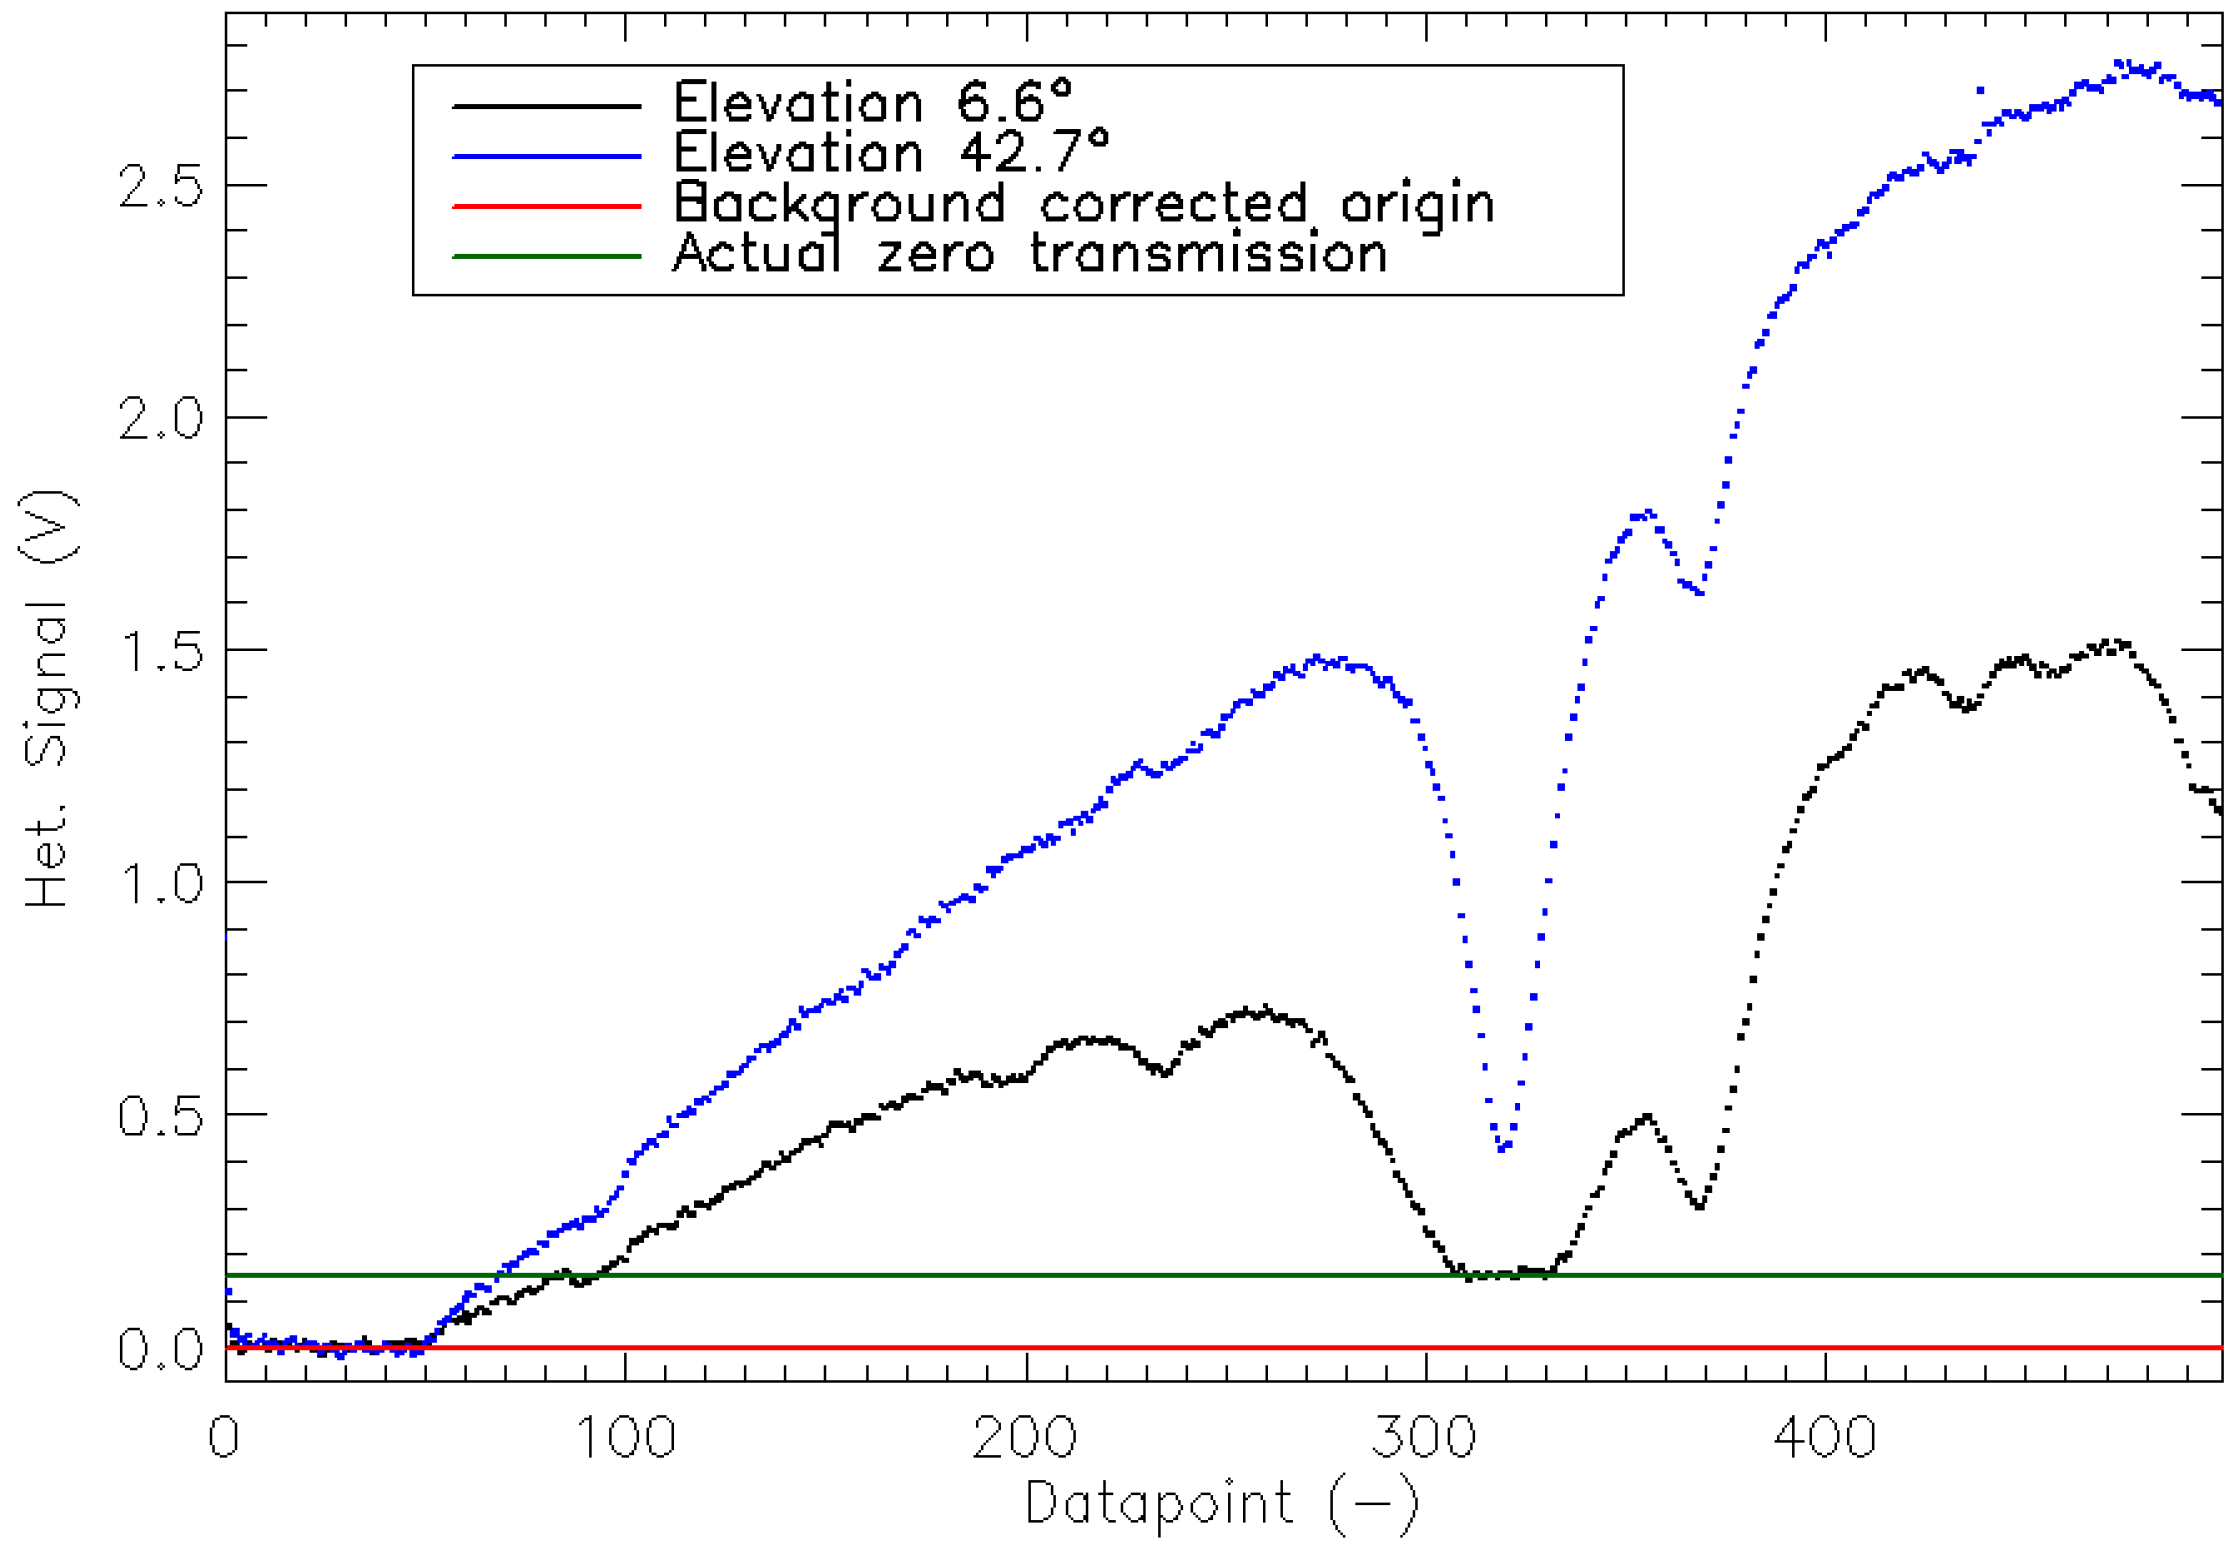
  • The background anomaly, preventing the correct estimation of the zero transmission, has been studied in detail, and its physical origin is traced back to detector responsivity modulation. This effect turns into an artifactual zero transmission offset scaling linearly with the solar power input. The most immediate remedy consists of limiting the spectral bandwidth of the input radiation;
  • A significant contribution to the biases was identified to instrument internal temperature variations. The associated physical process is still being investigated.
The long-term dataset obtained from the remote, autonomous operation in the Arctic has been extremely valuable in studying instrumental and processor errors throughout the measurement chain. With a 1-year feedback timescale, a series of improvements have been made, somewhat impeded by the occurrence of novel issues inherent to this sort of long campaign. All the learnings from the first phase of FRM4GHG are currently being used to deliver a major update of both the instrument and the processing chain of the LHR to reach a higher level of maturity for the measurement system. As part of this second phase of the FRM4GHG project, new sets of comparisons will be performed at the Harwell site using the recently established TCCON observatory [20] as a reference.

3.3. Results from the Vertex70 Upgrades

The Vertex70, equipped with an LN2-cooled InSb detector, has the capability to extend the measurements to the mid-infrared (MIR) spectral region. This section focuses on the results of the measurements performed in the MIR spectral region. Furthermore, the developments that will make the Vertex70 spectrometer mobile and autonomous will be presented.

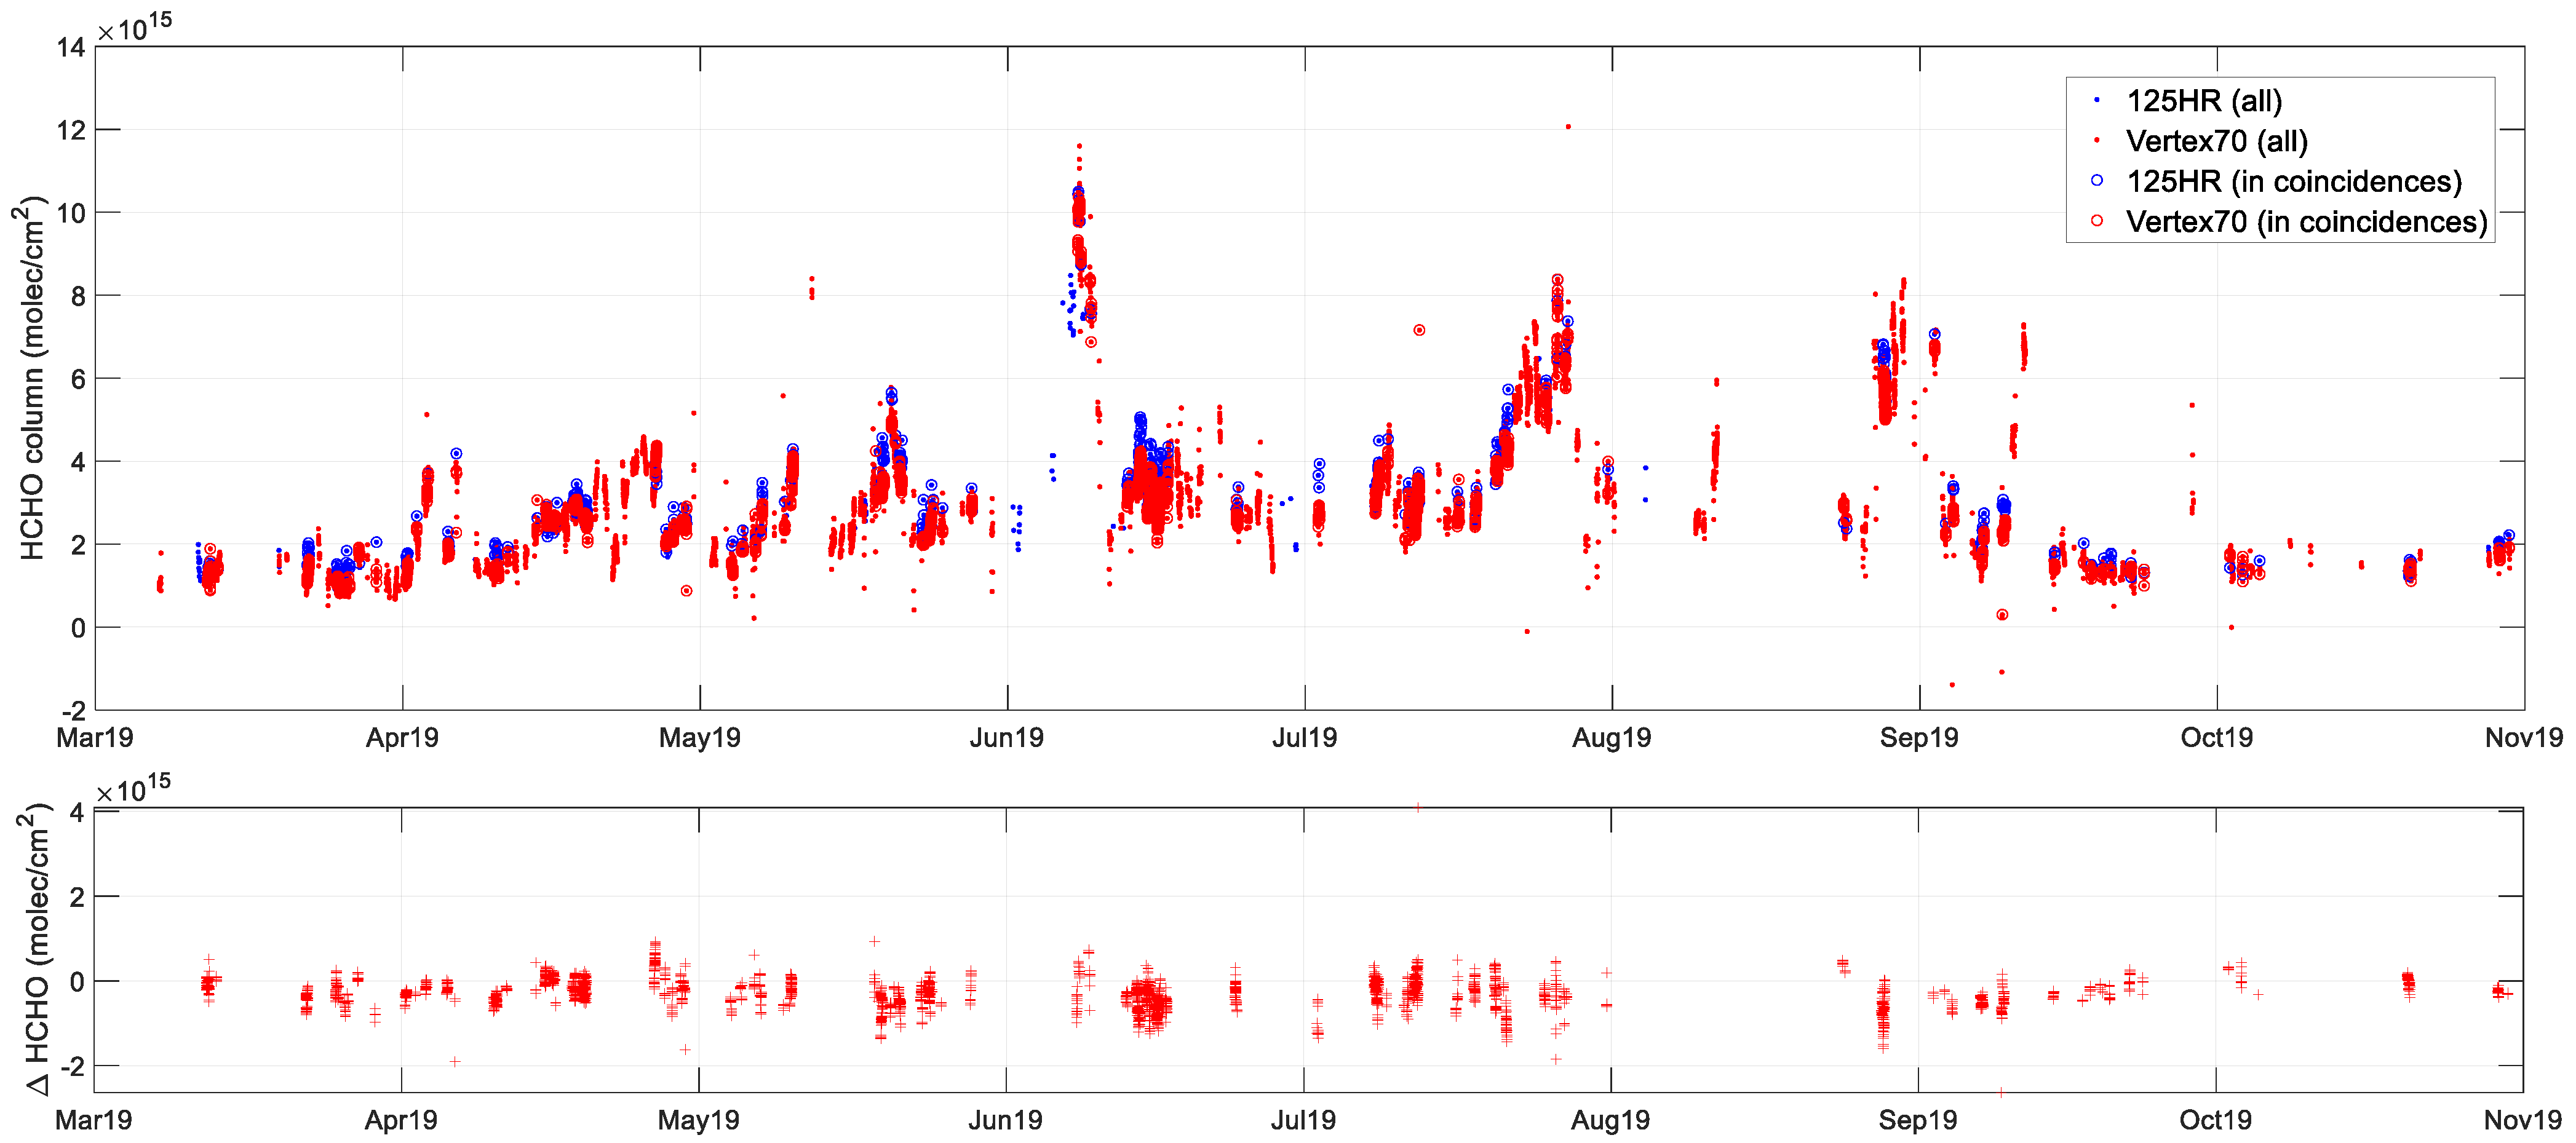
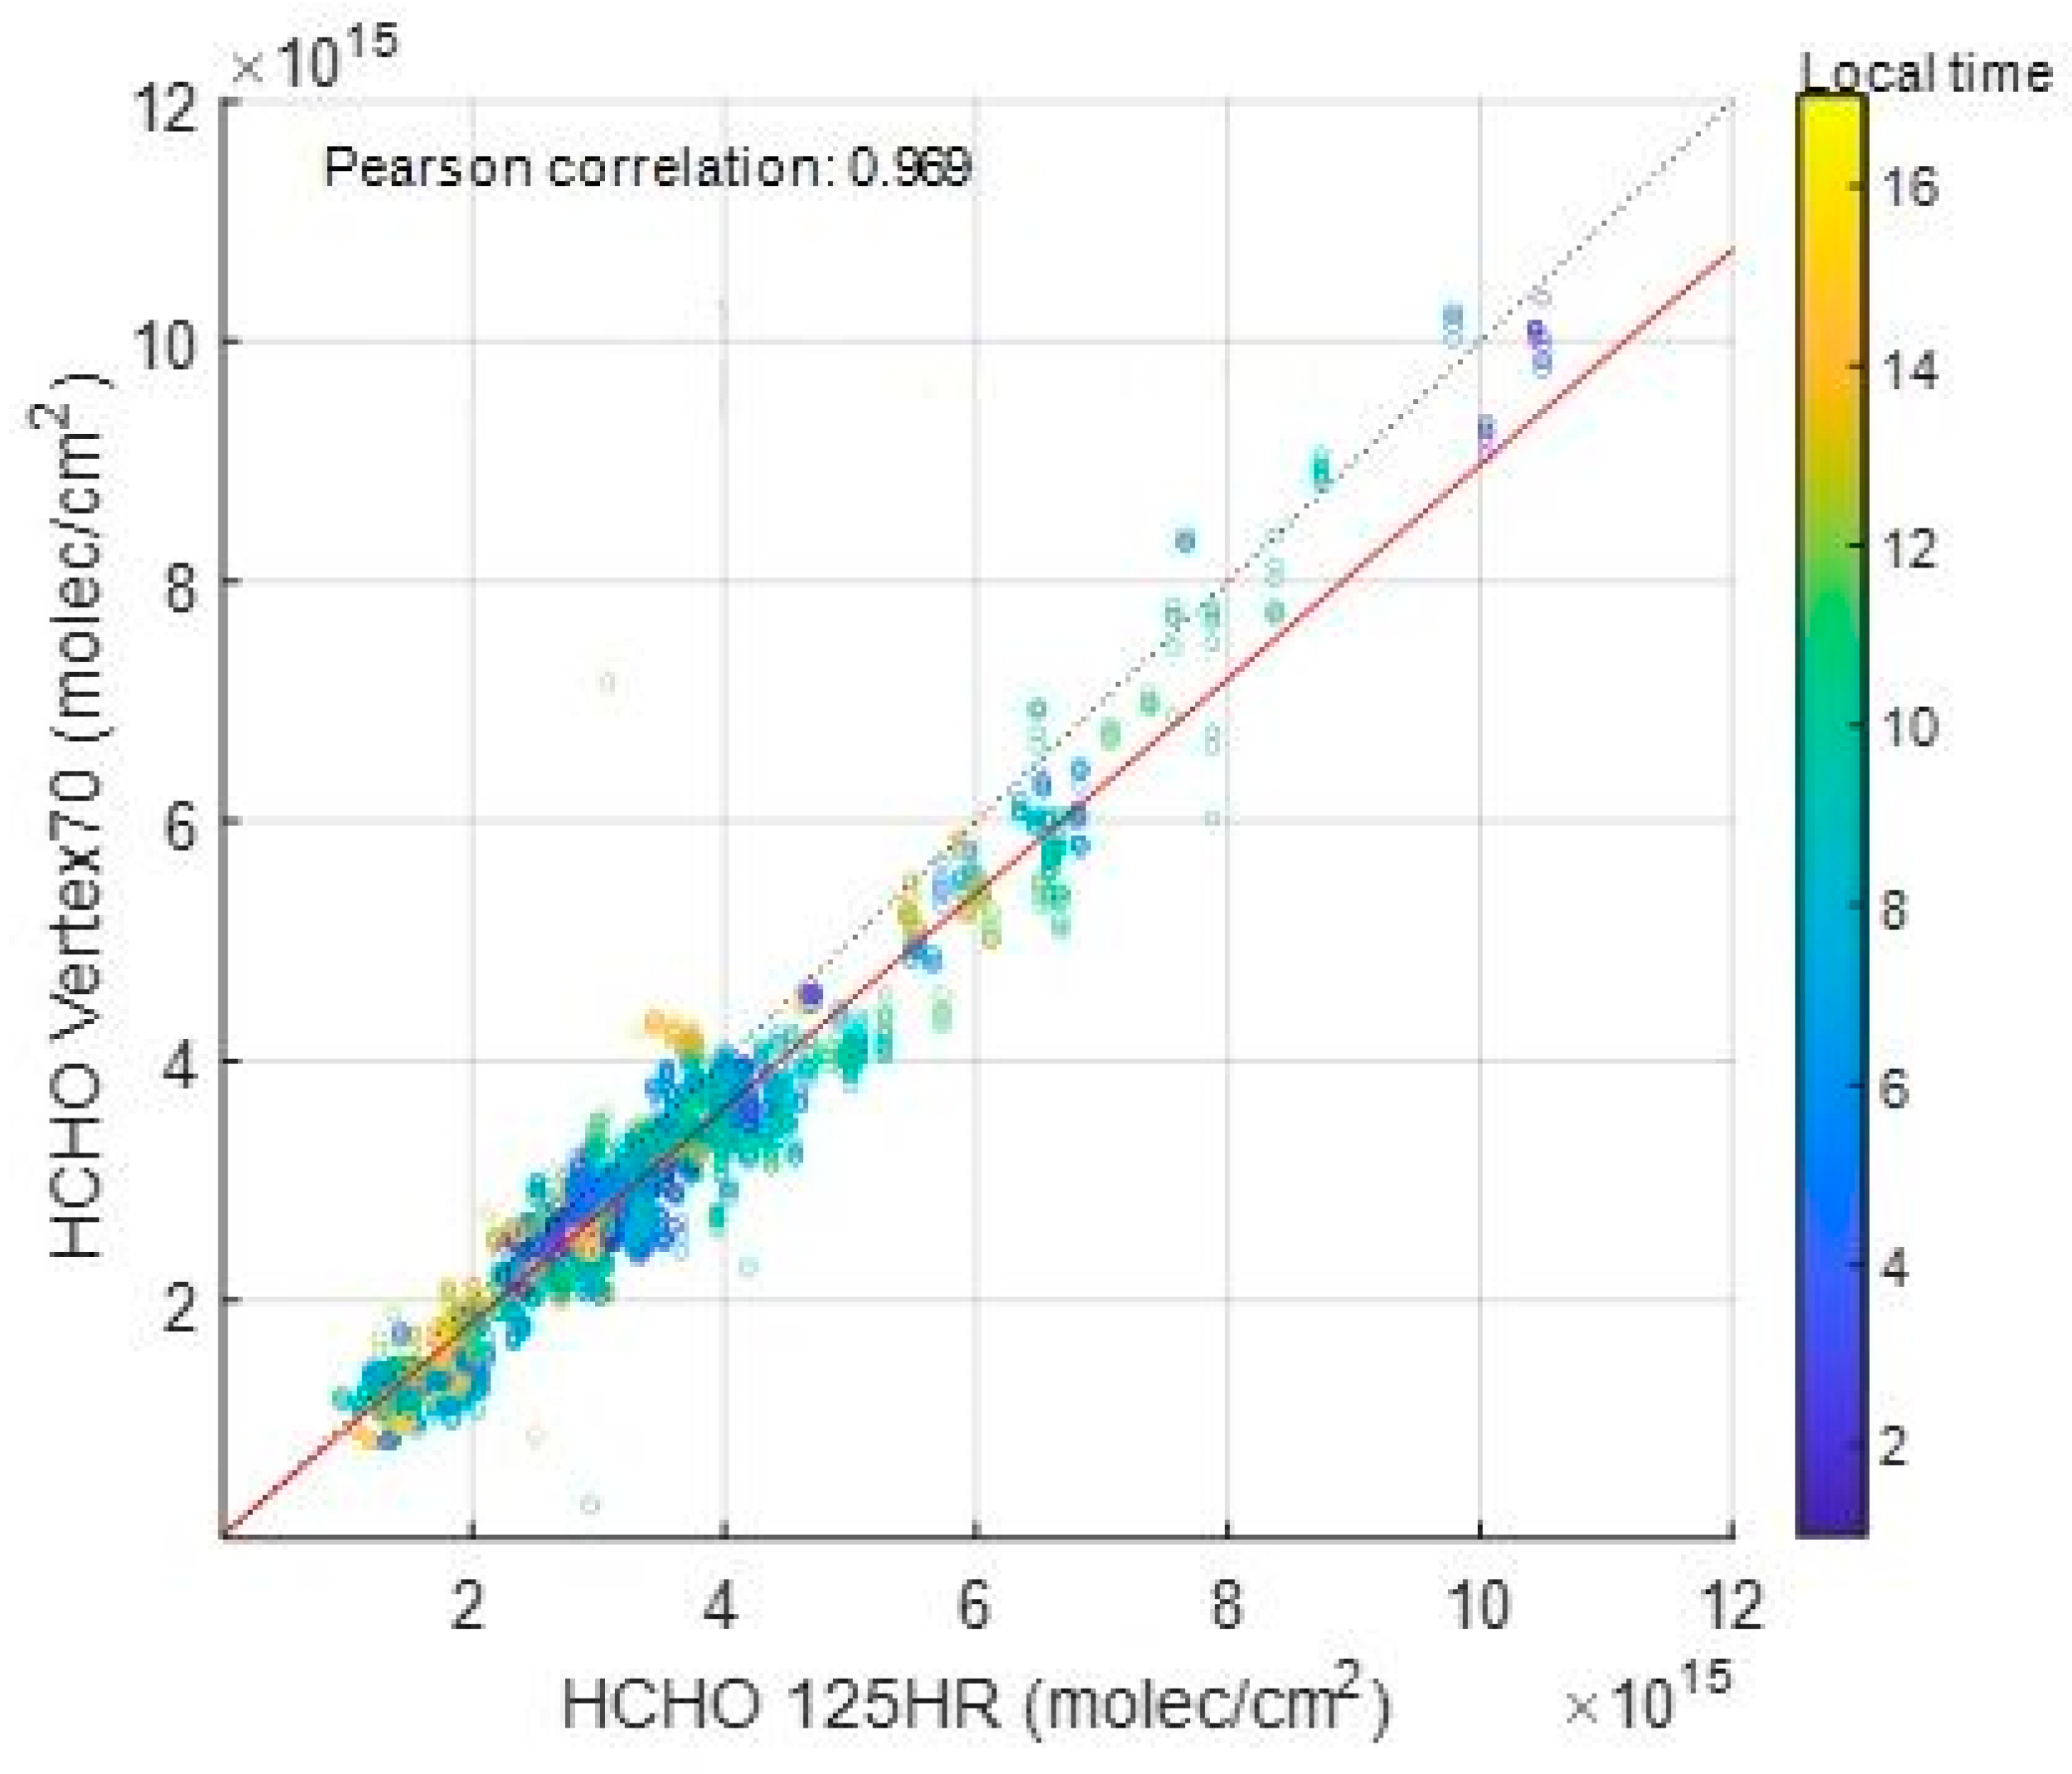
3.3.1. Formaldehyde (HCHO) Measurements Using the Vertex70 Spectrometer

Formaldehyde (HCHO) is an intermediate product of the degradation of many non-methane volatile organic compounds (NMVOCs). It has a lifetime of only a few hours and allows for constraining the NMVO emissions and understanding of the complex and still uncertain degradation mechanism of these NMVOCs [21]. The volatile organic compounds (VOCs) exert a strong influence on the oxidizing capacity of the atmosphere through their reactions with hydroxyl radical (OH) and nitrogen oxides (NOx; nitric oxide (NO) + nitrogen dioxide (NO2)). As a result of these reactions, ozone and secondary organic aerosols are produced, which affect air quality and the global climate. Measurement of HCHO columns from ground-based instrumentation has been crucial for the validation of satellite HCHO measurements and tropospheric chemistry models [22]. A harmonized HCHO retrieval strategy has been developed in the past for the high-resolution (HR) spectrometers of the NDACC and used at all the NDACC sites and at some TCCON sites equipped with an InSb detector (Vigouroux et al., 2018 [22]). The use of harmonized retrieval parameters among the network (same spectral micro-windows, same spectroscopy, …) ensures a good consistency of the HCHO FTIR datasets, which have therefore been used with success for the TROPOMI validation (Vigouroux et al., 2020 [23]). In the FRM4GHG2 project, the aim is to retrieve HCHO using the measurements performed with the Vertex70 (low-spectral resolution spectrometer) with good accuracy and precision. To verify this capability, we take the opportunity to use the campaign measurements at Sodankylä, where the Vertex 70 HCHO data can be compared to the ones derived from the Bruker IFS 125HR spectrometer measuring at the same site [22]. We focus on the data collected during the 2019 period when the Vertex70 was operated in optimal conditions and has been providing good and stable results for XCO2 and other gases (see Section 3.1.3).
The best agreement found between the Vertex70 and the 125HR HCHO columns is obtained when the same set of four spectral micro-windows was used in both cases (see Table 1 and Vigouroux et al. [22] for more details on chosen parameters). The spectroscopic parameters for both retrievals are, of course, taken the same: the atm16 linelist from G. toon (JPL) available at http://mark4sun.jpl.nasa.gov/toon/line%20list/linelist.html (accessed on 1 March 2024), which corresponds to HITRAN2012 for the HCHO absorptions.
The time series of the retrieved HCHO columns from the 125HR (reference) and the Vertex70 are shown in Figure 11. The Vertex70 HCHO columns are close to the 125HR HCHO columns, reproducing the day-to-day and seasonal variabilities well. The median bias of the Vertex70 relative to the reference is −2.7 × 10¹⁴ molec.cm2 (−8.9%), and the median absolute deviation (robust dispersion) scaled with 1.4826 to be equivalent to 2-sigma of a standard deviation is 3.2 × 10¹⁴ molec.cm2 (10.5%). Given the uncertainty budget of both instruments (14% and 9% for systematic and random uncertainties of the 125HR, see Vigouroux et al., 2018 [22]), they are in agreement. Note that this agreement is achieved when the Vertex70 spectra are derived from the interferograms using a Norton–Beer strong apodization; applying Boxcar apodization that is traditionally used with the 125HR measurements to the Vertex70 data gives HCHO columns biased by −45% and with a larger dispersion relative to the reference columns.
The good agreement between the HCHO columns retrieved from the two instruments is also seen in the scatter plot shown in Figure 12; the Pearson correlation coefficient is 0.97.

3.3.2. Carbonyl Sulfide (OCS) Measurements Using the Vertex70 Spectrometer

Carbonyl sulfide (OCS) is the most abundant sulfur-containing trace gas naturally present in the atmosphere. The uptake of OCS by plants is similar to the uptake mechanism of CO2 during photosynthesis by plants. However, unlike CO2, which is also released by plants during respiration, OCS uptake is a one-way process. This important feature is used to differentiate between the photosynthesis and respiration fluxes of CO2 and is used as a measurement-based photosynthesis tracer [24,25]. The sources and sinks of OCS are diverse and complex, with significant uncertainties remaining in the global budget estimates. Amongst the known sources of OCS, the ocean is believed to be the most important, with both direct and indirect flux contributions, and drives the seasonality of OCS in the Southern Hemisphere, while the uptake by plants is the main sink of OCS and dominates the seasonality of OCS in the Northern Hemisphere. Recent studies match up the top-down estimates with bottom-up estimates of OCS, indicating missing sources or overestimating the sink of OCS [26,27]. To close this gap, more OCS measurements are needed, covering different latitudes and ecosystem regions to validate the model estimates and build a better understanding of the sources and sinks of OCS.
The OCS measurements are performed using different techniques at different levels of the atmosphere. The NOAA’s Earth System Research Laboratory, Global Monitoring Division (NOAA/ESRL/GMD) network performs ground-based and aircraft-based flask sampling measurements of the surface/near-surface concentrations. The satellites provide a wide distribution of OCS measurements but are mainly sensitive in the upper/mid-troposphere and stratosphere and, therefore, have little help constraining land fluxes. The total/partial columns of OCS in the atmosphere are measured by remote sensing techniques from different platforms using the strong spectral absorption lines at 2030–2070 cm−1 in the MIR spectral region. A recent study by Hannigan et al., 2022 [28] worked on the globally consistent retrieval analysis of the OCS trend using data from 22 available NDACC stations providing OCS data. The retrieved products were the lower and free tropospheric and lower stratospheric columns and total column OCS data. The study showed that the OCS trend in the troposphere varies significantly, driven by anthropogenic emissions; there is an overall small but increasing trend in the stratosphere, and the trends in most of the atmosphere were increasing in the period 2008–2016, but in the recent period (data till 2020) are now decreasing. Increasing the number of measurement sites is therefore desired to extend the coverage to better capture the latitudinal gradient, reduce the mismatch between the measurements and models, and quantify and optimize the sources and sinks of OCS.
Here the measurements performed by the Vertex70 in the MIR during the year 2019 are analyzed to perform OCS retrievals. The retrieval procedure used in the OCS retrieval from HR spectra, as described in Hannigan et al., 2022 [28], is applied to the LR Vertex70 spectra. This showed a large scatter in the time series of OCS. Therefore, the Norton–Beer strong apodization was used instead of Boxcar (see Section 3.3.1). Additionally, due to the weak and wide absorption features, slightly wider retrieval windows were utilized, which reduced the scatter significantly. Setting the SNR deweighting to a value of 500 helped to further improve the overall intraday variability. Table 2 gives a summary of the key retrieval parameters.
The median total error from the Vertex70 analysis was found to be about 4.2%. The HR measurements from the Sodankylä site did not cover the spectral range used in the OCS retrieval during 2019. Therefore, a direct comparison of the two columns was not possible. As a result, the publicly available OCS analysis results from a nearby NDACC station in Kiruna, Sweden (67.84°N, 20.40°E; 420 m a.s.l.), about 330 km away, was used for comparison, such as to check if the intra-day variability and seasonal cycle are well captured. The time series of the OCS retrieved from the HR measurements performed in Kiruna and the LR measurements performed in Sodankylä using Vertex70 are shown in Figure 13. Due to the data being from two different sites, we do not attempt to make any direct daily coincidences comparisons. However, the time series of the Sodankylä Vertex70 OCS retrieval results demonstrates a clear intraday variability as well as a seasonal trend that is comparable to the results from the Kiruna 120/5 HR spectrometer.
The successful retrieval of OCS from LR Vertex70 type of spectrometers will assist in complementing the HR NDACC stations by providing observations from data-poor regions. Furthermore, together with the other means of OCS data providers, it will help in creating a global OCS data product that is needed to close the global OCS budget.

3.3.3. Nitrous Oxide (N2O) and Methane (CH4) Measurements Using Vertex70

In the framework of the FRM project, retrievals were performed for N2O and CH4 from the MIR spectra observed by the low-resolution FTIR (Vertex70) and compared to the NDACC measurements observed using Bruker IFS 125HR with a typical spectral resolution of 0.0035 cm−1. Based on one year (2019) of campaign data, retrievals of N2O and CH4 were performed from the Vertex70 MIR low spectral resolution spectra [29]. The accuracy and precision of the Vertex70 N2O and CH4 column and profile retrievals are assessed by comparing them with the coincident 125HR retrievals. The retrieval micro-windows for N2O used for the 125HR measurements were applied to the Vertex70 measurements. The relative differences between the N2O total columns retrieved from Vertex70 and 125HR spectra are −0.3 ± 0.7% with a correlation coefficient of 0.93. However, applying a similar approach for CH4 gave an underestimation of the Vertex70 CH4 columns by about −1.3 ± 1.1% and a correlation coefficient of 0.77 relative to the reference NDACC data. As a result, alternate micro-windows were investigated. The relative differences between the CH4 total columns retrieved from the Vertex70 and 125HR spectra using the alternate retrieval micro-windows become −0.0 ± 0.8% with a correlation coefficient of 0.87. The new micro-windows selected for the Vertex70 MIR CH4 retrievals removed the underestimation w.r.t. of the 125HR and resulted in an improved correlation coefficient. The retrievals of the vertical profile of the Vertex70 N2O and CH4 were also investigated. The degree of freedom for signal (DOF) of the Vertex70 N2O retrieval is 1.6, which is less than the DOF of 2.6 obtained for the retrievals from the 125HR spectra. However, it still allows us to derive two partial columns (0–6 km and 6–25 km) with a DOF of 0.8 in each layer. The mean and SD of the differences between the Vertex70 and 125HR is 0.0 ± 1.9% in the partial column between 6 and 25 km and −0.5 ± 1.7% between the surface and 6 km. The DOF of the Vertex70 CH4 retrievals is only 1.3, which means that the focus should be on its total columns.
The retrieval of N2O and CH4 from the MIR spectra of low-resolution measurements from the Vertex70 type of spectrometers offers an interesting opportunity to characterize the performances of the low- vs. high-spectral resolution instruments, the evolution of their performances over time, with various technological and retrieval advances. In the framework of the FRM4GHG2 project, it is intended to make the low-resolution FTIR spectrometers (especially Vertex70 and its upgraded model, the Invenio spectrometer) mobile such that it is convenient to transport the instruments and operate them autonomously. The details of these developments are discussed in the next section. Having the possibility of mobile autonomous operation will allow more campaign based as well as permanent operations at locations where traditional high-resolution 125HR instruments cannot be installed. Performing side-by-side measurements at other sites will help to better under the performances of the retrieval of the different gases between the high- and low-spectral resolution instruments under different conditions, such as varying humidity, aerosol load, or low-latitude.

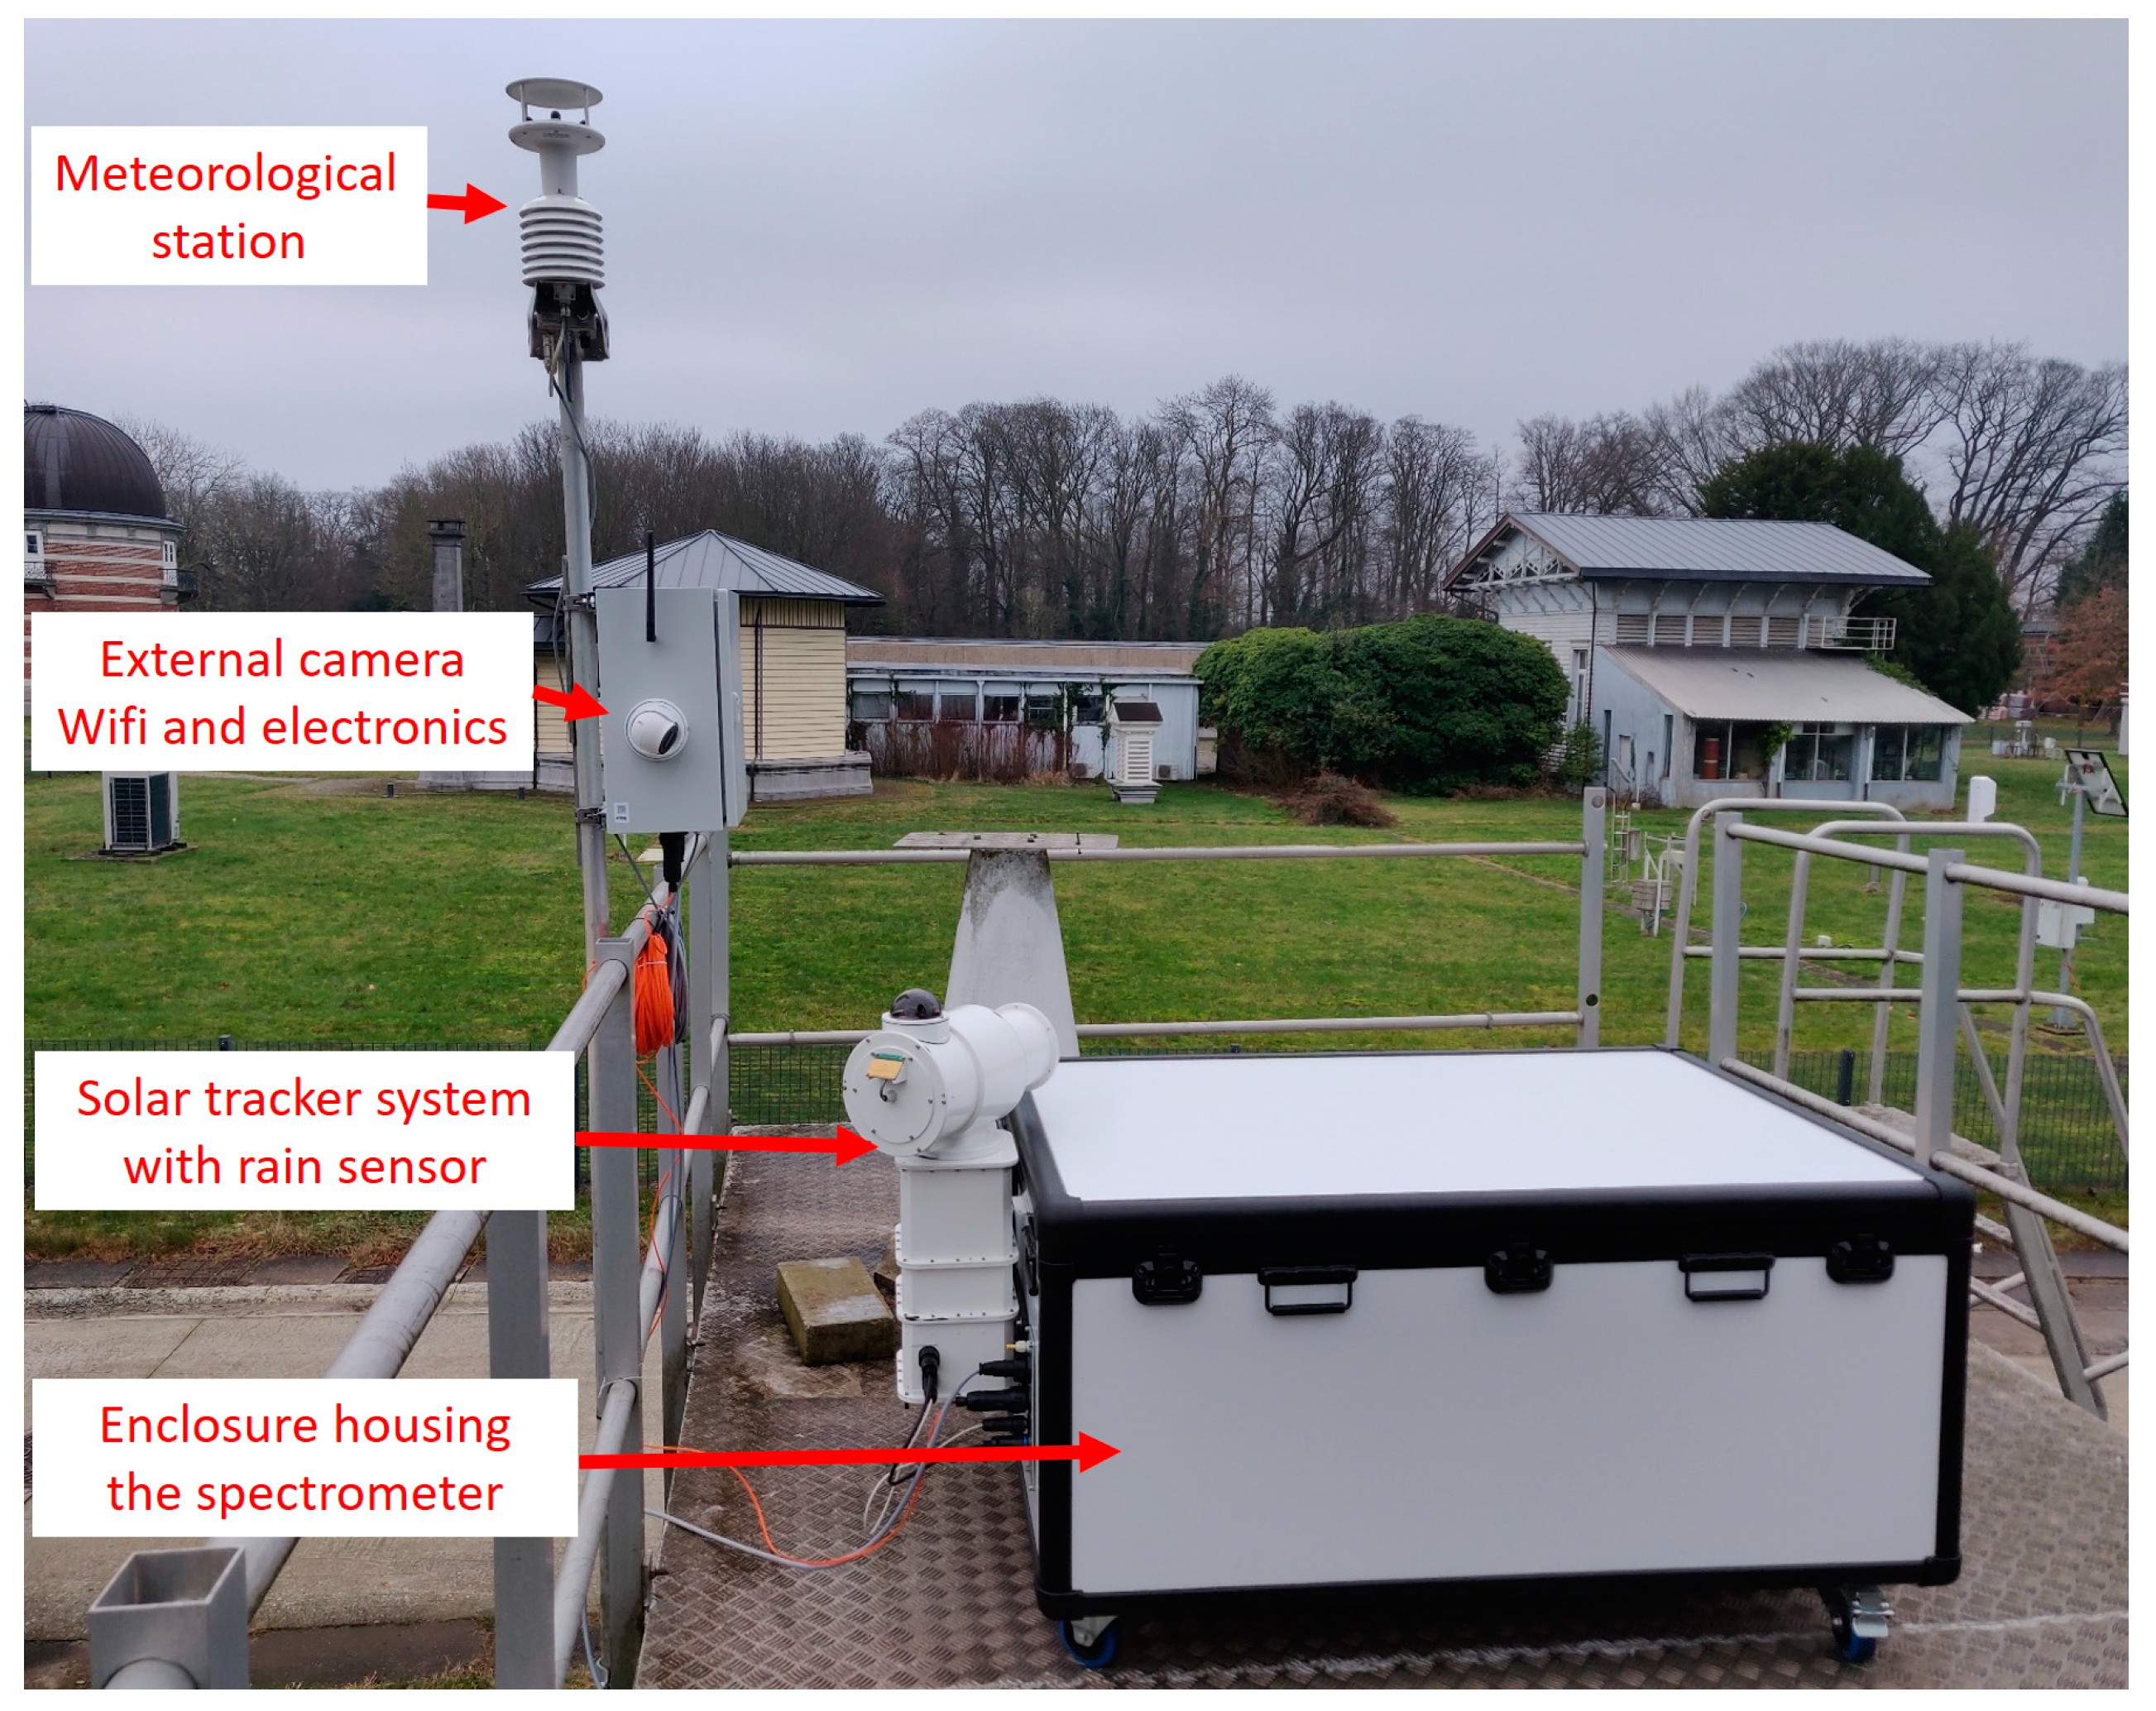
3.3.4. Making the Vertex70 Type of Spectrometers Portable and Autonomous

The Vertex70 spectrometer was set up inside the FRM4GHG container in Sodankylä and coupled to the large home-built solar tracker system that is also used for the TCCON/NDACC measurements by BIRA-IASB with the IFS 125HR spectrometers. The measurements were performed autonomously using the BARCOS system [30], which included a homemade control system for automated operation with the possibility of manual intervention at any time.
In the framework of the FRM4GHG2 project, the aim was to make the instrument mobile to facilitate easy deployment at other locations. The existing solutions of automated enclosure systems [31] are focused on the EM27/SUN systems. Therefore, we developed a new modular system capable of hosting Vertex70 or Invenio (which replaces the Vertex70 that was discontinued by its manufacturer) or EM27/SUN or IRCube type of spectrometers. Unlike the EM27/SUN, the Vertex70, the Invenio, or the IRCube spectrometers do not have an integrated solar tracker. The development, therefore, also included the development of a compact solar tracker and its integration with the spectrometer and enclosure.
The spectrometer is housed inside an insulated temperature controlled and water-proof box, installed on a base plate with mounting positions that can be dedicated to any of the above spectrometers for the purpose of achieving the same orientation each time the spectrometer is removed and re-mounted again. The opening of the box is located on top to allow easy access to all components installed inside. The Vertex70, and its replacement, the Invenio, are the largest in size among the other spectrometers tested during the campaign. Therefore, fitting in the EM27/SUN or the IRCube requires little adjustments in the base plate and the mounting positions. The enclosure box also contains an electronics bay that houses an industrial PC, UPS, power supplies, barometer, heating/cooling elements, and cabling. The enclosure has removable wheels attached to the bottom to allow easy movement for transportation or adjustments of orientation during measurement setup. The homemade compact solar tracker system was built based on the same principle of operation as the BIRA-IASB large solar trackers. In addition, a full sky camera is included to find the sun quickly after the passing of clouds. The rain sensor is part of the solar tracker system and allows for the detection of rain or no rain conditions and therefore helps the automation system to point the tracker mirrors in the direction of the sun or to be in the park position (looking down toward the surface), respectively. Furthermore, a meteorological station with an ICOS-compliant weather station [32] providing high-quality measurements of temperature, surface pressure, relative humidity, wind speed, and wind direction is included in the system to assist in the automation and data analysis. A separate unit (small electronics enclosure) is mounted on the mast of the meteorological station. It contains an external camera looking at the spectrometer and the antennas for the internet connection. The monitoring and data transfer is foreseen using either Wi-Fi or mobile (4G/5G) network depending on the availability of the infrastructure at the measurement station. The automation software allows for fully autonomous operation of the measurements with the possibility of manual or remote intervention at any time. The FTIR spectrometer and the solar tracker system can be removed from the enclosure and can be transported separately.
The enclosure system with integrated compact solar tracker and meteorological station is shown in Figure 14, during its deployment at the campus of BIRA-IASB in Uccle, Belgium. The dimensions of the enclosure with the solar tracker are 154 cm × 96 cm × 100 cm (l × w × h). The dimensions of the enclosure without the solar tracker are 147 cm × 96 cm × 74 cm (l × w × h) and weighs 70 kg. The dimensions of the compact solar tracker are 19 cm × 41 cm × 65 cm (l × w × h), and its weight is 15 kg. The temperature inside the enclosure can be controlled to a set value using Peltier elements. Lightening protection is included to avoid damage, especially during deployments in the tropics. The whole setup is capable of working with the AC supply voltage ranging from 100 to 240 V (50–60 Hz). The maximum total electrical power consumption is 640 W. Most of the power is used for temperature control. Therefore, for locations where the ambient temperature is closer to the set operating temperature, which is determined by the specifications of the installed spectrometer (laboratory spectrometers such as the Invenio have a much narrower range of acceptable operating temperatures than a field instrument such as the EM27/SUN), the power consumption will be lower. In addition, with the provision of battery and solar panels, the spectrometer can be operated in the field, making it independent of an external power supply.
The portability of the Vertex70/Invenio type of spectrometers will extend the observational capacity of the TCCON and NDACC networks for the observation of CO2, CH4, CO, and H2O in the NIR and additional species like N2O, CH4, HCHO, and OCS in the MIR spectral regions. These measurements have already contributed effectively to satellite validation, model validation, and scientific studies related to the carbon cycle or to the chemistry and dynamics of other measured gases. The recorded MIR spectra from the Vertex70 will be further investigated for retrieving additional species (like ethane (C2H6)).
The Vertex70/Invenio type of spectrometers covering the NIR as well as the MIR spectral range have the advantage of providing measurements of species like HCHO, OCS, N2O, CH4, … This is of direct relevance to the validation of satellite missions focusing on greenhouse gases and air quality, e.g., Sentinel-5 Precursor mission where both CH4 and HCHO columns are the derived products and need validation using FRM data. The Vertex70/Invenio working inside the FRM4GHG2 enclosure system has the potential to be used as a traveling standard for the MIR species, where currently, there is a lack of reference measurements for the absolute calibration of the target gases measured at the high-resolution FTIR sites. One such automated enclosure system is currently being prepared to be deployed in the tropical forest site at Yangambi, Democratic Republic of the Congo (0.8123°N, 24.4834°E) in 2024, and plans for the deployment of several others in India (Bhopal, Ahmedabad), Brazil (Santarem), and the Democratic Republic of the Congo (Mbandaka) by 2026.

3.4. Results from IRCube Upgrades

The Xgas and XAir occasionally show step changes after relocation and realignment of the system in the Sodankylä and subsequent campaign measurements in Wollongong and Darwin (see Section 3.1.4). Although small, these step changes were significant and not seen in co-located EM27/SUN and TCCON measurements. The changes were attributed to the variability in the input optics alignment, which is not well defined in this configuration and impacts the FOV and ILS of the FTIR system. Illumination of the entrance aperture and reproducibility of the input aperture position on a selector wheel both affect the FOV and ILS of the spectrometer; we conjecture that this feeds through to retrieve total column amounts of target gases.
The data record of the IRCube for the 2021 to mid-2023 period and the corresponding reference TCCON data are shown in Figure 15, evaluated using GGG2020. The IRCube foreoptics have been rebuilt and adjusted on several occasions as the system was moved and reassembled several times since its deployment in Sodankylä. In particular, the Haidinger fringes were examined with respect to the optical axis of the spectrometer and found to be off-center with respect to the internal aperture. The internal design of the spectrometer is such that there are no options to adjust these imperfections. One exception to this is the light switch on the aperture wheel that allows for some limited adjustment so that the 0.5 mm aperture is better aligned with the Haidinger fringe center (but still has an offset). The aperture wheel does not rotate back to the exact same position if moved between measurements (the motor is a stepper motor, so the error is about a step), which is a recognized issue in the IRCube. The changes in the IRCube are most clearly visible in the Xluft, bottom panel of Figure 15. Xluft is the column-average mile fraction of dry air. It is calculated as the ratio of the column of dry air calculated from surface pressure and the a priori H2O profile to the column of O2 retrieved in the single delta band. For example, from mid-2021, the level of Xluft changes from 0.985 (pre-mid-2021) to 0.995 due to a failure of the HeNe internal laser and its replacement with a new one. In early 2022, due to heavy rain, the telescope tube was filled with water, which was not discovered for a couple of months.
The IRCube was moved from its location on the UoW campus to a new purpose-built atmospheric laboratory about 200 m away in July 2022. On this new measurement platform, another fiber optic fed EM27/SUN spectrometer, with a second Ekotracker STR21G solar tracker, was installed. This second setup used a telescope with a 400mm focal length lens and a fiber optic cable with a core diameter of 0.8 mm, NA of 0.22, and also 20 m long Polymicro fiber (FIA800). The change of the fiber optic cable can be seen in Figure 15 in the Xluft tests performed at the approximate date 2022.62. Finally, apart from the brief period around 2022.95 when the 0.88 mm diameter fiber optic was used, throughout 2023, the system was relatively stable.
To address this observed variability in Xluft, the input and output/detector optics of the IRcube were rebuilt in late 2023 to emulate those of the EM27/SUN systems, such as those used in COCCON and FRM4GHG activities. In this rebuild configuration, the FOV and ILS are defined by the focal length and aperture of the output detector optics inside the spectrometer and should be more robust and less dependent on the fiber optic input beam alignment. The focused input optics and aperture have been removed such that the input to the spectrometer is a parallel beam collimated from the output of the fiber optic. This rebuilt configuration is now undergoing testing and will be reported separately.

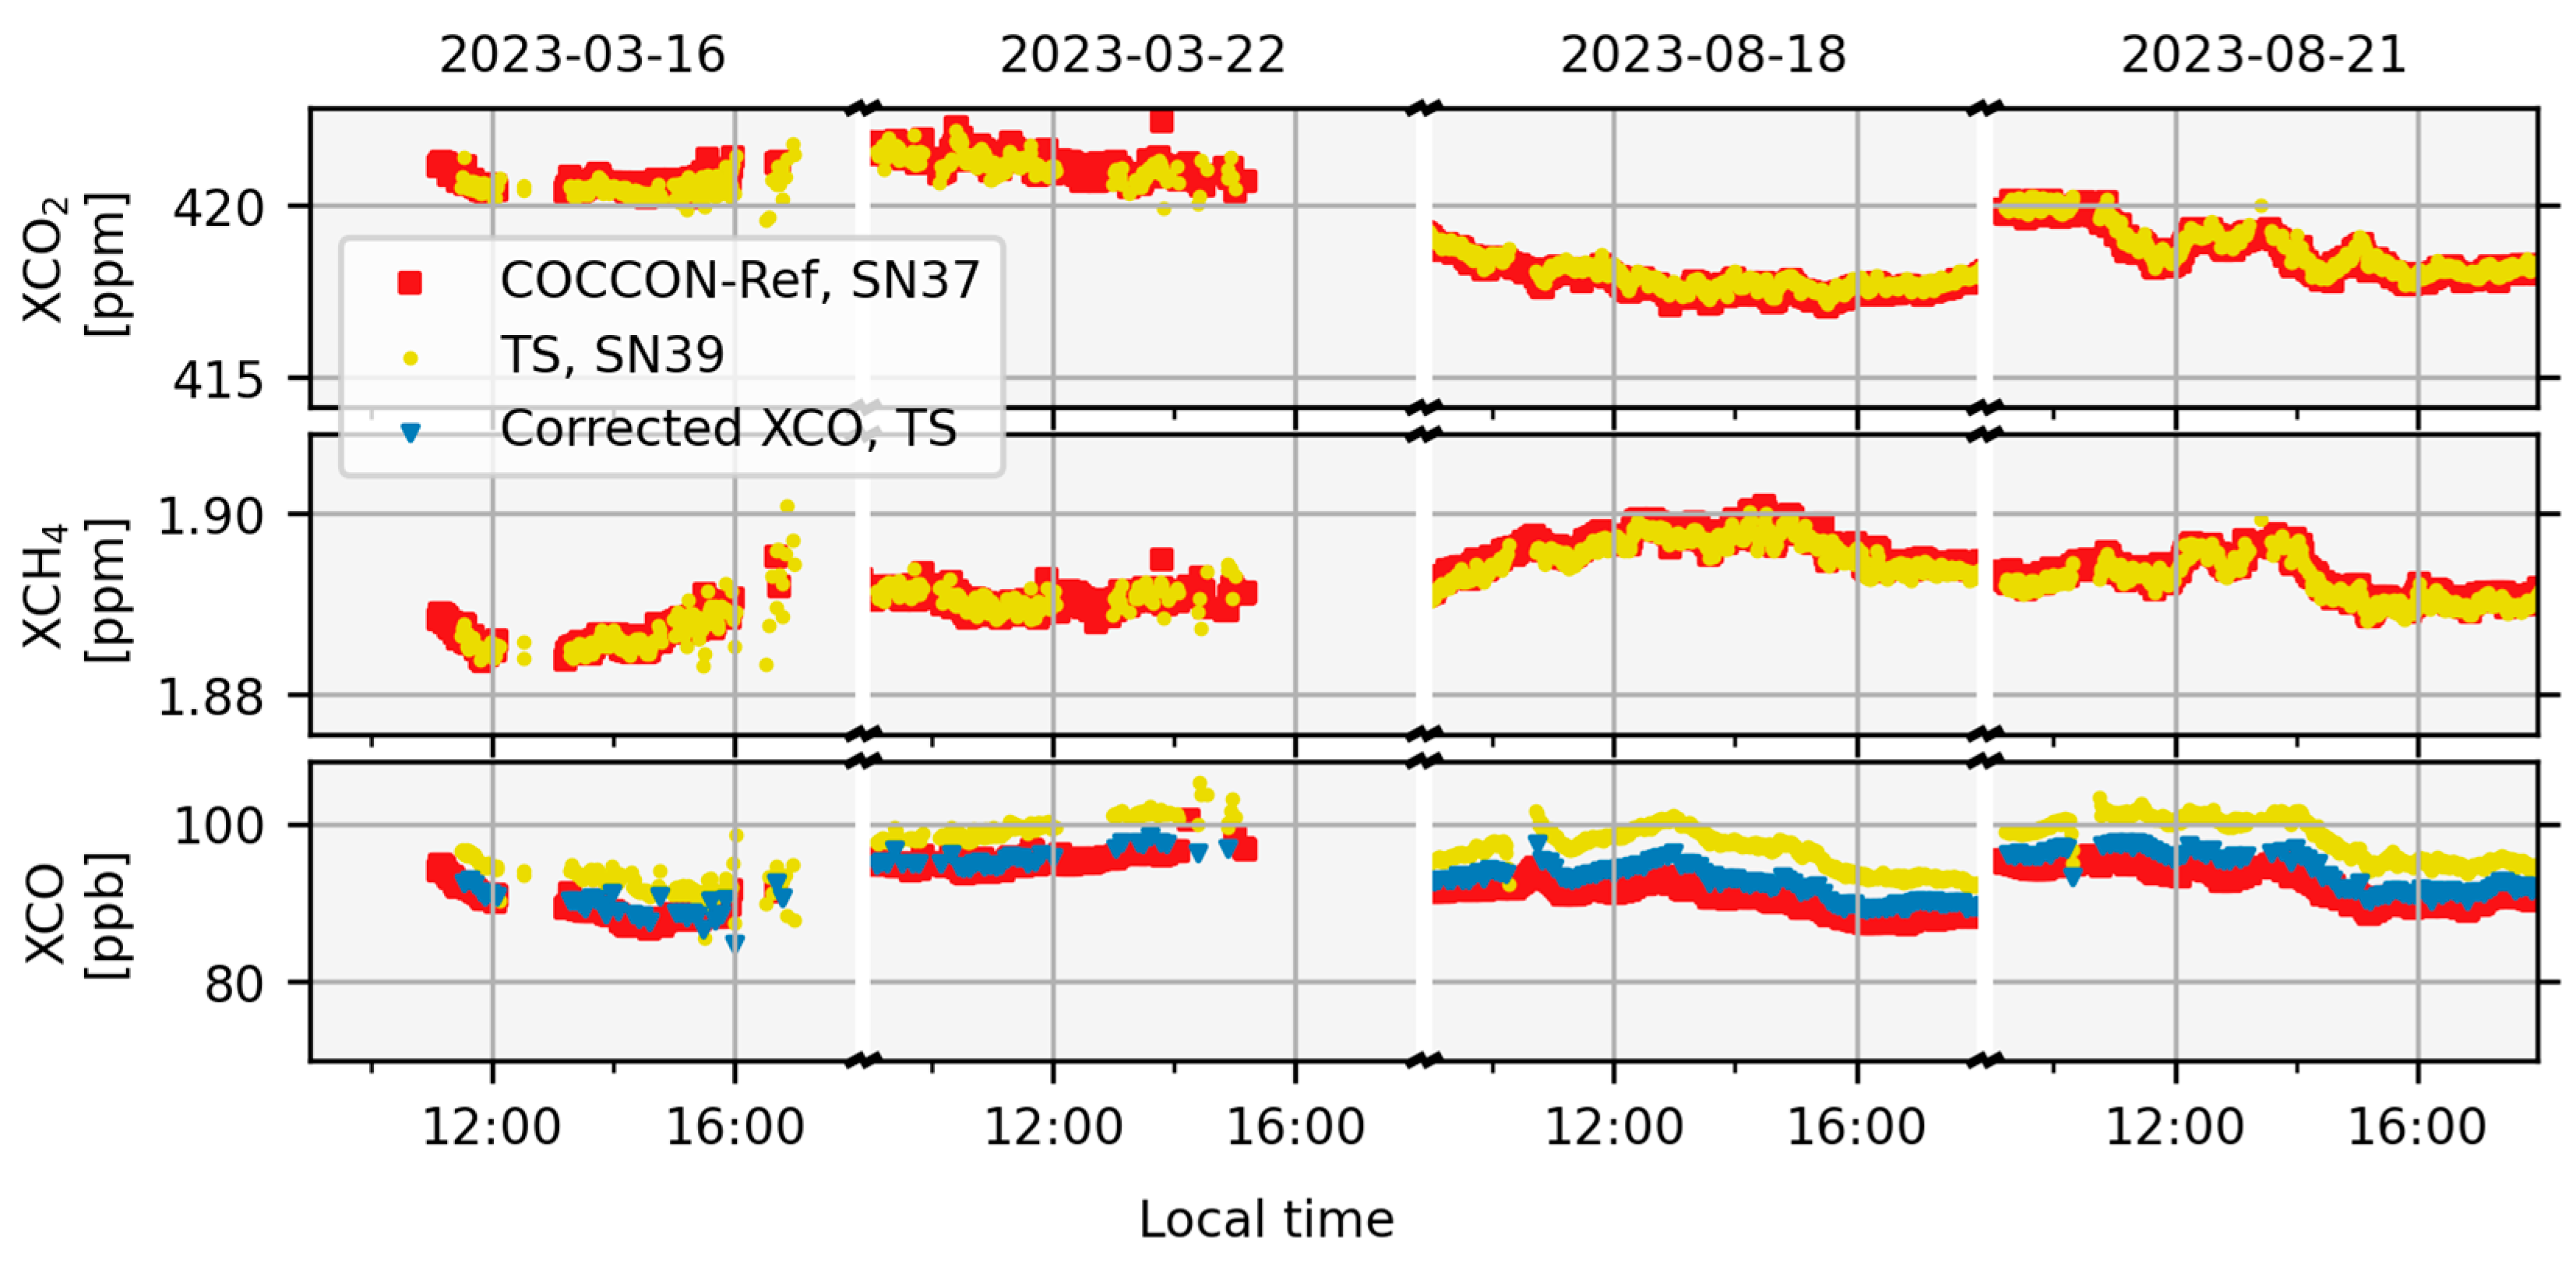
3.5. FRM4GHG Traveling Standard

TCCON is the current reference network for total column measurements of greenhouse gases (especially CO2) and is used as a validation source for satellites and models as well as carbon cycle studies. To ensure the high quality of reference data, it is tied to the WMO trace gas scale by comparison with vertically integrated, collocated profile observations taken with in situ sensors onboard airborne platforms at a few stations [7,33,34]. Furthermore, the site-to-site bias must be kept minimal to ensure the internal consistency of the network.
The collection of collocated in situ reference profiles at the TCCON site is a very laborious and expensive task and so only a few such measurements are available. Furthermore, it is not possible to perform such measurements at all stations, e.g., in densely populated regions or stations on islands where the recovery of AirCore systems is difficult or it is not guaranteed, or research aircraft are not easily available or have no permission to fly over some regions (e.g., over a city). Hence, the reference profiles are not available at all TCCON sites, limiting a comprehensive comparison between the individual TCCON sites.
TCCON uses two additional methods for quality assurance of the individual sites. Each site is required to perform regular monitoring of the instrumental line shape (ILS) of the spectrometer by performing reference gas cell measurements. Secondly, the evaluation of XAir (also called Xluft in the latest TCCON data version—GGG2020). Both methods are used to detect deviations of the spectrometer from its nominal behavior. The derivation of ILS parameters from gas cell measurements and the characterization of the HCl gas cells used by TCCON is detailed by Hase et al., 2013, 2019 [35,36]. The use of XAir is presented by Wunch et al., 2015 [10]. The two methods allow us to recognize deviations from the expected instrumental performance at each site. However, they do not allow for a direct comparison of Xgas values across sites and hence cannot sufficiently ensure network-wide consistency. This is where the concept of a traveling standard (TS) instrument is very helpful as it enables evaluation of the consistency of Xgas values between TCCON sites, the TS acting as the standard of comparison. It is with this view that the TS has been developed in the framework of the FRM4GHG project using an EM27/SUN spectrometer which is housed in an automatically controlled enclosure system for allowing both remote and manual controllability as required at the measurement location. Further details on the TS can be found in Herkommer et al., 2024 [37]. Here, we demonstrate the usefulness of the TS based on the data collected during a recent site visit at the Izaña TCCON site in Tenerife.
The first step is the preparation of the TS instrument for the TCCON site visit. Side-by-side measurements are collected with the COCCON reference spectrometer permanently operated at the central facility in Karlsruhe, Germany, before and after each deployment of the TS. This is to characterize the instrument and any potential bias that may arise during transport or deployments. The details of the evaluation method can be found in Herkommer et al., 2024 [37]. The ILS of the TS is described by two parameters, the modulation efficiency (ME) and the phase error (PE). The ME and PE before the campaign were 0.9840 and −0.001542, and after the campaign were 0.9822 and −0.001160, respectively. Both values are within the nominal range of an EM27/SUN [38].
The Xgas values of CO2, CH4, and CO from the side-by-side measurements in Karlsruhe before and after the site visit of the Izaña TCCON site are plotted in Figure 16. The data from the COCCON reference spectrometer are in red squares, and the data from the TS are in yellow dots. The XCO values of the TS are found to have an SZA dependence on an unknown source. Therefore, an empirical correction is applied to the data [37], and the resulting data are shown as blue triangles. The data in March and August were collected before and after the Izaña TCCON site visit. For both periods, empirical bias-correction factors K TS SN 37 are derived for each species. To derive them, the data of each instrument are binned in intervals of l -minutes and for each bin, the average is taken. Here, l = 10 :
K T S SN 37 = 1 N i N XGas ¯ SN 37 i XGas ¯ SN 39 i
Here, XGas ¯ SNxx i describes the i-th bin of each instrument, SN27 points to the COCCON reference spectrometer, and SN39 to the TS at the Karlsruhe TCCON site.
The bias correction factors are used for two purposes. First, their values before and after each campaign are compared to monitor the stability of the TS and to derive an estimate of the bias drift. Secondly, they are used to connect the measurements at each site with the COCCON reference unit operated in Karlsruhe. For each bias compensation factor, an uncertainty based on the standard error is calculated for each bin. This standard error is propagated to the final compensation factor. The bias compensation factors before and after the Izaña campaign are given in Table 3. For each period, the average difference between the COCCON reference and the TS spectrometers is calculated ( Δ XGas ¯ ) as well as the deviation of the difference from the previous comparison ( Δ Δ XGas ¯ ). As a comparison, the estimated TCCON site-to-site accuracy (Laughner et al., 2023 [11], Table 3, columns “Mean abs. dev”) is given. The Δ Δ XGas ¯ values are significantly smaller than the TCCON site-to-site accuracy. Hence, the TS device is accurate enough to serve as a comparison unit for TCCON sites.
Despite the application of an empirical correction for XCO, the deviation observed here is much larger than that observed in the previous campaign with the TS. In Herkommer et al., 2024 [37], deviations of 0.04 ppb to a maximum value of 0.5 ppb have been reported. This indicates that there is still an uncaptured issue with the XCO channel.
The site visit at the Izaña TCCON station took place from 15 June 2023 to 14 July 2023. During this time, a total of 11 days of side-by-side measurements were performed next to the TCCON instrument. The TCCON spectrometer collects the standard TCCON measurements (HR data at 0.02 cm−1 spectral resolution) and low-resolution measurements (LR data at 0.5 cm−1 spectral resolution), matching the resolution of the EM27/SUN spectrometers. The latter measurements are performed to avoid deviation in the Xgas retrieval, which is dependent on the spectral resolution (Sha et al., 2020 [7], Petri et al. [39]). Furthermore, both the low-resolution data can be processed with PROFFAST2, and hence, we avoid any potential bias in the comparison of the TCCON-LR and the TS data that may occur due to the use of different retrieval software packages.
The time series of the recorded data during the site visit of the TS is plotted in Figure 17. In red, pentagons represent the TCCON-HR data, in sandy stars are the TCCON-LR data, and in blue dots are the TS data. For all species, the visual analysis reveals a good agreement. The high noise level in the TCCON data starting from 11 July 2023 is caused by an autonomous accidental change of the data recording scheme. This reduces the scan duration to approximately half of the routine scan period, whereas all parameters (scan velocity, number of averaged spectra) remain the same. The reason for this change is not known yet and is under investigation.
From the side-by-side measurements, the bias compensation factors for the HR and the LR data relative to the TS data are derived ( K IZ - HR TS , K IZ - LR TS ) for each species. By multiplying them by the K TS SN 37 bias compensation factors (derived above), we obtain a bias compensation factor that describes the deviation of the Izaña TCCON site relative to the reference spectrometer in Karlsruhe ( K IZ - HR / LR SN 37 ). These factors can be converted into a relative deviation and are plotted in Figure 18.
The error bars include the forward propagated random errors of each compensation factor (given first, with a ±-sign) and uncertainty based on the difference of the side-by-side measurements with the COCCON-reference spectrometer before and after each campaign (given second). The reason why the uncertainty is not symmetrical is that it is derived from the change of the K TS SN 37 bias compensation factors before and after the campaign. Hence, it is a signed number as the K TS SN 37 can become smaller or larger.
Figure 18 shows the results of the site visit for Tsukuba and Wollongong, as previously shown in Herkommer et al., 2024 [37], and overlays the results of the recent site visit from Izaña for comparison. The deviation of the XCO2 LR data is 0.056 ± 0.005 + 0.610%, and hence by 0.06% is just outside the estimated TCCON site-to-site error but with a large uncertainty. The deviation of the HR data is −0.018 ± 0.005 + 0.061% and, including the uncertainty, within the estimated TCCON error. For XCH4, both deviations of the HR and LR data (−0.021 ± 0.005 − 0.031% and 0.011 ± 0.005 − 0.031%, respectively) are within the estimated TCCON site-to-site error. For XCO, the deviations are −3.832 ± 0.053 + 1.156% and −7.215 ± 0.058 + 1.116% for the HR and LR data.
For the interpretation of the results, it is important to note that the comparisons of the HR data with the TS contain a variable unknown smoothing error due to different vertical sensitivities. The comparison with the LR data is more meaningful.
To conclude, this example evaluation of the Izaña campaign demonstrates the workflow of the traveling standard instrument. Using these data, it is possible to compare Xgas values derived from different TCCON sites with each other. Each site visit takes a couple of months (transport, collection of measurements at the TCCON site, side-by-side measurements in Karlsruhe). For operationally serving the TCCON network as a whole, expanding the results of TS campaigns to additional TCCON sites in the same area by involving more EM27/SUN spectrometers seems a promising strategy. Extension of the TS to cover the MIR species is also desired. The Vertex70/Invenio type of spectrometers tested in this campaign with the liquid nitrogen-cooled InSb detector have the potential to be used as a TS for some of the species that have currently been evaluated and proved to be promising. This will immensely help NDACC tie the measurements to a common standard and reduce site-to-site biases.

3.6. Software Developments to Achieve FRM Quality Data

With respect to achieving the goal of providing FRM data, standardization of the data processing pipeline is of equal importance as the realization of hardware standards and procedures for verification of instrumental performance. In order to reflect this requirement, the PROFFAST data processing scheme has been developed in the framework of ESA projects COCCON-PROCEEDS I-III and FRM4GHG. The use of this processing scheme for data generation is required by COCCON and—together with recommendations for operation procedures and the instrumental characterizations performed for each participating spectrometer—sets the requirements for providing approved datasets. The PROFFAST software (latest version 2.4) and a wrapper for convenient use of the software are source-open, and the codes are freely available to anyone (published under GNU General Public License version 3).
The PROFFAST data processing scheme is composed of three individual steps, which are mapped into three processing modules: PREPROCESS, PCXS, and INVERS.
The PREPROCESS code generates spectra out of the raw DC-coupled interferograms, which form the primary data output delivered by a Fourier Transform spectrometer. These are initially stored in a proprietary format defined by the manufacturer of the spectrometer. PREPOCESS performs various quality checks on the measurement (sufficient signal level, stability of DC level during the recording of a scan, level of out-of-band spectral artifacts, wavenumber assignment, …) so that it can be assumed that all output spectra generated by PREPROCESS can subsequently be analyzed.
The measurement cadence of low-resolution FTIR spectrometers is very high (e.g., a single pair of double-sided forward–backward scans of an EM27/SUN operated with recommended acquisition parameters takes 6 s), so the data analysis scheme needs to be optimized with respect to computational speed. PROFFAST uses different strategies for achieving high processing speed, among these the use of precomputed daily lookup tables containing the required information on the spectral cross-section for each gas species. These lookup tables are generated using the meteorological information provided by the operator (ground pressure, temperature, and trace gas a priori profiles) by a call from the program unit PCXS. For aligning COCCON XGAS results with the TCCON reference network, the a priori meteorology information as used and provided by TCCON is adopted.
After running PREPROCESS for generating the spectra and calling PCXS for the generation of the cross-sections lookup table, the quantitative trace gas analysis of all measurements collected during the local measurement day is performed. This is achieved by calling INVERS, which works through the spectra as listed in the input file of INVERS. INVERS also incorporates post-processing, which performs empirical corrections of residual gas biases by applying airmass-independent and airmass-dependent corrections. The origin of these corrections is model errors, primarily shortcomings in the spectroscopic description (band intensities, pressure broadening, line mixing effects).
During the FRM4GHG2 project, extensive work on PROFFAST has been performed. The latest software version is the ver2.4 release. Relevant update features are the following:
  • The processing now supports the Invenio and IRCube spectrometers investigated in the framework of FRM4GHG. Specifically, PREPROCESS now also handles single-sided interferograms as delivered by these spectrometers. Because the presence of residual phase errors is much more critical in the case of single-sided interferograms, a novel phase correction scheme, which constructs a smooth analytical phase, has been developed and implemented;
  • An extensive spectroscopy update was performed. Individual line lists and the total internal partition sums have been updated to match the HITRAN 2020 data. At the time of compilation, no line-mixing parameters for CH4 were available in HITRAN, so the required parameters were deduced from cell measurements of methane–air mixtures performed at KIT. The solar line list provided by Geoff Toon for GGG2020 was incorporated for describing the solar spectrum;
  • The airmass-dependent modeling of atmospheric spectra has been refined, especially for high solar zenith angles. In order to save computational time and storage, the cross-sections are not tabulated as a function of vertical coordinate (e.g., pressure) but refer to the integrated absorption for the whole atmosphere. This approach requires a polynomial expansion for quantifying the deviation versus a simple model of a plane parallel atmosphere without refraction. The number of fitted parameters used in the expansion has been increased from four to five;
  • The empirical adjustments of COCCON Xgas products (airmass-independent and airmass-dependent corrections in INVERS) have been updated, now involving several EM27/SUN spectrometers and two TCCON reference sites (TCCON Karlsruhe and TCCON Sodankylä). The new GGG2020 reanalysis provided by TCCON has been used as a target reference. Because a significant slope change has been found when projecting TCCON XCH4 results versus XH2O using GGG2014 or GGG2020 data, a further empirical adjustment has been implemented in the post-processing of PROFFAST, which allows for an ad hoc slope correction of Xgas versus XH2O;
  • The latest PROFFAST release includes a revised version of the wrapper with significantly extended functionalities [40].

3.7. AirCore Developments and Results

Recently, the AirCore technique has been further developed to additionally obtain vertical profiles of N2O and OCS. For the former, a dedicated N2O analyzer (Picarro, Inc., Santa Clara, CA, USA, model G5310) is inserted inline upstream of the G2401 [41]. For the latter, both in Kiruna (August 2021) and Sodankylä (August 2023), AirCore samples were analyzed using a quantum cascade laser spectrometer (QCLS; Aerodyne Research Inc., Billerica, MA, USA, model TILDAS-CS), allowing for simultaneous measurements of OCS, N2O, CO2, CH4, and CO [42]. Precision for OCS (1σ of individual samples collected at 1 Hz) of the QCLS is better than 20 ppt, with an accuracy of ±40 ppt on the NOAA scale. Preliminary profiles for OCS are derived and will be presented in a separate manuscript (in preparation). These profiles will be very useful and allow a comparison of OCS total columns between FTIR and AirCore.

4. Achieving FRM Status

The CEOS Working Group Cal/Val (WGCV) established a means to enable Cal/Val data providers to robustly evidence that they are FRM compliant or to show their progress towards being fully FRM compliant, such as to allow their users to assess and weight the utility of the data in validating the performance of a particular satellite mission. Such assessment obtains the prefix of CEOS-FRM [1]. In order to be flexible, to maximize inclusivity and to encourage the development and evolution of the FRM data providers from new or existing teams, CEOS WGCV has set the compliance with criteria based on a gradation scaling rather than a simple fail/pass approach. The degree of compliance and associated gradation is presented in a Maturity Matrix (MM) model [1]. The MM is, therefore, a simple assessment tool to check the status of any candidate FRM dataset versus all given criteria, showing visually where it has achieved maturity and where further evolution and effort would be needed. Such a system allows the intended users of the FRM data to assess suitability for their particular application. It also gives an overview to the funders to decide on where and on what aspects to focus any investment.
The FRM4GHG projects have been very important in terms of both instrument development/modifications and testing, as well as the corresponding developments on the side of the data analysis software to achieve high-quality reference data for greenhouse gases. Amongst the tested instruments, the EM27/SUN showed very good performance with respect to the reference TCCON measurements; they constitute the COllaborative Carbon Column Observing Network (COCCON). COCCON is the new emerging infrastructure for GHG measurements initiated by KIT. COCCON has well-established protocols for the definition and maintenance of instrumental standards; it provides a service for the verification of the performance of the new spectrometers, has a defined protocol for data processing and formatting using community-wide standards, and for dissemination to the user community. The Vertex70 (and upgraded Invenio) type of spectrometer showed performances comparable to the EM27/SUN. The COCCON data processing software has been adapted to ingest raw data from the Vertex70 type of spectrometers and provide retrieval outputs following the COCCON standards. This effort led to including Vertex70 types of spectrometers under the umbrella of COCCON. In this section we will do a self-assessment of COCCON data by completing the CEOS-FRM MM.
Table 4 shows the Maturity Matrix for the COCCON graded by self-assessment following the guidelines [1] proposed by CEOS WGCV. The details of the different categories of assessment are documented in the “FRM Assessment Framework” document by CEOS WGCV and available on the CEOS Cal/Val Portal https://calvalportal.ceos.org/web/guest/frms-assessment-framework (accessed on 1 March 2024). There are several categories where the performance is graded either Ideal or Excellent, with the exception of Automation level, where the grading is Good. The CEOS-FRM definition of the ‘Automation level’ category refers to the whole process from data collection to user access and utilization. It assesses the status towards automatic calibration, automatic measurement, automatic QA/QC of instrument parameters, automatic data transfer, and automatic processing to satellite sensor observation. COCCON has achieved a certain level of automation in some of the categories and is working towards achieving a higher level in the future.
COCCON falls under class B according to the definition of the CEOS-FRM overall classification guidelines. COCCON meets many of the key criteria and has a path towards meeting the class A status in the future, where the condition to achieve a class of Ideal (class A) in the ‘guidance criteria’ in the ‘independent verification’ section of the MM and green (at least excellent) for all other verification categories where these have been carried out.

5. Discussion and Outlook

The first three years (2017–2019) of the FRM4GHG campaign were successfully executed by comparing four portable remote sensing instruments, namely EM27/SUN, Vertex70, IRCube, and Laser Heterodyne spectro-Radiometer, against a reference TCCON instrument. All instruments were deployed at the Sodankylä TCCON site during 2017 and 2018, while in the last year (2019), the IRCube was shipped to Australia and performed measurements at the TCCON sites in Wollongong and Darwin. Except for the EM27/SUN, which was operated at ambient temperature and pressure, all other tested instruments were placed inside the dedicated temperature-controlled FRM4GHG container and guided the solar light using solar trackers installed on the roof of the container. All instruments except the EM27/SUN needed optimization and behaved better after modifications, resulting in a low bias and a high correlation relative to the reference instrument. During the first year of the campaign, non-linearity of the detector response of the TCCON instrument was detected while making comparisons with the EM27/SUN, and the TCCON data were corrected for this effect. Possible non-linearity effects were also detected from the Vertex70 measurements during the first part of the first year. Several signal optimizations were tested during the first and second years. During the third year (2019), measurements were performed with an unchanged optimized configuration. IRCube underwent several changes during the three years of the campaign. Given the remote, autonomous operation of the LHR in the Arctic, the instrumental feedback from the data was on a 1-year timescale, so the next work for the improvements and testing will be at the Harwell TCCON site in Great Britain [20].
A series of AirCore measurements of CO2, CH4, and CO vertical profiles were performed during the project. These measurements were used to support comparisons with remote sensing observations. The EM27/SUN comparison results showed high precision and good correlation with the reference TCCON data. The bias shows a seasonality caused by the difference in the sensitivities of the high- and low-resolution instruments and the a priori not matching well with the actual profile shape. The comparison with the optimized Vertex70 relative to the TCCON showed a significantly lower scatter compared to the factory settings and comparable to the EM27/SUN results relative to the TCCON, therefore justifying its integration into COCCON. The IRCube results were continuously improving with the instrument modifications as to their precision. The best results were achieved during the deployment in Darwin in 2019. However, each instrumental change resulted in a step jump in the Xgas values. This required further investigation during the FRM4GHG2 campaign. The reason for these jumps has been attributed to the variability in the input optics alignment, which impacted the FOV and ILS of the system. To address this issue, the IRCube was rebuilt in late 2023 to emulate those of the EM27/SUN systems. In the current system, the FOV and ILS are defined by the focal length and aperture of the output detector optics inside the spectrometer instead of the entrance aperture. This setup is expected to be more robust and less dependent on the fiber optic input beam alignment. The low-resolution instruments will be scaled to the TCCON using calibration factors calculated from side-by-side measurements performed at reference TCCON site(s). This will tie the results from the low-resolution instruments to the TCCON scale, which is traceable to the WMO reference scale. This step will help to make the data from the low-resolution instruments traceable to the WMO reference scale. An EM27/SUN put inside a dedicated enclosure system is used as a travel standard instrument for GHG. The result of the visit of the travel standard to the Izaña TCCON site is presented here and compared to the previous visits to the Wollongong and Tsukuba TCCON sites. The workflow of the traveling standard instrument has been outlaid here in this paper. The traveling standard results demonstrate that it is possible to compare the Xgas values derived from different TCCON sites with each other. Each site visit of the traveling standard instrument takes several months; therefore, serving all of TCCON sites will take a couple of years unless more traveling standards are implemented and one carefully keeps track of the consistency between them. The multi-year campaign was helpful in checking the long-term stability and consistency of the instruments and their products. It was also beneficial for several of the tested instruments, which have been improved significantly during the campaign, while for some other instruments, further improvements are still ongoing to bring them to a high maturity level.
The Vertex70 type of spectrometer (or Invenio spectrometer) has the possibility to include a second LN2-cooled InSb detector. Measurements were performed in the mid-infrared spectral range in addition to the measurements performed in the NIR spectral range with the room temperature InGaAs detector. From these MIR measurements, a retrieval of N2O, CH4, HCHO, and OCS was performed and compared to reference measurements in the MIR using the high-resolution instrument (Bruker IFS 125HR). The results from the low-resolution Vertex70 are in good agreement with the 125HR MIR data. This gives the opportunity to use the Vertex70 type of spectrometer as a travel standard for some trace gases in the MIR spectral range. An enclosure system with a compact solar tracker and meteorological station has been built to house the Vertex70/Invenio spectrometer and perform autonomous measurements at any location in the field. This will help to complement the TCCON and NDACC networks and increase the observational capabilities of both ground-based networks.
Several updates have been performed to the PROFFAST code. One of the key changes is extending the capability of the code to work with the Vertex70/Invenio/IRCube type of measurements, which record single-sided interferograms, while the EM27/SUN records double-sided interferograms. The second important change is the empirical adjustment of COCCON Xgas products by updating the airmass-independent and airmass-dependent corrections.
The tested instruments have been characterized and calibrated during the campaigns against reference TCCON instruments and AirCore in situ profiles as reference datasets. The measurement protocols have been established and agreed upon within the consortium; the uncertainty budgets have been derived, analyzed, and intercompared between the measurements. The data are openly accessible via the project website (https://frm4ghg.aeronomie.be/, accessed on 1 March 2024) and published in scientific journals for public dissemination of results following the best practices.
The goal is to bring the instruments capable of providing greenhouse gas data of FRM quality under the umbrella of the COllaborative Carbon Column Observing Network (COCCON). While the instrument modifications are performed by the operating institutes, COCCON’s central facility hosted by the Karlsruhe Institute of Technology (KIT) is supporting the extension of the data processing software to ingest and analyze the measurements from various compact FTIR instruments and do centralized processing thereby avoiding processing related differences in the derived products. The intercomparison methodology outlaid in this paper and its implementation for various types of spectrometers will serve as a good basis for future instruments that aim to become part of the COCCON network. As the currently flying satellite product uncertainties are continuously improving and future satellites aim for ambitious uncertainty goals, the ground-based reference measurement networks providing reference data for Cal/Val should likewise also improve their product uncertainties way below the estimated best-case scenario of satellite uncertainty. Further dedicated investments are needed to further improve the uncertainties of the reference ground-based datasets.
Finally, a self-assessment of COCCON data products was performed by filling in the CEOS-FRM Maturity Matrix. The assessment of COCCON with the guidelines of the CEOS-FRM shows that it provides FRM quality GHG data.
We can, therefore, state that the portable, low-resolution instruments EM27/SUN and the Vertex70/Invenio type of FTIR systems under the umbrella of COCCON are able to provide independent, fully characterized, and traceable FRM data that can be used for the validation of greenhouse gases measured by traditional and “new space” satellite missions, as well as for campaigns or long-term measurements from any site and complement TCCON. The provision of high-quality reference FRM data with quantified low uncertainties covering the currently existing geographical gap, as well as extending the range of measurand space to a larger extent, will be of added value for the Cal/Val of current and future greenhouse gas satellite missions.

Author Contributions

Conceptualization, M.K.S., M.D.M. and J.N.; Data curation, M.K.S., H.C., O.G., D.W.T.G., F.H., P.H., B.H., N.J., R.K., N.K., B.L., N.A.M., J.M., C.P., C.V., D.W. and M.Z.; Funding acquisition, M.K.S., M.D.M. and J.N.; Project administration, M.K.S., M.D.M. and J.N.; Resources, M.K.S., M.D.M., J.N., T.B., P.B., P.C., H.C., F.D., O.G., D.W.T.G., F.H., P.H., B.H., C.H., N.J., R.K., N.K., B.L., N.A.M., J.M., W.M., C.P., Q.T., C.V., D.W. and M.Z.; Visualization, M.K.S., B.H., N.J., J.M. and C.V.; Writing—original draft, M.K.S., H.C., F.H., B.H., N.J., R.K., J.M., C.V., D.W. and M.Z.; Writing—review and editing, M.K.S., M.D.M., J.N., H.C., F.D., D.W.T.G., F.H., B.H., N.J., R.K., B.L., J.M., C.V., D.W. and M.Z. All authors have read and agreed to the published version of the manuscript.

Funding

This research and APC were funded by the European Space Agency’s FRM Programme under grant agreement no. 4000117640/16/I-LG and 4000136108/21/I-DT-lr. The PROFFAST data processing scheme has been funded by the European Space Agency’s project COCCON-PROCEEDS I-III under grant agreement no. 4000121212/17/I-EF and COCCON-OPERA under grant agreement no. 4000140431/23/I-DT-Ir. The LHR development and deployment were further supported by the UK Centre for Earth Observation Instrumentation (contract RP10G0435Z1).

Data Availability Statement

The atmospheric concentrations of the trace gases (level 2) are available at https://doi.org/10.18758/71021048.

Acknowledgments

The authors wish to thank everyone involved in the instrument development, modification, and operation, as well as the scientists working on the data analysis which were used in this paper. We thank Angelika Dehn and Paolo Castracane for their continuous support and contributions during the meetings and discussions. The TS observations at Izaña Observatory have been taken in the framework of the ATMO-ACCESS Integrating Activity (grant agreement No 101008004), funded by the European Union’s Horizon 2020 Research and Innovation Program. KIT acknowledges the important contributions made by Jia Chen and her team at TUM in the development of the travel standard unit.

Conflicts of Interest

The authors declare no conflicts of interest.

References

  1. Goryl, P.; Fox, N.; Donlon, C.; Castracane, P. Fiducial reference measurements (frms): What are they? Remote Sens. 2023, 15, 5017. [Google Scholar] [CrossRef]
  2. Wunch, D.; Toon, G.C.; Blavier, J.-F.L.; Washenfelder, R.A.; Notholt, J.; Connor, B.J.; Griffith, D.W.T.; Sherlock, V.; Wennberg, P.O. The total carbon column observing network. Philos. Trans. R. Soc. A Math. Phys. Eng. Sci. 2011, 369, 2087–2112. [Google Scholar] [CrossRef] [PubMed]
  3. Inoue, M.; Morino, I.; Uchino, O.; Nakatsuru, T.; Yoshida, Y.; Yokota, T.; Wunch, D.; Wennberg, P.O.; Roehl, C.M.; Griffith, D.W.T.; et al. Bias corrections of gosat swir xco2 and xch4 with tccon data and their evaluation using aircraft measurement data. Atmos. Meas. Tech. 2016, 9, 3491–3512. [Google Scholar] [CrossRef]
  4. Wunch, D.; Wennberg, P.O.; Osterman, G.; Fisher, B.; Naylor, B.; Roehl, C.M.; O’Dell, C.; Mandrake, L.; Viatte, C.; Kiel, M.; et al. Comparisons of the orbiting carbon observatory-2 (oco-2) xco2 measurements with tccon. Atmos. Meas. Tech. 2017, 10, 2209–2238. [Google Scholar] [CrossRef]
  5. Sha, M.K.; Langerock, B.; Blavier, J.-F.L.; Blumenstock, T.; Borsdorff, T.; Buschmann, M.; Dehn, A.; De Mazière, M.; Deutscher, N.M.; Feist, D.G.; et al. Validation of methane and carbon monoxide from sentinel-5 precursor using tccon and ndacc-irwg stations. Atmos. Meas. Tech. 2021, 14, 6249–6304. [Google Scholar] [CrossRef]
  6. Mazière, M.D.; Thompson, A.M.; Kurylo, M.J.; Wild, J.D.; Bernhard, G.; Blumenstock, T.; Braathen, G.O.; Hannigan, J.W.; Lambert, J.C.; Leblanc, T.; et al. The network for the detection of atmospheric composition change (ndacc): History, status and perspectives. Atmos. Chem. Phys. 2018, 18, 4935–4964. [Google Scholar] [CrossRef]
  7. Sha, M.K.; De Mazière, M.; Notholt, J.; Blumenstock, T.; Chen, H.; Dehn, A.; Griffith, D.W.T.; Hase, F.; Heikkinen, P.; Hermans, C.; et al. Intercomparison of low- and high-resolution infrared spectrometers for ground-based solar remote sensing measurements of total column concentrations of CO2, CH4, and CO. Atmos. Meas. Tech. 2020, 13, 4791–4839. [Google Scholar] [CrossRef]
  8. Karion, A.; Sweeney, C.; Tans, P.; Newberger, T. Aircore: An innovative atmospheric sampling system. J. Atmos. Ocean. Technol. 2010, 27, 1839–1853. [Google Scholar] [CrossRef]
  9. Kivi, R.; Heikkinen, P. Fourier transform spectrometer measurements of column co2 at sodankylä, finland. Geosci. Instrum. Methods Data Syst. 2016, 5, 271–279. [Google Scholar] [CrossRef]
  10. Wunch, D.; Toon, G.C.; Sherlock, V.; Deutscher, N.M.; Liu, C.; Feist, D.G.; Wennberg, P.O. The Total Carbon Column Observing Network’s GGG2014 Data Version; Technical Report; Carbon Dioxide Information Analysis Center, Oak Ridge National Laboratory: Oak Ridge, TN, USA, 2015. [Google Scholar]
  11. Laughner, J.L.; Toon, G.C.; Mendonca, J.; Petri, C.; Roche, S.; Wunch, D.; Blavier, J.-F.; Griffith, D.W.T.; Heikkinen, P.; Keeling, R.F.; et al. The total carbon column observing network’s ggg2020 data version. Earth Syst. Sci. Data Discuss. 2023, 16, 2197–2260. [Google Scholar] [CrossRef]
  12. Gisi, M.; Hase, F.; Dohe, S.; Blumenstock, T.; Simon, A.; Keens, A. Xco2-measurements with a tabletop fts using solar absorption spectroscopy. Atmos. Meas. Tech. 2012, 5, 2969–2980. [Google Scholar] [CrossRef]
  13. Hase, F.; Frey, M.; Kiel, M.; Blumenstock, T.; Harig, R.; Keens, A.; Orphal, J. Addition of a channel for xco observations to a portable ftir spectrometer for greenhouse gas measurements. Atmos. Meas. Tech. 2016, 9, 2303–2313. [Google Scholar] [CrossRef]
  14. Weidmann, D. 4-atmospheric trace gas measurements using laser heterodyne spectroscopy. In Advances in Spectroscopic Monitoring of the Atmosphere; Elsevier: Amsterdam, The Netherlands, 2021; pp. 159–223. ISBN 978-0-12-815014-6. [Google Scholar] [CrossRef]
  15. Weidmann, D.; Reburn, W.J.; Smith, K.M. Ground-based prototype quantum cascade laser heterodyne radiometer for atmospheric studies. Rev. Sci. Instrum. 2007, 78, 073107. [Google Scholar] [CrossRef] [PubMed]
  16. Hoffmann, A.; Macleod, N.A.; Huebner, M.; Weidmann, D. Thermal infrared laser heterodyne spectroradiometry for solar occultation atmospheric co2 measurements. Atmos. Meas. Tech. 2016, 9, 5975–5996. [Google Scholar] [CrossRef]
  17. Tsai, T.R.; Rose, R.A.; Weidmann, D.; Wysocki, G. Atmospheric vertical profiles of o3, n2o, ch4, ccl2f2, and h2o retrieved from external-cavity quantum-cascade laser heterodyne radiometer measurements. Appl. Opt. 2012, 51, 8779–8792. [Google Scholar] [CrossRef]
  18. Dirksen, R.J.; Sommer, M.; Immler, F.J.; Hurst, D.F.; Kivi, R.; Vömel, H. Reference quality upper-air measurements: Gruan data processing for the vaisala rs92 radiosonde. Atmos. Meas. Tech. 2014, 7, 4463–4490. [Google Scholar] [CrossRef]
  19. Frey, M.; Sha, M.K.; Hase, F.; Kiel, M.; Blumenstock, T.; Harig, R.; Surawicz, G.; Deutscher, N.M.; Shiomi, K.; Franklin, J.E.; et al. Building the collaborative carbon column observing network (coccon): Long-term stability and ensemble performance of the em27/sun fourier transform spectrometer. Atmos. Meas. Tech. 2019, 12, 1513–1530. [Google Scholar] [CrossRef]
  20. Brownsword, R.; Doniki, S.; Weidmann, D. Harwell TCCON Site Accreditation Application Report. 1.3, 1–35. Zenodo 2023. [Google Scholar] [CrossRef]
  21. Stavrakou, T.; Müller, J.-F.; De Smedt, I.; Van Roozendael, M.; van der Werf, G.R.; Giglio, L.; Guenther, A. Evaluating the performance of pyrogenic and biogenic emission inventories against one decade of space-based formaldehyde columns. Atmos. Chem. Phys. 2009, 9, 1037–1060. [Google Scholar] [CrossRef]
  22. Vigouroux, C.; Aquino, C.A.B.; Bauwens, M.; Becker, C.; Blumenstock, T.; De Mazière, M.; García, O.; Grutter, M.; Guarin, C.; Hannigan, J.; et al. Ndacc harmonized formaldehyde time series from 21 ftir stations covering a wide range of column abundances. Atmos. Meas. Tech. 2018, 11, 5049–5073. [Google Scholar] [CrossRef]
  23. Vigouroux, C.; Langerock, B.; Aquino, C.A.B.; Blumenstock, T.; Cheng, Z.; De Mazière, M.; De Smedt, I.; Grutter, M.; Hannigan, J.W.; Jones, N.; et al. Tropomi–sentinel-5 precursor formaldehyde validation using an extensive network of ground-based fourier-transform infrared stations. Atmos. Meas. Tech. 2020, 13, 3751–3767. [Google Scholar] [CrossRef]
  24. Goldan, P.D.; Fall, R.; Kuster, W.C.; Fehsenfeld, F.C. Uptake of cos by growing vegetation: A major tropospheric sink. J. Geophys. Res. Atmos. 1988, 93, 14186–14192. [Google Scholar] [CrossRef]
  25. Campbell, J.E.; Carmichael, G.R.; Chai, T.; Mena-Carrasco, M.; Tang, Y.; Blake, D.R.; Blake, N.J.; Vay, S.A.; Collatz, G.J.; Baker, I.; et al. Photosynthetic control of atmospheric carbonyl sulfide during the growing season. Science 2008, 322, 1085–1088. [Google Scholar] [CrossRef] [PubMed]
  26. Whelan, M.E.; Lennartz, S.T.; Gimeno, T.E.; Wehr, R.; Wohlfahrt, G.; Wang, Y.; Kooijmans, L.M.J.; Hilton, T.W.; Belviso, S.; Peylin, P.; et al. Reviews and syntheses: Carbonyl sulfide as a multi-scale tracer for carbon and water cycles. Biogeosciences 2018, 15, 3625–3657. [Google Scholar] [CrossRef]
  27. Wang, Y.; Deutscher, N.M.; Palm, M.; Warneke, T.; Notholt, J.; Baker, I.; Berry, J.; Suntharalingam, P.; Jones, N.; Mahieu, E.; et al. Towards understanding the variability in biospheric co2 fluxes: Using ftir spectrometry and a chemical transport model to investigate the sources and sinks of carbonyl sulfide and its link to co2. Atmos. Chem. Phys. 2016, 16, 2123–2138. [Google Scholar] [CrossRef]
  28. Hannigan, J.W.; Ortega, I.; Shams, S.B.; Blumenstock, T.; Campbell, J.E.; Conway, S.; Flood, V.; Garcia, O.; Griffith, D.; Grutter, M.; et al. Global atmospheric ocs trend analysis from 22 ndacc stations. J. Geophys. Res. Atmos. 2022, 127, e2021JD035764. [Google Scholar] [CrossRef]
  29. Zhou, M.; Langerock, B.; Sha, M.K.; Hermans, C.; Kumps, N.; Kivi, R.; Heikkinen, P.; Petri, C.; Notholt, J.; Chen, H.; et al. Atmospheric n2o and ch4 total columns retrieved from low-resolution fourier transform infrared (ftir) spectra (bruker vertex 70) in the mid-infrared region. Atmos. Meas. Tech. 2023, 16, 5593–5608. [Google Scholar] [CrossRef]
  30. Neefs, E.; De Mazière, M.; Scolas, F.; Hermans, C.; Hawat, T. Barcos, an automation and remote control system for atmospheric observations with a bruker interferometer. Rev. Sci. Instrum. 2007, 78, 035109. [Google Scholar] [CrossRef]
  31. Heinle, L.; Chen, J. Automated enclosure and protection system for compact solar-tracking spectrometers. Atmos. Meas. Tech. 2018, 11, 2173–2185. [Google Scholar] [CrossRef]
  32. ICOS RI. ICOS Atmosphere Station Specifications v2.0; Laurent, O., Ed.; ICOS ERIC: Helsinki, Finland, 2020. [Google Scholar] [CrossRef]
  33. Wunch, D.; Toon, G.C.; Wennberg, P.O.; Wofsy, S.C.; Stephens, B.B.; Fischer, M.L.; Uchino, O.; Abshire, J.B.; Bernath, P.; Biraud, S.C.; et al. Calibration of the total carbon column observing network using aircraft profile data. Atmos. Meas. Tech. 2010, 3, 1351–1362. [Google Scholar] [CrossRef]
  34. Messerschmidt, J.; Geibel, M.C.; Blumenstock, T.; Chen, H.; Deutscher, N.M.; Engel, A.; Feist, D.G.; Gerbig, C.; Gisi, M.; Hase, F.; et al. Calibration of tccon column-averaged co2: The first aircraft campaign over european tccon sites. Atmos. Chem. Phys. 2011, 11, 10765–10777. [Google Scholar] [CrossRef]
  35. Hase, F.; Drouin, B.J.; Roehl, C.M.; Toon, G.C.; Wennberg, P.O.; Wunch, D.; Blumenstock, T.; Desmet, F.; Feist, D.G.; Heikkinen, P.; et al. Calibration of sealed hcl cells used for tccon instrumental line shape monitoring. Atmos. Meas. Tech. 2013, 6, 3527–3537. [Google Scholar] [CrossRef]
  36. Hase, F.; Blumenstock, T.; Paton-Walsh, C. Analysis of the instrumental line shape of high-resolution fourier transform ir spectrometers with gas cell measurements and new retrieval software. Appl. Opt. 1999, 38, 3417–3422. [Google Scholar] [CrossRef] [PubMed]
  37. Herkommer, C.; Alberti, C.; Castracane, P.; Chen, J.; Dehn, A.; Dietrich, F.; Deutscher, N.M.; Frey, M.M.; Groß, J.; Gillespie, L.; et al. a portable ftir spectrometer to evaluate the consistency of tccon measurements on a global scale: The coccon travel standard. EGUsphere 2024, 2024, 1–46. [Google Scholar] [CrossRef]
  38. Alberti, C.; Hase, F.; Frey, M.; Dubravica, D.; Blumenstock, T.; Dehn, A.; Castracane, P.; Surawicz, G.; Harig, R.; Baier, B.C.; et al. Improved calibration procedures for the em27/sun spectrometers of the collaborative carbon column observing network (coccon). Atmos. Meas. Tech. 2022, 15, 2433–2463. [Google Scholar] [CrossRef]
  39. Petri, C.; Warneke, T.; Jones, N.; Ridder, T.; Messerschmidt, J.; Weinzierl, T.; Geibel, M.; Notholt, J. Remote sensing of CO2 and CH4 using solar absorption spectrometry with a low resolution spectrometer. Atmos. Meas. Tech. 2012, 5, 1627–1635. [Google Scholar] [CrossRef]
  40. Feld, L.; Herkommer, B.; Vestner, J.; Dubravica, D.; Alberti, C.; Hase, F. Proffastpylot: Running proffast with python. J. Open Source Softw. 2024, 9, 6481. [Google Scholar] [CrossRef]
  41. Tong, X.; van Heuven, S.; Scheeren, B.; Kers, B.; Hutjes, R.; Chen, H. Aircraft-based aircore sampling for estimates of n2o and ch4 emissions. Environ. Sci. Technol. 2023, 57, 15571–15579. [Google Scholar] [CrossRef] [PubMed]
  42. Vinković, K.; Andersen, T.; de Vries, M.; Kers, B.; van Heuven, S.; Peters, W.; Hensen, A.; Bulk, P.v.D.; Chen, H. Evaluating the use of an unmanned aerial vehicle (uav)-based active aircore system to quantify methane emissions from dairy cows. Sci. Total Environ. 2022, 831, 154898. [Google Scholar] [CrossRef]
Figure 1. Background anomaly of the Laser Heterodyne spectro-Radiometer. The black curve shows the CH4 lines at low solar elevation, and the blue curve shows the measurements at mid-solar elevation angles. The red line indicates the background corrected origin, while the green line is the actual zero transmission.
Remotesensing 16 03525 g001
Figure 2. Time series of XCO2 (a), XCH4 (c), and XCO (e) retrieved from AirCore and the TCCON instrument for measurements performed at Sodankylä during the period of 2017–2019, and their differences (AirCore minus TCCON) ΔXCO2 (b), ΔXCH4 (d), and ΔXCO (f) for the same period.
Remotesensing 16 03525 g002
Figure 3. Mean bias (solid points), standard deviation of the differences (error bars), and correlation coefficients (open points) for XCO2 (red), XCH4 (blue), and XCO (green) between Xgas calculated from the AirCore relative to the TCCON data for the individual years of the campaign as well as the averaged results over all years.
Remotesensing 16 03525 g003
Figure 4. Time series of XCO2 (a), XCH4 (c), and XCO (e) retrieved from EM27/SUN and TCCON instruments for measurements performed at Sodankylä during the period of 2017–2019, and their differences (EM27/SUN minus TCCON reference) ΔXCO2 (b), ΔXCH4 (d), and ΔXCO (f) for the same period.
Remotesensing 16 03525 g004
Figure 5. Mean bias (solid points), standard deviation of the difference (error bars), and correlation coefficients (open points) for XCO2 (red), XCH4 (blue), and XCO (green) calculated from the EM27/SUN relative to the TCCON for the individual years of the campaign as well as the averaged combined results of all years.
Remotesensing 16 03525 g005
Figure 6. Time series of XCO2 (a) retrieved from Vertex70 and TCCON instruments and their differences (Vertex70 minus TCCON reference) (b) for the same period. The shaded areas represent the time periods where the instrument was not operated in an optimal condition, and some tests were performed to achieve better results. The vertical bars represent the dates when an instrument modification was performed to the Vertex70 during the campaign.
Remotesensing 16 03525 g006
Figure 7. Mean bias (solid points), standard deviation of the difference (error bars), and correlation coefficients (open points) for XCO2 (red), XCH4 (blue), and XCO (green) calculated from the Vertex70 relative to the TCCON for the individual years of the campaign as well as the averaged results over all years.
Remotesensing 16 03525 g007
Figure 8. Time series of XCO2 (a) and XAir (c) retrieved from IRCube and TCCON instruments and their difference of ΔXCO2 (IRCube minus TCCON reference) (b) for the same period. The vertical bars represent the dates when an instrument modification was performed to the IRCube during the campaign.
Remotesensing 16 03525 g008
Figure 9. Mean bias (solid points), standard deviation of the difference (error bars), and correlation coefficients (open points) for XCO2 (red), XCH4 (blue), and XCO (green) calculated from the IRCube relative to the TCCON for the individual years of the campaign as well as the averaged results over all years. SO points to Sodankylä, WE to Wollongong, and DB to Darwin.
Remotesensing 16 03525 g009
Figure 10. Time series of XCO2 (a), XCH4 (c), and XH2O (e) retrieved from LHR and TCCON instruments for measurements performed at Sodankylä during the period of 2017–2019, and their differences (LHR minus TCCON reference) ΔXCO2 (b), ΔXCH4 (d), and ΔXH2O (f) for the same period.
Remotesensing 16 03525 g010
Figure 11. Time series of the retrieved HCHO columns at Sodankylä from the 125HR (blue) and the Vertex70 (red) spectrometers for all measurements (points) and for data in coincidences within 15 min (circles). Bottom: the differences of the HCHO columns Vertex70—125HR for the data in coincidences.
Remotesensing 16 03525 g011
Figure 12. Scatter plot of the HCHO columns retrieved at Sodankylä from the Bruker IFS 125HR and the Vertex70 spectrometers. Theil-Sen regression: y = 0.894 (0.047) x + 3.518 × 10¹³ (1.834 × 10¹²).
Remotesensing 16 03525 g012
Figure 13. Time series of the retrieved OCS columns at Sodankylä from the Vertex70 (blue) and at Kiruna from the 120/5 HR (red) spectrometer for all measurements performed in 2019.
Remotesensing 16 03525 g013
Figure 14. Picture of the enclosure, compact solar tracker, and meteorological station on the mast during deployment at the BIRA-IASB campus in Uccle, Belgium.
Remotesensing 16 03525 g014
Figure 15. Measurements of XCO2, XCH4, and Xluft from the IRCube (red) and TCCON (black) instruments on the UoW campus, Wollongong.
Remotesensing 16 03525 g015
Figure 16. Xgas values from the side-by-side measurements with the COCCON reference spectrometer (SN37) and the TS (SN39) at the Karlsruhe TCCON site. The two days in March and two days in August were collected before and after the visit to the Izaña TCCON site.
Remotesensing 16 03525 g016
Figure 17. Time series of the side-by-side measurements performed at the Izaña TCCON site during the visit of the TS spectrometer. TCCON-HR data are plotted as red pentagons, the TCCON-LR data as sandy stars, and TS data as blue dots.
Remotesensing 16 03525 g017
Figure 18. The results of the TS campaigns conducted so far. The data for Tsukuba (TK) and Wollongong (WG) are taken from Herkommer et al., 2024 [37]. The bars give the deviation in percentage of the HR and LR data at the individual sites relative to the reference in Karlsruhe. The tcorr represents the time-corrected LR data for the Tsukuba site.
Remotesensing 16 03525 g018
Table 1. HCHO retrieval parameters for the Vertex70 measurements.
Retrieval CodeSFIT4
Micro-windows (cm−1)2763.42–2764.17
2765.65–2766.01
2778.15–2779.1
2780.65–2782.0
Retrieved speciesHCHO, HDO, CH4: profiles
O3, N2O, H2O, solar lines: columns
A priori profilesClimatology from NDACC a priori chemical profiles v6
(built from the WACCM v4 model)
(except HDO and H2O)
NCEP 6-hourly profiles for HDO and H2O
Pressure and temperature profilesNCEP 6-hourly profiles
RegularizationTikhonov L1
Table 2. OCS retrieval parameters for the Vertex70 measurements.
Retrieval CodeSFIT4
Micro-windows (cm−1)2047.15–2048.24
2049.17–2050.18
2054.13–2054.97
Retrieved speciesOCS and O3: profiles
CO2, CO, H2O, C18O2, solar lines: columns
A priori profilesClimatology from NDACC a priori chemical profiles v7
(built from the WACCM v5 model) (excluding H2O) monthly means
NCEP 6-hourly profiles for HDO and H2O
Pressure and temperature profilesNCEP 6-hourly profiles
SpectroscopyHITRAN2020
RegularizationTikhonov L1
Table 3. Bias compensation factors before and after the Izaña campaign. Δ XGas ¯ is the average difference between both periods. Δ Δ XGas ¯ is the deviation of the difference from the previous period. The TCCON accuracy is taken from Laughner et al., 2023 [11] (Table 3, column “Mean abs. dev.”).
SpeciesDate K TS SN 37 Δ XGas ¯ Δ Δ XGas ¯ Estimated
TCCON Accuracy
XCO2March 2023 1.00032 ± 0.00004 0.1444 ppm0.2%
August 2023 0.99971 ± 0.00001 −0.1227 ppm−0.26701 ppm (0.067%)
XCH4March 2023 1.00027 ± 0.00001 −0.0001 ppm0.43%
August 2023 1.00027 ± 0.00001 0.0005 ppm0.00060 ppm (0.03%)
XCOMarch 2023 0.99472 ± 0.00053 −0.4636 ppm5.4%
August 2023 0.98276 ± 0.00018 −1.6116 ppm−1.14803 ppm (1.153%)
Table 4. Maturity Matrix for COCCON XCO2, XCH4, and XCO data. The meaning of the colors is defined in Table 5 and follows the CEOS-FRM standards. The header for the self-assessment section and the grade (Table 5) are provided in blue color following the CEOS-FRM standards.
Self-Assessment
Nature of FRMFRM
Instrumentation
Operations/SamplingDataMetrology
DescriptorInstrument
documentation
Automation levelData completenessUncertainty
characterization
Location/availability of FRMEvidence of
traceable calibration
Measurand
sampling/
representativeness
Availability and
usability
Traceability
Documentation
Range of instrumentsMaintenance planATBD on processing: algorithm/softwareData FormatComparison/
calibration of FRM
Complementary
observations
Operator
expertise
Guidelines
on transformation to satellite pixel
Ancillary DataAdequacy for intended class of instrument/measurand
Table 5. Grading criteria for the maturity matrix in Table 2.
Grade
Not assessed
Not assessable
Basic
Good
Excellent
Ideal
Non-public Remotesensing 16 03525 i001
Disclaimer/Publisher’s Note: The statements, opinions and data contained in all publications are solely those of the individual author(s) and contributor(s) and not of MDPI and/or the editor(s). MDPI and/or the editor(s) disclaim responsibility for any injury to people or property resulting from any ideas, methods, instructions or products referred to in the content.

