Article

Dynamic Monitoring and Analysis of Ecological Environment Quality in Arid and Semi-Arid Areas Based on a Modified Remote Sensing Ecological Index (MRSEI): A Case Study of the Qilian Mountain National Nature Reserve

by
Xiuxia Zhang
1,2,
Xiaoxian Wang
3,
Wangping Li
1,2,*,
Xiaodong Wu
4,5,
Xiaoqiang Cheng
6,
Zhaoye Zhou
1,2,
Qing Ling
1,2,
Yadong Liu
4,5,
Xiaojie Liu
1,2,
Junming Hao
1,2,
Tingting Wang
7,
Lingzhi Deng
1,2 and
Lisha Han
1,2
1
School of Civil Engineering, Lanzhou University of Technology, Lanzhou 730050, China
2
Gansu Emergency Mapping Engineering Research Center, Lanzhou 730050, China
3
College of Earth and Environmental Sciences, Lanzhou University, Lanzhou 730000, China
4
Cryosphere Research Station on the Qinghai-Tibet Plateau, Key Laboratory of Cryospheric Science and Frozen Soil Engineering, Northwest Institute of Eco-Environment and Resources, Lanzhou 730000, China
5
College of Resources and Environment, University of Chinese Academy Sciences, Beijing 100049, China
6
School of Geological Engineering and Geomatics, Chang’an University, Xi’an 710054, China
7
College Foreign Languages and Literature, Northwest Normal University, Lanzhou 730070, China
*
Author to whom correspondence should be addressed.
Remote Sens. 2024, 16(18), 3530; https://doi.org/10.3390/rs16183530
Submission received: 5 August 2024 / Revised: 18 September 2024 / Accepted: 18 September 2024 / Published: 23 September 2024

Abstract

:
The ecosystems within the Qilian Mountain National Nature Reserve (QMNNR) and its surrounding areas have been significantly affected by changes in climate and land use, which have, in turn, constrained the region’s socio-economic development. This study investigates the regional characteristics and application requirements of the ecological environment in the arid and semi-arid zones of the reserve. In view of the saturated characteristics of NDVI in the reserve and the high-altitude saline-alkali environmental conditions, this study proposed a Modified Remote Sensing Ecology Index (MRSEI) by introducing the kernel NDVI and comprehensive salinity index (CSI). This approach enhances the applicability of the remote sensing ecological index. The temporal and spatial dynamics of ecological and environmental quality within the QMNNR from 2000 to 2022 were quantitatively assessed using the MRSEI. The effect of land use on ecological quality was quantified by analyzing the MRSEI contribution rate. The findings in this paper indicate that (1) in arid and semi-arid regions, the MRSEI provides a more precise representation of surface ecological environmental quality compared to the remote sensing ecological index (RSEI). The high correlation (R2 = 0.908) and significant difference between MRSEI and RSEI demonstrate that MRSEI enhances the accuracy of evaluating ecological environmental quality. The impact of land use on ecological quality was quantitatively assessed by analyzing the contribution rate of the MRSEI. (2) The ecological quality of the QMNNR exhibited an upward trend from 2000 to 2022, with an increase rate of 1.3 × 10⁻³ y−1. The area characterized by improved ecological and environmental quality constitutes approximately 53.68% of the total area. Conversely, the ecological quality of the degraded areas accounts for roughly 28.77%. (3) Among the various land use types, the improvement in ecological environmental quality within the reserve is primarily attributed to the expansion of forest and grassland areas, along with a reduction in unused land. Forest and grassland types account for over 90% of the total area classified with “good” and “excellent” ecological grades, whereas unused land types represent more than 44% of the total area classified with “poor” ecological grades. Overall, this study provides a valuable framework for analyzing ecological and environmental changes in arid and semi-arid regions.

1. Introduction

Arid and semi-arid regions are characterized by elevated rates of evapotranspiration, limited precipitation, and substantial wind erosion, which collectively contribute to a relatively low carrying capacity in these areas [1]. Influenced by global climate change and land use variety, arid and semi-arid regions face significant ecological challenges, including glacier melting [2], grassland degradation, desertification, and biodiversity loss, all of which contribute to the instability of their ecosystems [3,4]. The QMNNR is situated in the northeastern part of the Qinghai-Tibet Plateau [5], covering arid and semi-arid areas. In recent years, the reserve has experienced several ecological issues, including a decline in vegetation cover, glacier retreat, and surface erosion [6].
The Chinese government has highlighted the importance of enhancing ecological protection and restoration efforts in its protected areas through the “Master Plan for Major Projects to Protect and Restore Important National Ecosystems (2021–2035)”. An accurate comprehension of the evolving characteristics of eco-environmental quality is essential for the successful implementation of ecological restoration and protection policies in protected areas. The rapid and effective routine monitoring of ecological environment quality at a regional scale has emerged as a significant challenge. Consequently, remote sensing technology has been widely utilized for the dynamic monitoring of regional ecological environmental quality, owing to its advantages in large-scale application and frequent data acquisition [7,8].
At present, the methods for assessing ecological environment quality using remote sensing technology are primarily categorized into three groups: (1) the Ecological Environment Status Index (EI); (2) the RSEI [9,10,11] based on the NDVI, WET, LST [12], and NDBSI; and (3) other evaluation models [3]. In comparison to the EI, the RSEI is capable of effectively and objectively capturing dynamic changes in regional ecological environment quality and it has been more extensively utilized. Many improved models based on remote sensing ecological indices have also been proposed. For instance, in order to improve the accuracy and applicability of environmental monitoring in mining areas, Zhang et al. [13] integrated the Enhanced Vegetation Index (EVI), Soil moisture monitoring index (SMMI), NDBSI, LST, and difference index (DI) to construct a comprehensive remote sensing ecological index. To address the issues of unstable time series and inconsistent resolution among the four indices, Yang et al. [14] employed the Google Earth Engine (GEE) to introduce an optimization approach that combines the Harmonic Analysis of Time Series (HANTS) with a Random Forest (RF) model. To accurately assess the relative importance of spatial variations in component indicators, Mondal et al. Introduced [15] a novel RSEI method based on geographically weighted principal component analysis (RSEI-GWPCA). To quantify the intensity of urban surface ecological barren areas, Firozjaei et al. [16] developed a surface ecological barren area index based on the linear regression function derived from the RSEI-impervious surface percentage (ISP) feature space. To differentiate the Land Surface Ecological Status across various land use/cover (LULC) types using remote sensing imagery, particularly bare soil and areas impacted by anthropogenic destructive activities, Firozjaei et al. [17] proposed the Land Surface Ecological Status Composition Index (LSESCI) based on an improved Ridd’s conceptual vegetation-impervious-soil triangular model. Karbalaei et al. [18] employed the remote sensing ecological index to evaluate spatiotemporal changes in ecological quality in Isfahan, Iran, from 2004 to 2019. So as to enhance the stability of the RSEI by mitigating the impact of extreme image values, Zheng et al. [19] substituted standardization for normalization. Furthermore, considering the regional characteristics of arid and semi-arid areas, Zhang et al. [20] incorporated the CSI and Water Network Density into the RSEI. Xu et al. [21] utilized an integrated vegetation-impervious surface–soil–air framework, combined with an optimal parameters-based geographical detector, to examine the relationship between environmental factors and human activities in the Qilian Mountains National Nature Reserve. Dong et al. [22] employed minimum spanning trees and geographic cellular automata to construct and optimize ecological corridors within the Qilian Mountain National Nature Reserve, identifying key areas for conservation focus.
Each of the aforementioned studies enhances remote sensing ecological indices to varying extents for specific locations. However, errors remain in conducting regional-scale ecological environment assessments due to the inherent saturation issue of the NDVI and EVI in densely vegetated areas [23,24]. Building upon this, with a focus on the environmental attributes of high-altitude cold regions and soil salinization [25] in the QMNNR, as well as addressing NDVI saturation issues in densely vegetated areas, this study introduced the kNDVI and CSI indices and combined them with the WET, NDBSI, and LST to develop the MRSEI. The applicability of remote sensing ecological indices in the reserve has been significantly improved. Utilizing the GEE platform, 8194 Landsat remote sensing images were employed to analyze the temporal and spatial dynamics of eco-environmental quality in the QMNNR from 2000 to 2022. This study offers novel insights into the monitoring of ecological quality in arid and semi-arid regions, providing a scientific foundation for the sustainable development of regional ecology.

2. Materials and Methods

2.1. Study Area

The QMNNR (97°23′34″~103°45′49″N, 36°29′57″~39°43′39″E), spanning a total area of 2.65 × 10⁴ km2, was established by the State Council of the People’s Republic of China in 1988 (Figure 1). The total area of the reserve is approximately 2.65 × 10⁴ km2, which is divided into the core area (5.05 × 10³ km2), buffer area (3.87 × 10³ km2), and experimental area (1.09 × 10⁴ km2). The reserve encompasses diverse ecological resources, including forests, meadows (Figure 1a), rivers, and glaciers (Figure 1b), and boasts rich biodiversity. Most of the reserve is situated at elevations ranging from 3000 to 3500 m above sea level, with an average annual rainfall of approximately 350–500 mm, primarily occurring between June and September. The Qilian Mountains serve as an ecological security barrier and a critical area for biodiversity conservation in the Hexi Corridor. Significantly, environmental challenges, including grassland degradation (Figure 1a), glacier melting (Figure 1b), and soil erosion (Figure 1c), within the reserve have escalated [26,27].

2.2. Data Source and Preprocessing

The Landsat images were acquired online using the GEE platform, and the images of the reserve spanning a 23-year period (2000–2022) were selected based on a criterion of low cloud cover (cloud ≤ 25%). Within the GEE cloud platform, the QA band accompanying Landsat images was utilized for cloud masking on 8194 images, and pre-processing tasks such as image coefficient conversion, fusion, and clipping were executed utilizing the Java programming language. Table 1 presents details of the data utilized in this study.
In this study, the availability of Landsat images in the reserve was analyzed utilizing the GEE platform, with a total of 8194 images. Landsat 5 acquired 2945 images from 2000 to 2011, Landsat 7 acquired 2475 images from 2000 to 2012, and Landsat 8 acquired 3061 images from 2012 to 2022. Figure 2 displays the strip distribution and the number of available images.

2.3. Methods

In accordance with the environmental characteristics of the Qilian Mountains, this study integrated the MRSEI was combined with land use changes to investigate the spatial-temporal variations in the ecological and environmental quality of the QMNNR from 2000 to 2022, as illustrated in Figure 3. Initially, the kNDVI and CSI were incorporated to develop the MRSEI, and the applicability of the MRSEI was subsequently assessed. Secondly, the dynamic characteristics of ecological quality in the QMNNR were assessed using Sen-MK spatial trend analysis and the mean time series of MRSEI. Finally, the influence of land utilization types on the ecological environment quality of the reserve was analyzed by utilizing the contribution rate index of the MRSEI and evaluating the changes in land use area.

2.3.1. Modified Remote Sensing Ecological Index

The RSEI combines information from four indicators, greenness, humidity, heat, and dryness, to capture the spatial heterogeneity of ecological conditions. In the arid and semi-arid regions of northwestern China, issues such as land salinization and desertification are significant, and the NDVI exhibits a noticeable saturation effect. Therefore, to enhance the applicability of the RSEI in arid and semi-arid areas, this study developed an MRSEI incorporating five ecological factors: kNDVI, WET, LST, NDBSI, and CSI. A detailed list of the indicators utilized for each factor is presented in Table 2. The specific model is summarized as follows:
(1)
Greenness factor: To quantify the degree of greening within the reserve and to capture vegetation changes more effectively, this study selected the kNDVI index. Compared to the traditional NDVI, kNDVI not only mitigates saturation issues but also exhibits greater robustness [28,29];
(2)
Humidity factor: The humidity factor is defined by the humidity component in the tassel cap transformation, representing surface moisture and soil moisture levels;
(3)
Heat factor: Land surface temperature (LST) was a key indicator of land–atmosphere energy balance and a major factor influencing vegetation dynamics [13]. The heat factor is characterized by the LST. In this study, bands 6 and 10 of Landsat 5/7/8 images were utilized to estimate surface temperature;
(4)
Dryness factor: Given the significant presence of bare soil in arid and semi-arid areas, the dryness factor was quantified using the dryness index [10];
(5)
Salinity factor: Land salinization, desertification, and grassland degradation in arid and semi-arid regions can result in regional-scale ecological deterioration. To effectively capture soil salinization information across a broad area, a comprehensive salinity index [20] was employed.
Where Blue represents the blue band, Green represents the green band, NIR represents the near-infrared band, Red represents the near-band, SWIR1 represents the shortwave infrared band 1, and SWIR2 represents the shortwave infrared band 2. λ is the wavelength of the thermal infrared band. ε denotes the surface emissivity, calculated using NDVI data through the Sobrino model. K1, K2, AF, and MF denote constants for image heat transfer.
In this study, the Modified Normalized Difference Water Index (MNDWI) was employed to mitigate the effect of water on the MRSEI [30]. The calculations are as follows:
MNDWI = ( G r e e n S W I R 1 ) / ( G r e e n + S W I R 1 )
Green and SWIR1 denote the green and short-wave infrared bands in Landsat images, respectively.
To ensure consistency in the dimensions of the five indicators, normalization was conducted prior to performing the principal component analysis. To systematically analyze the temporal and spatial variations in eco-environmental quality within the reserve, the MRSEI was normalized, as illustrated in Equations (2)–(4):
N I i = ( I i I min ) / ( I max I min )
M R S E I 0 = P C 1 [ f ( k N D V I , W E T , L S T , N D B S I , C S I ) ]
MRSEI = ( M R S E I 0 M R S E I 0min ) / ( M R S E I 0max M R S E I 0min )
To facilitate the analysis of spatio-temporal variability in eco-environmental quality within the reserve, the MRSEI was divided into intervals of 0.2, resulting in five grades: poor, fair, moderate, good, and excellent [31].

2.3.2. Changes in the Spatial Trends of Eco-Environmental Quality

The Theil–Sen median analysis method was employed to investigate the spatial trend changes in the MRSEI during the study period [32,33]. The Mann–Kendall (MK) test was utilized to examine the significance of interannual trend changes in the MRSEI from 2000 to 2022. This method, which can eliminate the influence of outliers, has been widely employed in spatial trend analysis. The calculation procedure is as follows:
s l o p e = m e d i a n ( M R S E I i M R S E I j i j ) , 2000 < i < j < 2022
where slope represents the change in the MRSEI trend, median () denotes the median function, and MRSEIi and MRSEIj represent the MRSEI values of the i-th and j-th years, respectively. When slope > 0, the MRSEI indicates an upward trend, and vice versa. The criteria for judgment conditions and trend change levels are presented in Table 3.

2.3.3. MRSEI Contribution Rate

The MRSEI contribution rate was utilized to investigate the influence of various land use types on co-environmental [34], calculated as follows:
EQCT xy = A x y A y × 100 %
where EQCTxy represents the contribution rate index of different land use to MRSEI, Axy represents the area engaged by land utilization type x with ecological quality grade y, and Ay signifies the total area with a level y MRSEI.

2.3.4. Collinear Diagnostic Index

The Variance Inflation Factor (VIF) was used as an indicator to assess the presence of collinearity or redundancy among the five indicators during the construction of MRSEI [35].
When 0 < VIF < 10, there is no information redundancy among the selected indicators, indicating a more reasonable selection of indicators. The VIF was calculated as follows:
VIF = 1 1 R i 2
where Ri2 represents the correlation between one variable and the other independent variables.

3. Results

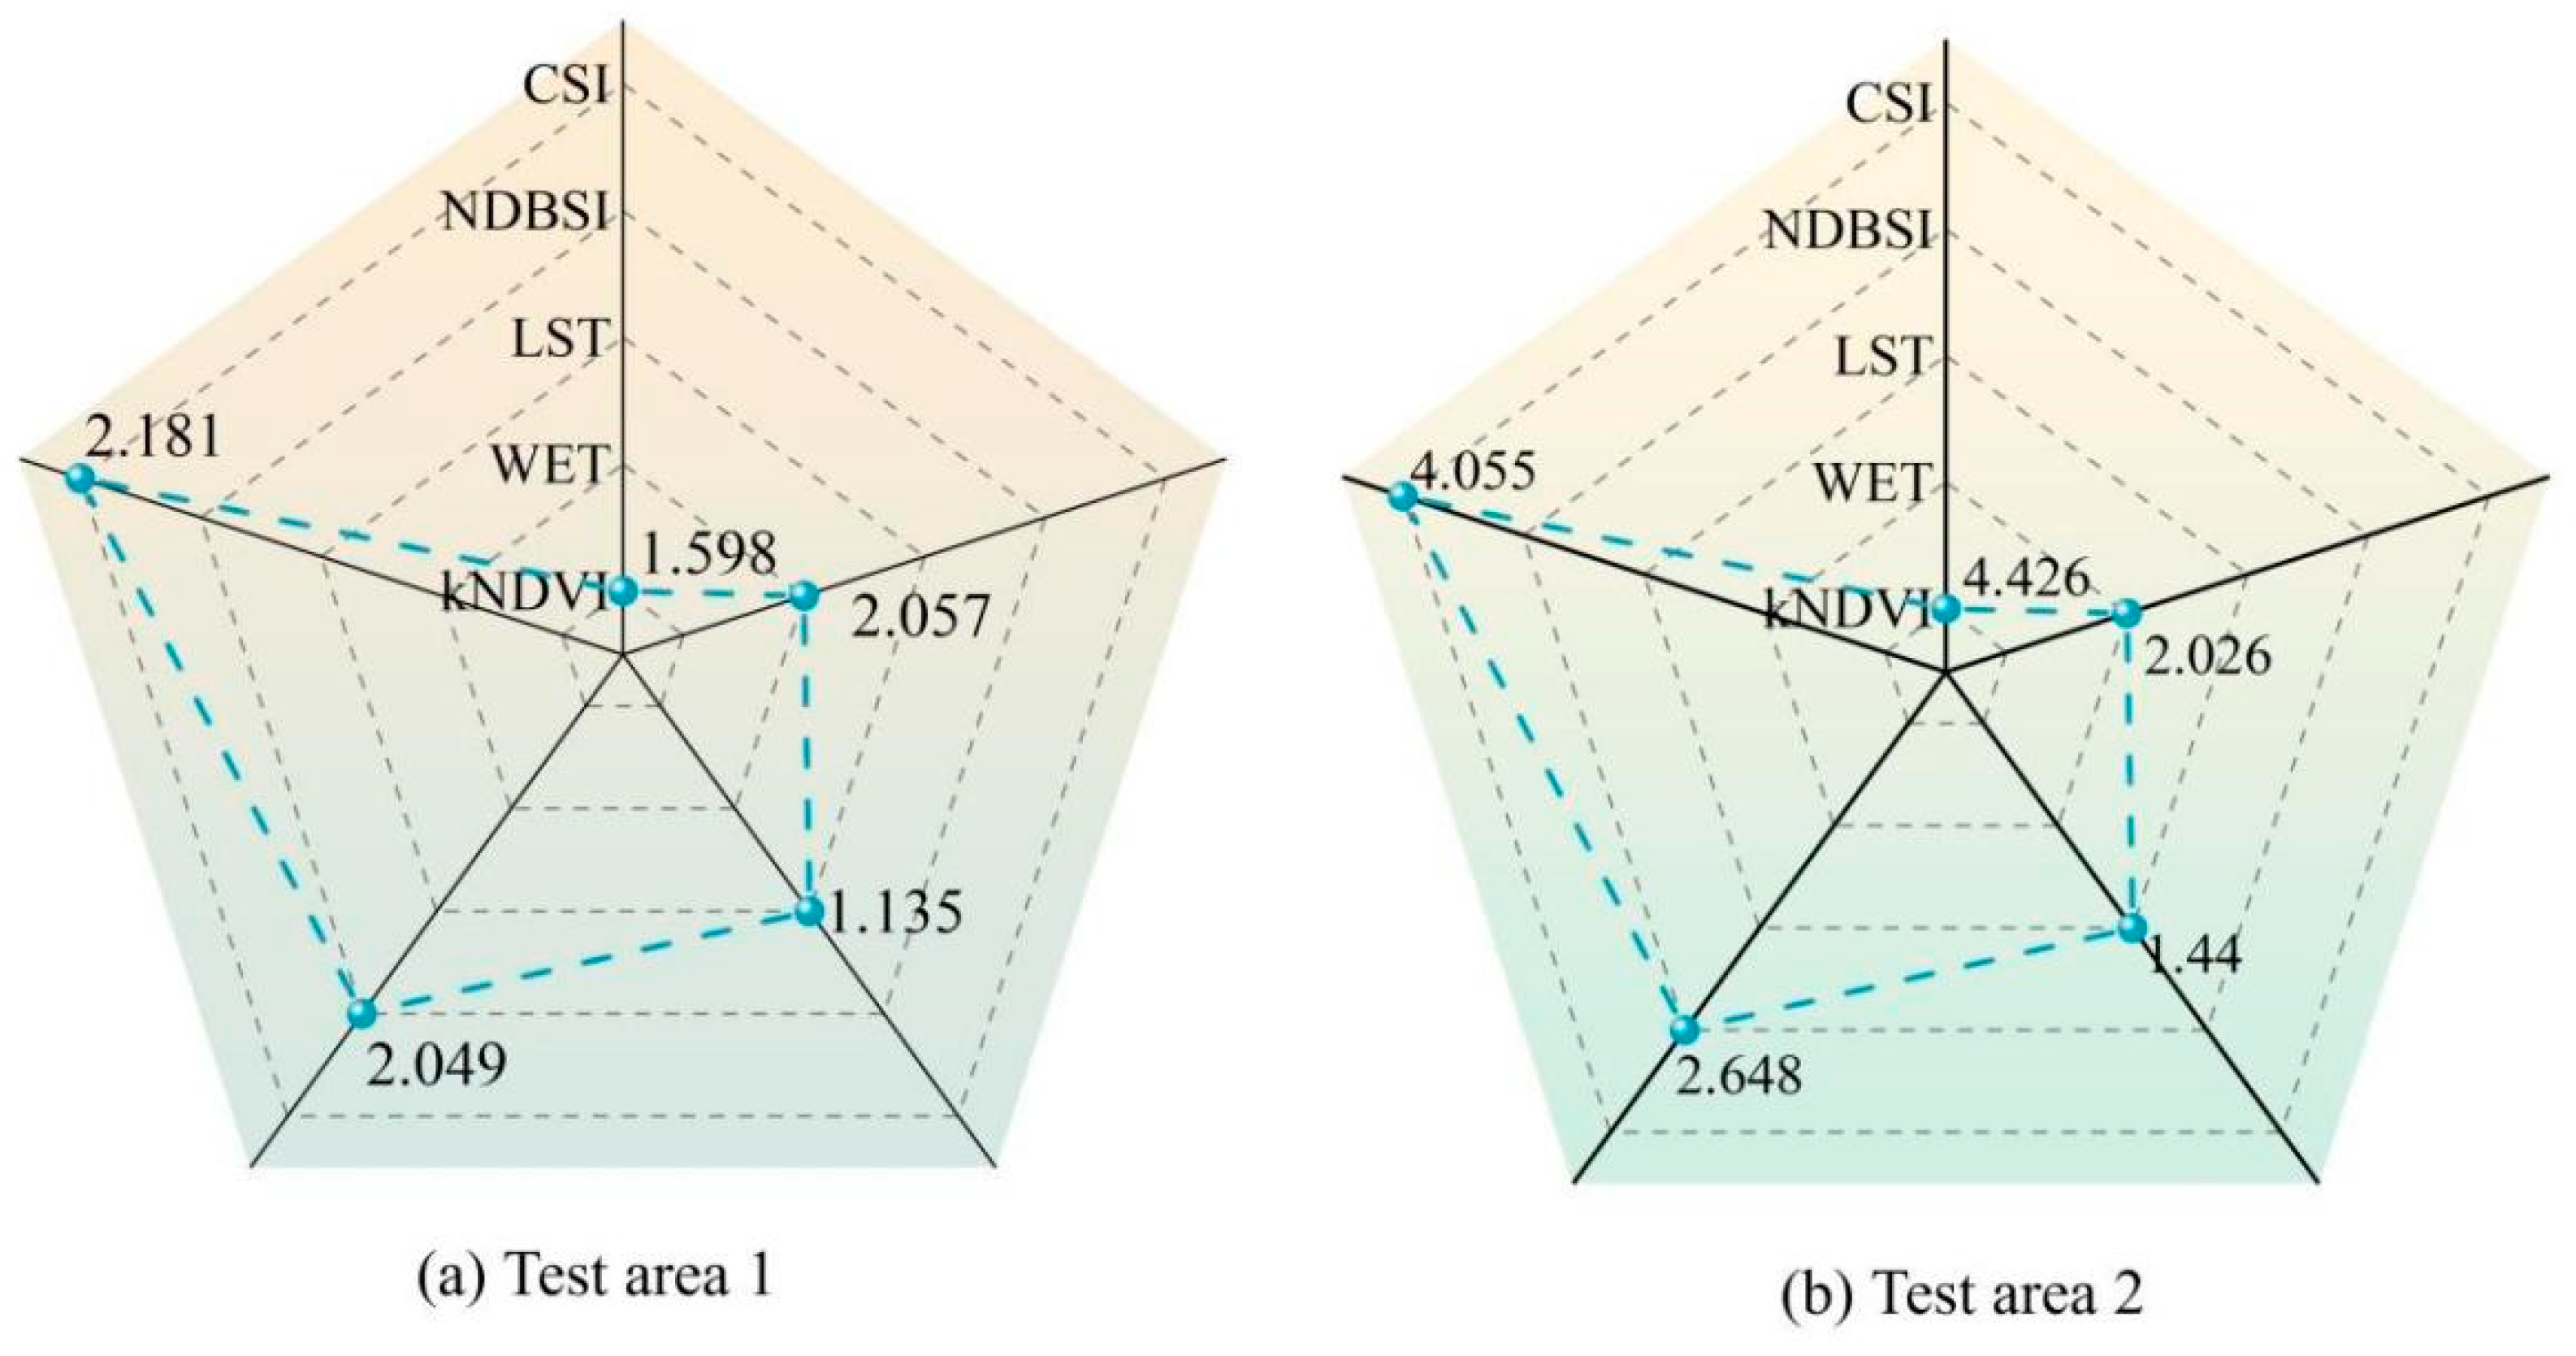
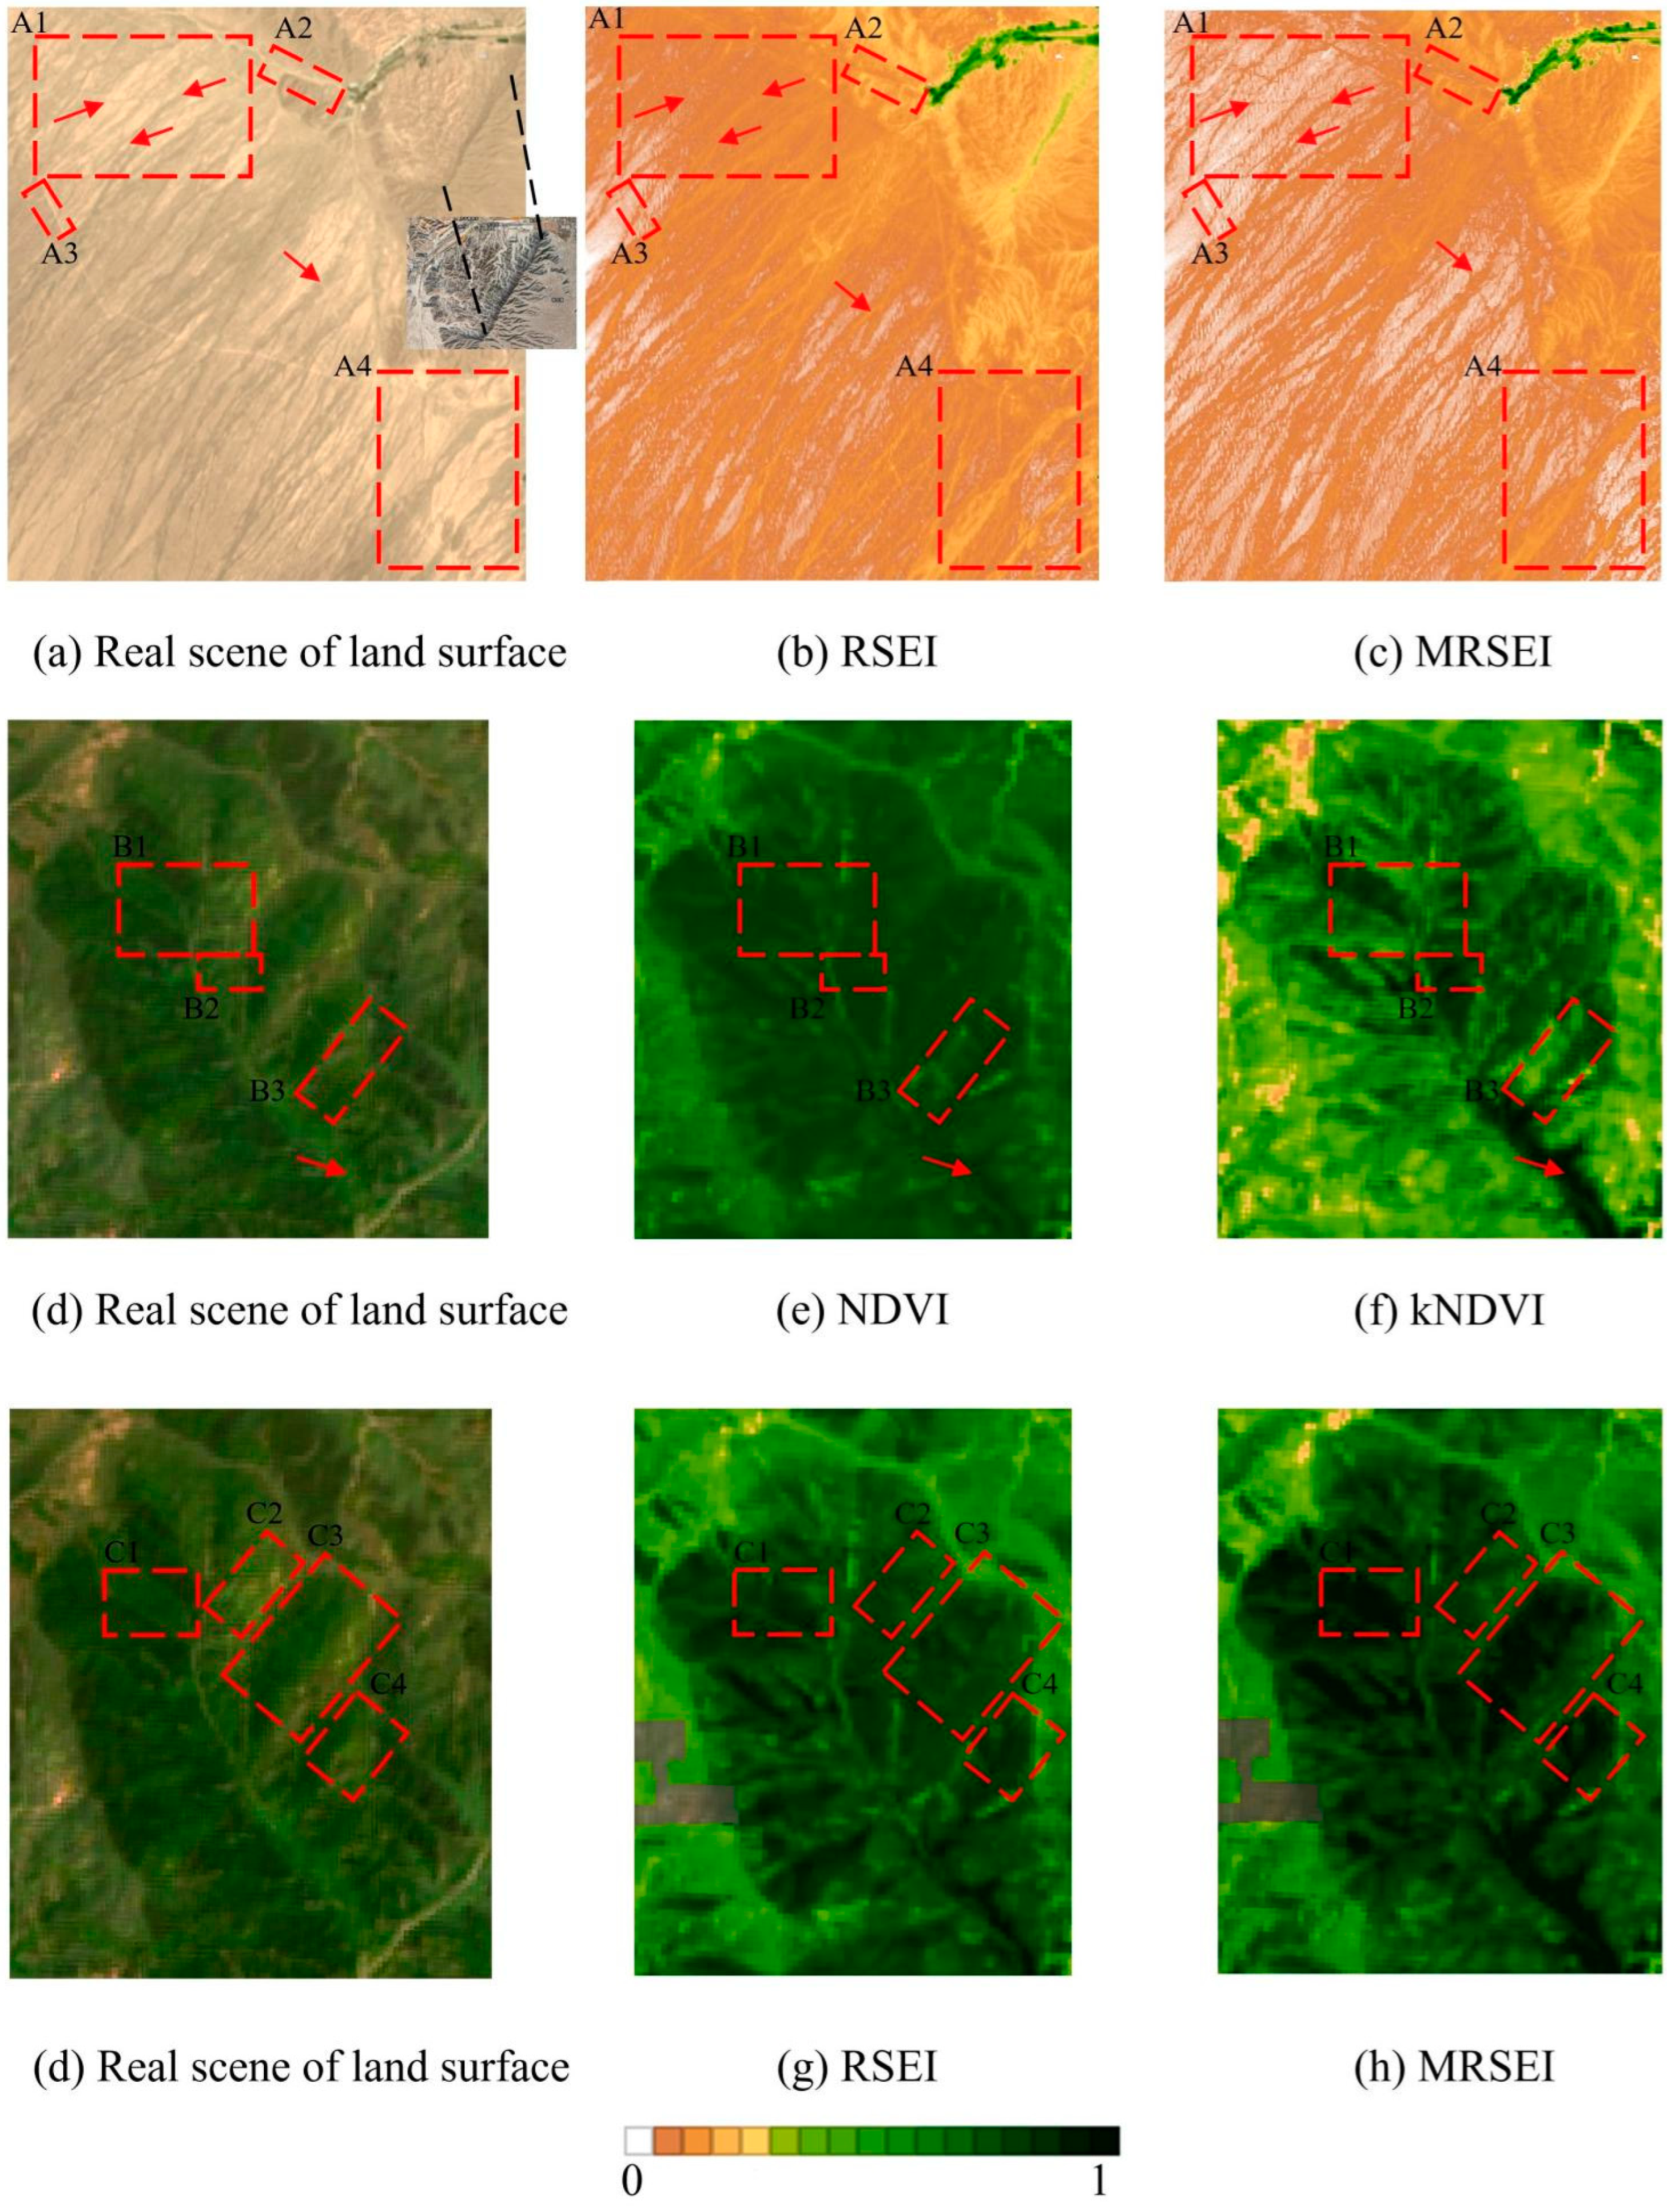
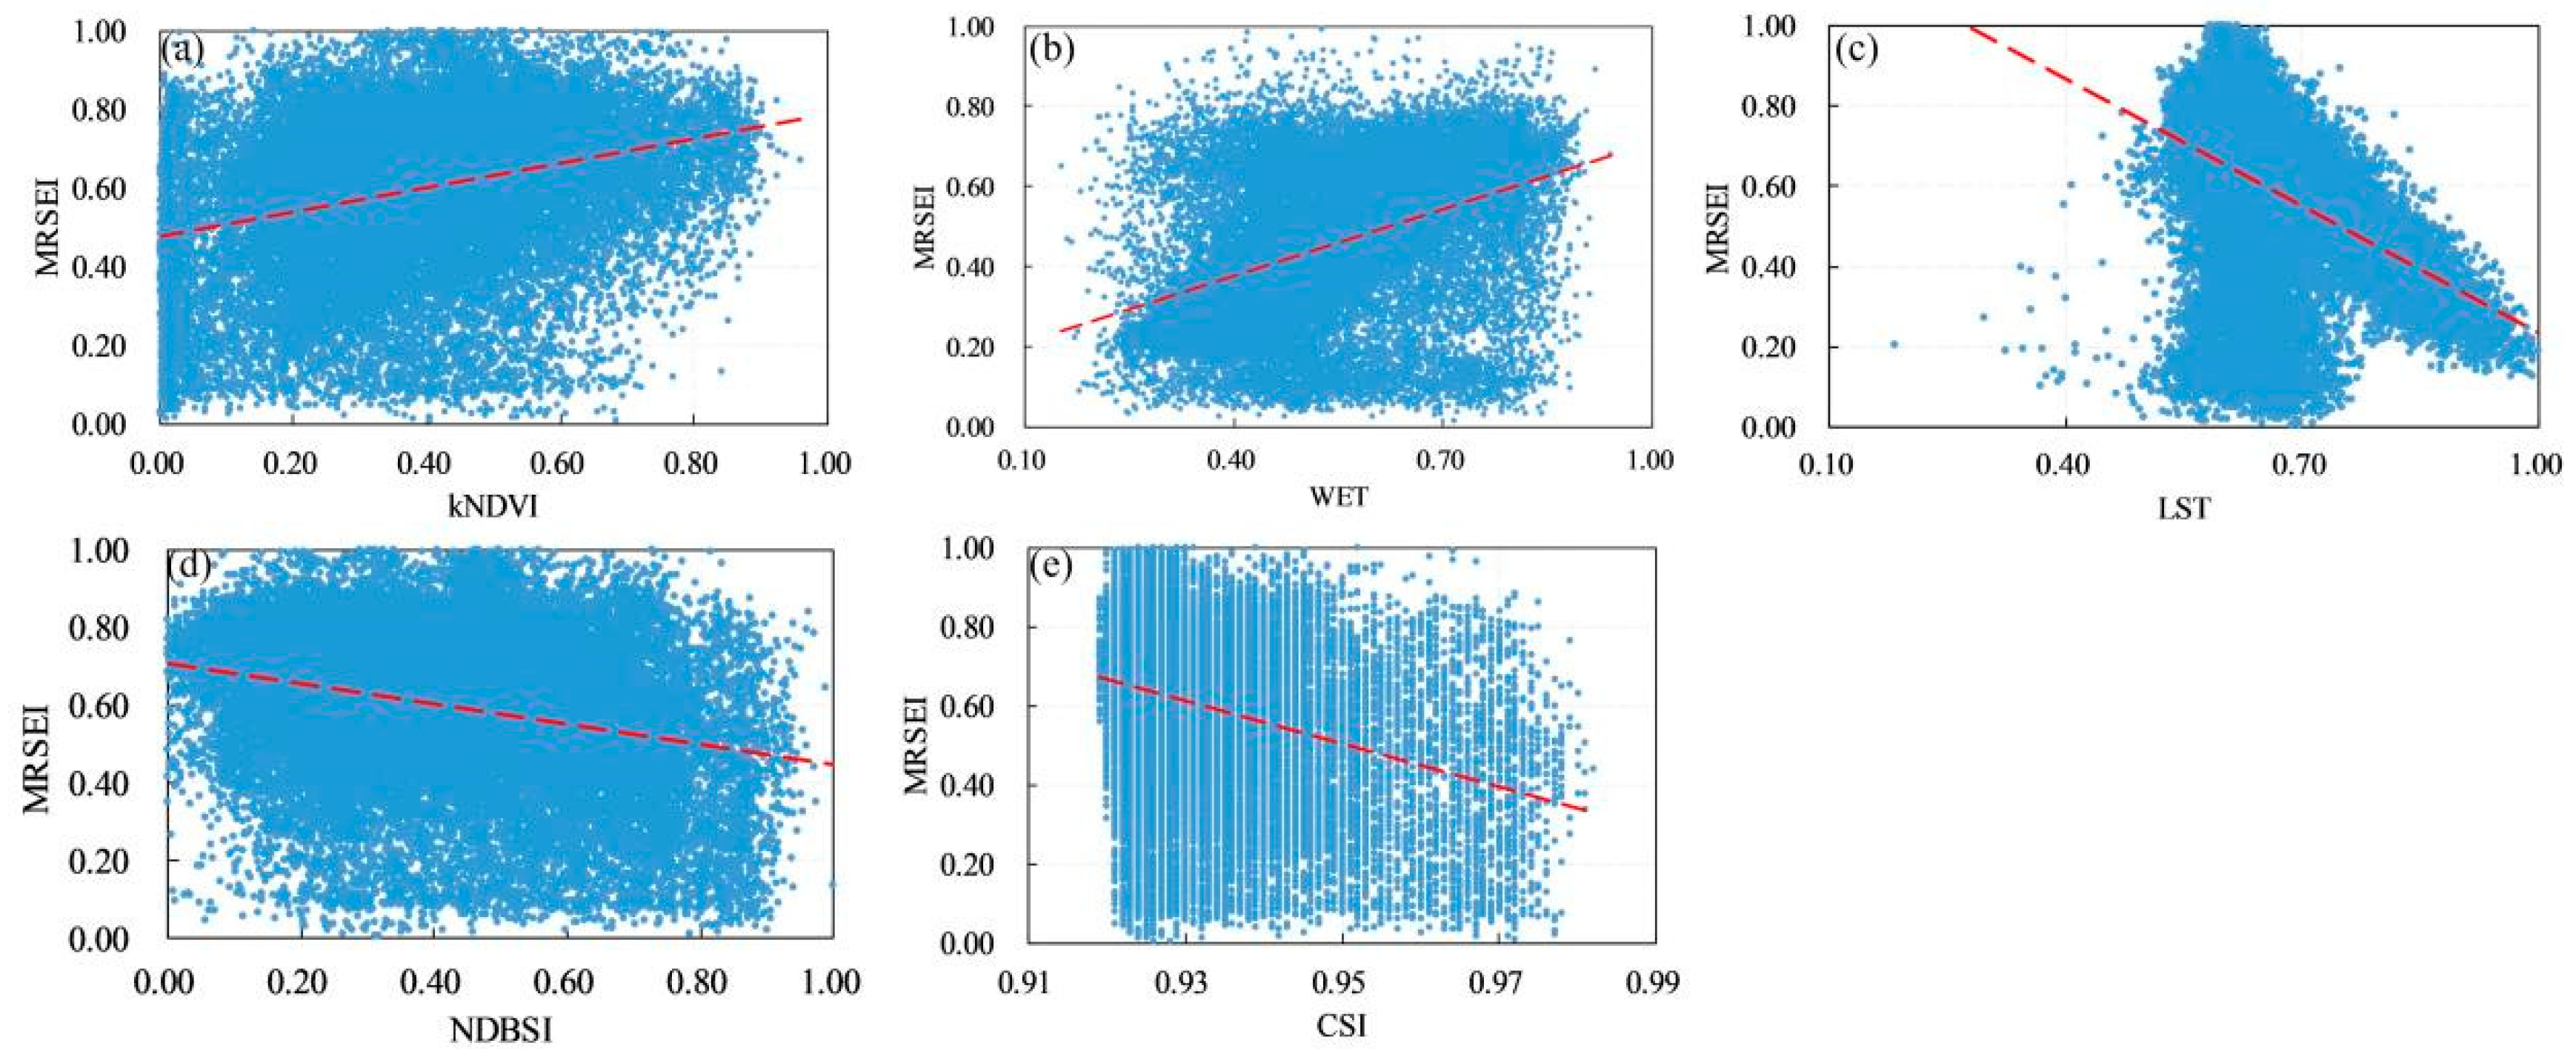
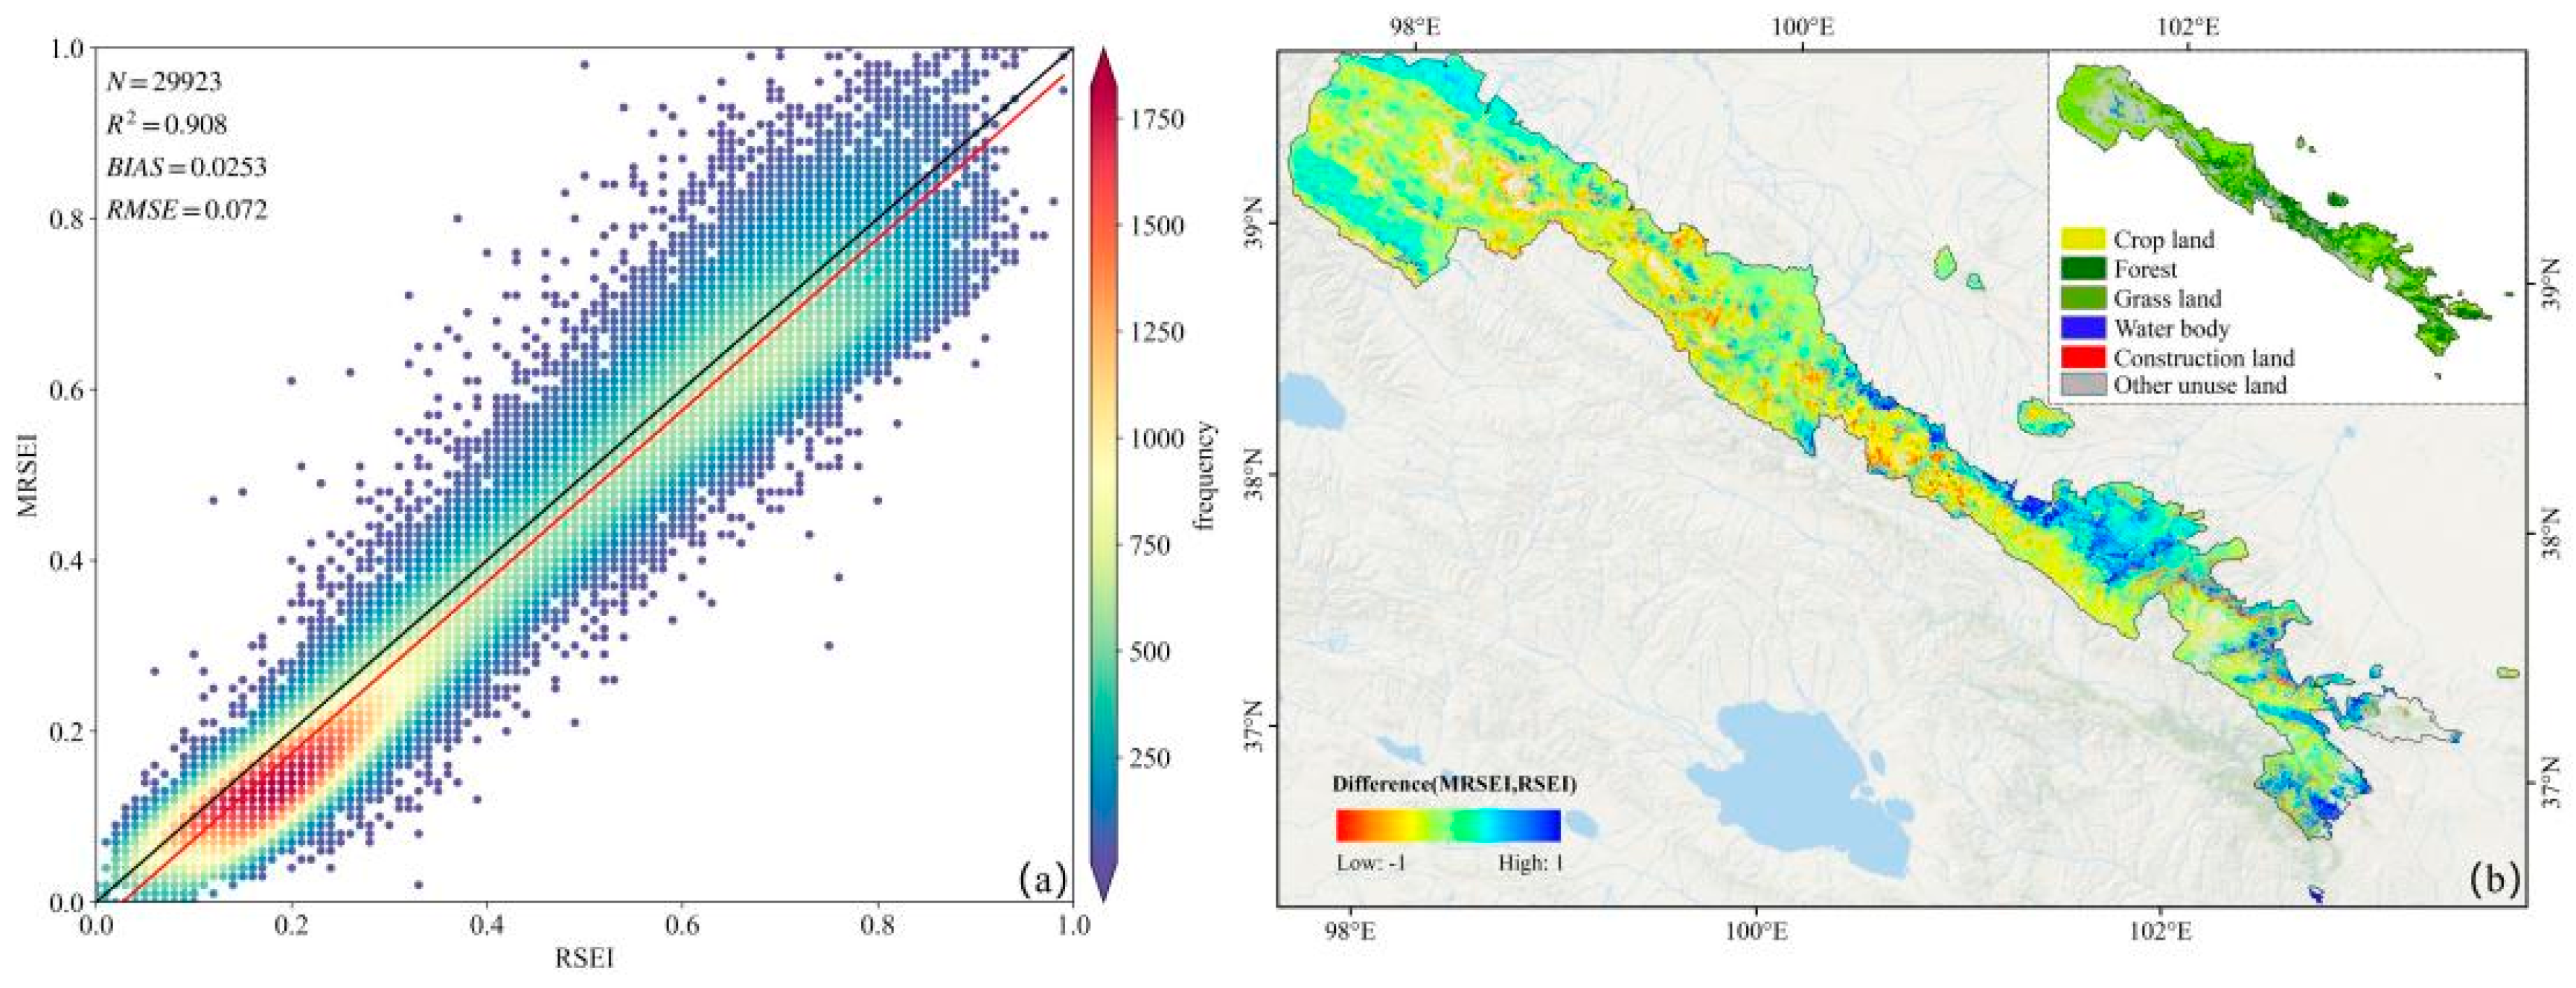
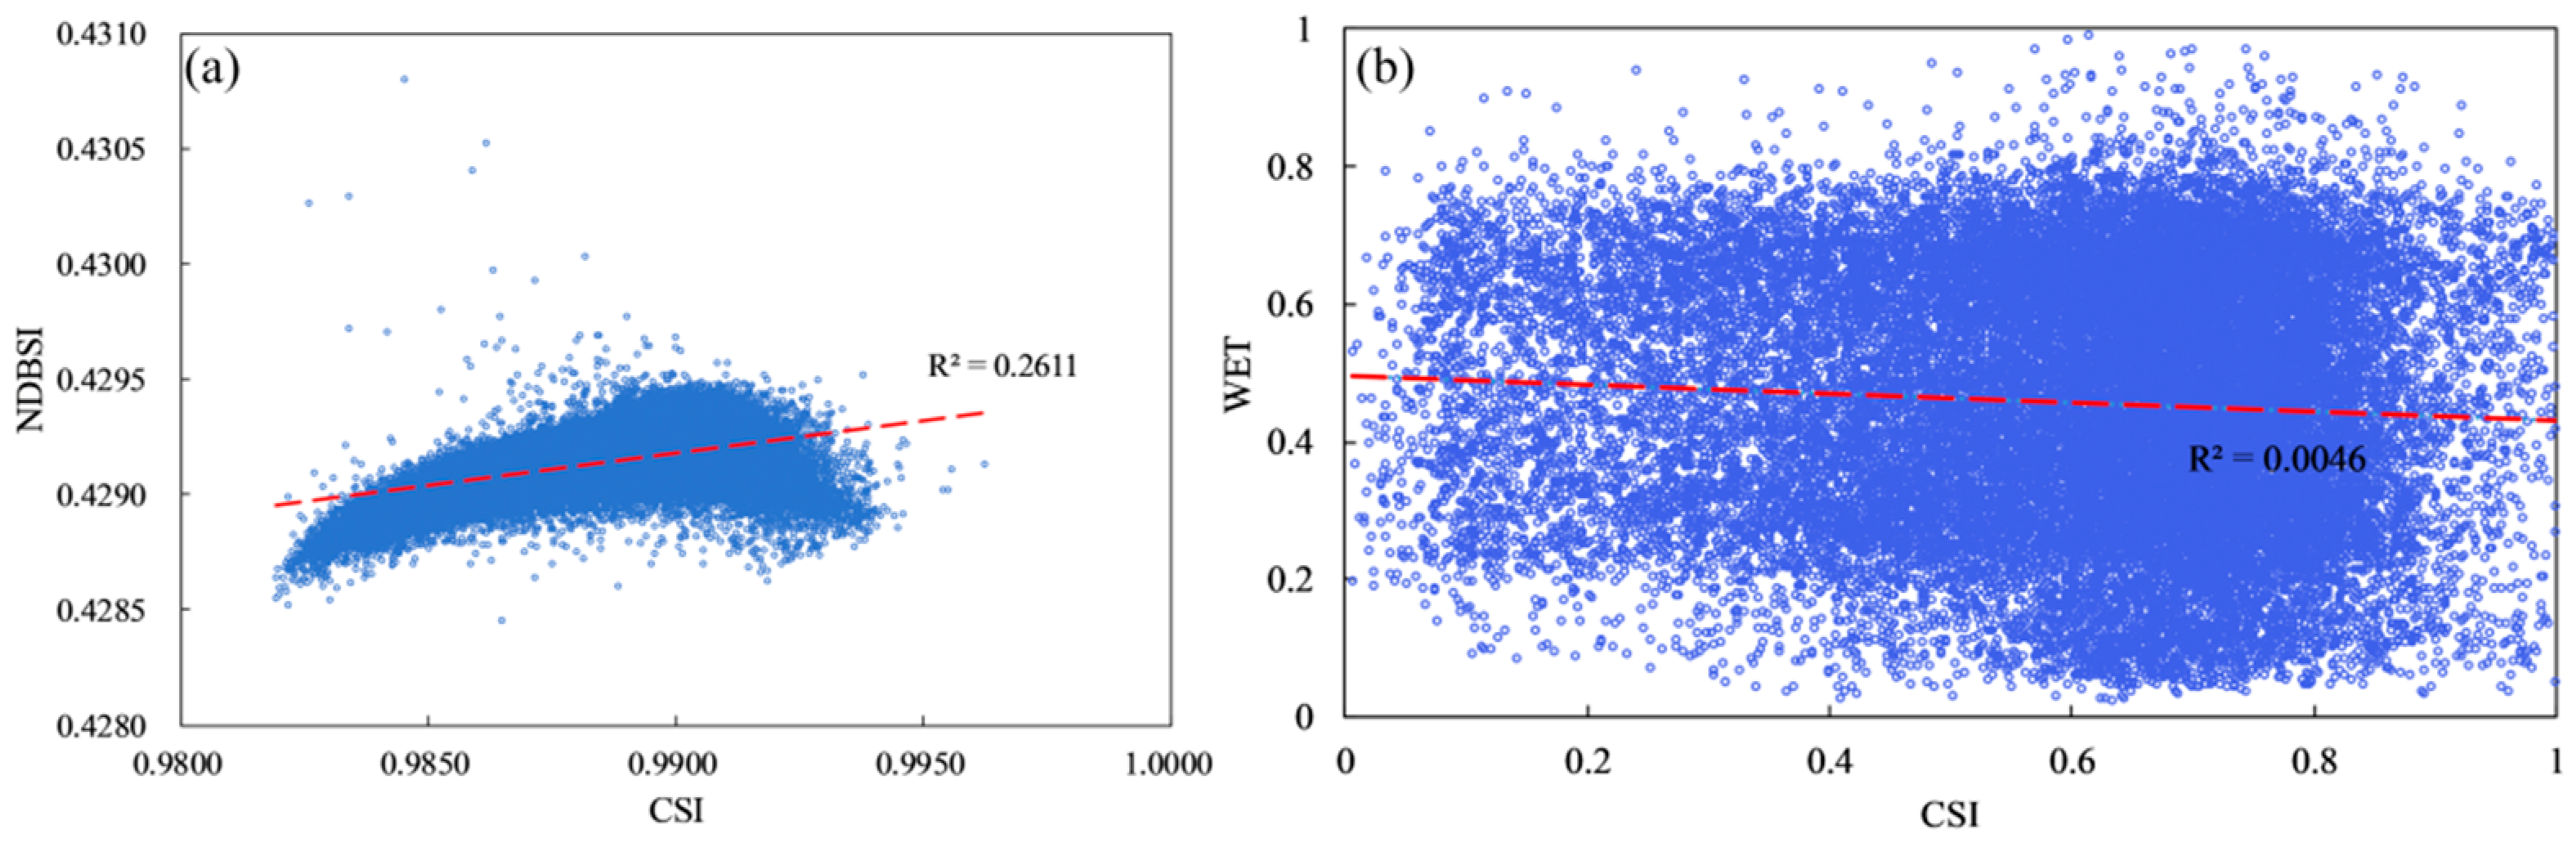
3.1. MRSEI Applicability Assessment

So as to validate the applicability of the MRSEI in the reserve, two test areas were selected based on land use types (Figure 4). Test area 1 primarily consisted of desert and sparse vegetation, while test area 2 was predominantly characterized by dense vegetation.
To verify the validity of the index selection, the collinear diagnostic index in linear regression was utilized to explore the redundancy of the selected indices.
The VIF is a commonly used indicator for diagnosing collinearity. In this study, a fishing net analysis tool was employed to extract the pixel values of all indicators and perform a rationality analysis. The diagnostic results are displayed in Figure 5. Notably, all VIF values were found to be less than 10, indicating the absence of information redundancy among the indicators.
Based on a comparison of the results of the MRSEI and RSEI in the QMNNR, the primary advantages of the MRSEI are summarized as follows.
In desert areas with sparse vegetation, local textural details were more prominent in the MRSEI. Figure 6a–c illustrates a typical desert area in Sunan Yugu Autonomous County with relatively severe desertification. Contrasting with the RSEI, the MRSEI provides a more comprehensive depiction of the outline and distribution of desert areas. The soil in area A1 exhibited signs of salinization and desertification. In comparison with the RSEI, the MRSEI was able to accurately delineate the outline of saline-alkali land and desertification in this region. Additionally, areas A2–A4 clearly highlighted the distinction between bare soil and vegetated areas. The more concentrated the distribution of desert areas, the lower the MRSEI value, reflecting a more precise representation of the true state of the surface at a regional scale.
In densely vegetated areas, the MRSEI avoids NDVI saturation and aligns more closely with ground conditions. Figure 6d–h illustrates a typical area in Tianzhu Tibetan Autonomous County characterized by ample precipitation and favorable temperatures conducive to robust vegetation growth. In these densely vegetated areas, NDVI saturation was observed (Figure 7), whereas kNDVI effectively prevented this saturation issue (Figure 6e,f). Additionally, Figure 6g,h highlights discrepancies in local details between the MRSEI and RSEI. Areas B1–B3 and C1–C4 exhibit dense vegetation cover. Contrasting with the RSEI, the MRSEI effectively distinguishes the varying ecological environment quality between densely vegetated regions and sparsely vegetated areas based on the intensity of green color. Compared to the RSEI, the MRSEI avoids the error stemming from NDVI saturation and, consequently, provides a more precise representation of surface conditions in densely vegetated areas.
Vegetation in terrestrial ecosystems has the capacity to absorb pollutants and release oxygen, thereby contributing to the enhancement of the regional eco-environmental quality [36]. The kNDVI and MRSEI exhibited a positive correlation (Figure 8a). The WET parameter reflects humidity and soil moisture levels, exerting a discernible positive influence on vegetation growth, disaster prevention, and the protection of the regional ecological environment (Figure 8b). The LST was a critical index of land–atmosphere energy balance, which negatively influences regional ecological environment quality [10] (Figure 8c). Additionally, the NDBSI represents the “drying” of the surface (Figure 8d), which is associated with soil desertification and salinization in arid and semi-arid areas (Figure 8e).
The correlation and disparity between the MRSEI and RSEI are employed for the quantitative analysis of the applicability of the MRSEI. The correlation between the MRSEI and RSEI was determined through the application of the linear regression method. The MRSEI and RSEI were both indicators generated at the same time resolution on the GEE platform. As illustrated in Figure 9a, the coefficient of determination (R2) between the MRSEI and RSEI was 0.908, indicating a very strong correlation. To more effectively demonstrate the differences between the MRSEI and RSEI within the identical pixel, the RSEI was subtracted from the MRSEI to generate the spatial difference distribution map of the MRSEI and RSEI (Figure 9b). As shown in the figure, regions with MRSEI values surpassing RSEI values were predominantly situated in forested, grassland, and cropland. Consequently, the correlation and difference between the MRSEI and RSEI indicated that the assessment results of eco-environmental quality in regions with dense vegetation cover have been improved by the MRSEI.
To more accurately quantify the differences in local texture details between the RSEI and the MRSEI, we calculated the entropy and contrast values of both indices using the GEE platform [20]. The entropy values for the RSEI and MRSEI were 4.288 and 4.290, respectively, while the contrast values were 79.054 and 83.287, respectively. Statistical analysis of the grayscale differences indicates that the MRSEI results demonstrate a more detailed texture, clearer effects, and a richer depiction of texture information compared to RSEI.
In conclusion, the optimization of methods and technical improvements demonstrated the successful integration of kNDVI and CSI information into the MRSEI. This integration has improved the applicability of MRSEI in assessing long-term ecological and environmental quality at a regional scale in arid and semi-arid regions.

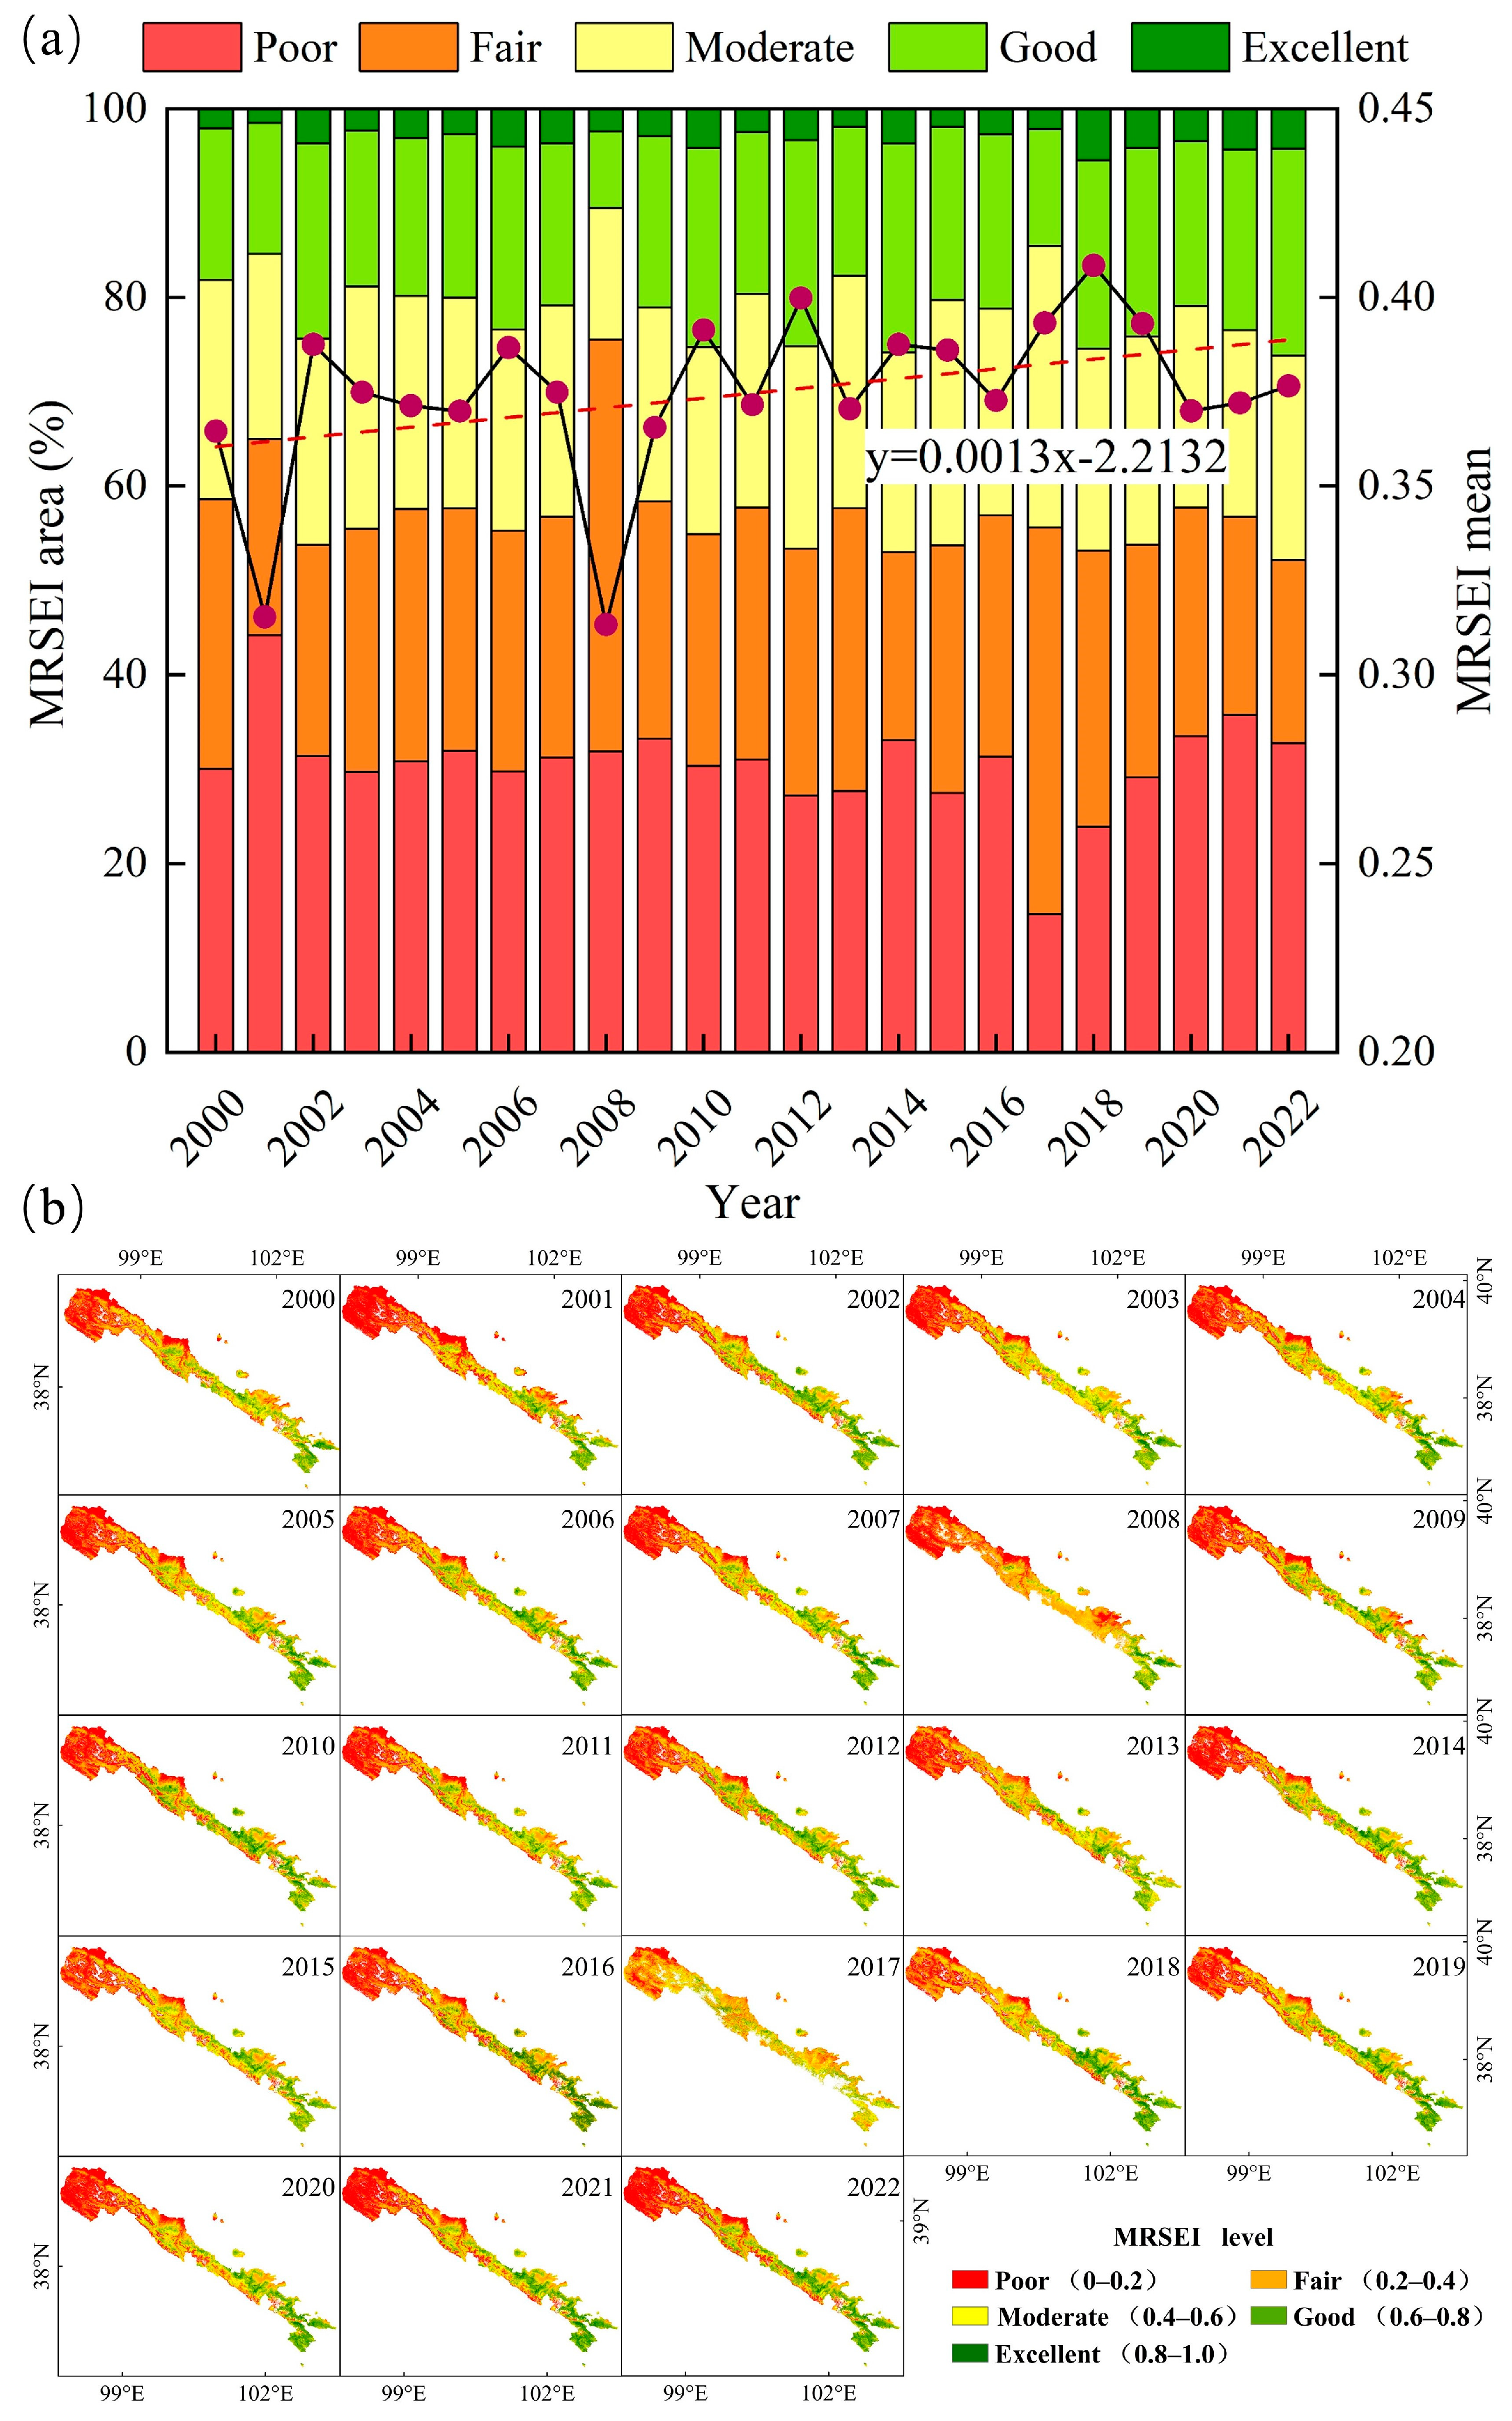
3.2. Analysis of Spatial-Temporal Variability in Eco-Environmental Quality

Figure 10a presents a summary of the shifts in the time series distribution of the QMNNR with different average MRSEI values from 2000 to 2022. Overall, the MRSEI values have shown an upward trend during this period, with an annual increase rate of 1.30 × 10⁻³ y−1. This trend suggests an improvement in ecological environmental quality, which aligns with the findings of previous research findings [37]. Table 4 illustrates that the overall MRSEI of the QMNNR declined from 2000 to 2008 [38]. During this period, the percentage of areas classified as “poor” and “fair” increased by 16.94%, while the proportion of areas rated as “good” and “excellent” decreased by 7.65%. Subsequently, the eco-environmental quality of the reserve exhibited an overall improvement from 2008 to 2022, with the proportion of “good” and “excellent” grades increasing by 15.56% and the proportion of “poor” and “fair” grades decreasing by 23.37%. The area with “poor” and “fair” eco-environmental quality within the reserve decreased by 1.5 × 10³ km2 from 2000 to 2022, while the area with “good” and “excellent” eco-environmental quality expanded by 2.1 × 10³ km2. As depicted in Figure 10b, the spatial pattern of eco-environmental quality in the reserve exhibits an increasing trend from northwest to southeast. Regions with “excellent” and “good” grades are predominantly located in low-altitude areas, while areas with “poor” and “fair” grades are primarily situated at higher altitudes. Specifically, the eco-environmental quality in the northwest desert regions of the QMNNR was predominantly classified as “poor” or “fair”, whereas the densely vegetated area in the southeast of the QMNNR exhibited mainly “good” or “excellent” ratings. Overall, the eco-environmental quality of the QMNNR shows a gradual improvement from the northwest to the southeast.

3.3. Trend Change of Eco-Environmental Quality in the Reserve

Based on the criteria and grade definitions outlined in Equation (5) and Table 3, the spatial trend in the ecological and environmental quality of the QMNNR from 2000 to 2020 is illustrated in Figure 11. The regions experiencing notable increases in MRSEI values during this period encompass around 13.36% of the total area. These regions are primarily located within the forest and grassland landscapes in the low-altitude areas of Wuwei City and Zhangye City. The slight increase in the MRSEI accounted for approximately 40.32% of the total area, primarily distributed in forests, grasslands, and some unused land of the northwest section of the QMNNR. The portions of the QMNNR where the MRSEI remained stable comprise approximately 17.55% of the total area. These regions are predominantly found in unused land and ice-covered areas. The regions exhibiting a slight decline in MRSEI values encompass approximately 24.78% of the total area. A significant portion of this land is located in the Zhangye section of the QMNNR and is characterized by partial forest and grassland cover. Finally, regions displaying a significant decline in MRSEI values represent approximately 3.99% of the total area, representing the smallest proportion. These areas are predominantly characterized by unused land. Since 2000, there has been a noticeable trend of warming and humidification in the QMNNR. The increase in precipitation and glacier meltwater have provided favorable conditions for vegetation growth in the northwest section of the QMNNR, leading to a gradual recovery in ecological environment quality. The southeastern section of the reserve experiences higher precipitation and temperatures. Immoderate precipitation exacerbates surface erosion and decreases soil organic content. Elevated temperatures lead to increased evapotranspiration and decreased plant water use efficiency, resulting in a deterioration of ecological environment quality in the southeast section of the QMNNR. Overall, since the second phase of the Three-North Shelterbelt Ecological Project, a significantly larger proportion of the reserve has demonstrated an increase in MRSEI values compared to areas showing a decline, indicating an overall improvement and recovery of the ecological and environmental quality in line with prior research findings [37].

3.4. Land Use Variety in the QMNNR and Its Impact on MRSEI

The regions of cropland, forest, grassland, water bodies, and construction land in the QMNNR experienced overall growth from 2000 to 2020, with construction land showing a relatively minor increase and a significant reduction in unused land. This trend signifies an enhancement in ecological and environmental quality within the QMNNR.
So as to assess the influence of various land utilization types on the eco-environmental quality, an analysis was conducted on the MRSEI contribution rate index, as depicted in Figure 12. The contribution of each land utilization type to the MRSEI is different; the land types characterized as “good” and “excellent” eco-environmental quality primarily include forests, grasslands, and cropland, with forests and grasslands together comprising over 90% of the total area. In areas with “poor” and “fair” ecological environment quality, the predominant land uses were grassland and other unused land, with other unused land comprising over 44% of the total area. This indicates that forests and grasslands contribute to ecological improvement, whereas the degradation of grasslands due to overgrazing in the QMNNR has resulted in the ecological deterioration of certain grasslands and other unused land [39]. To further elucidate the effect of land utilization types on the MRSEI, the variations in the MRSEI under each land utilization type were explored using ArcGIS (Figure 12f). The MRSEI showed an increasing trend under the influence of cropland and grassland. A slight decrease in the MRSEI was observed under the influence of forest, while a downward trend was evident under the influence of other unused land (Figure 12f).

4. Discussion

4.1. MRSEI Applicability Assessment

The applicability of the MRSEI in arid and semi-arid areas was assessed using a variety of methods, including variance inflation factor analysis [40], spatial measurement results of the MRSEI, principal component analysis, eigenvector directionality of the five indicators, and remote sensing image texture features. The variance inflation factor analysis confirmed that there was no redundancy among the five indicators. Additionally, this article assessed the correlations among the CSI, NDBSI, and WET, with the findings indicating weak correlations (Figure 13). Thus, the constructed indicators are not collinear. The average values of the RSEI and MRSEI, derived from Landsat 8 remote sensing data (2013 to present), are presented in Table 5. From an annual average perspective, the MRSEI time series has remained relatively stable.
The spatial measurement results show that the MRSEI effectively integrated the information from the kNDVI and CSI factors, avoiding NDVI saturation and accurately representing the true surface state. PCA analysis and the orientation of eigenvectors indicate that the MRSEI effectively integrates the majority of information from each indicator. The kNDVI and WET have been identified as potentially beneficial for ecological environment restoration [41]. Conversely, the LST, NDBSI, and CSI indicate the level of land surface drying and desertification, which negatively impact the ecological system and exhibit negative correlations with the MRSEI.

4.2. Spatial-Temporal Variety in MRSEI Ecological Environment Quality

The MRSEI of the reserve exhibited a consistent overall upward trend from 2000 to 2022, as supported by previous studies [16], with an average annual increase rate in the MRSEI value of 1.30 × 10⁻³ y−1. At a finer temporal scale, the MRSEI showed a declining trend from 2000 to 2008, characterized by a 16.94% increase in the account for areas classified as “poor” and “fair”, and a 7.65% decrease in the occupation of areas classified as “good” and “excellent”. The MRSEI exhibited an upward trend from 2008 to 2022, with the proportion of areas classified as “good” and “excellent” grades increasing by 15.56%, while the proportion of areas classified as “poor” and “fair” grades diminished by 23.37% (Table 4). These trends largely correspond to the establishment of around 25 hydropower stations in the QMNNR from 2000 to 2008. The unauthorized operation of hydropower stations within the reserve has been shown to have detrimental effects on the vegetation growth and recovery within the QMNNR [42]. In 2008, the Qilian Mountains were officially designated by the Ministry of Environmental Protection of China as an ecologically functional area for water conservation. In 2010, the Chinese government began the gradual transformation of farmers and herders residing in the core areas of the QMNNR into ecological management personnel. In September 2015, the Ministry of Environmental Protection of China conducted public interviews with relevant units and issued orders for them to rectify associated ecological and environmental issues. As a result, in 2016, human activity significantly decreased, and following a series of policy adjustments, the ecological conditions of the QMNNR gradually improved and were restored [32]. The MRSEI of QMNNR exhibited a rising trend from northwest to southeast between 2000 and 2022. This is primarily attributed to the lower precipitation and temperature in the northwest area of the QMNNR [43], which hinders the growth of vegetation. The land use in the northwestern section of the district is predominantly categorized as unused land. The area exhibiting an increase in MRSEI values from 2000 to 2020 accounted for approximately 53.68% and was predominantly linked to forest and grassland land use types. This finding aligns with the results of the MRSEI contribution index, indicating that land use in regions classified as having “good” and “excellent” ecological grades primarily consists of forest and grassland.

4.3. Land Use Variety in the QMNNR and Its Impact on MRSEI

According to the MRSEI contribution rate, grassland and forest areas accounted for over 90% of the regions classified with a good ecological grade, whereas unused land contributed more than 44% to regions with poor ecological grades. Overgrazing and other issues associated with livestock farming in the QMNNR have led to grassland degradation [39], resulting in these grasslands often being classified as having “poor” or “fair” ecological grades. Consequently, the expansion of forest and grassland areas has facilitated improvements in ecological environment quality within the QMNNR. This, coupled with the dispersal of unused land, contributes to a spatial pattern of ecological environment quality characterized by a “low in the northwest, high in the southeast” trend. Notably, the implementation of the second phase of the Three-North Shelterbelt Project [44] since 2000 has played a significant role in enhancing the eco-environmental conditions of the QMNNR.

4.4. Uncertainty and Prospects

This study constructed a modified remote sensing ecological index (MRSEI) by incorporating kNDVI and CSI, addressing the saturation limitations of the NDVI index and accounting for the characteristics of soil salinization in the study area. This approach comprehensively captures changes in the eco-environmental quality in the Qilian Mountains region. Nevertheless, optical images are affected by clouds, cloud shadows, and atmospheric conditions, resulting in image gaps and anomalies. The presence of these anomalies and missing values can adversely impact the stability of the RSEI [14]. To address these challenges related to optical image quality, this study employed image synthesis techniques on the GEE platform. Future research will explore and implement data reconstruction methods to address gaps in remote sensing data. With the increasing availability of multi-source remote sensing data, subsequent studies are expected to employ machine learning techniques [45] in conjunction with these data sources to enable dynamic monitoring of ecological environment quality. Moreover, the research focus of government agencies and researchers is largely centered on quantifying the impacts of climate change and human activities on the ecological environment [46,47]. In the future, we aim to further develop models to explore driving mechanisms, providing more detailed data for the protection and sustainable development of the Qilian Mountains region.

5. Conclusions

This study constructed an MRSEI as an indicator for monitoring variety in eco-environmental quality in arid and semi-arid areas and evaluated its applicability in monitoring changes in the QMNNR. The influence of land use on the eco-environmental quality was quantified using the MRSEI contribution index. The findings indicate the following:
(1)
From the perspective of ecosystem components, the constructed MRSEI effectively integrates the comprehensive information of five ecological factors. Taking into account the environmental conditions of the Qilian Mountains regions, the incorporation of kNDVI and CSI into the MRSEI allows for a more precise representation of the surface ecological environment characteristics while mitigating the saturation issue observed in traditional vegetation indices;
(2)
The eco-environmental quality of the QMNNR showed an upward pattern between 2000 and 2022, with an annual increase rate of 1.30 × 10⁻³ y−1. The spatial distribution pattern of eco-environmental quality ranged from low in the northwest to high in the southeast. The areas where the eco-environmental quality has been improved account for about 53.68%, mainly distributed in forest and grassland-type areas in low-altitude areas of Wuwei City and Zhangye City. The areas with deteriorated ecological environment quality account for approximately 28.77% of the total area, mainly distributed in unused areas in Zhangye City and Wuwei City. The proportion of “poor” and “fair” grades reduced by 6.43%, while the account for “good” and “excellent” grades increased by 8.00% from 2000 to 2022;
(3)
The expansion of forest and grassland areas, coupled with the reduction of unused land, constitutes the primary factor contributing to the enhancement of the eco-environmental quality of the QMNNR. The area classified as “poor” and “fair” decreased by 1.50 × 10³ km2, while the region classified as “good” and “excellent” increased by 2.11 × 10³ km2. Different land use types have varying contributions to the eco-environmental quality. The land use types with “good” and “excellent” eco-environmental quality predominantly include forests, grasslands, and croplands, with forests and grasslands collectively constituting over 90% of the total area. The land utilization types associated with “poor” eco-environmental quality primarily include grassland and unused land, with the unused land area comprising over 44%. Consequently, the overall ecological environment status of the QMNNR has shown gradual improvement since the initiation of the second phase of the Three-North Shelterbelt Project.

Author Contributions

Conceptualization, X.W. (Xiaoxian Wang) and X.Z.; methodology, X.W. (Xiaoxian Wang), Z.Z. and X.C.; software, X.W. (Xiaoxian Wang), X.C. and Q.L.; validation, X.W. (Xiaoxian Wang); formal analysis, X.W. (Xiaoxian Wang) and X.Z.; investigation, X.W. (Xiaoxian Wang), Y.L., L.D. and L.H.; resources, X.Z.; data curation, X.Z.; writing—original draft preparation, X.W. (Xiaoxian Wang); writing—review and editing, X.Z., W.L., X.W. (Xiaodong Wu), X.W. (Xiaoxian Wang) and T.W. (Tingting Wang); visualization, X.W. (Xiaoxian Wang) and X.Z.; supervision, X.Z. and Y.L.; project administration, W.L.; funding acquisition, X.W. (Xiaodong Wu), X.Z., W.L., X.L. and J.H. All authors have read and agreed to the published version of the manuscript.

Funding

This work was supported by the National Natural Science Foundation of China, grant number U23A2062, 32361133551; the Gansu Provincial Science and Technology Program, grant number 22ZD6FA005; West Light Foundation of the Chinese Academy of Sciences; the Dynamic Monitoring of Abandoned Cultivated Land in Oasis and Its Response to Ecological Environment in the Hexi Section of the “the Belt and Road”, grant number 24JRRA176; the Natural Science Foundation of Gansu Province, grant number 22JR5RA247; the Natural Science Foundation of Gansu Province, grant number 21JR7RA242; the Natural Science Foundation of Gansu Province, grant number 23JRRA830; the Gansu Provincial Science and Technology Project Fund, grant number 20JR10RA179.

Data Availability Statement

The data are unavailable due to privacy or ethical constraints.

Conflicts of Interest

The authors have no conflicts of interest to declare.

References

  1. Yu, Q.; Lu, H.W.; Yao, T.C.; Xue, Y.X. Enhancing sustainability of vegetation ecosystems through ecological engineering: A case study in the Qinghai-Tibet Plateau. J. Environ. Manag. 2023, 325, 116576. [Google Scholar] [CrossRef] [PubMed]
  2. Wang, S.P.; Ding, Y.J.; Jiang, F.Q.; Wu, X.D.; Xue, J. Identifying hot spots of long-duration extreme climate events in the northwest arid region of China and implications for glaciers and runoff. Res. Cold Arid Reg. 2022, 14, 347–360. [Google Scholar] [CrossRef]
  3. Duan, Q.T.; Luo, L.H.; Zhao, W.Z.; Zhuang, Y.L.; Liu, F. Mapping and evaluating human pressure changes in the Qilian mountains. Remote Sens. 2021, 13, 2400. [Google Scholar] [CrossRef]
  4. Sun, X.W.; Li, S.; Zhai, X.H.; Wei, X.X.; Yan, C.Z. Ecosystem changes revealed by land cover in the three-river headwaters region of Qinghai, China (1990–2015). Res. Cold Arid Reg. 2023, 15, 85–91. [Google Scholar] [CrossRef]
  5. Wang, X.X.; Zhang, X.X.; Li, W.P.; Cheng, X.Q.; Zhou, Z.Z.; Liu, Y.D.; Wu, X.D.; Hao, J.M.; Ling, Q.; Deng, L.Z.; et al. Quantitative Analysis of Climate Variability and Human Activities on Vegetation Variations in the Qilian Mountain National Nature Reserve from 1986 to 2021. Forests 2023, 14, 2042. [Google Scholar] [CrossRef]
  6. Yang, H.J.; Gou, X.H.; Xue, B.; Ma, W.J.; Kuang, W.N.; Tu, Z.Y.; Gao, L.L.; Yin, D.C.; Zang, J.Z. Research on the change of alpine ecosystem service value and its sustainable development path. Ecol. Indic. 2023, 146, 109893. [Google Scholar] [CrossRef]
  7. Almar, R.; Stieglitz, T.; Addo, K.A.; Ba, K.; Ondoa, G.A.; Bergsma, E.W.J.; Bonou, F.; Anguureng, D.; Arino, O. Coastal zone changes in West Africa: Challenges and opportunities for satellite earth observations. Surv. Geophys. 2023, 44, 249–275. [Google Scholar] [CrossRef]
  8. Chen, Y.; Weng, Q.H.; Tang, L.L.; Wang, L.; Xing, H.F.; Liu, Q.H. Developing an intelligent cloud attention network to support global urban green spaces mapping. ISPRS J. Photogramm. Remote Sens. 2023, 198, 197–209. [Google Scholar] [CrossRef]
  9. Xu, H.Q. A Remote Sensing Urban Ecological Index and Its Application. Acta Ecol. Sin. 2013, 33, 7853–7862. [Google Scholar] [CrossRef]
  10. Xu, H.Q. A Remote Sensing Index for Assessment of Regional Ecological Changes. China Environ. Sci. 2013, 33, 889–897. [Google Scholar] [CrossRef]
  11. Xu, H.Q.; Wang, M.Y.; Shi, T.T.; Guan, H.D.; Fang, C.Y.; Lin, Z.L. Prediction of ecological effects of potential population and impervious surface increases using a remote sensing based ecological index (RSEI). Ecol. Indic. 2018, 93, 730–740. [Google Scholar] [CrossRef]
  12. Xu, H.Q. Change of Landsat 8 TIRS Calibration Parameters and Its Effect on Land Surface Temperature Retrieval. J. Remote Sens. 2016, 20, 229–235. [Google Scholar] [CrossRef]
  13. Zhang, P.P.; Chen, X.D.; Ren, Y.; Lu, S.Q.; Song, D.W.; Wang, Y.L. A Novel Mine-Specific Eco-Environment Index (MSEEI) for Mine Ecological Environment Monitoring Using Landsat Imagery. Remote Sens. 2023, 15, 933. [Google Scholar] [CrossRef]
  14. Yang, X.Y.; Meng, F.; Fu, P.J.; Liu, Y.H. Instability of remote sensing ecological index and its optimisation for time frequency and scale. Ecol. Inform. 2022, 72, 101870. [Google Scholar] [CrossRef]
  15. Mondal, J.; Basu, T.; Das, A. Application of a novel remote sensing ecological index (RSEI) based on geographically weighted principal component analysis for assessing the land surface ecological quality. Environ. Sci. Pollut. Res. 2024, 31, 32350–32370. [Google Scholar] [CrossRef] [PubMed]
  16. Firozjaei, M.K.; Kiavarz, M.; Homaee, M.; Arsanjani, J.J.; Alavipanah, S.K. A novel method to quantify urban surface ecological poorness zone: A case study of several European cities. Sci. Total Environ. 2021, 757, 143755. [Google Scholar] [CrossRef]
  17. Firozjaei, M.K.; Fathololoumi, S.; Kiavarz, M.; Biswas, A.; Homaee, M.; Alavipanah, S.K. Land Surface Ecological Status Composition Index (LSESCI): A novel remote sensing-based technique for modeling land surface ecological status. Ecol. Indic. 2021, 123, 107375. [Google Scholar] [CrossRef]
  18. Karbalaei Saleh, S.; Amoushahi, S.; Gholipour, M. Spatiotemporal ecological quality assessment of metropolitan cities: A case study of central Iran. Environ. Monit. Assess. 2021, 193, 305. [Google Scholar] [CrossRef]
  19. Zheng, Z.H.; Wu, Z.F.; Chen, Y.B.; Guo, C.; Marinello, F. Instability of remote sensing based ecological index (RSEI) and its improvement for time series analysis. Sci. Total Environ. 2022, 814, 152595. [Google Scholar] [CrossRef]
  20. Zhang, W.; Du, P.J.; Guo, S.C.; Lin, C.; Zheng, H.R.; Fu, P.J. Enhanced remote sensing ecological index and ecological environment evaluation in arid area. J. Remote Sens. Bull. 2023, 27, 299–317. [Google Scholar] [CrossRef]
  21. Xu, H.Y.; Sun, H.; Zhang, T.; Xu, Z.H.; Wu, D.; Wu, L. Remote sensing study on the coupling relationship between regional ecological environment and Human activities: A case study of Qilian Mountain National Nature Reserve. Sustainability 2023, 15, 11177. [Google Scholar] [CrossRef]
  22. Dong, C.; Yu, H.Y.; Qian, X.L.; Kang, F.G.; Luo, T.; Cheng, X.J. Enhancing ecological connectivity in the Qilian Mountains: Integrating GCA and optimized MST models for ecological corridor construction. Ecol. Indic. 2024, 166, 112525. [Google Scholar] [CrossRef]
  23. Huang, S.; Tang, L.N.; Hupy, J.P.; Wang, Y.; Shao, G.F. A commentary review on the use of normalized difference vegetation index (NDVI) in the era of popular remote sensing. J. For. Res. 2021, 32, 1–6. [Google Scholar] [CrossRef]
  24. Camps-Valls, G.; Campos-Taberner, M.; Moreno-Martínez, Á.; Walther, S.; Duveiller, G.; Cescatti, A.; Mahecha, M.; Muñoz-Marí, J.; García-Haro, F.J.; Guanter, L.; et al. A unified vegetation index for quantifying the terrestrial biosphere. Sci. Adv. 2021, 7, eabc7447. [Google Scholar] [CrossRef] [PubMed]
  25. Zhang, J.H.; Li, G.D.; Lu, C.; Liu, Y.H.; Ding, Y.P. Methods for modeling spatial variability of soil organic carbon under different land use in middle reaches of the Heihe river basin, northwestern China. Bulg. Chem. Commun. 2017, 49, 109–114. [Google Scholar]
  26. Liu, Y.Y.; Liu, X.Y.; Zhao, C.Y.; Wang, H.; Zang, F. The trade-offs and synergies of the ecological-production-living functions of grassland in the Qilian mountains by ecological priority. J. Environ. Manag. 2023, 327, 116883. [Google Scholar] [CrossRef]
  27. Li, X.; Gou, X.H.; Wang, N.L.; Sheng, Y.; Jin, H.J.; Qi, Y.; Song, X.Y.; Hou, F.J.; Li, Y.; Zhao, C.M.; et al. Tightening Ecological Management Facilitates Green Development in the Qilian Mountains. Chin. Sci. Bull. 2019, 64, 2928–2937. [Google Scholar] [CrossRef]
  28. Zhang, J.; Ge, J.P.; Guo, Q.X. The relation between the change of NDVI of the main vegetational types and the climatic factors in the northeast of China. Acta Ecol. Sin. 2001, 21, 522–527. [Google Scholar]
  29. Wang, Q.; Moreno-Martínez, Á.; Muñoz-Marí, J.; Campos-Taberner, M.; Camps-Valls, G. Estimation of vegetation traits with kernel NDVI. ISPRS J. Photogramm. Remote Sens. 2023, 195, 408–417. [Google Scholar] [CrossRef]
  30. Xu, H.Q. A study on information extraction of water body with the modified normalized difference water index (MNDWI). J. Remote Sens. 2005, 9, 595. [Google Scholar] [CrossRef]
  31. Xu, H.Q.; Wang, Y.F.; Guan, H.D.; Shi, T.T.; Hu, X.S. Detecting ecological changes with a remote sensing based ecological index (RSEI) produced time series and change vector analysis. Remote Sens. 2019, 11, 2345. [Google Scholar] [CrossRef]
  32. Sun, B.; Zhou, Q. Expressing the spatio-temporal pattern of farmland change in arid lands using landscape metrics. J. Arid Environ. 2016, 124, 118–127. [Google Scholar] [CrossRef]
  33. Yuan, J.; Xu, Y.P.; Xiang, J.; Wu, L.; Wang, D.Q. Spatiotemporal variation of vegetation coverage and its associated influence factor analysis in the Yangtze River Delta, eastern China. Environ. Sci. Pollut. Res. 2019, 26, 32866–32879. [Google Scholar] [CrossRef] [PubMed]
  34. Pan, W.H.; Wang, S.Y.; Wang, Y.; Yu, Y.J.; Luo, Y.Y. Dynamical changes of land use/land cover and their impacts on ecological quality during China’s reform periods: A case study of Quanzhou city, China. PLoS ONE 2022, 17, e0278667. [Google Scholar] [CrossRef] [PubMed]
  35. Zhang, Y.; She, J.Y.; Long, X.R.; Zhang, M. Spatio-temporal evolution and driving factors of eco-environmental quality based on RSEI in Chang-Zhu-Tan metropolitan circle, central China. Ecol. Indic. 2022, 144, 109436. [Google Scholar] [CrossRef]
  36. Gupta, K.; Kumar, P.; Pathan, S.K.; Sharma, K.P. Urban Neighborhood Green Index—A measure of green spaces in urban areas. Landsc. Urban Plan. 2012, 105, 325–335. [Google Scholar] [CrossRef]
  37. Wei, W.; Guo, Z.C.; Shi, P.J.; Zhou, L.; Wang, X.F.; Li, Z.Y.; Pang, S.F.; Xie, B.B. Spatiotemporal changes of land desertification sensitivity in northwest China from 2000 to 2017. J. Geogr. Sci. 2021, 31, 46–68. [Google Scholar] [CrossRef]
  38. Shan, S.Y.; Xu, H.J.; Qi, X.L.; Chen, T.; Wang, X.D. Evaluation and prediction of ecological carrying capacity in the Qilian Mountain National Park, China. J. Environ. Manag. 2023, 339, 117856. [Google Scholar] [CrossRef]
  39. Geng, L.Y.; Che, T.; Wang, X.F.; Wang, H.B. Detecting spatiotemporal changes in vegetation with the BFAST model in the Qilian Mountain region during 2000–2017. Remote Sens. 2019, 11, 103. [Google Scholar] [CrossRef]
  40. Li, W.J.; Kang, J.W.; Wang, Y. Spatiotemporal changes and driving forces of ecological security in the Chengdu-Chongqing urban agglomeration, China: Quantification using health-services-risk framework. J. Clean. Prod. 2023, 389, 136135. [Google Scholar] [CrossRef]
  41. Jian, S.Q.; Zhang, Q.K.; Wang, H.L. Spatial–temporal trends in and attribution analysis of vegetation change in the Yellow River Basin, China. Remote Sens. 2022, 14, 4607. [Google Scholar] [CrossRef]
  42. Li, Z.X.; Feng, Q.; Li, Z.J.; Wang, X.F.; Gui, J.; Zhang, B.J.; Li, Y.C.; Deng, X.H.; Xue, J.; Gao, W.D.; et al. Reversing conflict between humans and the environment-The experience in the Qilian Mountains. Renew. Sustain. Energy Rev. 2021, 148, 111333. [Google Scholar] [CrossRef]
  43. Bai, B.; Yue, P.; Zhang, Q.; Yang, J.H.; Ma, P.L.; Han, T.; Jiang, Y.Y.; Huang, P.C.; Ma, Y.L. Changing characteristics of ecosystem and water storage under the background of warming and humidification in the Qilian Mountains, China. Sci. Total Environ. 2023, 893, 164959. [Google Scholar] [CrossRef] [PubMed]
  44. Zhai, J.J.; Wang, L.; Liu, Y.; Wang, C.Y.; Mao, X.G. Assessing the effects of China’s Three-North Shelter Forest Program over 40 years. Sci. Total Environ. 2023, 857, 159354. [Google Scholar] [CrossRef]
  45. Bartold, M.; Kluczek, M. A machine learning approach for mapping chlorophyll fluorescence at inland wetlands. Remote Sens. 2023, 15, 2392. [Google Scholar] [CrossRef]
  46. Qin, G.X.; Wang, N.L.; Wu, Y.W.; Zhang, Z.; Meng, Z.Y.; Zhang, Y.J. Spatiotemporal variations in eco-environmental quality and responses to drought and human activities in the middle reaches of the Yellow River basin, China from 1990 to 2022. Ecol. Inform. 2024, 81, 102641. [Google Scholar] [CrossRef]
  47. Bartold, M.; Wróblewski, K.; Kluczek, M.; Dąbrowska-Zielińska, K.; Goliński, P. Examining the Sensitivity of Satellite-Derived Vegetation Indices to Plant Drought Stress in Grasslands in Poland. Plants 2024, 13, 2319. [Google Scholar] [CrossRef]
Figure 1. Overview of the QMNNR.
Remotesensing 16 03530 g001
Figure 2. Strip and quantitative distribution of Landsat images in the QMNNR from 2000 to 2022. (a) Spatial distribution of Landsat images and (b) temporal distribution of Landsat images.
Remotesensing 16 03530 g002
Figure 3. Technical route.
Remotesensing 16 03530 g003
Figure 4. Overview of the test area.
Remotesensing 16 03530 g004
Figure 5. Diagnosis collinearity of ecological factors.
Remotesensing 16 03530 g005
Figure 6. Comparison of local details and textures of RSEI and MRSEI, NDVI, and kNDVI in test areas 1 and 2.
Remotesensing 16 03530 g006
Figure 7. Comparative analysis of NDVI and kNDVI during the growing season in the QMNNR in 2020.
Remotesensing 16 03530 g007
Figure 8. Changes in the MRSEI with the kNDVI, WET, LST, NDBSI, and CSI.
Remotesensing 16 03530 g008
Figure 9. (a) Correlation between MRSEI and RSEI and (b) difference spatial distribution.
Remotesensing 16 03530 g009
Figure 10. (a) The average value of MRSEI and the area proportion of the QMNNR and (b) Spatial distribution in the MRSEI from 2000 to 2022.
Remotesensing 16 03530 g010
Figure 11. MRSEI trend analysis for the QMNNR from 2000 to 2020.
Remotesensing 16 03530 g011
Figure 12. Contribution rates of various land use types in the QMNNR to MRSEI ratings in (a) 2000, (b) 2005, (c) 2010, (d) 2015, and (e) 2020, and (f) changes in MRSEI under the influence of cropland, forest, grassland, and other unused land.
Remotesensing 16 03530 g012
Figure 13. Correlation between CSI, NDBSI, and WET.
Remotesensing 16 03530 g013
Table 1. Data source.
DatasetNumber of ImagesResolution/mTime Resolution/yearDatabase URL
Image dataLandsat 5 SR2945 scenes302000–2011USGS
https://www.usgs.gov/ (accessed on 3 August 2024)
Landsat 7 SR2475 scenes302000–2012USGS
https://www.usgs.gov/ (accessed on 3 August 2024)
Landsat 8 SR3061 scenes302012–2022USGS
https://www.usgs.gov/ (accessed on 3 August 2024)
Basic dataLandsat PathRow
(WRS2)
//1983–nowGeodata Platform, School of Urban and Environmental Studies, Peking University
http://geodata.pku.edu.cn (accessed on 3 August 2024)
Chinese Academy of Sciences Land Use Data/302000, 2005, 2010, 20152020Chinese Academy of Sciences Land Use Data
http://www.resdc.cn/doi (accessed on 3 August 2024)
Table 2. Indicators used for each factor.
IndexCalculation Method
kNDVI kNDVI = tanh ( ( N I R R e d 2 σ ) 2 )
σ = N I R + R e d 2
WET WET L 8 = 0.1509 × B l u e + 0.1973 × G r e e n + 0.3279 × R e d + 0.3406 × N I R + ( 0.7112 ) × S W I R 1 + ( 0.4572 ) × S W I R 2
WET L 57 = 0.0315 × B l u e + 0.2021 × G r e e n + 0.3012 × R e d + 0.1594 × N I R + ( 0.6806 ) × S W I R 1 + ( 0.6109 ) × S W I R 2
LST LST = T B / ( 1 + ( λ T B / p ) l n ε )
T B = K 2 / l n ( K 1 / R + 1 )
R = M F D N + A F
NDBSI NDBSI = ( S I + I B I ) / 2
S I = ( ( S W I R 1 + R e d ) ( N I R + B l u e ) ) / ( ( S W I R 1 + R e d ) + ( N I R + B l u e ) )
I B I = { 2 S W I R 1 / ( S W I R 1 + N I R ) [ ( N I R / ( N I R + R e d ) + G r e e n / ( G r e e n + S W I R 1 ) ) ] } /             { 2 S W I R 1 / ( S W I R 1 + N I R ) + [ ( N I R / ( N I R + R e d ) + G r e e n / ( G r e e n + S W I R 1 ) ) ] }
CSI CSI = ( S I T + N D S I + S I 3 ) / 3
S I T = ( R e d / N I R ) 100
N D S I = ( R e d N I R ) / ( R e d + N I R )
S I 3 = S q r t ( G r e e n 2 + R e d 2 )
Table 3. Spatial and temporal trend level.
TrendSignificanceTrend Category
slope > 0s > 1.96Significant increase
s < 1.96Slight increase
slope = 0s = 0Stable and unchanged
slope < 0s > −1.96Slight decrease
s < −1.96Significant decrease
Table 4. Change of MRSEI area proportion from 2000 to 2022.
MRSEI
Grade
Area Ratio (%)
200020012002200320042005200620072008200920102011
poor, fair58.6264.9853.7555.4757.5657.6855.2556.8075.5658.3954.9057.71
moderate23.2219.6421.8825.7122.6222.3121.3722.3413.9320.5719.8222.63
good, excellent18.1615.3824.3718.8319.8120.0123.3820.8610.5121.0325.2819.66
20122013201420152016201720182019202020212022
poor, fair53.3457.6852.9953.6956.9055.6053.1653.7957.7456.7752.19
moderate21.5024.6221.1726.0521.9129.8421.4122.0621.3319.7921.65
good, excellent25.1617.7025.8420.2621.1914.5625.4324.1420.9323.4526.16
Table 5. Comparison of mean values of RSEI and MRSEI.
Year2013201420152016201720182019202020212022
MRSEI0.3700.3870.3860.3720.3930.4080.3930.3700.3720.376
RSEI0.4120.4470.3990.4530.4700.4640.4690.4080.4010.404
Disclaimer/Publisher’s Note: The statements, opinions and data contained in all publications are solely those of the individual author(s) and contributor(s) and not of MDPI and/or the editor(s). MDPI and/or the editor(s) disclaim responsibility for any injury to people or property resulting from any ideas, methods, instructions or products referred to in the content.

