Article

Enhanced Monitoring of Sub-Seasonal Land Use Dynamics in Vietnam’s Mekong Delta through Quantile Mapping and Harmonic Regression

by
Nick Kupfer
1,*,
Tuan Quoc Vo
2,
Felix Bachofer
3,
Juliane Huth
3,
Harry Vereecken
1,
Lutz Weihermüller
1 and
Carsten Montzka
1
1
Institute of Bio- and Geosciences: Agrosphere (IBG-3), Forschungszentrum Jülich, 52428 Jülich, Germany
2
GIS and Remote Sensing Laboratory, Department of Land Resources, Can Tho University, Can Tho 92000, Vietnam
3
German Remote Sensing Data Center, German Aerospace Center (DLR), 82234 Wessling, Germany
*
Author to whom correspondence should be addressed.
Remote Sens. 2024, 16(19), 3569; https://doi.org/10.3390/rs16193569
Submission received: 31 July 2024 / Revised: 12 September 2024 / Accepted: 20 September 2024 / Published: 25 September 2024

Abstract

:
In response to economic and environmental challenges like sea-level rise, salinity intrusion, groundwater extraction, sand mining, and sinking delta phenomena, the demand for solutions to adapt to changing conditions in riverine environments has increased significantly. High-quality analyses of land use and land cover (LULC) dynamics play a critical role in addressing these challenges. This study introduces a novel high-spatial resolution satellite-based approach to identify sub-seasonal LULC dynamics in the Mekong River Delta (MRD), employing a three-year (2021–2023) Sentinel-1 and Sentinel-2 satellite data time series. The primary obstacle is discerning detailed vegetation dynamics, particularly the seasonality of rice crops, answered through quantile mapping, harmonic regression with Fourier transform, and phenological metrics as inputs to a random forest machine learning classifier. Due to the substantial data volume, Google’s cloud computing platform Earth Engine was utilized for the analysis. Furthermore, the study evaluated the relative significance of various input features. The overall accuracy of the classification is 82.6% with a kappa statistic of 0.81, determined using comprehensive reference data collected in Vietnam. While the purely pixel-based approach has limitations, it proves to be a viable method for high-spatial resolution satellite image time series classification of the MRD.

1. Introduction

Vietnam is the world’s fifth-largest rice producer, with rice being the “most important food crop for the poor” [1]. Rice contributes a crucial part in providing food for over 900 million people worldwide living under the 1.25 USD poverty line. The MRD covers an area of around 40,000 km2, serves as a home for around 20 million people, and is commonly known for being the “Rice Bowl” of Vietnam, and is thus key to the food supply of the whole country and beyond. As one of the regions most vulnerable to climate change, subsidence, and upstream impacts (e.g., pollution and decreased sedimentation due to upstream dam building) the urge for solutions to adapt to changing climatic and anthropogenic drivers rises significantly, so that high-quality land use and land cover (LULC) and related spatial analyses provide important contributions to such undertakings. The Nine Dragons—as the Vietnamese call the river because in the delta it splits into numerous branches—are very capricious. Furthermore, unusual dry conditions associated with ENSO (El Niño Southern Oscillation) events have strongly affected Southeast Asia in the last years, leading to severe drought, in particular in Vietnam’s Mekong Delta.
Land use in the MRD is highly dynamic, demonstrating a wide range of farming techniques, varying planting densities, and different crop schedules. Due to the importance of this highly dynamic region, LULC-related research has been widely undertaken. However, the focus to date has hardly been on comprehensive analyses of the entire delta, the connections between the various land use classes and the interrelated dynamics.
Several studies have addressed the temporal dynamics and classifications dependent on time series data, highlighting the dynamic nature of land use in general and agriculture in particular in the MRD. For the whole basin, Leinenkugel et al. [2] presented a land cover product based on an 11-year (2001–2011) EVI MODIS time series. Recently, a study was published providing a timely comprehensive change analysis of the MRD using MODIS data, focusing on rice, aquaculture, and flooding [3]. Others combined Landsat and MODIS data to examine relationships between land use, climate, and water changes [4]. The analysis of Sentinel-1 backscatter variance from rice fields by Phan et al. [5] provided insights into the varying crop calendars, revealing significant changes to the plant structure at key phenological stages, which are challenging to monitor due to varying sowing and harvest dates. Pham et al. [6] applied Sentinel-1 data, supported by Sentinel-2 data, to capture land use dynamics in coastal areas through object-based image analysis (OBIA). These studies underline the importance of temporal analysis in understanding the dynamic and evolving nature of land use and agriculture in particular. Due to the high importance of rice being the main staple food for over half of the world’s population, significantly impacting the global economy, food security, water consumption, and climate change, it is by far the most analyzed and remotely sensed land use class of the MRD. The most widely applied satellite-based sensors for rice classification have a medium to low spatial resolution such as MODIS [7,8,9,10,11,12,13,14,15] or SPOT-VEGETATION [16,17,18]. Radar-based rice classifications have been based on ENVISAT/ASAR [19,20], TerraSAR-X, and Sentinel-1 data [21,22]; the latter has also been used to monitor the rice growth status delta-wide [23]. An in-depth analysis of Sentinel-1 backscatter variance from rice fields has been provided by Phan et al. [5], pointing to the varying crop calendars, making it challenging to determine the timing of crop growth stages, especially sowing and harvest dates. The analysis revealed significant changes to the plant structure at key phenological stages, regardless of the variety.
Beyond agriculture, mangrove dynamics have been detected using both pixel-based approaches [24,25,26,27,28] and object-based approaches [29]. Aquacultures in the MRD have been characterized in detail using Sentinel-1 Synthetic Aperture Radar (SAR) time series [30]. Tree and forest cover dynamics have been investigated for the Kien Luong district in Kien Giang province [31] and lower-basin-wide [32]. Another scope relates to flood hazards. In a radar-based approach, Envisat ASAR WSM time series of 2007–2011 have been utilized to examine the flood regime in the MRD [33]. A MODIS-based mapping of inundation extent has served as an auxiliary input for an investigation of dyke–flood relations [34]. Other studies have focused on specific points in time or did not include the dynamic aspect (e.g., alternating crops or several cultivation phases per year). For example, Künzer et al. [35] compared global land cover products for the entire Mekong River Basin and remote sensing applications for large river deltas [36]. They found that some widely used LULC products have major differences and concluded that greater attention must be given to the origins, benefits, and limitations of large-scale information products from remote sensing data. Poortinga et al. [37] developed an innovative approach to predict land cover changes by combining historical change patterns with big data and machine learning for the entire Mekong region. The need for conserving “the last remaining extensive wetland area of seasonally inundated grassland in the Mekong Delta” motivated Funkenberg et al. [38] and Nguyen et al. [39] to investigate the degradation of the Ha Tien Plain wetlands in the Northwest. Others have used Landsat data to compare changes at certain points in time [40,41,42]. Gebhardt et al. [43] investigated uncertainties in mangrove mapping due to various databases and methodologies.
Despite the large number of studies focusing on LULC in the MRD, the delta-wide and comprehensive monitoring of land surface dynamics detached from specific topics or thematic classes is rare. Moreover, sub-year dynamics are typically not covered, but are needed to clarify alternating crops with multiple harvests per year. In summary, to our knowledge, there is no up-to-date, comprehensive, high-spatial resolution analysis of LULC dynamics in the MRD available yet. In summary, there is still a need for more comprehensive, high-spatial resolution analyses of LULC dynamics across the MRD that consider sub-year dynamics, especially for regions with alternating crops and multiple harvests per year.
Another important need for sub-year crop information is the politically driven transformation from conventional towards organic farming practices, especially for rice in the MRD. As rice paddies are not isolated from each other with respect to exchanges in water, no single paddy field can be studied on its own with respect to imported pollutants such as pesticides or heavy metals, and therefore, the spatial and temporal interactions between neighboring fields need to be considered. In view of this, the aim of the present study is to provide a novel comprehensive high-spatial resolution satellite-based LULC time series product to serve as a basis for sustainable land management planning and for identifying potentially beneficial areas for organic rice production.
Since LULC patterns in the MRD are highly dynamic, often seasonally periodic, and even variable at small scales, it is rational to apply satellite data time series to cover, for example, rice seasonality. In this study, the use of high-spatial resolution satellite data for generating spatially explicit information on land use dynamics at a 10 m resolution was applied. The overarching goal is to determine, use, and evaluate dynamic influential factors in a comprehensive static image classification. Methodically, the focus was placed on quantile mapping and harmonic models to distinguish specific vegetation growth patterns over space and time. A well-known problem of optical data in tropical regions is the strong cloud cover, which is why the use of active sensors is often preferred [44]. This study uses harmonic modeling and quantile mapping, which have been seldom utilized in this context to date, to show that passive sensors still offer great potential in the detection of tropical and sub-tropical agriculture. Harmonic regression, i.e., discrete Fourier transformation, was used in remote sensing applications before, for example in ship targeting [45], spectroscopy [46], and bathymetry [47]. Despite its potential, it has not been widely used for specific vegetation or crop pattern detection to date. Rocchini et al. [48] proposed it for detecting landscape fragmentation. Several studies applied it to detect general vegetation seasonalities [49,50,51]. It was used for wetland mapping [52], assessing waterlogging stress levels [53], distinguishing utilized from underutilized land in Europe [54], and drought and dryland monitoring [55,56,57,58]. In this light, this study emphasizes the potential of harmonic analysis for the comprehensive time-series classifications of vegetation, in particular, but not only, rice, since the interrelation of the different crops is quite high.

2. Study Area

The Mekong River is the twelfth-longest river in the world. Originating from the Tibetan Plateau, alongside its neighboring rivers, the Yangtze and the Salween, it flows through China, Myanmar, Laos, Thailand, and Cambodia and unfolds into its delta in Vietnam. Here, it splits in two major tributaries, the Mekong and the Bassac, to merge with the South China Sea. Located between latitudes 8 and 11 north and longitudes 104 and 107 east, the MRD (see Figure 1) sprawls south-westerly from Vietnam’s largest city Ho Chi Minh City. About one third of the MRD is covered by fertile soils, mainly used for rice cultivation. The other two third consist of acidity soil, especially sulphate and saline [59], used primarily for settlements, agriculture, and natural, semi-natural, and production forests (e.g., Melaleuca). Especially along the southwestern coastline, mangroves fringe the delta. The summer monsoon causes 5–6 months of rainfall of above 100 mm per month where October is usually the wettest month of the year. A total of 17 million people on 40,000 km2 result in a population density of 425 people/km2. As of 1999, the growth rate declined and has stabilized since 2012 [60]. This decline is conceivably due to the Asian financial and economic crisis in the late 1990s. Vietnam is the world’s fifth-largest rice producer. The Mekong Delta is commonly known as the ’Rice Bowl’ of Vietnam, and is thus key to the food supply of the whole country and beyond. Rice cultivation in the MRD operates on a three-year cycle, with up to three growing seasons per year [61], whereby the third growing season during the rainy season is mainly made possible by the construction of high dikes, which enables farmers to control the seasonal water flow [62]. Rice cropping in the dry season in coastal provinces is hindered by salinity intrusion, emboldening the farmers to use the brackish water for aquaculture or hybrid rice–aquaculture cultivation. This in turn particularly comes down to climate change-induced sea-level rise [63] and the concurrent sinking of the delta due to reduced sediment deposition as a result of the strong increase in hydropower dams in the last decade. Simultaneously rice cultivation is intensified by extending triple-cropped rice, which leads to rising production despite a decreasing area [8]. Furthermore, the Mekong Delta’s agriculture faces increasing challenges including unpredictable rainfall patterns, land subsidence, and increasing pressure from urbanization and infrastructure development, all of which threaten sustainable farming and food security. Besides rice and aquaculture, the Mekong Delta also supports the cultivation of various other crops such as fruits (e.g., mangoes, longan, and dragon fruit), vegetables, and cash crops like sugarcane, contributing significantly to the region’s agricultural diversity and economic output.

3. Data Basis

3.1. Satellite Data

Due to the huge data volume, Google’s cloud computing platform Earth Engine [64,65] was used to process the satellite data. All data from January 2021 to December 2023 collected by Sentinel-2 (S2) Level 2A Bottom-of-Atmosphere (BOA) and Sentinel-1 (S1) available in the Earth Engine’s platform were employed, providing 3047 S2 and 1013 S1 satellite images distributed over 11 and 4 image tiles, respectively, over the MRD. Data from both the Sentinel-1A and Sentinel-1B C-band SAR were used until Sentinel-1B ceased operations in December 2021. All available Sentinel-1 scenes acquired over the MRD in the Interferometric Wide Swath (IW), at 10 m resampled resolution, with dual polarization, and delivered in Ground Range Detection (GRD) format were utilized (see Table 1). To support the definition of the target classes and the preparation of the reference data collection, three published classification schemes of the MRD were reviewed and compiled for this study: an update for the Mekong Delta of the Mekong Basin land cover product based on 11-year (2001–2011) EVI MODIS time series [2], and one rice seasonality map based on multi-year Envisat ASAR WSM data [20].

3.2. LULC Class Determination

Comprehensive field trips, selected LULC classifications of the MRD [2,20], and high-resolution Google Earth imagery, supplemented by in situ photos acquired from the Earth Observation and Modeling Facility (EOMF) of the University of Oklahoma [66] and local knowledge were reviewed to determine all relevant classes.

3.3. Reference Data Collection for Validation

Comprehensive reference data were collected in the MRD for validation purposes. Within the OrganoRice project (https://organorice.org), a questionnaire app was developed together with KIAG (Knowledge Intelligence Applications GmbH), Bonn, Germany, and students of Can Tho University (CTU), Vietnam were trained to conduct interviews with local farmers with respect to land use, irrigation, and pesticide management. The hereby captured land use data were used in this study to validate the classification together with data collected by ourselves and data kindly provided by colleagues from CTU. By this, a total of 605 reference points were available for this study (see Figure 1). Since one land use class (Casuarina) has not been covered, it was validated by cross-validation. The class samples were split into 60% training and 40% validation data. The assignment of samples to training and validation was undertaken by simple random sampling [67] and by polygon to avoid overlapping. This means that every sample is one certain polygon and not selected by the pixel to ensure that no pixel can be selected twice (one training, one validation), which would distort accuracy results.

4. Materials and Methods

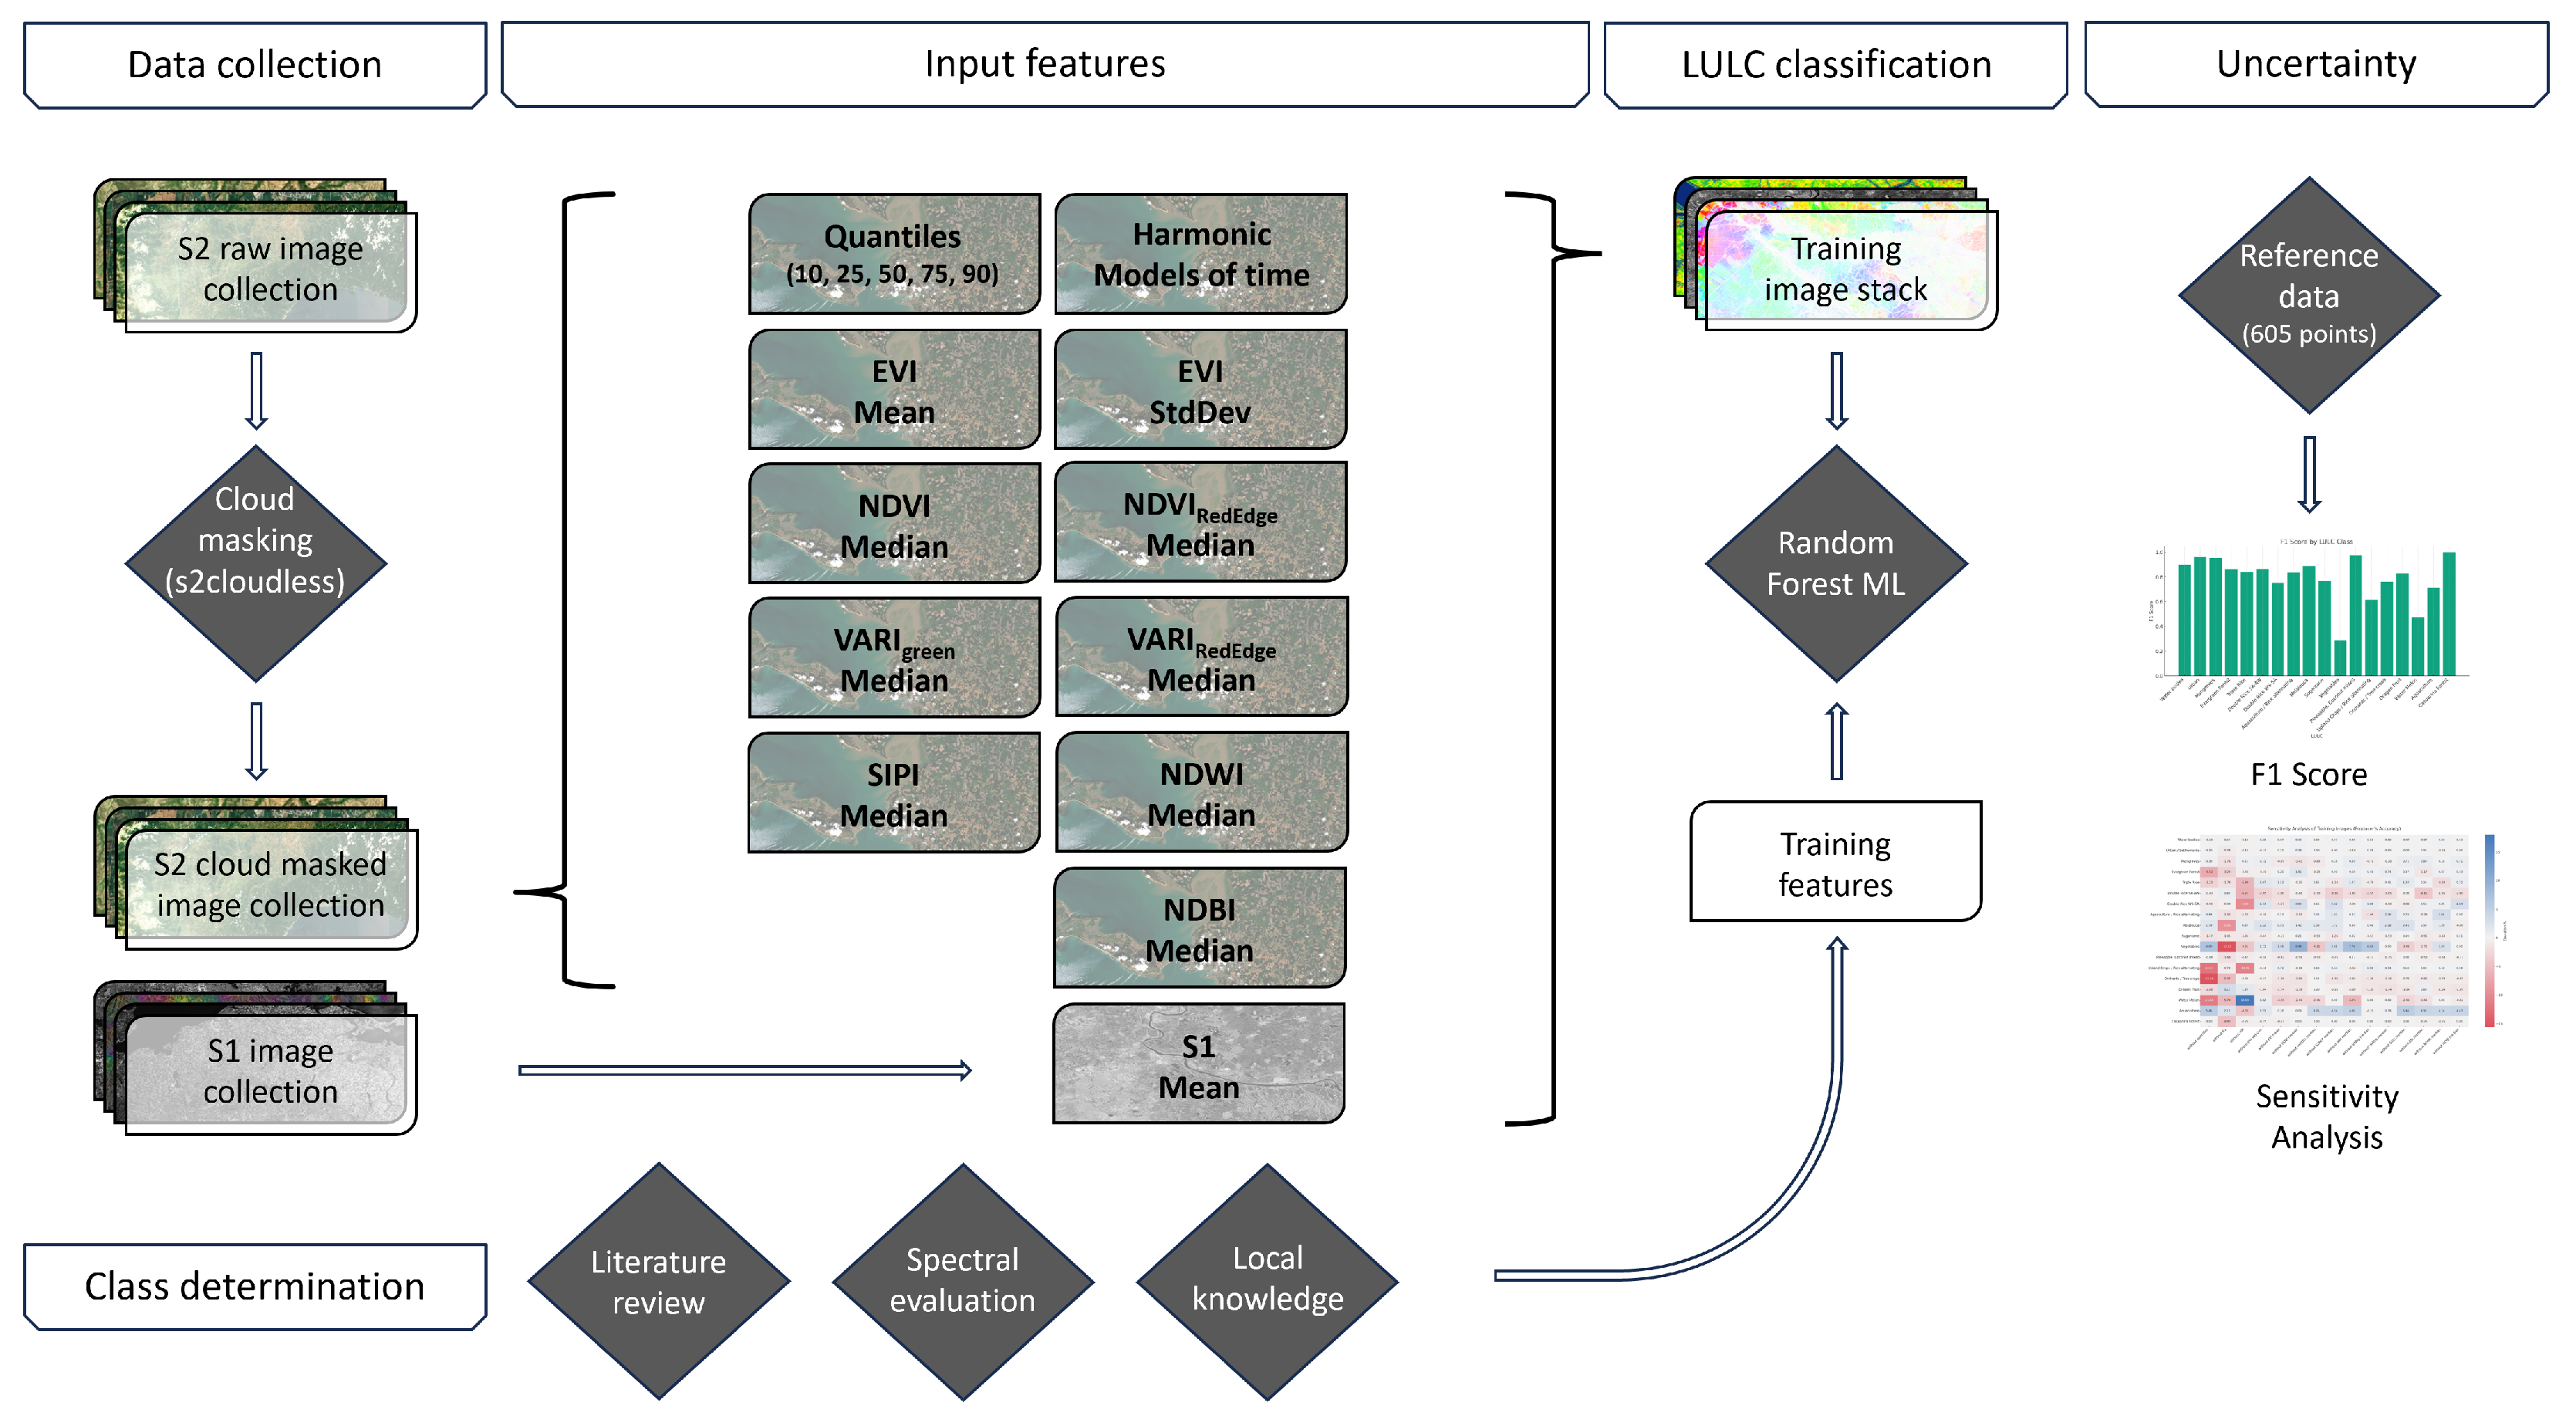
The utilized L2A data of the Sentinel-2 sensors are provided with an atmospheric correction based on Sen2cor [68]. After pre-processing, in which the surface reflectance (SR) data from the Sentinel-2 image collection was cloud- and shadow-masked, we derived relevant information for LULC detection by producing phenological metrics and conducting quantile mapping and harmonic analysis. We then fed it into the machine learning (ML) classifier and analyzed the uncertainty factors of the approach (see Figure 2).

4.1. Sentinel-2 Cloud Masking

Due to its tropical climate, passive optical remote sensing of the MRD suffers from a high cloud coverage. Each Sentinel-2 product is equipped with the QA60 quality bit mask band with cloud mask information for opaque and cirrus clouds. However, it turned out that due to the coarse spatial resolution of 60 m, the QA60 cloud masks in many cases discarded useful cloud-free observations in hetrogenic cloud patterns, while at the same time they ignored several small opaque clouds. In view of this, the decision was made to apply Sentinel Hub’s S2cloudless [69], a single-scene pixel-based cloud and cloud shadow detector suitable for large-scale applications to save computation time (see Skakun et al. [70], who recently compared different state-of-the-art cloud masking solutions). Applying a machine learning model trained on a large dataset, it produces a cloud probability map, which can be converted into a cloud mask by thresholding. For this work, a cloud probability greater than 70%, a cloud displacement index lower than −0.5, and a cirrus value greater than 0.02 were applied. It does not consider the spatial context of a certain LULCs, which makes it suitable for any resolution. Validation performed with the publicly available dataset of Hollstein et al. [71] showed high accuracy.

4.2. Calculation of Multi-Temporal Metrics

Creating metrics can be of high importance to highlight and extract class information, which is not clearly distinguishable from other classes. From all Sentinel-1 and cloud shadow-free Sentinel-2 observations, spatially contiguous temporal metrics were derived, allowing to exploit the specific temporal patterns in the data that can be attributed to seasonal vegetation dynamics or different land use types [72,73,74,75,76,77].

4.2.1. Quantile Mapping

Composites of time series are by their very nature temporally conditioned composites. Examples include minimum, maximum, mean, median, and quantiles. A quantile indicates a statistical key figure to define the division of a certain data sample. The median is the 0.5-quantile; it divides the data sample in half, thus being the exact center of the data sample. After proposing quantile regression for application in biology and ecology [78], it has been used in different remote sensing studies, e.g., precipitation forecast [79] and urban development [80]. Allen et al. [81] used quantile regression to detect changes in vegetation related to haying habits based on locally collected data. To our knowledge, there has been no application of quantile mapping in remote sensing to detect and distinguish vegetation seasonalities so far. To derive a wide range of temporal-spectral information, five different quantiles of the time series were chosen. For each pixel, the 10th, 25th, 50th, 75th, and 90th quantiles were calculated for the four Sentinel-2 spectral bands in the visible and near-infrared spectrum at 10 m resolution as well as for the two 20 m spectral bands in the short-wavelength infrared spectrum in order to tackle vegetation seasonalities: blue (Band 2), green (Band 3), red (Band 4), NIR (Band 8), SWIR1 (Band 11), and SWIR2 (Band 12).

4.2.2. Harmonic Analysis

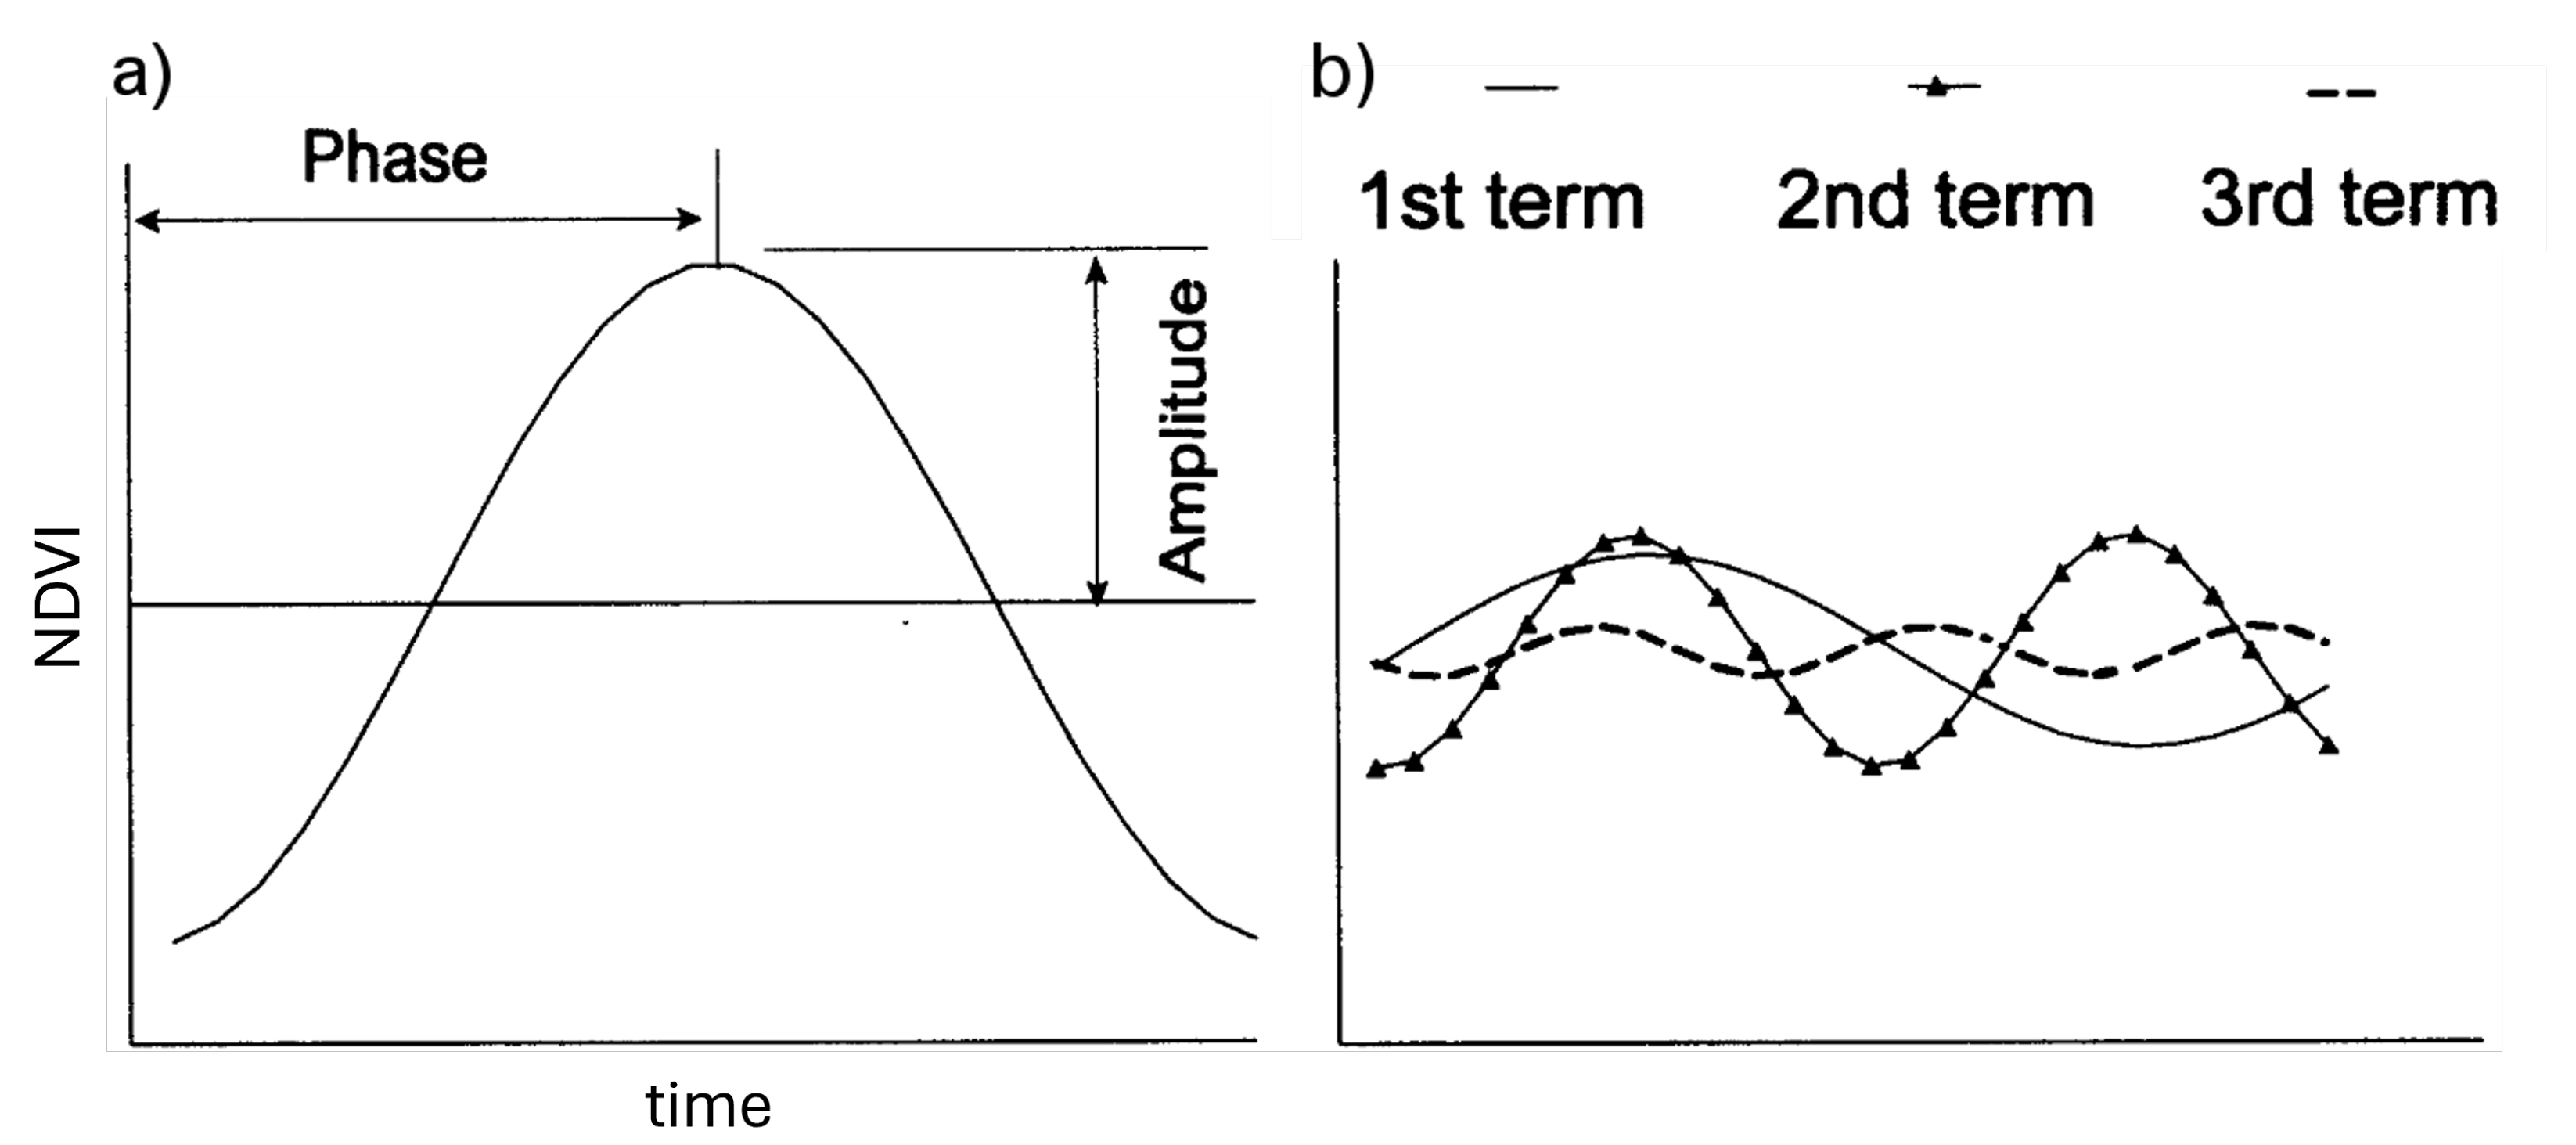
The most demanding challenge of this study turned out to be the distinction between the different rice growth cycles of the MRD. Although the different quantile bands, along with the phenological metrics, already depict the rice seasonalities, they are too imprecise to fully capture the changes in detail. Therefore, and to support other vegetation patterns’ detection, a harmonic regression analysis was applied to the NDVI to estimate seasonal information, as it is particularly robust against remaining noise, like haze and thin cirrus clouds, and is very sensitive to systematic changes in vegetation [2,82,83]. Therefore, this approach seems promising for gap-filling in the temporal data series. To do so, a Sentinel-2 NDVI time series of the examined time period was subjected to a discrete Fourier transform. Hereby, temporal NDVI signatures are decomposed into a series of constituent sinusoidal functions with unique amplitude and phase information as exemplarily shown in Figure 3. Each harmonic term indicates how many full cycles a wave undergoes within the specified interval (for example, the second term corresponds to two complete cycles) [84,85].
With regard to rice seasonality, the temporal NDVI signals of one, two, and three growing cycles per year were derived from the corresponding first, second, and third harmonic terms. Given pt a pixel value at time t, one can formulate a single pixel at different times by pt; t = t0tn. In general, the time series can be decomposed as sinusoidal functions (sinusoids) at different frequencies. Therefore, the harmonic component can also be extended to higher frequencies. Since in the MRD single-, double-, and even triple-cropped rice is farmed, a harmonic regression for every cycle count is computed by
p t = β 0 + β 1 t + β 2 cos ( 2 π ω t ) + β 3 sin ( 2 π ω t ) + e t
where β describes the independent variables of the regression analysis, β 2 is Acos( ϕ ), β 3 is Asin( ϕ ), et is a random error, A is the amplitude, ω is the frequency, and ϕ is the phase [86]. Figure 3 shows the visualization of phase and amplitude for three exemplary cycles.

4.2.3. Phenological, Hydrological, and Built-Up Metrics

Built-up structures were defined by the use of the NDBI median. The NDBI highlights urban and barren areas with higher reflectance in the shortwave-infrared compared to the near-infrared. The median was preferred to the mean to exclude potential outliers in built-up areas.
To enable the classifier to easily detect water bodies, the median composite of NDWI was applied, exploiting the strong absorption of water between the visible and infrared wavelenghts. To capture spatial vegetation differences, the median composite of NDVI was used. Suitable for covering a wide range of vegetation types, the NDVI uses the near-infrared for greenness and the red spectrum for chlorophyll absorption. The NDVI correlates well with vegetation, where the canopy is not fully closed, but it saturates later in the growing season due to higher leaf area. Therefore, the Visible Atmospherically Resistant Index (VARI) developed by Gitelson et al. [87] was utilized, which uses the red, green, blue, and/or red edge signals, depending on the chosen sub-index, because they contain important information throughout the growing season. The approaches applied in this study include the VARIGreen median and the VARIRed Edge median as statistical metrics of a time series. Hereby, close spectral distances between different cropping patterns and spectrally confusing overlaps and changes in the rice-pattern dynamics of the MRD shall be answered. In addition, to differentiate between forest and orchard structures, the temporal density differences were used, which occur when the latter is ‘interrupted’ by the fruit harvest. This can be referred to as a ‘time-dependent density difference’. Taking the same line, but widening the red-edge spectrum, was intended by applying the median composite of NDVIRed Edge. Both red-edge indices reduce the loss of chlorophyll sensitivity of the NDVI, and hence capture minor spectral differences in similar vegetation signatures. To capture temporally dynamic vegetation, the Structure Insensitive Pigment Index (SIPI) developed by Penuelas et al. [88] served as the training input. SIPI increases the sensitivity to the ratio of bulk carotenoids to chlorophyll and reduces the sensitivity to variation in the canopy structure. For the purpose of this work, a median composite of SIPI was applied to reduce the sensitivity to structural changes within a single class, thus allowing to differentiate it from other classes. By considering different levels of canopy stress, density, greenness, and chlorophyll absorption, and including the (red) edges in a pixel-based manner, the distinguishability of the highly variable vegetation cover in the MRD was intended to be further improved.
The delineation of rice followed the fact that paddy rice fields are systematically flooded and vegetated throughout the years. Inspired by Kontgis et al. [61], the standard deviation of the Enhanced Vegetation Index (EVI) was used to capture this variability. Another useful application of the EVI is to discriminate aquacultural ponds from other water bodies (‘cultivated’ versus ‘natural’ water bodies) with a pure pixel-based approach. The underlying idea refers to the fact that ponds, like paddy rice fields, are periodically flooded, but unlike rice fields, the change from flooded to non-flooded occurs abruptly in aquaculture rather than slowly, as in the case of rice. As a result, the standard deviation detects the difference between non-flooded and flooded ponds, but the EVI mean additionally takes the short non-flooded stage into account. Table 2 lists all applied input metrics used in the study.

4.2.4. Sentinel-1 Composite

From the available S1 observations, the mean of the VH polarized, VV polarized, and the VV/VH ratio data was calculated at the pixel level. Different backscatter behaviors of different vegetation types allowed for more accurate class separation. Furthermore, S1 data were applied for gap filling in areas with a low image-per-pixel count caused by high noise and cloud occurrence.

4.3. LULC Classification Based on Time Series Features

The multitemporal metrics formed the basis for the estimation of LULC information using a supervised classification approach. Additionally, the aforementioned field trips, existing LULC classifications, Google Earth Imagery, reference data from the EOMF, and local knowledge served as support to identify 18 relevant LULC classes (Table 3). Classification was performed using a non-parametric random forest classifier [3,94]. Studies show that single classification trees deliver relatively low accuracies [4,40] but combining several classification trees into tree ensembles can significantly improve the prediction results (e.g., [6]). Compared to other methods, the random forest classifier is particularly suitable for the study of land use dynamics in Vietnam’s Mekong Delta due to its ability to handle large, complex datasets with multiple classes and its robustness against noise and missing data. Unlike simpler models like logistic regression or naive Bayes, which may struggle with complex relationships and feature dependencies, or support vector machines and neural networks, which can be computationally intensive and less interpretable, random forest balances accuracy, scalability, and ease of use. Its ensemble approach reduces overfitting and provides valuable feature importance evaluation, making it a practical choice for remote sensing applications on platforms like Google Earth Engine.
In order to obtain the most suitable number of trees for the classifier, a hyperparameter tuning was performed. Higher numbers of trees require a larger computation capacity but do not necessarily generate higher predictive accuracies. This hyperparameter analysis led to an ideal value of 40 decision trees.
To reduce ’salt-and-pepper’ effects, a 3 × 3 pixel spatial low-pass filter was applied, replacing segments of up to two connected pixels with the kernel mode. This method balanced homogeneity and the risk of losing small-class objects. In order to delve deeper into each training input’s contribution a sensitivity analysis was conducted to evaluate their relevance by training 15 additional models, each excluding one feature iteratively.

5. Results

5.1. Classification Result

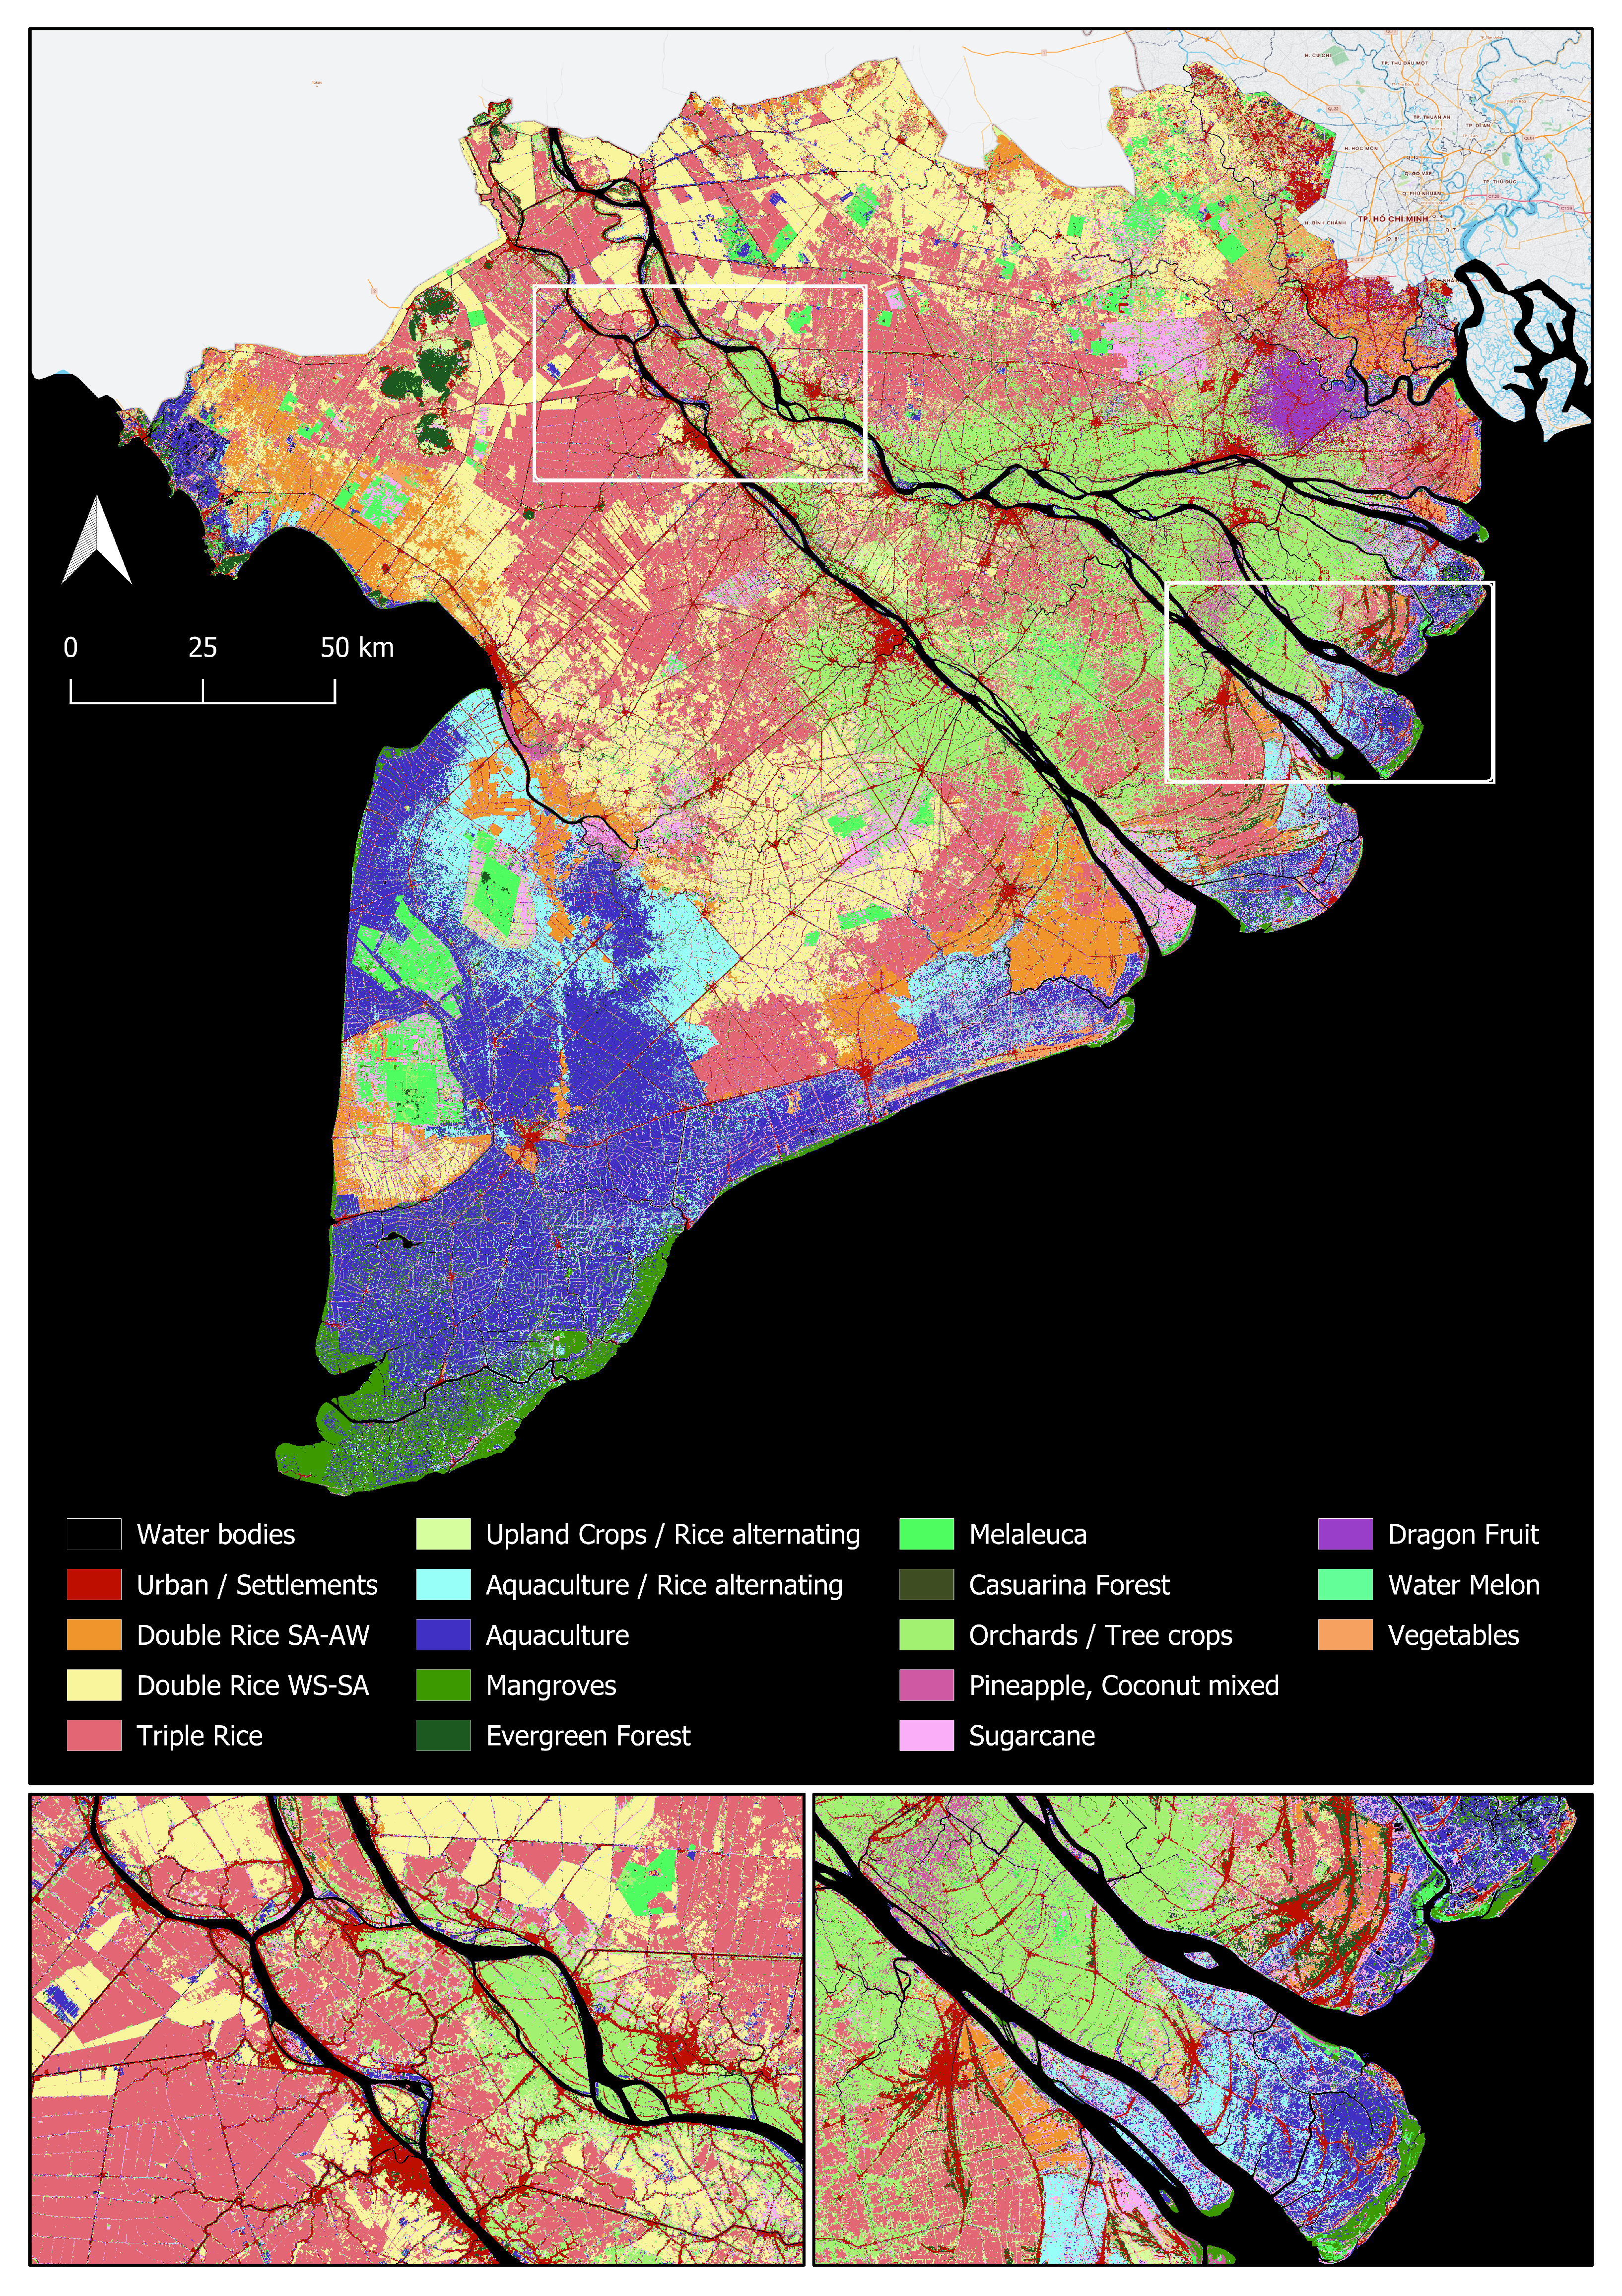
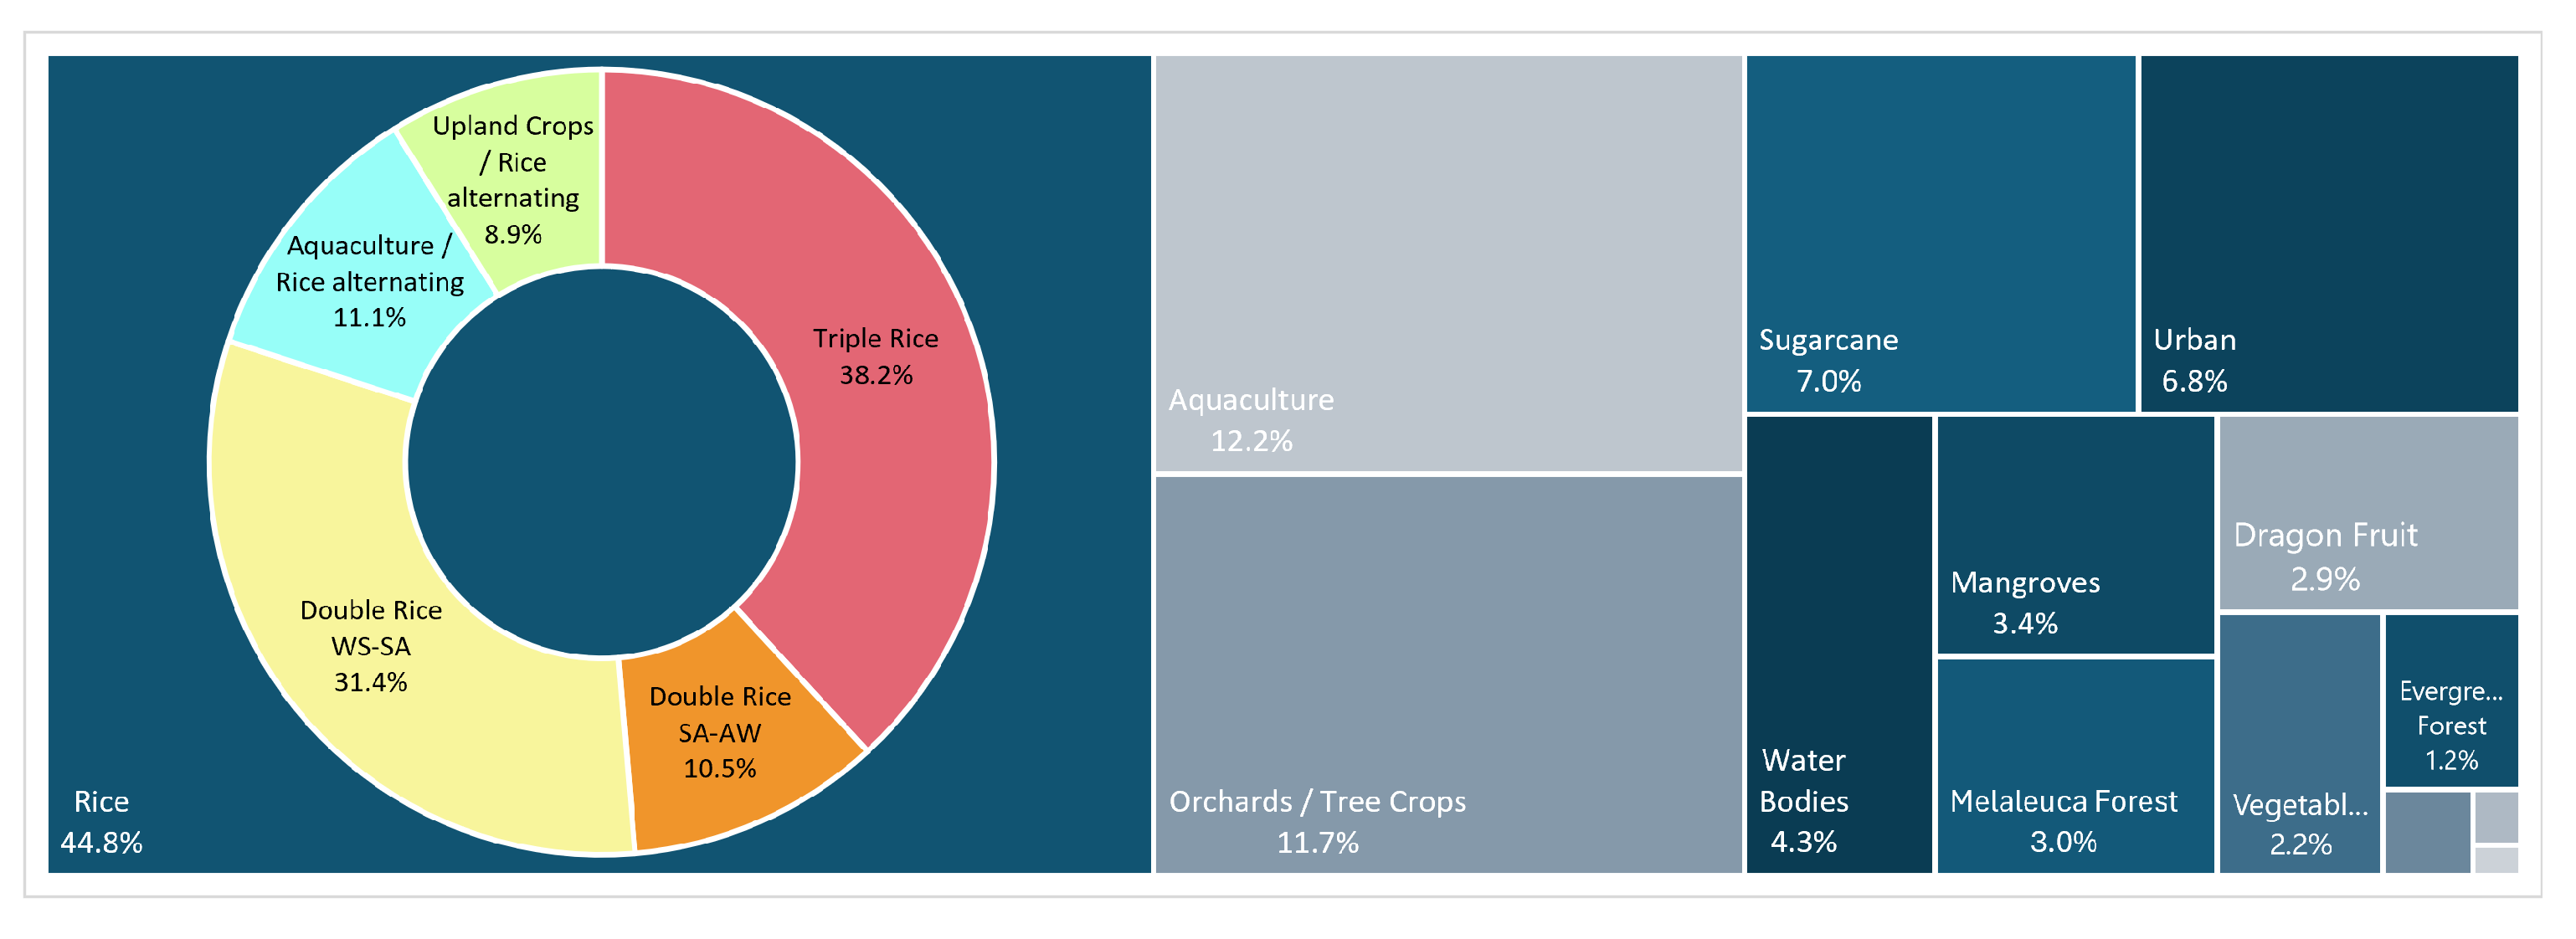
The final classification comprising 18 LULC classes is illustrated in Figure 4, with the area distribution per LULC class shown in Figure 5. The five classes related to rice cultivation cumulate in the largest share of LULC in the MRD. Summing up all rice classes (Double-cropped Rice SA-AW, Double-cropped Rice WS-SA, Triple-cropped Rice, Aquaculture/Rice alternating, Upland Crops/Rice alternating), it lives up to the delta’s second name as the ’Rice Bowl’ of Vietnam, accounting for 45% of the total delta area (17,733 km2). Within the MRD, Kien Giang province hosts the largest area for rice cropping, covering almost 3200 km2, followed by An Giang (2467 km2) and Long An (2354 km2) provinces. Amongst all rice classes, the double-cropped rice is the most dominant (1858 km2 SA-AW, 5558 km2 WS-SA), followed by triple-cropped rice (6769 km2), and the alternating forms of cultivation (1976 km2 aquaculture/rice and 1572 km2 upland crops/rice).
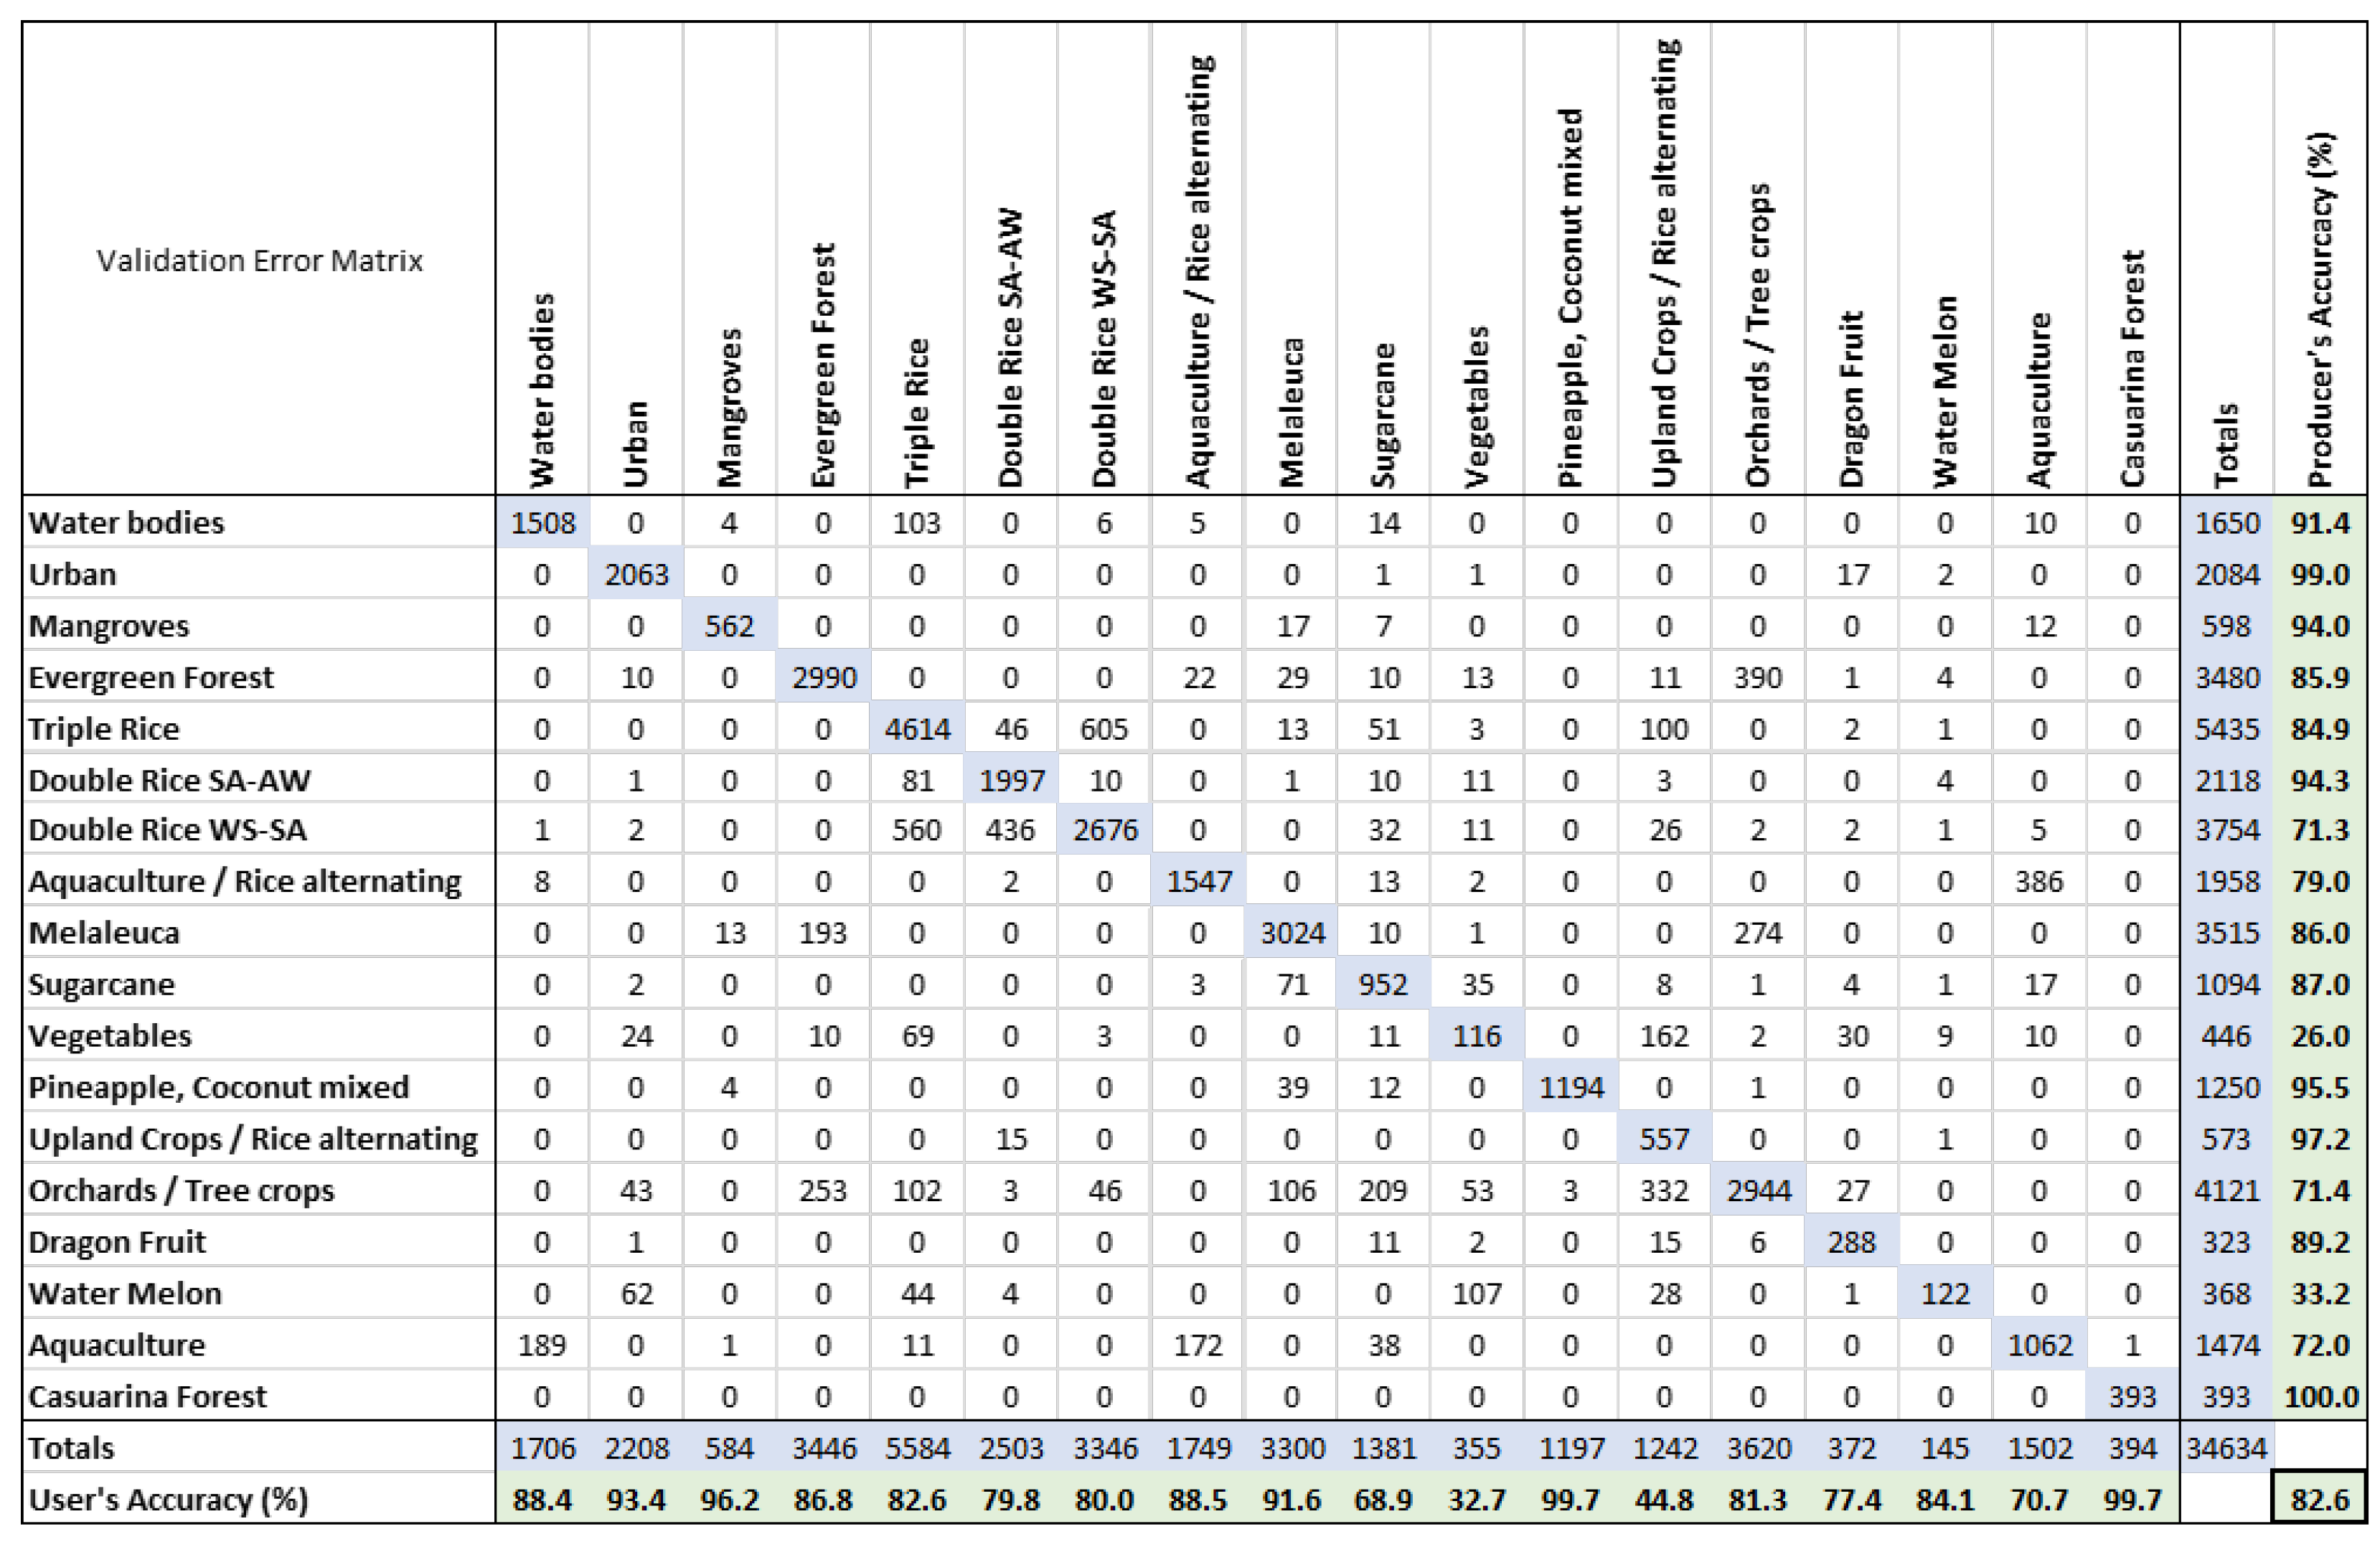
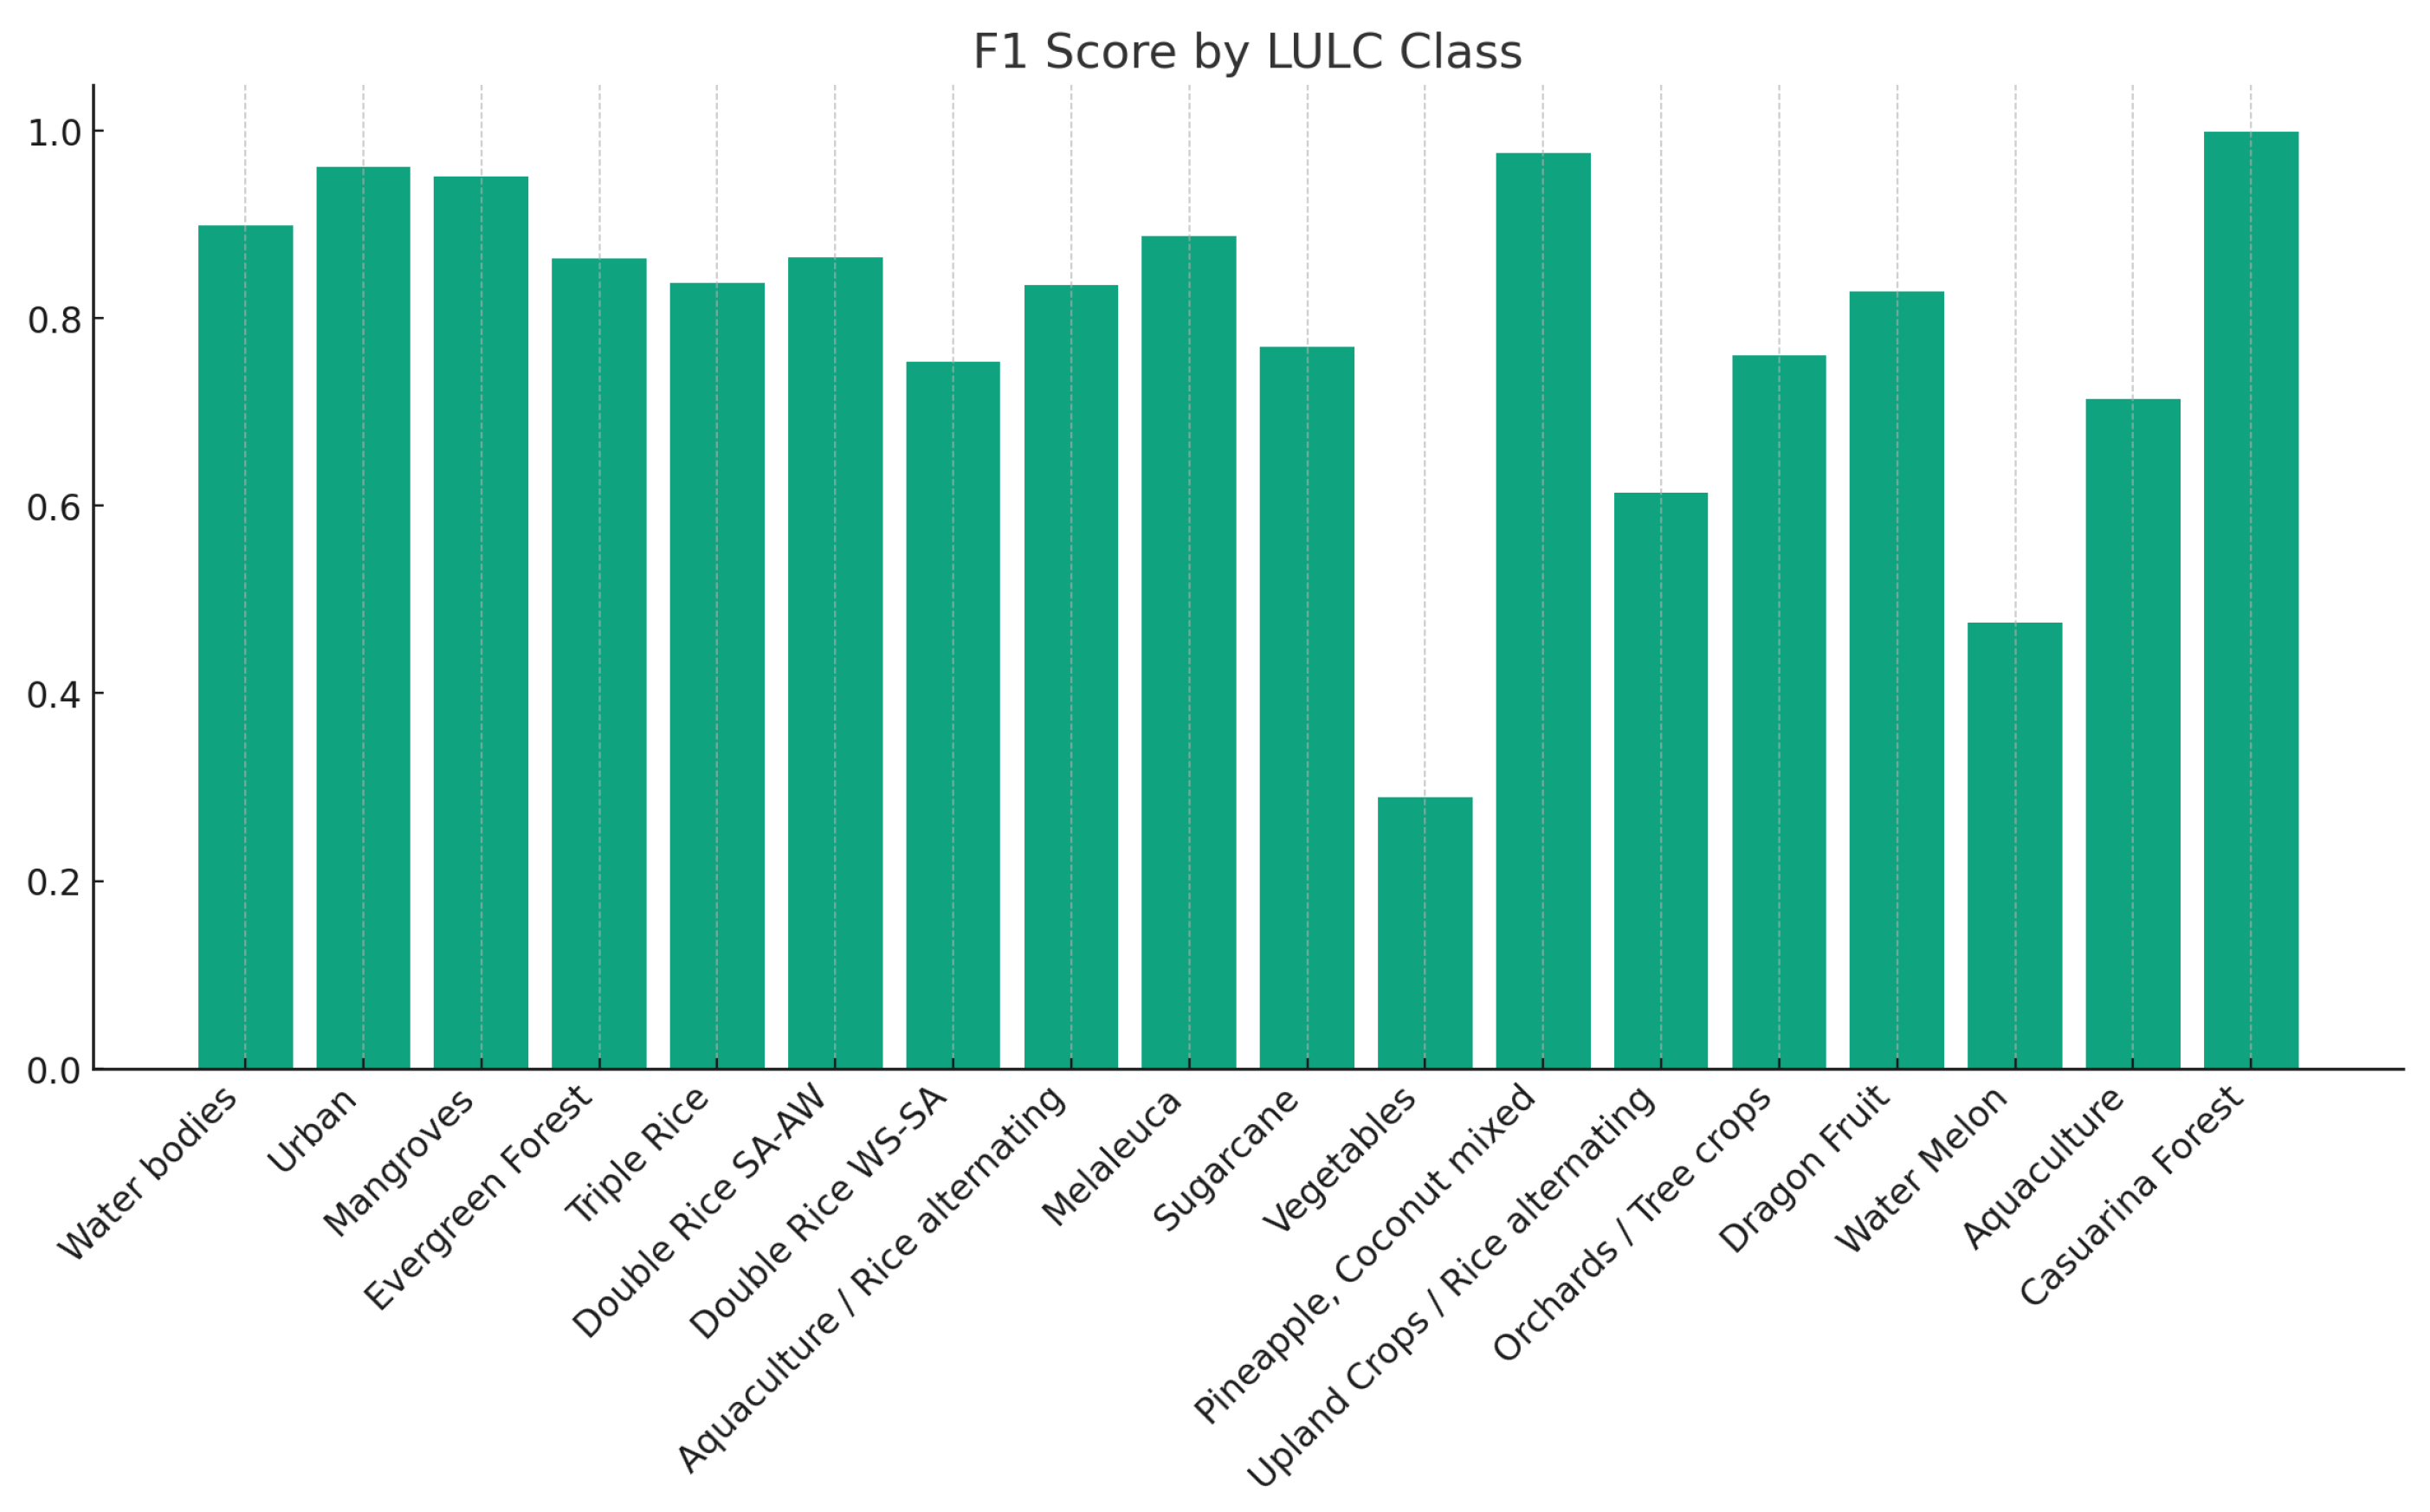
Aquaculture is the secondmost common land use in the MRD. Together with Aquaculture/Rice alternating it accounts for 17.2% of the area. Natural and semi-natural forests (mangroves, evergreen forest, melaleuca, casuarina) grow on 3035 km2, which is a share of 7.7% of the total area. Mangroves can be found mainly on the coastal region of Ca Mau, where 72% of the total occurrence can be found. The major share of evergreen forest (63%) falls in An Giang province, whereas melaleuca species are concentrated in the national parks in Kien Giang, Long An, and Ca Mau provinces (69%). Orchards and tree crops form a spatially dominant class and make up almost 12% of the total area, which concentrates in the central and eastern provinces of Tien Giang, Ben Tre, and Vinh Long between large settlements of the delta. Although the most extensive settlement areas and the largest population density are located in other provinces, the highest proportion of built-up area is detected in Long An province (15%), which is due to the suburban sprawl of Ho Chi Minh City into the northeast. The sugarcane hotspot in the MRD lies on and around the island of Cu Lao Dung in Soc Trang and Tra Vinh provinces. However, considerable plantations can also be found in Ca Mau, Long An, and Tien Giang. The classification achieved an overall validation accuracy of 82.6% (see Figure A1) and a kappa value of 0.81. To evaluate the results, the F1 score was calculated for each class. The F1 score is a measure used to evaluate the accuracy of a classification model, combining both precision and recall into a single metric. It is particularly useful in scenarios where the balance between false positives and false negatives is crucial, providing a more comprehensive understanding of model performance than accuracy alone. A total of 11 of the 18 classes show an F1 score above 0.8, i.e.,high values in both the user’s accuracy (UA) and producer’s accuracy (PA), while two are below 0.5 (see Figure 6).
Considering the highly dynamic cropping patterns in the MRD, it is no surprise that the majority of misclassifications of each rice class falls on the other rice classes. Both of the two other spatially major classes Orchards/Tree crops and Aquacultures are primarily confused with the expected partners. The first-mentioned is difficult to distinguish from the other tree classes, the latter from Aquaculture/Rice alternating. Worth mentioning is the relatively low confusion between the aquaculture classes and Water bodies, indicating that the approach employed in this study worked quite well in the distinction of the two, whereby an Aquaculture UA of 71% and PA of 72% leave room for improvement.

5.2. Input Metric Evaluation

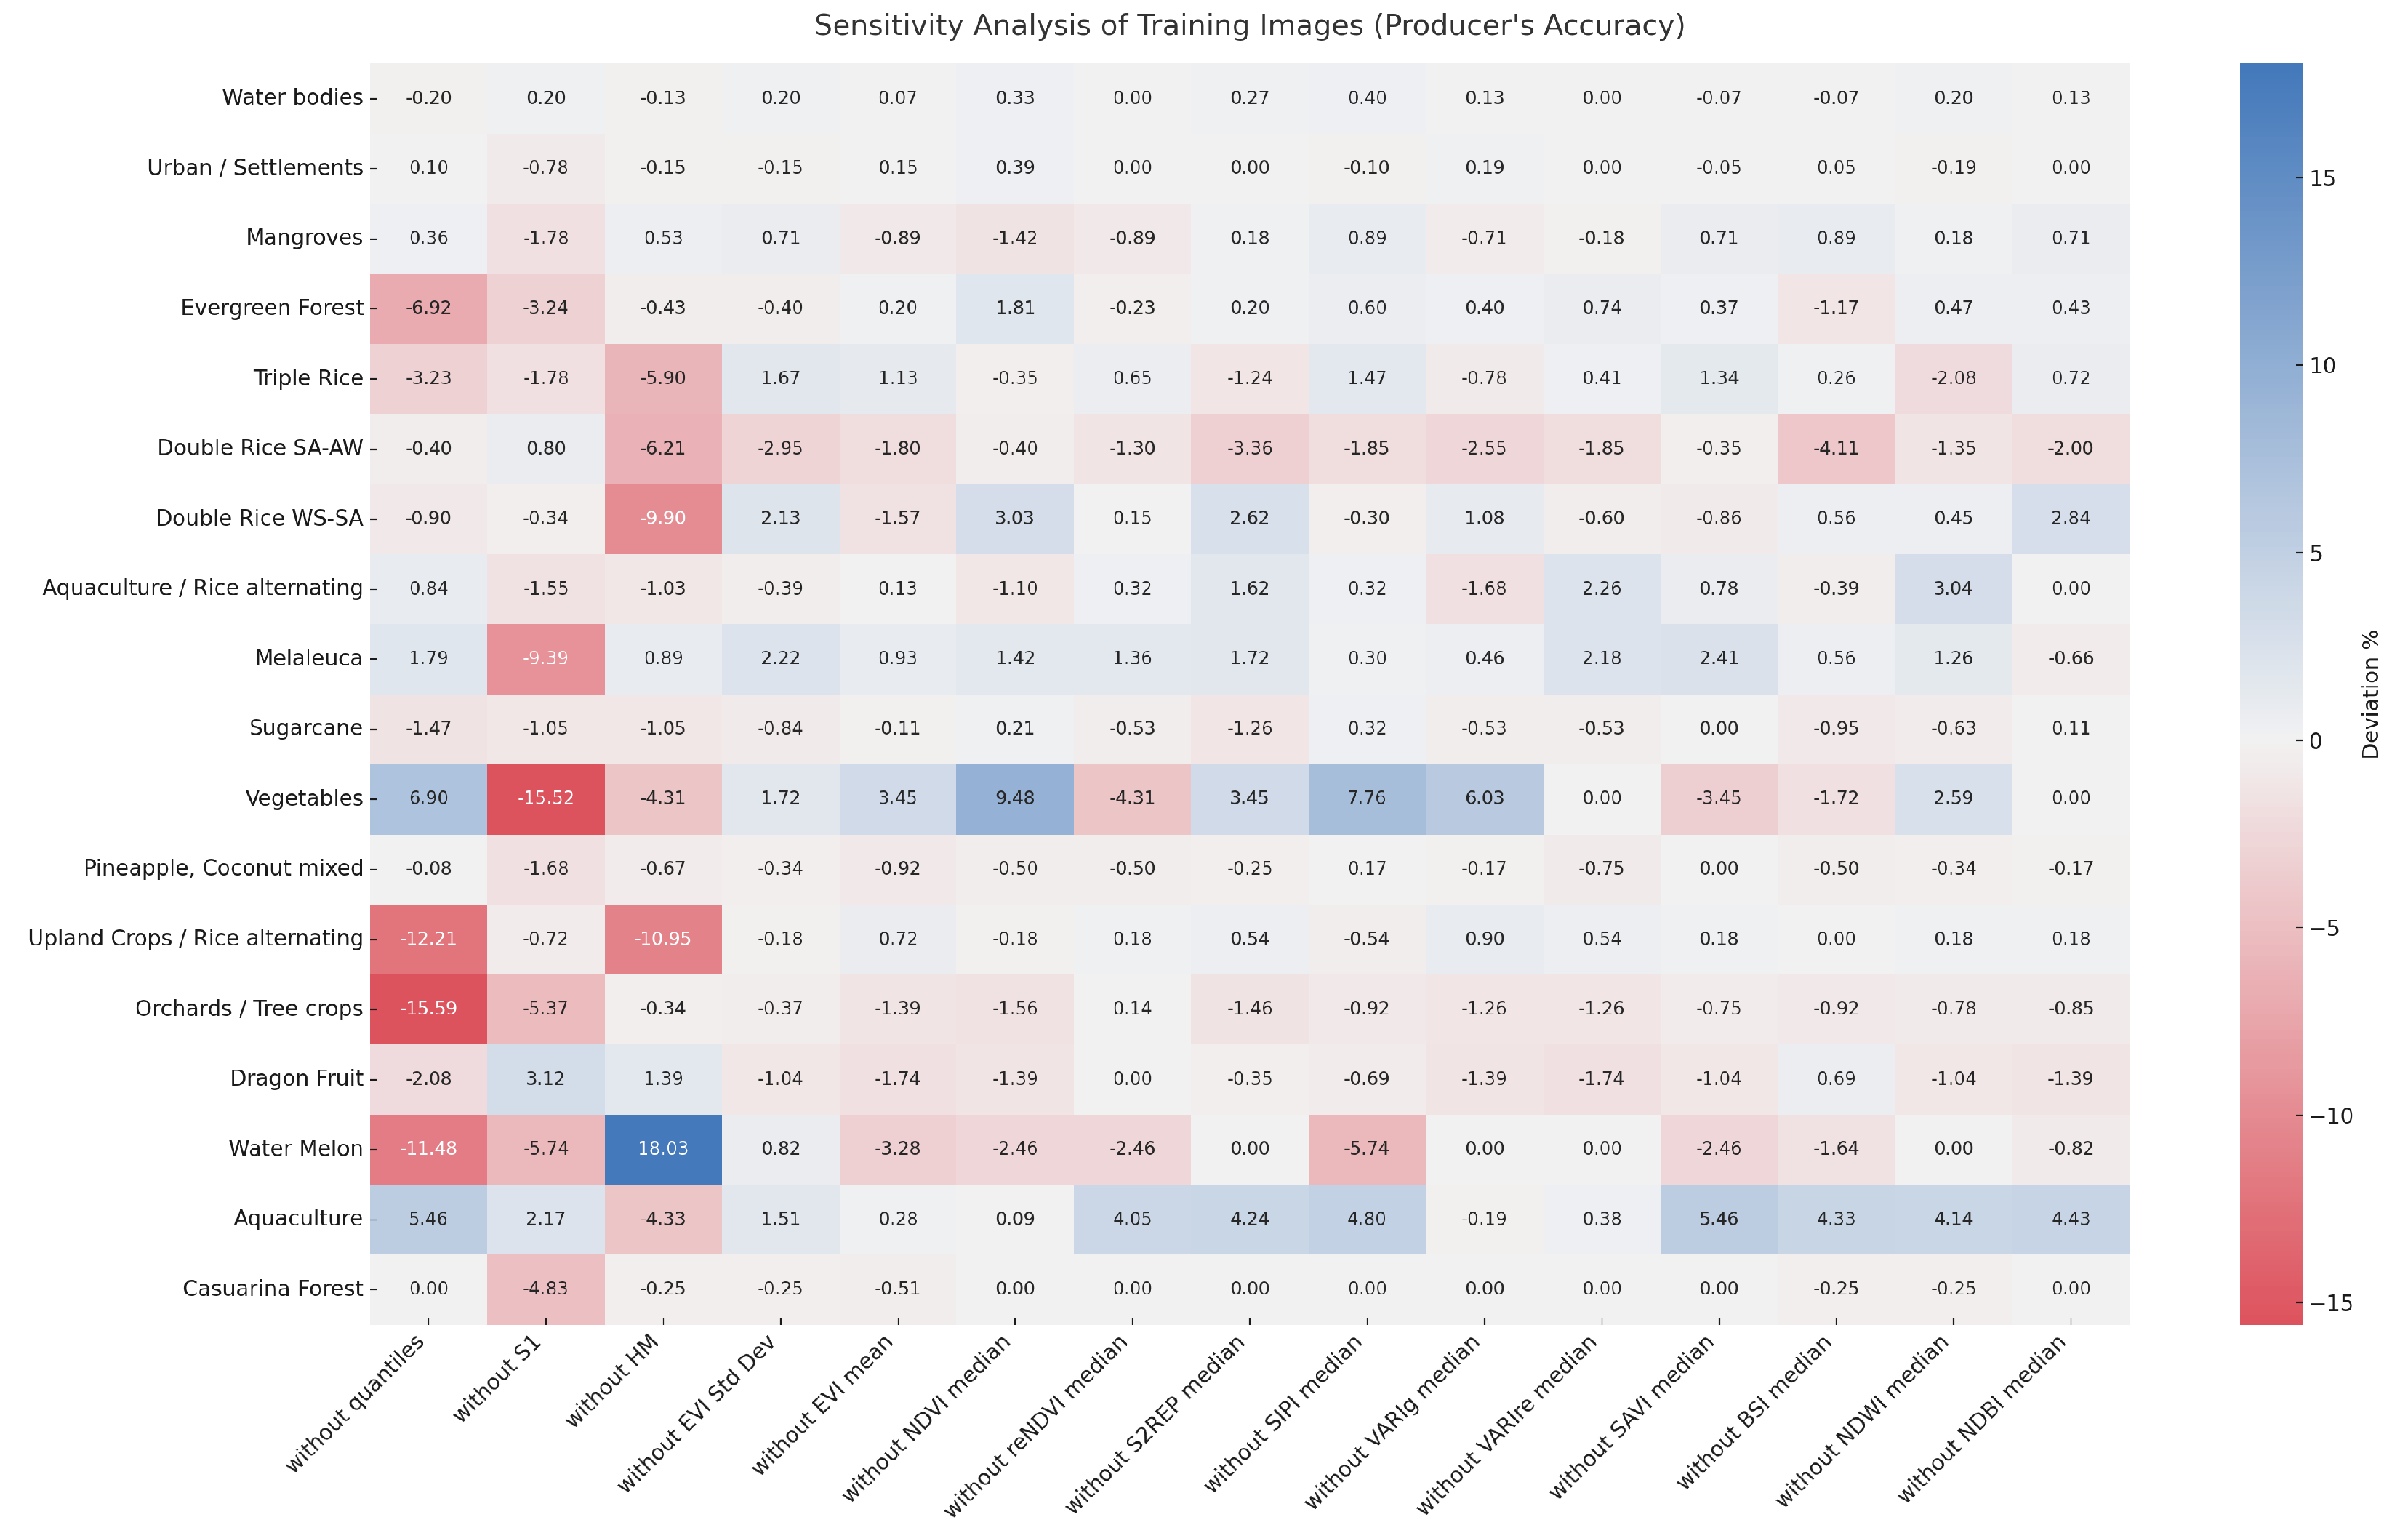
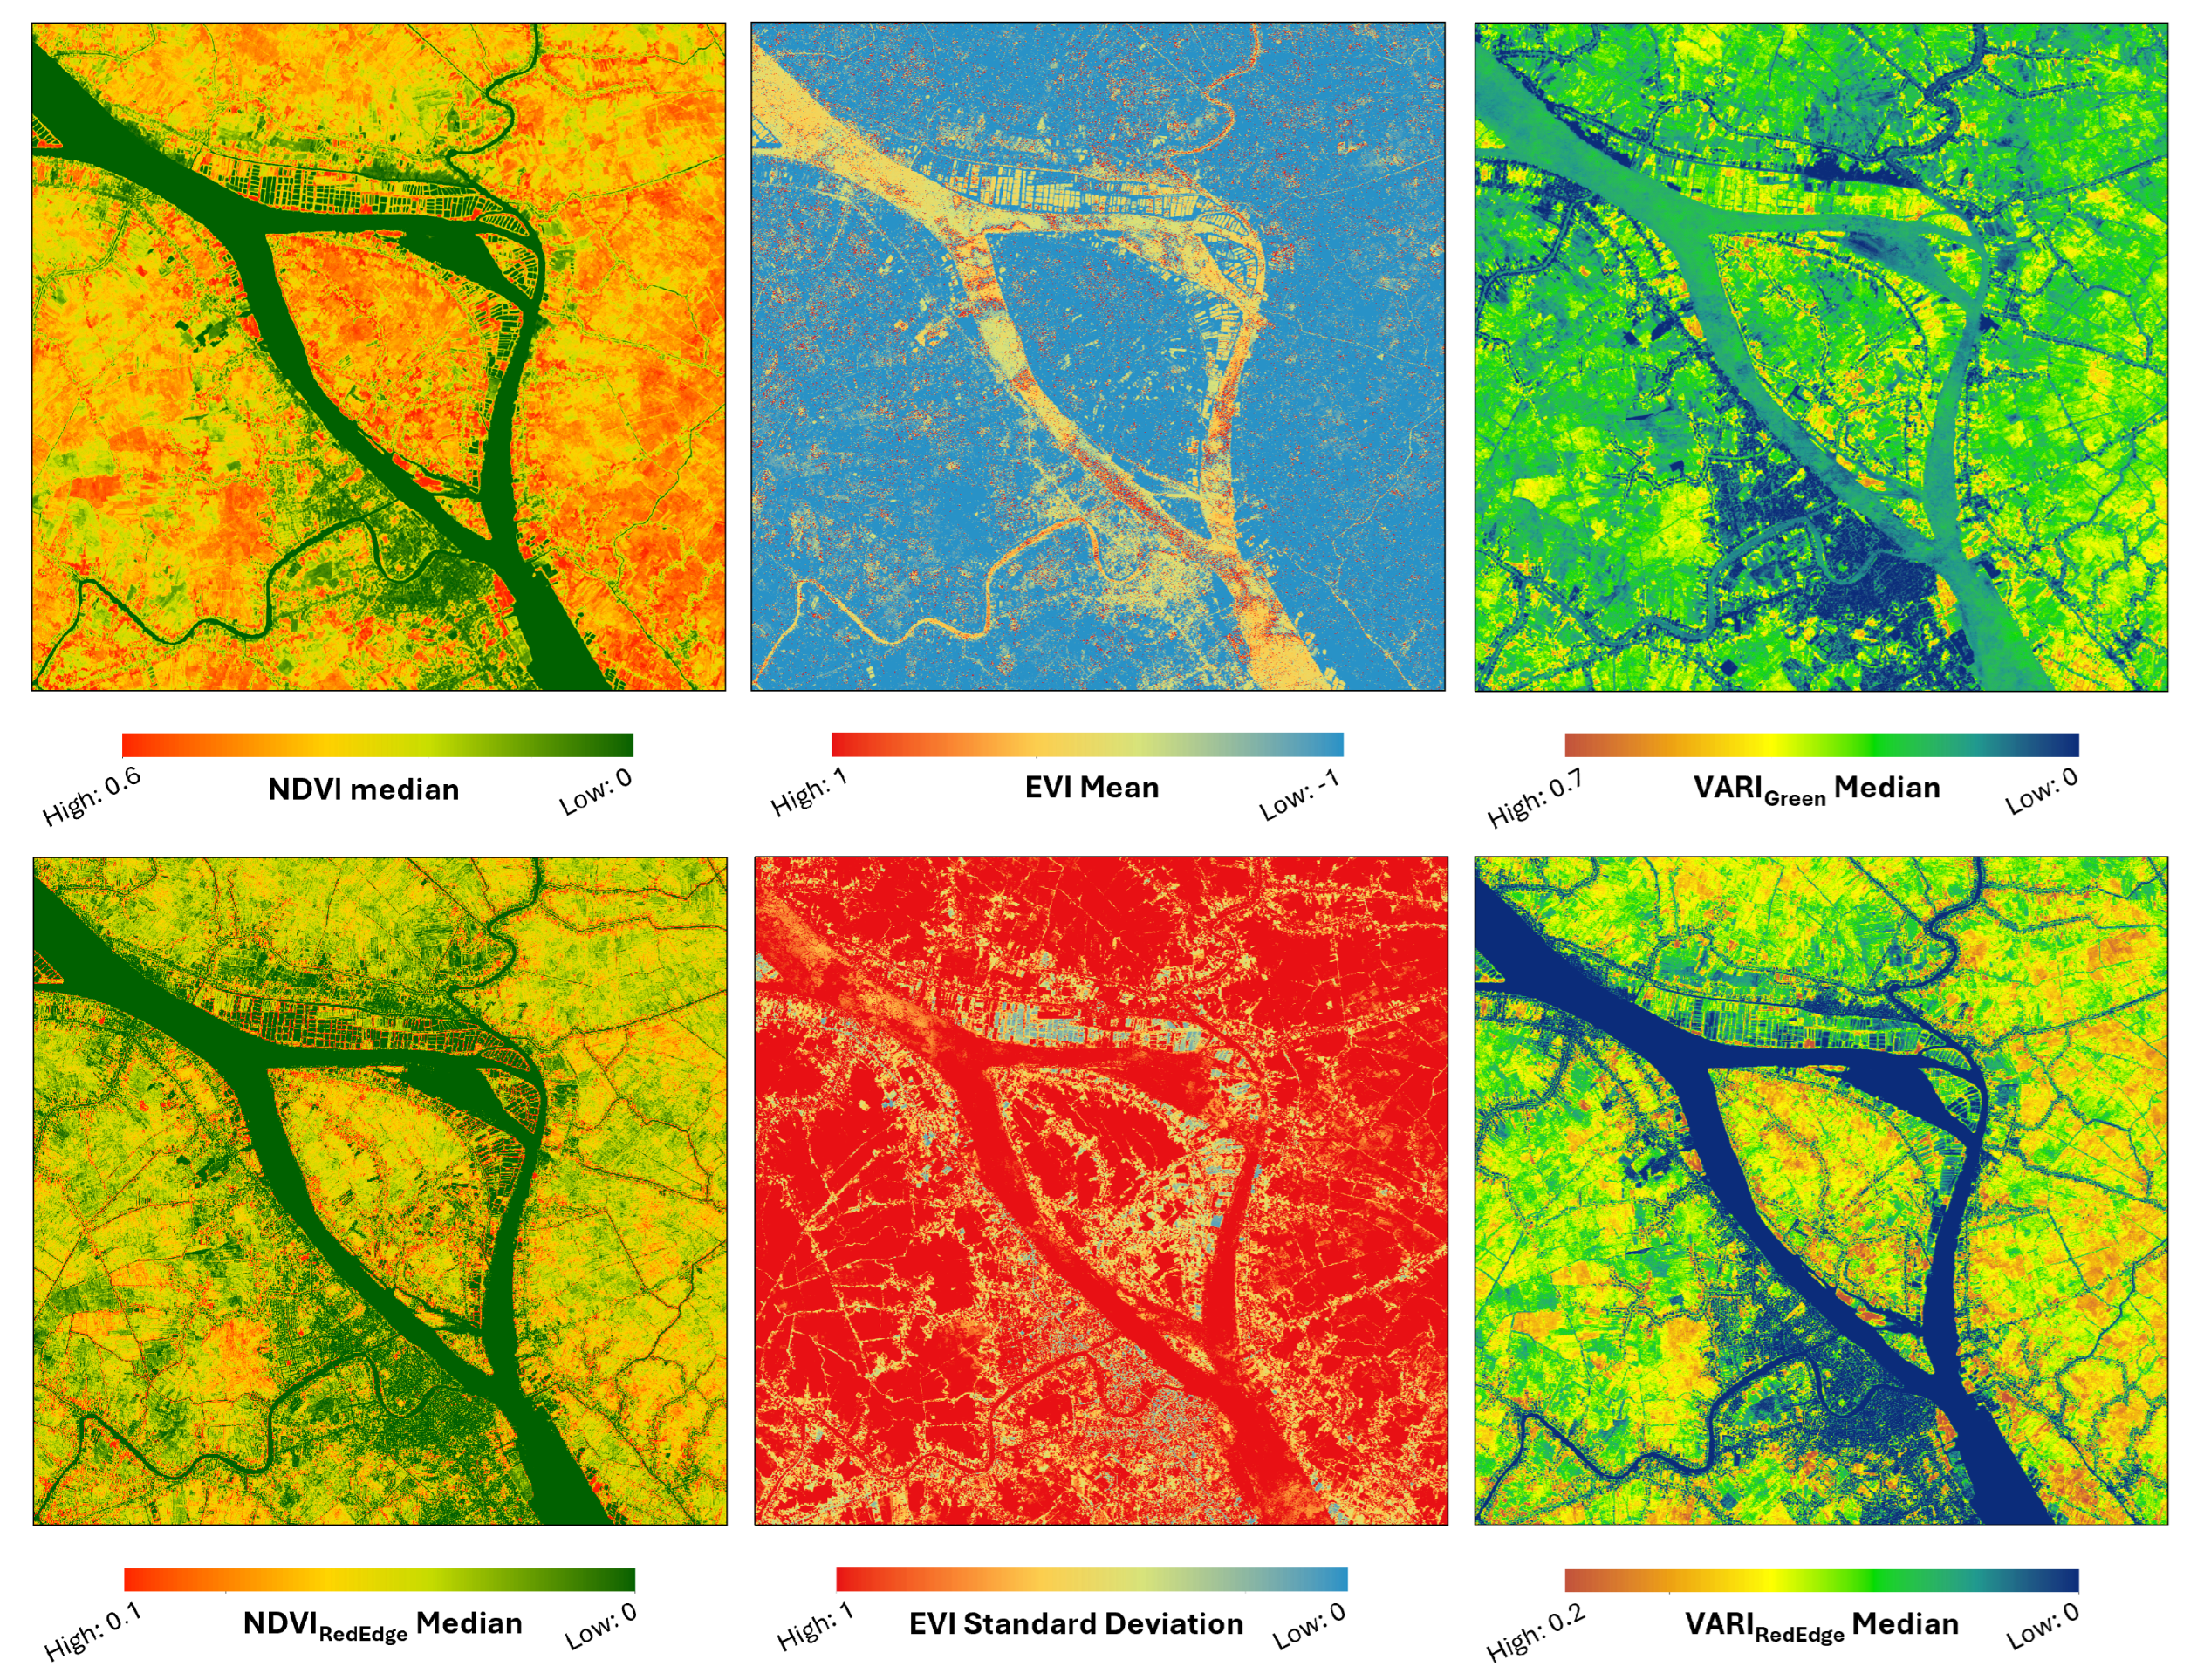
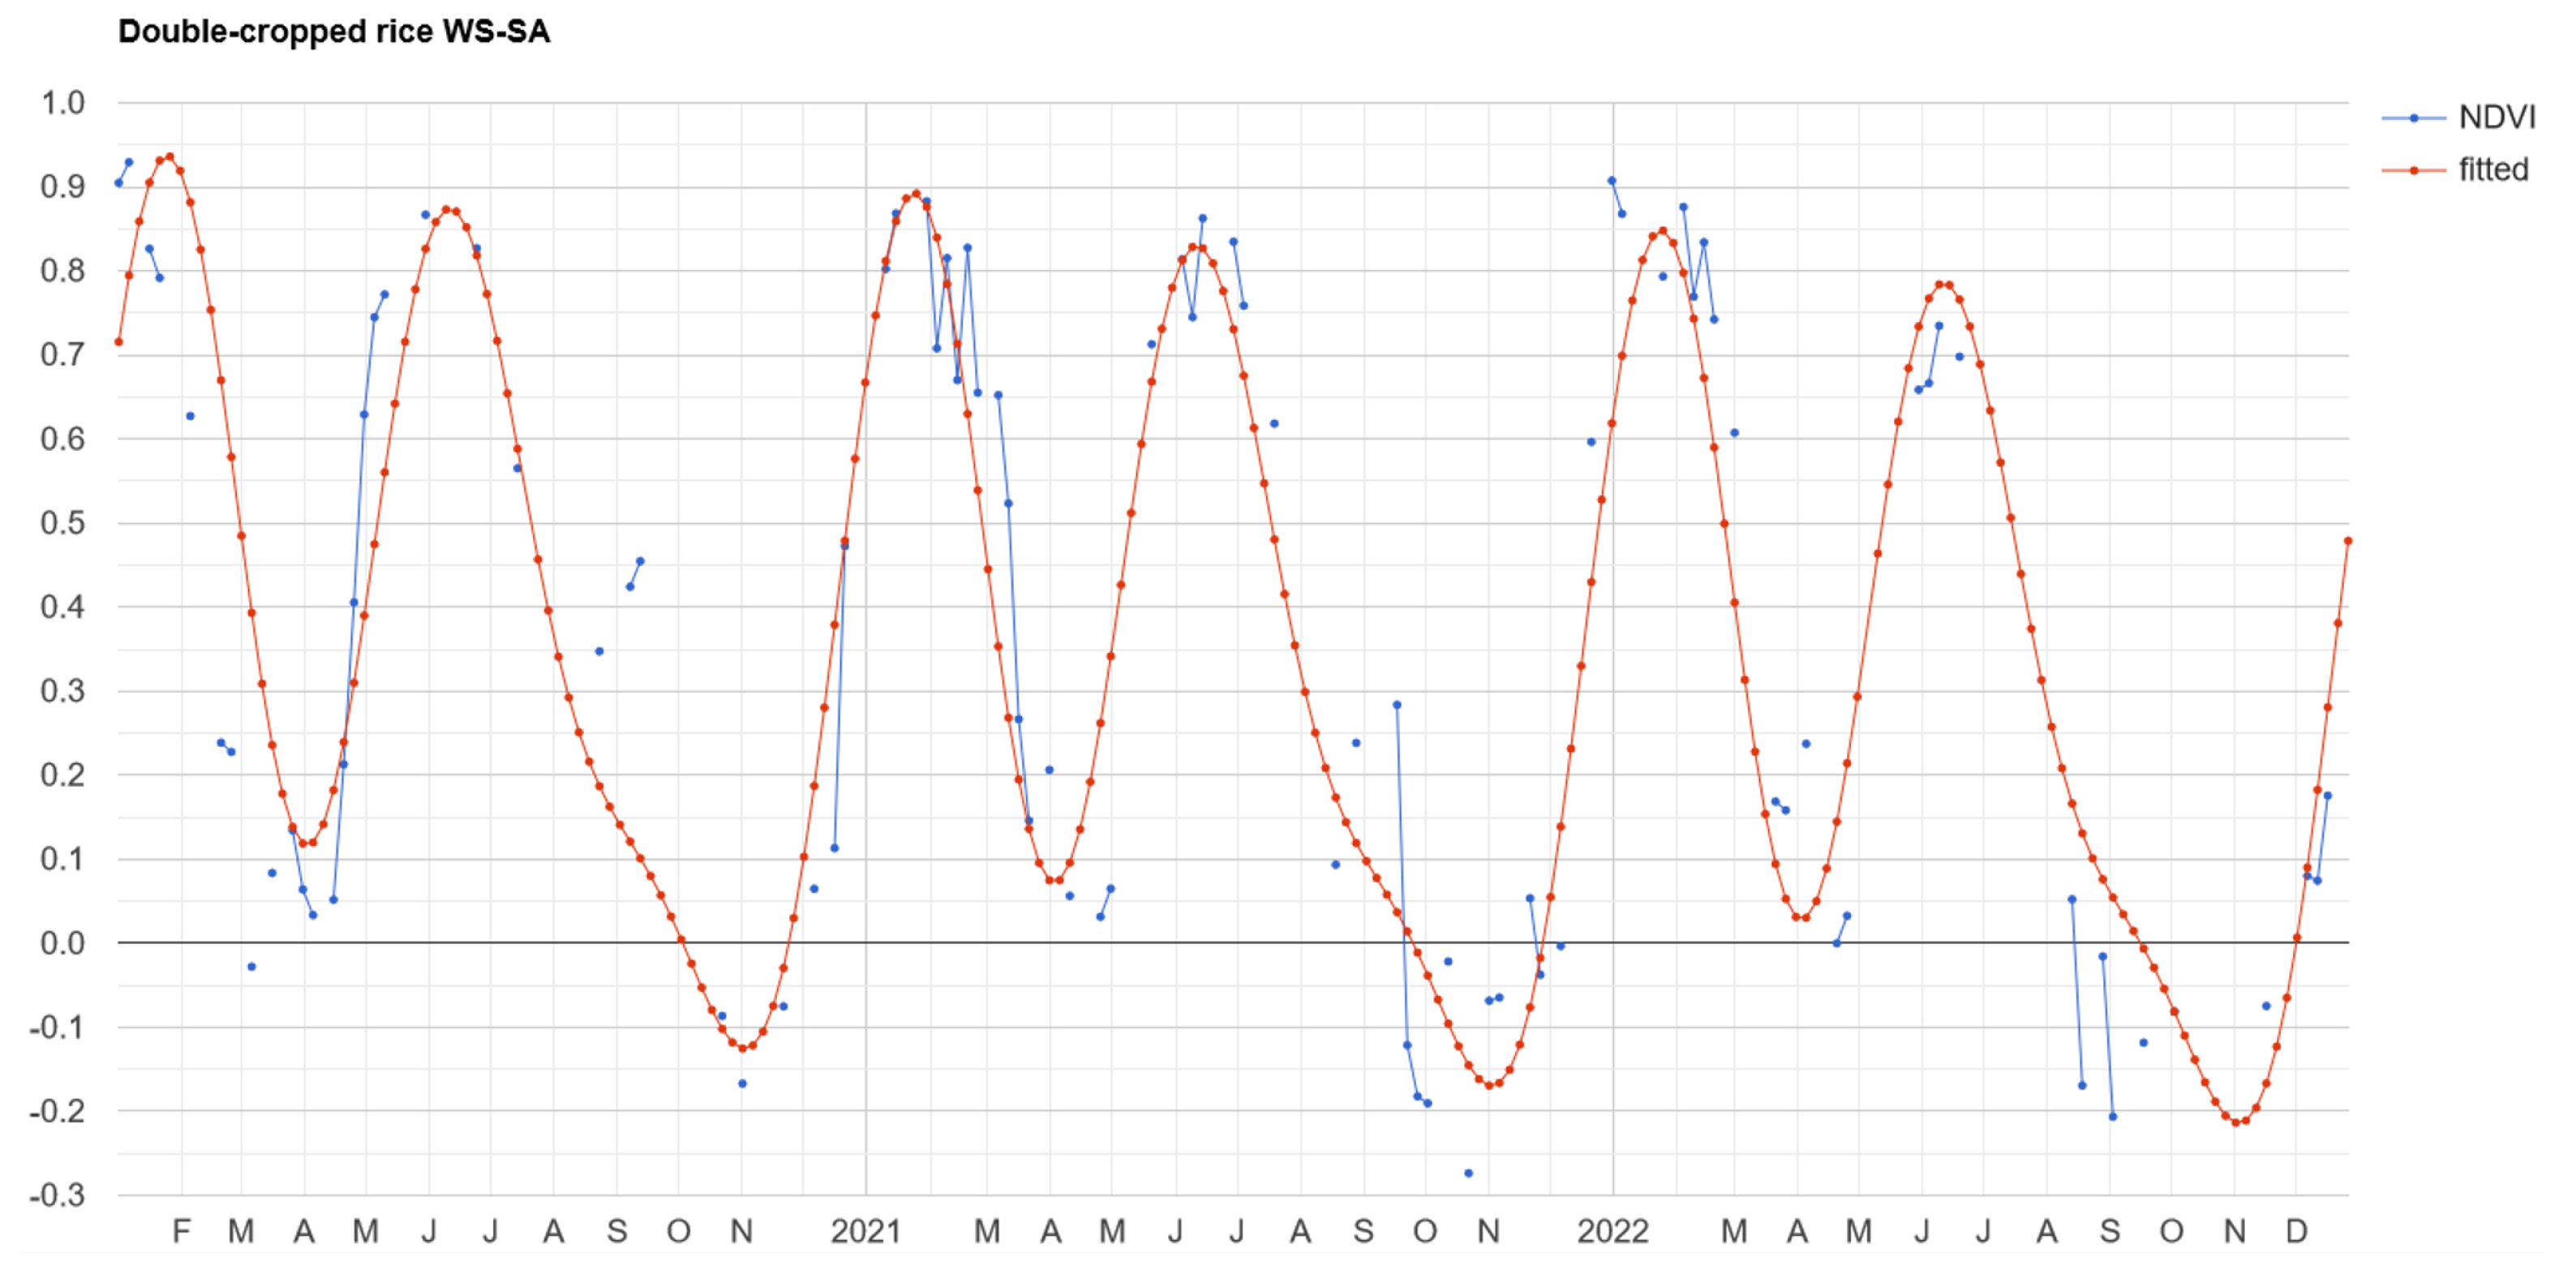
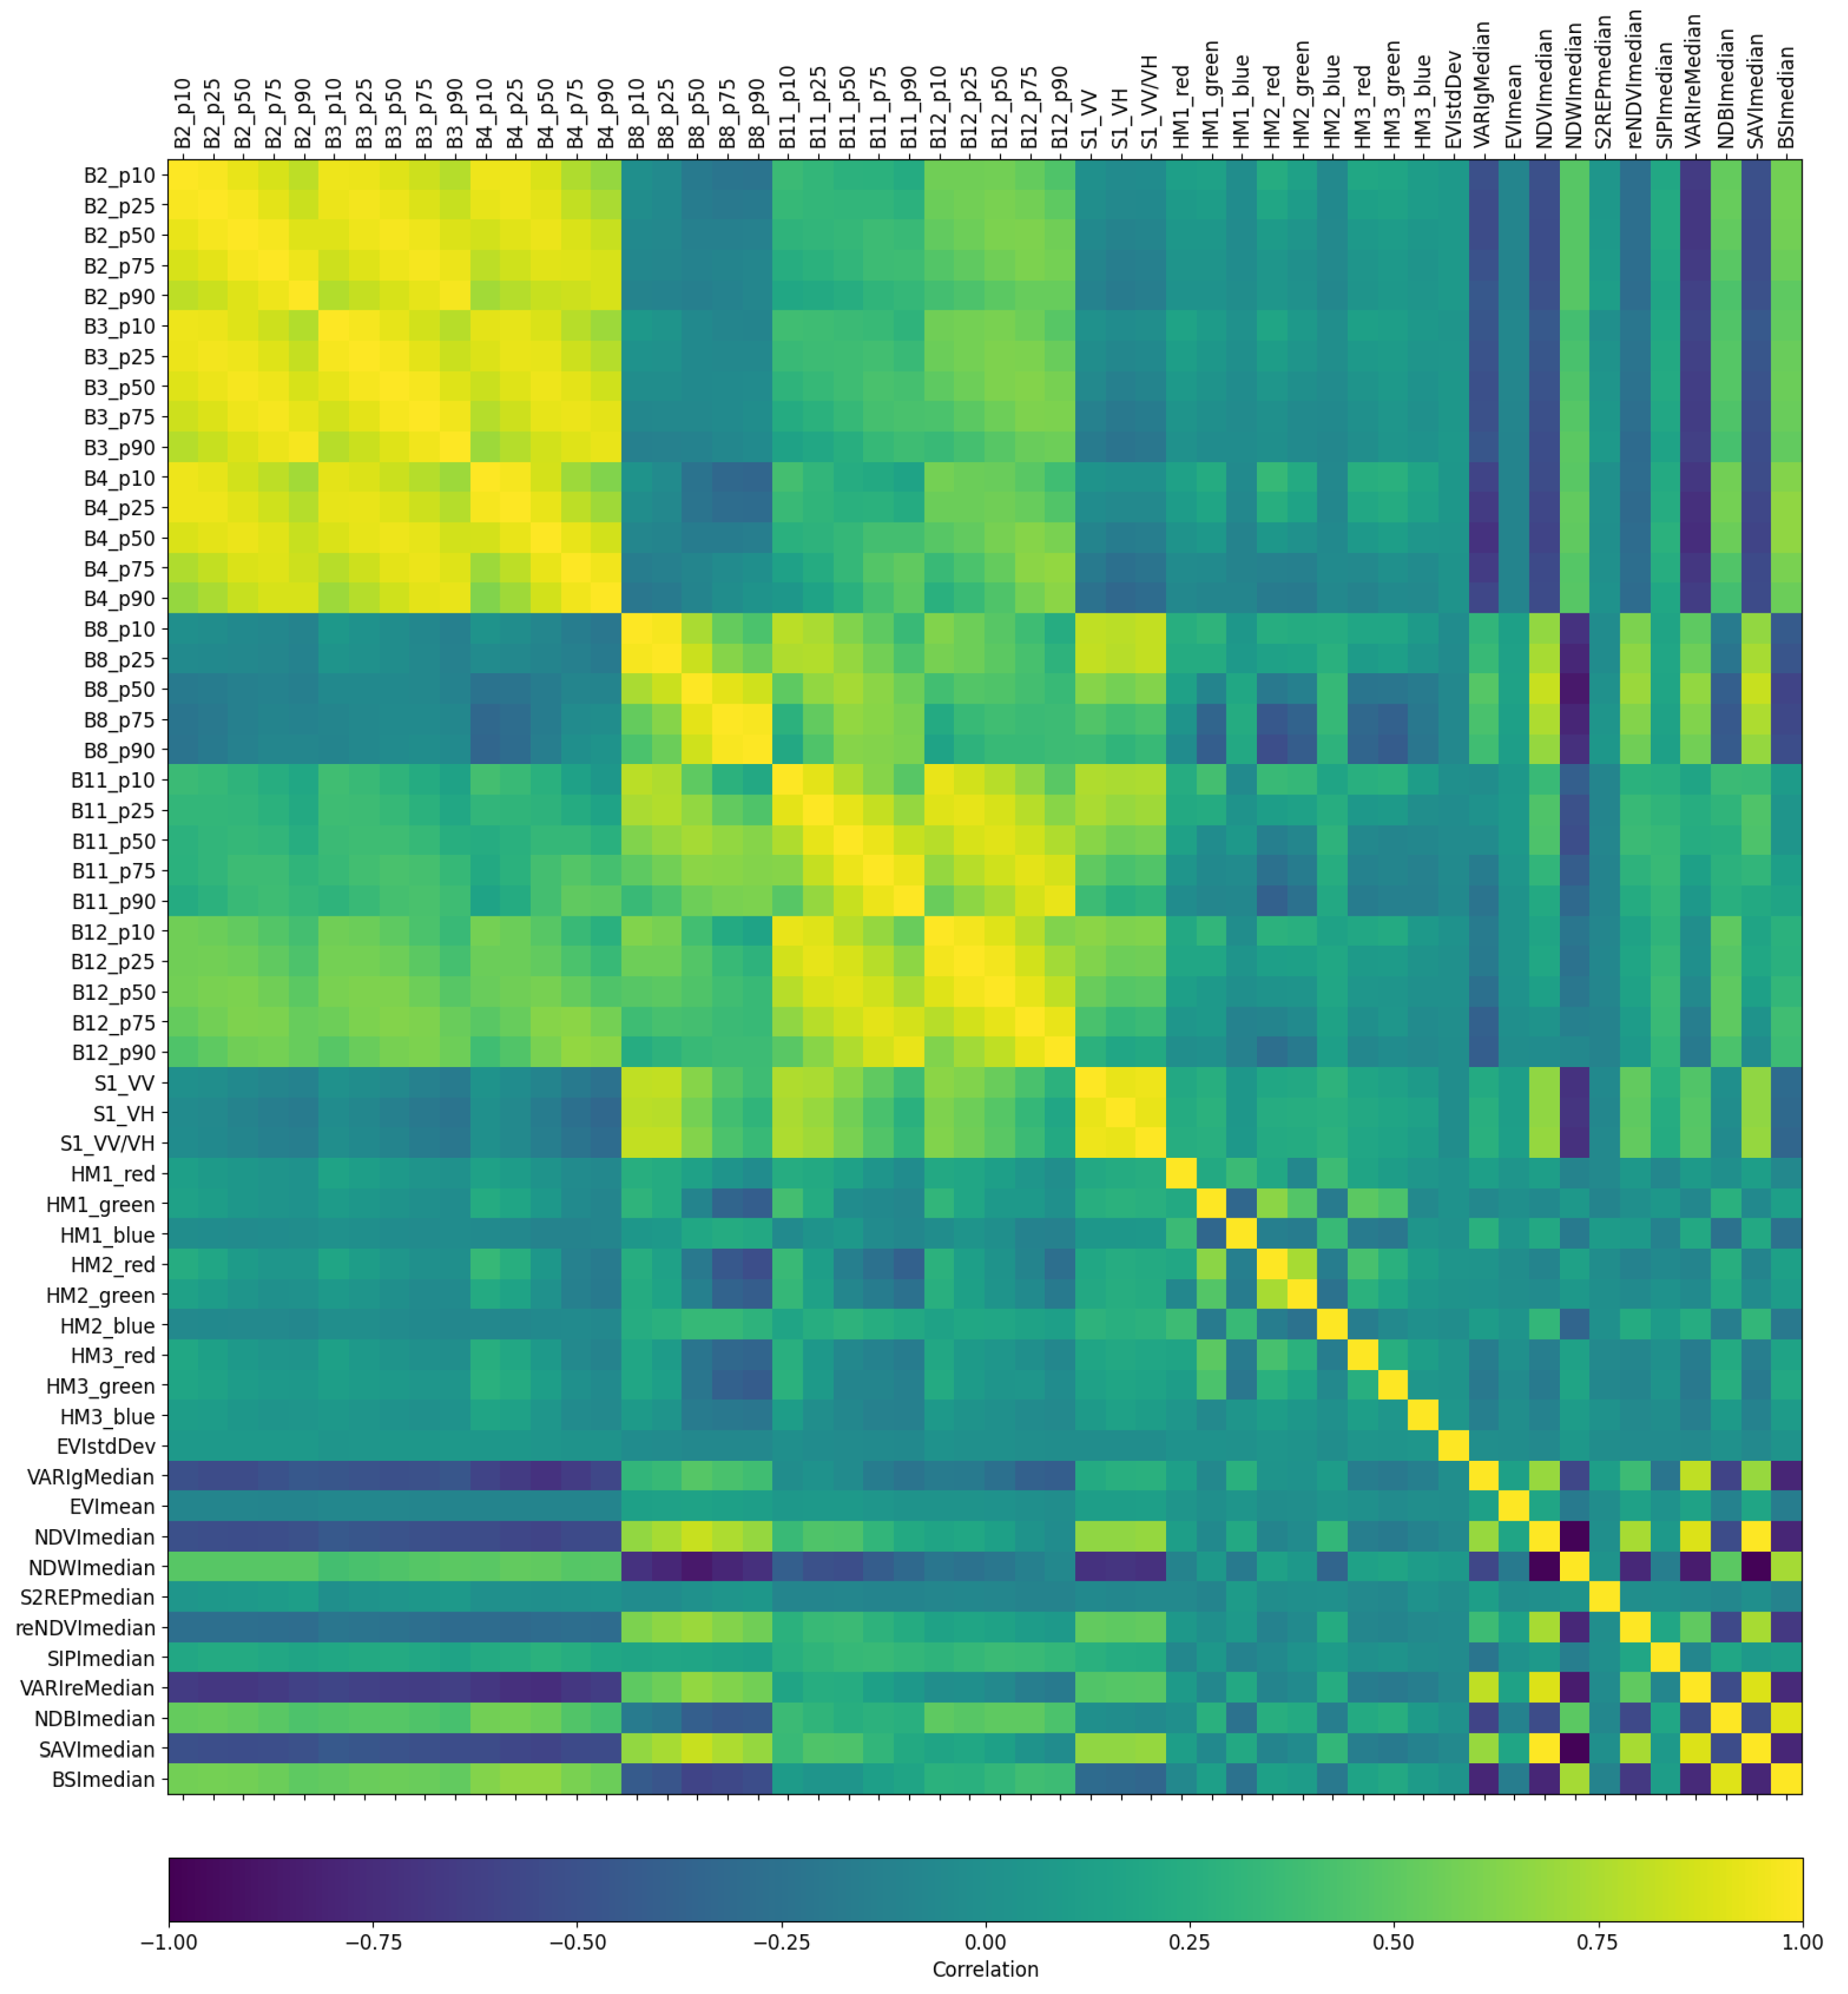
In order to identify redundancies between the input images, band correlations of the input images were calculated. This means that S1 data, phenological metrics (see Figure 7), quantile mapping and harmonic regression (see Figure 8) were compared. To discover those interactions between the input features, the calculation of pair-wise Pearson’s correlation coefficients helped to identify redundant variables (see Figure 9). Especially some of the phenological metrics correlate highly with the quantiles (e.g., the two VARI metrics and SAVI) and among each other (e.g., SAVI vs. NDVI). For a deeper exploration of the predictive accuracy, a sensitivity analysis was performed, whereby here the relevance of each feature input for the ML classifier to each class was evaluated. For this purpose, 15 additional classification models were trained, each time excluding one feature iteratively from the training image stack. Figure A2 and Figure A3 in the appendix illustrate that the image excluded stack’s accuracy deviation from the complete stack for each LULC. In general, quantile mapping, harmonic regression, and the S1 data deliver most of the needed information. Quantiles were particularly effective for separating tree crops and forest classes. The same is true for S1, which also had a significant impact on the Dragon Fruit UA. It is noteworthy that the harmonic models delivered a clear improvement for the distinction of the different rice classes. The examples in Figure 8 show the systematic patterns found in the NDVI signals by the application of the Fourier transformation. Vegetables and Water Melon show the highest deviations during the sensitivity analysis, whereby the first class was strongly dependent on phenological metrics and the second in terms of quantiles. The S1 mean composite adds significant improvement to the classification of Melaleuca, Vegetables, Orchards/Tree crops, and Dragon Fruit. T he inclusion of NDBI median had no noticeable effect on the classification of Urban/Settlements, likely because of the use of quantiles of Band 8 (NIR), which are also used in the NDBI calculation. The same applies for NDWI and the detection of Water bodies. The NDVI median’s noticeable effects relate to the UA of Sugarcane and Upland Crops/Rice alternating (Vegetables and Water Melon are discussed later). NDVIRed Edge and S2REP facilitated a similar improvement with a higher impact on Sugarcane prediction. A relevant influence of the EVI mean has not been detected in the workflow employed. The Sugarcane UA was also promoted by VARIGreen as well as VARIRed Edge, but no other classes were supported by the use of these two metrics. Finally, SIPI’s only impact on the quality of the classification was on Upland Crops/Rice alternating.

6. Discussion

The principal challenge of this study was the highly dynamic environment of the MRD, influenced by a myriad of factors including economic and political conditions, as well as reactions to changing climatic conditions such as water availability and saltwater intrusion. Rice cropping in the MRD, for example, does not follow the same chronological sequence every year. As demonstrated by Scarrott [16], some triple rice cropping patterns in one year switched to double rice in the following year. The data collected in this study confirmed these rapid changes. Therefore, the study’s approach and objective were to adapt to those dynamic changes, and therefore to include dynamic changes by incorporating dynamic factors into a static classification of the MRD using a three-year time series of active and passive remote sensing data.
Achieving an overall accuracy of 82.6% and a kappa of 0.81 on a pixel-based time series validated by a comprehensive reference dataset, this study achieved satisfactory results for a highly dynamic region of 40,000 km2. In the assessment of aquacultural ponds in the MRD based on Sentinel-1 data, Ottinger et al. [30] estimated a total area of 265,943 ha of aquaculture accounting for 6.8% of the total area of the MRD. Compared to the 12.2% (484,100 ha) estimated in our study, the aquacultural area and share almost doubled over 6 years.

6.1. Redundancy of Input Metric Information

The spectral distinction among the different target classes was conducted with the help of various metrics, which were in turn used as inputs to the random forest classifier. In terms of aquacultural ponds and other water bodies, the EVI mean did not have a significant impact on the classes’ accuracy. However, it delivered a better visual distinguishability of aquacultural ponds—except for those flooded year-round—and other water bodies. This is probably due to a better distinction of the edge areas (mixed pixels), which is a crucial factor to deal with in a time series analysis of a highly dynamic region, but it did not notably change the overall area and accuracy.
Both NDVI metrics had little, if any, effect on the outcome and the intended time-dependent density differences. Including the VARI metrics tried to address vegetation fraction later in the growing season, dynamics in rice patterns, and time-dependent density differences. A significant impact was only exerted on Sugarcane, which implies no additional effect on the dynamics detection. The SIPI median, designed to enhance the spectral detection of temporal dynamics, showed similar limitations.
Regarding Aquaculture, it is noteworthy that most of the training input images ad a negative effect on the PA, suggesting that including all training metrics might introduce more confusion, resulting in missing out on parts of the aquaculture classification. Albeit, these effects are not very strong. This indicates that by including all training metrics in the stack, more confusion is created, because more of what is called Aquaculture is missed out. The ineffectiveness of certain training features, especially on their intended purpose (e.g., the NDBI median for the built-up detection or the NDWI median for water body detection) likely does not stem from insufficient information content, but most likely from the fact that the needed information is already available through other training metrics. In class-specific applications that do not require computationally intensive methods such as quantile mapping, the various metrics can make a valuable contribution to detection. Further class-specific investigations are necessary for this.
The two lowest F1-scored classes, Vegetables and Water Melon, also show the highest deviations (in both directions), so the high impact of several phenological metrics might not be reliably evaluated in those cases.

6.2. Key Contributions of Quantile Mapping, Harmonic Regression, and Radar Data

The most valuable contributions were provided by quantile mapping, harmonic models, and Sentinel-1 data. In particular, the classification of natural, semi-natural, and cultivated tree classes benefited from the quantile’s ability to differentiate vegetation seasonalities and from the different backscatter behaviors of vegetation types when it comes to radar data.
The purpose and results of the Fourier transform to detect rice seasonalities can be described as consistent and successful, since all rice-related classes benefited significantly from the three models of one to three cycles.

7. Conclusions

The study presents a comprehensive analysis of sub-seasonal land use and land cover (LULC) dynamics in Vietnam’s Mekong Delta using a three-year time series of high-resolution satellite data from Sentinel-1 and Sentinel-2. By integrating quantile mapping and harmonic regression, a high level of accuracy was achieved, validated by extensive ground reference data, to capture the complex, dynamic patterns of land use in the region, and especially the differentiation between different rice cropping patterns.
The experimental data analysis revealed that the inclusion of quantile mapping and harmonic regression models significantly improved the detection of seasonal vegetation changes, particularly for rice cropping cycles. The radar data from Sentinel-1 further enhanced the distinction between vegetation types and filled gaps where optical data were obstructed by cloud cover, highlighting its value for tropical and subtropical agricultural monitoring.
The findings of this study have several practical applications for sustainable land management and agricultural planning in the Mekong Delta. The high-resolution LULC classification can help policymakers identify areas suitable for sustainable agricultural practices, such as organic farming or crop rotation, by providing timely and accurate information on crop cycles and land use dynamics. Additionally, the results can support water management strategies by identifying the spatial and temporal distribution of rice fields and aquaculture, which are crucial for planning irrigation and flood control measures.
While the beneficial combination of the high spatial and high temporal resolution of Sentinel-2 A/B is outstanding, the results could benefit from an even shorter repetition rate between two acquisitions, for instance to better capture the reflooding of paddy fields. Future research could focus on integrating more frequent satellite observations or additional data sources, such as higher-resolution commercial satellites or UAV imagery, to further refine crop monitoring and for the early detection of environmental stresses. Expanding the scope of quantile mapping and harmonic regression techniques to individual crops and specific agricultural practices could enhance the precision of remote sensing-based agricultural assessments. These improvements would not only benefit Vietnam’s Mekong Delta but could also be adapted to other dynamic agricultural regions worldwide facing similar challenges due to climate change and anthropogenic pressures.

Author Contributions

Conceptualization, N.K. and C.M.; methodology, N.K. and C.M.; formal data analysis, N.K.; writing—original draft preparation, N.K.; validation, N.K. and T.Q.V.; review and editing, N.K., T.Q.V., F.B., J.H., H.V., L.W. and C.M.; supervision, C.M.; project administration, L.W. and H.V.; resources, H.V. All authors have read and agreed to the published version of the manuscript.

Funding

This research was conducted within the OrganoRice project funded by the German Federal Ministry of Education and Research (BMBF) within the “CLIENT II—International Partnerships for Sustainable Innovations” funding initiative (Grant No. 01LZ1806A).

Data Availability Statement

For the time being, the raw data supporting the conclusions of this article will be made available by the authors upon request. A publication of our extensive database on land use, pesticides, and irrigation in the Mekong Delta is in progress.

Acknowledgments

Nguyen Kieu Diem (Land Resource Department, College of Environment and Natural Resources, Can Tho University, Vietnam), Huynh Nhat Hao, Huynh Trung Tinh, Ngo Thuat Ngon, Nguyen Duy Tan, Nguyen Thanh Toan, Nguyen Van Hoang Thanh, Pham Hoang Tu (students of Land Management at CTU conducting interviews with farmers in the MRD), Nicolas Charbonnier, Hugo Penelon, Sonia Phon-Lacroix (students at the Land Resources Department at CTU collecting reference data). Thank you for your valuable contributions.

Conflicts of Interest

The authors declare no conflicts of interest.

Abbreviations

The following abbreviations are used in this manuscript:
CTUCan Tho University
EVIEnhanced Vegetation Index
MLMachine Learning
MRDMekong River Delta
NDBINormalized Difference Built-up Index
NDVINormalized Difference Vegetation Index
NDWINormalized Difference Water Index
SA-AWSummer–Autumn—Autumn–Winter
SIPIStructure Insensitive Pigment Index
VARIVisible Atmospherically Resistant Index
WS-SAWinter–Spring—Summer–Autumn

Appendix A

Figure A1. Validation error matrix showing the user’s, producer’s and overall accuracy of the classification.
Remotesensing 16 03569 g0a1
Figure A2. Analysis of the accuracy deviation for the user’s accuracy.
Remotesensing 16 03569 g0a2
Figure A3. Analysis of the accuracy deviation for the producer’s accuracy.
Remotesensing 16 03569 g0a3

References

  1. Dawe, D.; Pandey, S.; Nelson, A.D. Emerging trends and spatial patterns of rice production. In Rice in the Global Economy: Strategic Research and Policy Issues for Food Security; Pandey, S., Byerlee, D., Dawe, D., Dobermann, A., Mohanty, S., Rozelle, S., Hardy, B., Eds.; International Rice Research Institute: Los Banos, Philippines, 2010; Chapter 1.1; pp. 15–35. [Google Scholar]
  2. Leinenkugel, P.; Kuenzer, C.; Oppelt, N.; Dech, S. Characterisation of land surface phenology and land cover based on moderate resolution satellite data in cloud prone areas—A novel product for the Mekong Basin. Remote. Sens. Environ. 2013, 136, 180–198. [Google Scholar] [CrossRef]
  3. Vu, H.T.D.; Tran, D.D.; Schenk, A.; Nguyen, C.P.; Vu, H.L.; Oberle, P.; Trinh, V.C.; Nestmann, F. Land use change in the Vietnamese Mekong Delta: New evidence from remote sensing. Sci. Total Environ. 2022, 813, 151918. [Google Scholar] [CrossRef] [PubMed]
  4. Mondal, A.; Le, M.H.; Lakshmi, V. Land use, climate, and water change in the Vietnamese Mekong Delta (VMD) using earth observation and hydrological modeling. J. Hydrol. Reg. Stud. 2022, 42, 101132. [Google Scholar] [CrossRef]
  5. Phan, H.; Toan, T.L.; Bouvet, A. Understanding dense time series of sentinel-1 backscatter from rice fields: Case study in a province of the mekong delta, Vietnam. Remote Sens. 2021, 13, 921. [Google Scholar] [CrossRef]
  6. Pham, L.H.; Pham, L.T.; Dang, T.D.; Tran, D.D.; Dinh, T.Q. Application of Sentinel-1 data in mapping land-use and land cover in a complex seasonal landscape: A case study in coastal area of Vietnamese Mekong Delta. Geocarto Int. 2022, 37, 3743–3760. [Google Scholar] [CrossRef]
  7. Sakamoto, T.; Van Nguyen, N.; Ohno, H.; Ishitsuka, N.; Yokozawa, M. Spatio-temporal distribution of rice phenology and cropping systems in the Mekong Delta with special reference to the seasonal water flow of the Mekong and Bassac rivers. Remote Sens. Environ. 2006, 100, 1–16. [Google Scholar] [CrossRef]
  8. Sakamoto, T.; Cao Van, P.; Kotera, A.; Nguyen Duy, K.; Yokozawa, M. Detection of yearly change in farming systems in the Vietnamese Mekong Delta from MODIS time-series imagery. Jpn. Agric. Res. Q. 2009, 43, 173–185. [Google Scholar] [CrossRef]
  9. Sakamoto, T.; Van Phung, C.; Kotera, A.; Nguyen, K.D.; Yokozawa, M. Analysis of rapid expansion of inland aquaculture and triple rice-cropping areas in a coastal area of the Vietnamese Mekong Delta using MODIS time-series imagery. Landsc. Urban Plan. 2009, 92, 34–46. [Google Scholar] [CrossRef]
  10. Chen, C.F.; Son, N.T.; Chang, L.Y.; Chen, C.R. Classification of rice cropping systems by empirical mode decomposition and linear mixture model for time-series MODIS 250 m NDVI data in the Mekong Delta, Vietnam. Int. J. Remote. Sens. 2011, 32, 5115–5134. [Google Scholar] [CrossRef]
  11. Chen, C.F.; Son, N.T.; Chang, L.Y.; Chen, C.C. Monitoring of soil moisture variability in relation to rice cropping systems in the Vietnamese Mekong Delta using MODIS data. Appl. Geogr. 2011, 31, 463–475. [Google Scholar] [CrossRef]
  12. Chen, C.F.; Son, N.T.; Chang, L.Y. Monitoring of rice cropping intensity in the upper Mekong Delta, Vietnam using time-series MODIS data. Adv. Space Res. 2012, 49, 292–301. [Google Scholar] [CrossRef]
  13. Son, N.T.; Chen, C.F.; Chen, C.R.; Duc, H.N.; Chang, L.Y. A phenology-based classification of time-series MODIS data for rice crop monitoring in Mekong Delta, Vietnam. Remote Sens. 2013, 6, 135–156. [Google Scholar] [CrossRef]
  14. Son, N.T.; Chen, C.F.; Chen, C.R.; Minh, V.Q.; Trung, N.H. A comparative analysis of multitemporal MODIS EVI and NDVI data for large-scale rice yield estimation. Agric. For. Meteorol. 2014, 197, 52–64. [Google Scholar] [CrossRef]
  15. Guan, X.; Huang, C.; Liu, G.; Meng, X.; Liu, Q. Mapping rice cropping systems in Vietnam using an NDVI-based time-series similarity measurement based on DTW distance. Remote Sens. 2016, 8, 19–44. [Google Scholar] [CrossRef]
  16. Scarrott, R. Extracting Gradient Boundaries Using Hyper-Temporal Image Analysis: Progress towards a Tool for Gradient Analysts. Master’s Thesis, University of Twente, Enschede, The Netherlands, 2009. [Google Scholar]
  17. Nguyen, T.T.H.; De Bie, C.A.J.M.; Ali, A.; Smaling, E.M.A.; Chu, T.H. Mapping the irrigated rice cropping patterns of the Mekong delta, Vietnam, through hyper-temporal SPOT NDVI image analysis. Int. J. Remote Sens. 2012, 33, 415–434. [Google Scholar] [CrossRef]
  18. Karila, K.; Nevalainen, O.; Krooks, A.; Karjalainen, M.; Kaasalainen, S. Monitoring Changes in Rice Cultivated Area from SAR and Optical Satellite Images in Ben Tre and Tra Vinh Provinces in Mekong Delta, Vietnam. Remote Sens. 2014, 6, 4090–4108. [Google Scholar] [CrossRef]
  19. Bouvet, A.; Le Toan, T. Use of ENVISAT/ASAR wide-swath data for timely rice fields mapping in the Mekong River Delta. Remote Sens. Environ. 2011, 115, 1090–1101. [Google Scholar] [CrossRef]
  20. Nguyen, T.T.; Berg, H.; Nguyen, H.T.T.; Nguyen, C.V. Effects of chlorpyrifos ethyl on acetylcholinesterase activity in climbing perch cultured in rice fields in the Mekong Delta, Vietnam. Ecotoxicol. Environ. Saf. 2015, 117, 34–40. [Google Scholar] [CrossRef] [PubMed]
  21. Chen, C.F.; Son, N.T.; Chen, C.R.; Chang, L.Y.; Chiang, S.H. Rice crop mapping using Sentinel-1A phenological metrics. In Proceedings of the International Archives of the Photogrammetry, Remote Sensing and Spatial Information Sciences—ISPRS Archives, Prague, Czech Republic, 12–19 July 2016. [Google Scholar] [CrossRef]
  22. Clauss, K.; Ottinger, M.; Kuenzer, C. Mapping rice areas with Sentinel-1 time series and superpixel segmentation. Int. J. Remote Sens. 2018, 39, 1399–1420. [Google Scholar] [CrossRef]
  23. Phung, H.P.; Nguyen, L.D.; Thong, N.H.; Thuy, L.T.; Apan, A.A. Monitoring rice growth status in the Mekong Delta, Vietnam using multitemporal Sentinel-1 data. J. Appl. Remote Sens. 2020, 14, 014518. [Google Scholar] [CrossRef]
  24. Thu, P.M.; Populus, J. Status and changes of mangrove forest in Mekong Delta: Case study in Tra Vinh, Vietnam. Estuarine Coast. Shelf Sci. 2007, 71, 98–109. [Google Scholar] [CrossRef]
  25. Nguyen, H.H.; McAlpine, C.; Pullar, D.; Johansen, K.; Duke, N.C. The relationship of spatial-temporal changes in fringe mangrove extent and adjacent land-use: Case study of Kien Giang coast, Vietnam. Ocean. Coast. Manag. 2013, 76, 12–22. [Google Scholar] [CrossRef]
  26. Tran Thi, V.; Tien Thi Xuan, A.; Phan Nguyen, H.; Dahdouh-Guebas, F.; Koedam, N. Application of remote sensing and GIS for detection of long-term mangrove shoreline changes in Mui Ca Mau, Vietnam. Biogeosciences 2014, 11, 3781–3795. [Google Scholar] [CrossRef]
  27. Nardin, W.; Locatelli, S.; Pasquarella, V.; Rulli, M.C.; Woodcock, C.E.; Fagherazzi, S. Dynamics of a fringe mangrove forest detected by Landsat images in the Mekong River Delta, Vietnam. Earth Surf. Process. Landforms 2016, 41, 2024–2037. [Google Scholar] [CrossRef]
  28. Bullock, E.L.; Fagherazzi, S.; Nardin, W.; Vo-Luong, P.; Nguyen, P.; Woodcock, C.E. Temporal patterns in species zonation in a mangrove forest in the Mekong Delta, Vietnam, using a time series of Landsat imagery. Cont. Shelf Res. 2017, 147, 144–154. [Google Scholar] [CrossRef]
  29. Vo, Q.T.; Oppelt, N.; Leinenkugel, P.; Kuenzer, C. Remote sensing in mapping mangrove ecosystems—An object-based approach. Remote Sens. 2013, 5, 183–201. [Google Scholar] [CrossRef]
  30. Ottinger, M.; Clauss, K.; Kuenzer, C. Large-Scale Assessment of Coastal Aquaculture Ponds with Sentinel-1 Time Series Data. Remote Sens. 2017, 9, 440. [Google Scholar] [CrossRef]
  31. Son, N.T.; Tu, N.A. Determinants of land-use change: A case study from the lower Mekong delta of southern Vietnam. Electron. Green J. 2008, 1, 1–12. [Google Scholar] [CrossRef]
  32. Leinenkugel, P.; Wolters, M.L.; Oppelt, N.; Kuenzer, C. Tree cover and forest cover dynamics in the Mekong Basin from 2001 to 2011. Remote. Sens. Environ. 2015, 158, 376–392. [Google Scholar] [CrossRef]
  33. Kuenzer, C.; Guo, H.; Huth, J.; Leinenkugel, P.; Li, X.; Dech, S. Flood mapping and flood dynamics of the mekong delta: ENVISAT-ASAR-WSM based time series analyses. Remote Sens. 2013, 5, 687–715. [Google Scholar] [CrossRef]
  34. Van Khanh Triet, N.; Viet Dung, N.; Fujii, H.; Kummu, M.; Merz, B.; Apel, H. Has dyke development in the Vietnamese Mekong Delta shifted flood hazard downstream? Hydrol. Earth Syst. Sci. 2017, 21, 3991–4010. [Google Scholar] [CrossRef]
  35. Kuenzer, C.; Leinenkugel, P.; Vollmuth, M.; Dech, S. Comparing global land-cover products—Implications for geoscience applications: An investigation for the trans-boundary Mekong Basin. Int. J. Remote Sens. 2014, 35, 2752–2779. [Google Scholar] [CrossRef]
  36. Kuenzer, C.; Heimhuber, V.; Huth, J.; Dech, S. Remote sensing for the quantification of land surface dynamics in large river delta regions—A review. Remote Sens. 2019, 11, 1985. [Google Scholar] [CrossRef]
  37. Poortinga, A.; Aekakkararungroj, A.; Kityuttachai, K.; Nguyen, Q.; Bhandari, B.; Thwal, N.S.; Priestley, H.; Kim, J.; Tenneson, K.; Chishtie, F.; et al. Predictive analytics for identifying land cover change hotspots in the mekong region. Remote Sens. 2020, 12, 1472. [Google Scholar] [CrossRef]
  38. Funkenberg, T.; Binh, T.T.; Moder, F.; Dech, S. The Ha Tien Plain—Wetland monitoring using remote-sensing techniques. Int. J. Remote Sens. 2014, 35, 2893–2909. [Google Scholar] [CrossRef]
  39. Nguyen, H.H.; Dargusch, P.; Moss, P.; Aziz, A.A. Land-use change and socio-ecological drivers of wetland conversion in Ha Tien Plain, Mekong Delta, Vietnam. Land Use Policy 2017, 64, 101–113. [Google Scholar] [CrossRef]
  40. Nguyen, H.; Pham Van, P.; Nguyen Thi Hong, D. Monitoring 15-year land use/land cover change in the Vietnamese Mekong Delta. Dong Thap Univ. J. Sci. 2022, 11, 93–103. [Google Scholar] [CrossRef]
  41. Liu, S.; Li, X.; Chen, D.; Duan, Y.; Ji, H.; Zhang, L.; Chai, Q.; Hu, X. Understanding Land use/Land cover dynamics and impacts of human activities in the Mekong Delta over the last 40 years. Glob. Ecol. Conserv. 2020, 22, e00991. [Google Scholar] [CrossRef]
  42. Dang, A.T.; Kumar, L.; Reid, M.; Nguyen, H. Remote sensing approach for monitoring coastal wetland in the mekong delta, vietnam: Change trends and their driving forces. Remote Sens. 2021, 13, 3359. [Google Scholar] [CrossRef]
  43. Gebhardt, S.; Nguyen, L.D.; Kuenzer, C. Mangrove Ecosystems in the Mekong Delta—Overcoming Uncertainties in Inventory Mapping Using Satellite Remote Sensing Data. In The Mekong Delta System: Interdisciplinary Analyses of a River Delta; Renaud, F.G., Kuenzer, C., Eds.; Springer: Dordrecht, The Netherlands, 2012. [Google Scholar] [CrossRef]
  44. Kuenzer, C.; Knauer, K. Remote sensing of rice crop areas. Int. J. Remote Sens. 2013, 34, 2101–2139. [Google Scholar] [CrossRef]
  45. Zhang, Y.; Xu, N.; Li, N.; Guo, Z. A Multi-Domain Joint Novel Method for ISAR Imaging of Multi-Ship Targets. Remote Sens. 2023, 15, 4878. [Google Scholar] [CrossRef]
  46. Chen, Y.; Lv, J.; Yue, W.; Zhao, Y.; Qin, Y.; Tao, J.; Chen, C.; Wang, W.; Liang, J. A Snapshot Infrared Imaging Fourier Transform Spectrometer for Dynamic Target Detection. Remote Sens. 2022, 14, 1543. [Google Scholar] [CrossRef]
  47. Mudiyanselage, S.D.; Wilkinson, B.; Abd-Elrahman, A. Automated High-Resolution Bathymetry from Sentinel-1 SAR Images in Deeper Nearshore Coastal Waters in Eastern Florida. Remote Sens. 2024, 16, 1. [Google Scholar] [CrossRef]
  48. Rocchini, D.; Metz, M.; Ricotta, C.; Landa, M.; Frigeri, A.; Neteler, M. Fourier transforms for detecting multitemporal landscape fragmentation by remote sensing. Int. J. Remote Sens. 2013, 34, 8907–8916. [Google Scholar] [CrossRef]
  49. Moody, A.; Johnson, D.M. Land-surface phenologies from AVHRR using the discrete Fourier transform. Remote Sens. Environ. 2001, 75, 305–323. [Google Scholar] [CrossRef]
  50. Melendez-Pastor, I.; Navarro-Pedreño, J.; Koch, M.; Gómez, I.; Hernández, E.I. Land-cover phenologies and their relation to climatic variables in an anthropogenically impacted mediterranean coastal area. Remote Sens. 2010, 2, 697–716. [Google Scholar] [CrossRef]
  51. Song, B.; Min, S.; Yang, H.; Wu, Y.; Wang, B. A Fourier Frequency Domain Convolutional Neural Network for Remote Sensing Crop Classification Considering Global Consistency and Edge Specificity. Remote Sens. 2023, 15, 4788. [Google Scholar] [CrossRef]
  52. Wen, L.; Mason, T.; Powell, M.; Ling, J.; Ryan, S.; Bernich, A.; Gufu, G. Improved Wetland Mapping of a Highly Fragmented Agricultural Landscape Using Land Surface Phenological Features. Remote Sens. 2024, 16, 1786. [Google Scholar] [CrossRef]
  53. Yang, F.; Liu, S.; Wang, Q.; Liu, T.; Li, S. Assessing waterlogging stress level of winter wheat from hyperspectral imagery based on harmonic analysis. Remote Sens. 2022, 14, 122. [Google Scholar] [CrossRef]
  54. Sobe, C.; Hirschmugl, M.; Wimmer, A. Sentinel-2 time series analysis for identification of underutilized land in europe. Remote Sens. 2021, 13, 4920. [Google Scholar] [CrossRef]
  55. Pastick, N.J.; Wylie, B.K.; Wu, Z. Spatiotemporal analysis of Landsat-8 and Sentinel-2 data to support monitoring of dryland ecosystems. Remote Sens. 2018, 10, 791. [Google Scholar] [CrossRef]
  56. Migolet, P.; Goïta, K. Evaluation of FORMOSAT-2 and planetscope imagery for aboveground oil palm biomass estimation in a mature plantation in the Congo Basin. Remote Sens. 2020, 12, 2926. [Google Scholar] [CrossRef]
  57. Nguyen, M.D.; Baez-Villanueva, O.M.; Bui, D.D.; Nguyen, P.T.; Ribbe, L. Harmonization of landsat and sentinel 2 for crop monitoring in drought prone areas: Case studies of Ninh Thuan (Vietnam) and Bekaa (Lebanon). Remote Sens. 2020, 12, 281. [Google Scholar] [CrossRef]
  58. Philipp, M.; Wegmann, M.; Kübert-Flock, C. Quantifying the response of german forests to drought events via satellite imagery. Remote Sens. 2021, 13, 1845. [Google Scholar] [CrossRef]
  59. Sato, M. Utilization of woody biomass in Southeast Asia: Melaleuca in the Mekong delta region. J. Agric. Dev. Stud. 2009, 20, 15–21. [Google Scholar]
  60. GSOV. General Statistics Office of Vietnam. Available online: https://www.gso.gov.vn/en/homepage/ (accessed on 27 April 2024).
  61. Kontgis, C.; Schneider, A.; Ozdogan, M. Mapping rice paddy extent and intensification in the Vietnamese Mekong River Delta with dense time stacks of Landsat data. Remote Sens. Environ. 2015, 169, 255–269. [Google Scholar] [CrossRef]
  62. Tong, Y.D. Rice Intensive Cropping and Balanced Cropping in the Mekong Delta, Vietnam—Economic and Ecological Considerations. Ecol. Econ. 2017, 132, 205–212. [Google Scholar] [CrossRef]
  63. Renaud, F.G.; Le, T.T.H.; Lindener, C.; Guong, V.T.; Sebesvari, Z. Resilience and shifts in agro-ecosystems facing increasing sea-level rise and salinity intrusion in Ben Tre Province, Mekong Delta. Clim. Chang. 2015, 133, 69–84. [Google Scholar] [CrossRef]
  64. Gorelick, N.; Hancher, M.; Dixon, M.; Ilyushchenko, S.; Thau, D.; Moore, R. Google Earth Engine: Planetary-scale geospatial analysis for everyone. Remote Sens. Environ. 2017, 202, 18–27. [Google Scholar] [CrossRef]
  65. Barroso, L.A.; Clidaras, J.; Hölzle, U. The Datacenter as a Computer: An Introduction to the Design of Warehouse-Scale Machines, 2nd ed.; Springer Nature: Cham, Switzerland, 2013; p. 154. [Google Scholar] [CrossRef]
  66. Earth Observation and Modeling Facility. Global Geo-Referenced Field Photo Library. 2013. Available online: https://www.ceom.ou.edu/photos/ (accessed on 20 September 2024).
  67. Congalton, R.G.; Green, K. Assessing the Accuracy of Remotely Sensed Data Principles and Practices, 3rd ed.; CRC Press: Boca Raton, FL, USA, 2019. [Google Scholar]
  68. Main-Knorn, M.; Pflug, B.; Louis, J.; Debaecker, V.; Müller-Wilm, U.; Gascon, F. Sen2Cor for Sentinel-2. In Proceedings of the Image and Signal Processing for Remote Sensing XXIII, Warsaw, Poland, 11–13 September 2017; p. 3. [Google Scholar] [CrossRef]
  69. Batič, M. Sentinel Hub Cloud Detector—s2cloudless. 2018. Available online: https://medium.com/sentinel-hub/sentinel-hub-cloud-detector-s2cloudless-a67d263d3025 (accessed on 14 July 2023).
  70. Skakun, S.; Wevers, J.; Brockmann, C.; Doxani, G.; Aleksandrov, M.; Batič, M.; Frantz, D.; Gascon, F.; Gómez-Chova, L.; Hagolle, O.; et al. Cloud Mask Intercomparison eXercise (CMIX): An evaluation of cloud masking algorithms for Landsat 8 and Sentinel-2. Remote Sens. Environ. 2022, 274, 112990. [Google Scholar] [CrossRef]
  71. Hollstein, A.; Segl, K.; Guanter, L.; Brell, M.; Enesco, M. Ready-to-use methods for the detection of clouds, cirrus, snow, shadow, water and clear sky pixels in Sentinel-2 MSI images. Remote Sens. 2016, 8, 666–684. [Google Scholar] [CrossRef]
  72. Griffiths, P.; Müller, D.; Kuemmerle, T.; Hostert, P. Agricultural land change in the Carpathian ecoregion after the breakdown of socialism and expansion of the European Union. Environ. Res. Lett. 2013, 8, 045024. [Google Scholar] [CrossRef]
  73. Hansen, M.; Potapov, P.; Moore, R.; Hancher, M.; Turubanova, S.; Tyukavina, A.; Thau, D.; Stehman, S.; Goetz, S.; Loveland, T.; et al. High-Resolution Global Maps of 21st-Century Forest Cover Change. Science 2013, 342, 850–853. [Google Scholar] [CrossRef] [PubMed]
  74. Müller, H.; Rufin, P.; Griffiths, P.; Barros Siqueira, A.J.; Hostert, P. Mining dense Landsat time series for separating cropland and pasture in a heterogeneous Brazilian savanna landscape. Remote Sens. Environ. 2015, 156, 490–499. [Google Scholar] [CrossRef]
  75. Rufin, P.; Müller, H.; Pflugmacher, D.; Hostert, P. Land use intensity trajectories on Amazonian pastures derived from Landsat time series. Int. J. Appl. Earth Obs. Geoinf. 2015, 41, 1–10. [Google Scholar] [CrossRef]
  76. Leinenkugel, P.; Wolters, M.L.; Kuenzer, C.; Oppelt, N.; Dech, S. Sensitivity analysis for predicting continuous fields of tree-cover and fractional land-cover distributions in cloud-prone areas. Int. J. Remote Sens. 2014, 35, 2799–2821. [Google Scholar] [CrossRef]
  77. Mack, B.; Leinenkugel, P.; Kuenzer, C.; Dech, S. A semi-automated approach for the generation of a new land use and land cover product for Germany based on Landsat time-series and Lucas in-situ data. Remote Sens. Lett. 2017, 8, 244–253. [Google Scholar] [CrossRef]
  78. Koenker, R. Quantile Regression; Cambridge University Press: Cambridge, UK, 2005. [Google Scholar]
  79. Li, X.; Wu, H.; Nanding, N.; Chen, S.; Hu, Y.; Li, L. Statistical Bias Correction of Precipitation Forecasts Based on Quantile Mapping on the Sub-Seasonal to Seasonal Scale. Remote Sens. 2023, 15, 1743. [Google Scholar] [CrossRef]
  80. Huang, Y.; Wu, C.; Chen, M.; Yang, J.; Ren, H. A quantile approach for retrieving the “core urban-suburban-rural” (USR) structure based on nighttime light. Remote Sens. 2020, 12, 4179. [Google Scholar] [CrossRef]
  81. Allen, A.W.; Cade, B.S.; Vandever, M.W. Effects of emergency haying on vegetative characteristics within selected conservation reserve program fields in the northern Great Plains. J. Soil Water Conserv. 2001, 56, 120–125. [Google Scholar]
  82. Zha, Y.; Gao, J.; Ni, S. Use of normalized difference built-up index in automatically mapping urban areas from TM imagery. Int. J. Remote. Sens. 2003, 24, 583–594. [Google Scholar] [CrossRef]
  83. Huete, A.; Didan, K.; Miura, T.; Rodriguez, E.P.; Gao, X.; Ferreira, L.G. Overview of the radiometric and biophysical performance of the MODIS vegetation indices. Remote Sens. Environ. 2002, 83, 195–213. [Google Scholar] [CrossRef]
  84. Jakubauskas, M.; Legates, D.; Kastens, J. Harmonic Analysis of Time-series AVHRR NDVI Data. Photogramm. Eng. Remote Sens. 2001, 67, 461–470. [Google Scholar]
  85. Jakubauskas, M.E.; Legates, D.R.; Kastens, J.H. Crop identification using harmonic analysis of time-series AVHRR NDVI data. Comput. Electron. Agric. 2002, 37, 127–139. [Google Scholar] [CrossRef]
  86. Shumway, R.H.; Stoffer, D.S. Time Series Analysis and Applications, 4th ed.; Springer: New York, NY, USA, 2016. [Google Scholar]
  87. Gitelson, A.A.; Kaufman, Y.J.; Stark, R.; Rundquist, D. Novel algorithms for remote estimation of vegetation fraction. Remote. Sens. Environ. 2002, 80, 76–87. [Google Scholar] [CrossRef]
  88. Penuelas, J.; Baret, F.; Filella, I. Semi-Empirical Indices to Assess Carotenoids/Chlorophyll-a Ratio from Leaf Spectral Reflectance. Photosynthetica 1995, 31, 221–230. [Google Scholar]
  89. Rouse, J.W.; Haas, R.H.; Schell, J.A.; Deering, D.W.; Harlan, J.C. Monitoring vegetation systems in the Great Plains with ERTS. In Proceedings of the Third ERTS Symposium, Washington, DC, USA, 10–14 December 1973; pp. 309–317. [Google Scholar]
  90. Delegido, J.; Verrelst, J.; Meza, C.M.; Rivera, J.P.; Alonso, L.; Moreno, J. A red-edge spectral index for remote sensing estimation of green LAI over agroecosystems. Eur. J. Agron. 2013, 46, 42–52. [Google Scholar] [CrossRef]
  91. Agapiou, A.; Lysandrou, V.; Hadjimitsis, D.G. Earth observation contribution to cultural heritage disaster risk management: Case study of eastern mediterranean open air archaeological monuments and sites. Remote Sens. 2020, 12, 1330. [Google Scholar] [CrossRef]
  92. Frampton, W.J.; Dash, J.; Watmough, G.; Milton, E.J. Evaluating the capabilities of Sentinel-2 for quantitative estimation of biophysical variables in vegetation. ISPRS J. Photogramm. Remote Sens. 2013, 82, 83–92. [Google Scholar] [CrossRef]
  93. Gao, B.C. NDWI—A normalized difference water index for remote sensing of vegetation liquid water from space. Remote Sens. Environ. 1996, 58, 257–266. [Google Scholar] [CrossRef]
  94. Hayes, M.M.; Miller, S.N.; Murphy, M.A. High-resolution landcover classification using random forest. Remote Sens. Lett. 2014, 5, 112–121. [Google Scholar] [CrossRef]
Figure 1. The Mekong River Delta (marked green in the overview) in Vietnam (red), its provincial division, and the location of collected reference data points.
Remotesensing 16 03569 g001
Figure 2. Workflow of the LULC analysis with data collection, input features used for classification, and final uncertainty analysis.
Remotesensing 16 03569 g002
Figure 3. (a) Harmonic curve representative of the first harmonic term and (b) curves for the first, second, and third harmonic terms (after [84]).
Remotesensing 16 03569 g003
Figure 4. LULC classification based on Sentinel-2 and -1 time series (2021–2023) of the Mekong River Delta with detailed sub-figures of An Giang/Dong Thap (left) and Ben Tre/Tra Vinh (right).
Remotesensing 16 03569 g004
Figure 5. LULC distribution of the Mekong River Delta 2021–2023. The three small boxes belong to the minor classes Pineapple/Coconut mixed (0.4%), Water Melon (0.1%), and Casuarina Forest (0.1%).
Remotesensing 16 03569 g005
Figure 6. F1 score for the 18 classes of the time series analysis.
Remotesensing 16 03569 g006
Figure 7. Exemplary illustrations of vegetation metrics that support the differentiation of different land use types.
Remotesensing 16 03569 g007
Figure 8. Time−dependent spectral progression of two exemplary rice and aquaculture classes derived from NDVI signals including harmonic fitting.
Remotesensing 16 03569 g008aRemotesensing 16 03569 g008b
Figure 9. Pair-wise Pearson correlation matrix of each training image. “Bx_py” refers to the calculated quantile band (Band x; quantile y). “HMx_y” refers to the calculated harmonic regression (Harmonic Model term x; Band y).
Remotesensing 16 03569 g009
Table 1. Applied satellite data.
Sentinel-2Sentinel-1
Sensor TypePassive opticalActive radar
Aqcuisition mode-IWS
Spatial resolution10–60 m10 m
Polarisation-Single (VV,VH), Dual (VV-VH)
Pre-processingLevel-2A harmonized (BOA)Level-1 GRD
Temporal resolution5 days6 days
Time period1 January 2021–31 December 20231 January 2021–31 December 2023
Image count30471013
Product size500 MB1 GB
Data volume1.5 TB1.1 TB
Table 2. Applied parameters, the relevant spectral and radar features, and their purpose.
Spectral/SAR FeaturesStatistical ParametersPurpose
Blue, green, red, NIR, SWIR1, SWIR210th, 25th, 50th, 75th, and 90th quantilesWide range of temporally focused spectral information for vegetation seasonality
First, second, and third terms from NDVI harmonic analysisAmplitude, PhaseRice seasonality
S1 backscatter dual polarization VV-VH; S1 backscatter single polarization VV, VHMeanGap-filling of areas with low image per-pixel count (cloud independence); different backscatter behavior of vegetation
Normalized Difference Vegetation Index (NDVI) [89]MedianCapturing of broad dividable vegetation spectrum in the MRD
NDVIRed Edge [90,91]MedianSensitivity for time-dependent density differences (e.g., harvest)
Enhanced Vegetation Index (EVI) [61]MeanDifferentiation between aquacultural ponds and other water bodies
EVIStandard DeviationCapture variability of rice fields being systematically flooded and vegetated
Visible Atmospherically Resistant Index (VARIGreen and VARIRed Edge) [87]MedianVegetation fraction and leaf area later in growing season; close distances between different cropping patterns; spectrally confusing overlaps; rice-pattern dynamics
Structure Insensitive Pigment Index (SIPI) [88]MedianTemporally dynamic vegetation: sensitivity to the ratio of bulk carotenoids to chlorophyll
Sentinel-2 Red Edge Position (S2REP) [92]MedianSensitive to changes in chlorophyll concentration
Normalized Difference Built-up Index (NDBI) [82]MedianUrban structures
Normalized Difference Water Index (NDWI) [93]MedianWater bodies
Table 3. Description of the final 18 classes supported by local knowledge and their sample distribution. Casuarina accuracy is calculated by cross-validation due to lack of reference data.
ClassDescriptionTraining/Validation Samples
Water bodiesAll water bodies, including rivers, lakes, canals, sea water, excluding aquaculture50/21
Urban/SettlementsHuman settlements: urban areas, villages, lakeside dwellings50/22
MangrovesHalophytes adapted to the brackish saline conditions in tropical coastal regions50/10
Evergreen ForestEvergreen broadleaf forest, wood- and shrubland50/44
Melaleuca ForestSeasonally flooded forest with Melaleuca cajuputi as dominant species50/28
CasuarinaEvergreen shrubs and trees on low-fertility coastal sands24/16
AquacultureShrimp and fish farming, also salt cultivation50/42
Double-cropped Rice SA-AWDouble-season rice usually cultivated between April and August (Summer–Autumn) and August and January (Autumn–Winter)60/20
Double-cropped Rice WS-SADouble-season rice usually cultivated between November and May (Winter–Spring) and April and August (Summer–Autumn)60/47
Triple-cropped RiceTriple-season rice usually cultivated in all three seasons (WS-SA-AW)60/99
Aquaculture/Rice alternatingAlternating cultivation of aquaculture (primarily shrimp) and single season rice usually cultivated between August and January (Autumn–Winter)50/43
Upland Crops/Rice alternatingAlternating cultivation of upland crops and single season rice30/20
VegetablesCultivated taro, lotus, and counting50/11
Orchards, Tree CropsCultivated durian, mandarin, longan, mango, orange, pummelo, rambutan, banana, avocado, mangosteen, jujube, acerola, eggplant, papaya, and counting50/116
Pineapple, CoconutCultivated pineapple and coconut tree crops40/20
SugarcaneCultivated sugarcane50/25
Dragon FruitCultivated dragon fruit50/14
Water MelonCultivated water melon40/15
Disclaimer/Publisher’s Note: The statements, opinions and data contained in all publications are solely those of the individual author(s) and contributor(s) and not of MDPI and/or the editor(s). MDPI and/or the editor(s) disclaim responsibility for any injury to people or property resulting from any ideas, methods, instructions or products referred to in the content.