Article

Seamless Weather Data Integration in Trajectory-Based Operations Utilizing Geospatial Information

1
Satellite Communication Research Division, Electronics and Telecommunications Research Institute (ETRI), Daejeon 34129, Republic of Korea
2
Division of Earth Environmental System Science (Major of Spatial Information System Engineering), Pukyong National University, Busan 48513, Republic of Korea
*
Author to whom correspondence should be addressed.
Remote Sens. 2024, 16(19), 3573; https://doi.org/10.3390/rs16193573
Submission received: 13 August 2024 / Revised: 20 September 2024 / Accepted: 24 September 2024 / Published: 25 September 2024
(This article belongs to the Special Issue International Symposium on Remote Sensing (ISRS2024))

Abstract

:
In this study, a 4D trajectory weather (4DT-Wx) prototype system was developed and evaluated for effective weather information integration in trajectory-based operation (TBO) environments. The system has two key distinguishing features: multi-model-based trajectory services and buffer zone information provision. We constructed a distributed processing system using Apache Spark, enabling the efficient processing of large-scale weather data. The performance evaluation demonstrated excellent scalability and efficiency in processing large-scale data. An analysis of the buffer configurations highlighted that buffer zone information is valuable in decision-making processes and has the potential to enhance the system performance. The system’s practical applicability is presented through visualizations of the extracted weather information. This system is expected to enhance aviation safety and operational efficiency, providing a foundation for addressing increasingly complex weather conditions and flight scenarios in the future. The approach presented in this study marks a significant step toward effective TBO implementation and the advancement of future air traffic management. The evaluation of the 4DT-Wx system analyzed the accuracy of weather data processing and the performance of distributed processing, finding that the temperature (T) estimation had the highest accuracy, and that the parallel processing using Apache Spark was most effectively modeled by Ahmed et al.’s model. The findings suggest the potential for further optimization in integrating various weather models and developing algorithms to enhance their utilization.
Keywords:
ATM; integration; TBO; 4DT; weather

1. Introduction

The International Civil Aviation Organization (ICAO) established the Global Air Navigation Plan (GANP) to fundamentally transform air traffic management (ATM). This plan presents a forward-looking strategy for navigation that needs to be adopted by countries worldwide [1,2,3,4,5]. The evolution of the global air transport system necessitates an ATM system capable of providing services that meet predefined performance levels.
Weather information is a critical component of air transport systems because of its significant impact on operations and must be considered in the context of gate-to-gate or en route operations [6,7,8,9]. This provides crucial information for resource allocation, service provision, and determining expected outcomes.
As the global air transport system evolves, the way weather information is provided, exchanged, integrated, and utilized must also change. The evolution of weather information provision in air traffic management is expected to bring significant improvements. These include enhanced data resolution and frequency, the integration of multiple data sources, real-time processing capabilities, and customized information delivery. A higher resolution and more frequent updates will provide more accurate weather forecasts. The integration of various weather models and observational data will offer comprehensive and reliable information. Real-time processing will enable quick analysis and the application of large-scale weather data. Customized information delivery will cater to specific flight phases and operational needs. These advancements will support more precise and dynamic flight planning and operations in the Trajectory-Based Operations (TBO) environment, ultimately enhancing the efficiency and safety of air traffic management. At the core of this change is trajectory-based operations (TBOs) [10]. The ICAO has proposed TBOs as part of its GANP, with Europe (SESAR) and the United States (NextGen) playing leading roles in its development and implementation [11,12,13]. TBOs aim to increase airspace resource utilization, achieve more precise flight control, improve fuel efficiency, and reduce the environmental impact through enhanced predictability and coordination in global ATM systems.
As TBO becomes increasingly popular, a highly accurate trajectory prediction becomes more crucial, not only for optimizing airspace resources, but also for improving ATM efficiency and reducing flight delays [14]. TBO is defined as “considering the trajectory of aircraft in all flight phases and managing the interaction of that trajectory with other trajectories or hazards to achieve the optimum system outcome” [15].
The transition from current aircraft position-tracking ATM to TBO is crucial for improving flight planning efficiency [14,15]. The TBO approach enables the dynamic trajectory information sharing among air navigation service providers (ANSPs) within and beyond flight information regions (FIRs), allowing ATM to predict future scenarios using 3D (x, y, z) and 4D (x, y, z, t) data.
The effective implementation of TBO requires significant improvements in weather information systems, particularly in terms of data availability, accuracy, resolution, and service quality. Recent studies have focused on enhancing the robustness, accuracy, and efficiency of aircraft trajectory optimization and prediction under uncertain and dynamic weather conditions [16,17,18,19,20,21,22]. These advancements are being achieved through machine learning-based prediction models, multi-objective optimization techniques, and the utilization of ensemble weather forecasts.
However, research from a meteorological perspective on TBOs and the development of weather data availability and service aspects for TBO weather integration remain insufficient. The importance of improved weather integration in TBO systems is emphasized from multiple angles. Accurate weather information contributes to enhanced flight safety through hazardous weather avoidance, increased operational efficiency through optimal route selection, minimized environmental impact through precise flight planning, and improved overall airspace utilization through flexible airspace management. These factors play a crucial role in the successful implementation of TBO and the overall improvement of air traffic management system performance. This gap highlights the critical need for improved weather integration in TBO systems.
The challenge is exemplified by the vast amounts of data generated by high-resolution numerical prediction models for aviation weather. For instance, a model centered on the Incheon Airport, based on LDAPS (Local Data Assimilation and Prediction System) data, predicts a 1000 × 1000 km area with 1 km resolution across 50 vertical layers for 36 h. This generates 3.6 billion data points for a single variable. When considering multiple weather variables, such as the wind direction WD, wind speed WS, and temperature T, the data scale increases exponentially. The effective integration of these large-scale datasets into TBO systems presents a major current challenge in the field. Addressing this challenge is crucial for realizing the full potential of weather-integrated TBOs and improving the overall flight efficiency and safety.
Some institutions are already providing 4D-trajectory (4DT) services. For instance, the UK MET Office offers a 4DT application programming interface (API) service that utilizes 10 km grid global model data to provide high-resolution weather information [23]. The 4DT API service developed in this study has two significant differences from existing services:
  • A multi-model-based trajectory service that combines the strengths of various weather models to provide more accurate and reliable weather information;
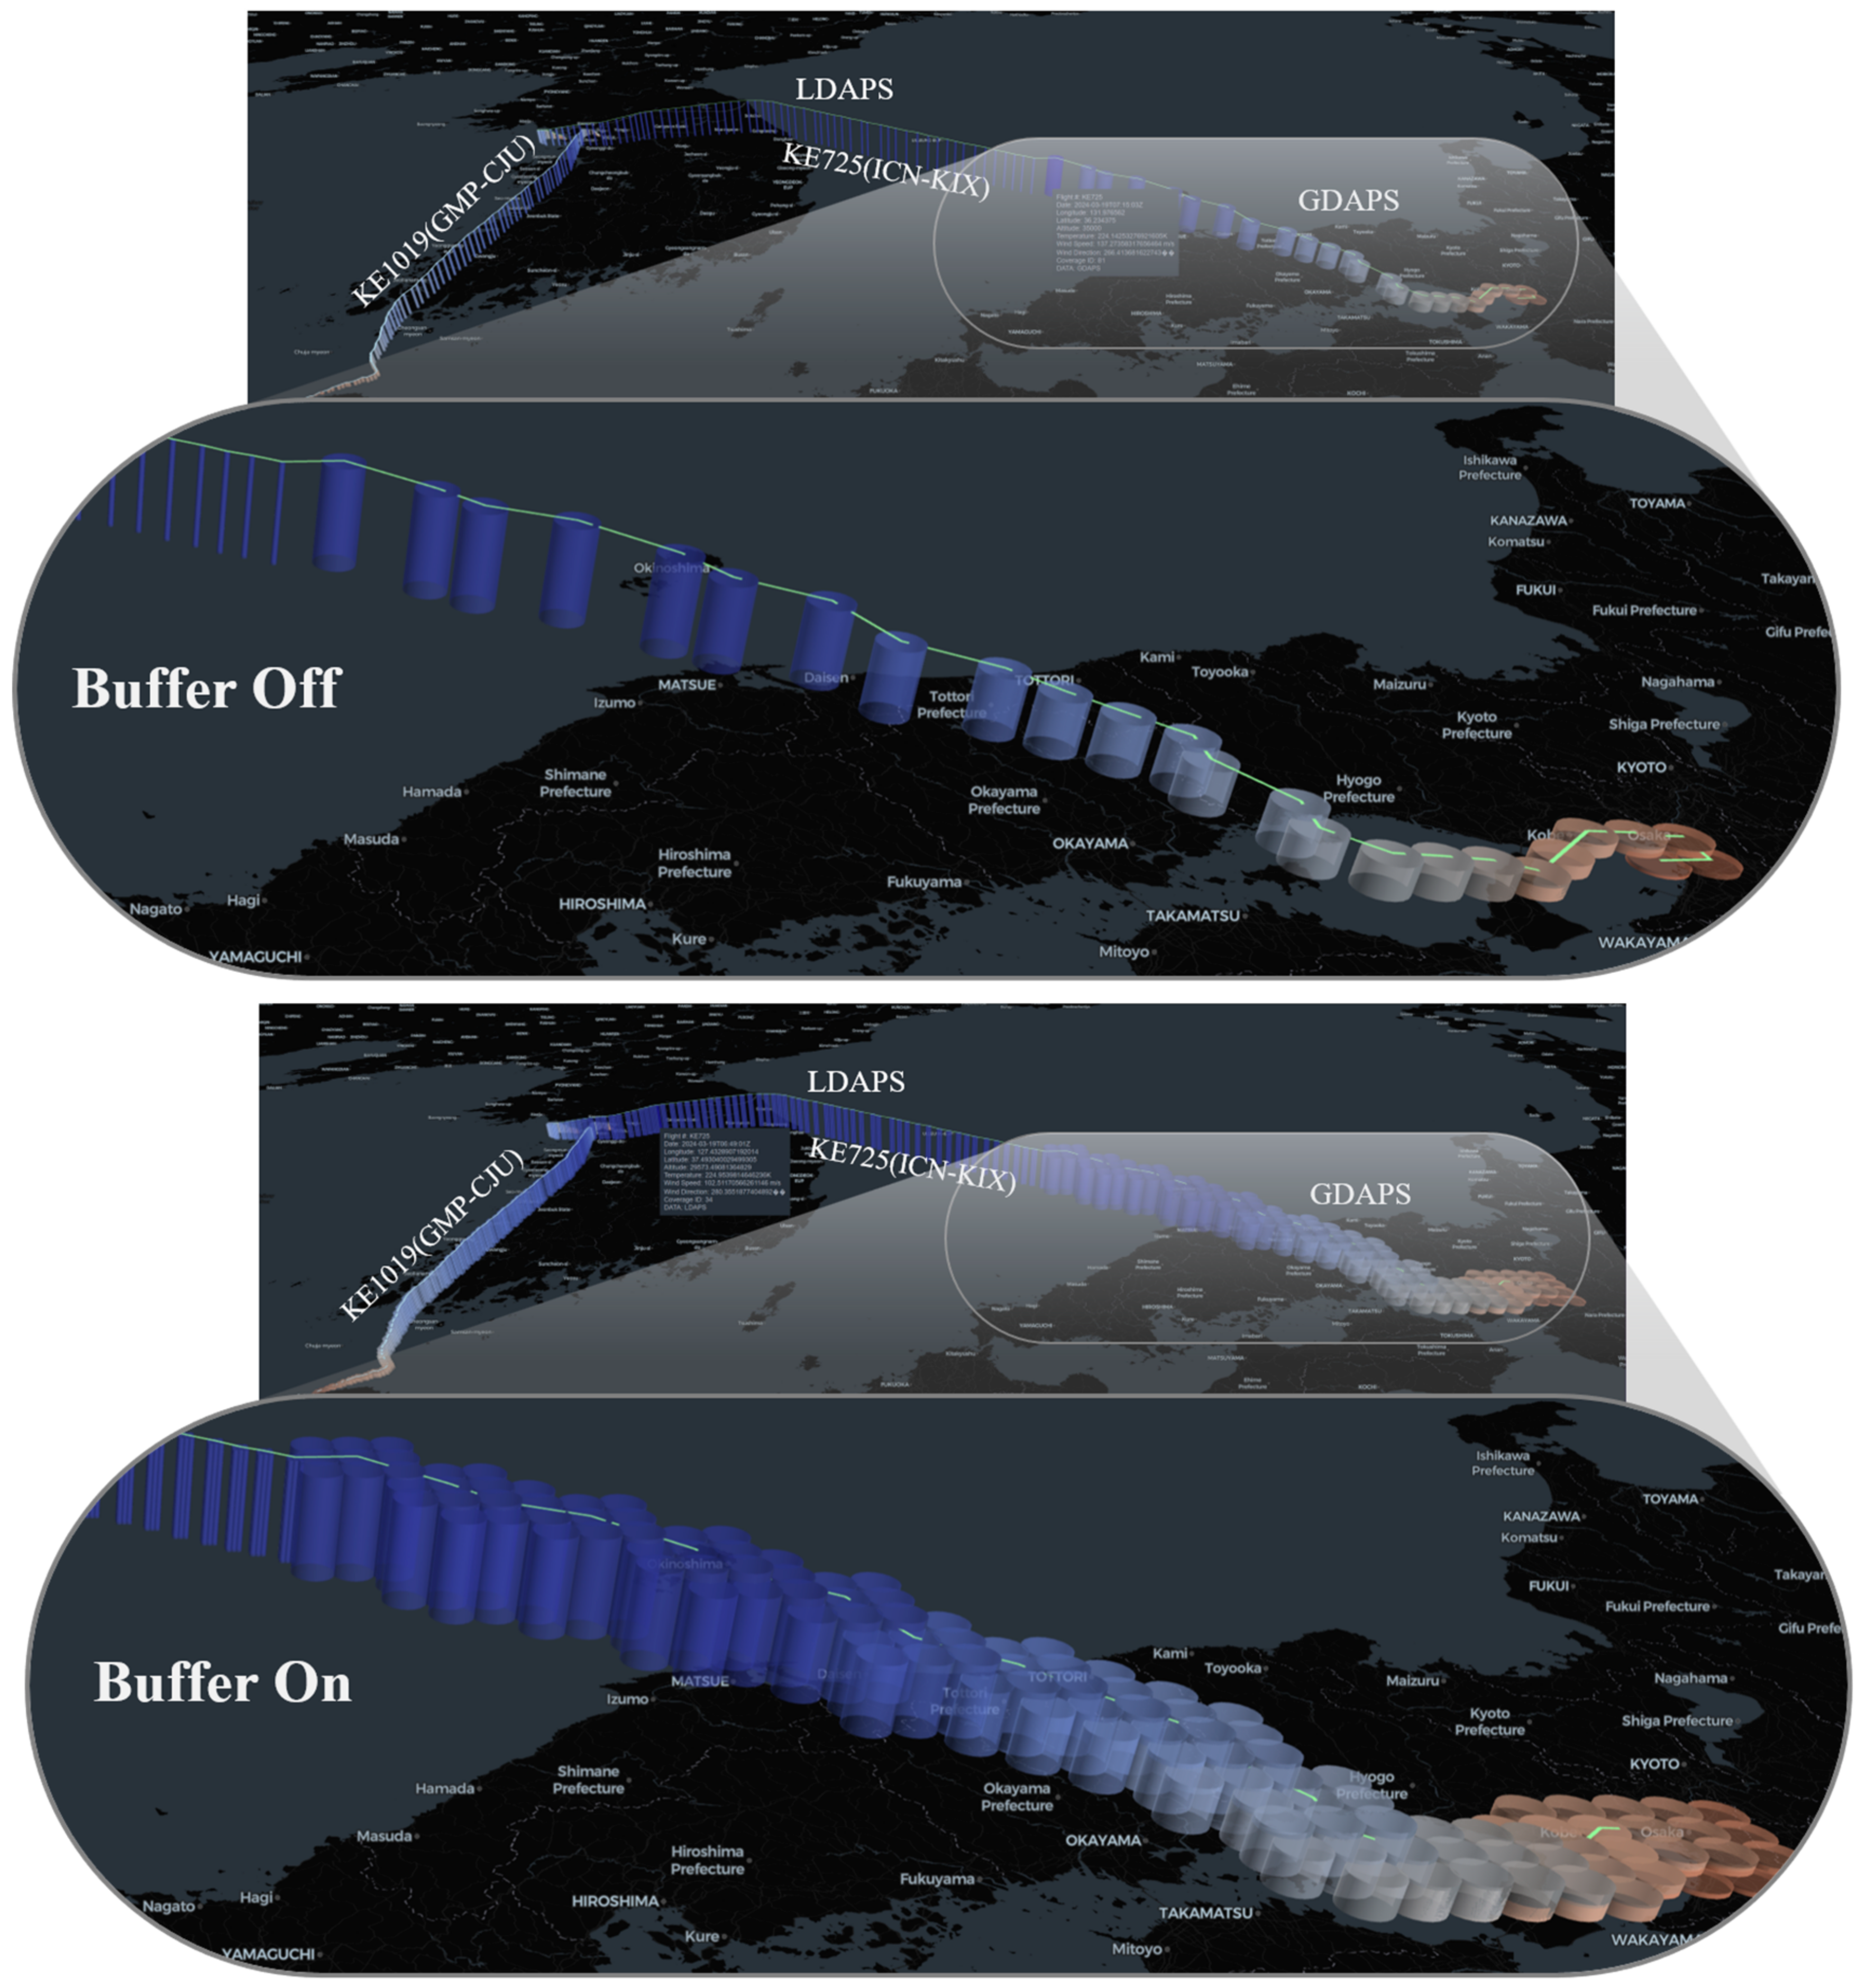
  • Buffer zone information provision, which offers additional information around the aircraft trajectory, allowing for flexible responses to unexpected situations.
In particular, by implementing an on/off function for the buffer zone, we have configured the system so that the buffer zone provides spatial awareness around the aircraft trajectory, allowing for flexible responses to unexpected weather conditions, which can enhance decision making in flight operations.
These features enable our 4DT API service to provide a more comprehensive and flexible approach than existing services. This service rapidly extracts and delivers weather elements from numerical models and provides real-time weather data interpolation tailored to the dynamic requirements of the aircraft trajectory. Such capabilities ensure that ATM systems can access the most relevant and current weather information, crucial for effective decision making and strategic flight planning. Moreover, the reliability and accuracy of the 4DT API service are rigorously validated through a comparison with real-time observational data from the ADS-B system.
This paper discusses the technical implementation of this advanced 4DT API service, its integration into existing ATM frameworks, and its anticipated impact on air traffic operations. The data sources, study area, and technical framework for the 4DT-Wx prototype system are presented in Section 2. The performance evaluation of the system, including the accuracy of meteorological data processing and the efficiency of the distributed processing system, is presented in Section 3. The results are interpreted in Section 4, highlighting the system’s practical applicability, benefits, and potential areas for further research. Finally, Section 5 summarizes the key findings of the study and their implications for future ATM and TBO implementations.

2. Materials and Methods

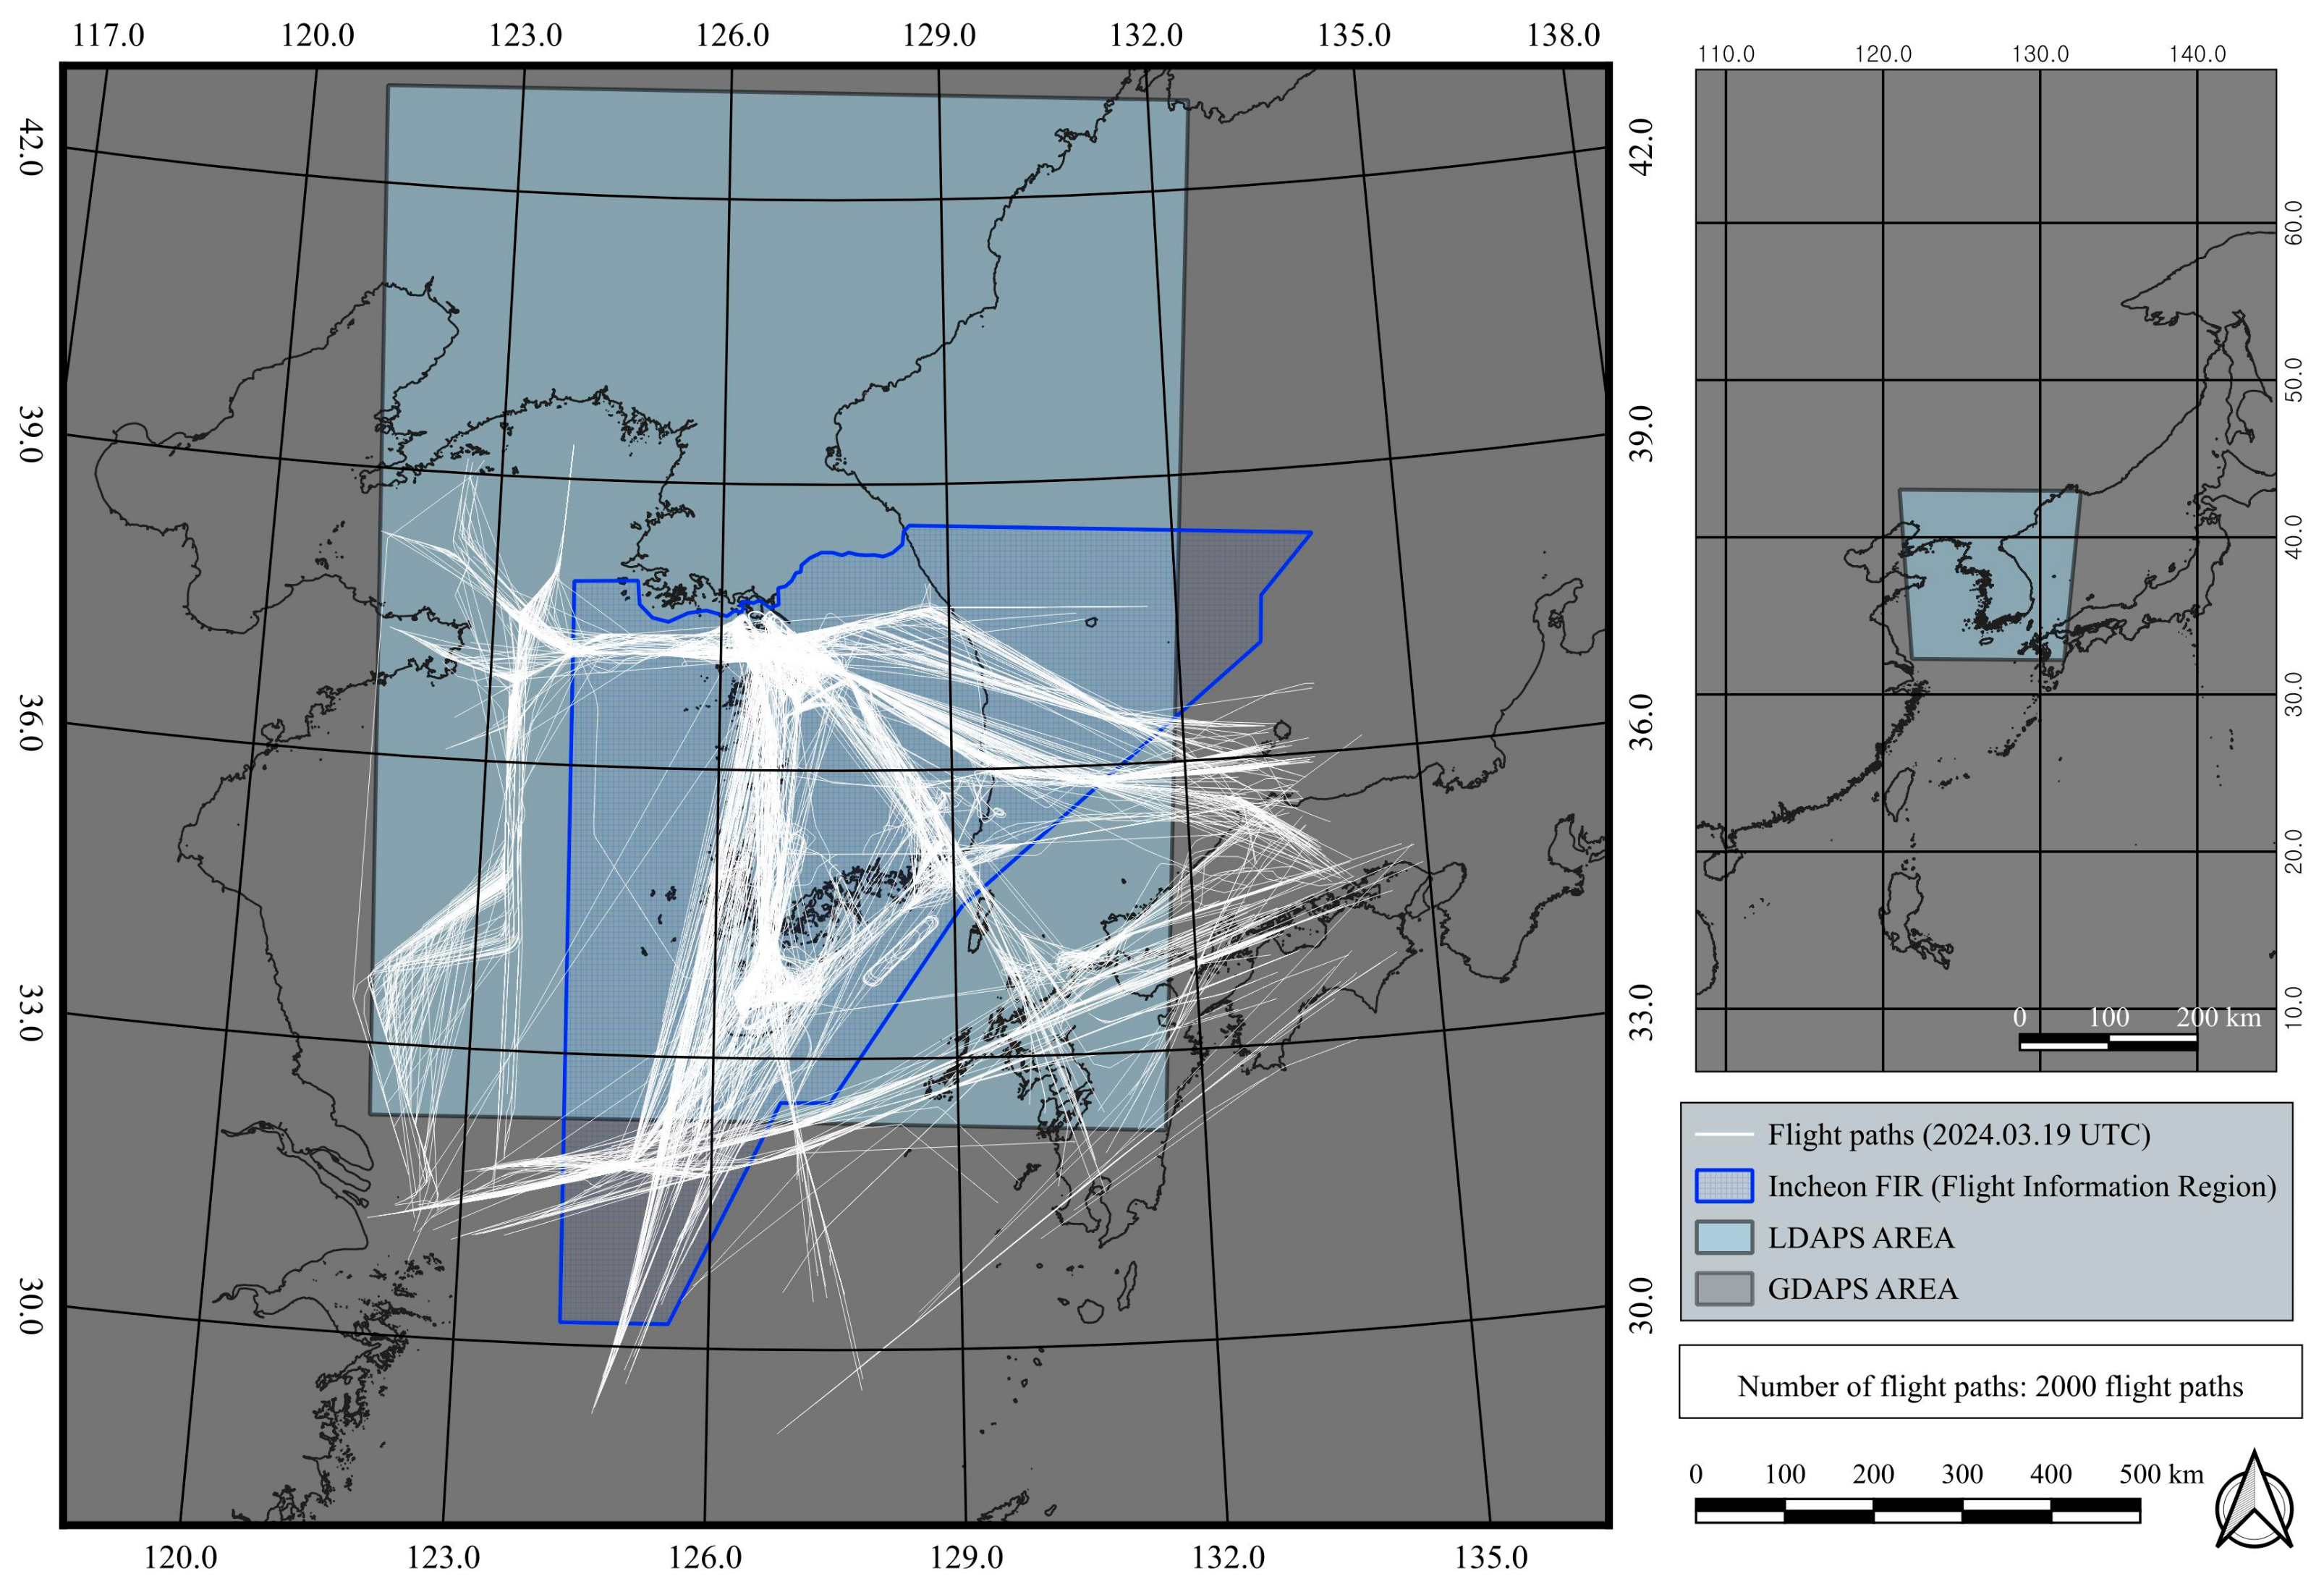
2.1. Data Sources and Study Area

2.1.1. ADS-B

ADS-B (Automatic Dependent Surveillance–Broadcast) is a modern sensor network delivering weather data [24]. ADS-B devices transmit and receive data using a 1090 MHz Mode S (mode-selective) data link. Initially designed for aviation surveillance, ADS-B operates globally, allowing aircrafts to autonomously transmit crucial flight parameters like their position, altitude, and velocity. Unlike traditional radar systems that rely on interrogation–reply cycles, ADS-B functions continuously, updating automatically at 1–2 Hz. Platforms like Flightradar24 (https://www.flightradar24.com/ (accessed on 1 August 2024)) and FlightAware (https://flightaware.com/ (accessed on 1 August 2024)) utilize ADS-B as a primary data source. The current focus in research is on hardware development, signal processing, network optimization, and surveillance enhancement. Alongside standard aviation metrics, ADS-B captures real-time weather data, such as wind and temperature. This information exchange enables enhanced situational awareness for both airborne and ground-based traffic control. Notably, ADS-B’s high update frequency and cost-effectiveness drive its adoption for weather monitoring applications, facilitating precise and timely weather alerts in the aviation sector.
Therefore, in this study, weather data (T, WD, and WS) derived by the Aviation Meteorological Office (AMO) of the Korea Meteorological Administration (KMA) via ADS-B were used to verify the trajectory-based weather variables extracted from the model. The relevant conversion details can be referenced in the World Meteorological Organization (WMO) guide documents [25,26].
The study on the production of weather data based on Mode S Enhanced Surveillance (EHS) began in 2007 by the Royal Netherlands Meteorological Institute (KNMI) [27]. Previous research indicated that the wind and temperature information calculated using Mode S EHS data has better quality than that using existing aircraft observation data [28,29,30]. Therefore, in this study, research was conducted based on realistic aircraft trajectories of actual flight data: 2000 aircraft trajectories from 19 March 2024 (Figure 1). These 2000 aircraft trajectories were defined and used as the number of API requests because each requires a unique API request to retrieve specific weather data along its trajectory. This approach ensures that the system is thoroughly tested for its ability to handle multiple simultaneous requests and provide accurate weather information tailored to individual aircraft trajectories.

2.1.2. Numerical Weather Prediction Models

The weather data used in this study correspond to the LDAPS and GDAPS (Global Data Assimilation and Prediction System) grid datasets within the ADS-B observation area on 19 March 2024 (Figure 1). LDAPS is a high-resolution weather prediction system for local scales, while GDAPS is a weather prediction system for global scales. LDAPS provides detailed weather information for the Korean Peninsula and its surrounding areas, whereas GDAPS offers global weather information. These systems play crucial roles in providing comprehensive weather data for different flight phases in our 4DT-Wx prototype system. These datasets conform to the GRIB2 format, a standard specification proposed by the WMO. The GRIB2 format is a binary file structure that compresses large amounts of data using modularization and object-oriented approaches.
These NWP (Numerical Weather Prediction) models use a 3D grid system, including two spatial dimensions i and j (longitude and latitude) and altitude k, to characterize the atmosphere. This system represents various weather variables (temperature, pressure, wind components, humidity, etc.) across different altitudes. In this study, as the main objective was to extract trajectory-based data, the research was conducted using an isobaric model.
  • The GDAPS dataset has the following spatial and temporal characteristics:
  • A horizontal resolution of 10 km;
  • A total of 70 layers;
  • A 288 h forecast (00, 12 UTC);
  • A 87 h forecast (06, 18 UTC).
The LDAPS dataset has the following spatial and temporal characteristics:
  • A horizontal resolution of 1.5 km;
  • A total of 70 layers;
  • A 36 h forecast (00, 06, 12, 18 UTC).

2.2. Seamless Weather Integration for TBO

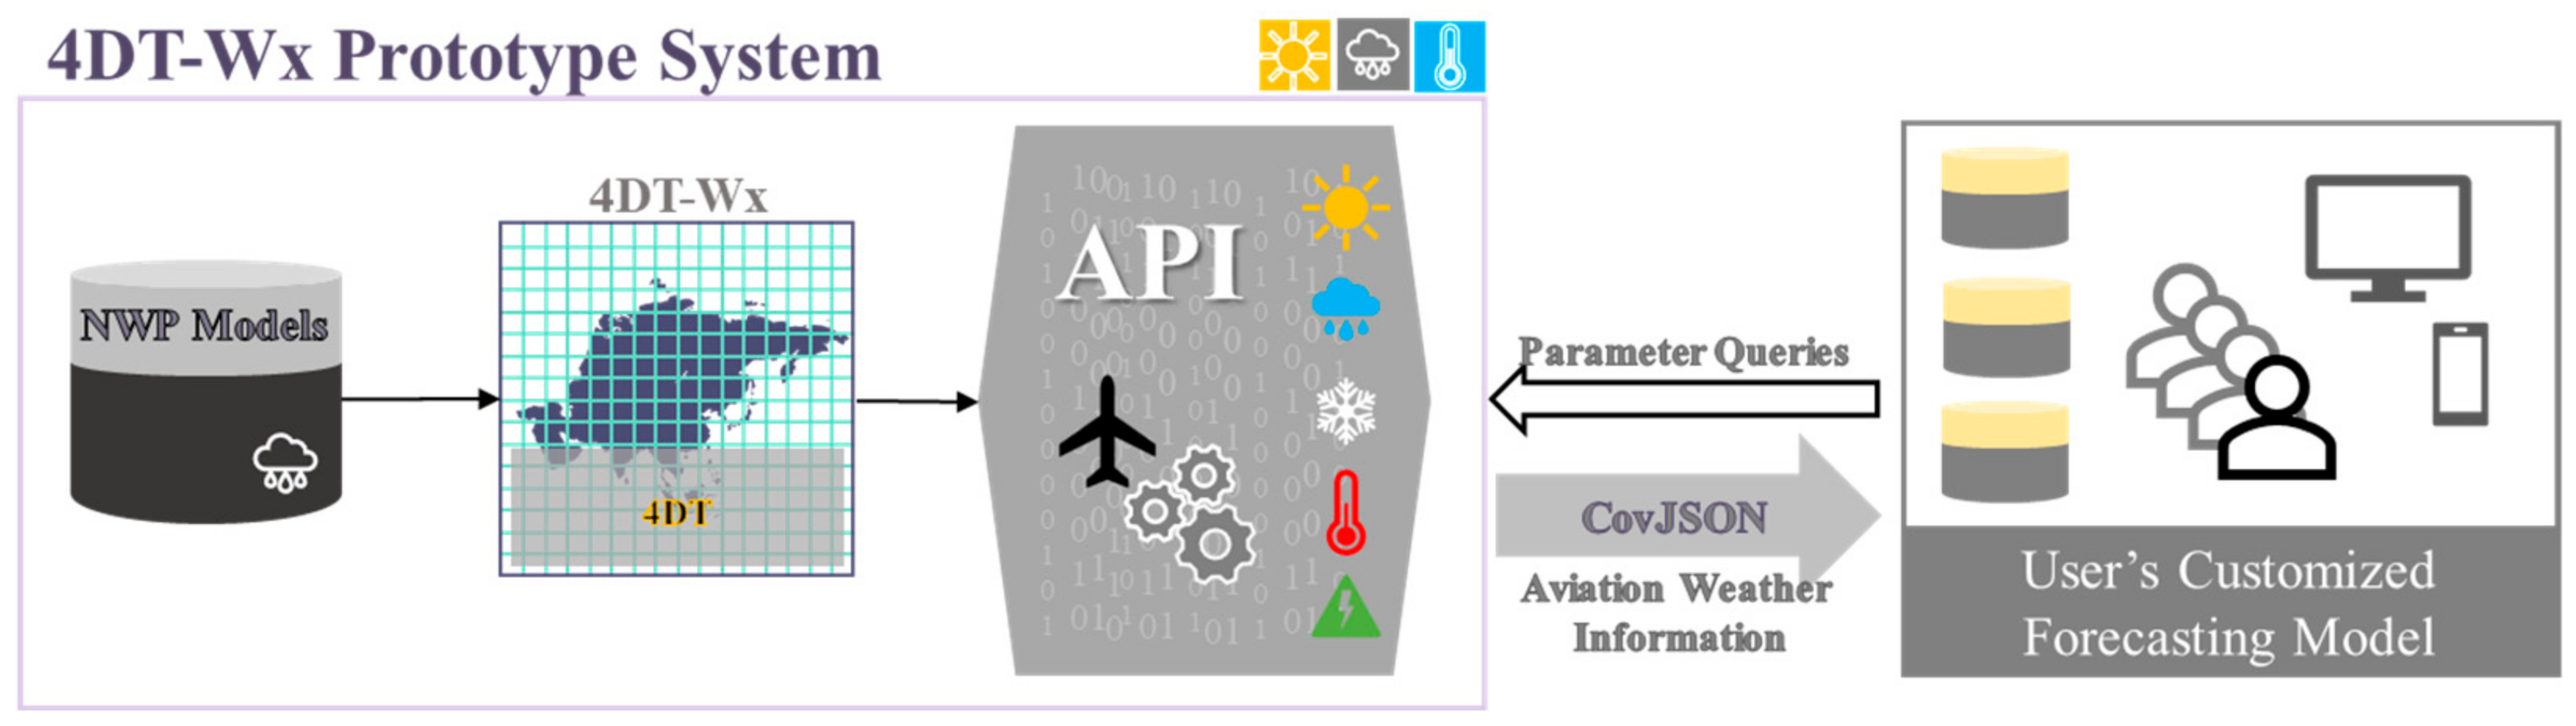
2.2.1. Structure of 4DT-Wx Prototype System

This study’s 4DT-Wx prototype system was designed to seamlessly integrate comprehensive weather data into the TBO framework. The main objective was to enhance flight planning and operations by providing real-time weather information along aircraft trajectories. The 4DT-Wx system utilizes various NWP models to extract accurate weather parameters for given trajectories. The prototype system environment was implemented using Python programming in a Windows environment and was executed on a high-performance computing system. Python was chosen for its extensive libraries supporting data analysis, which are crucial for processing complex weather data and implementing advanced algorithms. The Windows environment was selected for its compatibility with existing aviation systems, ensuring seamless integration with the current infrastructure. The computing system was equipped with 32 physical cores and 64 logical processors (threads) to handle the parallel processing requirements of large-scale weather data. The 256 GB of memory was allocated to accommodate the substantial data volumes involved in weather modeling and trajectory calculations. The 2.9 GHz CPU was chosen to provide the necessary processing speed for real-time weather data integration and trajectory computations. This high-performance setup was essential to meet the real-time processing capabilities required in a TBO environment, where rapid data analysis and decision making are critical for efficient and safe air traffic management. The 4DT-Wx prototype system (Figure 2) integrates NWPs and aircraft trajectories and extracts trajectory-based weather variables through queries on aircraft trajectory information (latitude, longitude, altitude, and time). Additionally, the 4D weather grid is defined using weather variables (Wx) representing weather conditions and the indices i, j, k, and t, representing longitude, latitude, altitude, and time intervals, respectively.
Therefore, as shown in Equation (1), the 4DT is associated with Wx in specific grid cells defined by longitude i, latitude j, altitude k, and time interval t. The extraction of trajectory-based weather information is termed 4DT-Wx.
4DT = Wx (i, j, k, t)
The central API processes various weather and aviation-related data, allowing users to perform customized parameter queries. The system’s output is stored in the CoverageJSON format [31], which is used to provide user-customized weather data necessary for aviation decision making. This format offers an efficient representation of multi-dimensional gridded data, compact storage, enhanced interoperability, and built-in support for geospatial and temporal metadata. These features make CoverageJSON ideal for handling complex weather information in our 4DT-Wx prototype system. This format can be utilized for various analysis and visualization tasks in the future, facilitating integration with other aviation systems and enabling sophisticated weather-based flight planning.
When extracting weather data along the trajectory, weather data monitoring for takeoffs and landings is performed within the LDAPS domain, while for areas outside the LDAPS domain, GDAPS data are used to monitor weather phenomena along the cruise route. This multi-model approach allows us to leverage the high spatial resolution (1.5 km) and frequent updates of LDAPS for critical takeoff and landing phases, where precise local weather information is crucial. Simultaneously, it utilizes the broader coverage of GDAPS (10 km resolution) for en route segments, ensuring continuous weather monitoring across longer flight paths. By integrating these complementary models, our system provides a comprehensive and seamless weather information service that maintains high accuracy for local operations while offering extensive coverage for long-distance flights. In this study, an interpolation method utilizing adjacent model data was applied to extract the altitude and time values corresponding to each point n of the trajectory. Specifically, the altitude and time of point n along its trajectory were calculated through an interpolation function f i n t e r p o l a t i o n , which uses the data from the immediately preceding model point (n − 1) and the immediately following model point (n + 1) as an input to estimate the values at point n, as described in Equation (2):
k n ,   t n = f i n t e r p o l a t i o n ( n 1 , n + 1 )
where kn is the trajectory altitude at point n and tn is the trajectory time at point n.
In this study, three interpolation techniques were applied and compared for the interpolation mentioned above [32,33,34,35,36,37]:
  • Linear interpolation estimates the intermediate values using a straight line between two points, assuming a linear relationship between the given data points.
  • Spline interpolation uses polynomials to smoothly connect data points, applying quadratic or cubic polynomials to each interval.
  • Inverse distance weighting (IDW) interpolates by weighting the values of the surrounding data points inversely proportionally to the distance. The closer the data point, the greater the weight, and this is used to estimate intermediate values.
These methods were selected due to their widespread use in meteorological applications, relative simplicity, and proven effectiveness. Each technique offers a balance between computational efficiency and the ability to handle various weather data characteristics. These approaches provide a robust performance without undue complexity, making them well-suited for real-time weather data processing in trajectory-based operations. Additionally, as an option, a 3 × 3-size buffer (in the buffer-on state) can be set at relevant points to monitor the surrounding conditions. In this study, we define the two states of buffer configuration as follows: the buffer-on state is denoted as “BOn”, and the buffer-off state is denoted as “BOff”.

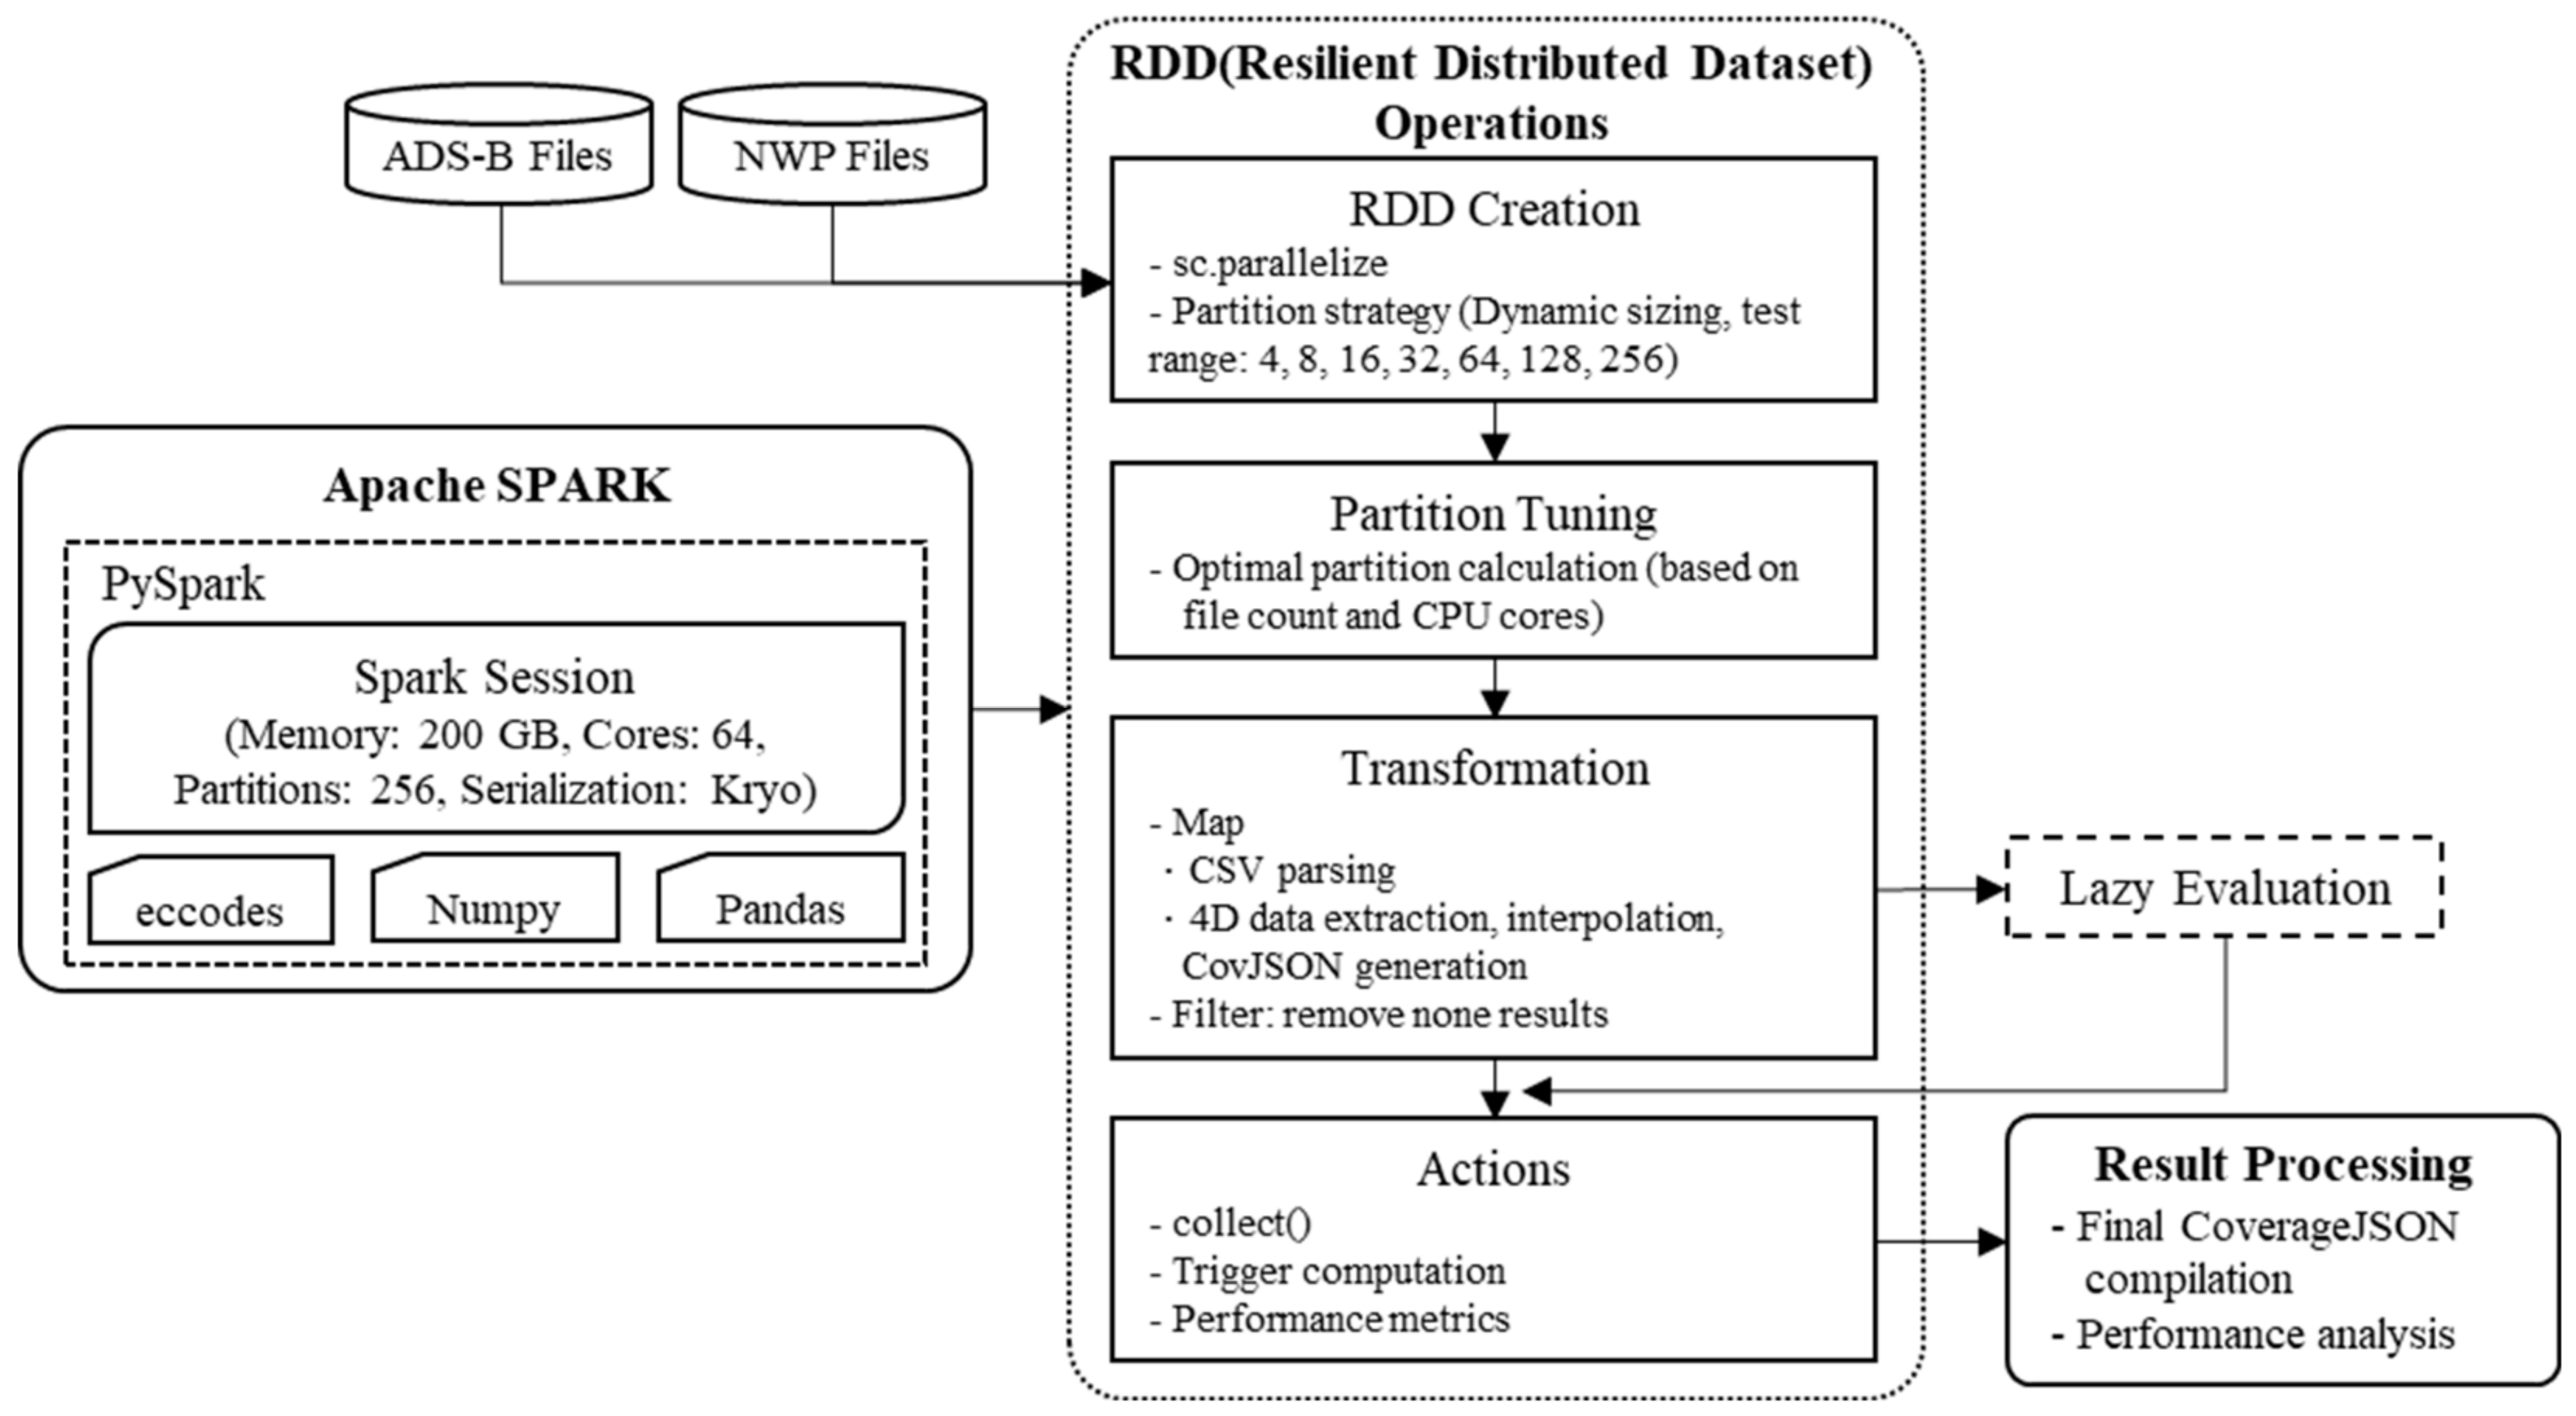
2.2.2. Technological Framework

Distributed processing system construction using Apache Spark.
The 4DT-Wx prototype system utilizes the Apache Spark framework (version 3.5.1) [38] to efficiently process large-scale weather data and aircraft trajectory information. Apache Spark is a Scala-based open-source computing platform that enables the parallel processing of large datasets, capable of analyzing static or streaming data with high performance and speed through in-memory operations [39].
In this study, Apache Spark’s local mode was configured to maximize the efficient use of resources in a single high-performance workstation (Figure 3). In the SparkSession configuration, about 80% of the system’s total memory of 256 GB, i.e., 200 GB, was allocated as the driver memory. This configuration was chosen based on our system’s workload characteristics for processing large, complex weather datasets. The 80–20 split between driver and executor memory was determined through experimental optimization, balancing in-memory data processing needs with executor operations and system overhead. Additionally, the default parallel processing level and shuffle partition count were set to 256, four times the number of logical processors. This setup effectively distributes and parallelizes data processing tasks on a system with 64 logical processors, ensuring the efficient handling of data-intensive tasks for real-time weather data integration in TBO environments.
For performance optimization, we used the Kryo serializer and enabled the compression option. The Kryo serializer is more efficient than Java’s native serialization, improving performance during data serialization and deserialization [40]. Enabling the compression option improves the overall system performance by reducing network transfers and disk I/O. This Spark configuration effectively leverages the fault-tolerant dataset concept [41]. The Resilient Distributed Dataset (RDD) is the foundation of the Spark framework, enabling in-memory computation on large-scale clusters [42,43,44,45,46]. The 4DT-Wx system utilizes RDD to efficiently process weather data and aircraft trajectories.
Python-based data processing through PySpark.
Utilizing Spark’s functions in a Python environment using PySpark, we performed efficient weather data processing, trajectory information analysis, and complex numerical calculations. Apache Spark supports various programming languages, including Java, Scala, Python, and R, enabling the development of real-time stream processing applications, allowing users to manage real-time data in a scalable, high-throughput, and fault-tolerant manner [46,47,48]. In this study, we used the following libraries for main data processing and analysis: Numpy for efficiently processing large multidimensional arrays and matrices, Pandas for high-performance data structures and tools for data manipulation and analysis, Pyproj for coordinate-system transformation and geospatial data processing, and eccodes for decoding and encoding weather data in GRIB and BUFR formats [49].
Dynamic partition allocation and performance optimization.
In this study, we implemented a dynamic partition allocation method to optimize the system performance. The optimal number of partitions was dynamically determined based on the numbers of files and CPU cores, which improved the processing speed by efficiently utilizing system resources.
Therefore, each file processing time was precisely measured through performance analysis and monitoring. The performance was compared and analyzed for various partition quantities (4, 8, 16, 32, 64, 128, and 256). By monitoring CPU and memory usage in real time, we could identify and optimize system bottlenecks. To verify the scalability of the system, we performed tests on datasets of different sizes (50, 100, 500, 1000, 1500, and 2000 files) and different numbers of partitions. This allowed us to verify the linear scalability of the system and determine the optimal parallel processing configuration.
RDD operations are broadly divided into four steps: input, transformation, and action. In this system, we implemented the following RDD workflow:
  • Generate an initial RDD from ADS-B files and NWP files using sc.parallelize;
  • Dynamically calculate the optimal number of partitions;
  • Perform transformations such as Comma-Separated Values (CSV) parsing, 4D data extraction, and interpolations using a map, removing unwanted results using a filter;
  • Collect results through the collect() method, which triggers an actual calculation.
By leveraging Spark’s Lazy Evaluation characteristic, transformation operations are delayed until an action is called, providing optimization opportunities for the overall operation and streamlining memory usage by preventing the unnecessary storage of intermediate results. Based on this highly optimized technical framework, the 4DT-Wx system can efficiently process large amounts of weather data and aircraft trajectory information, providing accurate and rapid weather information to users. This has the potential to significantly improve the safety and efficiency of aviation operations in TBO environments, providing a solid foundation to respond to more complex weather conditions and flight scenarios in the future.

3. Performance Evaluation of the 4DT-Wx Prototype System

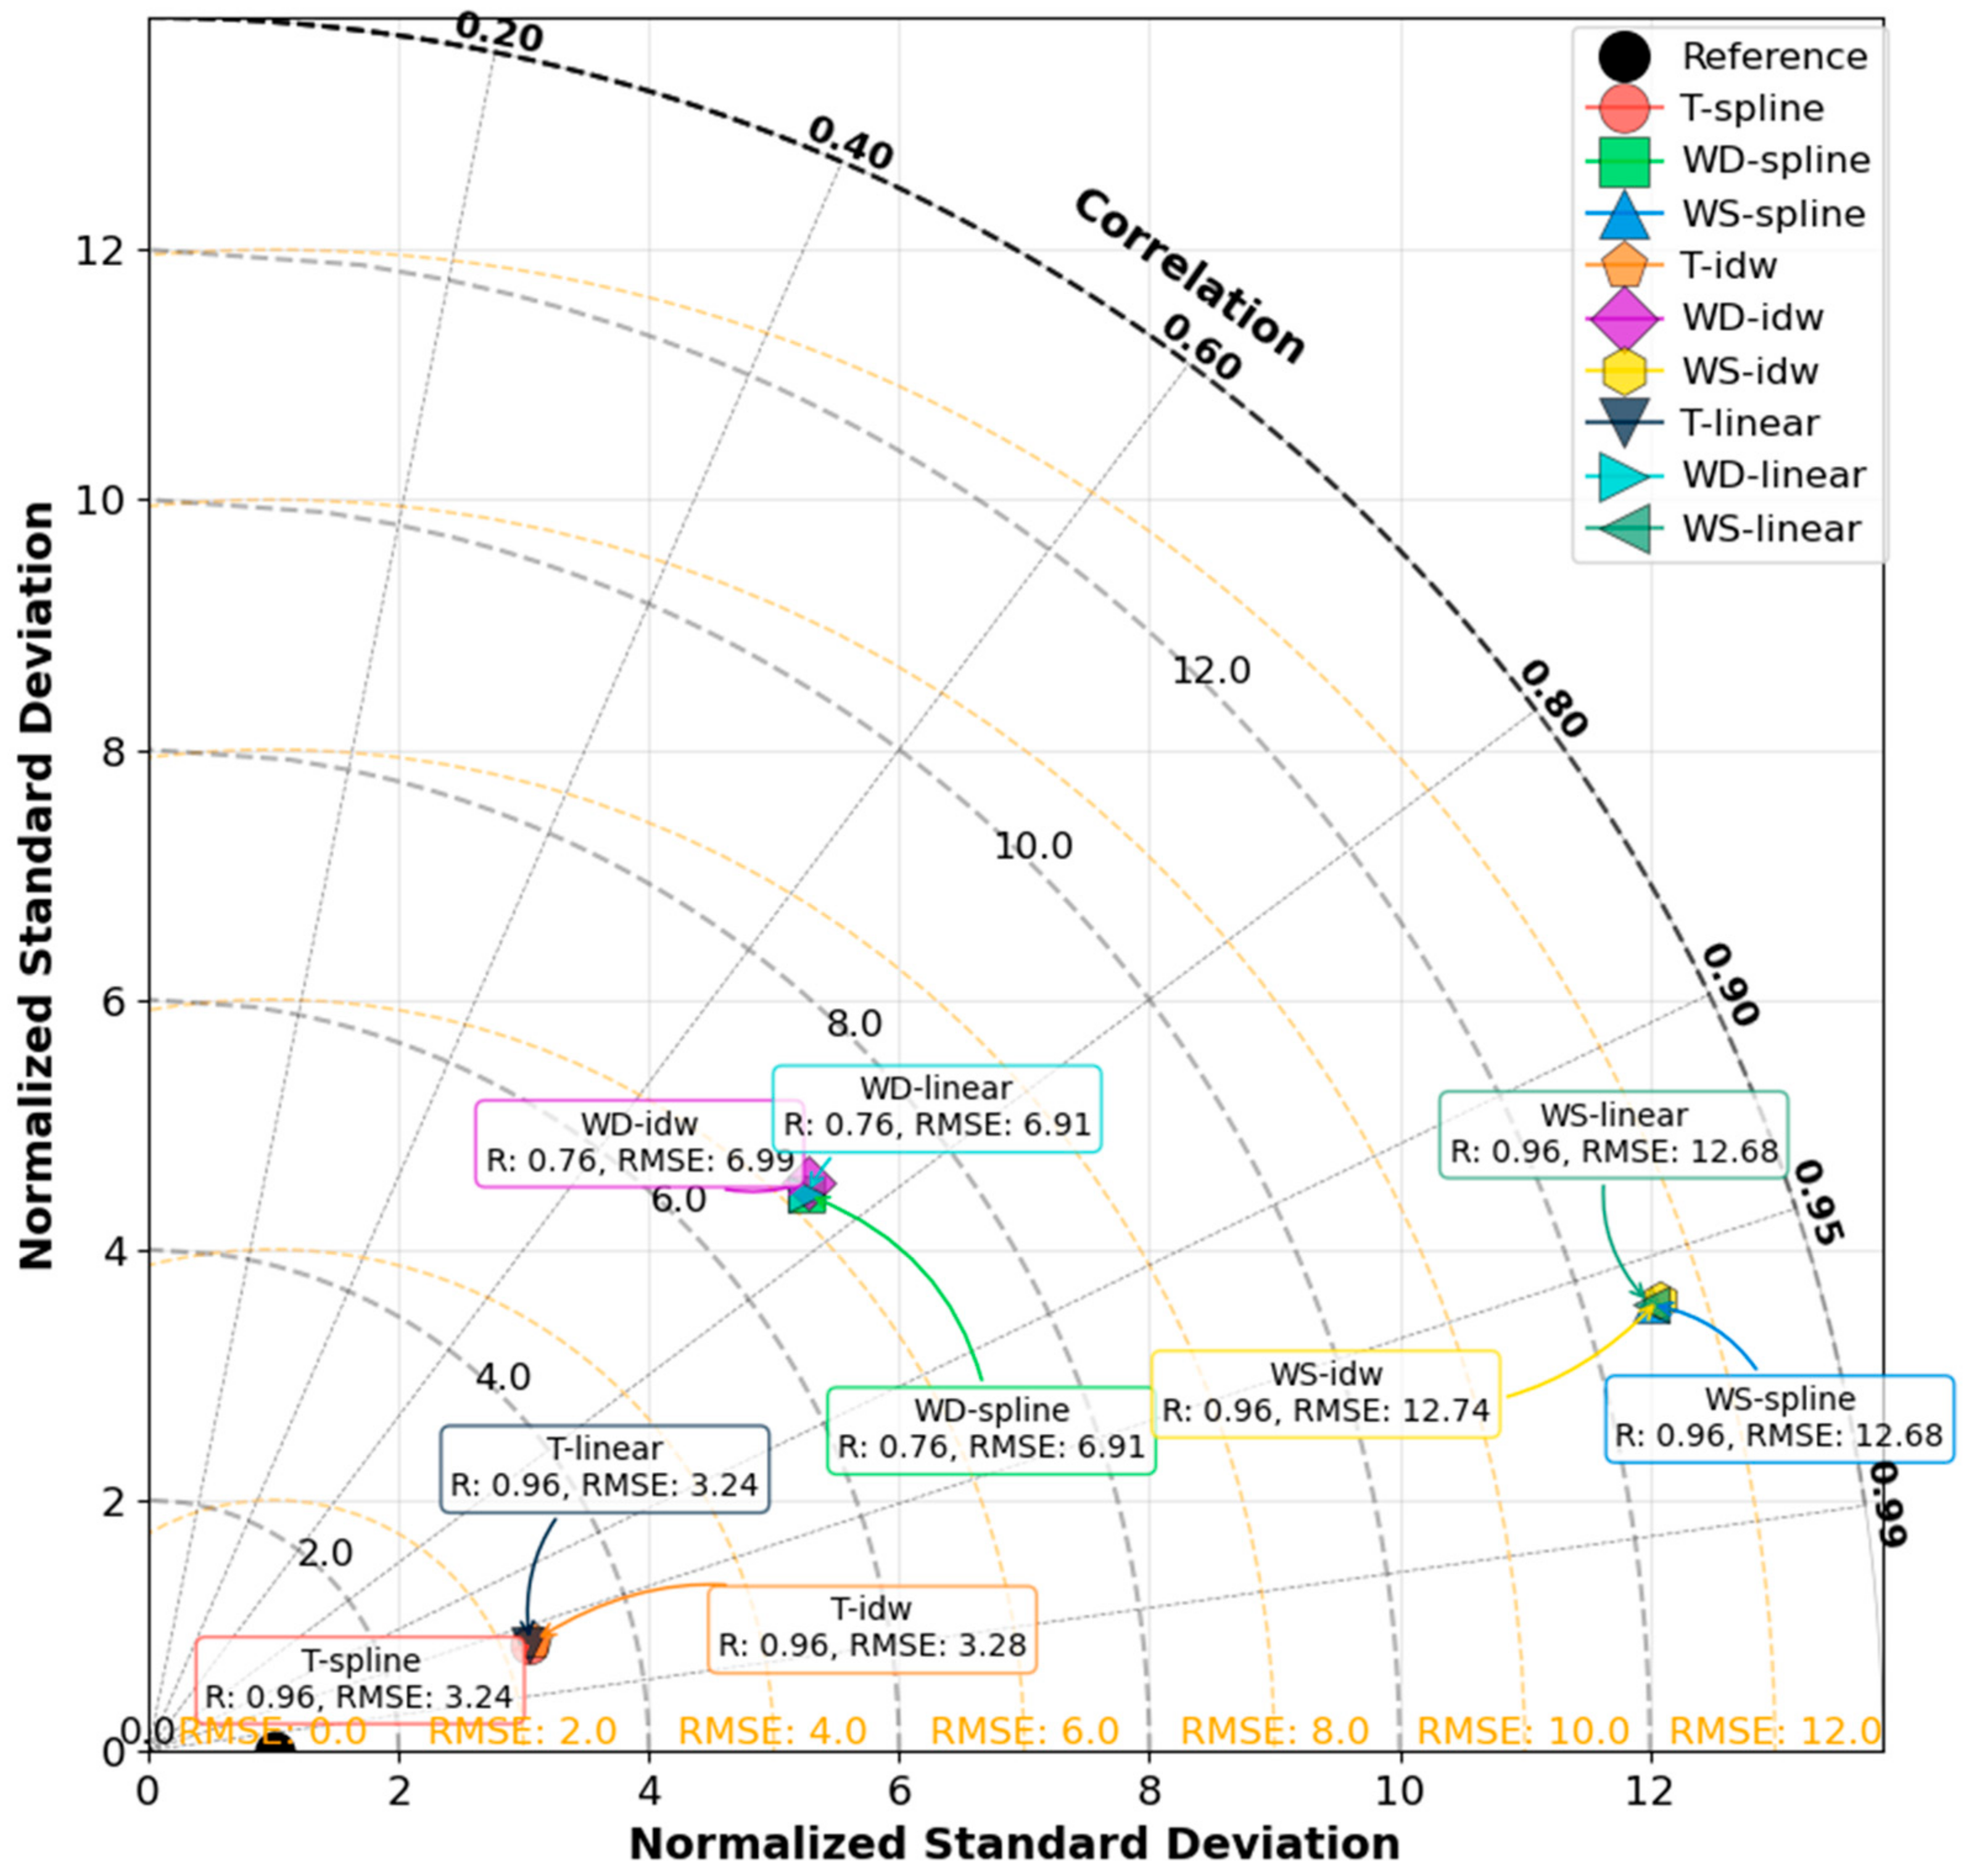
3.1. Evaluation of MET Data Processing Accuracy

The T, WD, and WS values extracted from the ADS-B data collected by the AMO, as presented in Section 2.1.1, were verified. The verification results are shown in Table 1. To analyze the extraction performance according to the interpolation methods, the accuracies of three interpolation methods—spline, IDW, and linear—were compared and analyzed.
The weather variables of ADS-B underwent a quality control process, extracting more than 900,000 valid data points from about 1 million initial data points for accuracy analysis. For T, all three interpolation methods showed high accuracy and a high correlation, with R2 values above 0.93 and a root mean square error (RMSE) of less than 3.3 °C. For WD, all three methods showed relatively low accuracy, with an R2 value of 0.58, showing a lower correlation compared with T. WS showed higher accuracy than that of WD but lower than that of T with an R2 value greater than 0.92, showing a high correlation. However, WS’s RMSE was relatively large at over 12.6 knots. These results are similar to those found in previous studies [24,50,51]. In this study, the estimation of WD and WS using ADS-B data was found to have a lower accuracy compared with the T estimations. This is interpreted as being due to the characteristics of the ADS-B system and the impact of the aircraft’s motion state on the measurements of WD and WS.
The Taylor diagram in Figure 4 allows for a comprehensive comparison of the performance of each variable and interpolation method. In this diagram, T is closest to the reference point, indicating the highest accuracy, while WD is farthest away, indicating the lowest accuracy. WS shows a moderate performance. Although the performance differences among the interpolation methods were minimal, there were differences in the processing speed. According to Table 2, linear interpolation demonstrated the fastest processing speed.
Therefore, in this study, the linear interpolation method was adopted for the performance analysis because of the negligible differences in accuracy but superior processing performance.

3.2. Performance Analysis of MET Data Processing on 4DT-Wx Prototype System

In this study, the performance of a distributed processing system using Apache Spark was analyzed from various perspectives. Particularly, we focused on the impact of the number of partitions and the buffer configuration on the system performance and observed performance changes according to various combinations of the number of files and partitions. The number of files was varied from 50 to 2000 and the number of partitions from 4 to 256 to measure the key performance indicators. Based on the data obtained through these extensive experiments, we directly and indirectly evaluated the parallelization performance by applying various methodologies such as speedup, optimal partitioning, efficiency, and suitability analysis.

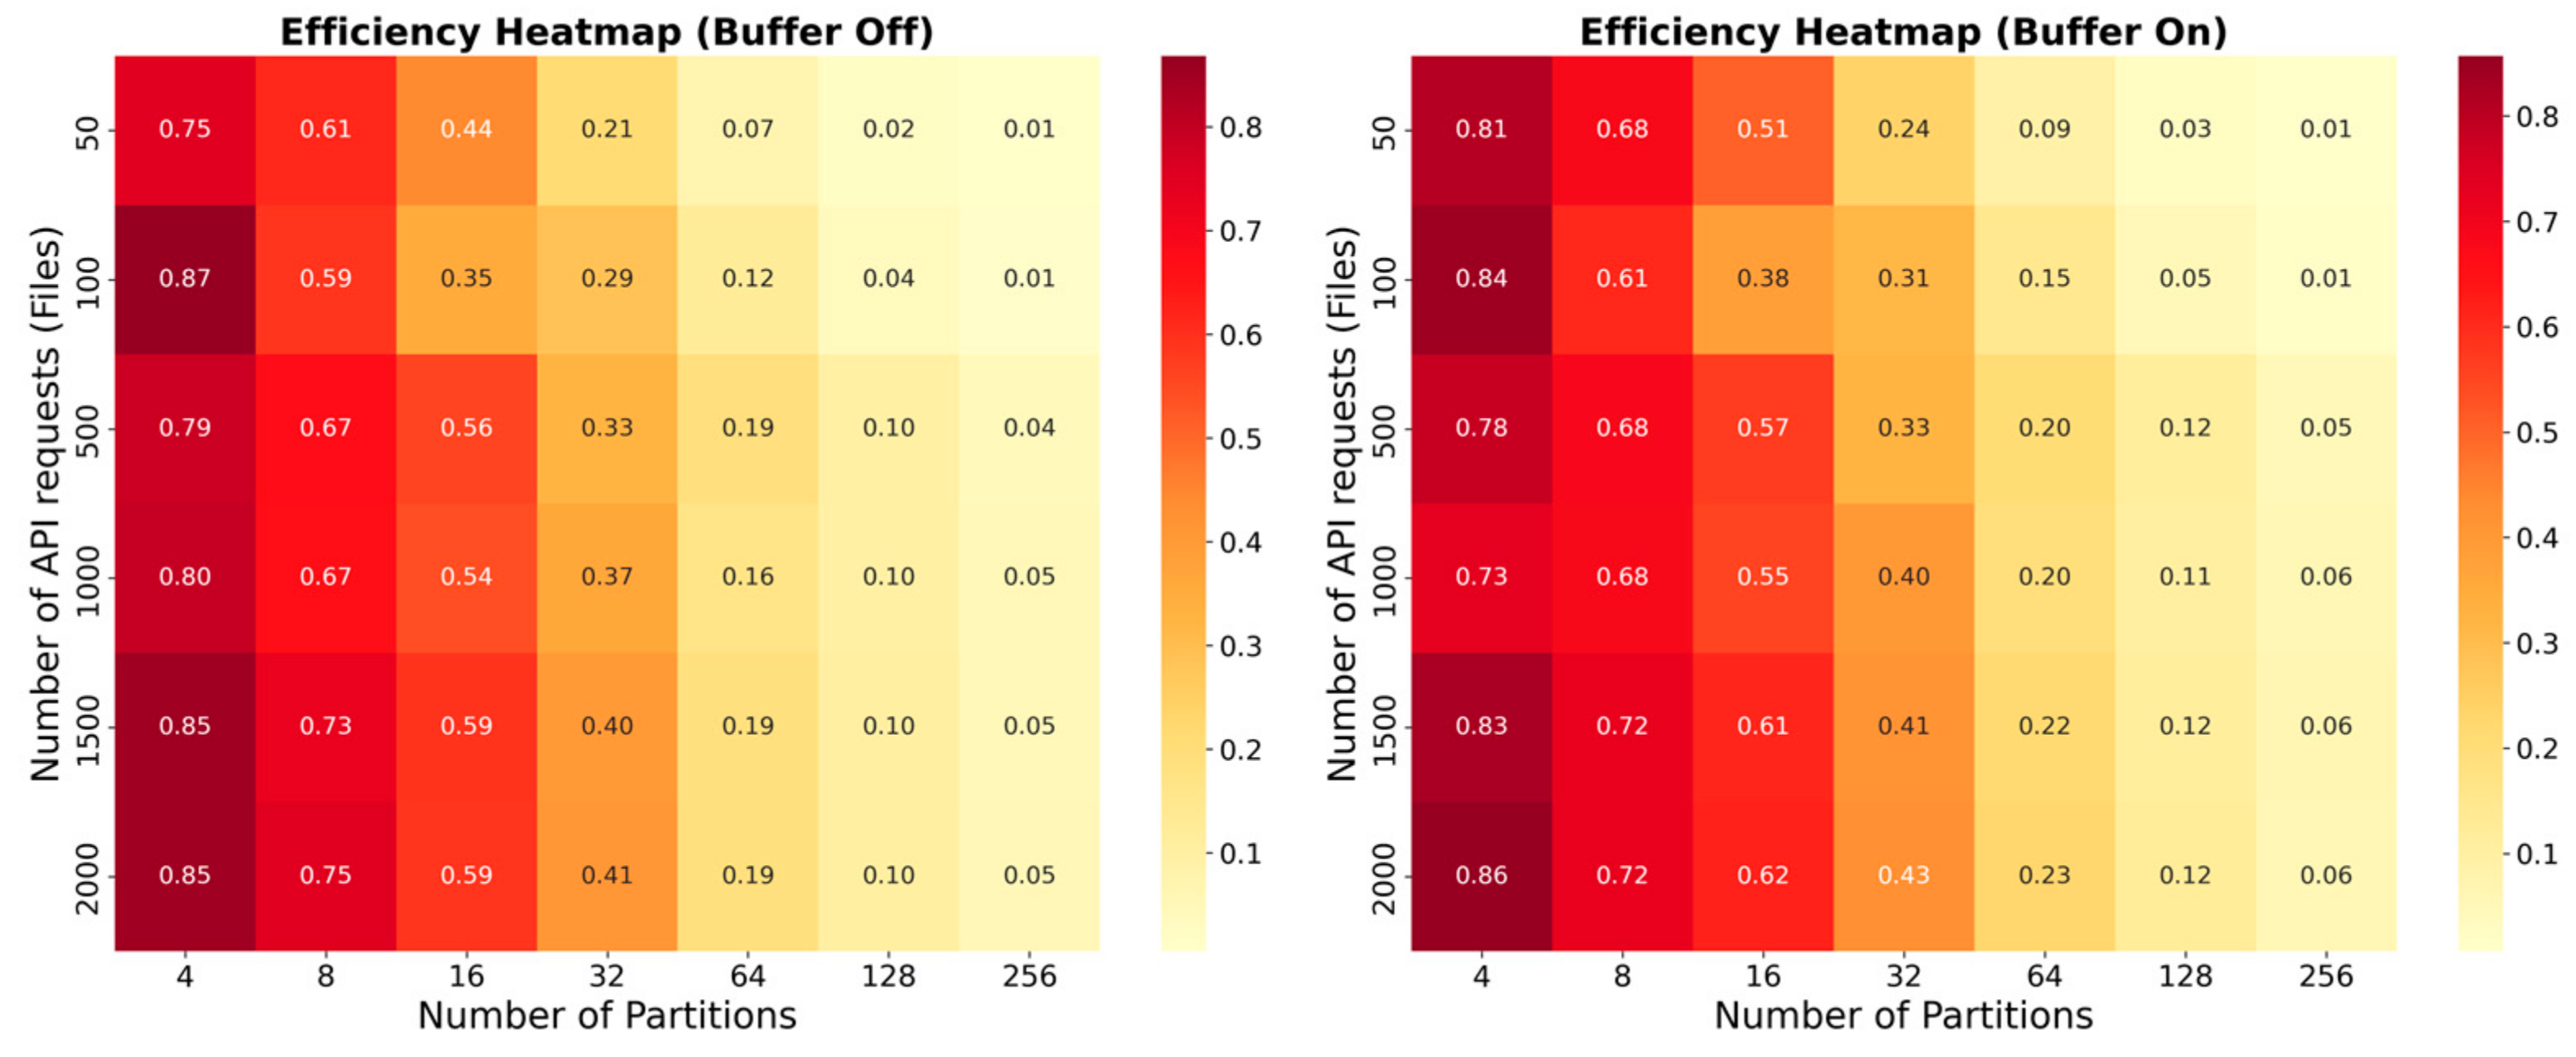
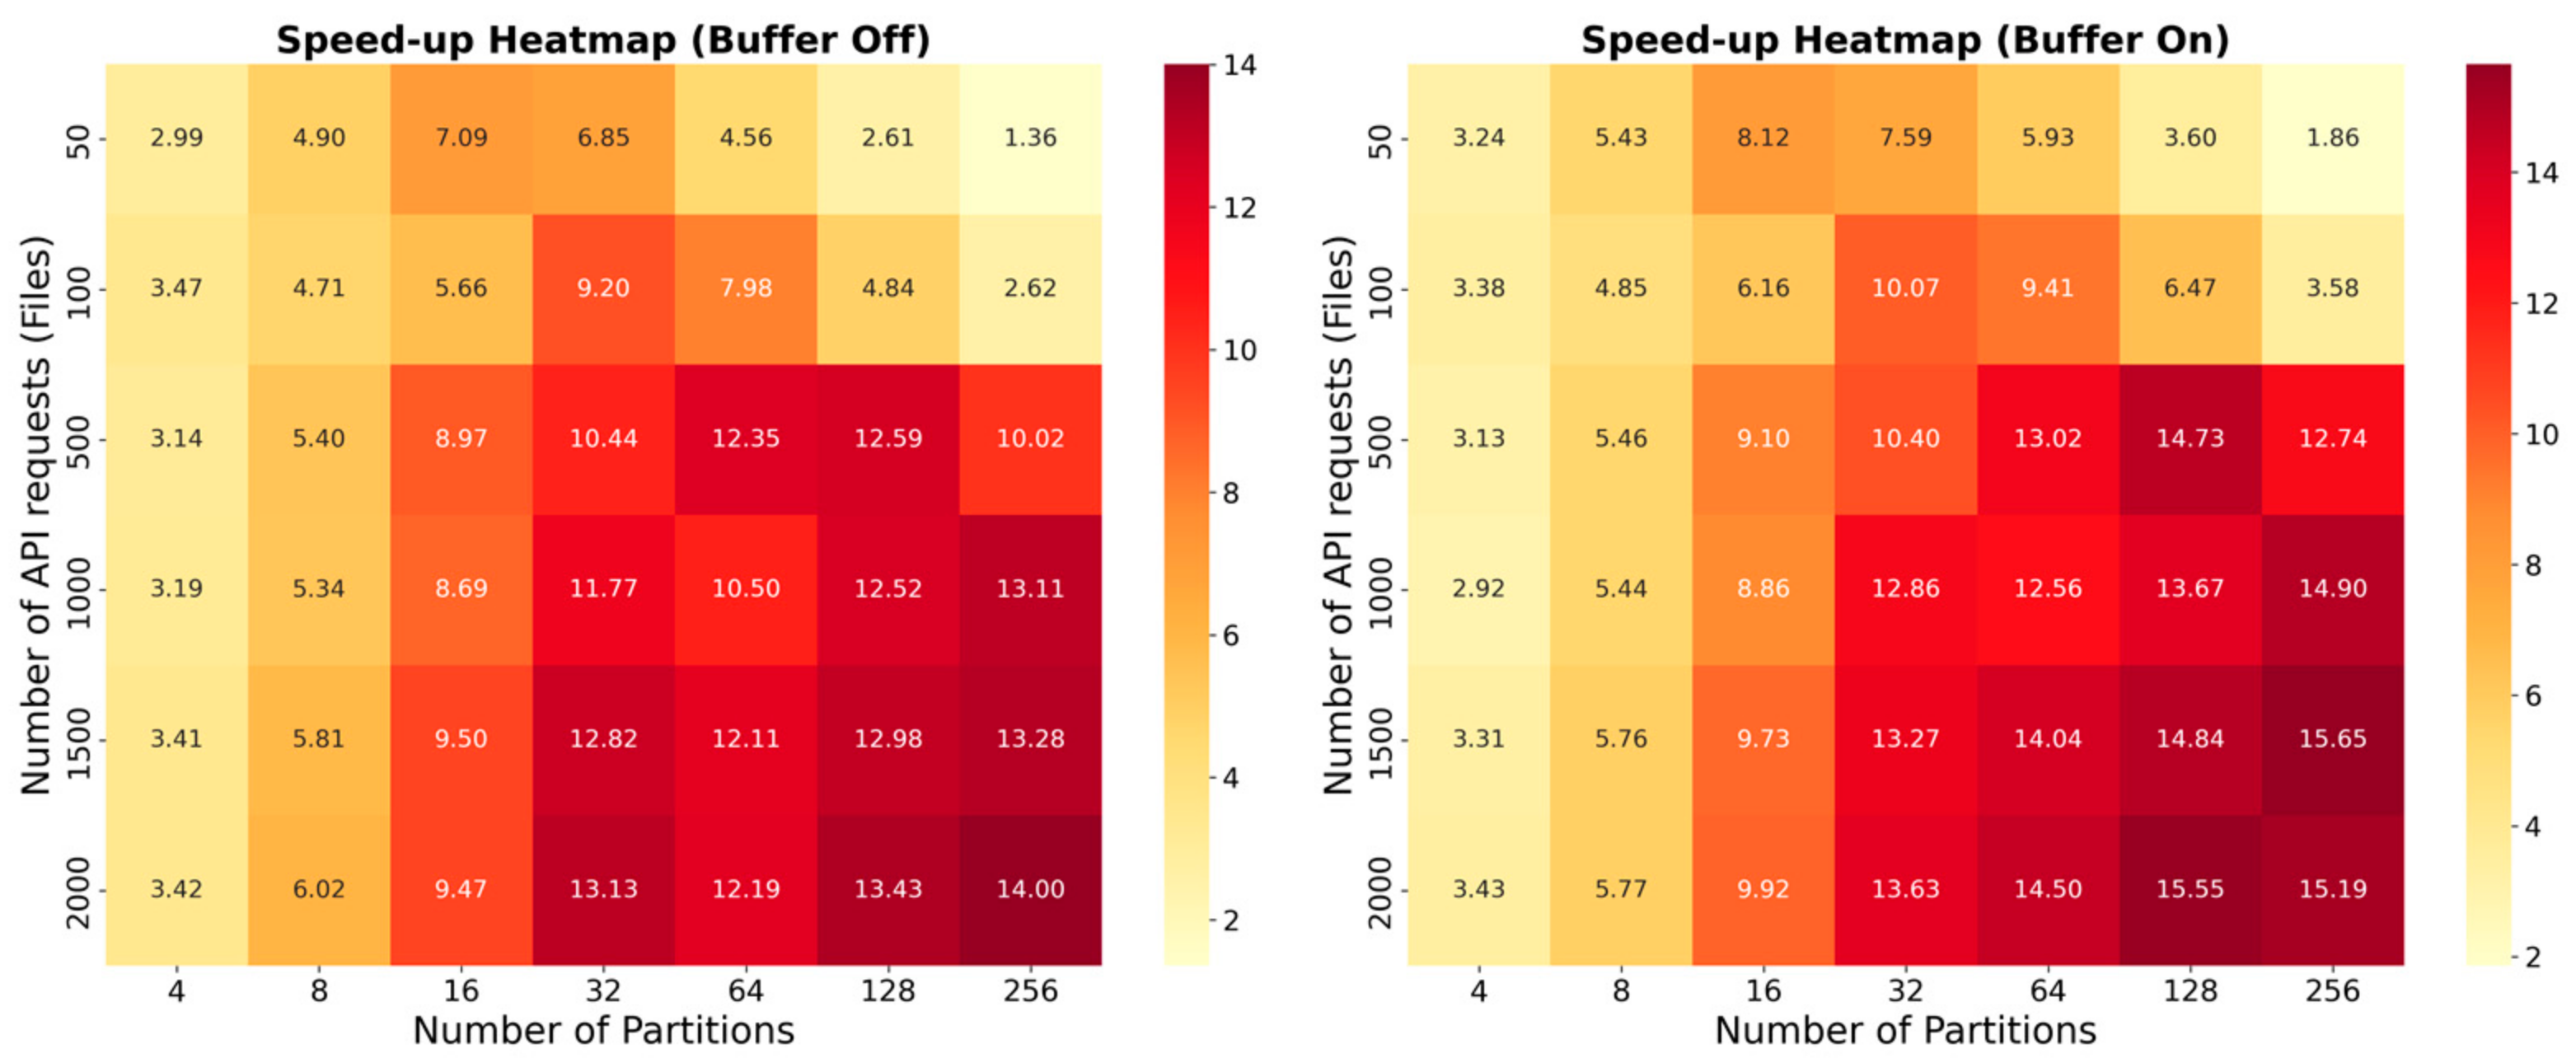
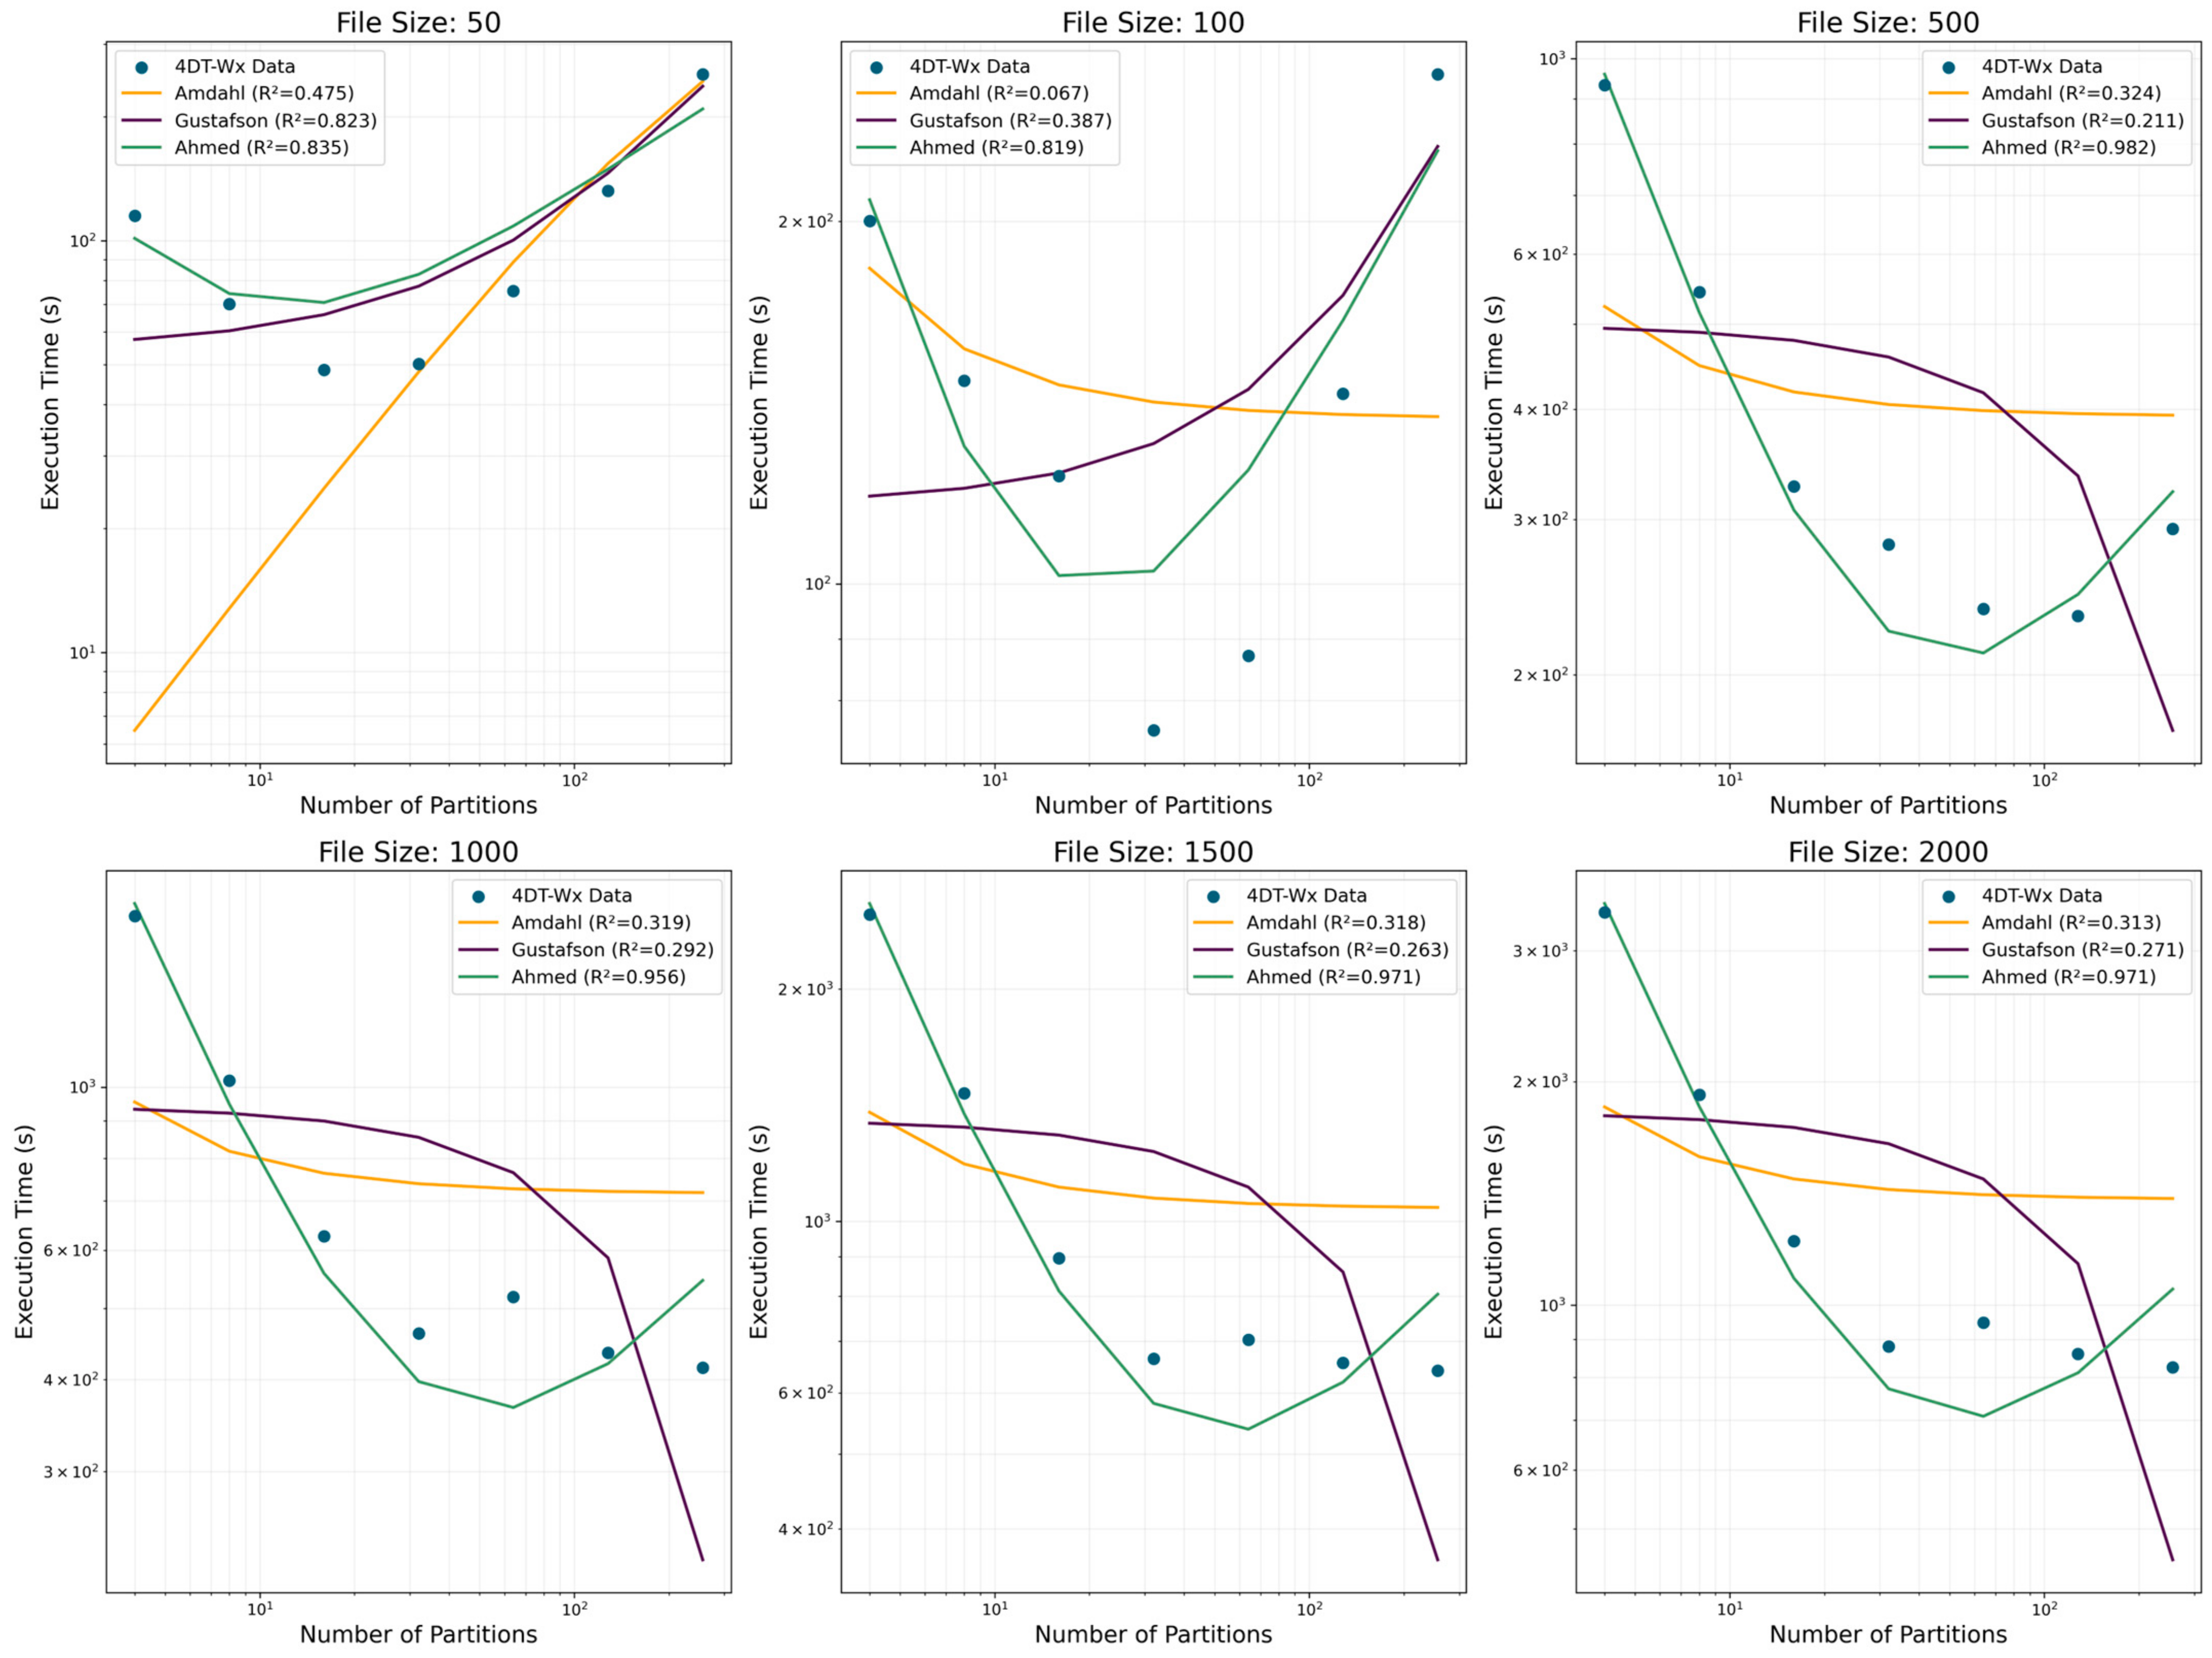
3.2.1. Scalability and Efficiency Analysis: Speedup and Partition Optimization

An analysis was conducted from the perspectives of scalability and efficiency of the 4DT-Wx prototype system. Lee [52] defined specific metrics for comparing the effects of various parallel algorithms, such as the speedup, efficiency, redundancy, utilization, and quality. The metrics speedup, S s p e e d u p , which indicates how much faster the parallel algorithm is compared with the corresponding serial algorithm, and efficiency, E E f f i c i e n c y , which indicates how well the processor is utilized to solve the problem, are mainly used in parallelism analyses [53,54]:
S s p e e d u p ( n ,   p ) = E T s e r i a l ( n , 1 ) E T p a r a l l e l ( n , p )
E E f f i c i e n c y ( n ,   p ) = S s p e e d u p ( n , p ) p
where n is the number of API requests, p is the number of partitions, ETserial(n, 1) is the execution time of the serial algorithm, and ETparallel(n, p) is the execution time of the parallel algorithm with p partitions.
Therefore, in this section, we analyzed the speedup and efficiency of the proposed parallel algorithm (Equations (3) and (4); Figure 5 and Figure 6). The system’s parallel processing capability was found to improve as the number of API requests increased. Specifically, when the number of API requests increased from 50 to 2000, using 32 partitions resulted in an increase in the speedup from 6.85 to 13.13, approximately 91.68%, and an increase in efficiency from 0.21 to 0.41, an improvement of 95%. This suggests that the 4DT-Wx system is more effective for large-scale data processing.
Upon examining the impact of the buffer presence, a slight performance improvement was observed when using BOn compared with BOff. For example, with 2000 API requests and 128 partitions, BOn showed an approximately 15.8% higher speedup than BOff. This is assumed to be due to the structural advantage of BOn (data locality), which allows more data to be processed in a single operation, indicating the potential for expanding the buffer size for API services. However, a decrease in efficiency with an increase in the number of partitions was also observed. When the number of API requests was 2000, increasing the number of partitions from four to eight resulted in a decrease in efficiency from 0.85 to 0.75, which is a factor to consider when scaling the system. The optimal number of partitions varied depending on the number of API requests.
Additionally, for 50–100 API requests, 8–32 partitions showed an optimal performance, while for 500–2000 API requests, 32–256 partitions performed best. This result considers both the speedup and efficiency. Notably, although 256 partitions provided the maximum speedup at high API request volumes, the efficiency dropped significantly, excluding it from the optimal partitions from a practical perspective.
Consequently, this suggests the need to dynamically adjust resources according to the anticipated load of the API service. Furthermore, the figures clearly illustrate the difference between the parallel and serial codes corresponding to the optimal partitions, demonstrating a consistent performance difference.
Figure 7 compares the total execution time of the serial algorithm with that of the parallel algorithm using the optimal number of partitions for different numbers of API requests (50, 100, 500, 1000, 1500, and 2000). This graph clearly visualizes the effect of parallelization. The execution time of the serial algorithm increases almost linearly as the number of API requests increases, whereas the execution time of the parallel algorithm shows a much gentler slope. This indicates that parallel processing provides significant performance improvements for large-scale data processing. Notably, as the number of API requests increases, the execution time gap between the serial and parallel algorithms widens. For example, at 50 API requests, the difference between the two algorithms is relatively small, but at 2000 API requests, the difference becomes significantly larger. This demonstrates that the benefits of parallelization are more pronounced in large-scale data processing. Additionally, the graph shows the results for the optimized number of partitions for each number of API requests.
Therefore, these results reflect the effect of optimized parallel processing tailored to the size of each task rather than simple parallelization. These findings empirically demonstrate that the parallelization strategy of the 4DT-Wx prototype system functions effectively, particularly showing excellent performance in large-scale data processing. Moreover, this graph indirectly indicates the system’s scalability, suggesting that the 4DT-Wx system can efficiently handle increasing API request loads.

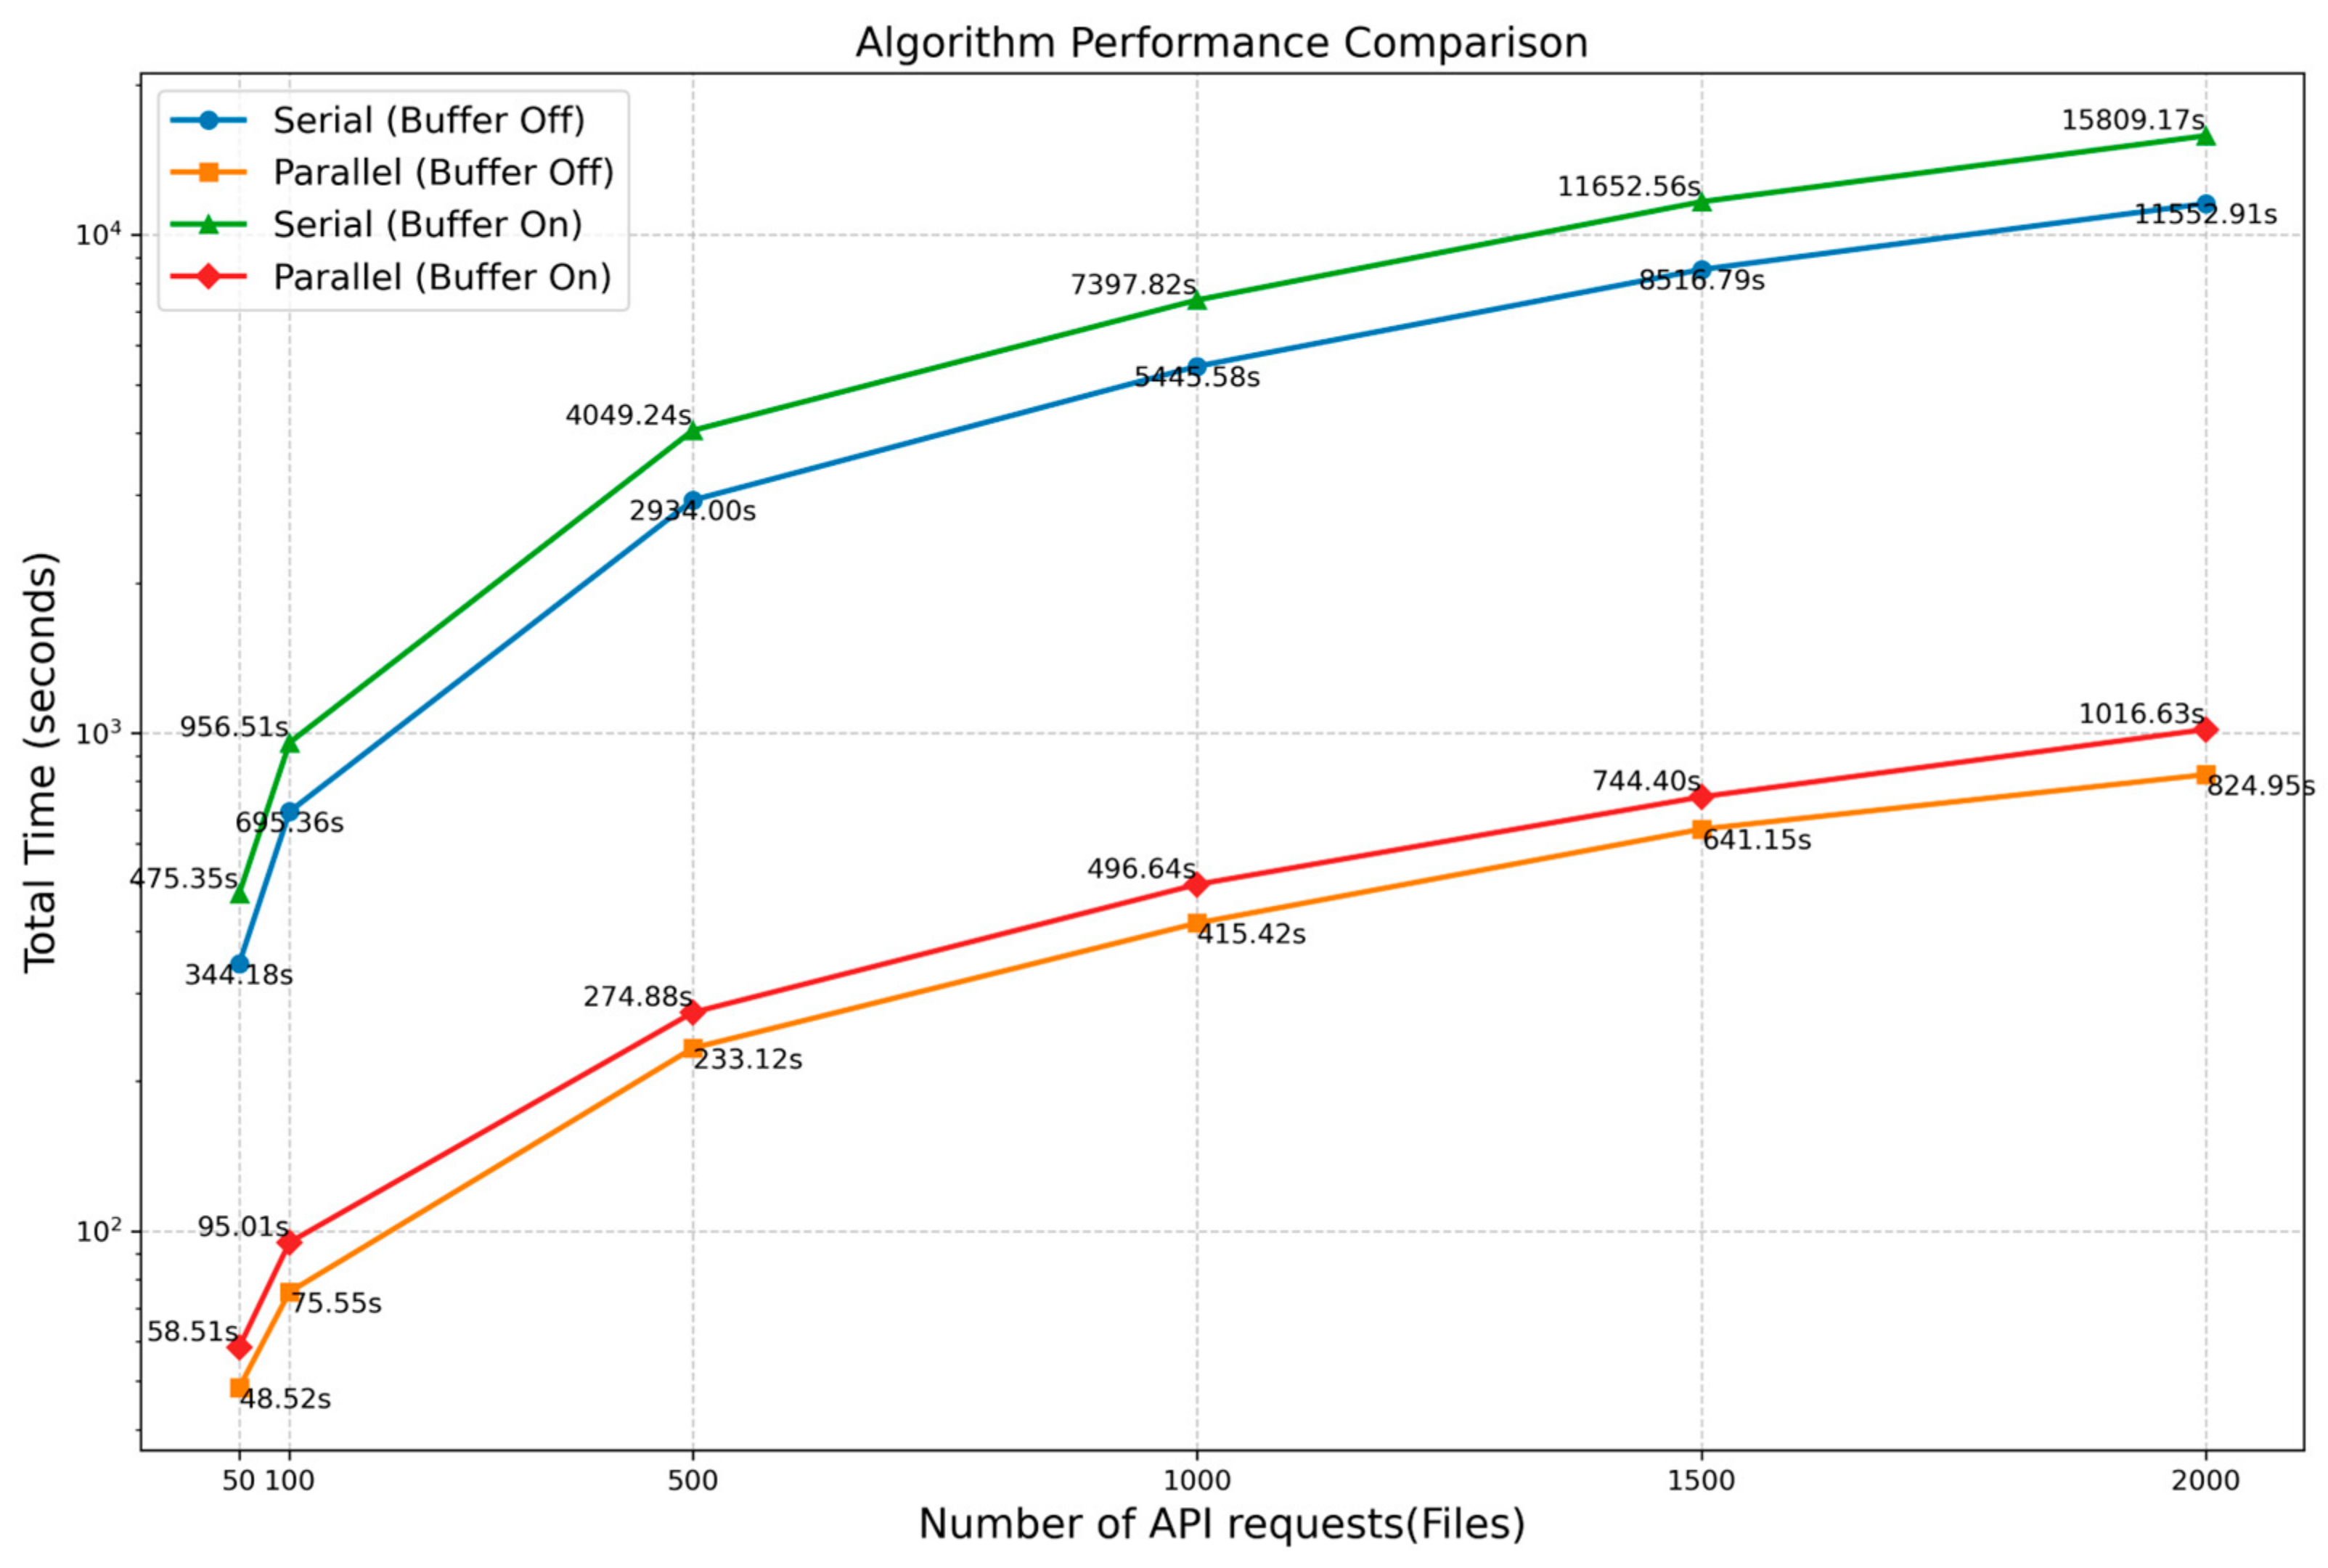
3.2.2. Comparative Analysis of Parallelization Performance

In this study, we applied the model proposed by Ahmed et al. [55] along with Amdahl’s and Gustafson’s laws to analyze the parallelization performance of our Spark-based big data processing system. By applying and comparing these three models to the actual performance data of our system, we can explain the performance characteristics of various Spark workloads and evaluate the efficiency of the implemented parallelization.
Therefore, we aimed to understand our system’s parallelization characteristics by analyzing the alignment of each model with the actual data, identifying the strengths and potential areas for improvement in the current implementation.
Amdahl’s and Gustafson’s laws are fundamental theories for understanding the benefits and limitations of parallel processing. Amdahl’s law focuses on the serial portion of the task that limits the speedup, while Gustafson’s law evaluates the effectiveness of parallelization under the assumption that the problem size can scale with the processing capability, suggesting that the efficiency of parallel processing can be maintained as the problem size increases. In contrast, the model proposed by Ahmed et al. offers a new approach that is adjusted for specific characteristics observed in the data, providing a more tailored prediction of the parallelization performance. The analysis was performed using only the BOff condition. This approach prevents additional delays and performance variations caused by buffers, allowing for a clearer observation of the actual effects of parallelization, and similar patterns to those demonstrated in the previously presented results (i.e., BOn).
The analysis results indicate that the model proposed by Ahmed et al. explains the actual data patterns of our system most accurately. The experimental results show that Ahmed et al.’s model demonstrated high R2 values, ranging from 0.819 to 0.982, for all numbers of API requests, particularly achieving very high accuracy with R2 values above 0.95 for 500 or more API requests (Table 3). This validates our implemented parallelization approach as being particularly effective for large-scale data processing. In contrast, Amdahl’s law showed a generally low explanatory power, and Gustafson’s law was also not suitable for most of our dataset. This suggests that our Spark workload performance does not scale in the manner assumed by these two models (Figure 8).
Classical models like Amdahl et al.’s model and Gustafson’s law assume fixed ratios of parallel and serial portions. However, our Spark-based system exhibits different characteristics, with its performance following more complex patterns than these models predict. While these classical models provide a basic understanding, they fail to accurately capture our system’s performance characteristics.
In conclusion, the high accuracy and consistency of Ahmed et al.’s model strongly support the effectiveness of our parallelization strategy, both theoretically and practically. It performs excellently in large-scale data processing, effectively handling the complex performance patterns that arise in real distributed environments. These findings suggest that more complex and flexible models, such as the one proposed by Ahmed et al., are necessary for performance prediction and optimization in Spark-based big data processing tasks as they meet these demands better than traditional parallel computing laws. Our system’s validation of Ahmed et al.’s model underscores its suitability for such purposes.

4. Discussion

The 4DT-Wx prototype system developed in this study presents an effective integration method for weather information for TBO. It differentiates itself from existing services through two main features: multi-model-based trajectory services and buffer zone information provision. These features can contribute significantly to the implementation of a high-performance ATM system, as recommended by ICAO’s GANP.
The multi-model approach combines the strengths of various weather models, providing more accurate and reliable weather information. This is crucial for improving the accuracy of aircraft trajectory predictions in a TBO environment. The provision of buffer zone information allows for flexible responses to unexpected situations, which is a crucial element in real-time decision making and strategic flight planning. This aspect has not been sufficiently addressed in previous studies.
The performance evaluation results showed excellent scalability and efficiency, particularly in large-scale data processing. This suggests that the system can meet the real-time processing capabilities required in a TBO environment.
The example in Figure 9 shows a visualization of the actual weather information extracted in this study, demonstrating the system’s practical applicability. The figure shows the temperature variations along the aircraft trajectories of KE725 (ICN-KIX) and KE1019 (GMP-CJU). KE1019, a domestic flight, uses only LDAPS data, while KE725 uses both LDAPS for high-resolution takeoff data and GDAPS for lower-resolution data outside the domestic region. The figure clearly illustrates how the presence of buffers enables the comprehensive monitoring of the surrounding conditions.
This visualization provides valuable information for pilots and air traffic controllers in real-time flight planning and decision making. The inclusion of buffer zone information enhances the ability to identify potential hazards and optimal route changes, significantly improving safety and efficiency.
Future research can focus on improving and optimizing the integration of various weather models, long-term performance evaluations, and the validation of buffer zone usage in actual TBO environments and on developing customized weather information provision methods for different flight phases. In conclusion, the 4DT-Wx prototype system developed in this study offers a new paradigm for weather information integration in TBO environments, contributing to enhanced aviation safety and operational efficiency while providing a robust foundation for addressing increasingly complex weather conditions and flight scenarios.

5. Conclusions

The 4DT-Wx prototype system developed in this study presents an innovative approach to integrating weather information for TBOs. Implementing multi-model-based trajectory services and buffer zone information offers a more comprehensive and flexible weather information integration method than existing services. The use of Apache Spark for a distributed processing system enables the efficient handling of large-scale weather data. These research results can contribute to the implementation of a high-performance ATM system, as required by ICAO’s GANP, and introduce a new paradigm for weather information integration in a TBO environment. Therefore, these analysis results can serve as important foundational data for the future implementation and optimization of the 4DT-Wx system’s API services, ensuring seamless weather data integration in TBOs utilizing geospatial information.

6. Patents

Korean patent (Patent Number: 10-2024-0108535) “System and method for Multi-Model Based 4D Weather Information Extraction”.

Author Contributions

Conceptualization, S.-I.K. and K.-S.H.; methodology, S.-I.K. and J.K.; software, S.-I.K.; validation, S.-I.K. and D.J.; formal analysis, S.-I.K.; investigation, S.-I.K.; resources, S.-I.K.; data curation, S.-I.K. and J.K.; writing—original draft preparation, S.-I.K.; writing—review and editing, S.-I.K., D.J. and K.-S.H.; visualization, S.-I.K.; supervision, K.-S.H.; project administration, D.-S.A.; funding acquisition, D.-S.A. All authors have read and agreed to the published version of the manuscript.

Funding

This work was funded by the KMA Research and Development Program under grant KMI 2022-01810.

Data Availability Statement

The model data used in this study are available from the Korea Meteorological Administration (KMA) API hub at https://apihub.kma.go.kr/, accessed on 23 September 2024. The ADS-B and derived datasets presented in this article are not readily available because they are part of an ongoing project. Requests to access these datasets should be directed to the corresponding author and are subject to approval from KMA.

Conflicts of Interest

The authors declare no conflicts of interest.

References

  1. ICAO. Doc 9750-AN/963. 2016–2030 Global Air Navigation Plan, 5th ed.; International Civil Aviation Organization: Montreal, QC, Canada, 2016. [Google Scholar]
  2. Da Silva, S. Global air navigation plan: The need for a harmonized evolution of the global air navigation system. In Proceedings of the 2018 Integrated Communications, Navigation, Surveillance Conference (ICNS), Herndon, VA, USA, 10–12 April 2018. [Google Scholar] [CrossRef]
  3. Macfarlane, R. Global harmonization and ICAO’s Global Air Navigation Plan (GANP). In Proceedings of the 2015 Integrated Communication, Navigation and Surveillance Conference (ICNS), Herndon, VA, USA, 21–23 April 2015. [Google Scholar] [CrossRef]
  4. Fellner, A.; Konieczka, R. Rotorcraft in the performance based navigation international civil aviation organization implementation. Trans. Aerosp. Res. 2019, 2019, 53–64. [Google Scholar] [CrossRef]
  5. Batuwangala, E.; Kistan, T.; Gardi, A.; Sabatini, R. Certification challenges for next-generation avionics and air traffic management systems. IEEE Aerosp. Electron. Syst. Mag. 2018, 33, 44–53. [Google Scholar] [CrossRef]
  6. Sauer, M. On the Impact of Adverse Weather Uncertainty on Aircraft Routing: Identification and Mitigation. Ph.D. Thesis, Leibniz Universit, Hannover, Germany, 2015. [Google Scholar] [CrossRef]
  7. Menon, P.K.; Yang, B.J.; Dutta, P.; Park, S.G.; Chen, O.; Cheng, V.H.L. A Computational Platform for Analyzing the Safety of the National Airspace System. In Proceedings of the Annual Conference of the PHM Society, Chongqing, China, 26–28 October 2018; Volume 10. [Google Scholar] [CrossRef]
  8. Sridhar, B.; Bell, D. Sustainable Aviation Operations and the Role of Information Technology and Data Science: Background, Current Status and Future Directions. In Proceedings of the AIAA AVIATION 2022 Forum, Chicago, CA, USA, 27 June 2022. [Google Scholar] [CrossRef]
  9. Concept for the Integration of Meteorological Information for Air Traffic Management, 6th ed. Available online: https://old.wmo.int/aemp/sites/default/files/ICAO%20Concept%20for%20Integration%20of%20MET%20Information%20Integration%20for%20ATM%20v00%2006%2000.pdf (accessed on 31 July 2024).
  10. White Paper Future Aeronautical Meteorology Information Delivery, Developed by the ICAO Meteorology Panel. Available online: https://www.icao.int/airnavigation/METP/METP%20Reference%20Documents/White%20Paper%20on%20Future%20Aeronautical%20Meteorological%20Information%20Service%20%20Delivery.pdf (accessed on 31 July 2024).
  11. Torres, S.; Kloster, J.K.; Ren, L.; CastilloEffen, M. Trajectory Synchronization Between Air and Ground Trajectory Predictors. In Proceedings of the 30th IEEE/AIAA Digital Avionics Systems Conference (DASC), Seattle, WA, USA, 16–20 October 2011. [Google Scholar] [CrossRef]
  12. SESAR Joint Undertaking, EUROPEAN ATM MASTER PLAN. Available online: https://www.sesarju.eu/masterplan2020 (accessed on 31 July 2024).
  13. Federal Aviation Administration. 2018–2019 NextGen Implementation Plan. Available online: https://www.faa.gov/nextgen/2018-2019-nextgen-implementation-plan (accessed on 31 July 2024).
  14. Ma, L.; Meng, X.; Wu, Z. Data-Driven 4D Trajectory Prediction Model Using Attention-TCN-GRU. Aerospace 2024, 11, 313. [Google Scholar] [CrossRef]
  15. ICAO. Doc. 9854-AN/458. Global Air Traffic Management Operation Concept, 1st ed.; International Civil Aviation Organization: Montreal, QC, Canada, 2015. [Google Scholar]
  16. Chang, Z.; Hu, M.; Zhang, Y. Multi-Objective Aircraft Robust Trajectory Optimization Considering Various Predictability Metrics Under Uncertain Wind. IEEE Access 2023, 11, 104333–104346. [Google Scholar] [CrossRef]
  17. Huang, J.; Ding, W. Aircraft Trajectory Prediction Based on Bayesian Optimised Temporal Convolutional Network–Bidirectional Gated Recurrent Unit Hybrid Neural Network. Int. J. Aerosp. Eng. 2022, 2022, 2086904. [Google Scholar] [CrossRef]
  18. Jiang, G.; Hou, Z. A data-driven approach for trajectory-based aircraft operation with controlled time of arrival and along-track wind effects. Trans. Inst. Meas. Control. 2017, 42, 2166–2177. [Google Scholar] [CrossRef]
  19. Kithmal Wickramasinghe, N.; Nakamura, Y.; Senoguchi, A. Evaluating the Influence of Weather Prediction Accuracy on Aircraft Performance Estimation. In Proceedings of the 2021 Asia-Pacific International Symposium on Aerospace Technology (APISAT 2021), Jeju, Republic of Korea, 15–17 November 2021; Springer: Singapore, 2021. [Google Scholar] [CrossRef]
  20. Lindner, M.; Rosenow, J.; Zeh, T.; Fricke, H. In-Flight Aircraft Trajectory Optimization within Corridors Defined by Ensemble Weather Forecasts. Aerospace 2020, 7, 144. [Google Scholar] [CrossRef]
  21. Xu, Z.; Zeng, W.; Chu, X.; Cao, P. Multi-Aircraft Trajectory Collaborative Prediction Based on Social Long Short-Term Memory Network. Aerospace 2021, 8, 115. [Google Scholar] [CrossRef]
  22. Xu, M.; Hu, M.; Zhou, Y.; Ding, W.; Wu, Q. Multi-Aircraft Cooperative Strategic Trajectory-Planning Method Considering Wind Forecast Uncertainty. Sustainability 2022, 14, 10811. [Google Scholar] [CrossRef]
  23. Met Office, 4D-Trajectory API (4DT). Available online: https://www.metoffice.gov.uk/services/transport/aviation/commercial/aviation-data-services/4dt (accessed on 31 August 2024).
  24. Liu, T.; Xiong, T.; Thomas, L.; Liang, Y. ADS-B Based Wind Speed Vector Inversion Algorithm. IEEE Access 2020, 8, 150186–150198. [Google Scholar] [CrossRef]
  25. WMO. No.1200. Guide to Aircraft-Based Observations. Available online: https://community.wmo.int/en/activity-areas/aircraft-based-observations/resources/manuals-and-guides (accessed on 23 September 2024).
  26. WMO. No.8. Guide to Instruments and Methods of Observation: Volume III—Observing Systems. Available online: https://library.wmo.int/records/item/68661-guide-to-instruments-and-methods-of-observation (accessed on 31 August 2024).
  27. De Haan, S.; de Haij, M.; Sondij, J. The Use of a Commercial ADS-B Receiver to Derive Upper Air Wind and Temperature Observations from MODE-S EHS Information in The Netherlands; KNMI: De Bilt, The Netherlands, 2013. [Google Scholar]
  28. De Haan, S. High-resolution wind and temperature observations from aircraft tracked by mode-S air traffic control radar. J. Geophys. Res. Atmos. 2011, 116, D10111. [Google Scholar] [CrossRef]
  29. De Leege, A.M.P.; van Paassen, M.M.; Mulder, M. Using automatic dependent surveillance-broadcast for meteorological monitoring. J. Aircr. 2013, 50, 249–261. [Google Scholar] [CrossRef]
  30. Stone, E.K.; Kitchen, M. Introducing an approach for extracting temperature from aircraft GNSS and pressure altitude reports in ADS-B messages. J. Atmos. Ocean. Technol. 2015, 32, 736–743. [Google Scholar] [CrossRef]
  31. Open Geospatial Consortium—CoverageJSON. Available online: https://www.ogc.org/standard/coveragejson/ (accessed on 31 August 2024).
  32. Zhang, R.; Rong, Y.; Tian, J.; Su, H.; Li, Z.-L.; Liu, S. A Remote Sensing Method for Estimating Surface Air Temperature and Surface Vapor Pressure on a Regional Scale. Remote Sens. 2015, 7, 6005–6025. [Google Scholar] [CrossRef]
  33. Amirfakhrian, M.; Samavati, F. Weather daily data approximation using point adaptive ellipsoidal neighborhood in scattered data interpolation methods. Appl. Math. Comput. 2021, 392, 125717. [Google Scholar] [CrossRef]
  34. Bemporad, A. Active learning for regression by inverse distance weighting. Bit Numer. Math. 2023, 626, 275–292. [Google Scholar] [CrossRef]
  35. Li, F.; Shang, Z.; Liu, Y.; Shen, H.; Jin, Y. Inverse distance weighting and radial basis function based surrogate model for high-dimensional expensive multi-objective optimization. Appl. Soft Comput. 2024, 152, 111194. [Google Scholar] [CrossRef]
  36. Ruzanski, E.; Chandrasekar, V. Weather Radar Data Interpolation Using a Kernel-Based Lagrangian Nowcasting Technique. IEEE Trans. Geosci. Remote Sens. 2015, 53, 3073–3083. [Google Scholar] [CrossRef]
  37. Parmentier, B.; McGill, B.; Wilson, A.M.; Regetz, J.; Jetz, W.; Guralnick, R.P.; Tuanmu, M.-N.; Robinson, N.; Schildhauer, M. An Assessment of Methods and Remote-Sensing Derived Covariates for Regional Predictions of 1 km Daily Maximum Air Temperature. Remote Sens. 2014, 6, 8639–8670. [Google Scholar] [CrossRef]
  38. Apache Spark™—Unified Analytics Engine for Big Data. Available online: https://spark.apache.org/ (accessed on 1 August 2024).
  39. Oğur, N.B.; Al-Hubaishi, M.; Çeken, C. IoT data analytics architecture for smart healthcare using RFID and WSN. ETRI J. 2022, 44, 135–146. [Google Scholar] [CrossRef]
  40. Zhao, Y.; Hu, F.; Chen, H. An adaptive tuning strategy on spark based on in-memory computation characteristics. In Proceedings of the 2016 18th International Conference on Advanced Communication Technology (ICACT), Pyeongchang, Republic of Korea, 31 January–3 February 2016. [Google Scholar] [CrossRef]
  41. Zaharia, M.; Chowdhury, M.; Das, T.; Dave, A.; Ma, J.; McCauley, M.; Franklin, M.J.; Shenker, S.; Stoica, I. Resilient Distributed Datasets: A Fault-Tolerant abstraction for in-Memory Cluster Computing. In Proceedings of the 9th USENIX Symposium on Networked Systems Design and Implementation (NSDI 12), San Jose, CA, USA, 25–27 April 2012. [Google Scholar]
  42. Choi, J.H.; Park, J.; Park, H.D.; Min, O.G. DART: Fast and efficient distributed stream processing framework for internet of things. ETRI J. 2017, 39, 202–212. [Google Scholar] [CrossRef]
  43. Nie, P.; Cui, Z.; Wan, Y. A Rapid Parallel Mosaicking Algorithm for Massive Remote Sensing Images Utilizing Read Filtering. Remote Sens. 2023, 15, 4863. [Google Scholar] [CrossRef]
  44. Gounaris, A.; Torres, J. A Methodology for Spark Parameter Tuning. Big Data Res. 2018, 11, 22–32. [Google Scholar] [CrossRef]
  45. Vo, A.V.; Laefer, D.F.; Byrne, J. Optimizing Urban LiDAR Flight Path Planning Using a Genetic Algorithm and a Dual Parallel Computing Framework. Remote Sens. 2021, 13, 4437. [Google Scholar] [CrossRef]
  46. Xu, C.; Du, X.; Yan, Z.; Fan, X. ScienceEarth: A Big Data Platform for Remote Sensing Data Processing. Remote Sens. 2020, 12, 607. [Google Scholar] [CrossRef]
  47. Salloum, S.; Dautov, R.; Chen, X.; Peng, P.X.; Huang, J.Z. Big data analytics on Apache Spark. Int. J. Data Sci. Anal. 2016, 1, 145–164. [Google Scholar] [CrossRef]
  48. Gupta, Y.K.; Kumari, S. A Study of Big Data Analytics using Apache Spark with Python and Scala. In Proceedings of the 2020 3rd International Conference on Intelligent Sustainable Systems (ICISS), Thoothukudi, India, 3–5 December 2020. [Google Scholar] [CrossRef]
  49. Agustin, E.V.; Cruz, F.R.G. Implementation of Sensor Data Fusion in Radiosonde based on WMO Standard Data Format. In Proceedings of the 2022 6th International Conference on Electrical, Telecommunication and Computer Engineering (ELTICOM), Medan, Indonesia, 22–23 November 2022. [Google Scholar] [CrossRef]
  50. Hurter, C.; Alligier, R.; Gianazza, D.; Puechmorel, S.; Andrienko, G.; Andrienko, N. Wind parameters extraction from aircraft trajectories. Comput. Environ. Urban Syst. 2014, 47, 28–43. [Google Scholar] [CrossRef]
  51. Huy, V. ADS-B and Mode-S Data for Aviation Meteorology and Aircraft Performance Modelling. Master’s Thesis, Faculty of Aerospace Engineering, Delft University of Technology, Delft, The Netherlands, 2018. [Google Scholar]
  52. Lee, R.B.L. Empirical Results on the Speed, Efficiency, Redundancy and Quality of Parallel Computations. In Proceedings of the International Conference on Parallel Processing 9th: IEEE Computer Society, Harbor Springs, MI, USA, 26–29 August 1980. [Google Scholar]
  53. Parhami, B. Introduction to Parallel Processing: Algorithms and Architectures; Springer Science & Business Media: Berlin/Heidelberg, Germany, 2006. [Google Scholar]
  54. Liu, E.S.; Theodoropoulos, G.K. An analysis of parallel interest matching algorithms in distributed virtual environments. In Proceedings of the 2013 Winter Simulations Conference (WSC), Washington, DC, USA, 8–11 December 2013. [Google Scholar] [CrossRef]
  55. Ahmed, N.; Barczak, A.L.; Rashid, M.A.; Susnjak, T. A parallelization model for performance characterization of Spark Big Data jobs on Hadoop clusters. J. Big Data 2021, 8, 107. [Google Scholar] [CrossRef]
Figure 1. Study area and data description (white lines—ADS-B data; blue boundary—Incheon FIR).
Remotesensing 16 03573 g001
Figure 2. Architecture of the 4DT-Wx prototype system.
Remotesensing 16 03573 g002
Figure 3. Technological framework for the 4DT-Wx prototype system.
Remotesensing 16 03573 g003
Figure 4. Performance comparison of variables (T, WD, and WS) and interpolation methods (IDW, linear, and spline) in a Taylor diagram.
Remotesensing 16 03573 g004
Figure 5. Efficiency heatmap for BOff (left) and BOn (right) across different numbers of API requests.
Remotesensing 16 03573 g005
Figure 6. Speedup heatmap for BOff (left) and BOn (right) across different numbers of API requests.
Remotesensing 16 03573 g006
Figure 7. Comparison of the total execution time between serial and parallel algorithms for BOff and BOn and different numbers of API requests.
Remotesensing 16 03573 g007
Figure 8. Comparison of parallelization models (Ahmed et al.’s model, Amdahl’s law, and Gustafson’s law) across different numbers of API requests (BOff).
Remotesensing 16 03573 g008
Figure 9. Visualization of weather information extracted from the 4DT-Wx prototype system for KE725 (ICN-KIX) and KE1019 (GMP-CJU).
Remotesensing 16 03573 g009
Table 1. Accuracy validation of 4DT-Wx data using different interpolation methods.
VariablesSpline InterpolationIDW InterpolationLinear Interpolation
R2RMSEBiasR2RMSEBiasR2RMSEBias
Temperature T (°C)0.933.24−0.70.933.28−0.70.933.24−0.7
Wind Direction WD (°)0.586.91−0.580.586.99−0.580.596.91−0.58
Wind Speed WS (knots)0.9212.682.020.9212.731.860.9212.682.02
Table 2. Processing speed comparison for interpolation methods (spline, IDW, and linear).
Interpolation MethodSpline InterpolationIDW InterpolationLinear Interpolation
No. of points/s1195.951163.041200.06
Time/point0.000836 s0.000860 s0.000833 s
Table 3. R2 estimates for parallelization models (Ahmed et al.’s model, Amdahl’s law, and Gustafson’s law) under the BOff condition.
Number of API RequestsR2
Ahmed et al.’s Model Amdahl’s LawGustafson’s Law
500.8350.4750.823
1000.8190.0670.387
5000.9820.3240.211
10000.9560.3190.292
15000.9710.3180.263
20000.9710.3130.271
Disclaimer/Publisher’s Note: The statements, opinions and data contained in all publications are solely those of the individual author(s) and contributor(s) and not of MDPI and/or the editor(s). MDPI and/or the editor(s) disclaim responsibility for any injury to people or property resulting from any ideas, methods, instructions or products referred to in the content.

