Abstract
Studies of the impact of biomass burning and the emissions of trace gases from biomass burning, especially using long-term observations, are scarce in China. We utilize solar absorption spectra obtained via ground-based high-resolution Fourier transform infrared (FTIR) spectroscopy to retrieve the atmospheric total columns and vertical profiles of carbon monoxide (CO), formaldehyde (H2CO), and hydrogen cyanide (HCN) in Hefei, China. Seasonal and interannual variability in the three gases from 2016 to 2022 are analyzed. Atmospheric CO shows significant seasonal variations, peaking during spring and winter, and declining during summer, with a seasonal amplitude of 8.07 × 10¹⁷ molecules cm−2 and a seasonal variability of 29.35%. H2CO and HCN have similar seasonal patterns to each other, with high concentrations in summer and low concentrations in winter. The seasonal amplitude of H2CO and HCN are 1.89 × 10¹⁶ molecules cm−2 and 2.32 × 10¹⁵ molecules cm−2, respectively, with a seasonal variability of 133.07% and 34.69%, respectively. The means of the annual variation rate for CO, H2CO, and HCN are (−2.67 ± 2.88)% yr−1, (2.52 ± 12.48)% yr−1 and (−3.48 ± 7.26)% yr−1, respectively. To assess the influence of biomass burning on the variations in column concentrations of the three gases, the correlation between CO, H2CO, and HCN was analyzed. The months during which the monthly correlation coefficient between CO and H2CO with HCN exceeds 0.8, and the fire radiative power (FRP) observed by satellites is larger than its monthly average are regarded as a biomass-burning occurrence in Anhui province. Additionally, the enhancement ratios of ΔH2CO/ΔCO and ΔHCN/ΔCO were calculated for the periods impacted by the biomass burning. Finally, backward trajectory cluster analysis and the potential source contribution function (PSCF) calculation identified the air mass transport pathways and the potential source areas at the Hefei site.
1. Introduction
Biomass burning significantly contributes to atmospheric particulate matter, greenhouse gases, and pollution gases, thereby influencing air quality and global radiative forcing, as well as accelerating climate change [1,2,3,4]. Emissions from biomass burning release various trace gases, including carbon monoxide (CO), formaldehyde (H2CO), and hydrogen cyanide (HCN) [5]. HCN has a lifetime of approximately 2–4 months, while CO persists for around two months [6,7]. H2CO rapidly reacts with OH, NO3, Br, and Cl, resulting in a typical persistence of several hours [8]. The primary sources of CO include fossil fuel combustion, biomass burning, and oxidation of hydrocarbons, including methane. CO is a significant tropospheric pollutant, functioning as an ozone precursor and an indirect greenhouse gas [9,10]. In the troposphere, CO is predominantly removed through oxidation by the hydroxyl radical (OH) [11], playing a crucial role in atmospheric chemistry by influencing the tropospheric oxidizing capacity [12]. H2CO is released directly into the atmosphere through various sources, including anthropogenic emissions, such as industrial emissions and motor exhaust, biogenic emissions such as from living and decaying plants and seawater, and pyrogenic emissions such as burning of garbage, biomass fuels, and paddy stubble [13,14,15,16,17,18,19]. Direct emissions from biomass burning account for a minor part of the H2CO budget, but biomass burning is an important local source, particularly during fire events. Additionally, H2CO forms through the degradation of hydrocarbons and serves as an important intermediate in the oxidation of volatile organic compounds (VOCs) from biogenic, anthropogenic, and pyrogenic sources [20]. For atmospheric HCN, the main contributor is biomass burning [21]. The main sink for HCN is ocean uptake, with minor sinks including reactions with atmospheric hydroxyl radicals (OH) and O(1D), and photolysis [22,23,24]. Because of its chemical inactivity and extended longevity, HCN is considered a reliable tracer for biomass-burning emissions [7,25]. Therefore, measurements of HCN are particularly useful for identifying the characteristics of atmospheric-gas variations driven by biomass burning.
Ground-based high-resolution Fourier transform infrared (FTIR) spectroscopy can precisely measure total columns of CO, H2CO, HCN, and other trace gases [26,27,28]. Changes in atmospheric composition caused by biomass burning can be reflected by variations in CO, H2CO, and HCN [29]. Combined measurements of CO and HCN aid in comprehending the transport of biomass-burning emissions [7,30]. Lutsch et al., (2020) utilized the data measured by FTIR at multiple sites to trace sources of atmospheric CO, HCN, and ethane (C2H6), highlighting the efficacy of ground-based FTIR in quantifying emissions from biomass burning [31]. Based on FTIR measurements conducted at the Xianghe station in China, Zhou et al. (2022) discovered a significant correlation between CO and various compounds such as acetylene (C2H2), C2H6, H2CO, and HCN. By combining backward simulations based on the FLEXPART model and satellite observations, the researchers demonstrated that emissions from wildfires in northern Russia contributed to the elevated total columns of HCN in Xianghe [32].
Although some sites have utilized ground-based FTIR spectroscopy to analyze trace gases such as CO, H2CO, and HCN to explore the impact of biomass burning on atmospheric composition, the study of the influence of biomass burning and the emissions of trace gases during biomass burning, especially using long-term observations, are relatively scarce in China. This study fills the knowledge gap by investigating the total column variations and interrelationships of CO, H2CO, and HCN. In addition, the Hefei site is located in the northwestern suburb of Hefei City, which is in the Yangtze River delta region. Hefei city has suffered from heavy air pollution in recent years, due to rapidly growing industry, high levels of traffic, energy consumption, and biomass burning, so the study of the effect of these sources on the variation of the pollution gases and taking measures to control pollution emissions are of great significance. Section 2 details the observation site, instruments, spectral retrieval methods, retrieval strategies, typical retrieval information, and error analysis. Section 3 discusses the seasonal variation and annual variation of CO, H2CO, and HCN from 2016 to 2022, and calculates the enhancement ratio of H2CO and HCN relative to CO in biomass-burning periods. Section 4 summarizes the conclusion of this study.
2. Measurements and Methods
2.1. Instruments and Site Description
The ground-based FTIR remote-sensing site in Hefei is situated at 31.91°N, 117.17°E, and 29 m above sea level, which is within the urban environment of this city in eastern China. Managed by the Key Laboratory of Environmental Optics and Technology, the site has a rooftop solar tracker (A547N, Bruker, Billerica, MA, USA) and a high-resolution Fourier transform infrared spectrometer (Bruker IFS 125HR, Bruker, Billerica, MA, USA) among its instruments. The instrument is specifically designed for atmospheric remote sensing on clear days, and it alternately collects mid-infrared (MIR) and near-infrared (NIR) solar absorption spectra. This spectrometer covers key absorption features of various atmospheric gases. Equipped with a Michelson interferometer, it has high spectral resolution and can precisely observe trace gases. The FTIR spectrometer works in conjunction with the automatic solar tracker, which aligns the instrument with the sun to ensure continuous and reliable data collection. Since September 2015, the observation site has also been equipped with a weather station (ZENO, Coastal Environmental Systems, Seattle, WA, USA) that records meteorological data [33,34]. The FTIR instrument uses an indium gallium arsenide (InGaAs) detector and a calcium fluoride (CaF2) beam splitter to record NIR solar spectra (4000–11,000 cm−1), with a spectral resolution of 0.02 cm−1 [11,33]. For NIR spectra, the spectrum acquisition time is approximately 90 s. For MIR spectra (600–4500 cm−1), it employs a potassium bromide (KBr) beam splitter, a mercury cadmium telluride (MCT) detector, and an indium antimonide (InSb) detector, achieving a spectral resolution of 0.005 cm−1 [33,35]. The spectrum acquisition time is approximately 288 s. Multiple optical filters mounted in front of the detectors are employed to enhance the signal-to-noise ratio (SNR) of the retrieval spectra. Low-pressure HBr and HCl cells are used to maintain proper alignment of the interferometer and to monitor the instrument line shape (ILS) of the spectrometer [11,33,35].
2.2. The Retrieval Principles
The MIR spectra at the Hefei site are analyzed using the SFIT4 algorithm, which is an improved version of SFIT2 [6,36], to retrieve CO, H2CO, and HCN profiles. The forward model () describes the physical processes of solar radiation interacting with the atmosphere, linking the parameter vector () representing atmospheric state and auxiliary/instrumental parameters with the state vector () and measurement vector () from the measured solar absorption spectrum, as shown below:
In this equation, denotes the measurement noise, which includes random noise and retrieval uncertainty. This scenario presents an ill-posed problem, as nearly identical spectra () can be yielded by multiple atmospheric states (). The ill-posed problem is mostly due to a lack of vertical resolution. To mitigate this issue, a cost function () is employed to constrain the solution state:
The discrepancy between the spectrum simulated under the defined atmospheric state () and the observed spectrum () is quantified in the first term, with being the measurement covariance matrix for . The regularization term corresponds to the second term. denotes the covariance matrix of the a priori, reflecting the uncertainty or confidence in the a priori estimate, and is used to define the strength and type of constraint that constrain the a priori state () and the atmospheric state (). The solution is obtained by minimizing the cost function . Since the FTIR measurement’s forward model is nonlinear, numerical methods are used to iteratively minimize the cost function. The iteration process for the (i + 1)th is described as follows:
where G represents the gain matrix, capturing the sensitivity of the measurement vector () to variations in the atmospheric state () as represented by the Jacobian matrix (). The relationship between the true state vector () and the retrieved state vector () can be formulated as follows [37]:
In this equation, is the matrix of averaging kernel (). quantifies the degrees of freedom for signal (DOFs), with its trace indicating the vertically independent information derived from the measurements. denotes the error terms.
From retrieval results, total column () can be calculated as follows:
In this equation, , , and denote the a priori, the target species’ true profile, and the profile array of dry air partial column, respectively; is the retrieval uncertainty of the total column; stands for the averaging kernel of the total column; represents the a priori total column of the target species [32,38]. This comprehensive process ensures accurate retrieval of atmospheric profiles from MIR spectra.
2.3. Retrieval Strategies
The retrieval strategy determines the accuracy of the solar absorption spectrum retrieval results. Trace gases have different absorption characteristics in different spectral bands. The selected spectral window for retrieval should not only avoid the saturation of strong absorption lines but also avoid the signal of weak absorption lines being submerged by noise, so as to minimize the interference of other gases and solar spectral lines. A prior profile information and interference gas composition have an important influence on spectral retrieval. The spectral retrieval parameters of atmospheric CO, H2CO, and HCN are set as shown in Table 1. There are three retrieval windows for CO and HCN, and four for H2CO. The spectroscopic signatures of the interfering gases were accounted for to minimize fitting residuals. H2O and HDO are treated as distinct interfering species during retrieval, with line parameters sourced from the HITRAN 2008 database. The daily atmospheric temperature, pressure, and humidity a priori profiles are interpolated using reanalysis data from the National Centers for Environmental Prediction (NCEP) [39]. A priori profile data from version 6 of the Whole Atmosphere Community Climate Model (WACCAM) are used for CO, H2CO, HCN, and other interfering gases except H2O and HDO. The ground meteorological data are recorded by the weather station. The atmosphere is divided into 48 discrete layers from the surface to 120 km for model calculation [35,40,41].

Table 1.
Spectral retrieval strategies parameter settings.
2.4. Typical Retrieval Information
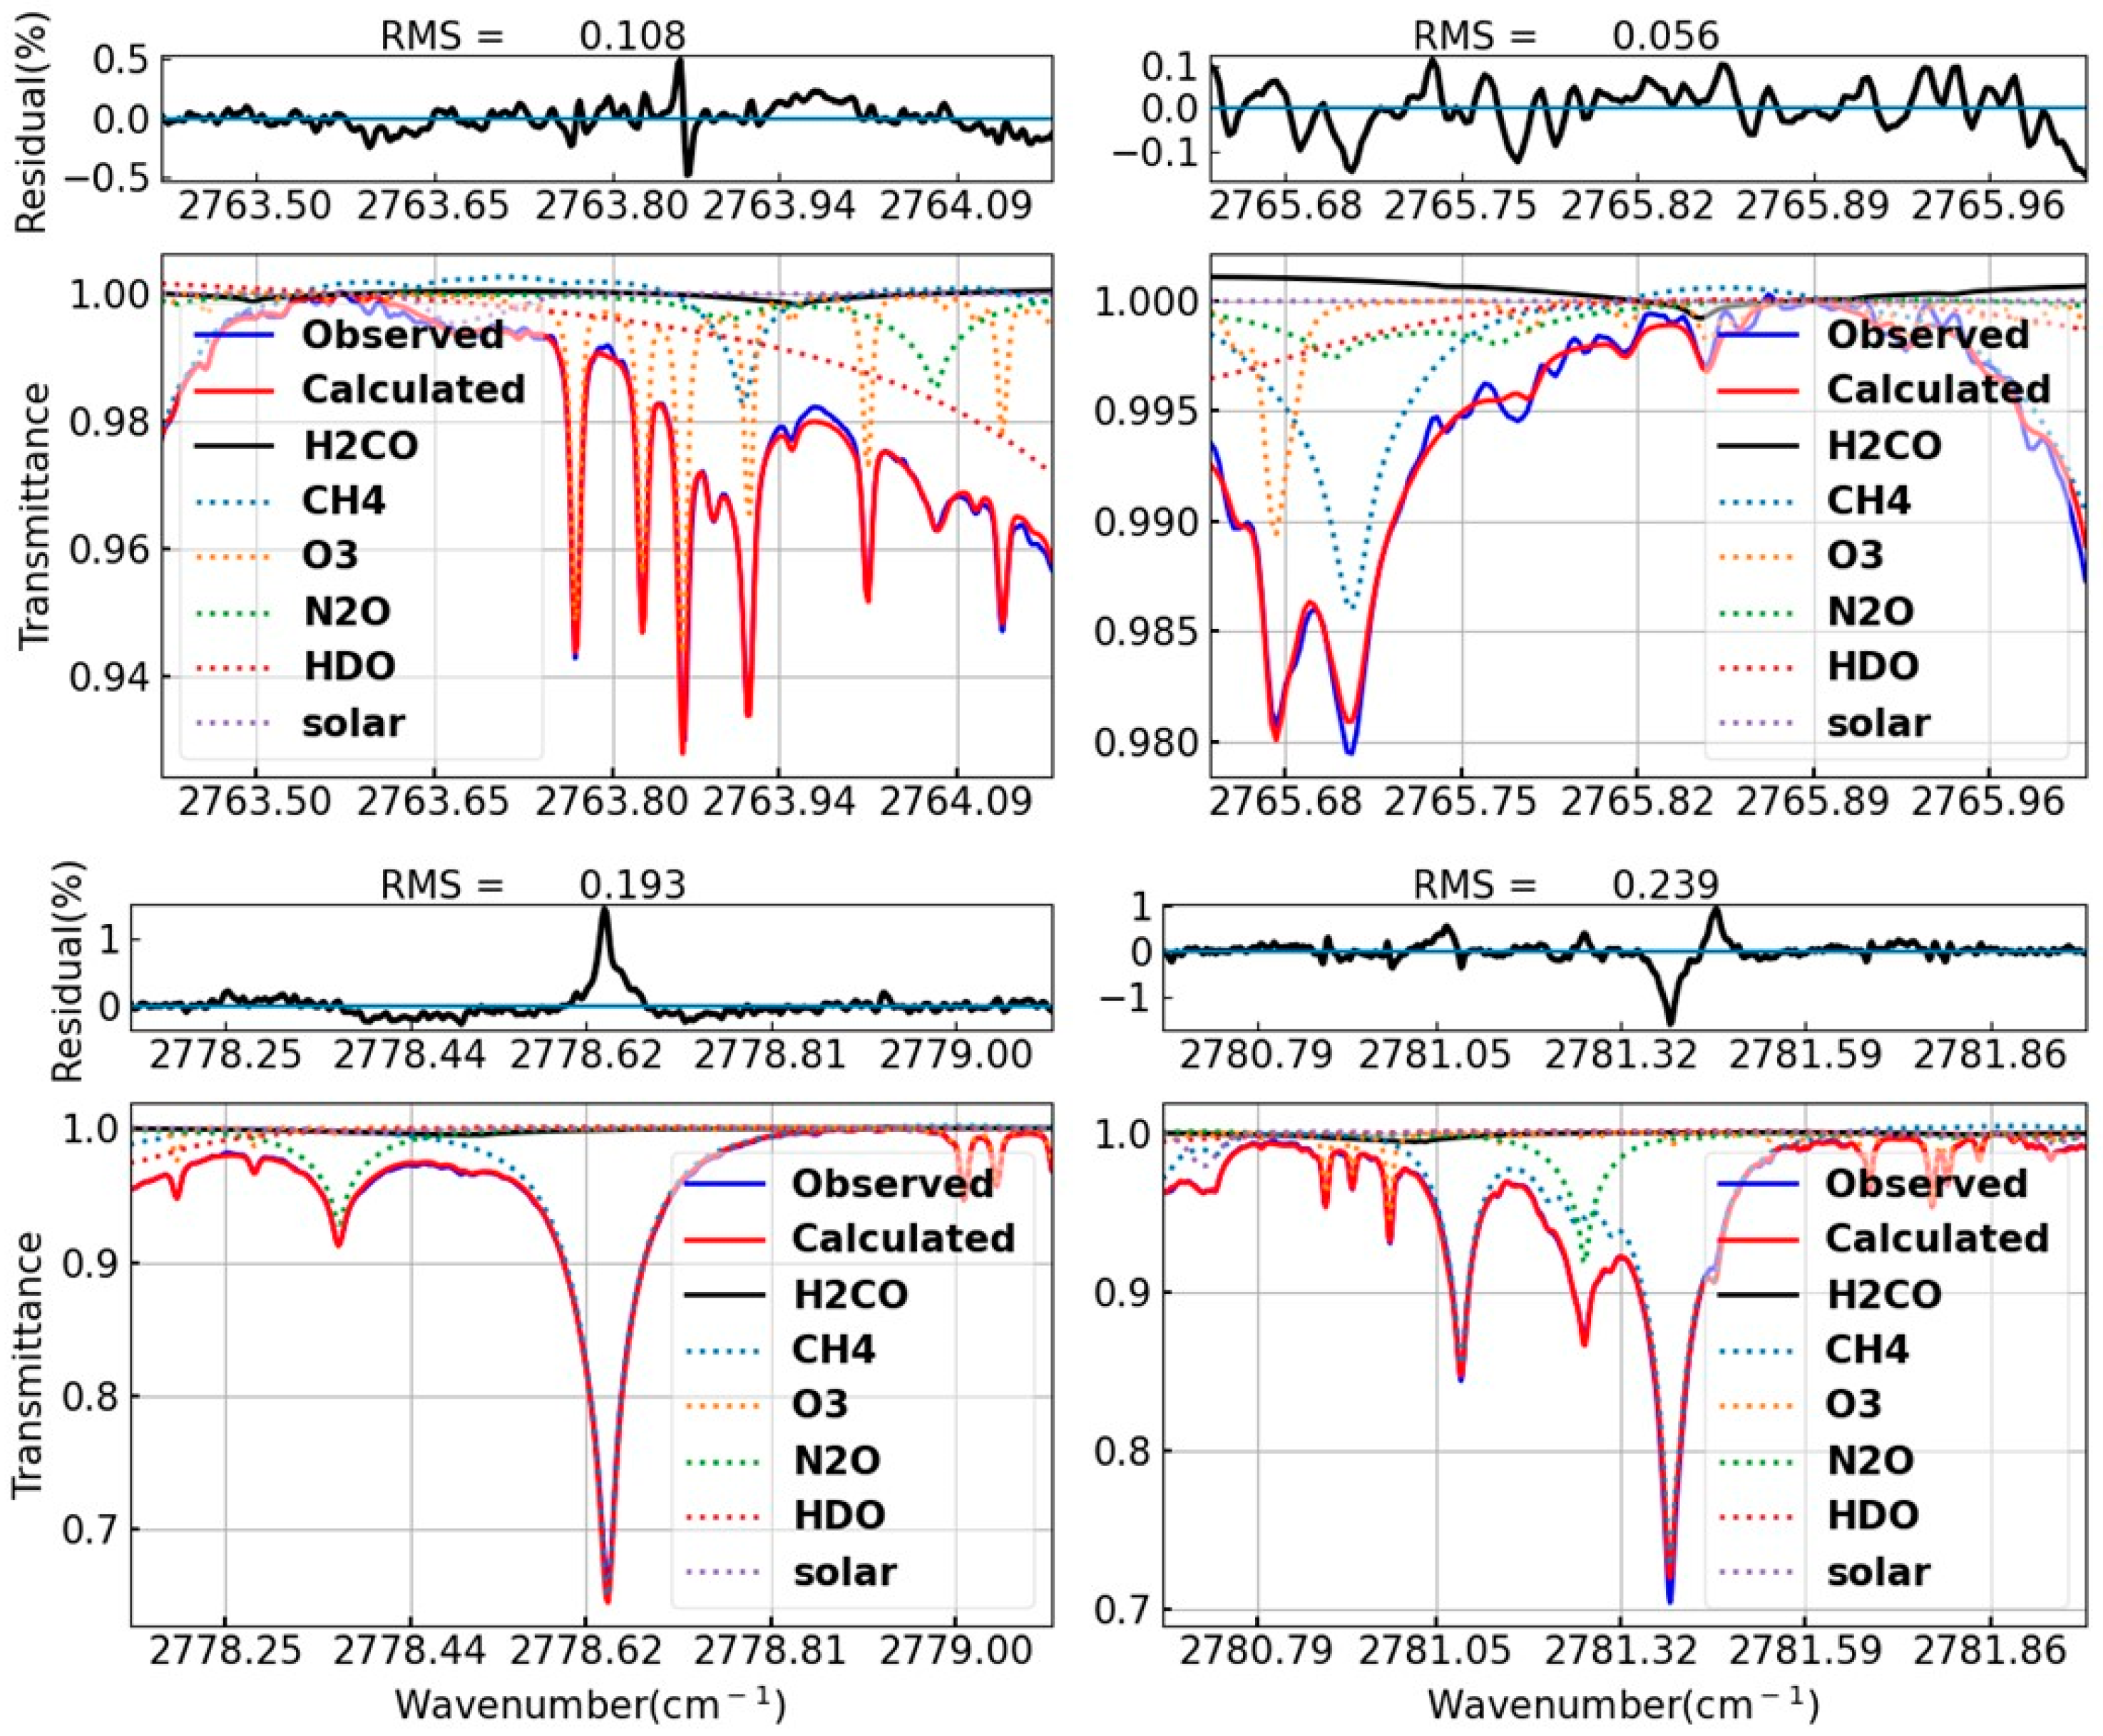
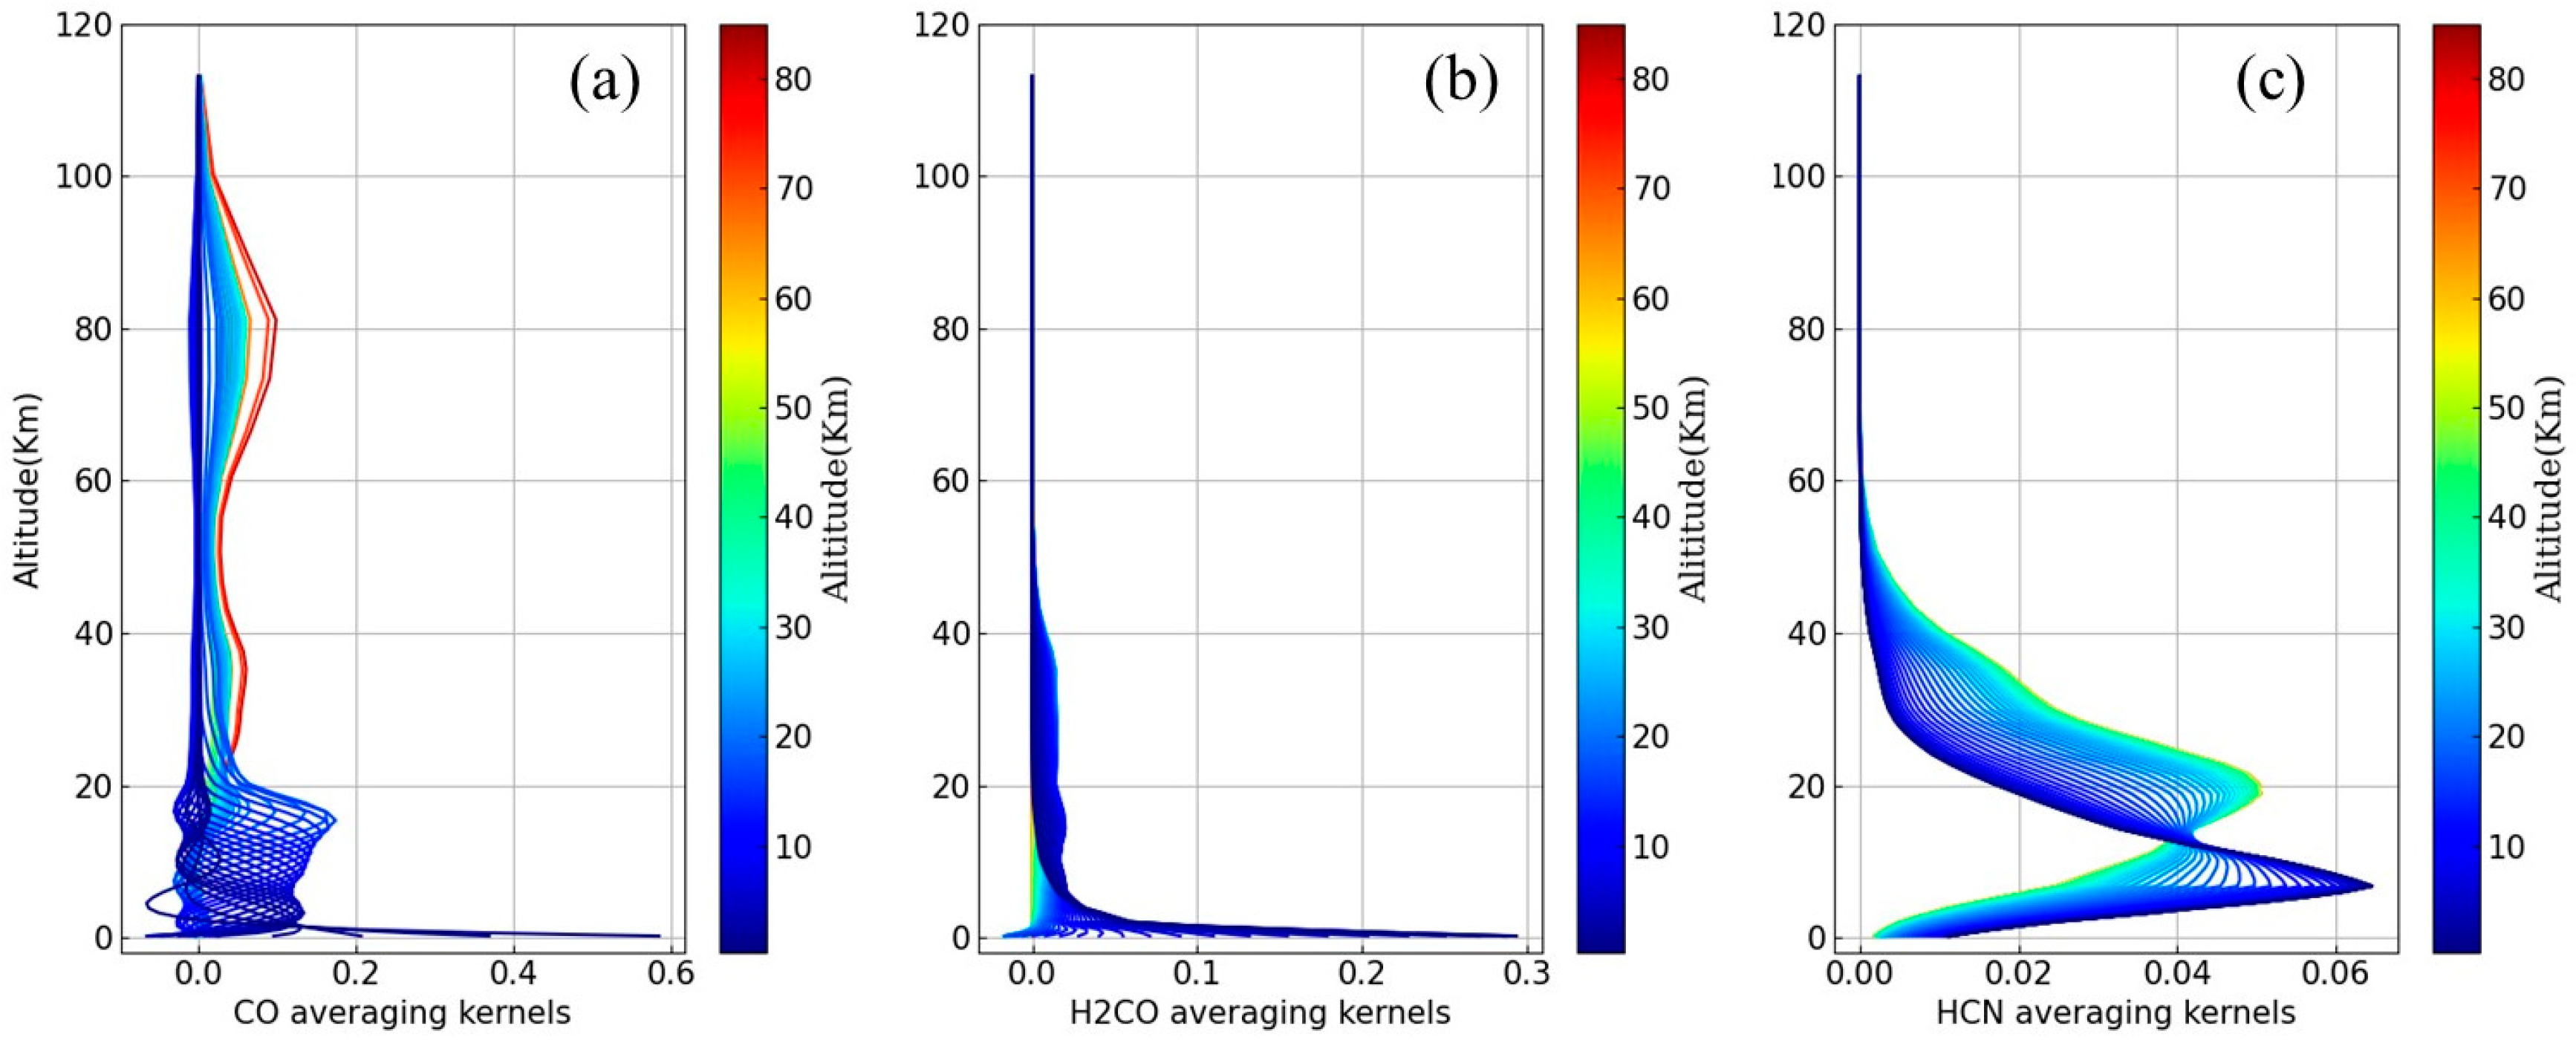
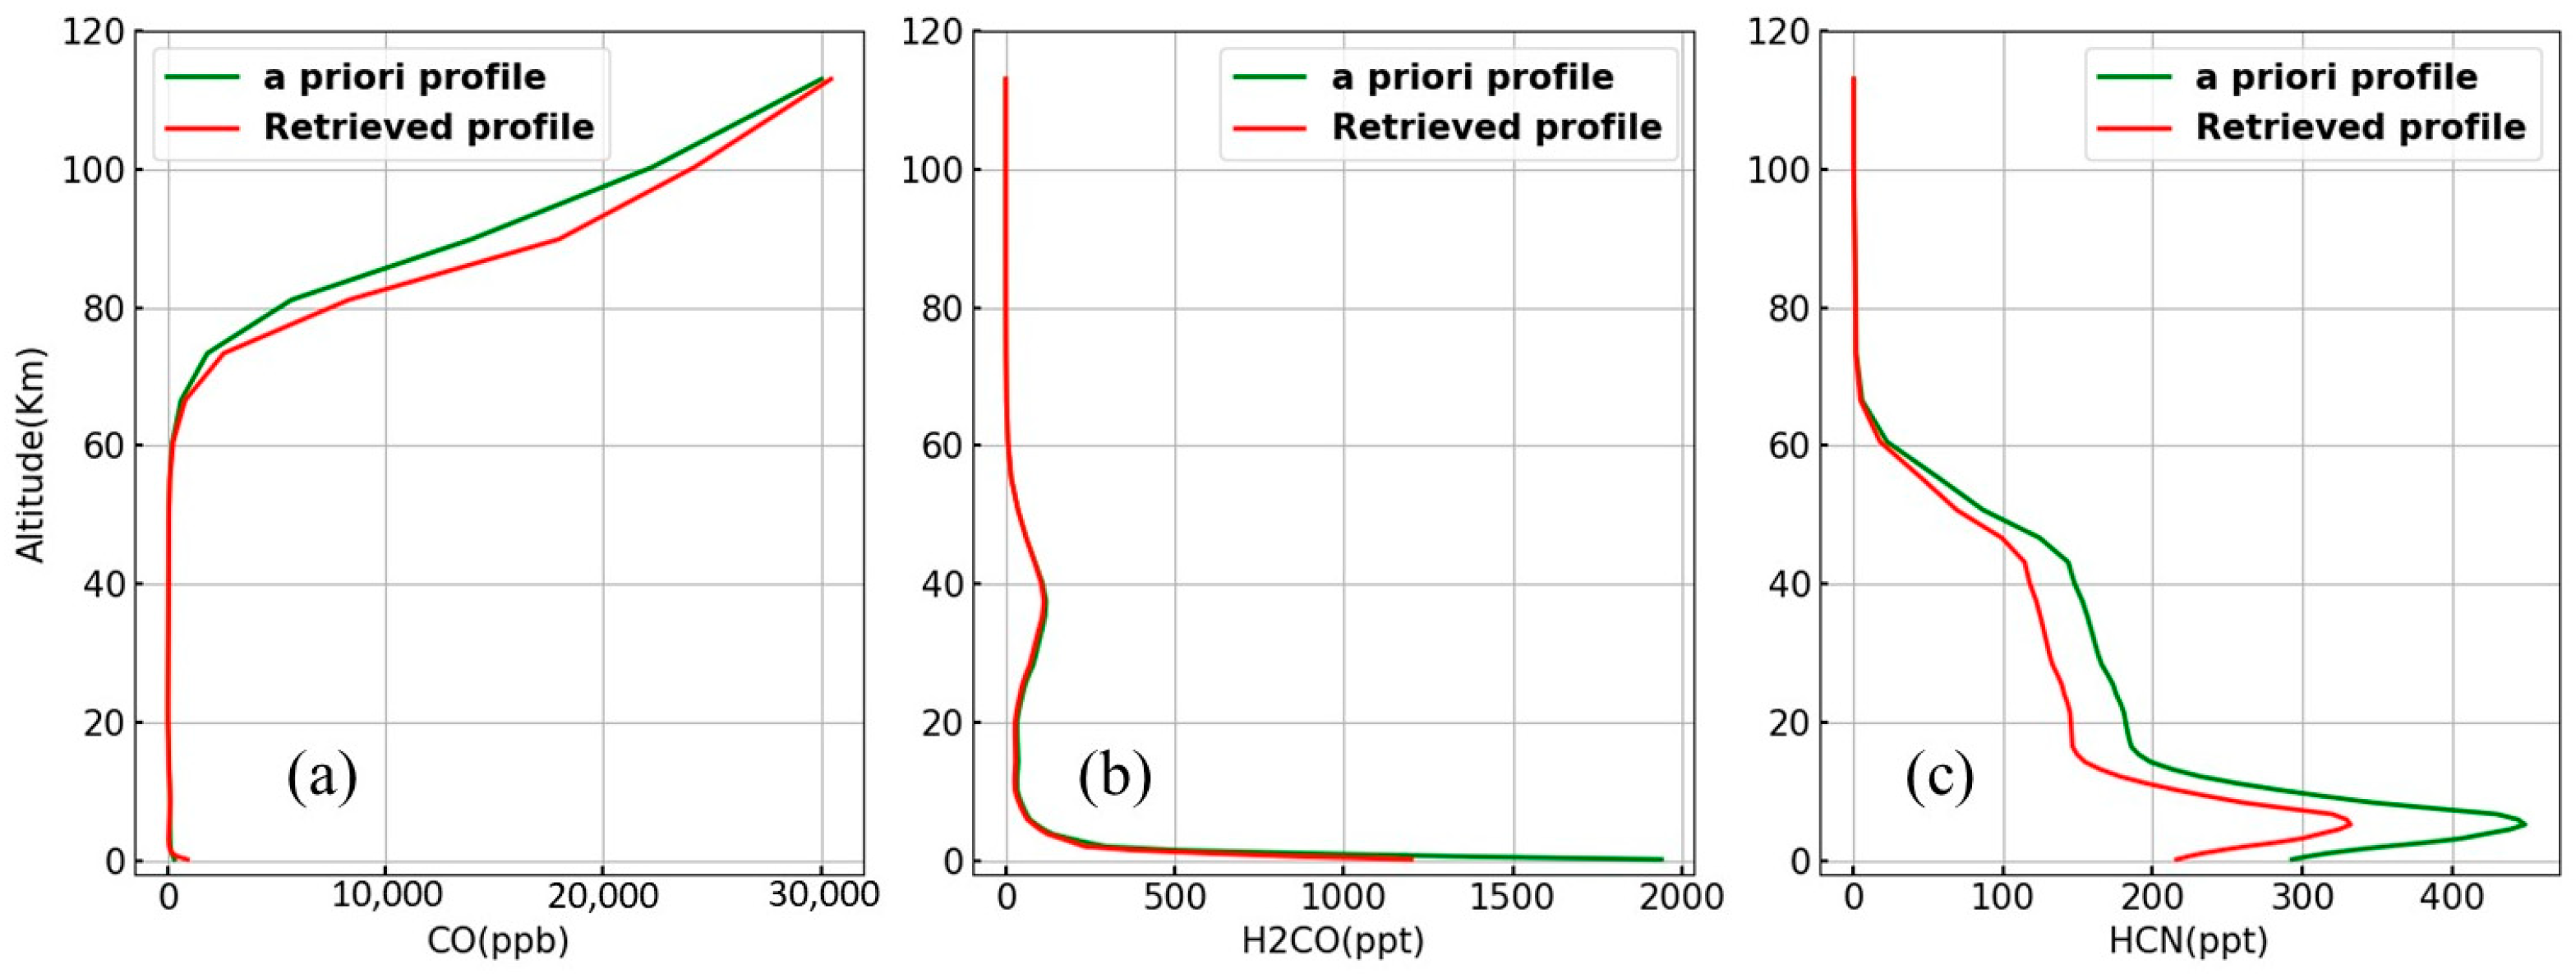
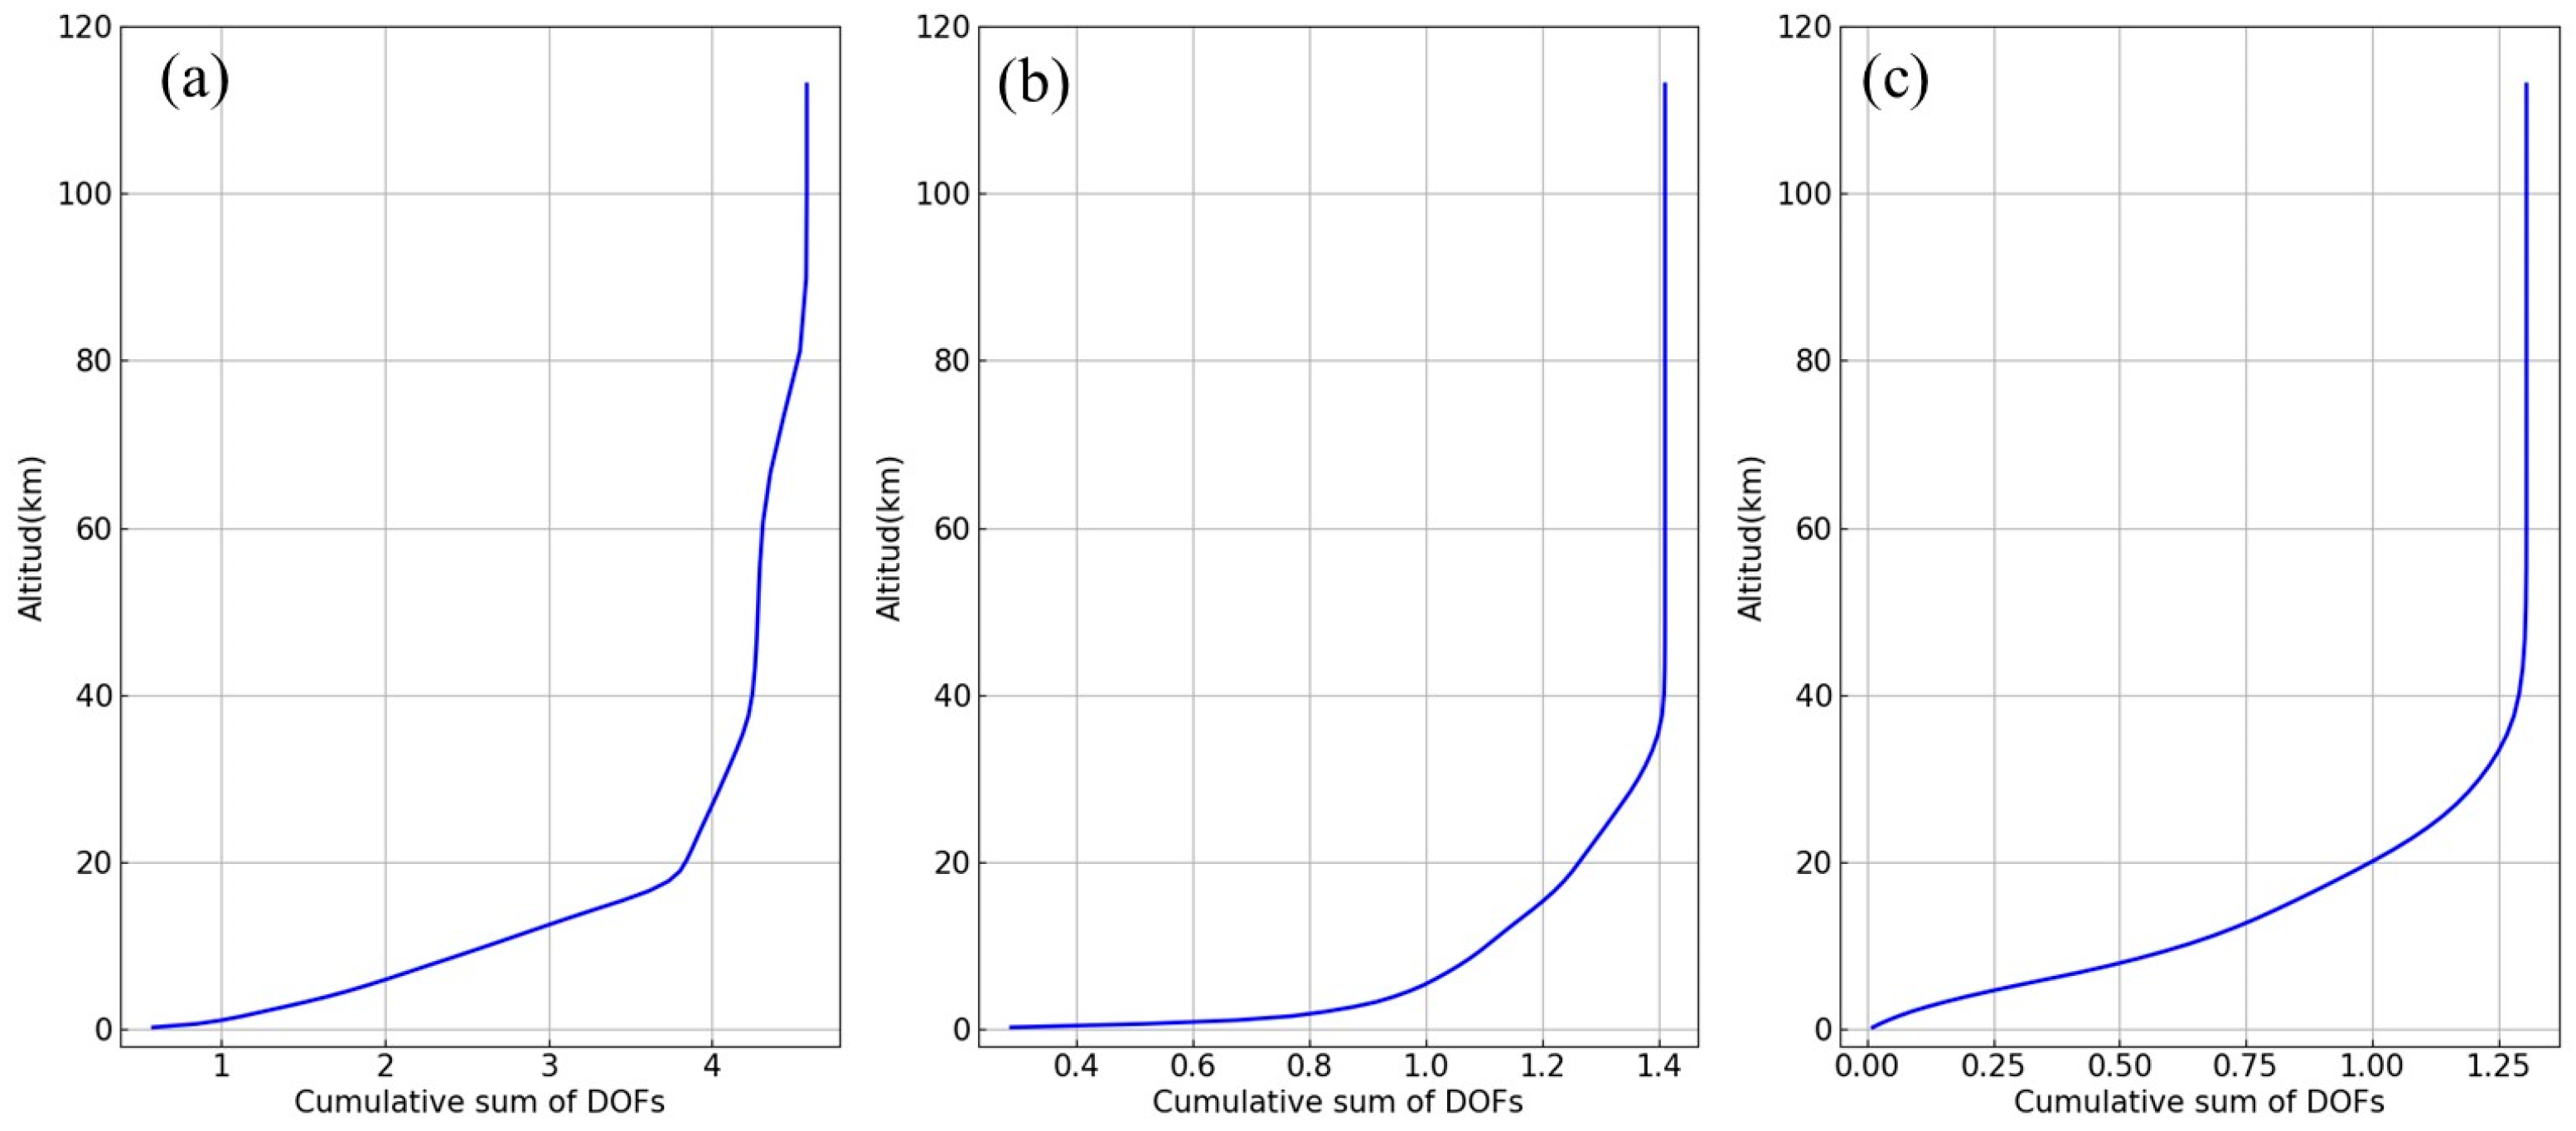
Table 2 shows the retrieval results of the three gases from typical spectra. The spectrum for CO retrieval was collected at 02:46:23 UTC on 13 January 2017. During the measurement period, the solar zenith angle (SZA) was recorded as 57.65°. For H2CO retrieval, the spectrum was collected at 02:15:24 UTC on 10 March 2018. The SZA was 46.56° during this measurement period. The spectrum for HCN retrieval was collected at 01:38:35 UTC on 11 January 2018. During this measurement period, the SZA was 65.71°. The total columns retrieved for CO, H2CO, and HCN are 3.03 × 10¹⁸, 4.55 × 10¹⁵, and 5.45 × 10¹⁵, respectively. Figure 1, Figure 2, Figure 3, Figure 4, Figure 5 and Figure 6 illustrate the results of spectral fitting in the microwindows, the averaging kernels, the retrieved vertical profile, and the DOFs of CO, H2CO, and HCN. The averaged root-mean-square (RMS) error for CO, H2CO, and HCN of the spectral fitting residual is 0.20%, 0.20%, and 0.12%, respectively. The RMS of the residuals of the three target gases are very small, indicating that the spectral fitting is good. The a priori profiles of CO and H2CO closely resemble the retrieved profiles, while the retrieved concentrations of HCN are markedly higher in the troposphere compared to those in the a priori profile. The typical averaging kernel matrix for CO, H2CO, and HCN is shown in Figure 4. Each CO layer exhibits higher sensitivity at about 18 and 80 km. H2CO shows higher sensitivity below 50 km, decreasing to zero above 50 km. For HCN, maximum sensitivity for each layer occurs around 15 km, diminishing above 60 km. The trace of the averaging kernel provides an estimate of the vertical sensitivity of the retrieval, representing the DOFs [42]. The larger value indicates greater vertical information is achieved. The typical DOFs values of CO, H2CO, and HCN are 4.58, 1.41, and 1.31, respectively, and the DOFs value of CO is the largest.

Table 2.
Retrieval results of typical spectra.

Figure 1.
Typical spectral fitting of CO. The blue line and the red line represent the observed spectrum and the calculated spectrum, respectively. The upper panels display the residuals from the spectra fitting.
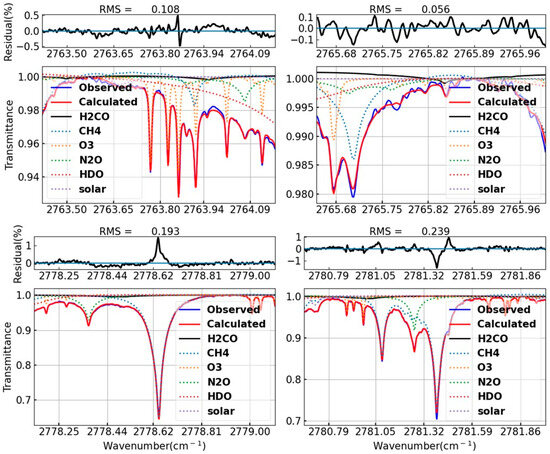
Figure 2.
Similar to Figure 1, but it is for H2CO.

Figure 3.
Similar to Figure 1, but it is for HCN.
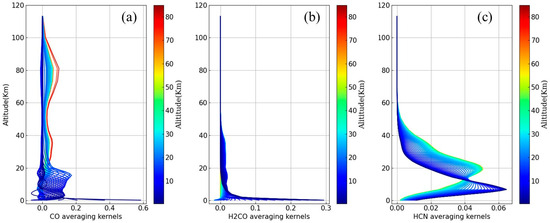
Figure 4.
The averaging kernels of (a) CO, (b) H2CO, and (c) HCN.
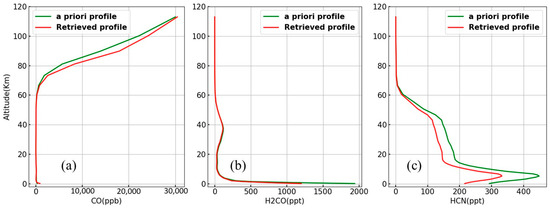
Figure 5.
A priori profile (green) and retrieved profile (red) for (a) CO, (b) H2CO, and (c) HCN.
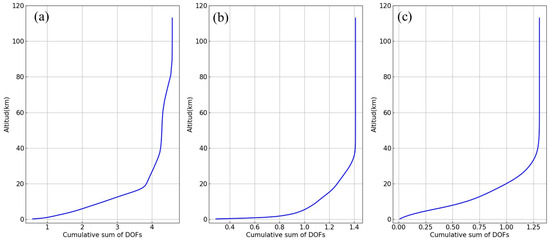
Figure 6.
The degrees of freedom for signal (DOFs) of (a) CO, (b) H2CO, and (c) HCN.
2.5. Retrieval Uncertainty
Taking potential errors into account, Equation (4) can be reformulated as follows:
Here denotes a reference profile, ε represents the measurement noise, denotes the Jacobian matrix of model parameters, and represents estimated model parameters. is the linearized retrieved state.
Equation (6) forms the foundation of this analysis. The terms, respectively, account for smoothing errors, uncertainties in input or model parameters, and measurement noise [38]. The uncertainties in interfering species, target gas, and other retrieved parameters (such as wavenumber offset and slope) influence smoothing errors. Key parameters for model parameter errors include temperature, SZA, spectroscopy, and zero level offset (zshift). Measurement noise is assumed to be purely random [32]. The root mean square of these three types of errors was calculated to determine the total error.
The total retrieval error for a typical spectrum is calculated, and Table 3 shows the results. For CO, the total error is 1.88%, comprising a random error of 1.15% and a systematic error of 1.49%. The primary source of error is the model parameter error. For H2CO, the total error is 6.78%, comprising a random error of 6.22% and a systematic error of 2.70%, with measurement error being the main contributor. The total error of HCN is 9.35%, of which the random error is 8.85% and the systematic error is 3.05%. The measurement error and smoothing error are the main sources of error.

Table 3.
Random and systematic uncertainties for CO, H2CO, and HCN retrieval.
3. Results
3.1. The Variation of Atmospheric CO, H2CO, and HCN
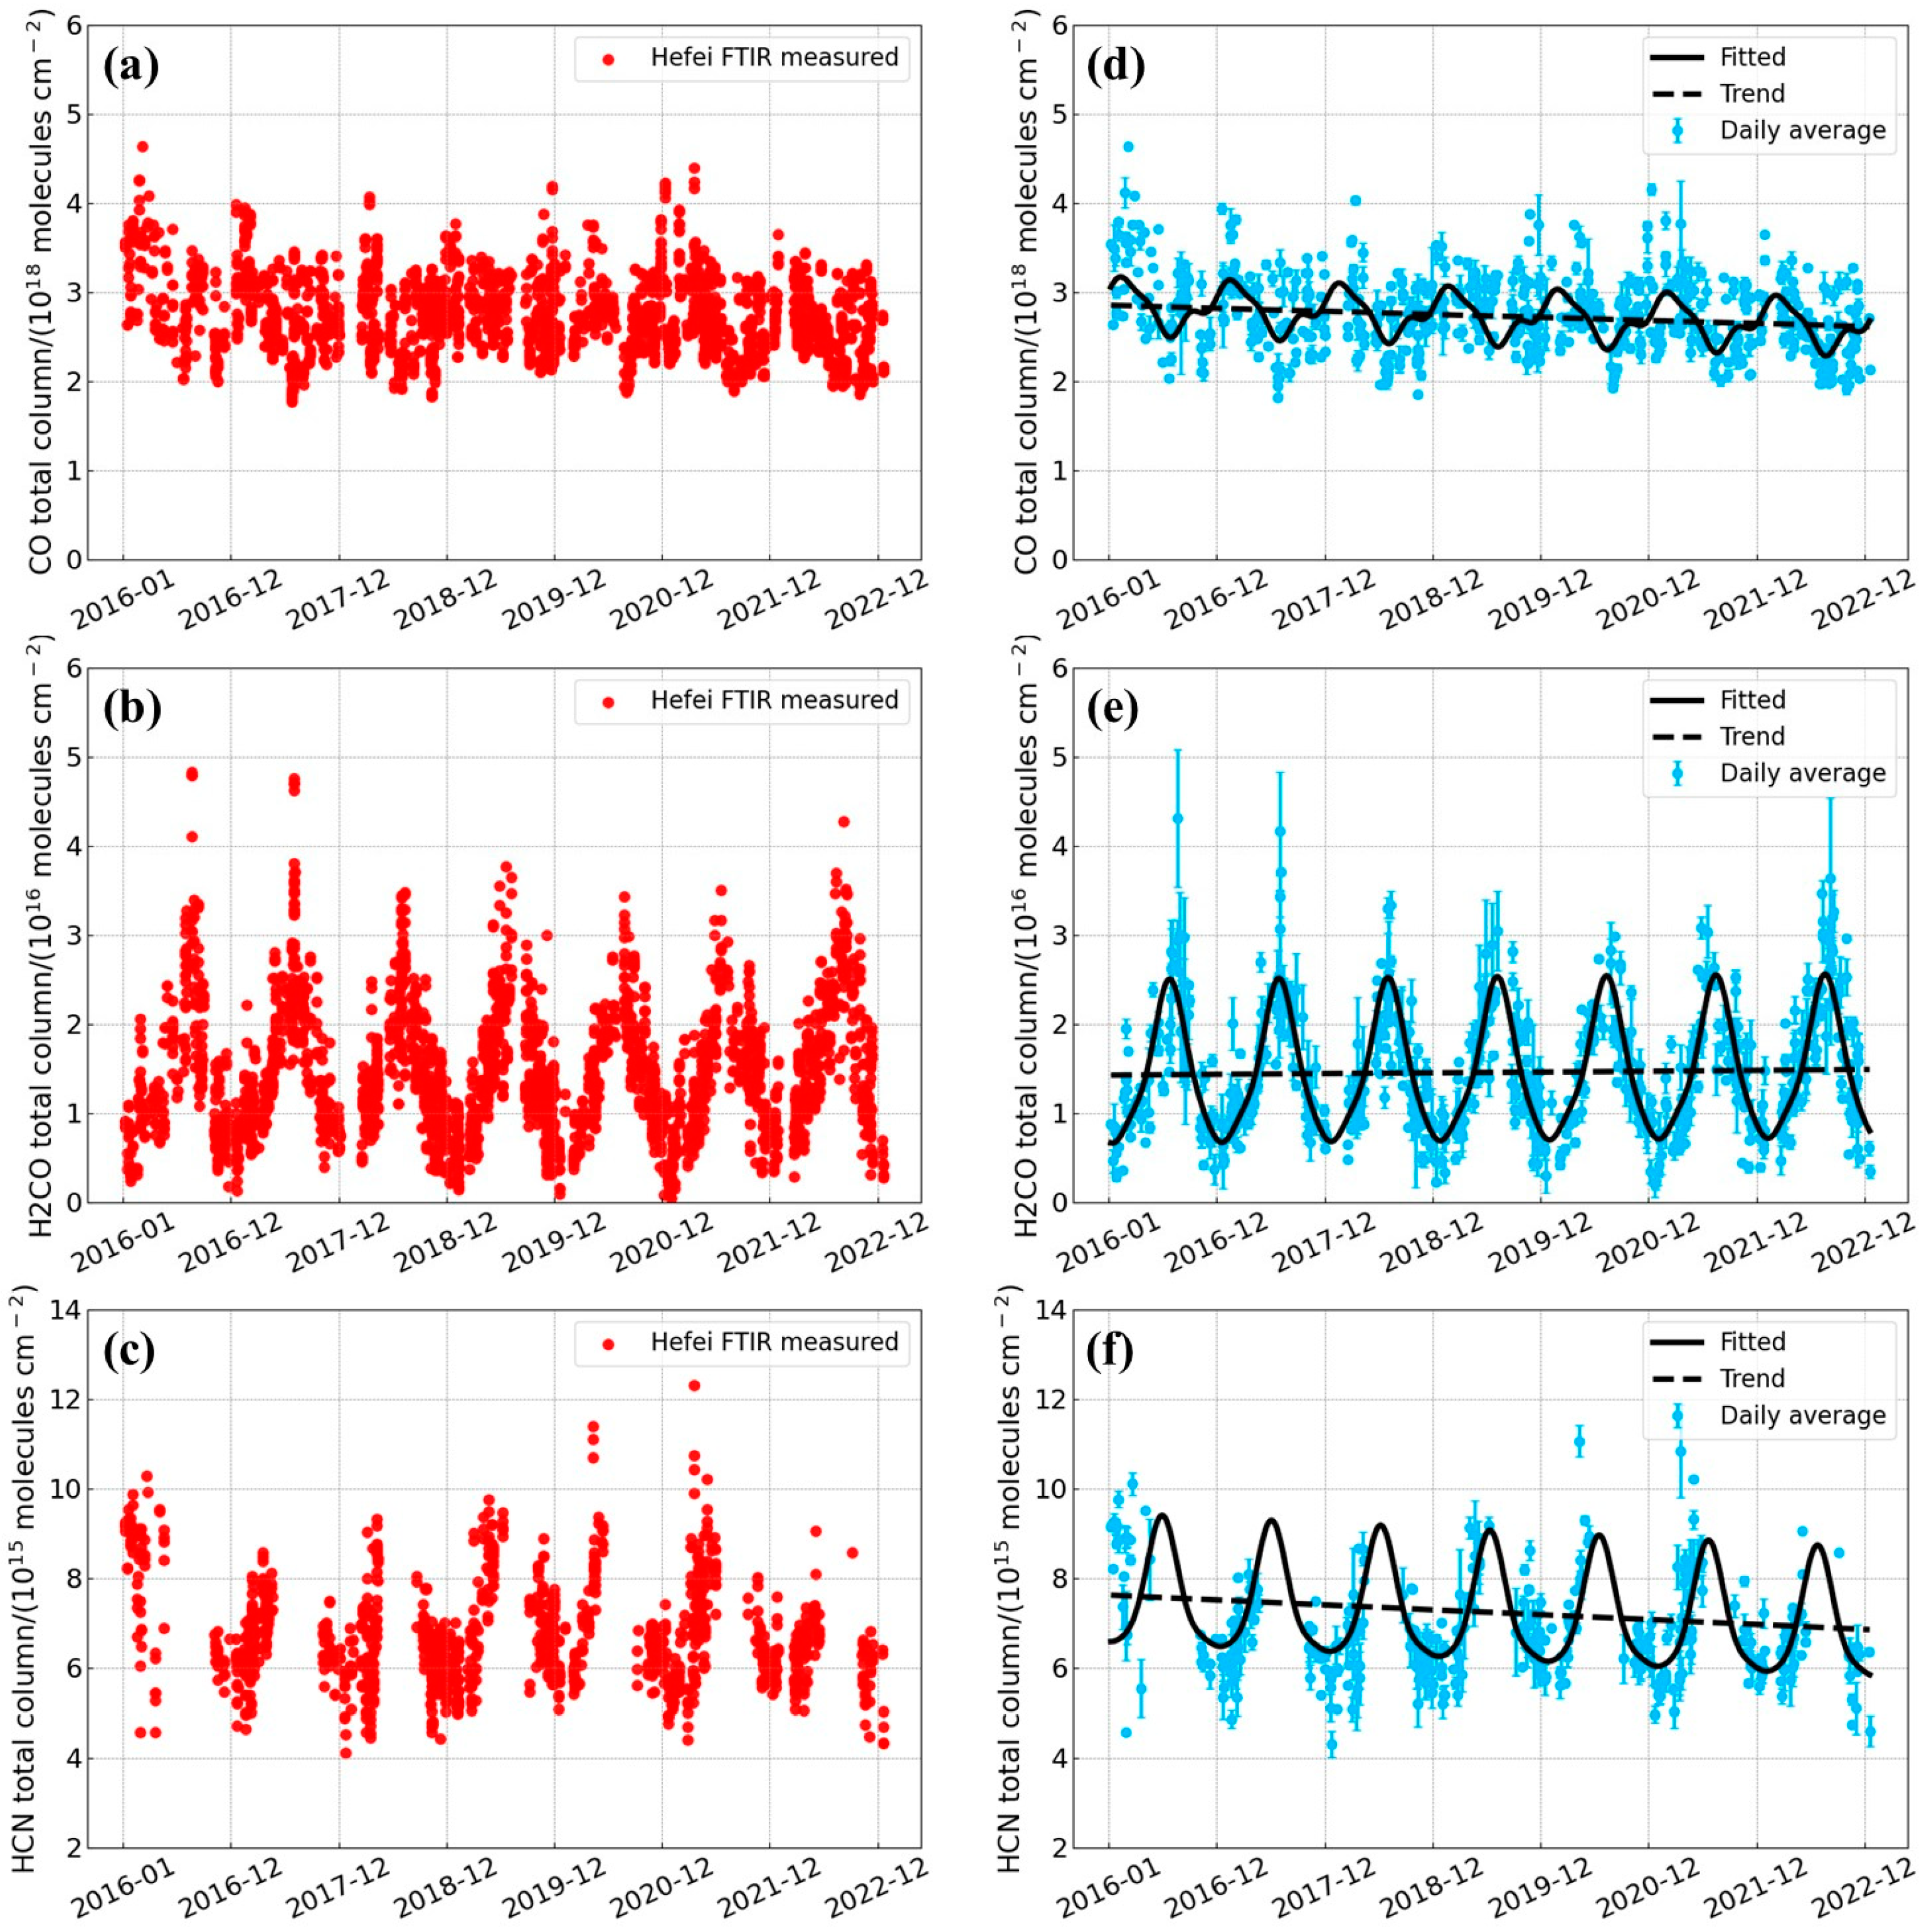
Figure 7 displays the time series and daily mean of CO, H2CO, and HCN total column measured at the Hefei site from 2016 to 2022. The data gap of the HCN total column from June to September is due to the high humidity in summer when the interference of water vapor affects the retrieval of HCN, thus some data with poor quality are filtered out. To better visualize the seasonal variation and annual trend, the time series in Figure 7d–f is fitted using a lowpass filtering fast Fourier transform (FFT) technique. The following is the FFT function :
where , , and denotes the time fraction annually, the trend of each year, and the intercept, respectively. Additionally, to represent the coefficient of sine/cosine harmonic [40,43].
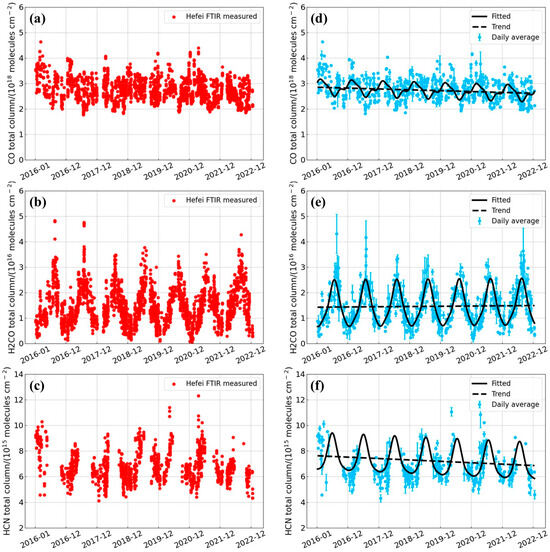
Figure 7.
The time series of total columns for (a) CO, (b) H2CO, and (c) HCN measured by FTIR at the Hefei site. The time series of daily averages for (d) CO, (e) H2CO, and (f) HCN. The black solid line depicts the fitting curve, while the black dashed line indicates the annual trend. The red dots represent individual measurements, the light blue dots indicate the daily average, and the blue error bars show the standard deviations of the daily average.
CO, H2CO, and HCN show an obvious seasonal variation, as shown in Figure 7, and the monthly variation in Figure 8. The CO reaches its peak in February and its lowest point in July, showing a seasonal amplitude of 8.07 × 10¹⁷ molecules cm−2 and a seasonal variability of 29.35%. Atmospheric CO column concentrations peak during spring (March, April, and May) and winter (December, January, and February), with the lowest levels observed during summer (June, July, and August). Conversely, the total column of H2CO is highest in summer and lowest in winter. July recorded the highest monthly mean value of H2CO, while January had the lowest. The seasonal amplitude is 1.89 × 10¹⁶ molecules cm−2, with a seasonal variation of 133.07%. The column concentration of HCN is higher during summer (in June) and lower during winter. The maximum monthly mean value of HCN occurred in June, while the minimum occurred in December, reflecting a seasonal amplitude of 2.32 × 10¹⁵ molecules cm−2, and the seasonal variation was 34.69%.

Figure 8.
The monthly variations of (a) CO, (b) H2CO, and (c) HCN total columns in 2016–2022 at the Hefei site. The blue dot is the monthly average. The red error bars represent the standard deviation of the monthly average.
Table 4 lists the mean and annual variation of the total column for CO, H2CO, and HCN. The mean total columns of CO, H2CO, and HCN from 2016 to 2022 are (2.75 ± 0.47) × 1018 molecules cm−2, (1.42 ± 0.72) × 1016 molecules cm−2, and (6.69 ± 1.12) × 1015 molecules cm−2, respectively. The mean annual variation rates for CO, H2CO, and HCN are (−2.67 ± 2.88)% yr−1, (2.52 ± 12.48)% yr−1, and (−3.48 ± 7.26)% yr−1 from 2016 to 2022, respectively. So, CO and HCN gradually decreased, and H2CO slowly increased. However, the mean of the CO and HCN columns increased from 2018 to 2019, with an increasing rate of 2.40% and 7.96%, respectively. H2CO shows a strong year-to-year growth from 2021 to 2022, and the variation rate is 27.09%.

Table 4.
The mean and annual variation of the total column for CO, H2CO, and HCN.
The FTIR spectrometer in Toronto collected solar absorption spectra for the retrieval of the time series of the total columns of CO, HCN, and other gases. CO exhibited lower levels during summer and fall as part of its annual cycle, while HCN peaked in May as part of its own annual pattern. During July and August, the HCN column displayed higher standard deviations, attributed to increased biomass burning, which results in skewed mean values [44]. In Bremen, the daily average of the CO total column reached its peak in February–March, with the lowest point in July–September. The daily average of HCN reached its highest levels in August–September and its lowest in December–January [45]. The total column of CO at Eureka peaked at 2.20 × 10¹⁸ molecules cm−2 in March and reached its lowest point at 1.56 × 10¹⁸ molecules cm−2 in September. The seasonal amplitude of the CO total column was 34%. The total column of HCN and H2CO exhibited a seasonal variation, peaking in summer and reaching their lowest levels in winter, with seasonal amplitudes of 78% and 93%, respectively [6]. The relative annual variations of CO, H2CO, and HCN in the Xianghe site from June 2018 to November 2021 were −2.2 ± 2.0% yr−1, −6.7 ± 4.0% yr−1, and 1.2 ± 2.3% yr−1, respectively [32].
The seasonal variations for CO in Hefei are similar to those in Toronto and Eureka, exhibiting higher concentrations during winter and lower concentrations during summer. This was related to increased heating and traffic emissions in winter [6,11,44]. The H2CO and HCN in Hefei and Eureka exhibit similar seasonal variations, with higher levels during summer and lower during winter, mainly due to more active photochemical reactions and increased biomass burning in summer [6]. In addition, high biogenic emissions from vegetation and forests also contribute to the high levels of H2CO in summer. The annual variations in CO and HCN show a gradual decrease in Hefei and Xianghe, possibly due to the increased use of clean energy and the implementation of environmental protection measures [32]. H2CO shows a decrease in Xianghe, reflecting changes in industrial and traffic emission sources in this region [32]. The seasonal and annual variations of CO, H2CO, and HCN at each site are influenced by a combination of local climatic conditions, emission sources, and policy changes.
3.2. Enhancement Ratios of H2CO and HCN Relative to CO during Biomass-Burning Period
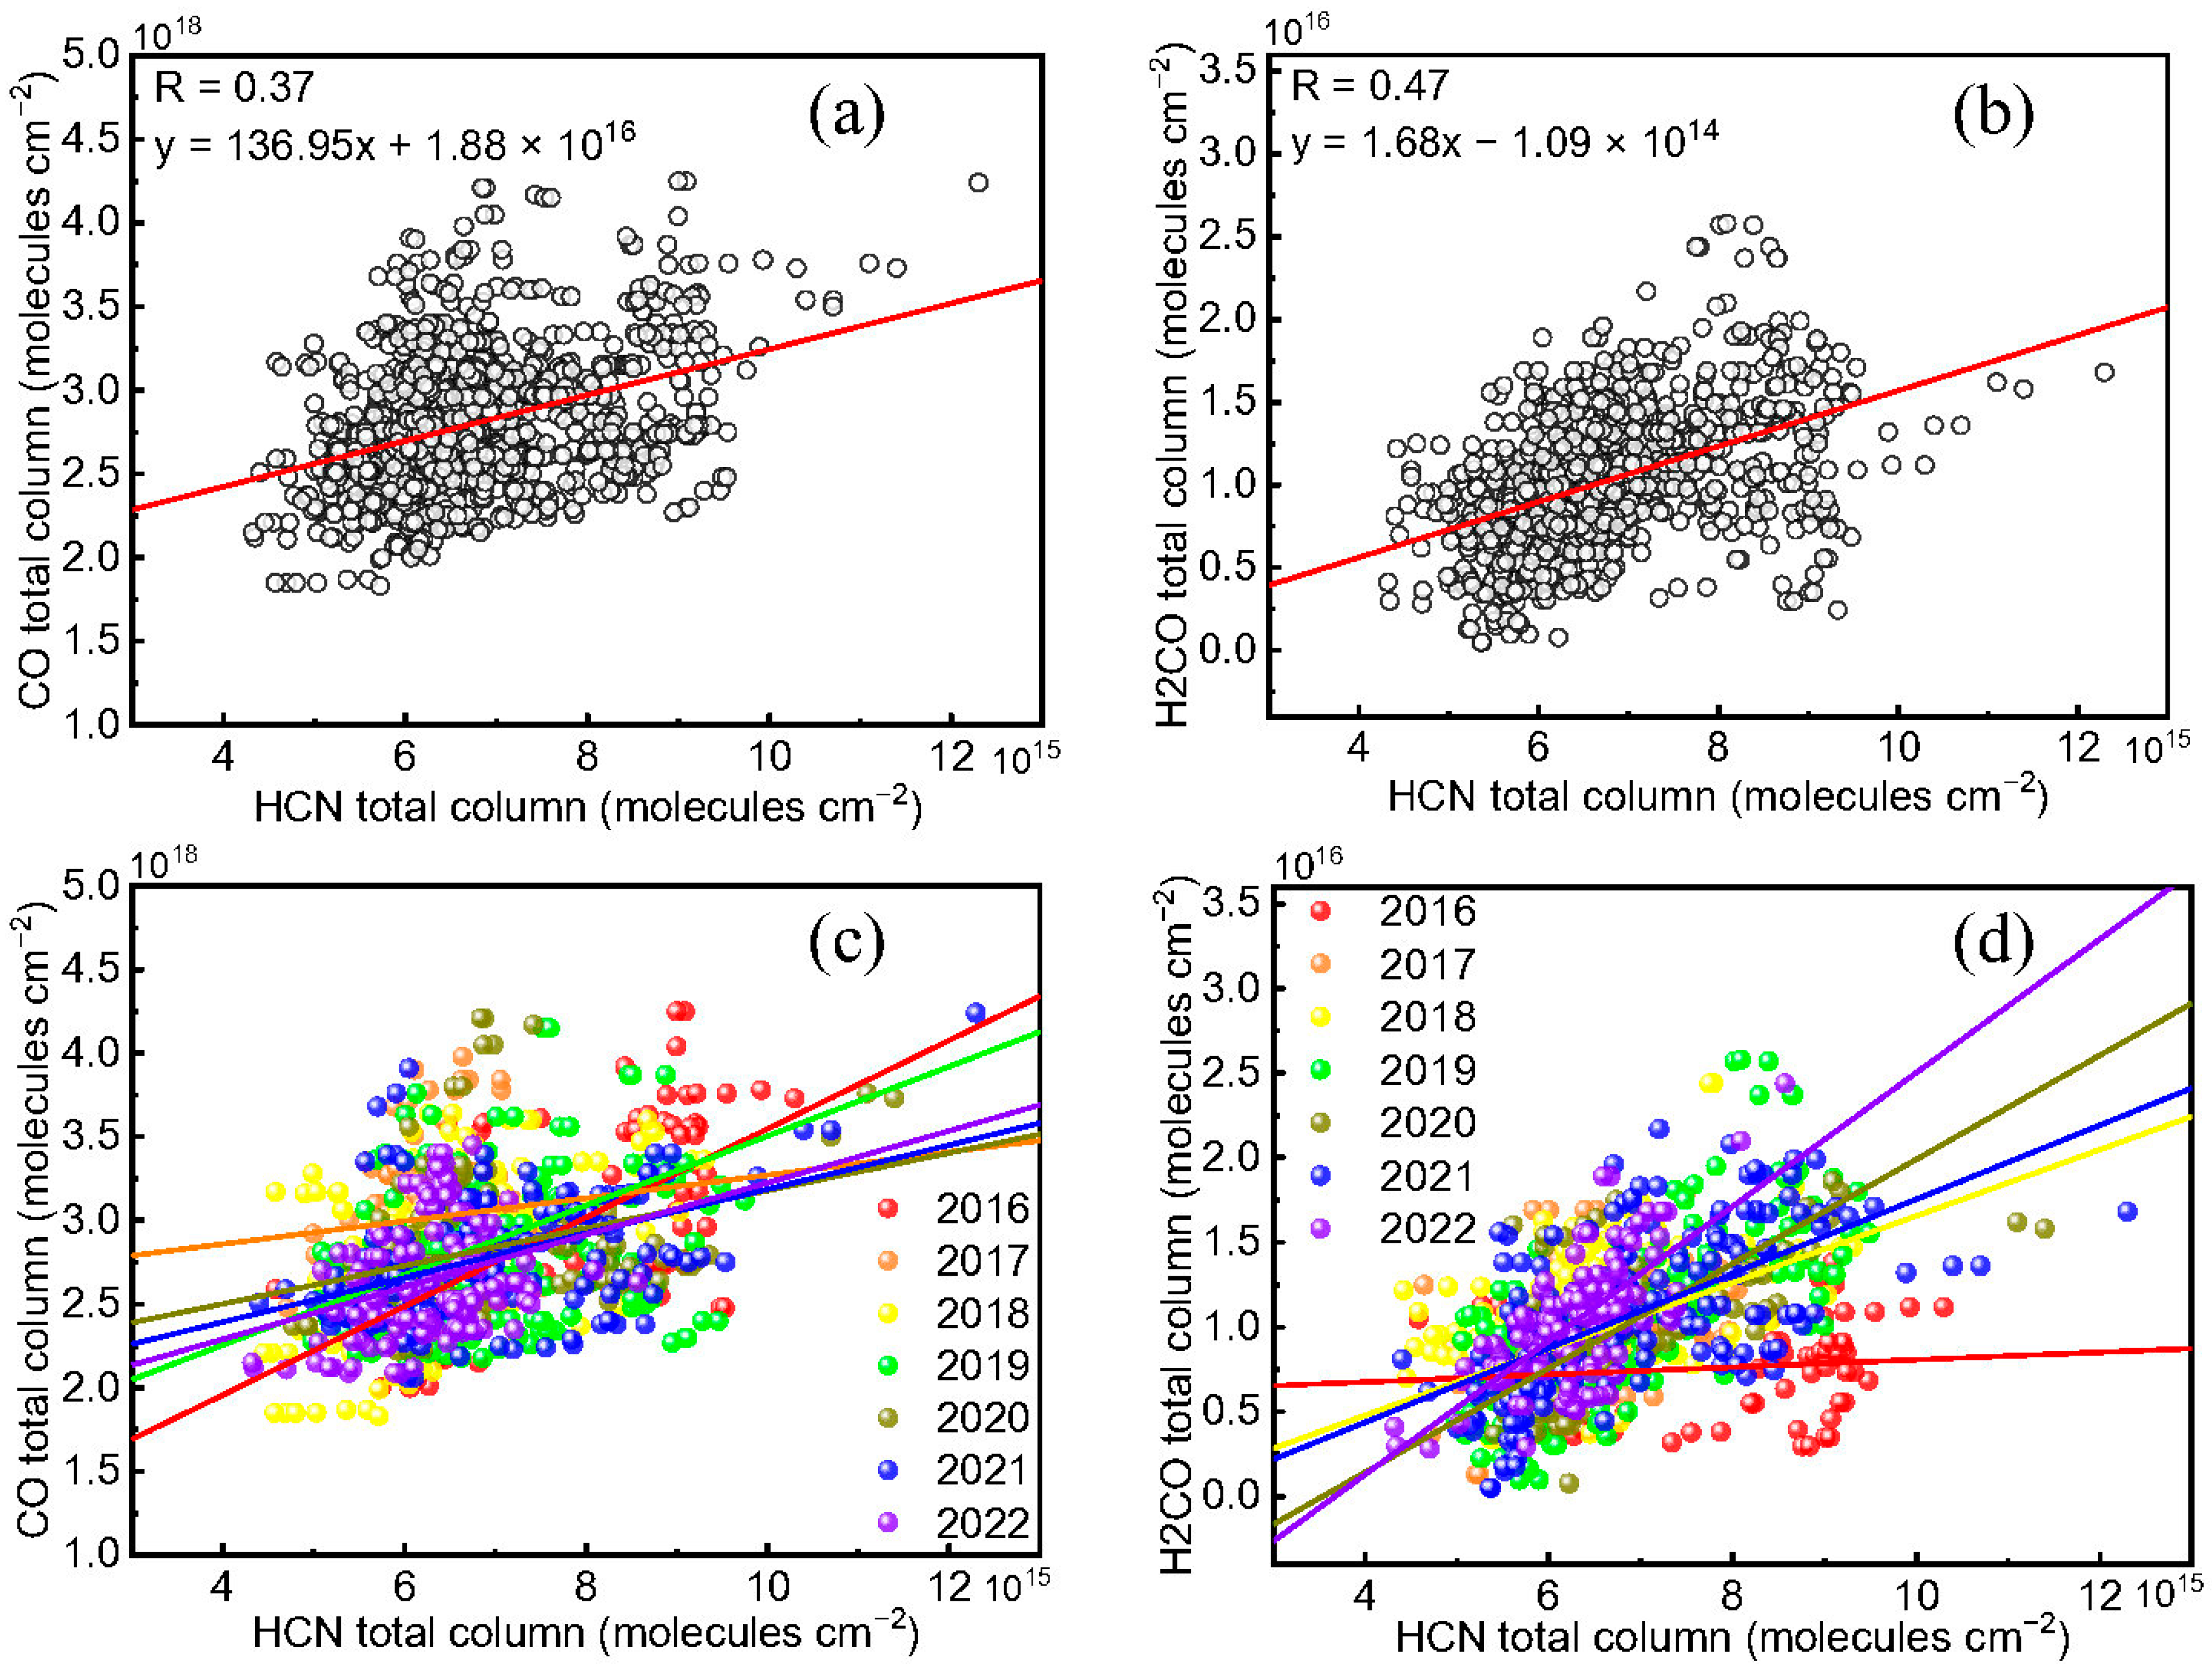
The total column of CO and H2CO at the Hefei station for all years and each individual year from 2016 to 2022 are plotted against the total column of HCN, as shown in Figure 9. We utilized the least-squares method described by York et al., (2004) to fit the coincident measurements with a linear regression equation [46]. Table 5 shows the correlation R values, slopes, and intercepts between CO and H2CO with HCN in each year and all years at the Hefei site from 2016 to 2022.
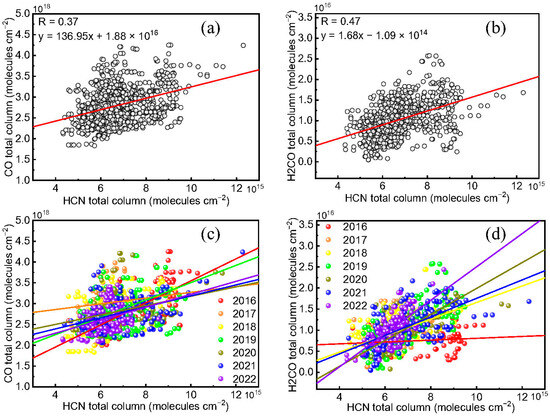
Figure 9.
Correlation plots for (a) CO and (b) H2CO versus HCN for all years from 2016 to 2022 (black). Correlation plots between (c) CO and (d) H2CO versus HCN for each year from 2016 to 2022. The data of different years are represented by color points. All solid lines are linear fitting.

Table 5.
Correlation R value, slope, and intercept between CO and H2CO with HCN in each year and all years from 2016 to 2022 at the Hefei site.
Good correlations between the gases indicate that these gas molecules undergo similar processes of production and dilution [7]. HCN, CO, and H2CO are recognized as primary species from fire-induced biomass burning [5]. Biomass burning is the predominant source of HCN [21,22,29,47], making HCN a reliable indicator of biomass-burning occurrence. If biomass burning predominantly affects the variability of CO and H2CO, a high correlation of CO and H2CO with HCN should appear, and the reverse is also true [24,48]. For the observation span of 2016 to 2022, the correlation R values between CO and H2CO with HCN in all years are 0.37 and 0.47, respectively, showing a weak correlation. For each year, the highest R value between CO and HCN occurred in 2016 (R = 0.64), while the highest R value between H2CO and HCN occurred in 2019 (R = 0.72). Most correlation R values between H2CO with HCN are higher than those between CO and HCN in each year. So, biomass-burning emissions contribute more to atmospheric H2CO throughout the observation period.
Further, to clarify how biomass burning affects total column changes in CO and H2CO, the correlation between CO and H2CO with HCN in each month at the Hefei site from 2016 to 2022 was analyzed. The results are displayed in Table 6. Monthly correlation coefficient R values exceeding 0.8 for CO with HCN are observed in February and April 2016; May and December 2017; April, May, September, and October 2018; June and September to December 2019; April and December 2020; March and April 2021; and February, October, and December 2022. For H2CO with HCN, the monthly correlation coefficient R values greater than 0.8 are found in February 2016; January, May, and December 2017; April and October 2018; April, June, and October to December 2019; April 2020; and October and December 2022. Here correlation coefficient R values greater than 0.8 are regarded as strong correlations. It can be reasonably assumed that the variability of the gases may be dominated by biomass burning in the corresponding month.

Table 6.
Monthly correlation R value between CO and H2CO with HCN from 2016 to 2022 at the Hefei site. Blue values are those with strong correlations (R value ≥ 0.80).
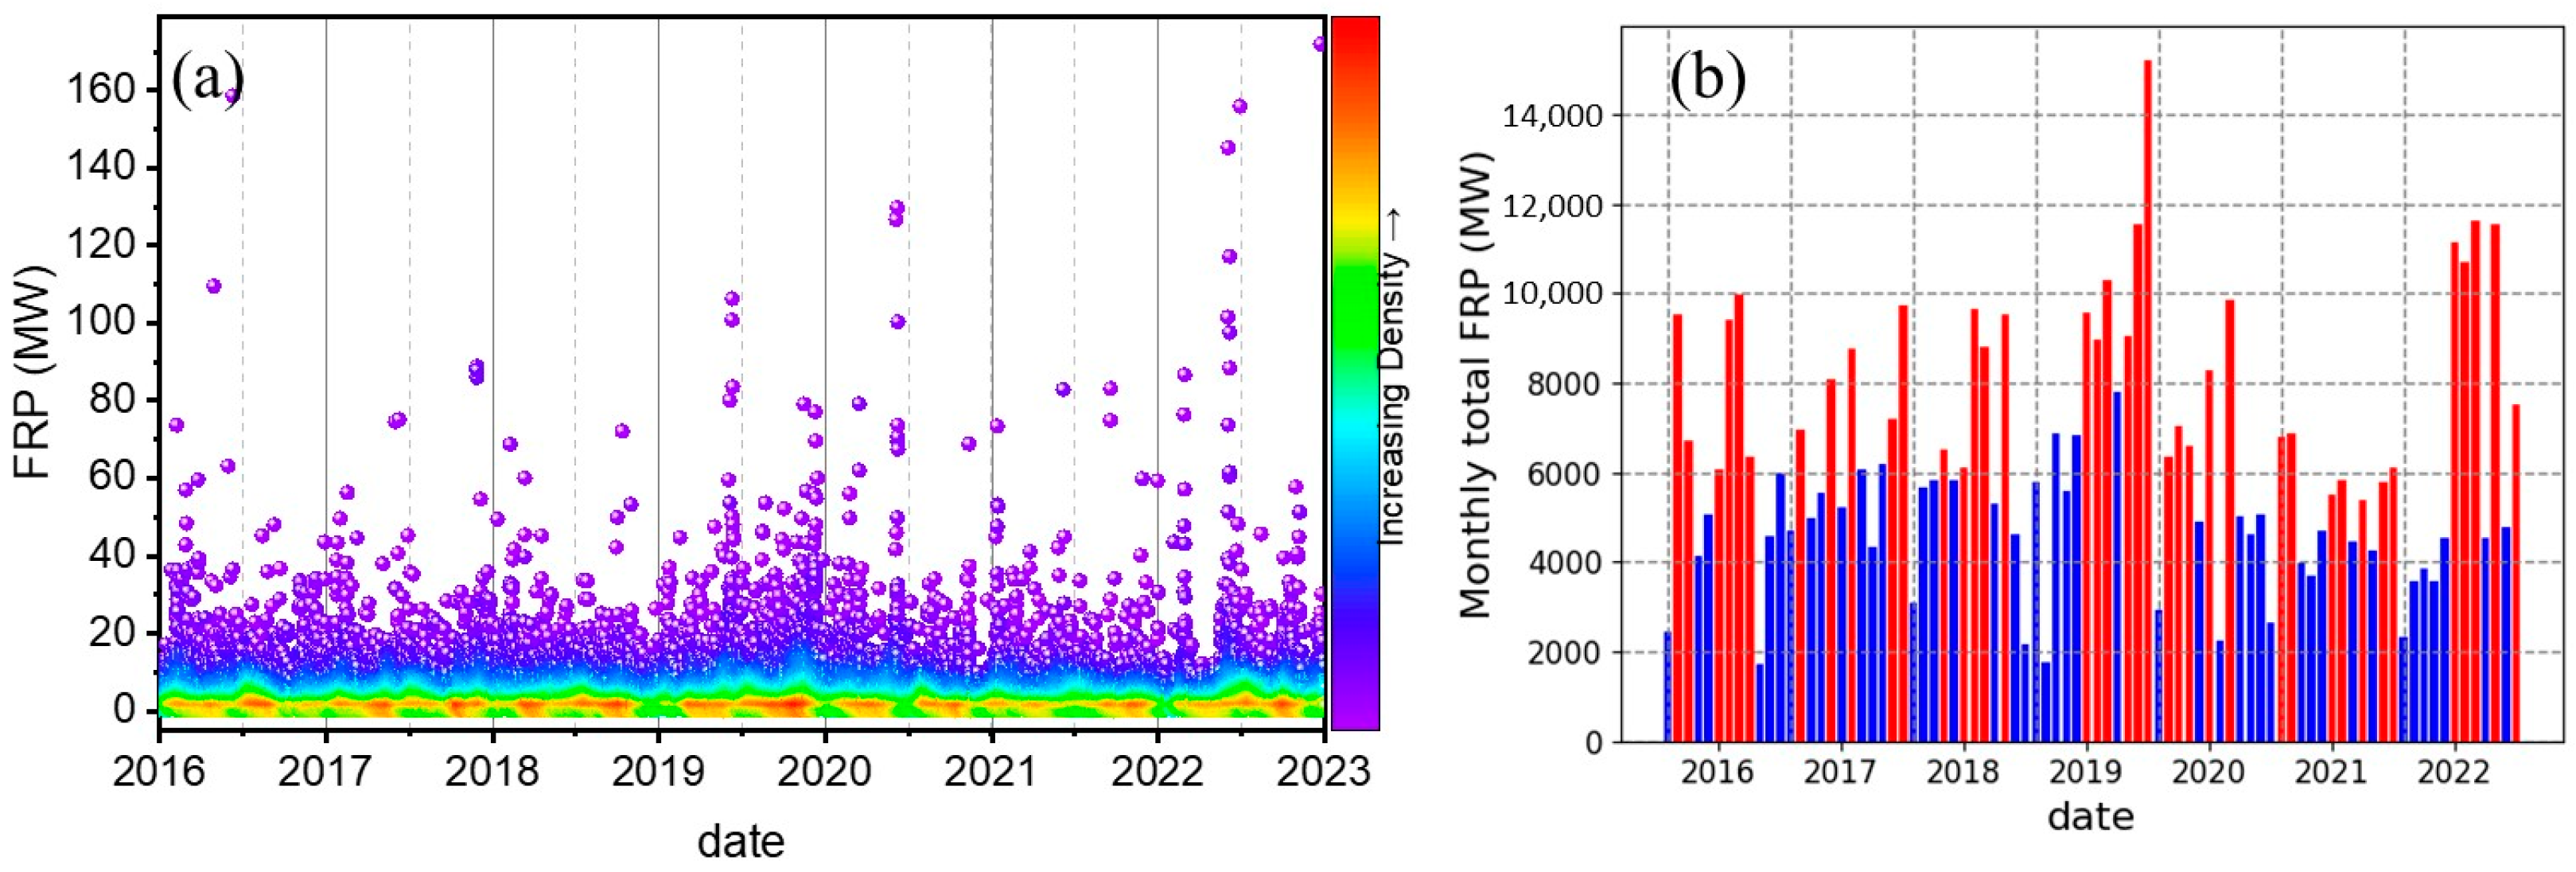
Fires emit heat energy, which spreads through radiation, conduction, and convection. Fire radiative energy (FRE), similar to electromagnetic radiation, travels through space and is detectable from aircraft and satellites [49]. Retrieving fire radiative power (FRP) provides new avenues for studying emissions from biomass burning and their impact on air quality [50,51]. For each fire pixel detected by satellite, the corresponding FRP (or FRE) can be obtained. FRP represents the pixel-integrated fire radiative power in megawatts (MW). The Fire Information for Resource Management System (FIRMS) archives FRP data, which is generated from the Visible Infrared Imaging Radiometer Suite (VIIRS) by NASA (https://firms.modaps.eosdis.nasa.gov/download/, accessed on 2 April 2024). Figure 10 shows the FRP values measured by satellite in Anhui province from 2016 to 2022. The total FRP values in each month are calculated, shown in Figure 10b, and the months with the total FRP greater than the monthly average within each year are marked with red.
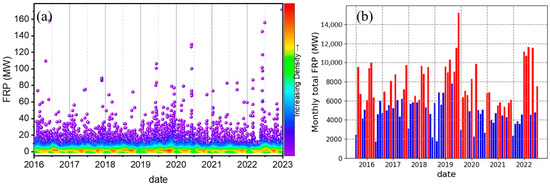
Figure 10.
(a) FRP in each fire pixel detected by the satellite VIIRS in Anhui province from 2016 to 2022, (b) Monthly total FRP in Anhui province from 2016 to 2022. The dots are colored by the density. Red bars indicate months with total FRP exceeding the monthly average of each year, and blue bars indicate months with total FRP below the monthly average of each year. All data are from the FIRMS fire atlas.
The months in which the correlation coefficient between CO and H2CO with HCN exceeds 0.8 are divided into two categories. In the first category, the correlation between CO or H2CO with HCN both exceeds 0.8 in these months. The first category includes February 2016; May and December 2017; April and October 2018; June, October, November, and December 2019; April and December 2020, and October and December 2022. In the second category, the correlation between CO or H2CO with HCN exceeds 0.8 for only one gas. The second category comprises April 2016, January 2017, May and September 2018, April and September 2019, December 2020, March and April 2021, and February 2022. In the first category, it is found that the total FRP for all months is greater than the monthly average in each year. This suggests the biomass-burning occurrence in Anhui province for the months with high total FRP values. So, the main driving factor for the variation of CO and H2CO is biomass-burning emissions in this category. In the second category, the total FRP values for these months are all lower than the annual monthly average. The pattern with one gas of CO or H2CO showing a high correlation with HCN, but with low FRP means that CO or H2CO are affected by long-distance biomass-burning sources, rather than the sources from Anhui province.
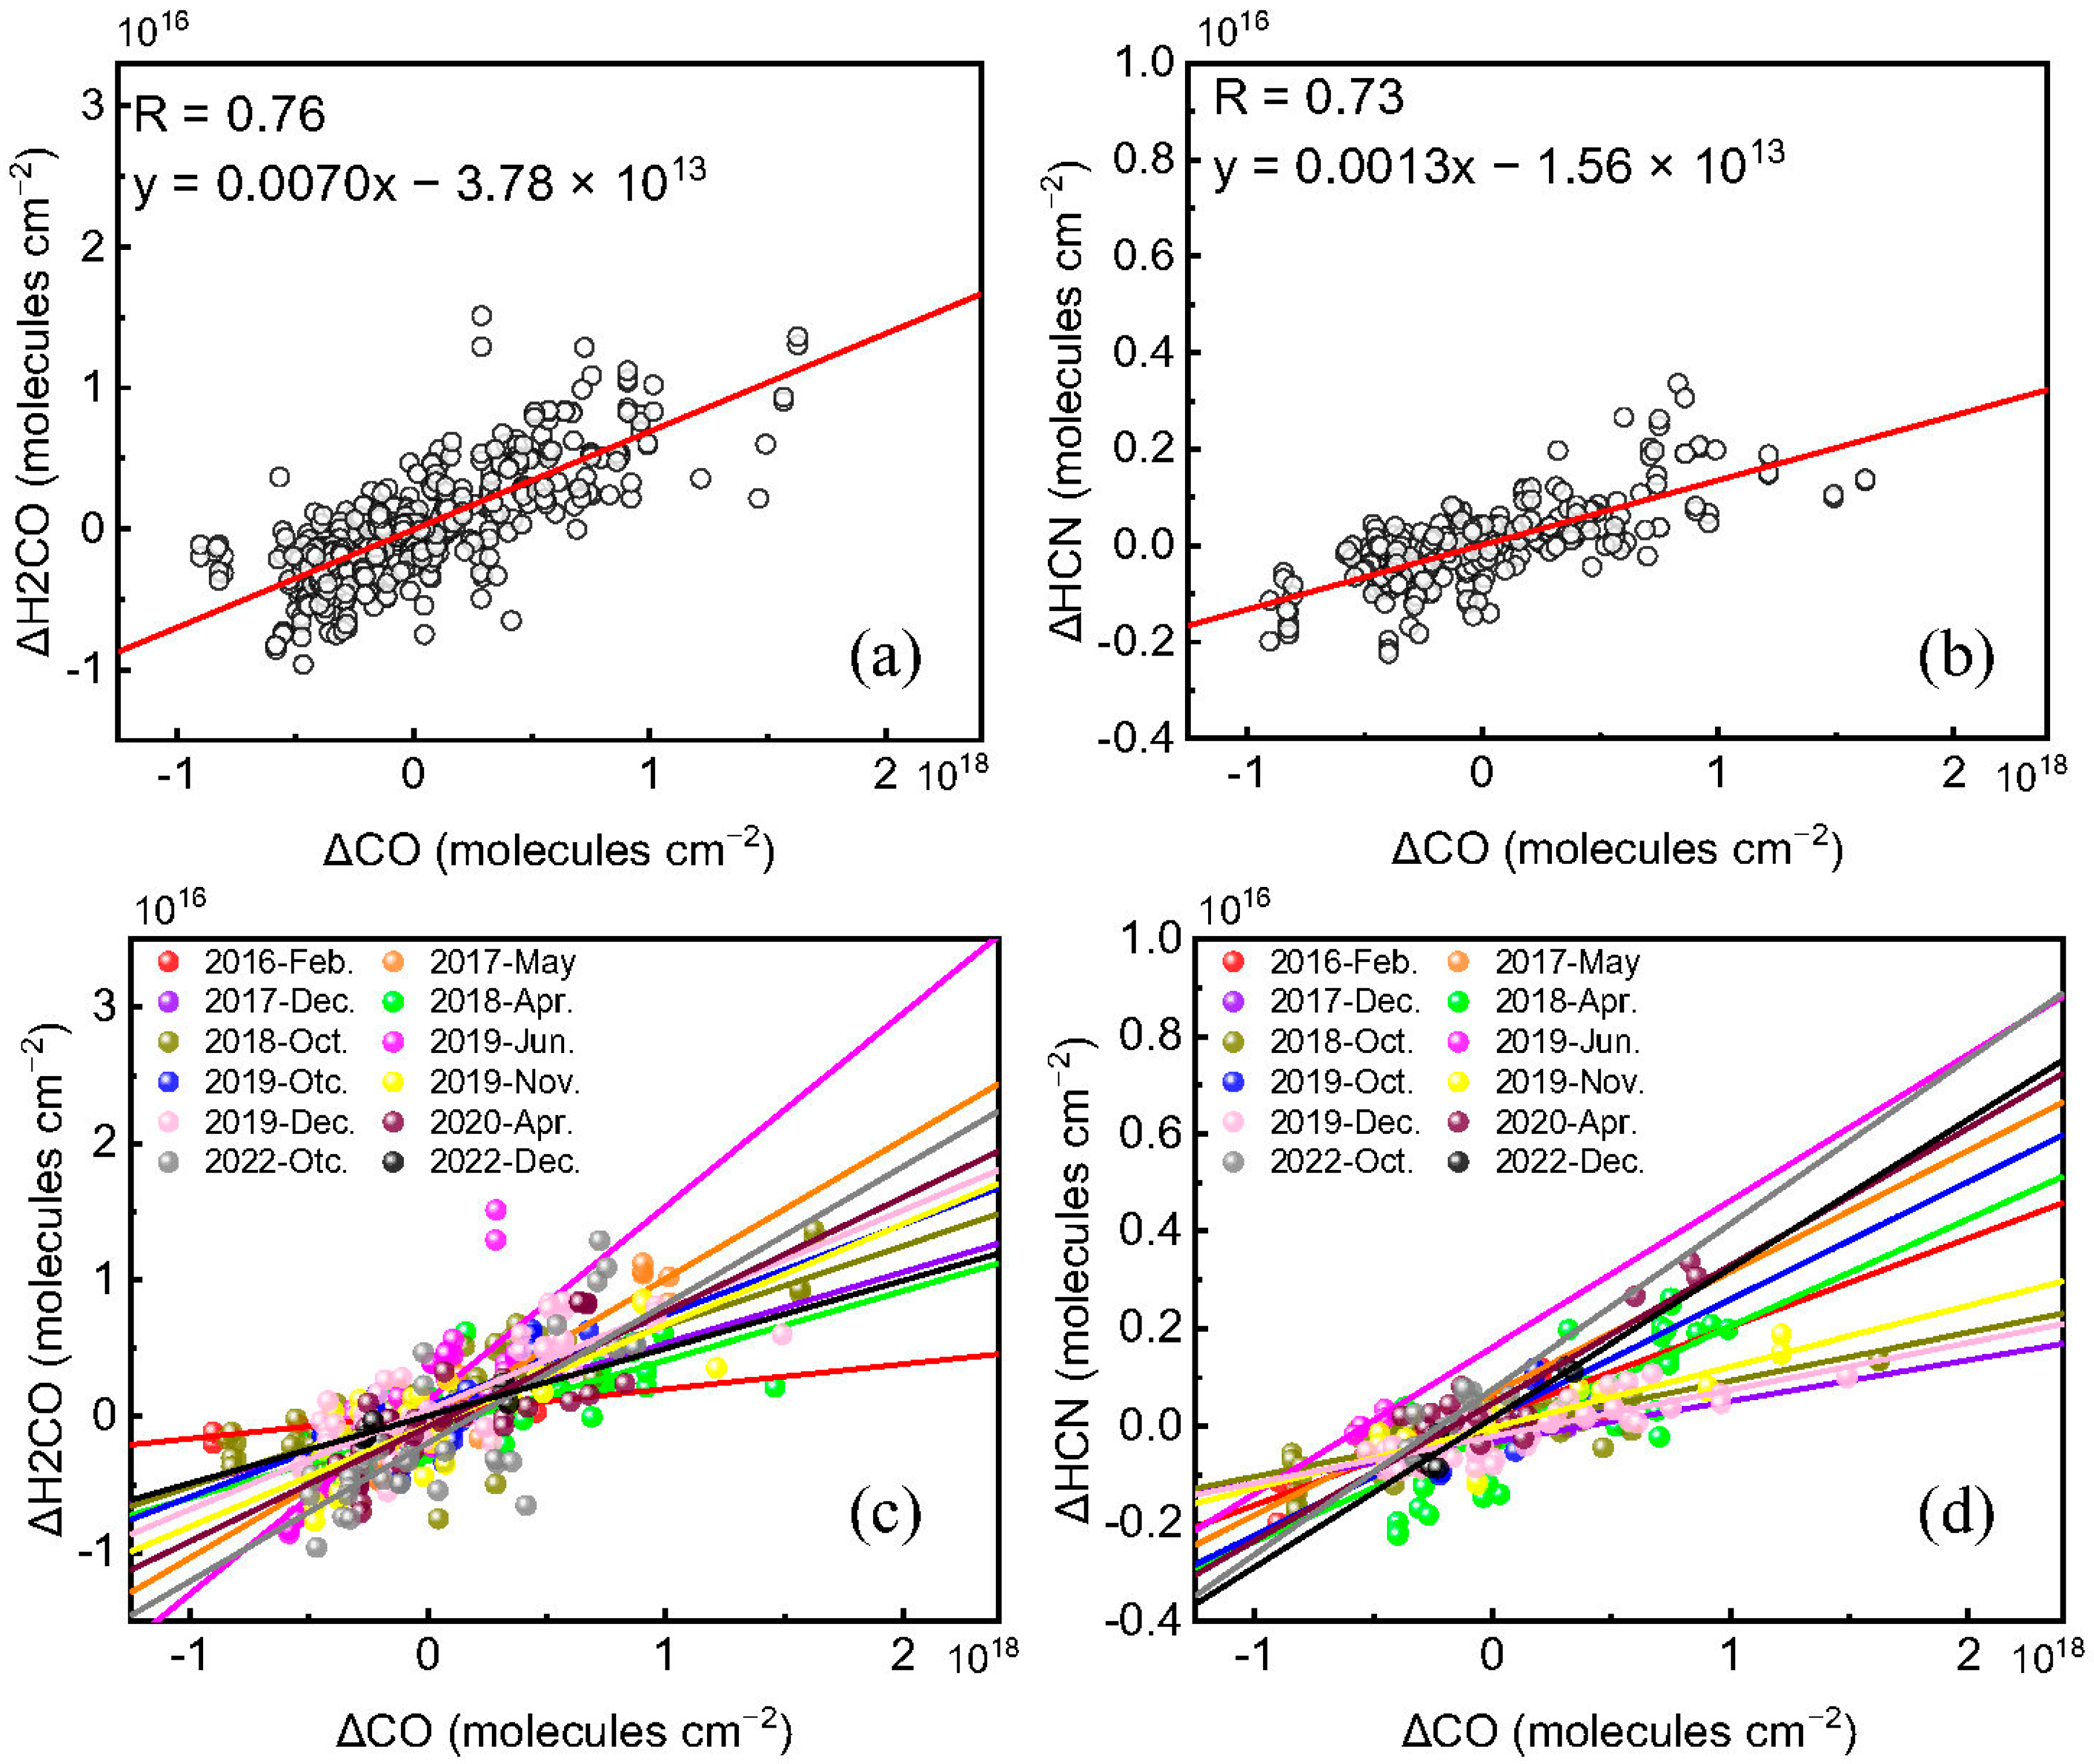
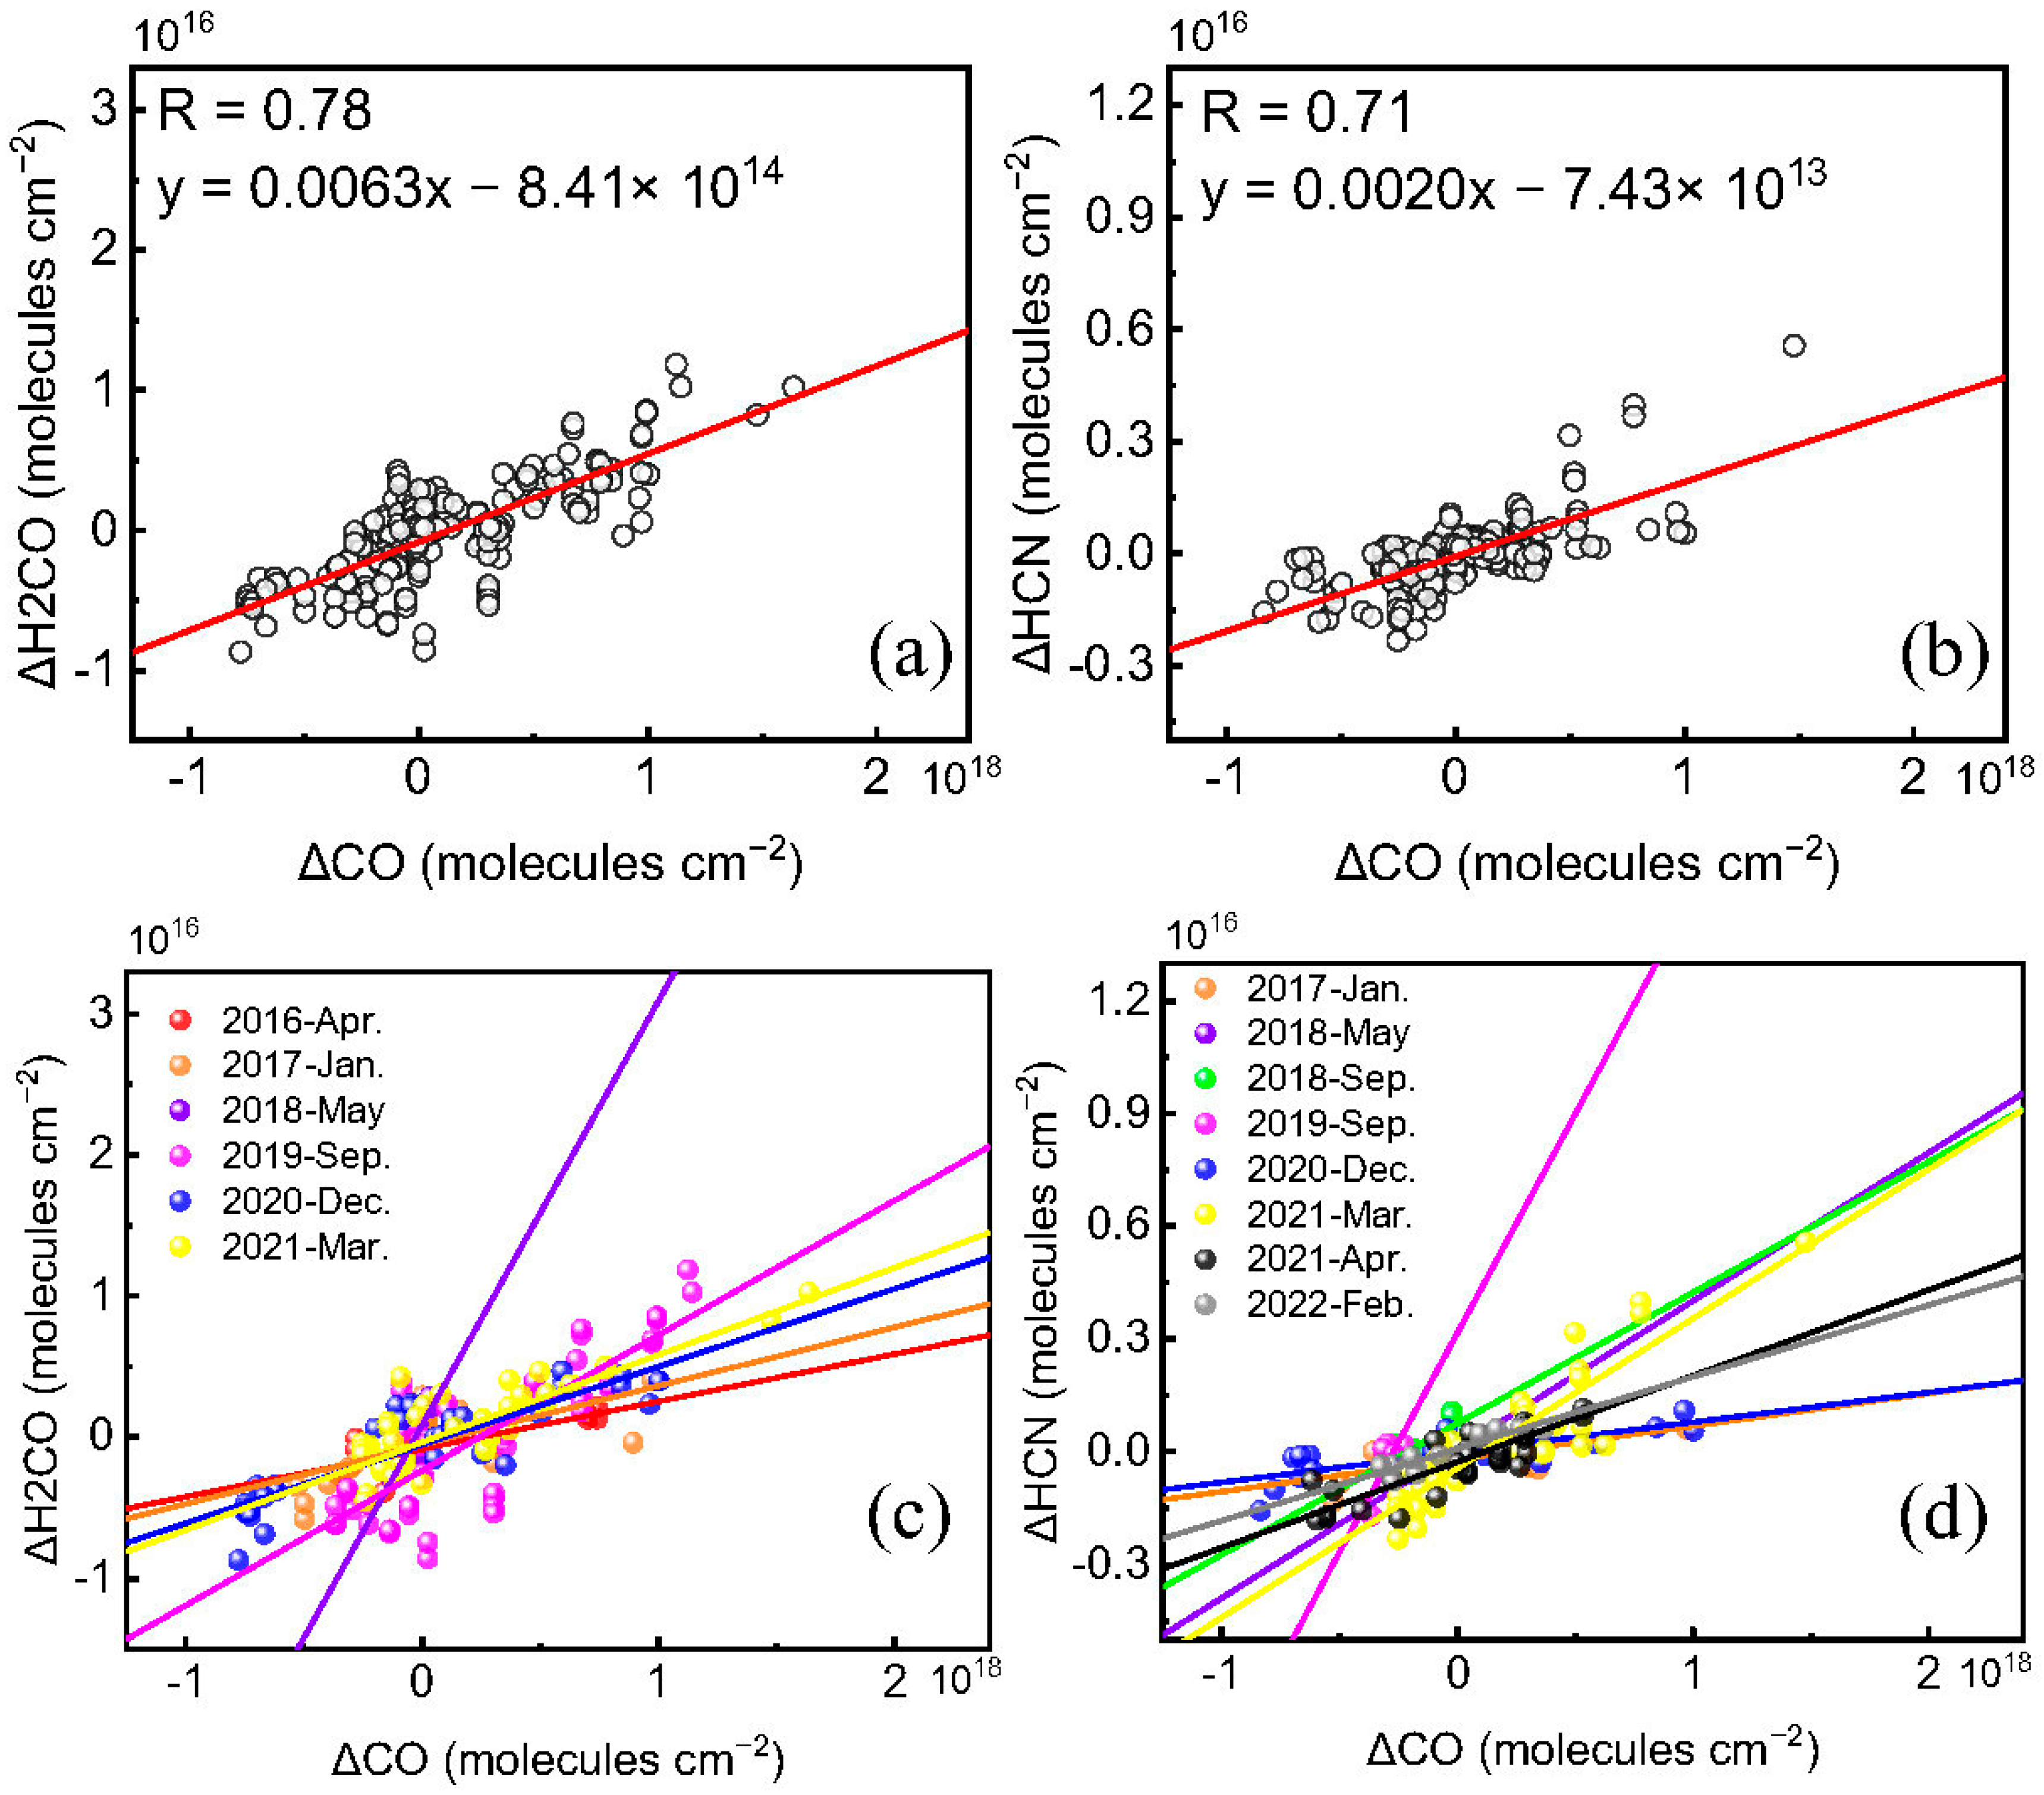
The monthly mean deviations of gas (ΔCO, ΔH2CO, and ΔHCN) are obtained by removing the monthly means from the individual total column of CO, H2CO, and HCN. The monthly mean deviations reduce the influence of the atmospheric background and remove the seasonal component [24,30,32]. During the months when the variations of H2CO and CO are predominantly affected by local emissions from biomass burning (in the first category), the relationship between ΔH2CO and ΔHCN with ΔCO is shown in Figure 11. The specific correlation coefficients (R), slopes, and intercepts between ΔH2CO and ΔHCN with ΔCO are listed in Table 7. The enhancement ratio (EnhR), defined as the slope of ΔH2CO/ΔCO and ΔHCN/ΔCO, is a useful metric for identifying the emissions of biomass burning [25,52,53,54]. When the R values for both H2CO and CO with HCN are greater than 0.8, ΔH2CO and ΔHCN with ΔCO also exhibit a high correlation. The overall correlation R values for ΔH2CO and ΔHCN with ΔCO are 0.76 and 0.73, respectively. The monthly R values range between 0.76 and 0.93 for ΔH2CO with ΔCO, and between 0.79 and 0.96 for ΔHCN with ΔCO. The calculated EnhR values for ΔH2CO/ΔCO and ΔHCN/ΔCO are in the range of 1.8 × 10⁻³ to 14.2 × 10⁻³ and 0.8 × 10⁻³ to 3.4 × 10⁻³, respectively.
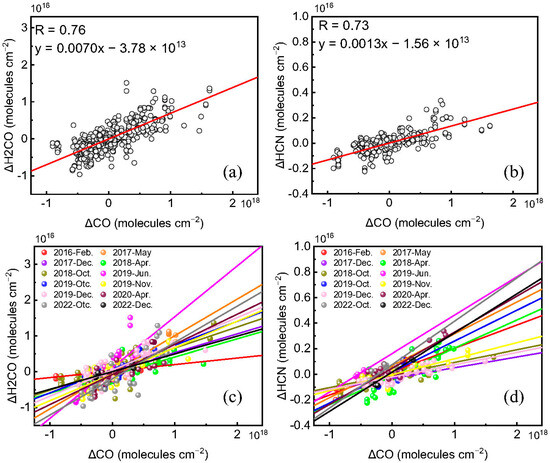
Figure 11.
Correlation plots of (a) ΔH2CO versus ΔCO and (b) ΔHCN versus ΔCO for all the months when H2CO and CO are predominantly influenced by biomass-burning emissions (black). Correlation plots of (c) ΔH2CO versus ΔCO and (d) ΔHCN versus ΔCO for each month when H2CO and CO are predominantly affected by emissions from biomass burning. The data in different months are represented by color points. All solid lines are linear fits.

Table 7.
Monthly correlation R value, slope (EnhR), and intercept between ΔH2CO and ΔHCN versus ΔCO for months when H2CO and CO are predominantly influenced by biomass-burning emissions.
Additionally, for the months in the second category when the variations of H2CO and CO are influenced by long-distance biomass burning, Figure 12 illustrates the relationship between ΔH2CO and ΔHCN with ΔCO. Detailed values can be found in Table 8. In the months when the R value of only one gas, H2CO or CO, with HCN is greater than 0.8, some correlation R values between ΔH2CO and ΔHCN with ΔCO are low values. Therefore, the months with correlation R values between ΔH2CO or ΔHCN with ΔCO below 0.6 were excluded from the analysis, and the enhancement ratio was not calculated. Then the overall R values between ΔH2CO and ΔHCN with ΔCO were 0.78 and 0.71, respectively. The monthly R values for ΔH2CO and ΔCO ranged from 0.68 to 0.89, and for ΔHCN and ΔCO from 0.68 to 0.98. The EnhR for ΔH2CO/ΔCO and ΔHCN/ΔCO are in the range of 3.4 × 10⁻³ to 30.1× 10⁻³ and in the range of 0.8 × 10⁻³ to 11.7 × 10⁻³, respectively. The EnhR of ΔH2CO/ΔCO in May 2018 and ΔHCN/ΔCO in September 2019 showed abnormally large values. After removing these outliers, The EnhR ranges from 3.4 × 10⁻³ to 9.6 × 10⁻³ and from 0.8 × 10⁻³ to 4.0 × 10⁻³, respectively.
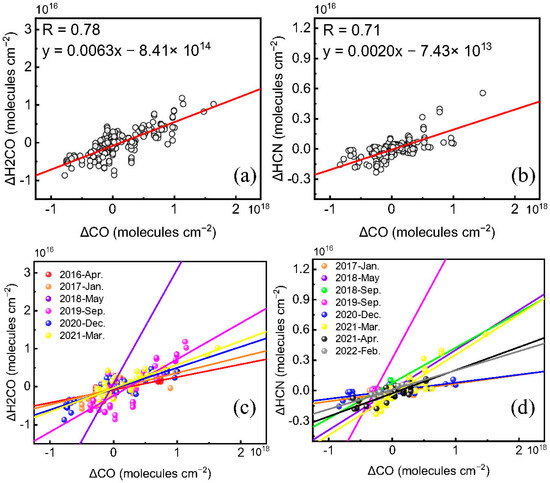
Figure 12.
Similar to Figure 11, but for the months in the second category with correlation R values between ΔH2CO and ΔHCN with ΔCO greater than 0.6. (a) ΔH2CO versus ΔCO and (b) ΔHCN versus ΔCO for all the months when H2CO or CO are affected by long-distance biomass burning sources (black). Correlation plots of (c) ΔH2CO versus ΔCO and (d) ΔHCN versus ΔCO for each month when H2CO and CO are predominantly affected by H2CO or CO are affected by long-distance biomass burning sources. The data in different months are represented by color points. All solid lines are linear fits.

Table 8.
Monthly correlation R value, slope (EnhR), and intercept between ΔH2CO and ΔHCN versus ΔCO for months in the second category when H2CO or CO are affected by long-distance biomass burning sources, “/” means that the slope and intercept were not calculated.
The EnhRs of ΔH2CO/ΔCO and ΔHCN/ΔCO from the FTIR measurements at Xianghe during 2018 to 2021 were 3.7–6.8 × 10⁻³ and 0.5–0.9 × 10⁻³, respectively [32]. The EnhR of H2CO and HCN relative to CO in Hefei is slightly larger than that in Xianghe. The reason for this difference may be that we only consider the months when biomass burning dominated the gas changes in this study. The HCN/CO ratios measured in Hefei, which are similar to the range of 0.2–7.1 × 10⁻³ reported by Yokelson et al. (1997) and 0.4–2.6 × 10⁻³ reported by Holzinger et al., (1999), are consistent with laboratory measurements [47,55].
3.3. Analysis of Air Mass Transport
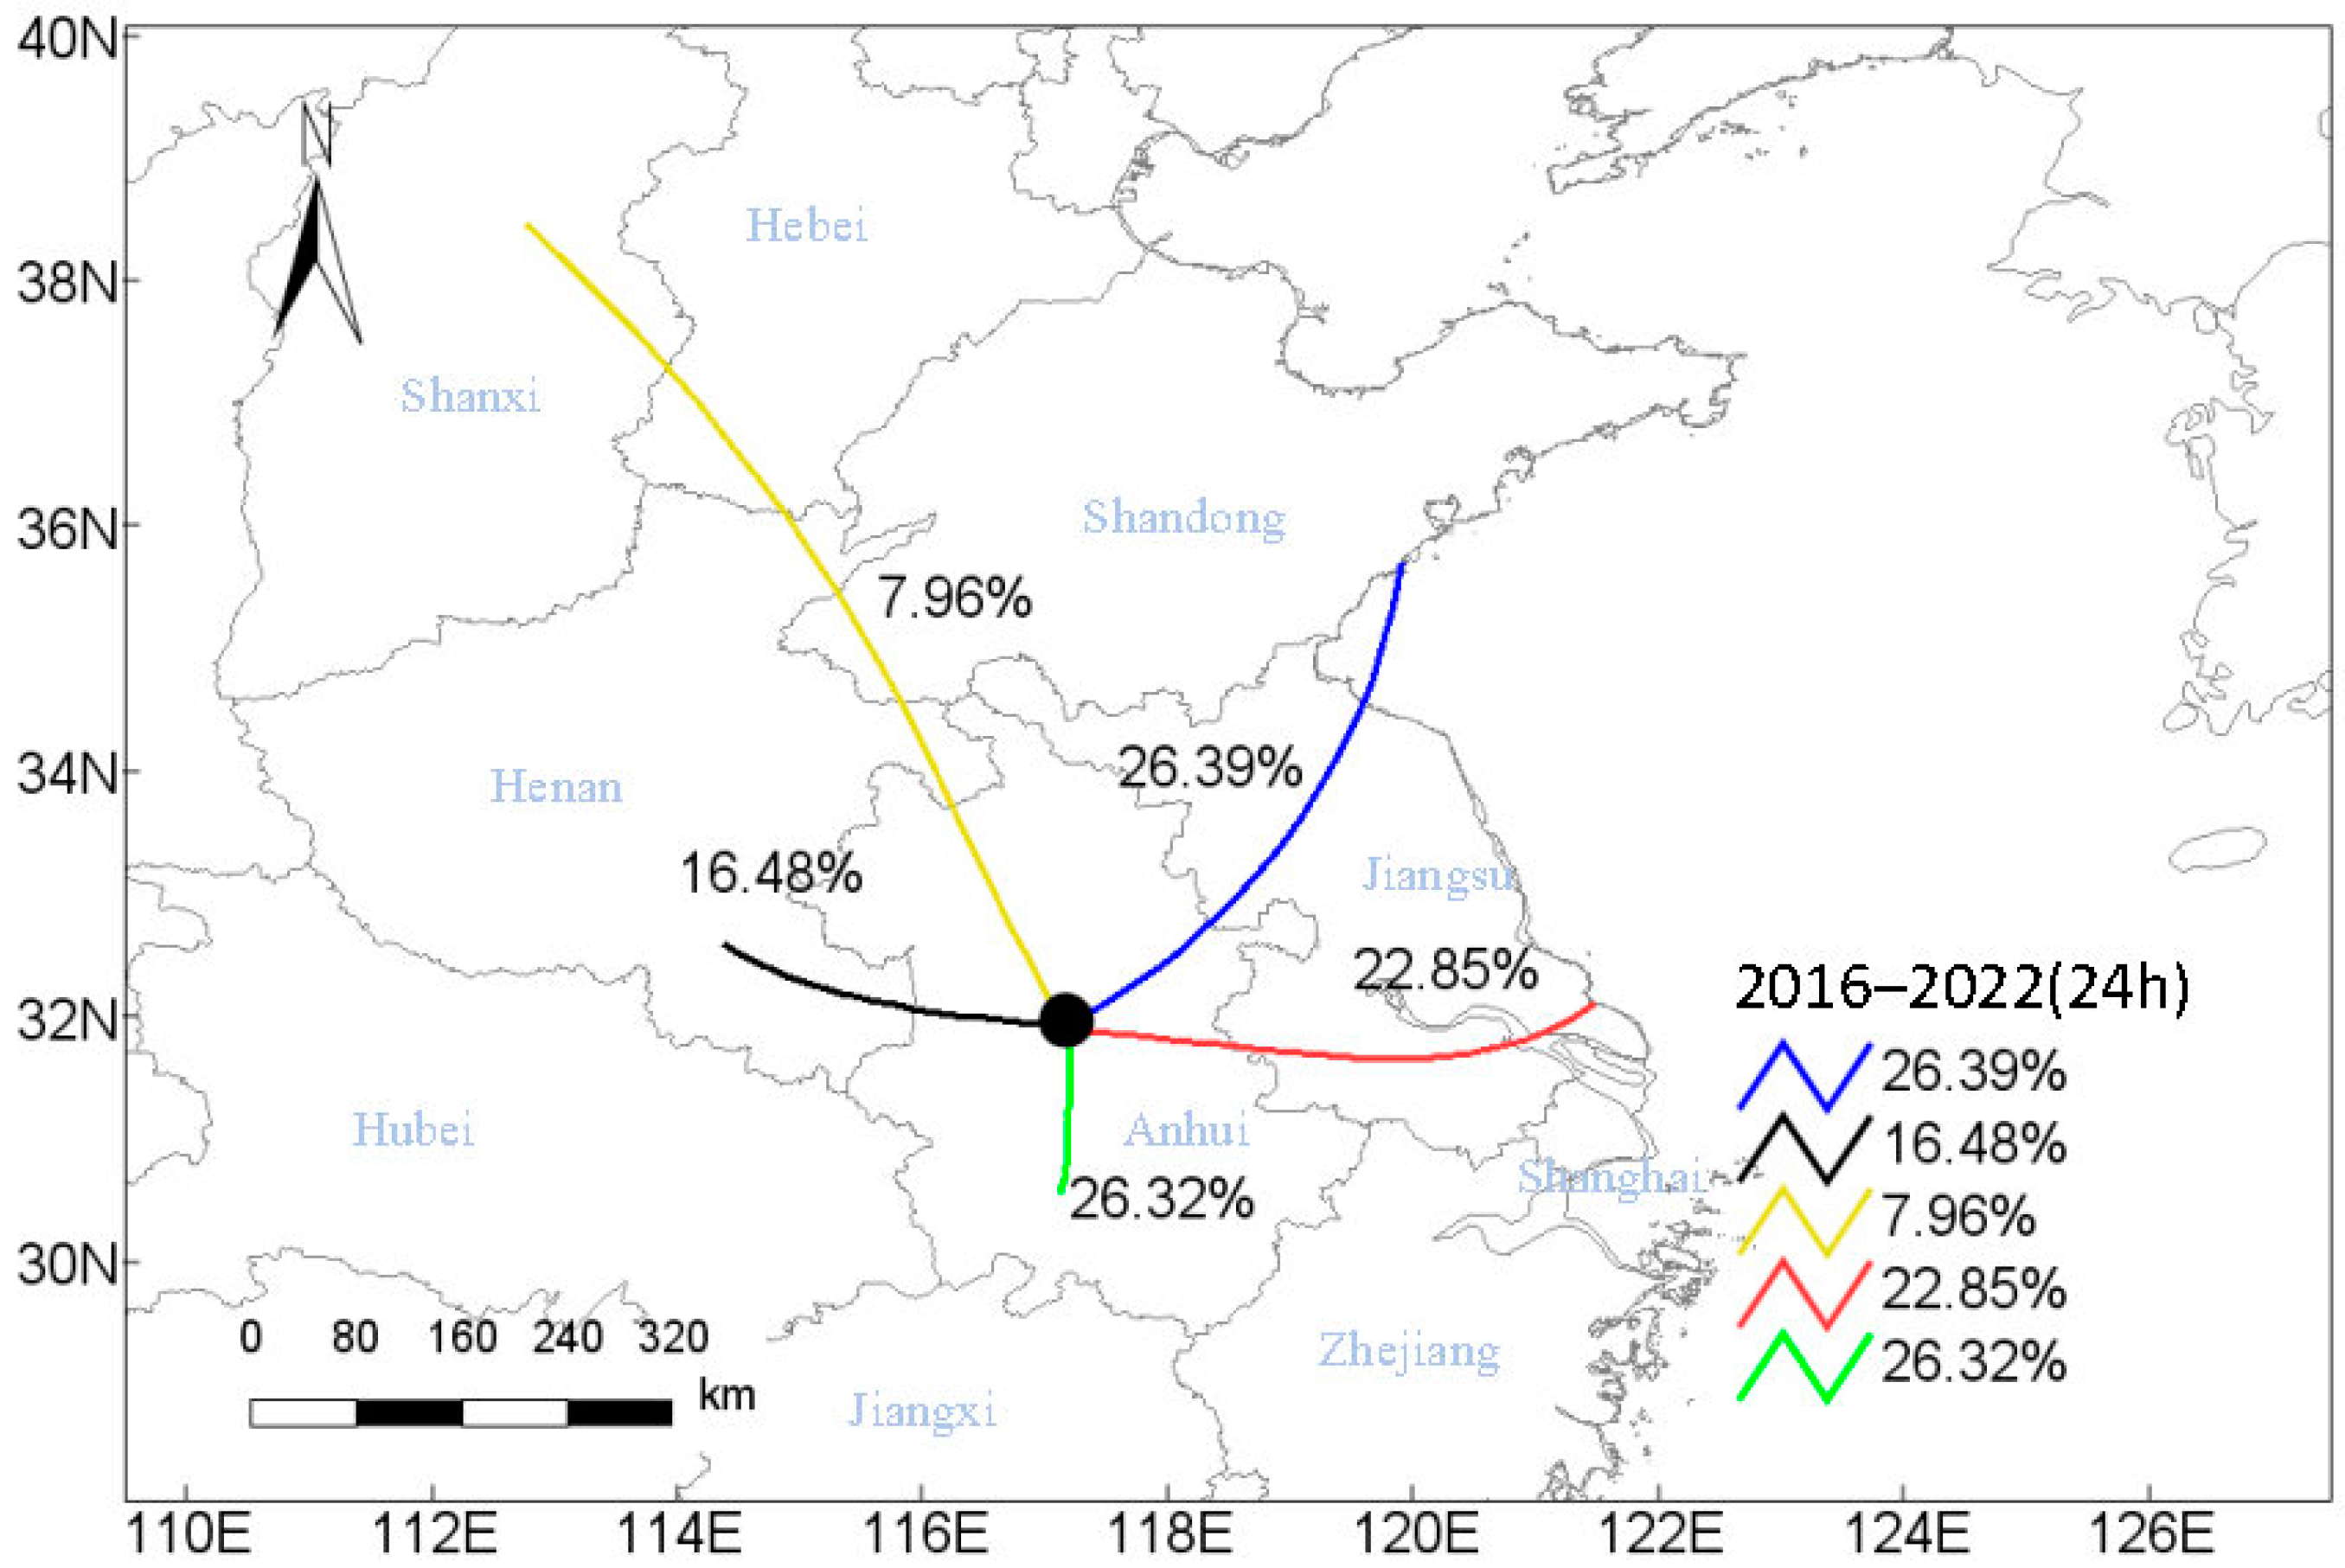
The Hybrid Single-Particle Lagrangian Integrated Trajectory (HYSPLIT) model provides effective methods for analyzing the transport and dispersion of pollutants through air masses [56]. HYSPLIT provides a comprehensive system for studying the atmospheric dispersion and transport of diverse pollutants across different regions, utilizing meteorological fields from the Global Data Assimilation System (GDAS) [57]. To comprehend the influence of air mass transport on the variations of the gases over the Hefei site during the periods when the biomass burning occurred, we employed the HYSPLIT model to compute air mass trajectories backward for 24 h at 500 m. The results are shown in Figure 13. The months during which the monthly correlation R of CO and H2CO with HCN is greater than 0.8 are included in the analysis of air mass transport.
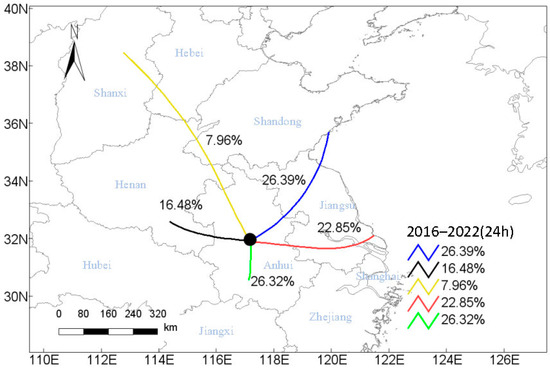
Figure 13.
Cluster analysis of airmass backward trajectories of the 24-h trajectories for months dominated by biomass burning for the years from 2016 to 2022 at the Hefei station. The colored lines represent the results of the cluster analysis.
The 24-h backward trajectories can be divided into five categories. The largest proportion of 26.39% was from the sea and passed through the northern part of Jiangsu province. In addition, 26.32% of air masses came from the southern part of Anhui province and 22.85% came from the eastern part of Jiangsu province and traveled through the southern part of Jiangsu province. Also, 16.48% of air masses came from the southern part of Henan province. Finally, the remaining 7.96% was from the Shanxi province and passed through the southern part of Hebei province, Henan province, and the northwest part of Anhui province. So, within 24 h, about 49.24% of air masses passed through Jiangsu province, and 26.32% came from the southern part of Anhui province. It means Jiangsu province, the eastern part, and the southern part of Anhui province had a great impact on the variations of pollutants over the Hefei site.
Further, the potential source contribution function (PSCF) of CO, H2CO, and HCN in the Hefei site was calculated. The PSCF calculation has been applied in many studies to locate the potential source contribution areas associated with air pollutants [58,59]. Figure 14 shows the 24-h PSCF values of the three gases for the same months as in the analysis of airmass backward trajectories. Over a 24-h period, the areas with a high PSCF for CO are the southeastern part of Anhui province, the southern part of Zhejiang province, Shanghai, and Jiangsu province. The areas with a high PSCF for H2CO are the southeastern part of Anhui province, the northern part of Anhui province, and the provinces bordering the southeast. The areas with a high PSCF for HCN are the eastern part of Anhui province, and the provinces bordering the southeast and northeast of Anhui. Overall, the biomass-burning emissions in the eastern part of Anhui province, the southeastern part of Anhui province, and the bordering provinces in the southeast of Anhui significantly affect the variations of the three gases. The pattern agrees with the 24-h backward trajectories of the air mass transport.

Figure 14.
PSCF for (a) CO, (b) H2CO, and (c) HCN over 24 h during which the monthly correlation R of CO and H2CO with HCN is greater than 0.8 from 2016 to 2022 at the Hefei site. The black dot represents the location of the Hefei site.
4. Conclusions
This study presents long-term data of total column and vertical profiles of atmospheric CO, H2CO, and HCN at the Hefei site from 2016 to 2022, based on high-resolution FTIR measurements of solar absorption spectra. The seasonal and interannual variability of CO, H2CO, and HCN from 2016 to 2022 are analyzed. During the observation period, atmospheric CO exhibited significant seasonal variations, characterized by high column concentrations observed during the spring and winter, and lower levels during the summer. The seasonal amplitude is 8.07 × 10¹⁷ molecules cm−2, with a seasonal variability of 29.35% and an average annual variability rate of (−2.67 ± 2.88)% yr−1. The H2CO total column exhibited a seasonal pattern, showing higher levels in the summer and lower levels in the winter. The seasonal amplitude and variability of H2CO are 1.89 × 10¹⁶ molecules cm−2 and 133.07%, respectively. The average annual variability rate is (2.52 ± 12.48)% yr−1. Similarly, HCN exhibited high column concentrations in the summer and low column concentrations in the winter. The seasonal amplitude is 2.32 × 10¹⁵ molecules cm−2, with a seasonal variability of 34.69% and an average annual variability rate of (−3.48 ± 7.26)% yr−1.
To evaluate the impact of biomass burning on the gas column variations, we utilized the correlation between atmospheric CO, H2CO, and HCN columns to identify the months during which biomass burning influences the variations of the gases. The satellite-observed FRP values within the Anhui province are used to further find the months during which biomass burning occurred. The months during which the monthly R values between CO and H2CO with HCN are greater than 0.8, and the monthly total FRP exceeds its monthly average, are considered biomass-burning occurrences in the Anhui province. Conversely, the months during which only one of the R between CO or H2CO with HCN is greater than 0.8, and the monthly total FRP is below its monthly average, are regarded as being influenced by long-distance transport.
Then, the enhancement ratios (EnhR) represented as ΔH2CO/ΔCO and ΔHCN/ΔCO for the months with biomass-burning occurrence and being influenced by the long-distance transport were calculated. For months with biomass-burning occurrence, the range of ΔH2CO/ΔCO and ΔHCN/ΔCO was 1.8–14.2 × 10⁻³ and 0.8–3.4 × 10⁻³, respectively. For months being influenced by the long-distance transport, the range of ΔH2CO/ΔCO and ΔHCN/ΔCO was 3.4–9.6× 10⁻³ and 0.8–4.0 × 10⁻³, respectively. Finally, the backward trajectory cluster analysis and PSCF calculation were conducted to examine air mass transport pathways and the potential source areas for the three gases at the Hefei site. The joint monitoring of atmospheric CO, H2CO, and HCN in the Hefei area helps to identify biomass-burning months and seasons, demonstrating the capability of high-resolution FTIR technology to accurately monitor biomass-burning emissions.
Author Contributions
Funding acquisition, W.W. and C.L.; writing—original draft, Q.Z.; resources, C.S., Y.X., P.W., B.L., X.P. and Z.Q.; writing—review and editing, W.W. and Q.Z; supervision, C.L. All authors have read and agreed to the published version of the manuscript.
Funding
We gratefully acknowledge the support of the National Key Technology R&D Program of China (2022YFB3904805); the National Natural Science Foundation of China (42305139); the University Natural Science Research Project of Anhui Province (2022AH051794); the State Environmental Protection Key Laboratory of Sources and Control of Air Pollution Complex (SCAPC202110); the Key Laboratory of Middle Atmosphere and Global Environment Observation (LAGEO-2022-05); and the Research Fund Program of Guangdong-Hongkong-Macau Joint Laboratory of Collaborative Innovation for Environmental Quality (GHML2022-002).
Data Availability Statement
The data presented in this study are available on request from the corresponding author. The data are not publicly available due to The data is part of an ongoing study, and the measurement data will be made available on the NDACC website at a later stage.
Acknowledgments
We gratefully acknowledge Nicholas Jones, University of Wollongong, and Omaira E. García, State Meteorological Agency of Spain, for guidance on the spectroscopy retrievals. We are grateful to the NDACC networks for providing information and advice on the SFIT (version 0.9.4.4) software. We gratefully acknowledge the NOAA Air Resources Laboratory (ARL)for the provision of the HYSPLIT transport and dispersion model and READY website (http://www.ready.noaa.gov).
Conflicts of Interest
The authors declare no conflict of interest.
References
- Andreae, M.O. Emission of trace gases and aerosols from biomass burning—An updated assessment. Atmos. Chem. Phys. 2019, 19, 8523–8546. [Google Scholar] [CrossRef]
- Coheur, P.F.; Herbin, H.; Clerbaux, C.; Hurtmans, D.; Wespes, C.; Carleer, M.; Turquety, S.; Rinsland, C.P.; Remedios, J.; Hauglustaine, D.; et al. ACE-FTS observation of a young biomass burning plume: First reported measurements of C2H4, C3H6O, H2CO and PAN by infrared occultation from space. Atmos. Chem. Phys. 2007, 7, 5437–5446. [Google Scholar] [CrossRef]
- Wu, J.; Kong, S.; Wu, F.; Cheng, Y.; Zheng, S.; Yan, Q.; Zheng, H.; Yang, G.; Zheng, M.; Liu, D.; et al. Estimating the open biomass burning emissions in central and eastern China from 2003 to 2015 based on satellite observation. Atmos. Chem. Phys. 2018, 18, 11623–11646. [Google Scholar] [CrossRef]
- Zarzana, K.J.; Selimovic, V.; Koss, A.R.; Sekimoto, K.; Coggon, M.M.; Yuan, B.; Dubé, W.P.; Yokelson, R.J.; Warneke, C.; de Gouw, J.A.; et al. Primary emissions of glyoxal and methylglyoxal from laboratory measurements of open biomass burning. Atmos. Chem. Phys. 2018, 18, 15451–15470. [Google Scholar] [CrossRef]
- Tereszchuk, K.A.; González Abad, G.; Clerbaux, C.; Hurtmans, D.; Coheur, P.F.; Bernath, P.F. ACE-FTS measurements of trace species in the characterization of biomass burning plumes. Atmos. Chem. Phys. 2011, 11, 12169–12179. [Google Scholar] [CrossRef]
- Viatte, C.; Strong, K.; Walker, K.A.; Drummond, J.R. Five years of CO, HCN, C2H6, C2H2, CH3OH, HCOOH and H2CO total columns measured in the Canadian high Arctic. Atmos. Meas. Tech. 2014, 7, 1547–1570. [Google Scholar] [CrossRef]
- Zhao, Y.; Strong, K.; Kondo, Y.; Koike, M.; Matsumi, Y.; Irie, H.; Rinsland, C.; Jones, N.; Suzuki, K.; Nakajima, H.; et al. Spectroscopic measurements of tropospheric CO, C2H6, C2H2, and HCN in northern Japan. J. Geophys. Res. Atmos. 2002, 107, ACH 2-1–ACH 2-16. [Google Scholar] [CrossRef]
- Anderson, D.C.; Nicely, J.M.; Wolfe, G.M.; Hanisco, T.F.; Salawitch, R.J.; Canty, T.P.; Dickerson, R.R.; Apel, E.C.; Baidar, S.; Bannan, T.J. Formaldehyde in the tropical western Pacific: Chemical sources and sinks, convective transport, and representation in CAM-Chem and the CCMI models. J. Geophys. Res. Atmos. 2017, 122, 11201–11226. [Google Scholar] [CrossRef]
- Clerbaux, C.; George, M.; Turquety, S.; Walker, K.A.; Barret, B.; Bernath, P.; Boone, C.; Borsdorff, T.; Cammas, J.P.; Catoire, V.; et al. CO measurements from the ACE-FTS satellite instrument: Data analysis and validation using ground-based, airborne and spaceborne observations. Atmos. Chem. Phys. 2008, 8, 2569–2594. [Google Scholar] [CrossRef]
- Yin, Y.; Chevallier, F.; Ciais, P.; Broquet, G.; Fortems-Cheiney, A.; Pison, I.; Saunois, M. Decadal trends in global CO emissions as seen by MOPITT. Atmos. Chem. Phys. 2015, 15, 13433–13451. [Google Scholar] [CrossRef]
- Wang, W.; Tian, Y.; Liu, C.; Sun, Y.; Liu, W.; Xie, P.; Liu, J.; Xu, J.; Morino, I.; Velazco, V.A.; et al. Investigating the performance of a greenhouse gas observatory in Hefei, China. Atmos. Meas. Tech. 2017, 10, 2627–2643. [Google Scholar] [CrossRef]
- Zeng, G.; Wood, S.; Morgenstern, O.; Jones, N.; Robinson, J.; Smale, D. Trends, interannual and seasonal variations of tropospheric CO, C2H6 and HCN columns measured from ground-based FTIR at Lauder and Arrival Heights. Atmos. Chem. Phys. Discuss. 2012, 12, 6185–6204. [Google Scholar]
- Fan, J.; Ju, T.; Wang, Q.; Gao, H.; Huang, R.; Duan, J. Spatiotemporal variations and potential sources of tropospheric formaldehyde over eastern China based on OMI satellite data. Atmos. Pollut. Res. 2021, 12, 272–285. [Google Scholar] [CrossRef]
- Guven, B.B.; Olaguer, E.P. Ambient formaldehyde source attribution in Houston during TexAQS II and TRAMP. Atmos. Environ. 2011, 45, 4272–4280. [Google Scholar] [CrossRef]
- Ho, S.S.H.; Ho, K.F.; Lee, S.C.; Cheng, Y.; Yu, J.Z.; Lam, K.M.; Feng, N.S.Y.; Huang, Y. Carbonyl emissions from vehicular exhausts sources in Hong Kong. J. Air Waste Manag. Assoc. 2012, 62, 221–234. [Google Scholar] [CrossRef]
- Ling, Z.; Zhao, J.; Fan, S.; Wang, X. Sources of formaldehyde and their contributions to photochemical O3 formation at an urban site in the Pearl River Delta, southern China. Chemosphere 2017, 168, 1293–1301. [Google Scholar] [CrossRef]
- Morfopoulos, C.; Müller, J.F.; Stavrakou, T.; Bauwens, M.; De Smedt, I.; Friedlingstein, P.; Prentice, I.C.; Regnier, P. Vegetation responses to climate extremes recorded by remotely sensed atmospheric formaldehyde. Glob. Change Biol. 2022, 28, 1809–1822. [Google Scholar] [CrossRef]
- Zhang, H.; Li, J.; Ying, Q.; Guven, B.B.; Olaguer, E.P. Source apportionment of formaldehyde during TexAQS 2006 using a source-oriented chemical transport model. J. Geophys. Res. Atmos. 2013, 118, 1525–1535. [Google Scholar] [CrossRef]
- Zhu, B.; Huang, X.-F.; Xia, S.-Y.; Lin, L.-L.; Cheng, Y.; He, L.-Y. Biomass-burning emissions could significantly enhance the atmospheric oxidizing capacity in continental air pollution. Environ. Pollut. 2021, 285, 117523. [Google Scholar] [CrossRef]
- Fortems-Cheiney, A.; Chevallier, F.; Pison, I.; Bousquet, P.; Saunois, M.; Szopa, S.; Cressot, C.; Kurosu, T.; Chance, K.; Fried, A. The formaldehyde budget as seen by a global-scale multi-constraint and multi-species inversion system. Atmos. Chem. Phys. 2012, 12, 6699–6721. [Google Scholar] [CrossRef]
- Lobert, J.M.; Scharffe, D.H.; Hao, W.M.; Crutzen, P.J. Importance of biomass burning in the atmospheric budgets of nitrogen-containing gases. Nature 1990, 346, 552–554. [Google Scholar] [CrossRef]
- Li, Q.; Palmer, P.I.; Pumphrey, H.C.; Bernath, P.; Mahieu, E. What drives the observed variability of HCN in the troposphere and lower stratosphere? Atmos. Chem. Phys. 2009, 9, 8531–8543. [Google Scholar] [CrossRef]
- Li, Q.; Jacob, D.J.; Bey, I.; Yantosca, R.M.; Zhao, Y.; Kondo, Y.; Notholt, J. Atmospheric hydrogen cyanide (HCN): Biomass burning source, ocean sink? Geophys. Res. Lett. 2000, 27, 357–360. [Google Scholar] [CrossRef]
- Nagahama, Y.; Suzuki, K. The influence of forest fires on CO, HCN, C2H6, and C2H2 over northern Japan measured by infrared solar spectroscopy. Atmos. Environ. 2007, 41, 9570–9579. [Google Scholar] [CrossRef]
- Rinsland, C.P.; Jones, N.B.; Connor, B.J.; Wood, S.W.; Goldman, A.; Stephen, T.M.; Murcray, F.J.; Chiou, L.S.; Zander, R.; Mahieu, E. Multiyear infrared solar spectroscopic measurements of HCN, CO, C2H6, and C2H2 tropospheric columns above Lauder, New Zealand (45 S latitude). J. Geophys. Res. Atmos. 2002, 107, ACH 1-1–ACH 1-12. [Google Scholar] [CrossRef]
- Rinsland, C.; Goldman, A.; Murcray, F.; Stephen, T.; Pougatchev, N.; Fishman, J.; David, S.; Blatherwick, R.; Novelli, P.; Jones, N. Infrared solar spectroscopic measurements of free tropospheric CO, C2H6, and HCN above Mauna Loa, Hawaii: Seasonal variations and evidence for enhanced emissions from the Southeast Asian tropical fires of 1997–1998. J. Geophys. Res. Atmos. 1999, 104, 18667–18680. [Google Scholar] [CrossRef]
- Notholt, J.; Toon, G.; Lehmann, R.; Sen, B.; Blavier, J.F. Comparison of Arctic and Antarctic trace gas column abundances from ground-based Fourier transform infrared spectrometry. J. Geophys. Res. Atmos. 1997, 102, 12863–12869. [Google Scholar] [CrossRef]
- Hak, C.; Pundt, I.; Trick, S.; Kern, C.; Platt, U.; Dommen, J.; Ordóñez, C.; Prévôt, A.S.; Junkermann, W.; Astorga-Lloréns, C. Intercomparison of four different in-situ techniques for ambient formaldehyde measurements in urban air. Atmos. Chem. Phys. 2005, 5, 2881–2900. [Google Scholar] [CrossRef]
- Lieschke, K.J.; Fisher, J.A.; Paton-Walsh, C.; Jones, N.B.; Greenslade, J.W.; Burden, S.; Griffith, D.W. Decreasing Trend in Formaldehyde Detected From 20-Year Record at Wollongong, Southeast Australia. Geophys. Res. Lett. 2019, 46, 8464–8473. [Google Scholar] [CrossRef]
- Vigouroux, C.; Stavrakou, T.; Whaley, C.; Dils, B.; Duflot, V.; Hermans, C.; Kumps, N.; Metzger, J.-M.; Scolas, F.; Vanhaelewyn, G. FTIR time-series of biomass burning products (HCN, C2H6, C2H2, CH3OH, and HCOOH) at Reunion Island (21° S, 55° E) and comparisons with model data. Atmos. Chem. Phys. 2012, 12, 10367–10385. [Google Scholar] [CrossRef]
- Lutsch, E.; Strong, K.; Jones, D.B.A.; Blumenstock, T.; Conway, S.; Fisher, J.A.; Hannigan, J.W.; Hase, F.; Kasai, Y.; Mahieu, E.; et al. Detection and attribution of wildfire pollution in the Arctic and northern midlatitudes using a network of Fourier-transform infrared spectrometers and GEOS-Chem. Atmos. Chem. Phys. 2020, 20, 12813–12851. [Google Scholar] [CrossRef]
- Zhou, M.; Langerock, B.; Wang, P.; Vigouroux, C.; Ni, Q.; Hermans, C.; Dils, B.; Kumps, N.; Nan, W.; De Mazière, M. Variations and correlations of CO, C2H2, C2H6, H2CO and HCN columns derived from three years of ground-based FTIR measurements at Xianghe, China. Atmos. Chem. Phys. Discuss. 2022, 2022, 1–29. [Google Scholar]
- Shan, C.; Wang, W.; Liu, C.; Guo, Y.; Xie, Y.; Sun, Y.; Hu, Q.; Zhang, H.; Yin, H.; Jones, N. Retrieval of vertical profiles and tropospheric CO2 columns based on high-resolution FTIR over Hefei, China. Opt. Express 2021, 29, 4958–4977. [Google Scholar] [CrossRef] [PubMed]
- Shan, C.; Wang, W.; Liu, C.; Sun, Y.; Hu, Q.; Xu, X.; Tian, Y.; Zhang, H.; Morino, I.; Griffith, D.W. Regional CO emission estimated from ground-based remote sensing at Hefei site, China. Atmos. Res. 2019, 222, 25–35. [Google Scholar] [CrossRef]
- Wu, P.; Shan, C.; Liu, C.; Xie, Y.; Wang, W.; Zhu, Q.; Zeng, X.; Liang, B. Ground-based remote sensing of atmospheric water vapor using high-resolution FTIR spectrometry. Remote Sens. 2023, 15, 3484. [Google Scholar] [CrossRef]
- Pougatchev, N.; Connor, B.; Rinsland, C. Infrared measurements of the ozone vertical distribution above Kitt Peak. J. Geophys. Res. Atmos. 1995, 100, 16689–16697. [Google Scholar] [CrossRef]
- Rodgers, C.D.; Connor, B.J. Intercomparison of remote sounding instruments. J. Geophys. Res. Atmos. 2003, 108, 4116. [Google Scholar] [CrossRef]
- García, O.E.; Schneider, M.; Sepúlveda, E.; Hase, F.; Blumenstock, T.; Cuevas, E.; Ramos, R.; Gross, J.; Barthlott, S.; Röhling, A.N. Twenty years of ground-based NDACC FTIR spectrometry at Izaña Observatory–overview and long-term comparison to other techniques. Atmos. Chem. Phys. 2021, 21, 15519–15554. [Google Scholar] [CrossRef]
- Kalnay, E.; Kanamitsu, M.; Kistler, R.; Collins, W.; Deaven, D.; Gandin, L.; Iredell, M.; Saha, S.; White, G.; Woollen, J. The NCEP/NCAR 40-year reanalysis project. In Renewable Energy; Routledge: London, UK, 2018; pp. Vol1_146–Vol141_194. [Google Scholar]
- Shan, C.; Zhang, H.; Wang, W.; Liu, C.; Xie, Y.; Hu, Q.; Jones, N. Retrieval of Stratospheric HNO3 and HCl Based on Ground-Based High-Resolution Fourier Transform Spectroscopy. Remote Sens. 2021, 13, 2159. [Google Scholar] [CrossRef]
- Zeng, X.; Wang, W.; Liu, C.; Shan, C.; Xie, Y.; Wu, P.; Zhu, Q.; Zhou, M.; De Mazière, M.; Mahieu, E. Retrieval of atmospheric CFC-11 and CFC-12 from high-resolution FTIR observations at Hefei and comparisons with other independent datasets. Atmos. Meas. Tech. 2022, 15, 6739–6754. [Google Scholar] [CrossRef]
- Ronsmans, G.; Langerock, B.; Wespes, C.; Hannigan, J.W.; Hase, F.; Kerzenmacher, T.; Mahieu, E.; Schneider, M.; Smale, D.; Hurtmans, D. First characterization and validation of FORLI-HNO3 vertical profiles retrieved from IASI/Metop. Atmos. Meas. Tech. 2016, 9, 4783–4801. [Google Scholar] [CrossRef]
- Thoning, K.W.; Tans, P.P.; Komhyr, W.D. Atmospheric carbon dioxide at Mauna Loa Observatory: 2. Analysis of the NOAA GMCC data, 1974–1985. J. Geophys. Res. Atmos. 1989, 94, 8549–8565. [Google Scholar] [CrossRef]
- Yamanouchi, S.; Strong, K.; Lutsch, E.; Jones, D.B. Detection of HCOOH, CH3OH, CO, HCN, and C2H6 in Wildfire Plumes Transported Over Toronto Using Ground-Based FTIR Measurements From 2002–2018. J. Geophys. Res. Atmos. 2020, 125, e2019JD031924. [Google Scholar] [CrossRef]
- Salau, O.; Warneke, T.; Notholt, J.; Shim, C.; Li, Q.; Xiao, Y. Tropospheric trace gases at Bremen measured with FTIR spectrometry. J. Environ. Monit. 2009, 11, 1529–1534. [Google Scholar] [CrossRef]
- York, D.; Evensen, N.M.; Martínez, M.L.; De Basabe Delgado, J. Unified equations for the slope, intercept, and standard errors of the best straight line. Am. J. Phys. 2004, 72, 367–375. [Google Scholar] [CrossRef]
- Holzinger, R.; Warneke, C.; Hansel, A.; Jordan, A.; Lindinger, W.; Scharffe, D.H.; Schade, G.; Crutzen, P.J. Biomass burning as a source of formaldehyde, acetaldehyde, methanol, acetone, acetonitrile, and hydrogen cyanide. Geophys. Res. Lett. 1999, 26, 1161–1164. [Google Scholar] [CrossRef]
- Sun, Y.; Liu, C.; Zhang, L.; Palm, M.; Notholt, J.; Yin, H.; Vigouroux, C.; Lutsch, E.; Wang, W.; Shan, C. Fourier transform infrared time series of tropospheric HCN in eastern China: Seasonality, interannual variability, and source attribution. Atmos. Chem. Phys. 2020, 20, 5437–5456. [Google Scholar] [CrossRef]
- Ichoku, C.; Kaufman, Y.J. A method to derive smoke emission rates from MODIS fire radiative energy measurements. IEEE Trans. Geosci. Remote Sens. 2005, 43, 2636–2649. [Google Scholar] [CrossRef]
- Kaufman, Y.J.; Justice, C.O.; Flynn, L.P.; Kendall, J.D.; Prins, E.M.; Giglio, L.; Ward, D.E.; Menzel, W.P.; Setzer, A.W. Potential global fire monitoring from EOS-MODIS. J. Geophys. Res. Atmos. 1998, 103, 32215–32238. [Google Scholar] [CrossRef]
- Wooster, M.; Zhukov, B.; Oertel, D. Fire radiative energy for quantitative study of biomass burning: Derivation from the BIRD experimental satellite and comparison to MODIS fire products. Remote Sens. Environ. 2003, 86, 83–107. [Google Scholar] [CrossRef]
- Zhao, Y.; Kondo, Y.; Murcray, F.; Liu, X.; Koike, M.; Irie, H.; Strong, K.; Suzuki, K.; Sera, M.; Ikegami, Y. Seasonal variations of HCN over northern Japan measured by ground-based infrared solar spectroscopy. Geophys. Res. Lett. 2000, 27, 2085–2088. [Google Scholar] [CrossRef]
- Lutsch, E.; Dammers, E.; Conway, S.; Strong, K. Long-range transport of NH3, CO, HCN, and C2H6 from the 2014 Canadian wildfires. Geophys. Res. Lett. 2016, 43, 8286–8297. [Google Scholar] [CrossRef]
- Viatte, C.; Strong, K.; Hannigan, J.; Nussbaumer, E.; Emmons, L.K.; Conway, S.; Paton-Walsh, C.; Hartley, J.; Benmergui, J.; Lin, J. Identifying fire plumes in the Arctic with tropospheric FTIR measurements and transport models. Atmos. Chem. Phys. 2015, 15, 2227–2246. [Google Scholar] [CrossRef]
- Yokelson, R.J.; Susott, R.; Ward, D.E.; Reardon, J.; Griffith, D.W. Emissions from smoldering combustion of biomass measured by open-path Fourier transform infrared spectroscopy. J. Geophys. Res. Atmos. 1997, 102, 18865–18877. [Google Scholar] [CrossRef]
- Qianzhu, F.; Yan, Z.; Weichun, M.; Huixin, M.; Junlan, F.; Qi, Y.; Xin, Y.; KW, N.S.; Qingyan, F.; Limin, C. Spatial and Seasonal Dynamics of Ship Emissions over the Yangtze River Delta and East China Sea and Their Potential Environmental Influence. Environ. Sci. Technol. 2016, 50, 1322–1329. [Google Scholar]
- Draxler, R.R.; Hess, G. An overview of the HYSPLIT_4 modelling system for trajectories. Aust. Meteorol. Mag. 1998, 47, 295–308. [Google Scholar]
- Yin, X.; Kang, S.; de Foy, B.; Cong, Z.; Luo, J.; Zhang, L.; Ma, Y.; Zhang, G.; Rupakheti, D.; Zhang, Q. Surface ozone at Nam Co in the inland Tibetan Plateau: Variation, synthesis comparison and regional representativeness. Atmos. Chem. Phys. 2017, 18, 11293–11311. [Google Scholar] [CrossRef]
- Kaiser, A.; Scheifinger, H.; Spangl, W.; Weiss, A.; Gilge, S.; Fricke, W.; Ries, L.; Cemas, D.; Jesenovec, B. Transport of nitrogen oxides, carbon monoxide and ozone to the alpine global atmosphere watch stations Jungfraujoch (Switzerland), Zugspitze and Hohenpeißenberg (Germany), Sonnblick (Austria) and Mt.Krvavec (Slovenia). Atmos. Environ. 2007, 41, 9273–9287. [Google Scholar] [CrossRef]
Disclaimer/Publisher’s Note: The statements, opinions and data contained in all publications are solely those of the individual author(s) and contributor(s) and not of MDPI and/or the editor(s). MDPI and/or the editor(s) disclaim responsibility for any injury to people or property resulting from any ideas, methods, instructions or products referred to in the content. |
© 2024 by the authors. Licensee MDPI, Basel, Switzerland. This article is an open access article distributed under the terms and conditions of the Creative Commons Attribution (CC BY) license (https://creativecommons.org/licenses/by/4.0/).


