Article

Dynamic Analysis and Risk Assessment of Vegetation Net Primary Productivity in Xinjiang, China

1
State Key Laboratory of Remote Sensing Science, Faculty of Geographical Science, Beijing Normal University, Beijing 100875, China
2
Beijing Engineering Research Center for Global Land Remote Sensing Products, Faculty of Geographical Science, Beijing Normal University, Beijing 100875, China
*
Author to whom correspondence should be addressed.
Remote Sens. 2024, 16(19), 3604; https://doi.org/10.3390/rs16193604
Submission received: 15 June 2024 / Revised: 2 September 2024 / Accepted: 23 September 2024 / Published: 27 September 2024

Abstract

:
Vegetation net primary productivity (NPP) is a key indicator for assessing vegetation dynamics and carbon cycle balance. Xinjiang is located in an arid and ecologically fragile region in northwest China, but the current understanding of vegetation dynamics in the region is still limited. This study aims to analyze Xinjiang’s NPP spatial and temporal trends, using random forest regression to quantify the extent to which climate change and human activities affect vegetation productivity. CMIP6 (Coupled Model Intercomparison Project Phase 6) climate scenario data help assess vegetation restoration potential and future risks. Our findings indicate that (1) Xinjiang’s NPP exhibits a significant increasing trend from 2001 to 2020, with three-quarters of the region experiencing an increase, 2.64% of the area showing significant decrease (p < 0.05), and the Ili River Basin showing a nonsignificant decreasing trend; (2) precipitation and radiation are major drivers of NPP variations, with contribution ratios of 35.13% and 30.17%, respectively; (3) noteworthy restoration potential exists on the Tian Shan northern slope and the Irtysh River Basin, where average restoration potentials surpass 80% relative to 2020, while the Ili River Basin has the highest future risk. This study explores the factors influencing the current vegetation dynamics in Xinjiang, aiming to provide references for vegetation restoration and future risk mitigation, thereby promoting sustainable ecological development in Xinjiang.

1. Introduction

Vegetation net primary productivity (NPP) is a fundamental metric to measure the productive capacity of plant ecosystems, playing an important role in the assessment of terrestrial ecological dynamics [1]. As a core component of the soil–plant–atmosphere continuum, vegetation influences the material cycling and energy exchange between the Earth’s surface and the atmosphere [2]. As the most dynamic component of terrestrial ecosystems, vegetation is usually influenced by factors including CO2 levels, solar radiation, atmospheric circulation patterns, and human activities [3]. The effects of these influencing factors show in various indicators of vegetation. NPP represents the solar energy converted into chemical energy through photosynthesis by vegetation, indicating the amount of organic carbon remaining in terrestrial ecosystems after subtracting their own respiratory consumption. NPP is a crucial parameter of ecosystem function, with its variations associated with plant growth, development, and reproduction. As one of the most important indicators of vegetation degradation and recovery [4], NPP accurately reflects the response of vegetation to climatic factors and human activities. Hence, the comprehensive study of the spatiotemporal dynamics of vegetation NPP and its underlying determinants is important for the sustainable utilization of vegetation resources, the exploitation of vegetation production potential, and the mitigation of vegetation degradation [5].
To date, numerous studies have conducted attribution analyses on the factors influencing vegetation changes based on NPP and their respective magnitudes of influence [6]. In the field of climatic influences on vegetation dynamics, recent studies have primarily focused on temperature [6], precipitation [7], CO2 concentration [8], and other climatic variables [9]. Studies on the effects of human activities on vegetation dynamics have focused on shifts in land use types [10], governmental interventions aimed at vegetation conservation in the study area [11], and fluctuations in grazing intensities [12]. Overall, research on the mechanisms by which individual climate factors influence vegetation productivity is now relatively mature. Some studies have explored the combined effects of climate factors and human activities, further investigating their impact on vegetation growth through various research methodologies [13] and across diverse vegetation types [14]. However, there are still shortcomings in integrating climate factors and human activities for a comprehensive analysis. Furthermore, current research tends to focus on the impacts of two broad categories—climate and human activities—on vegetation cover. There are fewer quantitative analyses of how specific factors within these categories contribute to changes in vegetation cover. Additionally, research on the impacts of human activities is often limited to analyses of land use change.
In the face of multiple influencing factors, assessing the current restoration potential and future change risks of vegetation is another critical concern for many scholars. Vegetation restoration, as a prerequisite for ecological restoration, affects various ecological functions, including soil and water conservation, carbon sequestration, and biodiversity. Vegetation restoration potential is the theoretical maximum potential that vegetation can reach during the restoration process [15]. Currently, common methods to quantify vegetation restoration potential mainly include field-based investigations [16] and constructing indicator systems [17]. These methods are used to explore the benefits of ecological restoration measures on vegetation protection [18] and to predict the time of vegetation restoration under different restoration modes [19]. Future change risk assessment involves analyzing the trends and risks of vegetation growth under various potential environmental variables in future climate scenarios [20]. The goal is to reduce the frequency of environmental risk events and hazards, enhance the level of environmental risk prevention and control, and provide a scientific basis for environmental protection [21]. However, existing research has mainly focused on large-scale vegetation greenness changes, lacking a comprehensive quantitative assessment and overall analysis of the restoration potential and future change risks inherent to specific regional vegetation dynamics.
Currently, as a typical arid climate region, Xinjiang continues to face challenges such as incomplete analysis of influencing factors, insufficient quantitative analysis of factor contributions, and an inadequate framework for assessing vegetation dynamics. Xinjiang, located in the arid regions of northwest China, is characterized by fragile ecological environments. Due to its distinctive geographical positioning and climatological attributes, Xinjiang’s terrestrial ecosystems are highly sensitive to climate change [22]. In recent years, climatic perturbations have led to challenges in Xinjiang, including diminished soil moisture and a perturbed plant–water equilibrium. These changes have resulted in vegetation degradation, exacerbating the difficulties in sustainably managing natural resources within the region [23]. Meanwhile, human activities, including extensive grazing practices and grassland reclamations, have compounded the negative impact on vegetation. Climate change acts as an intrinsic driver, while human activities act as external drivers [24]. Under the combined influence of these factors, issues such as grassland degradation and land desertification in Xinjiang are becoming increasingly prominent. Additionally, due to Xinjiang’s distinctive topographical contours, epitomized by its “three mountains and two basins” typology, the effects of climate change and human activities show significant spatial heterogeneity in the region [25]. Against this backdrop, local governments face prolonged challenges in devising effective management strategies and assessing the extent to which vegetative ecosystems are impacted by human and climatic influences. Hence, evaluating the spatial potential for future vegetation recovery and degradation risks is an urgent issue that requires attention.
Based on the above reasons, we believe that the influencing factors and future change risks of vegetation in Xinjiang, as a typical ecologically fragile region, warrant further investigation. Thus, this study systematically analyzes the spatiotemporal characteristics of vegetation NPP in Xinjiang from 2001 to 2020. It evaluates the impacts of climate change and human activities on vegetation and introduces innovative methods to assess the potential space for vegetation restoration and to quantitatively predict future risks. This research systematically evaluates the multidimensional changes in vegetation in Xinjiang, China. It is critical for understanding the mechanisms of vegetation degradation, implementing sound ecological management, and has far-reaching implications for the sustainable management of vegetation resources in Xinjiang [26].

2. Materials and Methods
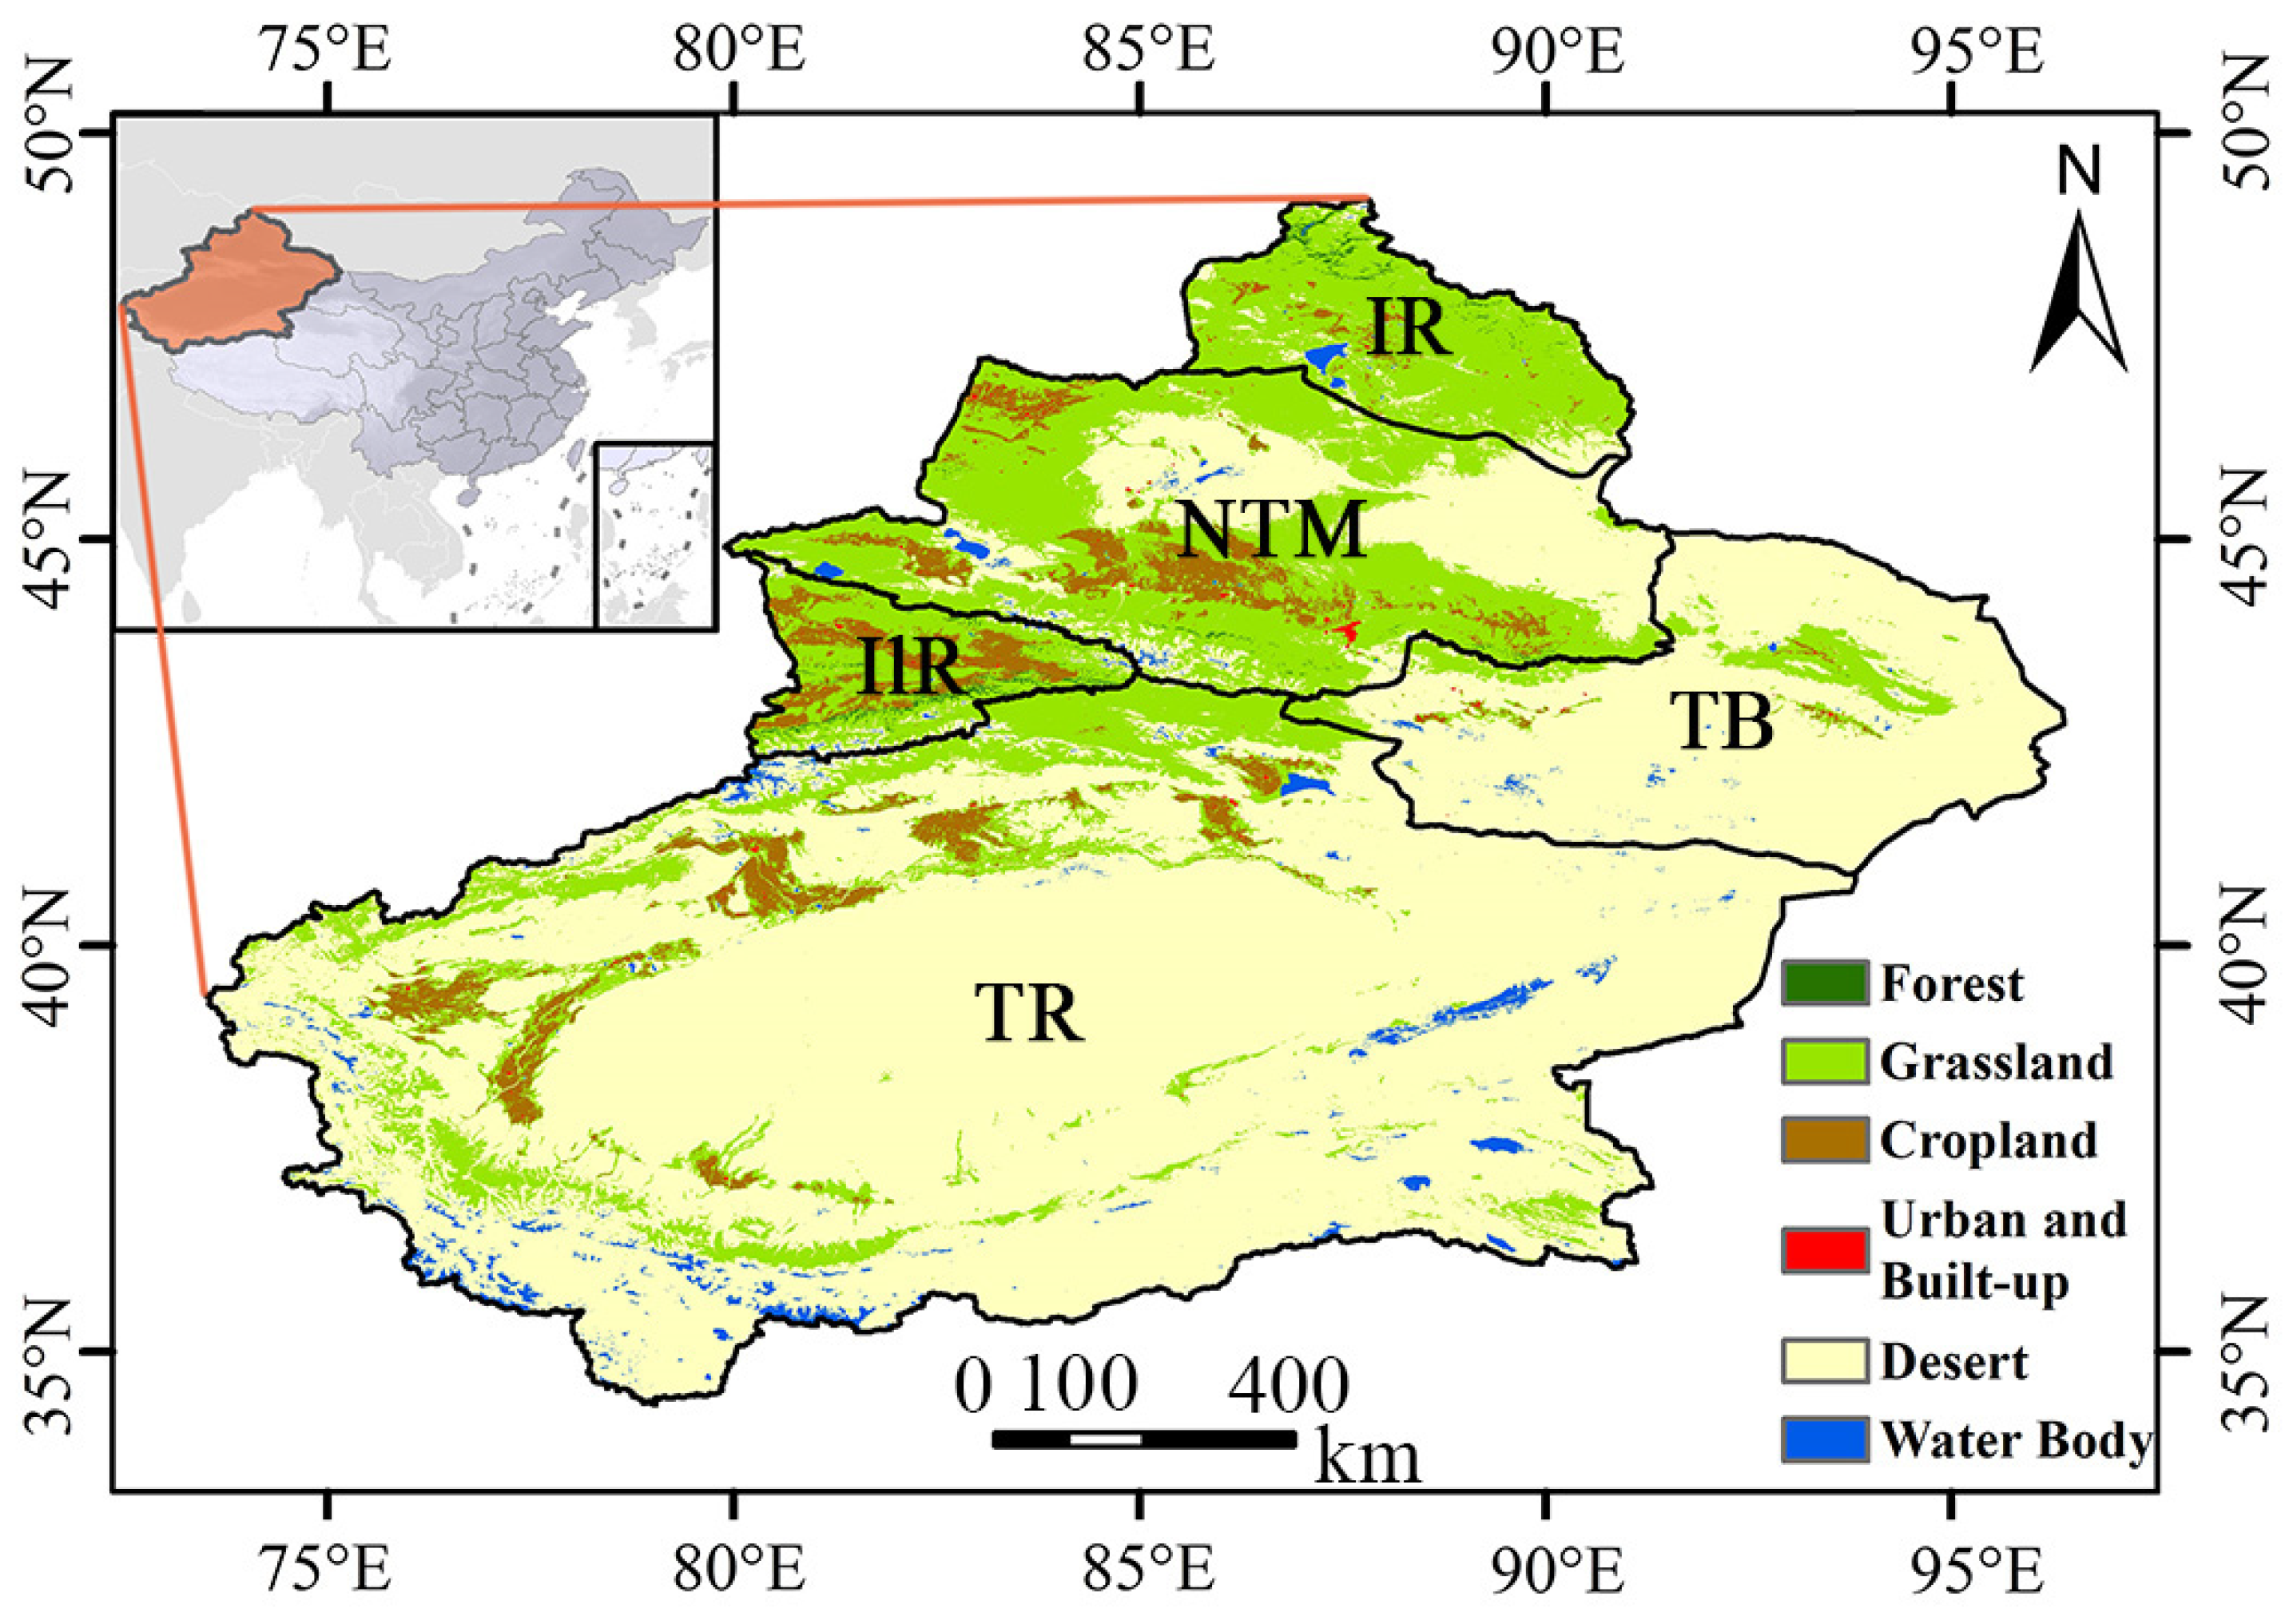
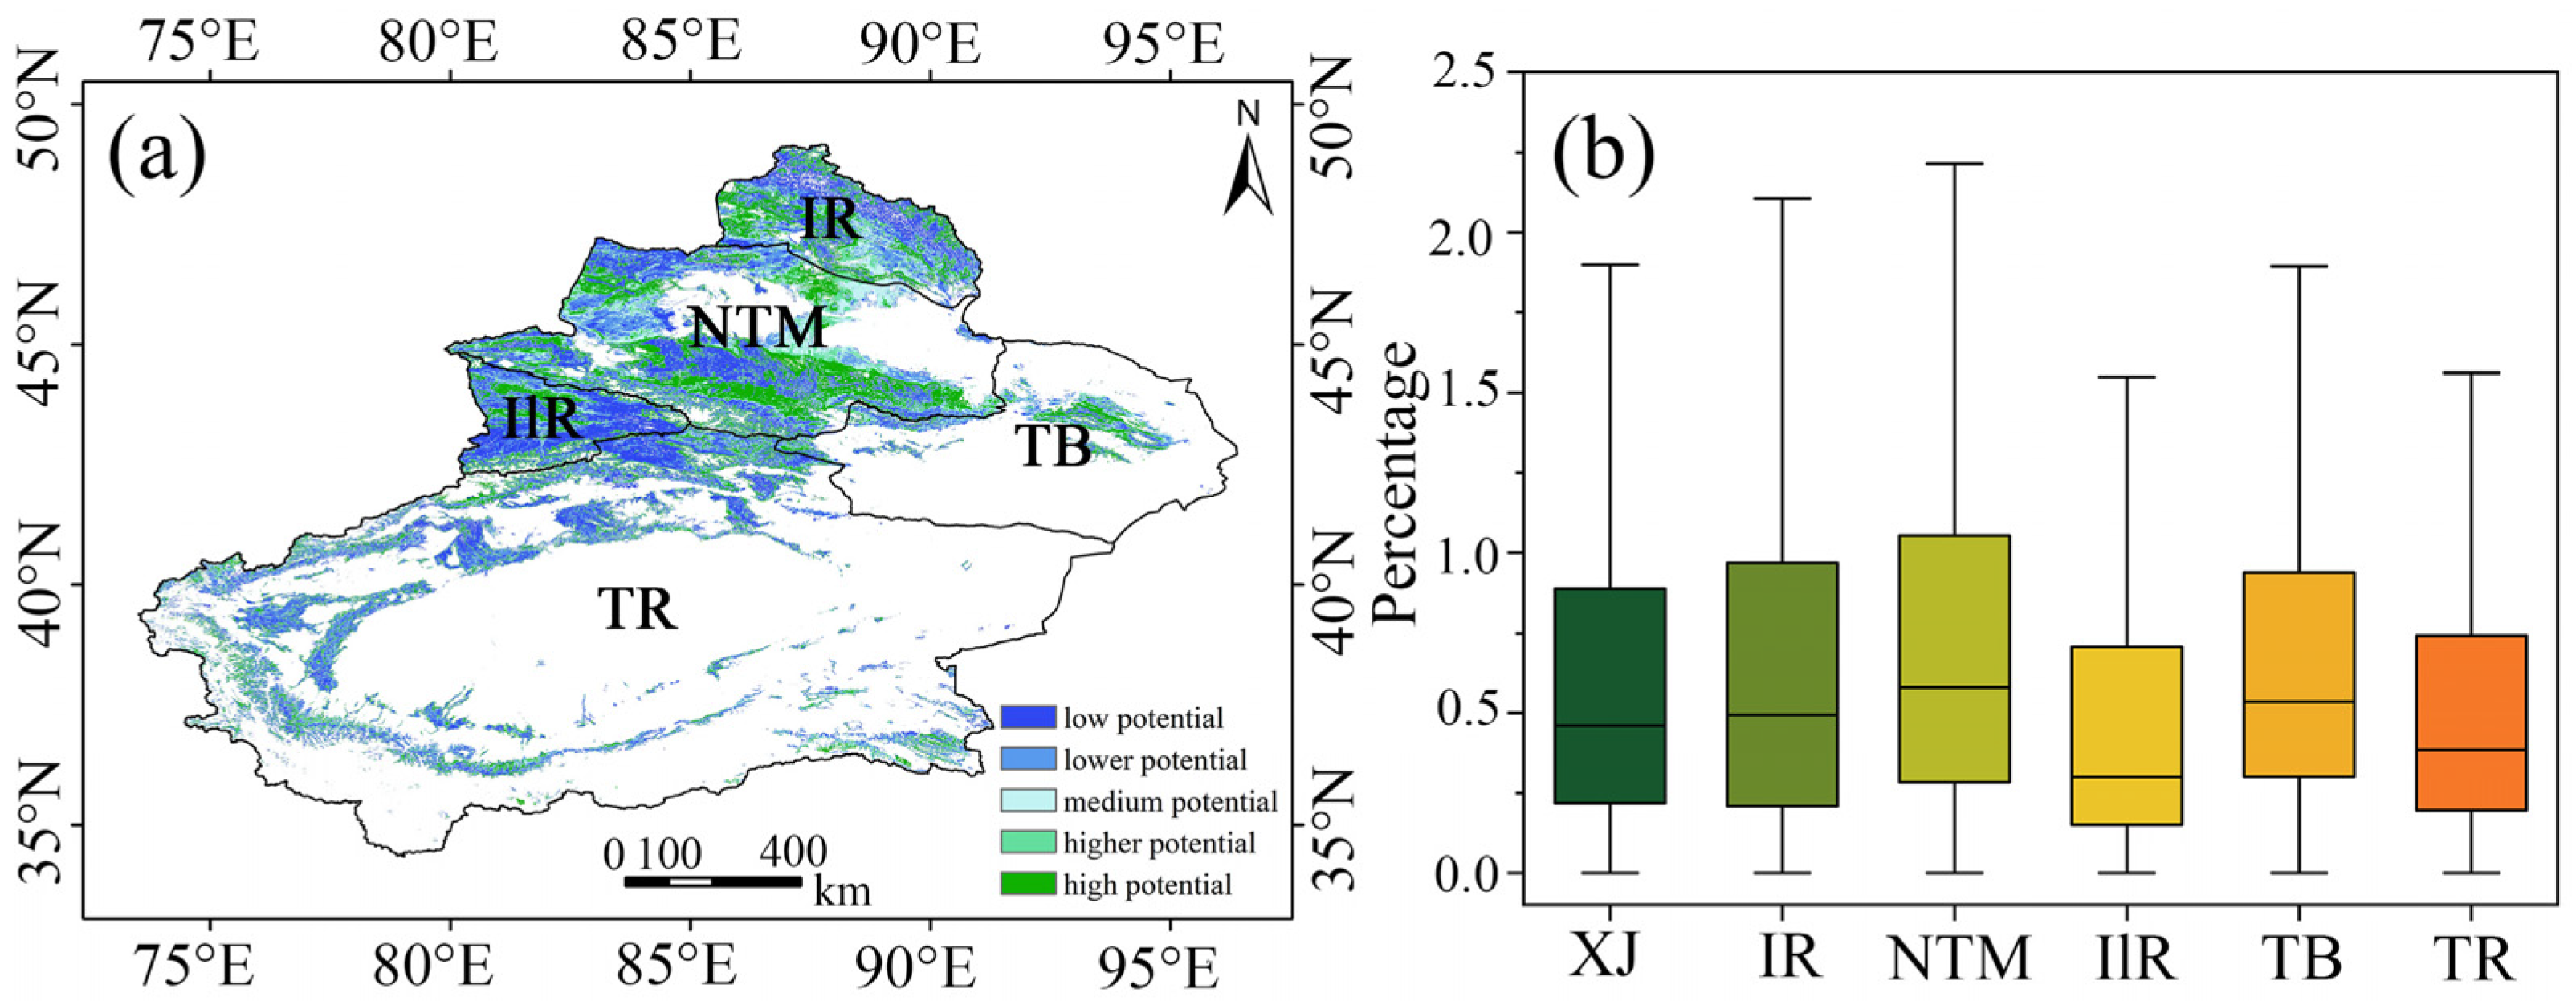
2.1. Study Area

Xinjiang is located in the northwestern part of China, with geographical coordinates between 34°22′N–49°33′N and 73°22′E–96°21′E, as shown in Figure 1. Covering approximately 1.66 million km2, it comprises one-sixth of China’s total land area. Situated in the heartland of the Eurasian continent, Xinjiang’s landscape is characterized by a mix of mountains and basins. From north to south, the region encompasses the Altai Mountains, Junggar Basin, Tianshan Mountains, Tarim Basin, and Kunlun Mountains, presenting a typical geographical configuration known as the “three mountains and two basins”. As one of the driest regions in China, Xinjiang is a typical arid area, characterized by a temperate continental climate with scarce precipitation. The annual average precipitation is merely 145 mm, only 23% of the national average of 630 mm [27]. Abundant sunlight and significant diurnal temperature variations are notable climatic features [28]. The region’s unique geographical location and distinctive terrain lead to significant spatial differences in climate conditions, including temperature, precipitation, and radiation.
Soil types in Xinjiang include brown pedocal, sierozem, gray–brown desert soil, and gray desert soil [29]. According to the landcover data (as shown in Table 1), most areas of Xinjiang are barren, desert and grassland account for about 69% and 25% of the total area in 2020, respectively. And the ecological environment is fragile, characterized by a limited variety and low coverage of vegetation, forming a pattern of a mountain–oasis–desert ecological environment influenced by topography [30]. This study focuses on the Xinjiang Uygur Autonomous Region, delineating five major areas: the Irtysh River Basin (IR), northern slopes of the Tianshan Mountains (NTM), Ili River Basin (IlR), Turpan Basin (TB), and Tarim River Basin (TR). These areas are divided primarily by “watersheds” and “county-level administrative boundaries”, from north to south and from west to east (as shown in Figure 1). Among these areas, the Irtysh River Basin, northern slopes of the Tianshan Mountains, and Ili River Basin belong to northern Xinjiang, while the Turpan Basin and Tarim River Basin are part of southern Xinjiang.

2.2. Data Sources

The annual average primary productivity data for this study come from the National Earth System Science Data Center, spanning from 2001 to 2020, with a 500 m spatial resolution. Derived from an enhanced version of the light-use efficiency model (EC-LUE), the GLASS primary productivity data account for factors like saturated vapor pressure deficit and atmospheric CO2 concentration, effectively capturing the spatiotemporal variations in global vegetation productivity and modeling its interannual changes [31,32]. The datasets were reprojected to the WGS84 coordinate system using the ArcGIS 10.4 software to maintain spatial consistency.
The MCD12Q1 land use dataset originates from the National Aeronautics and Space Administration (NASA) and is distributed by the MODIS Land Science team. This dataset covers 2001 to 2020 with a 500 m resolution and annual temporal resolution. The MCD12Q1 product has been widely employed in analyzing land use changes in China relative to climate factors [33,34]. This study adopts the classification scheme proposed by the International Geosphere-Biosphere Programme (IGBP) as the foundational framework [35], and based on the needs of this study, consolidates the original 17 land use categories into 6 overarching categories [36]: (1) Forest: Evergreen Needleleaf Forests, Evergreen Broadleaf Forests, Deciduous Needleleaf Forests, Deciduous Broadleaf Forests, Mixed Forests, Closed Shrublands, and Woody Savannas are grouped under this classification; (2) Grassland: Open Shrublands, Savannas, Grasslands, and Permanent Wetlands are grouped under this classification; (3) Cropland: Croplands and Cropland/Natural Vegetation Mosaics are grouped under this classification; (4) Urban and built up: Urban and Built-up Lands are consolidated into this classification; (5) Desert: Barren is subsumed within this category; (6) Water body: Permanent Snow and Ice and Water Bodies are grouped under this classification. This reclassification aligns with the study’s goals to investigate key land use dynamics.
The climate data utilized in this study are sourced from the ERA5 dataset provided by the European Centre for Medium-Range Weather Forecasts (ECMWF). Representing the fifth iteration of global atmospheric reanalysis products developed by ECMWF, ERA5 combines model simulations with observations for a comprehensive global atmospheric dataset. Specifically, the 10 m wind speed data employed in this study are sourced from the ERA5 Monthly dataset, characterized by a spatial resolution of 0.25° and encompassing the temporal range from 1979 to 2020. Concurrently, the 2 m air temperature data, total precipitation data, and downward shortwave radiation data are obtained from the ERA5 Land Monthly dataset, with a spatial resolution of 0.1° and covering the period from 1950 to 2023. Based on the premise that climate is similar at larger spatial scales [37,38,39], these datasets were resampled to 500 m resolution using bilinear interpolation in ArcGIS 10.4 to ensure uniformity in spatial analysis.
The CO2 data utilized in this study were obtained from the World Data Center for Greenhouse Gases (WDCGG). Among the extant CO2 monitoring stations across China, only the Qinghai Wulan Guan station (WLG) provides data spanning the period from 2001 to 2020. Consequently, this study relies on the synthetic annual mean CO2 measurements from the WLG station for the years 2001 to 2020, serving as a proxy for the interannual CO2 concentration levels in Xinjiang. Previous studies have indicated minimal differences in average CO2 data within Chinese regions [40], hence the CO2 data from the WLG site remains highly representative for CO2 levels in Xinjiang.
The livestock data utilized in this research were obtained from the Xinjiang Statistical Yearbook. Data on the number of livestock at the end of each year from 2001 to 2020 were extracted and standardized into sheep units [41]. Employing county-level vector maps of Xinjiang and the ArcGIS 10.4 software, spatial interpolation procedures were performed to generate county-level livestock density maps for 2001 to 2020, representing grazing intensity. Grazing pressure is an important factor influencing vegetation growth and changes in NPP [42]. The conversion ratios for livestock to sheep units were as follows: goats = 1, cattle and horses = 5, donkeys = 3, pigs = 1.5 [41]. Analyzing livestock density along with other environmental and climatic variables helps clarify the impact of human activities on vegetation dynamics in ecologically sensitive areas such as Xinjiang.
This study simulates the trend of future vegetation NPP in Xinjiang from 2021 to 2050 under the SSP1-2.6, SSP2-4.5, and SSP5-8.5 climate scenarios using future climate model data from CMIP6 (Coupled Model Intercomparison Project Phase 6) to evaluate vegetation risks under varying climate conditions. The CMIP 6 climate simulation data are derived from the BCC-CSM2-MR experiment [43]. BCC-CSM2-MR is a medium-resolution monthly climate system model developed by the National (Beijing) Climate Center (BCC) with a time range of 1850–2100 and a spatial resolution of 1°. This model has demonstrated effectiveness in simulating climate conditions in China, providing detailed validation of key climate factors such as temperature, precipitation, and radiation that are essential for vegetation growth [44,45]. The study used a deep learning method to obtain future vegetation NPP data with a spatial resolution of 0.05° for the years 2025–2050, based on CMIP6 meteorological data. The data test set achieved an R2 of 0.894 and an RMSE of 0.330, indicating that this method has high predictive accuracy and model reliability in vegetation modeling in China [46]. Information on the various types of future climate scenarios used in the study is shown in Table 2.
The source, spatial resolution, and resampling methods for all data are shown in Table 3. The reprojected and resampled datasets were validated against their original resolutions to ensure that the resampling and interpolation processes did not introduce significant errors. This validation included comparing key statistical properties and spatial patterns before and after resampling, confirming the reliability of the unified dataset for subsequent analyses.

2.3. Methods

2.3.1. Trend Analysis

This study utilizes a linear fitting equation to analyze the trend of vegetation productivity. For each pixel of the NPP image, its value reveals the situation of vegetation productivity within that pixel. The overall pattern of vegetation productivity change in Xinjiang over the study period is analyzed, and the overall trend of NPP change is determined through linear regression of time series data as follows:
N P P = a × y e a r + b
where NPP represents the values of the NPP (net primary productivity) data; a denotes the slope value of the fitted equation, reflecting the degree of temporal change in vegetation productivity trends; and b signifies the intercept of the fitted equation. The p-value is computed for the NPP time series data through the t-test to ensure that the trend in NPP change holds statistical significance. The significance of the NPP trend is determined based on whether the p-value is ≤0.05.

2.3.2. Significance Test

The Mann–Kendall test serves as a robust statistical method employed to assess the significance of monotonic trends elucidated through the Theil–Sen estimator. Hence, in previous studies, the Theil–Sen estimator has frequently been paired with the Mann–Kendall test to indicate the trend of change for each pixel [3]. The specific calculations of the Theil–Sen estimator are as follows:
T S N P P = m e d i a n N P P j N P P i j i , 2001 i < j 2020
where TSNPP represents the Theil–Sen estimator data value; i and j denote the years; and NPPi and NPPj represent the NPP values for the i and j years, respectively.
The Mann–Kendall test is a widely applicable statistical methodology utilized to ascertain the significance of Theil–Sen estimator outcomes within a given time series dataset. Distinguished by its non-parametric nature, this test method remains robust even in the presence of missing or outlier values, rendering it particularly suitable for assessing trend significance within extensive time series datasets [48]. A significant result from the Mann–Kendall test indicates a significant trend in vegetation pixel changes within the time series data. Conversely, a nonsignificant result indicates trend stability (i.e., no discernible trend). The specific calculation formula is as follows:
Z = T s 1 V a r T s , T s > 0 0 , T s = 0 T s + 1 V a r T s , T s < 0
T s = j = 1 n 1 i = j + 1 n sgn N P P j N P P i
sgn N P P j N P P i = 1 , N P P j N P P i > 0 0 , N P P j N P P i = 0 1 , N P P j N P P i < 0
V a r T s = n ( n 1 ) ( 2 n + 5 ) 18
where NPPi and NPPj, respectively, represent the values of pixels i and j; and n indicates the length of the time series. A pixel is deemed to pass the Mann–Kendall test and exhibit a significant trend only when Z > Z 1 α / 2 . In this study, Z > 1.96 is considered to pass the significance test at a 95% confidence level, indicating a significant trend in the pixel.

2.3.3. Factor Contribution Analysis

Typically, external hydrothermal meteorological conditions determine the large-scale patterns of ecosystems, primarily reflected in the spatial distribution of different vegetation types. Simultaneously, within the same vegetation type, there are still some differences due to local climatic variations. Based on this, we divide the impact of external factors on vegetation growth into average contributions and residual contributions. The average contributions reflect the effects of hydrothermal conditions on the vegetation distribution, which is the dominant factor determining the spatial distribution and changes in vegetation NPP; the residual contribution is defined as the remaining impact of external factors on vegetation NPP after controlling for vegetation type. The total contribution of climate to vegetation can be calculated by summing these contributions. And LULC acts as an intermediary, linking these two contributions.
Previous studies have demonstrated the potential of segregating vegetation parameters influenced by climate and human activity factors [49,50], utilizing random forests [51] to analyze these parameters and ascertain their impact levels [52], which helps identify individual contributions to ecosystem dynamics. Accordingly, we employed random forest regression (RFR) to analyze the average and residual contributions of six key factors related to vegetation dynamics: annual average temperature (TEM), annual total precipitation (PRE), annual average downward shortwave radiation (SRAD), annual average wind speed (Wind), annual livestock density (LD), and annual average carbon dioxide (CO2). These factors significantly influence vegetation growth and productivity. Among them, temperature and precipitation primarily drive vegetation biomass accumulation and distribution [53], while radiation and wind speed impact photosynthesis and water evapotranspiration efficiency [54]. Rising CO2 levels affect photosynthesis rates, crucial for studying global climate change [8]. Additionally, livestock density reflects the pressure of human activities on vegetation [12]. The specific calculation steps are as follows:
(1) Average contributions: Using the sliding window method, we defined the study area window, in which 80% of pixels consistently represent the same land class over multiple years. For each window identified with consistent land use, we extracted the average values of four key climate features (temperature, precipitation, solar radiation, and wind speed) [6] as the feature set. We used RFR to predict vegetation NPP based on these environmental features, implemented using Python 3.9 and the sklearn package. The robustness of this model allows for handling complex variable interactions. Feature importance was evaluated by measuring the increase in prediction error when each feature’s data are altered, keeping others constant. The contribution rate is calculated based on the feature importance scores generated by the model. Since both NPP data and the various influencing factors are annual-scale data, each factor at each pixel contains 20 samples. The importance of each feature was assessed through the feature importance scores generated by the model, calculated as follows:
M I j = F I j i = 1 n F I i
where FIj represents the feature importance of the j factor; and MIj is the normalized feature importance of the j factor. Using this method, the mean contribution of each factor can be calculated.
To combat sample imbalance across land use categories, we established a sampling strategy using the median count of sample windows from all categories as the threshold. For categories exceeding this threshold, a random subset of samples matching this threshold was selected to ensure a balanced representation in our model training.
(2) Residual contribution: We calculated residual contributions by using the average multi-year NPP as the baseline and regressing the difference between actual and baseline NPP for each pixel using a random forest regressor. The independent variables of the random forest include the current year’s precipitation, temperature, downward shortwave radiation, wind speed, livestock density, and CO2. The random forest regressor is trained, and its R 2 is calculated as R 0 2 . Furthermore, to quantify the contribution of each independent variable, the mean decrease accuracy (MDA) metric is employed [51]. MDA is a widely accepted measure of factor attribution [55] and has been applied in various geoscientific fields [56].
For a multiple-factor regression model, the contribution of each factor can be calculated as
V I j = R 0 2 R j 2 , 1 j n
where R j 2 is the R 2 value calculated based on the original distribution and following the fitted regression model for the j variable, and R 0 2 is the R 2 value when the independent variables are uncorrected. The formula for calculating the contribution of each factor is shown in Equation (7), where VIj in Equation (8) corresponds to FIj in Equation (7), and MIj represents the contribution of the j factor.
Through the two steps described above, the average and residual contributions of the influencing factors can be calculated. By subsequently overlaying these results, the comprehensive contributions of each influencing factor can be determined.

2.3.4. Potential Analysis

Overexploitation and unsustainable economic activities can degrade a landscape [57]. However, once these disturbances are reduced or have ceased, ecosystems can naturally recover to their optimal state due to their inherent resilience mechanisms [58]. The gap between the optimal vegetation condition and the current vegetation condition can be defined as the vegetation restoration potential (VRP). In this study, based on the principle of “similar habitats have similar VRP”, under similar habitat conditions, vegetation growth should be fundamentally similar. The current vegetation status at each pixel location is represented by the NPP value of that pixel for the current year, and the optimal growth status can be represented by the maximum NPP value at similar habitat locations [59,60]. Considering the spatial variability of environmental variables affecting vegetation growth, we employ a local window model and obtain a sliding-window-based similar habitat potential model (SWSHPM) [61]. Since NPP data are usually represented in a regular grid format, i and j are used to denote the row and column numbers of the data, respectively. Therefore, the VRP of row i and column j can be expressed as
V R P i j V 1 , V 2 , , V N = M a x u i j t , R 1 k m 1 l n y b t y e N P P k l V 1 , V 2 , , V N N P P i j V 1 , V 2 , , V N
where V R P i j V 1 , V 2 , , V N denotes the vegetation restoration potential (VRP) at the current location in row i and column j, and V 1 , V 2 , , V N denote the environmental variables at the current location, assuming there are N environmental condition variables. The M a x u i j t , R 1 k m , 1 l n , y b t y e N P P k l V 1 , V 2 , , V N is computed by identifying the maximum NPP value derived from pixels within the NPP dataset spanning various years (with yb representing the starting year and ye representing the ending year), selecting the value corresponding to the current location among these variables, and subsequently, returning this maximal value. Suppose the local window has m rows and n columns, where N P P i j V 1 , V 2 , , V N represents the NPP value obtained for the current pixel in the given year. In this study, the search scope is limited to grid cells of the same land use type as the current location, with the temporal span restricted to the years spanning from 2001 to 2020. Additionally, comparisons were made among variables under different window ranges. It was observed that climatic variables exhibit only slight changes within a local range of 10 km, thus their impact on vegetation growth can be disregarded.
The Vegetation Restoration Potential Ratio Index (VRPRI) is delineated as the ratio of vegetation restoration potential (VRP) values to the actual NPP values in 2020. To alleviate potential data uncertainties, the 95th percentile of the NPP distribution histogram is used instead of the maximum value during computation. Subsequently, the computed results are categorized into five distinct levels: low potential (<25%), lower potential (25–50%), medium potential (50–75%), higher potential (75–100%), and high potential (>100%).

3. Results

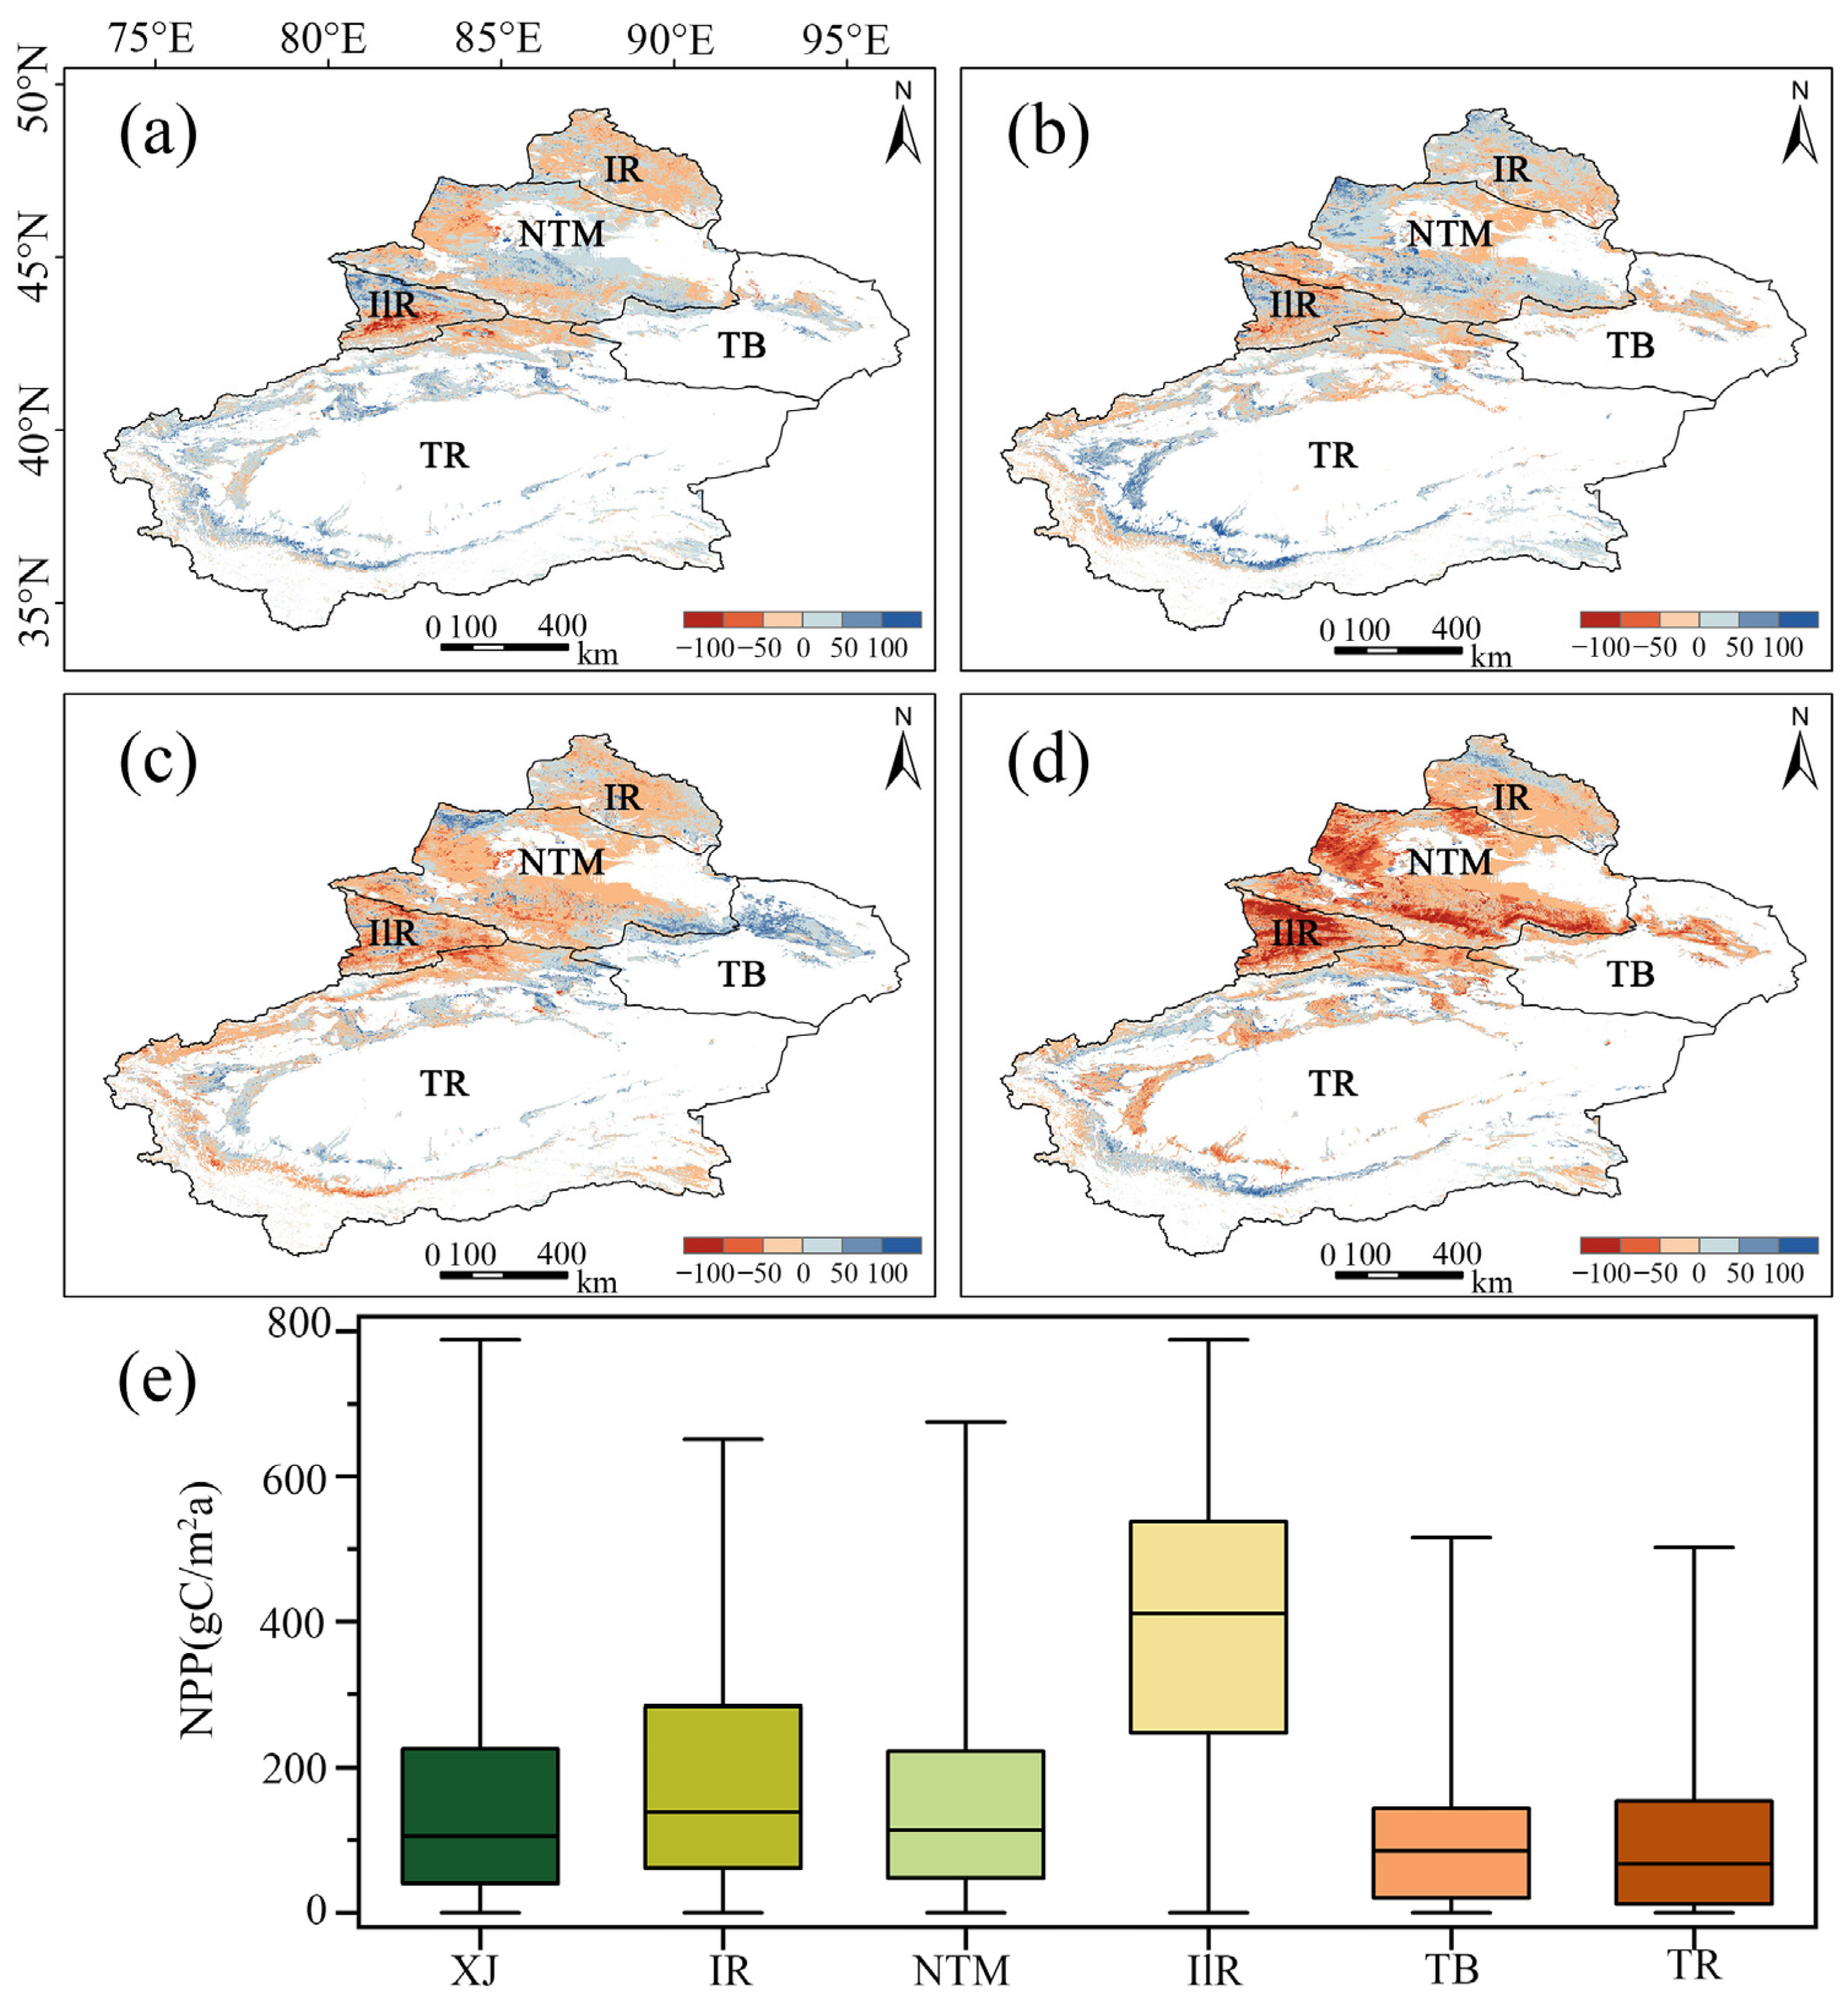
3.1. Spatiotemporal Analysis of NPP

During the timeframe spanning 2001 to 2020, both the interannual difference and the average NPP of vegetation in Xinjiang exhibited significant spatial distribution differences (Figure 2). Quantitatively, areas with high NPP values (>400 gC/m2∙a) were primarily distributed in the IlR, the IR, and the northwest corner of the NTM. In contrast, regions with low NPP values (<100 gC/m2·a) were mainly distributed in the hinterland of the Junggar Basin in the NTM and the edge of the Tarim Basin in the TR region. Over 71% of the territory manifested vegetation NPP less than 200 gC/m2∙a, and 49.06% of the area recorded an average NPP value below 100 gC/m2∙a. Merely 14.58% of the area showed vegetation NPP values exceeding 300 gC/m2∙a, with just 7.22% of the regions featuring high NPP values (>400 gC/m2∙a). Notably, vegetation NPP in northern Xinjiang was significantly higher than in southern Xinjiang. The IlR recorded the highest average NPP from 2001 to 2020, at 369.50 gC/m2, while the TB had the lowest annual average NPP, at only 17.76 gC/m2. Spatially, NPP gradually decreased from the Ili River Valley, Tianshan Mountains, Altai Mountains, and Kunlun Mountains towards the Junggar Basin and Tarim Basin. The IlR region exhibited relatively high overall NPP values, as evinced by the boxplot in Figure 2e. However, there is a significant decrease in the NPP value during 2011–2020 (Figure 2c,d). In the TB, NPP values were mainly concentrated within the central oasis belt, making it the region with the smallest distribution span of NPP within all areas (Figure 2e). Meanwhile, the overall NPP values in the TR region were relatively low and fluctuated over the 20-year period.
From a region-wide perspective, there was an evident increasing trend in NPP across Xinjiang from 2001 to 2020 (Figure 3i). The average NPP increased from 50.73 gC/m2 in 2001 to 58.58 gC/m2 in 2020, indicating an overall increase of 7.85 gC/m2, with an average annual growth rate of 0.39 gC/m2. Over these 20 years, notable interannual variations in the average NPP of Xinjiang were observed, with discernible fluctuations from 2001 to 2008, reaching a nadir of 49.05 gC/m2 in 2008. Subsequently, NPP showed an upward trajectory from 2008 to 2013, experienced a sharp decline in 2014, then rebounded and reached its peak value of 65.15 gC/m2 in 2016. However, in the following four years, except for a slight increase between 2018 and 2019, there was a decreasing trend in NPP. Spatially, approximately 75.05% of the vegetation NPP showed an increasing trend in 2020 compared to 2001 across Xinjiang (Figure 3c). As shown in Figure 3a, the decreasing trend of NPP values is obvious in the Ili Valley region, while there is a more noticeable increasing trend of vegetation NPP in the south and west sides of the Junggar Basin. Among these, 29.56% of the pixels displayed PS, predominantly concentrated in the southern segment of the NTM, the TR, and the TB. Additionally, 45.49% of the pixels indicated PNS, primarily dispersed near the IR and the confluence of the NTM with the TR. Furthermore, 22.23% and 2.64% of the regions demonstrated NNS and NS, respectively, primarily distributed in the northwest sector of the IlR and the NTM.
Across the five major regions, an analysis of the study period reveals fluctuating increases in NPP across the IR, the NTM, the TB, and the TR, with a particularly notable interannual increase in the TR. However, the IlR showed a nonsignificant decreasing trend (Figure 3e), marked by two significant fluctuations occurring from 2006 to 2009 and from 2013 to 2017, while the remaining years were relatively stable. Each region reached its maximum annual average NPP between 2015 and 2016, with the IlR having the highest average at 422.85 gC/m2. The IR and the NTM both reached their lowest values in 2008, at 141.14 gC/m2 and 92.27 gC/m2, respectively. The TR experienced its lowest value of 19.11 gC/m2 in 2009. In the IlR, the lowest value during the study period, 302.59 gC/m2, was observed in 2014. Conversely, the TB, with the lowest average value among the five major regions, witnessed an increase in NPP values over the 20-year period compared to 2001, reaching 13.97 gC/m2. Overall, interannual fluctuations were higher in northern regions of Xinjiang compared to southern regions.
Spatially, the TR and the TB exhibit distinct growth trends in vegetation NPP (Figure 3f,h), with proportions of NPP values increasing by 91.59% and 92.03%, respectively, and only 8.37% and 7.93% experiencing decreases in vegetation NPP. In the TB, the central oasis region shows a significant upward trend. In the TR region, areas of significant increase are concentrated at the edge of the Tarim Basin, while areas of nonsignificant increase are distributed around the region, with decreases in NPP occurring sporadically. The IR shows a noticeable decrease in vegetation NPP, with 54.35% of vegetation exhibiting a declining trend. Among these, 8.86% show a significant decline, constituting the highest proportion of declining pixels among all regions. Except for the central area of the Ili River Valley and its boundaries with adjacent regions, numerous patches of NPP decline are scattered across the region. The vegetation NPP changes in the NTM are complex, featuring an overall increasing trend. Approximately 22.54% of vegetation exhibits PS, and 43.89% show PNS, mainly distributed in the southern part of the Junggar Basin. A total of 33.46% of vegetation shows a decreasing trend and is relatively dispersed. Changes in the IR appear relatively stable, with 20.06% of the area showing significant changing trends. Among these, 18.84% of vegetation demonstrates PS, while 1.22% exhibits an NS trend.

3.2. Impacts of Influencing Factors on NPP

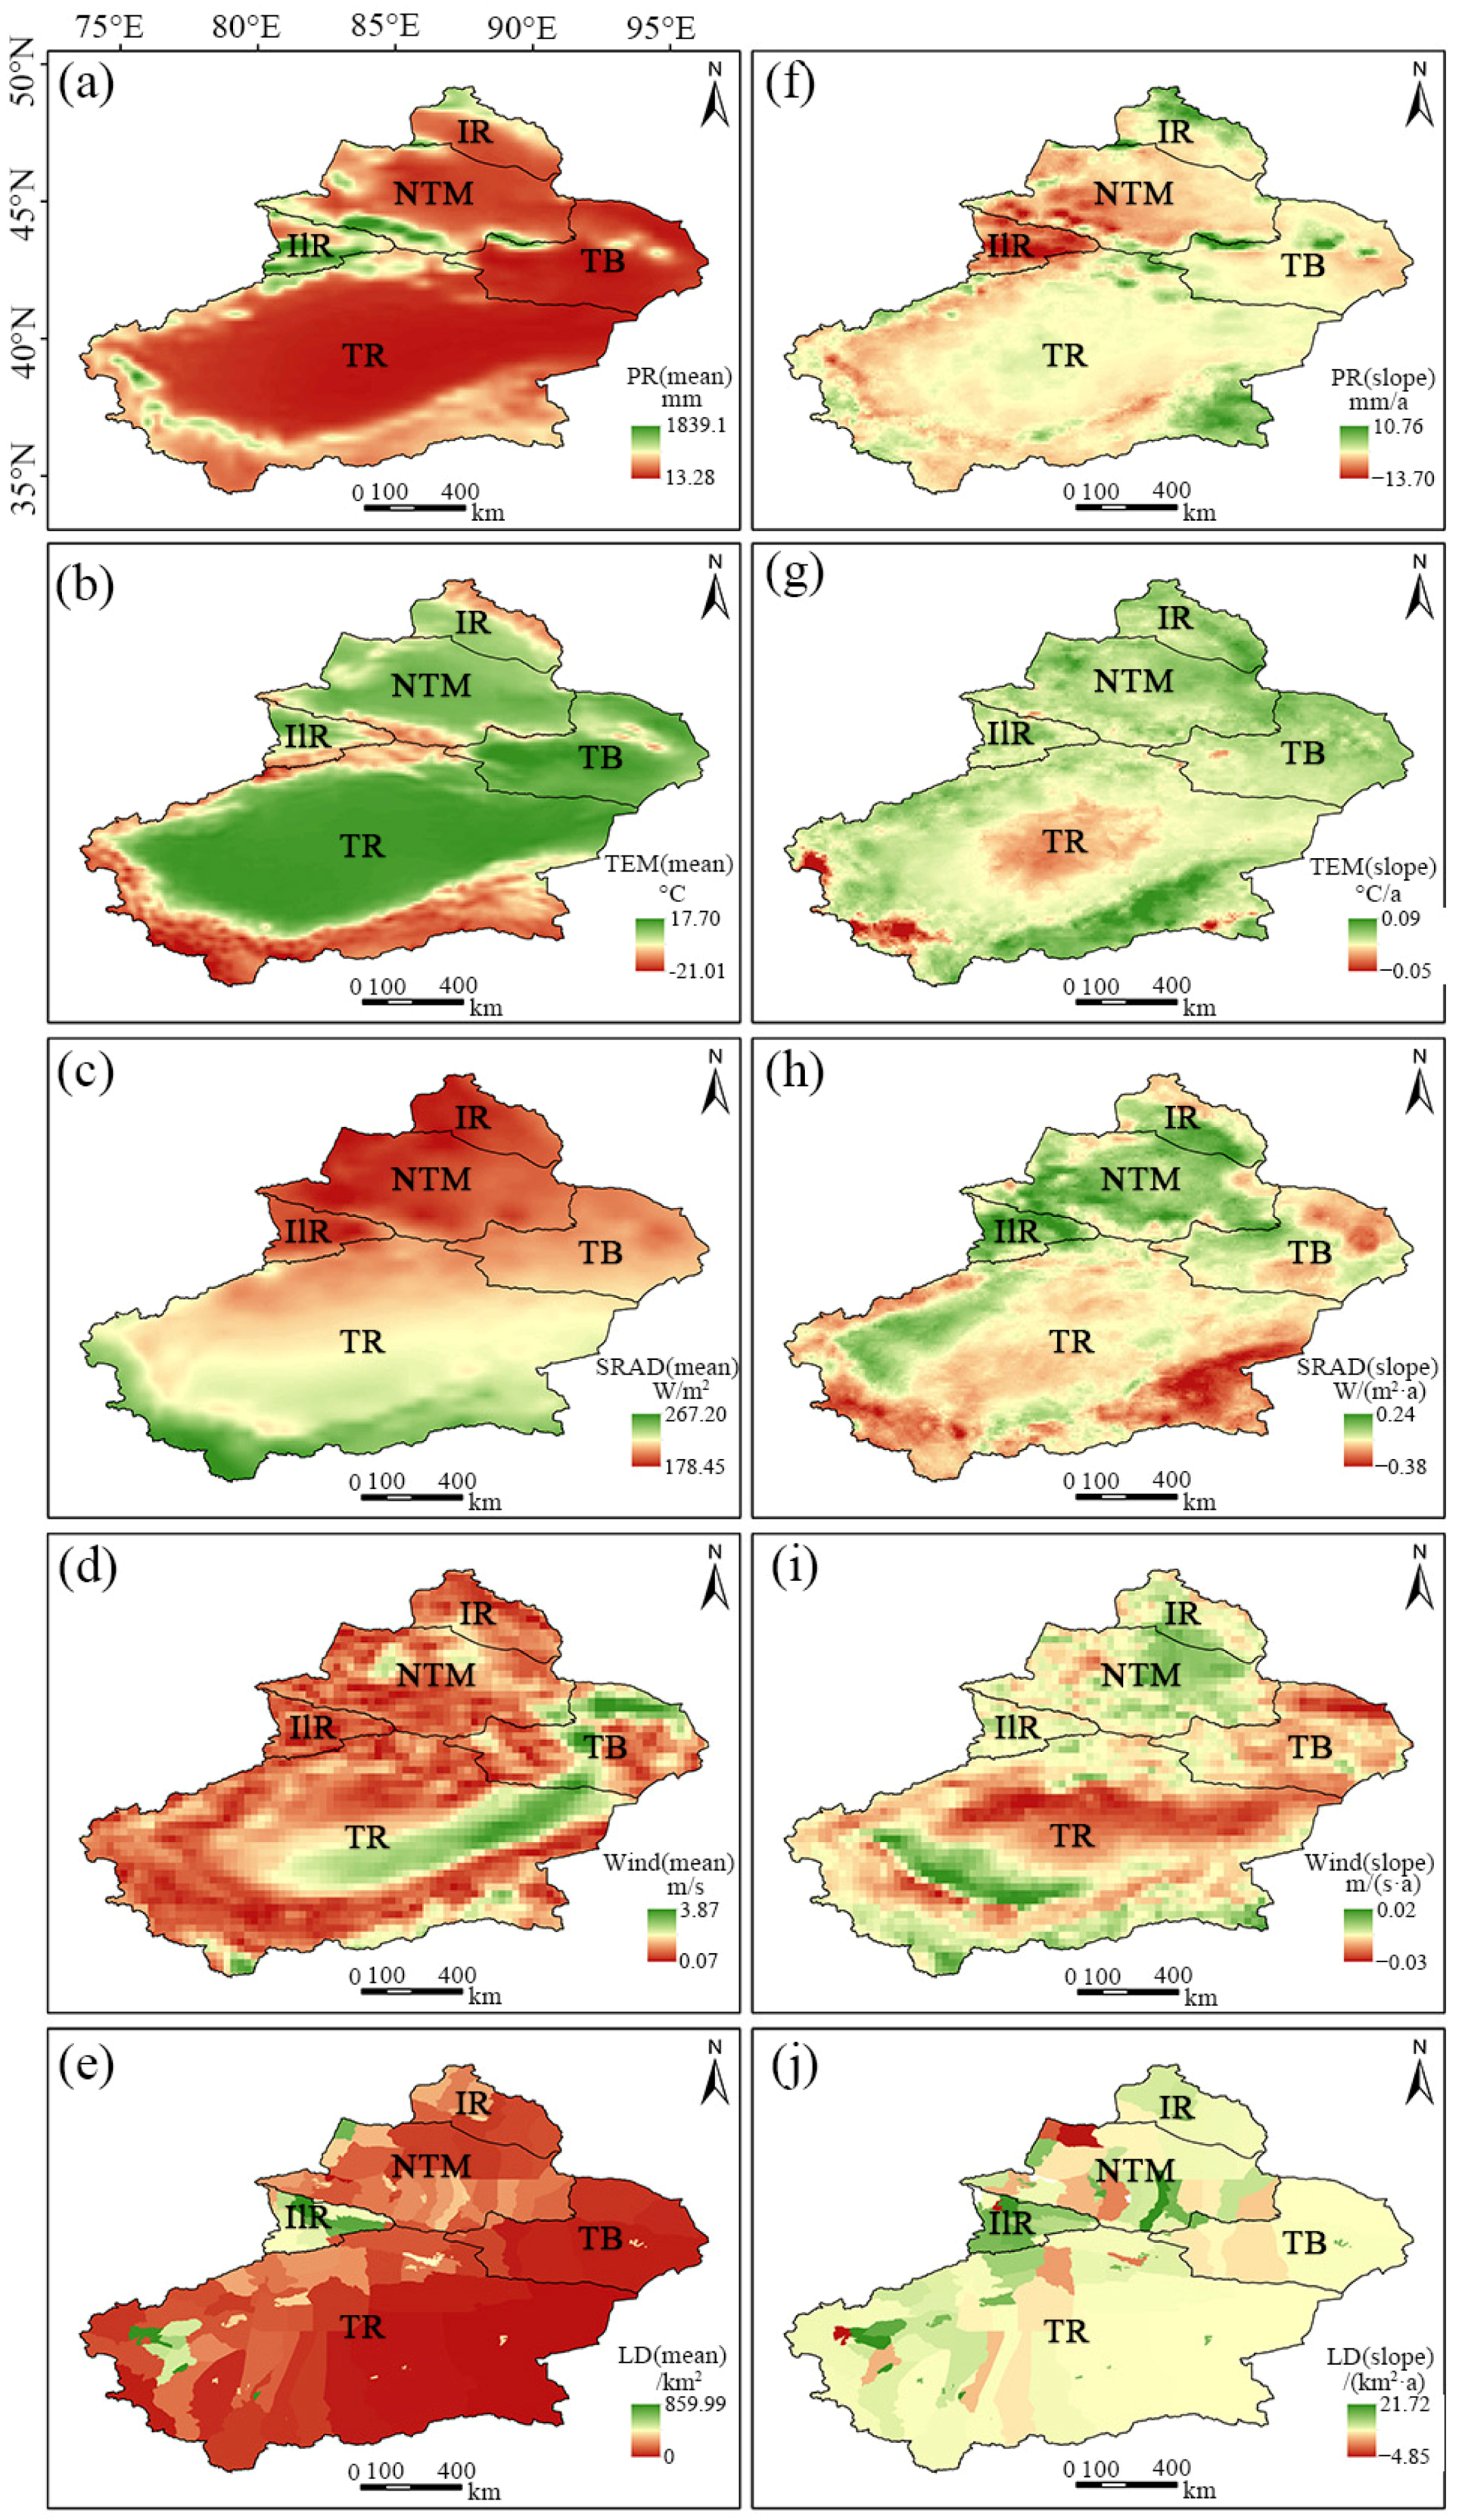
3.2.1. Change in Influencing Factors

From 2001 to 2020, precipitation in the Xinjiang region showed spatial differentiation, with generally higher levels in the western and northern parts compared to the eastern and southern regions (Figure 4a). The Ili River Valley, influenced by its unique topography and oceanic moisture influx, served as a core area for precipitation in Xinjiang. Additionally, certain areas along the NTM exhibited relatively concentrated precipitation. The spatial pattern of annual average temperature in Xinjiang was almost the opposite of precipitation. Mountainous areas experienced lower temperatures, whereas basins had higher temperatures, a phenomenon substantially influenced by terrain features. This temperature gradient was particularly evident in regions such as the NTM and the IlR. Downward shortwave radiation exhibited a distinct distribution characteristic of higher in the south and lower in the north, decreasing from south to north, with high values mainly concentrated near the Kunlun Mountains in the south. The spatial variability in average wind speed across Xinjiang from 2001 to 2020 was higher in the east and lower in the west. This trend corresponded to the mountainous terrain in the west and the basins and deserts dominating the southeast, indicating a positive correlation between elevation and wind speed. Additionally, the spatial distribution of livestock density was closely related to vegetation growth. Areas of higher livestock density were notably concentrated in the Ili River Valley and the northwest part of the NTM (Figure 4e). In contrast, the central areas of the Tarim Basin in the south and the eastern part of the TB were primarily desert regions with lower livestock density.
Using the Theil–Sen estimation method, the trends in various influencing factors from 2001 to 2020 were obtained (Figure 4f–j). Precipitation variation remained relatively stable in most areas, with significant increases observed in the southeastern part of the Altai Mountains, the Tarim River Basin, and the central oasis belt of the TB. Conversely, noticeable decreases were noted in the southwestern part of the IlR and the NTM region. The annual average temperature in Xinjiang exhibited an overall increasing trend during the study period. In the TR region, changes were more intricate, with a distinct upward trend in the southern region and numerous patches of decline in the western and central parts. Overall, most regions in Xinjiang exhibited a shift towards warmer and wetter climatic conditions. Downward shortwave radiation in Xinjiang showed spatial variations, with a northward increase and a southward decrease, alongside a westward increase and an eastward decrease. The IlR and the NTM in northern Xinjiang showed significant upward trends, while the TR and the TB primarily exhibited downward trends. Wind speed changes in northern Xinjiang remained relatively stable, with some areas showing an upward trend. Conversely, wind speed variations in southern Xinjiang were more intricate, with slight increases observed in the southern part of the TR and notable decreases in the central part of the Tarim Basin. In the vicinity of basin boundaries, growth and decline trends intermingled. However, in the surrounding areas of the TB, declines predominated for livestock density in most counties, and cities in western Xinjiang showed a slight increase, with overall upward trends observed in the IlR and IR regions, with particularly significant increases in the IlR. The NTM and TR regions exhibited more intricate changes, with varying degrees of increase and decrease observed.

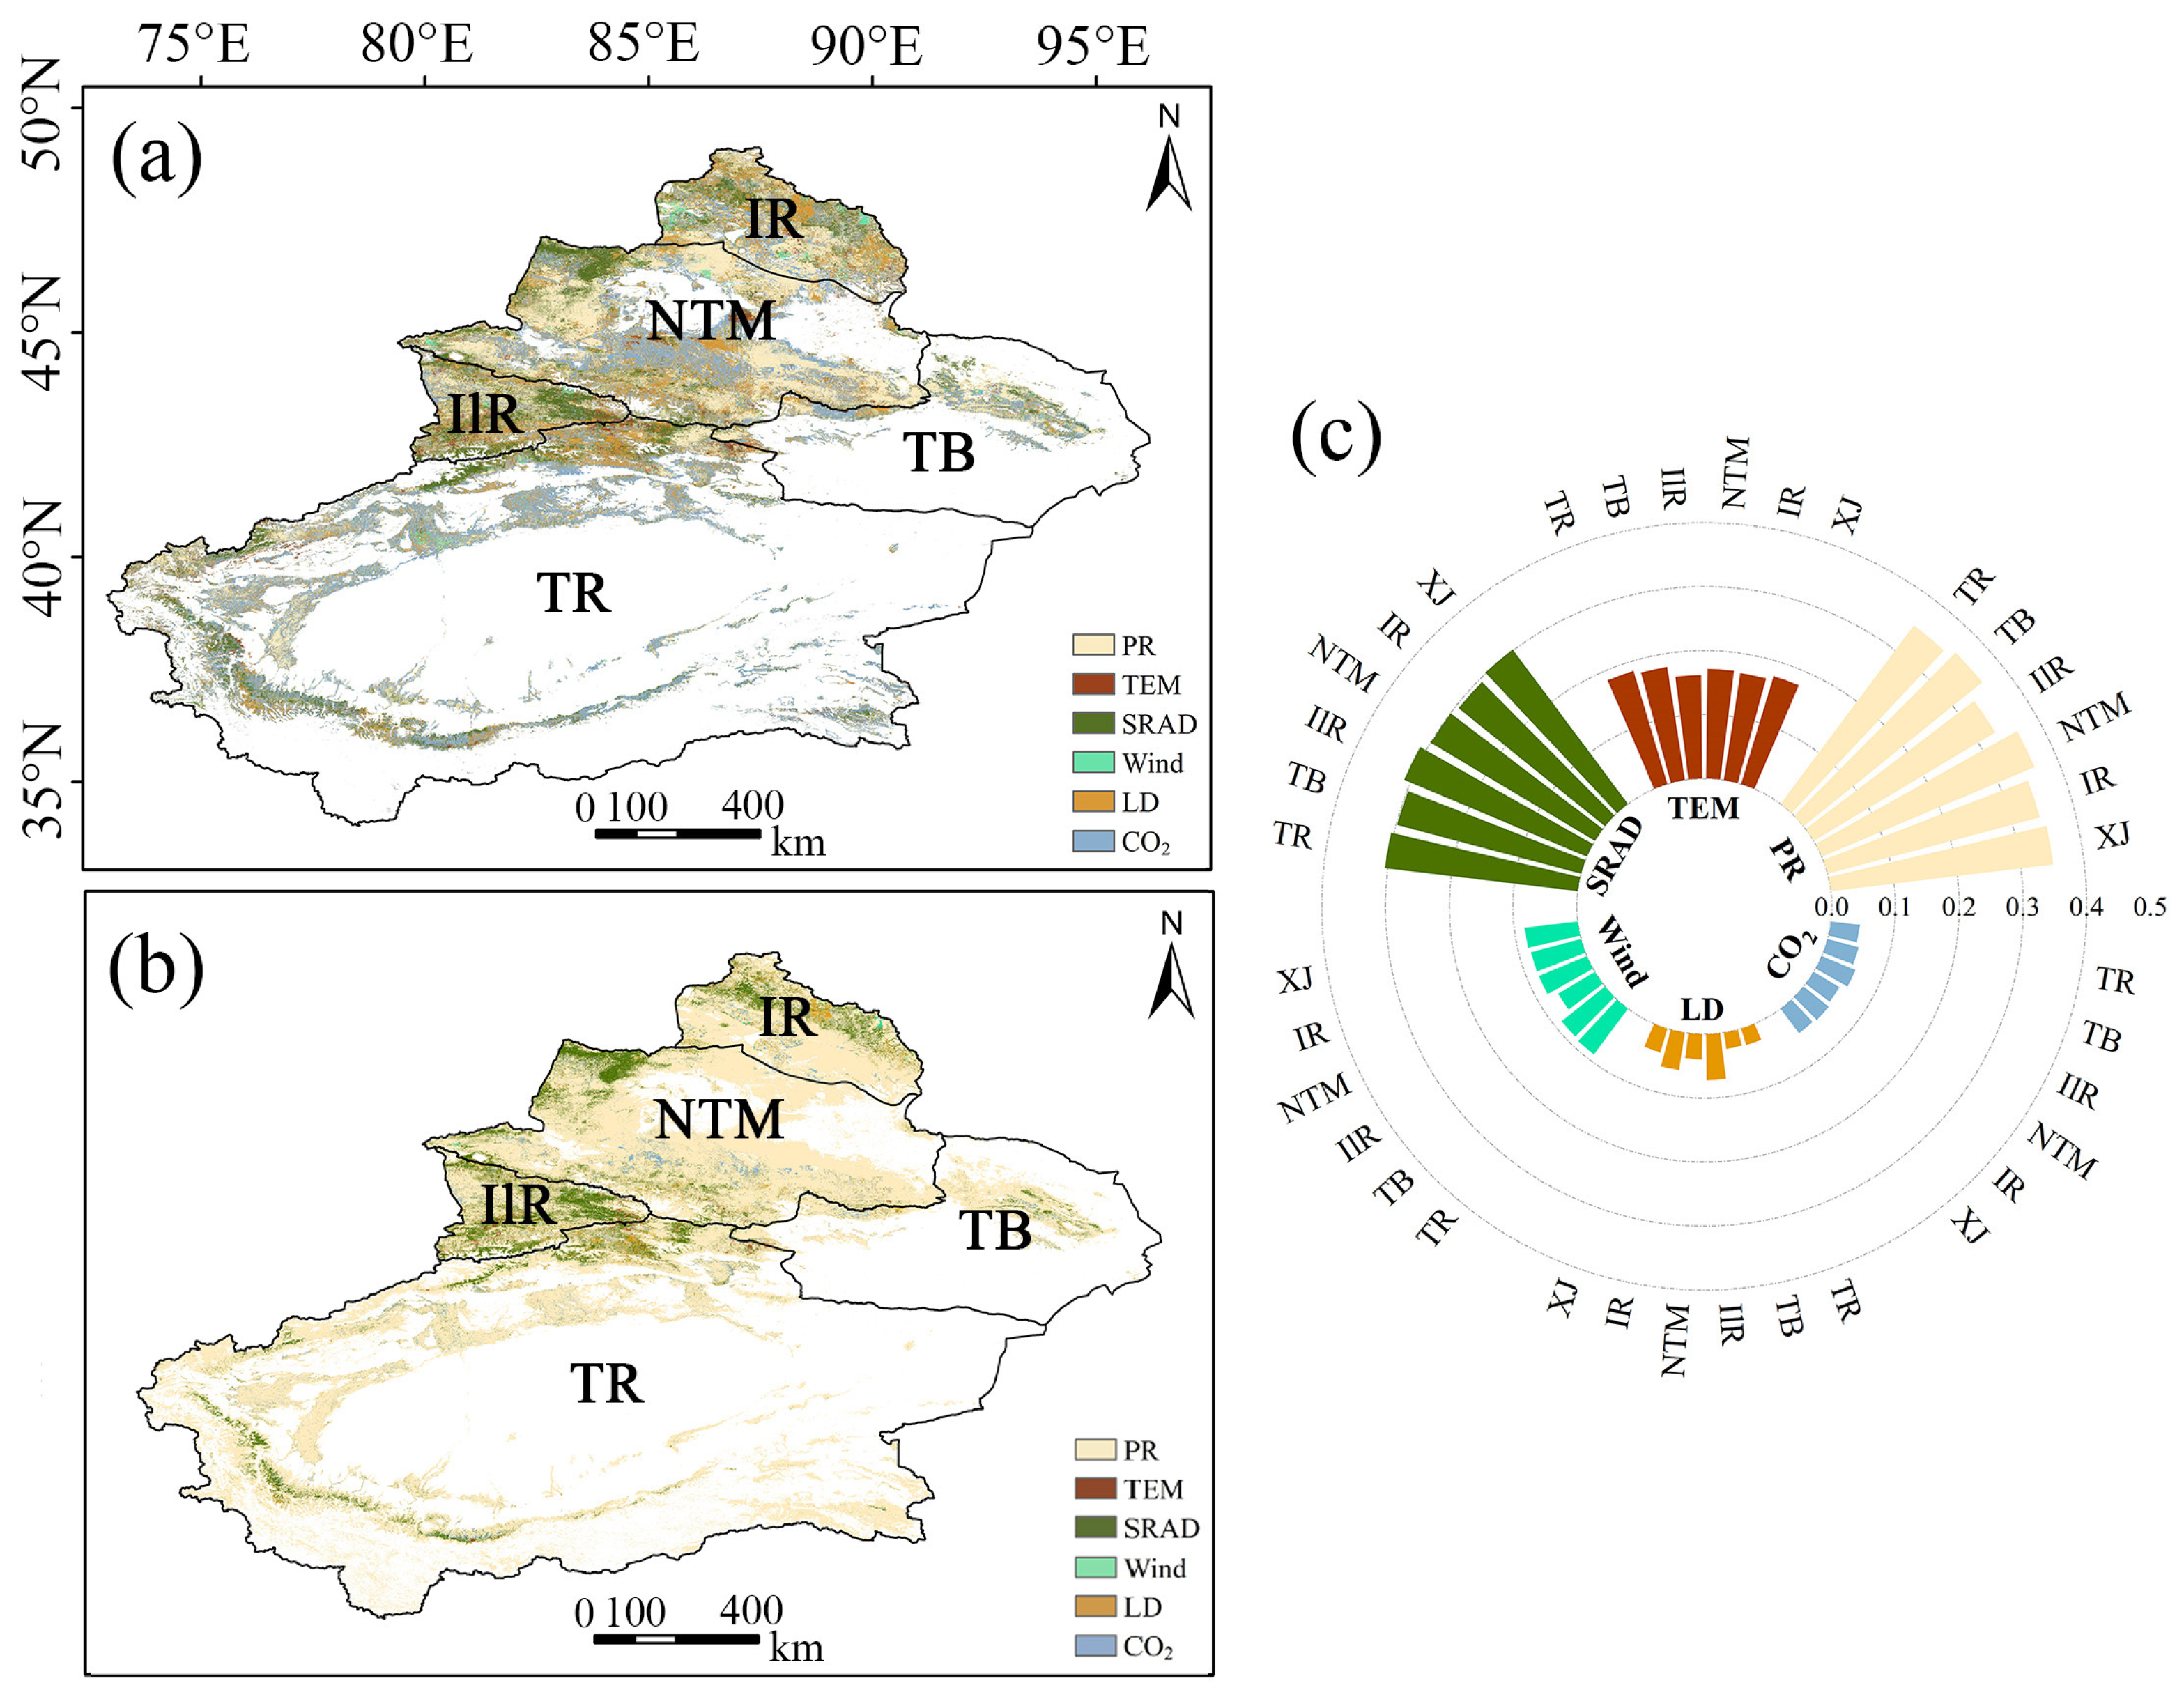
3.2.2. Contribution Analysis

According to the comprehensive contribution results shown in Figure 5b, precipitation is the most significant factor affecting the variation in vegetation NPP in Xinjiang among the six selected influencing factors, accounting for 35.13% of the total contribution across Xinjiang. The comprehensive contribution of precipitation to NPP is relatively high across all five regions, with particularly notable effects in the southern Altai Mountains within the IR region, the southern part of the Junggar Basin within the NTM region, and the northern part of the Tarim Basin within the TR region (Figure 5b). Downward shortwave radiation contributes 30.17% to the vegetation NPP, making it another important factor in Xinjiang. Its dominant impact areas are relatively concentrated, mainly distributed in the northwest corner of the NTM region and the eastern part of the IlR region. The contribution of downward shortwave radiation is particularly significant in the IlR region, accounting for 31.06%.
Temperature is the third highest contributing factor, accounting for 17.61% of the total contribution. Its high contribution areas are relatively scattered and fragmented across all five regions, with dominant patches in each. Among the four hygrothermal condition factors, wind speed has the lowest comprehensive contribution, accounting for 8.37%, with fewer areas primarily influenced by it. And its residual contribution is more obvious near the Altai Mountains, as can be seen in Figure 5a. The comprehensive contribution of CO2 is 4.81%, and combining Figure 5a and Figure 5b we can see that it has a significant impact on the southern side of the Junggar Basin in the NTM area and the northern side of the Tarim Basin in the TR region. Livestock density, a factor closely related to human activities, contributes only 3.9% to the overall vegetation NPP in Xinjiang, with high values concentrated in areas with notable annual variations in livestock, such as the Ili Valley and the Altai Mountains. Among these, livestock density has a more significant comprehensive contribution to the IlR region, accounting for 7.22%.

3.3. Restoration Potential and Degradation Risk

3.3.1. Restoration Potential

The spatial distribution of the VRPRI shown in Figure 6a reveals significant spatial variability in the potential for vegetation restoration is observed in the study area, with a multi-year average VRPRI of 73%. Regions with high potential values are predominantly clustered in the NTM, the southern Altai Mountains, and the oasis zone in the central part of the TB. Particularly, the NTM exhibit numerous pixels with high potential values, with the highest mean among the five major regions, while the IlR has the lowest annual average VRPRI (Figure 6b). Additionally, the average results show that the relative potential values in the IR are relatively high, with average values exceeding 80%. This suggests that despite the NPP values in the NTM and the IR not inherently being elevated (Figure 2), substantial potential exists for future vegetation productivity in these regions. Additionally, VRPRI values in the Altai Mountains, Tianshan Mountains, and Kunlun Mountains all exhibit low potential values, whereas numerous pixels with high potential values are distributed along the mountainous slopes and oasis zones of basins.

3.3.2. Degradation Risk

This study uses future climate scenario data sourced from SSP1-2.6, SSP2-4.5, and SSP5-8.5 in CMIP6 to assess the potential risks to NPP in Xinjiang from 2025 to 2050 under different climate development conditions. The Mann–Kendall test and Theil–Sen estimation are conducted on NPP data spanning the timeframe, and the results are combined to define regions with significantly decreasing NPP as high-risk areas, regions with nonsignificant decreases as medium-risk areas, regions with nonsignificant changes as low-risk areas, and regions with a projected upward trend in the future as no-risk areas. Figure 7a–c illustrate the spatial distribution of risk levels, while Figure 7d–f present the proportions of each risk level within Xinjiang and its five major regions.
Spatially, under the SSP1-2.6 and SSP2-4.5 scenarios, certain areas within the IlR, the western regions of the NTM, and western side of the TR exhibit degradation risks. In contrast, under the SSP5-8.5 scenario, the overall degradation risk in Xinjiang is relatively low, with only the northwestern side of the Tianshan Mountains and areas near the Altai Mountains showing signs of degradation risk. Quantitative analysis shows that under the SSP1-2.6 and SSP2-4.5 scenarios, nearly 50% of the IlR falls within high-risk and medium-risk zones, indicating significant vulnerability to future vegetation degradation, which is consistent with the current NPP change patterns (Figure 3). Furthermore, under the SSP2-4.5 and SSP5-8.5 scenarios, more than 8% of pixels in the IR and NTM regions exhibit notable future risks. In the SSP5-8.5 scenario, the high-risk proportion in the northern slope of the Tianshan Mountains reaches nearly 20%.

4. Discussions

4.1. NPP Response to Various Influencing Factors

The rapid growth of global climate change and urbanization is impacting various components of terrestrial ecosystems worldwide [62], thereby subjecting vegetation to unprecedented risks. Xinjiang, a typical arid regions in northwest China, stands out as one of the areas most acutely vulnerable to these global changes [63]. Changes in various climatic factors have caused fluctuations in the interactions between land and atmosphere systems, affecting vegetation growth and resulting in interannual variations and spatial heterogeneity in vegetation NPP [24]. Therefore, a comprehensive analysis of the combined effects of multiple factors on vegetation is essential for better maintaining global carbon balance.
The analysis of the spatiotemporal variation trends in vegetation NPP indicates that from 2001 to 2020 NPP in Xinjiang overall exhibited a significant increasing trend, which may be related to changes in hydrothermal conditions [6]. Regionally, the shifts in trends across the four major areas of the IR, NTM, TB, and TR are consistent yet show notable spatial discrepancies. As shown in Figure 3c, the TB and TR regions exhibit relatively high proportions of PS and PNS changes, aligning with the changes in precipitation shown in Figure 4f. The overall increase in NPP observed in the IR and NTM is related to the transition of other vegetation types to forests (as shown in Table 1), possibly resulting from policies such as the “Three North Shelterbelt Program” [10]. Hydrothermal conditions are a determining factor in the distribution of land use categories, which in turn determines the spatial distribution of vegetation NPP. Given that forests have the highest NPP among vegetation types, their proliferation contributes to the rise in NPP values. However, these areas also exhibit a relatively high prevalence of NNS regions, possibly due to local overgrazing, as indicated by LD contributions shown in Figure 5c at 5.93% and 3.92% in the two major regions, respectively. Despite the adoption of measures such as grazing prohibition periods for Xinjiang grasslands since the inception of the “Grain for Green” policy in 2003 to align grazing with vegetation recovery, implementation challenges due to topographical constraints have precipitated a decline in grassland NPP [6,14]. In contrast to other regions, the IlR region exhibits a nonsignificant decreasing trend, likely related to precipitation. As shown in Figure 4f, there has been a significant decrease in precipitation in the IlR region from 2001 to 2020. Adequate precipitation supports the growth of local vegetation in areas characterized by high vegetation cover and productivity values, while diminishing precipitation levels may lead to vegetation degradation. Previous studies have also highlighted the correlation between diminished precipitation and reduced NPP in the IlR [64]. Grazing density may also contribute to the decrease in vegetation NPP in this area to some extent [14].
Various factors contribute to spatial heterogeneity in Xinjiang due to topographical, altitudinal, and latitudinal variations, leading to diverse fluctuations in NPP. Among these factors, precipitation has the highest contribution rate, accounting for 35.13%, which plays a significant role in influencing the variation in vegetation NPP in Xinjiang, consistent with previous research findings [65]. The study found that the synergy between hydrothermal conditions is particularly important for the growth of vegetation in Xinjiang [30]. In arid climates, limited water conditions make the impact of hydrothermal factors on vegetation growth more pronounced. For example, in higher altitude mountainous areas, an increase in temperature can benefit vegetation growth to some extent. However, in desert areas, if the temperature rises without a corresponding increase in precipitation, it may lead to intensified drought conditions, potentially hindering vegetation growth. This is especially true in areas with high summer temperatures, where the negative impacts of insufficient rainfall may be amplified. In addition, the influence of radiation on the distribution and change in vegetation NPP was also dominant and consistent across patches, a view that has been confirmed in previous studies [66].
CO2 also influences changes in vegetation NPP in Xinjiang. As shown in Figure 5c, regions predominantly influenced by CO2 are mainly distributed around the NTM and the TR, where vegetation NPP has generally increased. Previous research has shown that a moderate increase in atmospheric CO2 concentration can enhance vegetation’s access to CO2 and its fertilization effect, thereby increasing terrestrial carbon sinks and affecting vegetation NPP [67]. In addition, previous studies have shown that complex hydrothermal conditions create a rich variety of land use categories, and that different land use types lead to notable disparities in surface vegetation coverage, resulting in significant divergences in NPP values [65]. It is worth noting that the policy of converting farmland to forests and grasslands, implemented since 1999, has significantly impacted land use types and vegetation productivity. This policy has promoted ecological restoration and mitigated land degradation [29]. The implementation of ecological engineering and government policies [68], along with the increasing pressure on land due to China’s urbanization process [69], has led to adjustments in the land use structure of Xinjiang from 2001 to 2020, and influenced changes in vegetation NPP.

4.2. Restoration Potential and Degradation Risk Assessment

Based on the “similar habitat principle” and statistical analyses, the mean Vegetation Restoration Potential Ratio Index (VRPRI) in Xinjiang is 0.73. The NTM and the IlR exhibit relatively high values of VRPRI. As shown in Figure 2, these areas possess a relatively good vegetation foundation and are characterized by favorable climatic conditions and unique topography, which facilitate plant growth by providing conditions conducive to vegetation recovery, such as meltwater from ice and snow. In addition, areas in Xinjiang with lower elevations and gentler slopes have higher potential for vegetation recovery, consistent with previous studies [70]. This may be attributed to the richer vegetation types in low-elevation and low-slope areas of Xinjiang, which has higher levels of biodiversity, thereby facilitating vegetation recovery after disturbance. However, vegetation changes are influenced by multiple factors, with human activities significantly impacting the restoration potential of vegetation in Xinjiang. Notably, governmental policies play a pivotal role in the recovery of vegetation NPP [15,71]. Moreover, regulations on forest fire prevention, forest pest management, relevant leading industries for economic development, and the promotion of ecotourism development are all conducive to exerting positive influences on vegetation recovery [15,72,73].
Under different future climate development scenarios, we predict that a considerable number of pixels in the IlR, the MTM, and the IR will exhibit a high-risk degradation level in the future (Figure 7). These regions have inherently high vegetation NPP (Figure 2) and are situated within terrain characterized by unique topographical features and complex and variable climates, which may lead to increased NPP risks in the future. Furthermore, in the context of global warming, with rapid industrial, agricultural, and population growth, there is increasing demand for water resources in the IlR, where precipitation is declining (Figure 4f). Local water scarcity may become more frequent and persistent, further exacerbating vegetation loss [74]. Meanwhile, the future risk to vegetation NPP in Xinjiang is relatively low under the SSP5-8.5 scenario compared to the other two scenarios. This may be related to the high carbon emissions and continued reliance on fossil fuels under the SSP5-8.5 scenario, leading to a significant increase in global temperatures and atmospheric CO2 concentrations. Although rising temperatures may have negative impacts in some regions, in arid areas like Xinjiang, moderate temperature increases and higher CO2 concentrations could promote photosynthesis, thereby enhancing vegetation growth [75]. This may partially offset or mitigate the trend of NPP degradation. Under the SSP5-8.5 scenario, the high-risk areas are predominantly located near mountainous regions, which is attributed to the complexity of the terrain and the vulnerability of the ecosystems in these areas. Due to the complex topography, large elevation differences, and more variable climate conditions, vegetation in mountainous regions has a lower adaptive capacity [76]. In the scenario of high carbon emissions and rising temperatures, these regions are likely to experience more extreme climate events, and local ecosystems may struggle to adapt quickly to the rapidly changing environmental conditions, leading to an increased risk of NPP degradation. It is also worth noting that in the western Tarim Basin, numerous pixels are at high-risk levels, exhibiting significant disparities from current trends (Figure 3). This suggests that while past ecological conservation policies may have been appropriate under the prevailing climatic conditions at the time, these strategies may not be beneficial under future climate regimes [77].

4.3. Limitations and Future Work

While this study has analyzed the influencing factors, restoration potential, and future risks of NPP in Xinjiang, there are still certain limitations. Firstly, in terms of data, factors such as topography [78], slope [79], and soil moisture [80], among others, which can also affect vegetation NPP, were not considered in this study. Furthermore, the ERA5 meteorological data were resampled to 500 m, smoothing out climatic extremes, which could mask the real impacts of climate change on vegetation NPP. In addition, direct interpolation of livestock density might not accurately reflect grazing pressure. Therefore, future analyses could enhance precision by delineating the spatial extents of grazing prohibition areas or implementing diverse ecological engineering measures. As for baseline NPP values, the study used a 20-year average for each LULC type but more refined methodologies could improve accuracy. Moreover, while changes in LULC may instigate vegetation degradation, subsequently impacting NPP dynamics, it is also plausible that LULC alterations may precipitate minor climatic shifts, thereby exerting an indirect influence on NPP values [81]. Finally, while many studies have used the VRPRI index to analyze vegetation restoration potential [15,82], this might miss trends in long-term data improvement. Future studies should consider more detailed modeling approaches.

5. Conclusions

This study conducted a spatiotemporal trend analysis of vegetation NPP in Xinjiang from 2001 to 2020, innovatively incorporating LULC factors as intermediate variables in the model to assess the contributions of climate change and human activities to changes in vegetation NPP. Additionally, innovative methods were introduced to assess the potential space for vegetation restoration and predict future risks.
Over the 20-year period, three-quarters of the Xinjiang area showed an upward trend in vegetation NPP, with an average annual growth rate of 0.39 gC/m2. Among the factors affecting changes in vegetation NPP in Xinjiang, precipitation, and radiation were the dominant factors, contributing 35.13% and 30.17%, respectively. Climate factors played a crucial role in moderating the impact of land use types on NPP. The regions along the northern Tianshan and the Ili River in Xinjiang exhibited significant vegetation restoration potential, with average VRPRI values exceeding 80%. However, the Ili River region had relatively lower restoration potential and the highest future risk, with nearly half of the area facing medium-to-high risks. This study can serve as a reference for policymakers to prioritize conservation efforts in Xinjiang and adjust management strategies to mitigate the impacts of climate variability.

Author Contributions

Conceptualization, W.Z. and X.Z.; formal analysis, W.Z.; funding acquisition, X.Z.; methodology, W.Z. and Y.F.; software, W.Z. and H.L.; writing—original draft, W.Z.; writing—review and editing, H.L., X.Z., Y.F., W.S., S.Z. and Y.G. All authors have read and agreed to the published version of the manuscript.

Funding

This research was supported by the Third Xinjiang Scientific Expedition Program (Grant No. 2022xjkk0405) and the Open Fund of State Key Laboratory of Remote Sensing Science and Beijing Engineering Research Center for Global Land Remote Sensing Products (Grant No. OF202417).

Data Availability Statement

Datasets can be downloaded at the following links. The GLASS data are available at http://www.geodata.cn (accessed on 1 April 2023). The land cover product MCD12Q1 V6 is available at https://search.Earthdata.nasa.gov/search (accessed on 22 March 2023). The ERA5 reanalysis datasets are available at https://cds.climate.copernicus.eu/) (accessed on 29 March 2023). The CO2 data are available at https://gaw.kishou.go.jp/search (accessed on 24 March 2023). The CMIP6 datasets re available at https://pcmdi.llnl.gov/CMIP6/ (accessed on 6 September 2023).

Acknowledgments

We appreciate Beijing Normal University for providing the GLASS dataset, and the Public Data Portal for freely providing the dataset used in this study. We appreciate the National Earth System Science Data Center for providing the NPP data. We also thank the anonymous reviewers and editor for their valuable comments on the manuscript.

Conflicts of Interest

The authors declare no conflicts of interest. The funders had no role in the design of the study; in the collection, analyses, or interpretation of data; in the writing of the manuscript; or in the decision to publish the results.

References

  1. Michaletz, S.T.; Cheng, D.; Kerkhoff, A.J.; Enquist, B.J. Convergence of terrestrial plant production across global climate gradients. Nature 2014, 512, 39–43. [Google Scholar] [CrossRef] [PubMed]
  2. Lawrence, D.M.; Oleson, K.W.; Flanner, M.G.; Thornton, P.E.; Swenson, S.C.; Lawrence, P.J.; Zeng, X.; Yang, Z.-L.; Levis, S.; Sakaguchi, K.; et al. Parameterization improvements and functional and structural advances in Version 4 of the Community Land Model. J. Adv. Model. Earth Syst. 2011, 3, M03001. [Google Scholar] [CrossRef]
  3. Fensholt, R.; Langanke, T.; Rasmussen, K.; Reenberg, A.; Prince, S.D.; Tucker, C.; Scholes, R.J.; Le, Q.B.; Bondeau, A.; Eastman, R.; et al. Greenness in semi-arid areas across the globe 1981–2007—An Earth Observing Satellite based analysis of trends and drivers. Remote Sens. Environ. 2012, 121, 144–158. [Google Scholar] [CrossRef]
  4. Shi, W.Y.; Chen, Y.Z.; Feng, X.M. Identifying the terrestrial carbon benefits from ecosystem restoration in ecologically fragile regions. Agric. Ecosyst. Environ. 2020, 296, 106889. [Google Scholar] [CrossRef]
  5. Gong, H.; Cao, L.; Duan, Y.; Jiao, F.; Xu, X.; Zhang, M.; Wang, K.; Liu, H. Multiple effects of climate changes and human activities on NPP increase in the Three-north Shelter Forest Program area. For. Ecol. Manag. 2023, 529, 120732. [Google Scholar] [CrossRef]
  6. Fang, S.; Yan, J.; Che, M.; Zhu, Y.; Liu, Z.; Pei, H.; Zhang, H.; Xu, G.; Lin, X. Climate change and the ecological responses in Xinjiang, China: Model simulations and data analyses. Quat. Int. 2013, 311, 108–116. [Google Scholar] [CrossRef]
  7. Ge, W.; Deng, L.; Wang, F.; Han, J. Quantifying the contributions of human activities and climate change to vegetation net primary productivity dynamics in China from 2001 to 2016. Sci. Total Environ. 2021, 773, 145648. [Google Scholar] [CrossRef]
  8. Fang, X.; Chen, Z.; Guo, X.; Zhu, S.; Liu, T.; Li, C.; He, B. Impacts and uncertainties of climate/CO2 change on net primary productivity in Xinjiang, China (2000–2014): A modelling approach. Ecol. Model. 2019, 408, 108742. [Google Scholar] [CrossRef]
  9. Wang, C.; Chen, J.; Gu, L.; Wu, G.; Tong, S.; Xiong, L.; Xu, C.-Y. A pathway analysis method for quantifying the contributions of precipitation and potential evapotranspiration anomalies to soil moisture drought. J. Hydrol. 2023, 621, 129570. [Google Scholar] [CrossRef]
  10. Yang, H.; Zhong, X.; Deng, S.; Xu, H. Assessment of the impact of LUCC on NPP and its influencing factors in the Yangtze River basin, China. Catena 2021, 206, 105542. [Google Scholar] [CrossRef]
  11. Zhou, H.; Van Rompaey, A.; Wang, J.A. Detecting the impact of the “Grain for Green” program on the mean annual vegetation cover in the Shaanxi province, China using SPOT-VGT NDVI data. Land Use Policy 2009, 26, 954–960. [Google Scholar] [CrossRef]
  12. Zhu, Q.; Chen, H.; Peng, C.; Liu, J.; Piao, S.; He, J.-S.; Wang, S.; Zhao, X.; Zhang, J.; Fang, X.; et al. An early warning signal for grassland degradation on the Qinghai-Tibetan Plateau. Nat. Commun. 2023, 14, 6406. [Google Scholar] [CrossRef]
  13. Guo, W.-W.; Jin, L.; Li, W.; Wang, W.-T. Assessing the vulnerability of grasslands in Gannan of China under the dual effects of climate change and human activities. Ecol. Indic. 2023, 148, 110100. [Google Scholar] [CrossRef]
  14. Zhang, R.; Liang, T.; Guo, J.; Xie, H.; Feng, Q.; Aimaiti, Y. Grassland dynamics in response to climate change and human activities in Xinjiang from 2000 to 2014. Sci. Rep. 2018, 8, 2888. [Google Scholar] [CrossRef]
  15. Xu, X.; Zhang, D.; Zhang, Y.; Yao, S.; Zhang, J. Evaluating the vegetation restoration potential achievement of ecological projects: A case study of Yan’an, China. Land Use Policy 2020, 90, 104293. [Google Scholar] [CrossRef]
  16. Halik, Ü.; Aishan, T.; Betz, F.; Kurban, A.; Rouzi, A. Effectiveness and challenges of ecological engineering for desert riparian forest restoration along China’s largest inland river. Ecol. Eng. 2019, 127, 11–22. [Google Scholar] [CrossRef]
  17. Yan, H.; Zhan, J.; Liu, B.; Huang, W.; Li, Z. Spatially Explicit Assessment of Ecosystem Resilience: An Approach to Adapt to Climate Changes. Adv. Meteorol. 2014, 2014, 798428. [Google Scholar] [CrossRef]
  18. Li, J.; Huang, L.; Cao, W.; Wang, J.; Fan, J.; Xu, X.; Tian, H. Benefits, potential and risks of China’s grassland ecosystem conservation and restoration. Sci. Total Environ. 2023, 905, 167413. [Google Scholar] [CrossRef]
  19. Ma, F.; Jiang, Q.o.; Xu, L.; Lv, K.; Chang, G. Processes, potential, and duration of vegetation restoration under different modes in the eastern margin ecotone of Qinghai-Tibet Plateau. Ecol. Indic. 2021, 132, 108267. [Google Scholar] [CrossRef]
  20. Chen, T.; Wang, Y.; Peng, L. Advanced time-lagged effects of drought on global vegetation growth and its social risk in the 21st century. J. Environ. Manag. 2023, 347, 119253. [Google Scholar] [CrossRef]
  21. Gao, X.; Cao, C.; Xu, M.; Yang, X.; Li, J.; Shea Duerler, R.; Wang, K.; Guo, H.; Yang, Y. Ecological risk assessment of grassland vegetation change based on Bayesian model in Xilin Gol League, China. Ecol. Indic. 2023, 157, 111199. [Google Scholar] [CrossRef]
  22. Wang, J.; Zhang, F.; Jim, C.-Y.; Chan, N.W.; Johnson, V.C.; Liu, C.; Duan, P.; Bahtebay, J. Spatio-temporal variations and drivers of ecological carrying capacity in a typical mountain-oasis-desert area, Xinjiang, China. Ecol. Eng. 2022, 180, 106672. [Google Scholar] [CrossRef]
  23. Zhang, W.; Zhou, J.; Feng, G.; Weindorf, D.C.; Hu, G.; Sheng, J. Characteristics of water erosion and conservation practice in arid regions of Central Asia: Xinjiang, China as an example. Int. Soil Water Conserv. Res. 2015, 3, 97–111. [Google Scholar] [CrossRef]
  24. Gong, X.; Li, Y.; Wang, X.; Zhang, Z.; Lian, J.; Ma, L.; Chen, Y.; Li, M.; Si, H.; Cao, W. Quantitative assessment of the contributions of climate change and human activities on vegetation degradation and restoration in typical ecologically fragile areas of China. Ecol. Indic. 2022, 144, 109536. [Google Scholar] [CrossRef]
  25. Yang, H.; Li, J.; Wang, Y.; Yao, L. Relative contribution of climate change and human activities to vegetation degradation and restoration in North Xinjiang, China. Eur. J. Soil Sci. 2017, 39, 289–302. [Google Scholar] [CrossRef]
  26. Lyu, J.; Fu, X.; Lu, C.; Zhang, Y.; Luo, P.; Guo, P.; Huo, A.; Zhou, M. Quantitative assessment of spatiotemporal dynamics in vegetation NPP, NEP and carbon sink capacity in the Weihe River Basin from 2001 to 2020. J. Clean. Prod. 2023, 428, 139384. [Google Scholar] [CrossRef]
  27. Jiapaer, G.; Liang, S.; Yi, Q.; Liu, J. Vegetation dynamics and responses to recent climate change in Xinjiang using leaf area index as an indicator. Ecol. Indic. 2015, 58, 64–76. [Google Scholar] [CrossRef]
  28. Liu, Y.; Li, L.; Chen, X.; Zhang, R.; Yang, J. Temporal-spatial variations and influencing factors of vegetation cover in Xinjiang from 1982 to 2013 based on GIMMS-NDVI3g. Glob. Planet. Chang. 2018, 169, 145–155. [Google Scholar] [CrossRef]
  29. Yang, H.; Mu, S.; Li, J. Effects of ecological restoration projects on land use and land cover change and its influences on territorial NPP in Xinjiang, China. Catena 2014, 115, 85–95. [Google Scholar] [CrossRef]
  30. Yao, J.; Hu, W.; Chen, Y.; Huo, W.; Zhao, Y.; Mao, W.; Yang, Q. Hydro-climatic changes and their impacts on vegetation in Xinjiang, Central Asia. Sci. Total Environ. 2019, 660, 724–732. [Google Scholar] [CrossRef] [PubMed]
  31. Zheng, Y.; Shen, R.; Wang, Y.; Li, X.; Liu, S.; Liang, S.; Chen, J.M.; Ju, W.; Zhang, L.; Yuan, W. Improved estimate of global gross primary production for reproducing its long-term variation, 1982–2017. Earth Syst. Sci. Data 2020, 12, 2725–2746. [Google Scholar] [CrossRef]
  32. Yuan, W.; Liu, S.; Yu, G.; Bonnefond, J.-M.; Chen, J.; Davis, K.; Desai, A.R.; Goldstein, A.H.; Gianelle, D.; Rossi, F.; et al. Global estimates of evapotranspiration and gross primary production based on MODIS and global meteorology data. Remote Sens. Environ. 2010, 114, 1416–1431. [Google Scholar] [CrossRef]
  33. He, Y.; Lee, E.; Warner, T.A. Continuous annual land use and land cover mapping using AVHRR GIMMS NDVI3g and MODIS MCD12Q1 datasets over China from 1982 to 2012. In Proceedings of the IGARSS 2016–2016 IEEE International Geoscience and Remote Sensing Symposium, Beijing, China, 10–15 July 2016; IEEE: Piscataway, NJ, USA, 2016; pp. 5470–5472. [Google Scholar]
  34. Javed, T.; Yao, N.; Chen, X.; Suon, S.; Li, Y.A.-O. Drought evolution indicated by meteorological and remote-sensing drought indices under different land cover types in China. Environ. Sci. Pollut. Res. 2020, 27, 4258–4274. [Google Scholar] [CrossRef] [PubMed]
  35. Loveland, T.R.; Zhu, Z.; Brown, J.F.; Yang, L. An analysis of IGBP global land-cover characterization process. Photogramm. Eng. Remote Sens. 1999, 65, 1069–1074. [Google Scholar]
  36. Hao, L.; Wang, S.; Cui, X.; Zhai, Y. Spatiotemporal Dynamics of Vegetation Net Primary Productivity and Its Response to Climate Change in Inner Mongolia from 2002 to 2019. Sustainability 2021, 13, 13310. [Google Scholar] [CrossRef]
  37. Hamed, M.M.; Nashwan, M.S.; Shahid, S.; Wang, X.-J.; Ismail, T.B.; Dewan, A.; Asaduzzaman, M. Future Köppen-Geiger climate zones over Southeast Asia using CMIP6 Multimodel Ensemble. Atmos. Res. 2023, 283, 106560. [Google Scholar] [CrossRef]
  38. Beck, H.E.; Zimmermann, N.E.; McVicar, T.R.; Vergopolan, N.; Berg, A.; Wood, E.F. Present and future Köppen-Geiger climate classification maps at 1-km resolution. Sci. Data 2018, 5, 180214. [Google Scholar] [CrossRef]
  39. Guanter, L.; Del Carmen González-Sanpedro, M.; Moreno, J. A method for the atmospheric correction of ENVISAT/MERIS data over land targets. Int. J. Remote Sens. 2007, 28, 709–728. [Google Scholar] [CrossRef]
  40. Li, H.; Li, K.; Zhao, X.; Zhao, J. Changes in Vegetation Greenness and Their Influencing Factors in Southern China. Remote Sens. 2022, 14, 3291. [Google Scholar] [CrossRef]
  41. Li, Y.; Ji, J. Assessment of the productivity and livestock carrying capacity of Inner Mongolia grassland by regional scale modeling. J. Nat. Resour. 2004, 19, 610–616. [Google Scholar]
  42. Wei, Y.; Lu, H.; Wang, J.; Wang, X.; Sun, J. Dual Influence of Climate Change and Anthropogenic Activities on the Spatiotemporal Vegetation Dynamics over the Qinghai-Tibetan Plateau From 1981 to 2015. Earth’s Future 2022, 10, e2021EF002566. [Google Scholar] [CrossRef]
  43. Wu, T.; Lu, Y.; Fang, Y.; Xin, X.; Li, L.; Li, W.; Jie, W.; Zhang, J.; Liu, Y.; Zhang, L.; et al. The Beijing Climate Center Climate System Model (BCC-CSM): The main progress from CMIP5 to CMIP6. Geosci. Model Dev. 2019, 12, 1573–1600. [Google Scholar] [CrossRef]
  44. Liu, Y.-W.; Zhao, L.; Tan, G.-R.; Shen, X.-Y.; Nie, S.-P.; Li, Q.-Q.; Zhang, L. Evaluation of multidimensional simulations of summer air temperature in China from CMIP5 to CMIP6 by the BCC models: From trends to modes. Adv. Clim. Chang. Res. 2022, 13, 28–41. [Google Scholar] [CrossRef]
  45. Tan, J.; Huang, A.; Shi, X.; Zhang, Y.; Zhang, Y.; Cao, L.; Wu, Y. Evaluating the Performance of BCC-CSM2-MR Model in Simulating the Land Surface Processes in China. Plateau Meteorol. 2022, 41, 1335–1347. [Google Scholar] [CrossRef]
  46. Li, H.; Zhou, Y.; Zhao, X.; Zhang, X.; Liang, S. A Dataset of 0.05-Degree LAI in China during 2015–2100 Based on Deep Learning Network. Scientific Data. Major Revision. Available online: https://osf.io/9qz4k/wiki/home/ (accessed on 13 August 2024).
  47. Tebaldi, C.; Debeire, K.; Eyring, V.; Fischer, E.; Fyfe, J.; Friedlingstein, P.; Knutti, R.; Lowe, J.; O’Neill, B.; Sanderson, B.; et al. Climate model projections from the Scenario Model Intercomparison Project (ScenarioMIP) of CMIP6. Earth Syst. Dynam. 2021, 12, 253–293. [Google Scholar] [CrossRef]
  48. Jiang, W.; Yuan, L.; Wang, W.; Cao, R.; Zhang, Y.; Shen, W. Spatio-temporal analysis of vegetation variation in the Yellow River Basin. Ecol. Indic. 2015, 51, 117–126. [Google Scholar] [CrossRef]
  49. Liu, N.; Ding, Y.; Peng, S. Temporal effects of climate on vegetation trigger the response biases of vegetation to human activities. Glob. Ecol. Conserv. 2021, 31, e01822. [Google Scholar] [CrossRef]
  50. Ren, Y.; Liu, J.; Liu, S.; Wang, Z.; Liu, T.; Shalamzari, M.J. Effects of Climate Change on Vegetation Growth in the Yellow River Basin from 2000 to 2019. Remote Sens. 2022, 14, 687. [Google Scholar] [CrossRef]
  51. Breiman, L. Random forest. Mach. Learn. 1999, 45, 1–35. [Google Scholar]
  52. Shi, Y.; Jin, N.; Ma, X.; Wu, B.; He, Q.; Yue, C.; Yu, Q. Attribution of climate and human activities to vegetation change in China using machine learning techniques. Agric. For. Meteorol. 2020, 294, 108146. [Google Scholar] [CrossRef]
  53. Chang, C.; Chang, Y.; Xiong, Z.; Liu, H.; Bu, R. Estimating the aboveground biomass of the Hulunbuir Grassland and exploring its spatial and temporal variations over the past ten years. Ecol. Indic. 2024, 161, 112010. [Google Scholar] [CrossRef]
  54. Li, Y.; Zheng, Z.; Qin, Y.; Rong, P. Relative contributions of natural and man-made factors to vegetation cover change of environmentally sensitive and vulnerable areas of China. J. Clean. Prod. 2021, 321, 128917. [Google Scholar] [CrossRef]
  55. Genuer, R.; Poggi, J.-M.; Tuleau-Malot, C. Variable selection using random forests. Pattern Recognit. Lett. 2010, 31, 2225–2236. [Google Scholar] [CrossRef]
  56. Grabska, E.; Hostert, P.; Pflugmacher, D.; Ostapowicz, K. Forest Stand Species Mapping Using the Sentinel-2 Time Series. Remote Sens. 2019, 11, 1197. [Google Scholar] [CrossRef]
  57. Abu Hammad, A.; Tumeizi, A. Land degradation: Socioeconomic and environmental causes and consequences in the eastern Mediterranean. Land Degrad. Dev. 2010, 23, 216–226. [Google Scholar] [CrossRef]
  58. Ren, H.; Peng, S.; Lu, H. The restoration of degraded ecosystems and restoration ecology. Acta Ecol. Sin. 2004, 24, 1760–1768. [Google Scholar]
  59. Nauman, T.W.; Duniway, M.C.; Villarreal, M.L.; Poitras, T.B. Disturbance automated reference toolset (DART): Assessing patterns in ecological recovery from energy development on the Colorado Plateau. Sci. Total Environ. 2017, 584–585, 476–488. [Google Scholar] [CrossRef] [PubMed]
  60. Gao, H.; Pang, G.; Li, Z.; Cheng, S. Evaluating the potential of vegetation restoration in the Loess Plateau. Acta Geogrphica Sin. 2017, 72, 863–874. [Google Scholar]
  61. Zhang, D.; Xu, X.; Yao, S.; Zhang, J.; Hou, X.; Yin, R. A novel similar habitat potential model based on sliding-window technique for vegetation restoration potential mapping. Land Degrad. Dev. 2019, 31, 760–772. [Google Scholar] [CrossRef]
  62. Afuye, G.A.; Kalumba, A.M.; Busayo, E.T.; Orimoloye, I.R. A bibliometric review of vegetation response to climate change. Environ. Sci. Pollut. Res. Int. 2022, 29, 18578–18590. [Google Scholar] [CrossRef]
  63. Wang, G.; Mao, J.; Fan, L.; Ma, X.; Li, Y. Effects of climate and grazing on the soil organic carbon dynamics of the grasslands in Northern Xinjiang during the past twenty years. Glob. Ecol. Conserv. 2022, 34, e02039. [Google Scholar] [CrossRef]
  64. Zhao, P.; Chen, T.; Wang, Q.; Yu, R. Quantitative analysis of the impact of climate change and human activities on grassland ecosystem NPP in Xinjiang. J. Univ. Chin. Acad. Sci. 2020, 37, 51–62. [Google Scholar]
  65. Li, J.; Wang, J.; Zhang, J.; Liu, C.; He, S.; Liu, L. Growing-season vegetation coverage patterns and driving factors in the China-Myanmar Economic Corridor based on Google Earth Engine and geographic detector. Ecol. Indic. 2022, 136, 108620. [Google Scholar] [CrossRef]
  66. Jia, L.; Yu, K.; Li, Z.; Li, P.; Xu, G.; Cong, P.; Li, B. Spatiotemporal pattern of NPP and its response to climatic factors in the Yangtze River Economic Belt. Ecol. Indic. 2024, 162, 112017. [Google Scholar] [CrossRef]
  67. Yang, S.; Yang, J.; Shi, S.; Song, S.; Luo, Y.; Du, L. The rising impact of urbanization-caused CO2 emissions on terrestrial vegetation. Ecol. Indic. 2023, 148, 110079. [Google Scholar] [CrossRef]
  68. Li, T.; Lü, Y.; Fu, B.; Comber, A.J.; Harris, P.; Wu, L. Gauging policy-driven large-scale vegetation restoration programmes under a changing environment: Their effectiveness and socio-economic relationships. Sci. Total Environ. 2017, 607–608, 911–919. [Google Scholar] [CrossRef] [PubMed]
  69. Zhou, T.; Liu, H.; Gou, P.; Xu, N. Conflict or Coordination? measuring the relationships between urbanization and vegetation cover in China. Ecol. Indic. 2023, 147, 109993. [Google Scholar] [CrossRef]
  70. Bisson, M.; Fornaciai, A.; Coli, A.; Mazzarini, F.; Pareschi, M.T. The Vegetation Resilience After Fire (VRAF) index: Development, implementation and an illustration from central Italy. Int. J. Appl. Earth Obs. Geoinf. 2008, 10, 312–329. [Google Scholar] [CrossRef]
  71. Wang, C.; Chu, X.; Zhan, J.; Wang, P.; Zhang, F.; Xin, Z. Factors Contributing to Efficient Forest Production in the Region of the Three-North Shelter Forest Program, China. Sustainability 2019, 12, 302. [Google Scholar] [CrossRef]
  72. Yin, R.; Yin, G. China’s primary programs of terrestrial ecosystem restoration: Initiation, implementation, and challenges. Environ. Manag. 2010, 45, 429–441. [Google Scholar] [CrossRef]
  73. Bryan, B.A.; Gao, L.; Ye, Y.; Sun, X.; Connor, J.D.; Crossman, N.D.; Stafford-Smith, M.; Wu, J.; He, C.; Yu, D.; et al. China’s response to a national land-system sustainability emergency. Nature 2018, 559, 193–204. [Google Scholar] [CrossRef] [PubMed]
  74. Piao, S.; Ciais, P.; Huang, Y.; Shen, Z.; Peng, S.; Li, J.; Zhou, L.; Liu, H.; Ma, Y.; Ding, Y.; et al. The impacts of climate change on water resources and agriculture in China. Nature 2010, 467, 43–51. [Google Scholar] [CrossRef]
  75. Xu, S.; Zhang, M.; Su, M. Estimation of grassland productivity in the period 1978−2021 and prediction under different climate scenarios in the period 2021–2100 in the Qinghai-Tibet Plateau in China. Glob. Ecol. Conserv. 2023, 43, e02449. [Google Scholar] [CrossRef]
  76. Chen, T.; Bao, A.; Jiapaer, G.; Guo, H.; Zheng, G.; Jiang, L.; Chang, C.; Tuerhanjiang, L. Disentangling the relative impacts of climate change and human activities on arid and semiarid grasslands in Central Asia during 1982–2015. Sci. Total Environ. 2019, 653, 1311–1325. [Google Scholar] [CrossRef] [PubMed]
  77. Kong, Z.; Ling, H.; Deng, M.; Han, F.; Yan, J.; Deng, X.; Wang, Z.; Ma, Y.; Wang, W. Past and projected future patterns of fractional vegetation coverage in China. Sci. Total Environ. 2023, 902, 166133. [Google Scholar] [CrossRef] [PubMed]
  78. Xu, G.; Zhang, J.; Li, P.; Li, Z.; Lu, K.; Wang, X.; Wang, F.; Cheng, Y.; Wang, B. Vegetation restoration projects and their influence on runoff and sediment in China. Ecol. Indic. 2018, 95, 233–241. [Google Scholar] [CrossRef]
  79. Chen, S.; Ma, M.; Wu, S.; Tang, Q.; Wen, Z. Topography intensifies variations in the effect of human activities on forest NPP across altitude and slope gradients. Environ. Dev. 2023, 45, 100826. [Google Scholar] [CrossRef]
  80. Zhang, S.; Bai, X.; Zhao, C.; Tan, Q.; Luo, G.; Cao, Y.; Deng, Y.; Li, Q.; Li, C.; Wu, L.; et al. Limitations of soil moisture and formation rate on vegetation growth in karst areas. Sci. Total Environ. 2022, 810, 151209. [Google Scholar] [CrossRef] [PubMed]
  81. Wang, R.; Gao, W.; Peng, W. Spatial downscaling method for air temperature through the correlation between land use/land cover and microclimate: A case study of the Greater Tokyo Area, Japan. Urban Clim. 2021, 40, 101003. [Google Scholar] [CrossRef]
  82. Gu, F.; Xu, G.; Wang, B.; Jia, L.; Xu, M. Vegetation cover change and restoration potential in the Ziwuling Forest Region, China. Ecol. Eng. 2023, 187, 106877. [Google Scholar] [CrossRef]
Figure 1. Location of the study area in China and spatial distribution of land cover types in study area in 2020. XJ, IR, NTM, IlR, TB, and TR denote Xinjiang, the Irtysh River, north slope of the Tianshan Mountains, Ili River, Turpan Basin, and Tarim River, respectively.
Remotesensing 16 03604 g001
Figure 2. Annual difference and mean values of vegetation NPP in Xinjiang from 2001 to 2020. (ad) represent the difference between the four study periods of 2001–2005, 2006–2010, 2011–2015, and 2016–2020, respectively. The units of NPP are all gC/m2∙a. (e) Box plots of NPP averages for the whole of Xinjiang and the five major regions. XJ, IR, NTM, IlR, TB, and TR denote the Xinjiang, Irtysh River, north slope of the Tianshan Mountains, Ili River, Turpan Basin, and Tarim River, respectively.
Remotesensing 16 03604 g002
Figure 3. Spatial and temporal trends of the NPP from 2001 to 2020 in Xinjiang. (a) Spatial distribution of the Sen slope of NPP change in Xinjiang from 2001 to 2020; (b) The spatial distribution of the annual mean NPP trend in Xinjiang from 2001 to 2020. (c) The stack bar of the trend grouped by types of significance in major regions and the whole of Xinjiang. The fold line graph of the NPP mean trend in five areas (dh) and the whole of Xinjiang (i) from 2001 to 2020. NS, NNS, NC, PS, and PNS denote negative significant, negative non-significant, nonsignificant change, positive significant, and positive nonsignificant, respectively; XJ, IR, NTM, IlR, TB, and TR denote the Xinjiang, Irtysh River, north slope of the Tianshan Mountains, Ili River, Turpan Basin, and Tarim River, respectively.
Remotesensing 16 03604 g003
Figure 4. Twenty-year averages (ae) and annual mean change rates (fj) of precipitation, temperature, downward shortwave radiation, wind, and livestock density in Xinjiang. PR, TEM, SRAD, Wind, and LD denote the precipitation, temperature, downward shortwave radiation, wind speed, and livestock density, respectively.
Remotesensing 16 03604 g004
Figure 5. The contribution of each factor to NPP given by random forest. (a) is the result of the residual contribution; (b) is the result of the combined contribution when the average and residual contributions are superimposed. (c) shows the average of the comprehensive contribution of each factor for each pixel in the five regions and the whole of Xinjiang. Each pixel in (a,b) shows the highest contributing factor of the six factors: precipitation, temperature, sinking shortwave radiation, wind speed, livestock density, and CO2. PR, TEM, SRAD, Wind, LD, and CO2 denote the precipitation, temperature, downward shortwave radiation, wind speed, livestock density, and CO2, respectively; XJ, IR, NTM, IlR, TB, and TR denote the Xinjiang, Irtysh River, north slope of the Tianshan Mountains, Ili River, Turpan Basin, and Tarim River, respectively.
Remotesensing 16 03604 g005
Figure 6. Spatial distribution and statistics of the VRPRI in Xinjiang. (a) Spatial distribution of the VRPRI; (b) box plots of the ratio of the VRPRI across the whole of Xinjiang and the five regions. XJ, IR, NTM, IlR, TB, and TR denote the Xinjiang, Irtysh River, north slope of the Tianshan Mountains, Ili River, Turpan Basin, and Tarim River, respectively.
Remotesensing 16 03604 g006
Figure 7. Risk of change in NPP in Xinjiang from 2025 to 2050. (ac) Spatial distribution of change risk under scenarios SSP1-2.6, SSP2-4.5, and SSP5-8.5; (df) proportion of each risk class in Xinjiang and the five regions. XJ, IR, NTM, IlR, TB, and TR denote the Xinjiang, Irtysh River, north slope of the Tianshan Mountains, Ili River, Turpan Basin, and Tarim River, respectively.
Remotesensing 16 03604 g007
Table 1. Comparison of the area share of each LULC type in Xinjiang and five regions in 2001 and 2020. XJ, IR, NTM, IlR, TB, and TR denote the Xinjiang, Irtysh River, north slope of the Tianshan Mountains, Ili River, Turpan Basin, and Tarim River, respectively.
LULC TypeYearXJIRNTMIlRTBTR
Forest20010.21%1.35%0.19%2.68%0.00%0.01%
20200.25%1.65%0.21%3.31%0.01%0.01%
Grassland200123.86%84.39%54.64%61.81%9.09%10.88%
202024.85%83.73%54.57%62.33%9.91%12.39%
Cropland20012.87%1.26%4.97%25.34%0.36%1.66%
20204.19%2.69%8.65%24.19%0.51%2.73%
Urban and built up20010.17%0.20%0.46%0.53%0.13%0.08%
20200.17%0.20%0.46%0.56%0.13%0.08%
Desert200171.80%11.41%38.94%8.36%90.37%86.03%
202068.94%10.31%35.14%8.11%88.94%82.80%
Water body20011.09%1.39%0.80%1.28%0.50%1.34%
20201.60%1.42%0.97%1.50%0.50%1.99%
Table 2. The introduction of different future climate scenarios [47].
NameDifficulty of Climate Change AdaptationDifficulty of Climate Change MitigationDescription
SSP1-2.6LowLowSustainable development pathway. Low resource intensity and reduced reliance on fossil fuels, balanced development within and among economies, technological advancement, with a strong emphasis on preventing environmental degradation.
SSP2-4.5MediumMediumMiddle-of-the-road pathway. The world continues to develop according to the typical trends of the past few decades, with reduced dependence on fossil fuels, but uneven development among low-income countries.
SSP5-8.5LowHighFossil fuel development pathway. Emphasizes traditional economic development, with an energy system dominated by fossil fuels, but deepened regional cooperation and economic globalization, characterized by strong economic growth and highly engineered infrastructure.
Table 3. The introduction of data category, parameters, sources, spatial resolution, and resampling methods, all spanning 2001–2020.
Data CategoryData ParameterData SourceSpatial ResolutionResampling Method
Remote sensing dataNPPGLASS products500 m
Meteorological data2 m air temperatureERA5-Land monthly products0.1°Bilinear
PrecipitationERA5-Land monthly products0.1°Bilinear
Downward shortwave radiationERA5-Land monthly products0.1°Bilinear
10 m wind speedERA5 monthly products0.25°Bilinear
CO2WLG station dataSite scaleBilinear
Human activity dataLand use/coverMCD12Q1 dataset500 m
Livestock data (sheep units)Xinjiang Statistical YearbookCounty scaleBilinear
Future climate simulation dataFuture NPPCMIP6Deep learning
Disclaimer/Publisher’s Note: The statements, opinions and data contained in all publications are solely those of the individual author(s) and contributor(s) and not of MDPI and/or the editor(s). MDPI and/or the editor(s) disclaim responsibility for any injury to people or property resulting from any ideas, methods, instructions or products referred to in the content.

