Abstract
For some time, CNN was the de facto state-of-the-art method in remote sensing image change detection. Although transformer-based models have surpassed CNN-based models due to their larger receptive fields, CNNs still retain their value for their efficiency and ability to extract precise local features. To overcome the limitations of the restricted receptive fields in standard CNNs, deformable convolution allows for dynamic adjustment of sampling locations in convolutional kernels, improving the network’s ability to model global contexts. InternImage is an architecture built upon deformable convolution as its foundational operation. Motivated by InternImage, in this paper, a CNN-based change detection vision foundation model is proposed. By introducing deformable convolution into Siamese InternImage architecture, the proposed CNN-based change detection vision foundation model is capable of capturing long-range dependencies and global information. A refinement block is utilized to merge local detail, where channel attention is incorporated. The proposed approach achieved excellent performance on the LEVIR-CD and WHU-CD datasets.
1. Introduction
Change detection is a hot topic in remote sensing application, aiming to accurately identify changed regions in bitemporal images. High-resolution images present challenges such as seasonal differences, lighting variations, and complex backgrounds, making change detection particularly difficult. Since the task of change detection has been introduced, researchers have developed numerous methods. These methods can be broadly classified into traditional image-based approaches and deep learning-based approaches.
Traditional methods include techniques such as Gabor filters [1], K-means clustering, PCA [2,3], and SVM [4]. However, these methods often rely on handcrafted features and shallow models, which may encounter difficulties in capturing the intricate spatial and spectral patterns inherent in remote sensing data. This limitation can hinder their effectiveness, especially in challenging and dynamic environmental conditions where deeper understanding and adaptability are required for accurate change detection. In contrast, deep learning-based methods have become more appealing due to their promising performance. Deep learning methods leverage hierarchical feature learning and end-to-end training, allowing them to automatically extract intricate features from raw data. This capability enables deep learning models to adapt better to diverse and dynamic environmental conditions, leading to superior performance in remote sensing image change detection tasks. In fact, deep learning has emerged as the de facto state-of-the-art method for challenging remote sensing image change detection tasks.
In the literature, many deep learning-based methods adopt an encoder–decoder framework or Siamese architecture [5,6,7]. The encoder extracts change features, and the decoder aims to obtain changed regions by classifying change features [6,7,8]. Two commonly used encoders are CNN [7] and Transformer [8]. The CNN architecture can be considered as a regularized form of a multilayer perceptron, specifically designed with a profound inductive bias to learn representations that remain invariant to image translations. The Transformer architecture [9], with its self-attention mechanism, exhibits exceptional ability to model long-distance dependency in processing sequential data, which provides a unique advantage over CNN in capturing global information. In short, the sole usage of CNN or Transformer is limited in simultaneously capturing local detail and global information, and thus the combination of CNN and Transformer seems reasonable. To fully leverage the complementary advantages of both CNN architectures and Transformer architectures, researchers have explored a series of innovative strategies. Using large convolution kernels and deformable convolution [10,11,12] are two primary strategies. Large convolution kernels capture long-distance dependency by expanding the receptive field. However, this results in increased computational costs and overfitting. To balance the effectiveness and efficiency, dilated convolution [13] and depth-wise separable convolution [14] have been presented, which simulate large convolution kernels with reduced computational burden. Deformable convolution introduces extra learnable parameters to dynamically adjust the sampling positions of the convolution kernels and to better adapt to the spatial variation. Without significantly increasing computational costs, deformable convolutions effectively improve the model’s ability to model complex and irregular patterns, enhancing the capture of long-distance dependencies. By leveraging these strategies, researchers have been able to develop CNN models that combine the strengths of both CNNs and Transformers, offering improved performance in tasks that require modeling of long-distance dependencies while maintaining the efficiency of local feature extraction.
InternImage [12] is a fully CNN-based backbone network that employs deformable convolutions as its core operation, utilizing an efficient stacking strategy between layers to form the model. However, as a single-branch network, it is not directly suited for change detection tasks. When adapted into a dual-branch network, its overall performance in detecting change regions remains suboptimal, even with the use of DCNv3 for long-range modeling. Motivated by InternImage, which is a leading CNN-based change detection vision foundation model, in this paper, a novel Siamese InternImage model is proposed for change detection tasks. The main contributions of this paper can be outlined as follows:
- (1)
- A Siamese InternImage framework is proposed for change detection tasks. This represents the first CNN-based change detection vision foundation model and integrates the advantages of Siamese architecture and the merits of InternImage (e.g., reducing the inductive bias of traditional CNN, learning stronger and more robust feature representations via the large and effective receptive field, and integrating an adaptive spatial aggregation mechanism conditioned by inputs, etc.).
- (2)
- To compensate for the lack of local information, a refinement block is used to enhance local feature representation.
- (3)
- Channel attention is integrated into the InternImage model in order to model the temporal relationship and enhance the detection accuracy at different scales.
2. Related Work
To better understand the novelty of the proposed approach, this section reviews related work.
Typical change detection networks generally consist of a backbone network with an encoder, a decoder, and a feature fusion mechanism. The typical workflow involves using the backbone to extract features, then merging the encoder and decoder features through skip connections or explicitly designed modules to fuse features from bitemporal images. Beyond the need for the encoder to extract accurate spatial-temporal feature representations, change detection poses an additional challenge: effectively merging the bitemporal features to decode and reconstruct the regions of change. Researchers have explored various approaches for spatial–temporal feature extraction and fusion, primarily falling into two categories: CNN-based and transformer-based methods.
2.1. CNN-Based Change Detection Methods
Early CNN-based change detection methods simply used bitemporal fully convolutional networks, where the encoder extracted features, and skip connections were employed to fuse features between the encoder and decoder. Daudt [15] introduced three distinct architectures based on FCN, specifically designed for change detection tasks in remote sensing imagery. These architectures were developed to effectively capture and analyze temporal changes between bitemporal images, contributing to advancements within the specialized domain of remote sensing image analysis. Among them, FC-EF is a variant of the U-Net model that directly incorporates bitemporal patches by concatenating them along the channel dimension. The Siamese extensions of FC-EF, namely FC-Siam-conc and FC-Siam-diff, feature two parallel streams of encoding layers with identical structures and shared weights, as seen in traditional Siamese networks. Each of these streams processes a single image from the bitemporal images. The key distinction between FC-Siam-conc and FC-Siam-diff lies in the manner of handling skip connections during the decoding phase. Specifically, FC-Siam-conc combines the skip connections from both encoding streams by concatenating them, while FC-Siam-diff combines the absolute differences between corresponding features extracted from the two temporal images. This approach allows FC-Siam-diff to capture temporal differences more explicitly during the decoding process.
However, this type of method faces two major issues, which are also the main directions for improvement in subsequent research. The first issue is feature extraction, and the second is feature fusion. Regarding the first issue, these methods encode the bitemporal images independently, without considering the spatial–temporal dependencies between them during feature extraction [5]. To address this, STANet [5] an attention-based Siamese FCN method, was established so that spatial–temporal attention could be captured by the corresponding spatial–temporal attention extraction module. This approach utilizes a CNN architecture based on a Siamese network to capture and model the intricate relationships among various spatial–temporal pixels. Although these methods extract richer features, they rely on deep features and lose shallow features that contain fine-grained information, resulting in unclear boundaries. SNUNet [16] combines the Siamese network architecture with NestedUNet [17] to address the difficulty of preserving localization information in deeper layers. This fusion architecture utilizes efficient information transmission mechanisms between the encoder and decoder, as well as among different levels of the decoder, to enhance the network’s capability of accurately detecting and localizing change regions in bitemporal images. Change detection datasets typically suffer from class imbalances, and the aforementioned models lack robustness to pseudo-change regions. DASNet [18] was designed to solve the vulnerability of current methods to pseudo-changes through the implementation of a dual attentive fully convolutional Siamese network and the employment of a weighted double margin contrastive loss. The change detection results of these models often have unclear boundaries. Consequently, researchers have designed more refined modules to extract finer-grained features. Huang [19] introduced a Siamese neural network based on UNet improvement to address the issue of detail information loss stemming from feature misalignment. HANet [20] integrates features across various scales and refines detailed features based on hierarchical attention networks implemented by Siamese architecture. USSFC-Net [7] utilizes a multiscale decoupled convolution to reduce computational redundancy and introduce an effective spatial–temporal feature fusion strategy to generate richer and more comprehensive features. By capturing intricate details across various scales and dimensions, USSFC-Net improves the overall accuracy and robustness of change detection processes.
Regarding the second issue, IFNet [21] pointed out that the change detection network architecture was directly adapted from single-image semantic segmentation networks, which leads to several problems. In early fusion, the raw images are concatenated before entering the network, and then skip connections are used to fuse low-level and high-level information. This approach results in the loss of the deep features of the individual original images, which would help with image reconstruction, resulting in poor boundary recognition in the output. In late fusion, features from each image are extracted separately, and change detection results are obtained through difference discrimination. However, due to the gradient vanishing problem in deep networks, the gradient cannot be effectively propagated to the lower-level features, resulting in suboptimal feature representations. To address these challenges, IFNet [21] explores a bitemporal image feature fusion mechanism and proposes a deeply supervised image fusion network for change detection. Specifically, highly representative deep features of bitemporal images are first extracted through a fully convolutional two-stream architecture. Then, the extracted deep features are fed into a deeply supervised difference discrimination network (DDN) for change detection. To improve the boundary completeness and internal compactness of objects in the output change maps, multi-level deep features of raw images are fused with image difference features using attention modules to reconstruct the change maps. Changer [22] designed specialized modules and explored two feature fusion methods, aggregation–distribution and feature “exchange”, achieving excellent results. Recently, STNet [23] was developed, offering a refined mechanism for feature fusion that enhances both spatial and temporal information capture. It employs a temporal feature fusion (TFF) module with a cross-temporal gating mechanism to highlight significant changes, and a spatial feature fusion module with cross-scale attention to capture fine-grained spatial details. This dual-module design enhances the accuracy and robustness of detecting changes in remote sensing imagery.
2.2. Transformer-Based Change Detection Methods
Transformer-based methods for change detection primarily leverage self-attention and cross-attention mechanisms to improve spatial–temporal discrimination capabilities. Similar to CNN methods, Transformer architectures also emphasize cross-scale feature fusion between encoders and decoders while utilizing global information capture and fine-grained local feature modeling to enhance the precision and robustness of change detection. BIT [24] incorporates a bitemporal image Transformer (BIT) into a framework based on deep feature differencing for change detection. In this method, bitemporal images are represented as a sequence of tokens. A Transformer encoder is used to capture contextual information within this structured tokenized temporal framework. The encoder generates context-rich tokens, which are then processed by a Transformer decoder to refine the original features back into pixel space. BIT is not a purely Transformer-based architecture; it uses a ConvNet encoder to extract feature representations. ChangeFormer, as introduced in [25], removes ConvNets and integrates a hierarchical Transformer encoder, known for its deep understanding of structured data, with an MLP decoder, celebrated for its straightforward yet effective decoding capabilities. This integration occurs within the robust framework of a Siamese network, which excels at identifying similarities and differences between paired inputs. This architecture can capture detailed information across multiple scales, crucial for precise change detection tasks. However, CNNs are effective at extracting local features. BIT, as a hybrid model combining CNN and Transformer, benefits from improved efficiency, yet the direct information interaction between the CNN and Transformer is not well-considered [26]. ICIF-Net [26] introduces a novel method featuring an intra-scale cross-interaction and inter-scale feature fusion network that merges CNN and Transformer models. In this approach, CNN is responsible for extracting local features, while Transformer captures global features. These features interact at the same spatial resolution through a linearized conv attention module. Moreover, advanced attention-based techniques enable effective integration of information across various resolutions. The combined features are then processed by a traditional change prediction head to produce the final output. In addition, some recent novel methods have emulated the human visual process of observing changes to extract multi-scale information and have achieved excellent results. Zhou [27] proposed an innovative approach which uses the dual cross-attention-Transformer (DCAT) to emulate the human visual process of observing changes by interacting with and merging bitemporal features, and it extracts features at multiple scales and models patch-wise change relationships through a sequence of hierarchically structured dual cross-attention blocks (DCAB). Similar to CNN-based methods, there are also approaches that design specialized fusion modules to integrate different features, achieving impressive results. Zhu [28] presented an innovative approach centered on collaborative learning strategy for change detection tasks and semantic segmentation tasks. This technique utilizes a backbone network to extract multilevel bitemporal features, which are then processed by separate, dedicated decoders to independently learn change and semantic features layer by layer. An interactive fusion module (IFM) is subsequently used to merge these features, enhancing collaboration between the tasks.
In summary, the aforementioned methods either use CNNs composed of standard convolutions to extract local features and apply different kernel sizes for long-range modeling, or they employ pure Transformer methods to capture global features, supplemented by carefully designed modules to compensate for the Transformer’s limitations in extracting details. Some approaches use a hybrid of CNNs and Transformers to capture both local and global information. Additionally, they utilize explicitly designed feature fusion modules or multi-scale feature fusion between the encoder and decoder to achieve better feature representation. In contrast to these approaches, we propose a novel CNN architecture. Our method utilizes deformable convolutions, extending them to the CrosDCNv3 operation specifically designed for change detection. This allows for encoding features while simultaneously capturing global information and performing shallow feature fusion. Moreover, we employ an explicit feature fusion module to enhance feature representation. We also designed a refinement module to address the limitations of deformable convolutions in extracting local information.
3. Materials and Methods
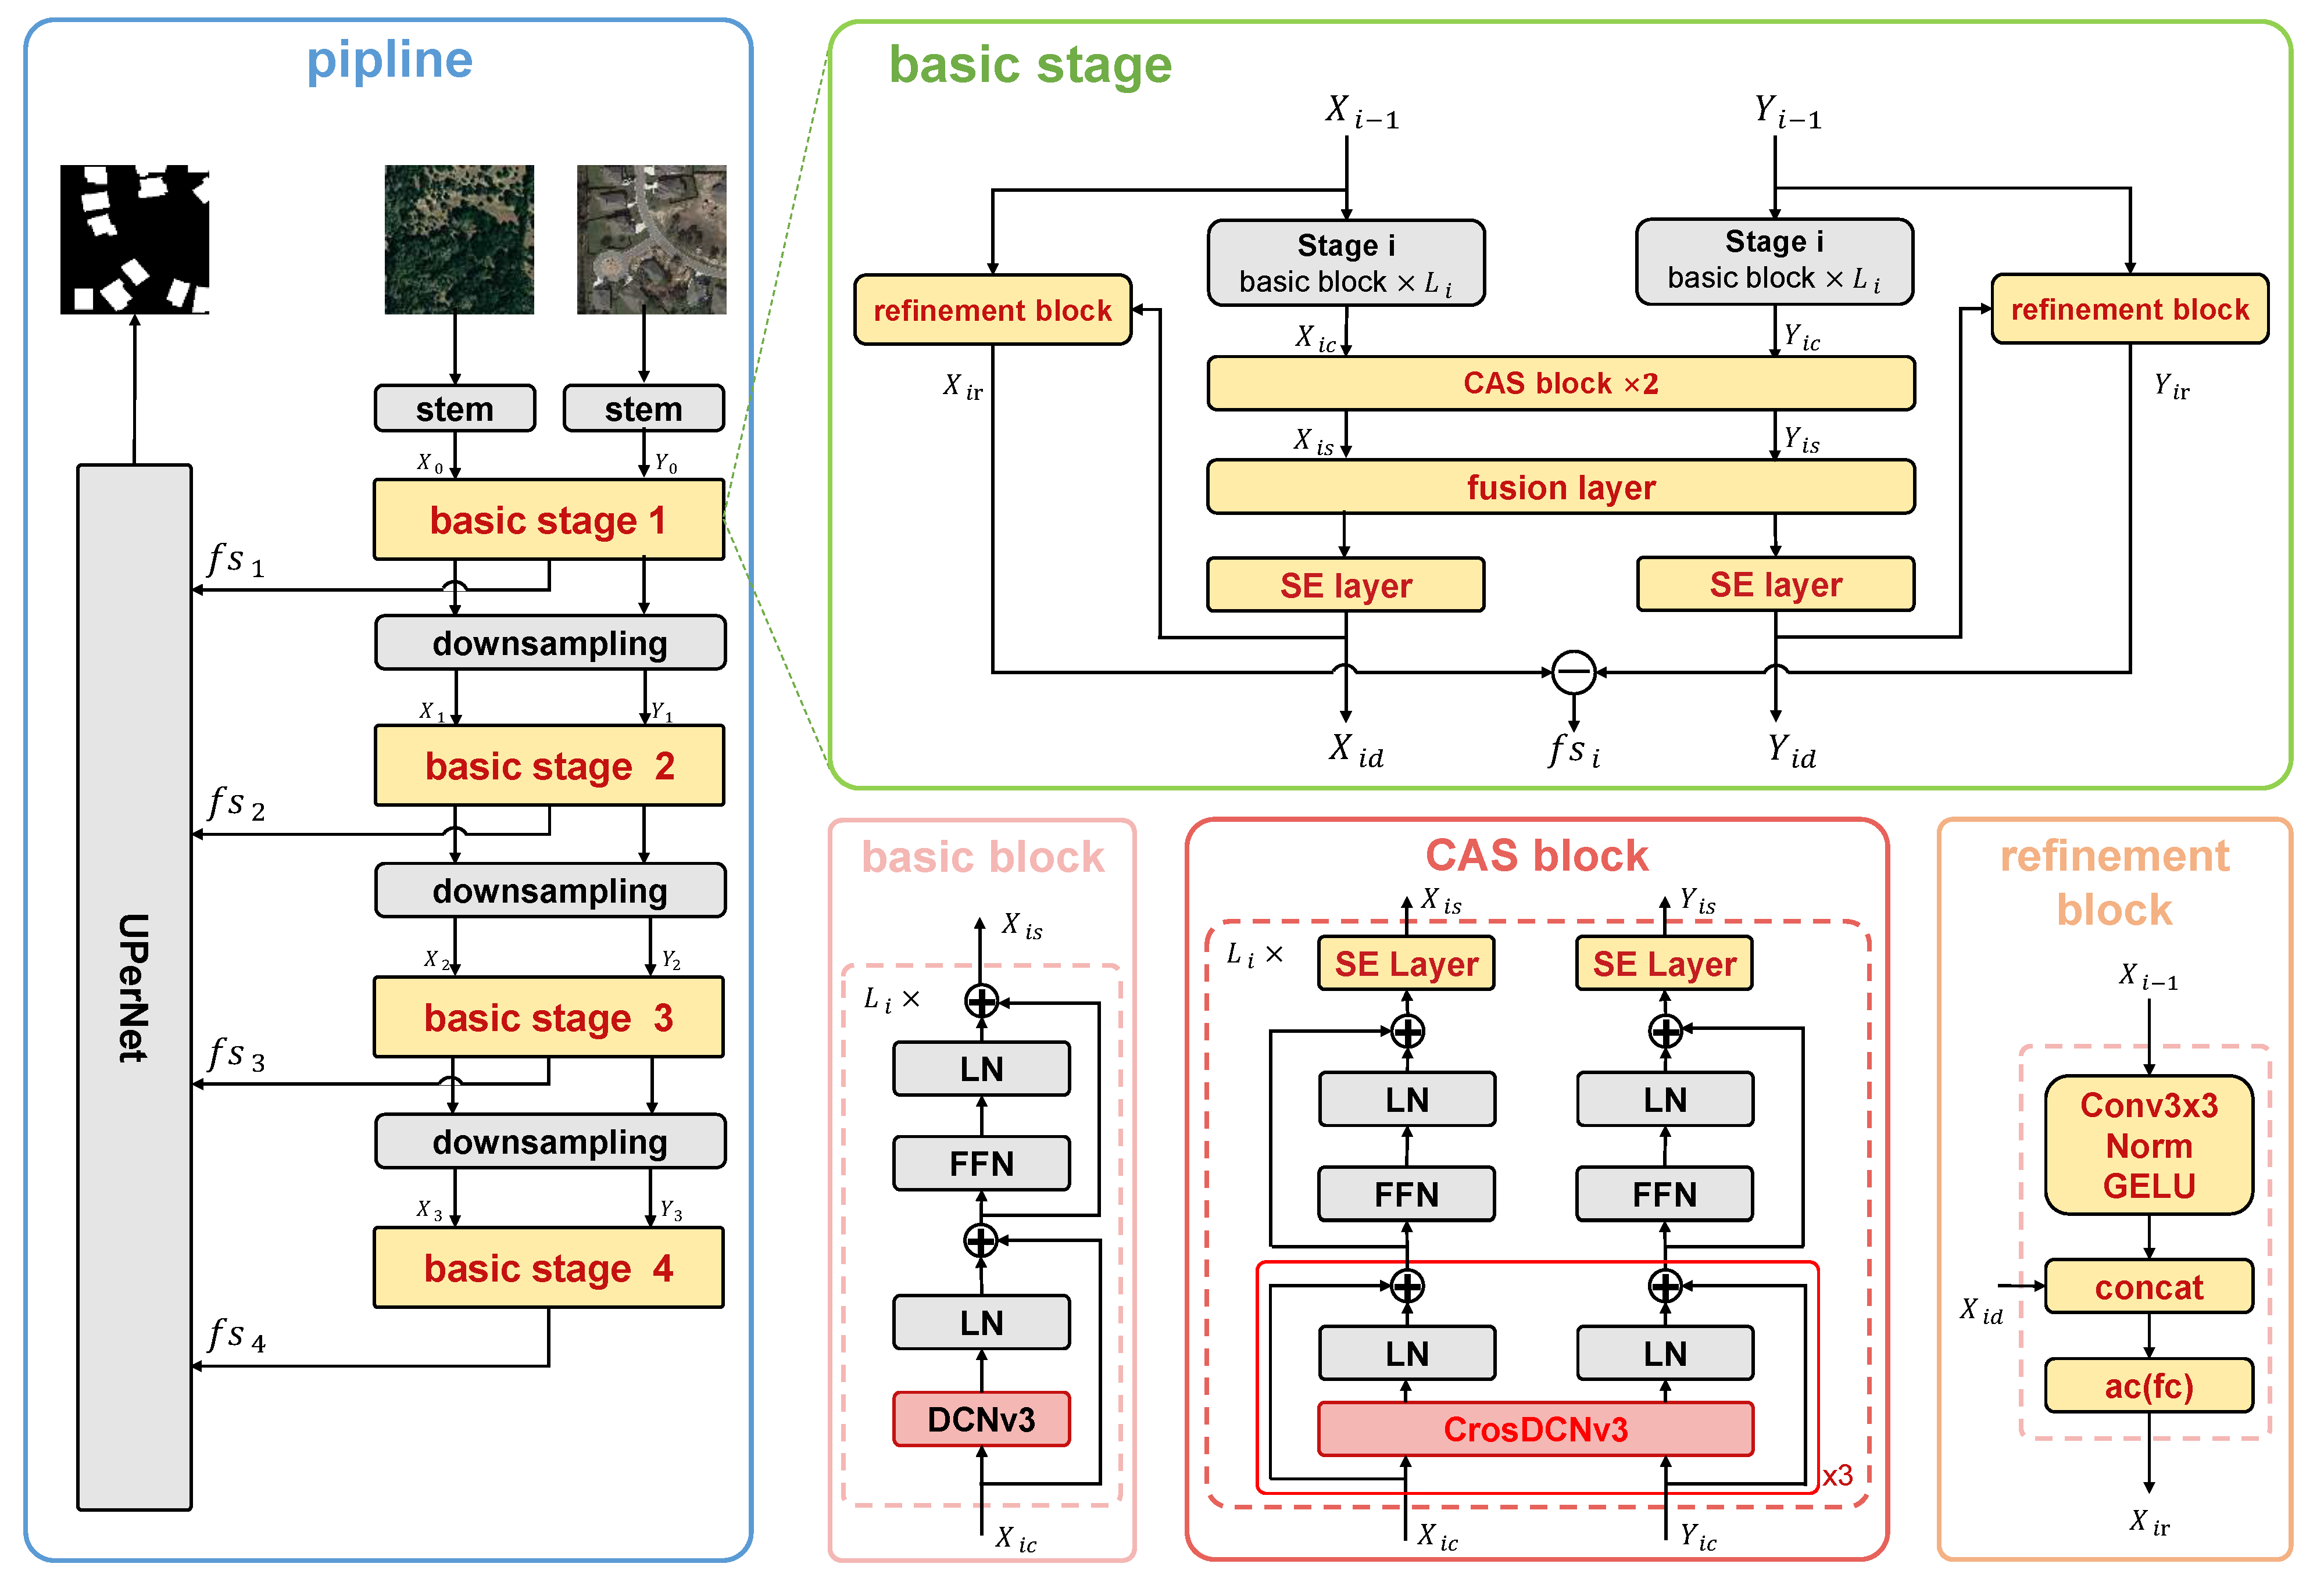
The rationale of the proposed approach is to learn representative features using a CNN-based foundation model, merge semantics changes and spatial details using multiscale fusion, and output change detection results via a segmentation head. As illustrated by Figure 1, the above rationale is achieved using stem, downsampling, basic stage, and UperNet. In the following section, the proposed approach will be comprehensively explained and detailed.
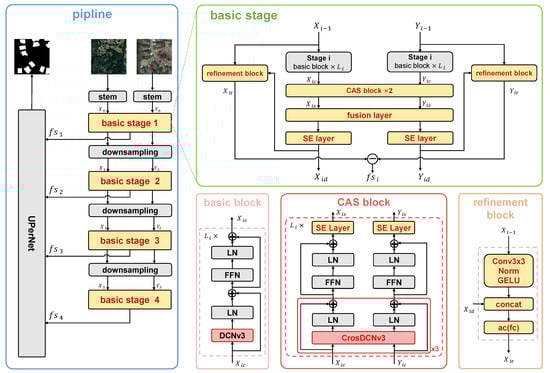
Figure 1.
The overall framework of the proposed approach. The common modules shared by InternImage and the proposed approach are filled in black, while the modules introduced by us for the change detection task are filled in yellow. Specifically, DCNv3 is extended to CrosDCNv3 for handling bitemporal images. A squeeze-and-excitation (SE) layer is introduced after CrosDCNv3 within each block to enhance the robustness of learned features and amplify feature representations per channel. According to the results of our ablation experiments, using CrosDCNv3 consecutively three times achieves the best performance. We designed a refinement module that uses standard convolution to extract local features, which are then concatenated with the output of the SE layer. The bitemporal features are subtracted, and the change features of different scales are achieved.
3.1. Stem and Downsampling Layers
To obtain hierarchical feature maps for the subsequent feature fusion, a convolutional stem block and a downsampling operation were employed to adjust the feature maps to different scales. These modules were the same as those in the original InternImage. Specifically, the stem layer, as illustrated in Figure 1, situated before the first stage, initially reduced the input resolution by a factor of four. This reduction was achieved through the application of two convolutional layers, each configured with a kernel size of 3, a stride of 2, and padding of 1. This layer also incorporated two layer normalization (LN) layers and a GELU activation function. These operations effectively prepared the input features for further processing and hierarchical feature extraction in subsequent stages of the model. The downsampling layer, positioned between stages, was used to halve the size of the input feature map.
3.2. Basic Stage
The basic stage aimed to learn the change features of different scales. The basic stage contained a basic block, a CAS(CrosDCN-And-Selayer) block, a fusion layer, an SE layer, and a refinement block.
3.2.1. Basic Block
The basic block was performed on the bitemporal images independently for subsequent feature fusion. The basic block was constructed by integrating the deformable convolution operator (e.g., DCNv3) with advanced components, including layer normalization (LN) and a feed-forward network (FFN). This combination leveraged the flexibility and adaptability of deformable convolutions to capture complex spatial dependencies, while the layer normalization ensured stable and efficient training by normalizing the input features. Additionally, the feed-forward network contributed by enhancing the representational capacity of the block, allowing for more complex feature transformations. The core operator of the basic block, DCNv3 [12], mitigated the inductive bias inherent in traditional CNN and simulated a Transformer in dynamically learning suitable receptive fields and enabling adaptive spatial aggregation. It is these merits that make CNN-based change detection vision foundation models outperform Transformer-based change detection vision foundation models with a smaller model size and more computational efficiency. For this reason, the basic block was used to learn the local information and long-range dependencies for our change detection tasks.
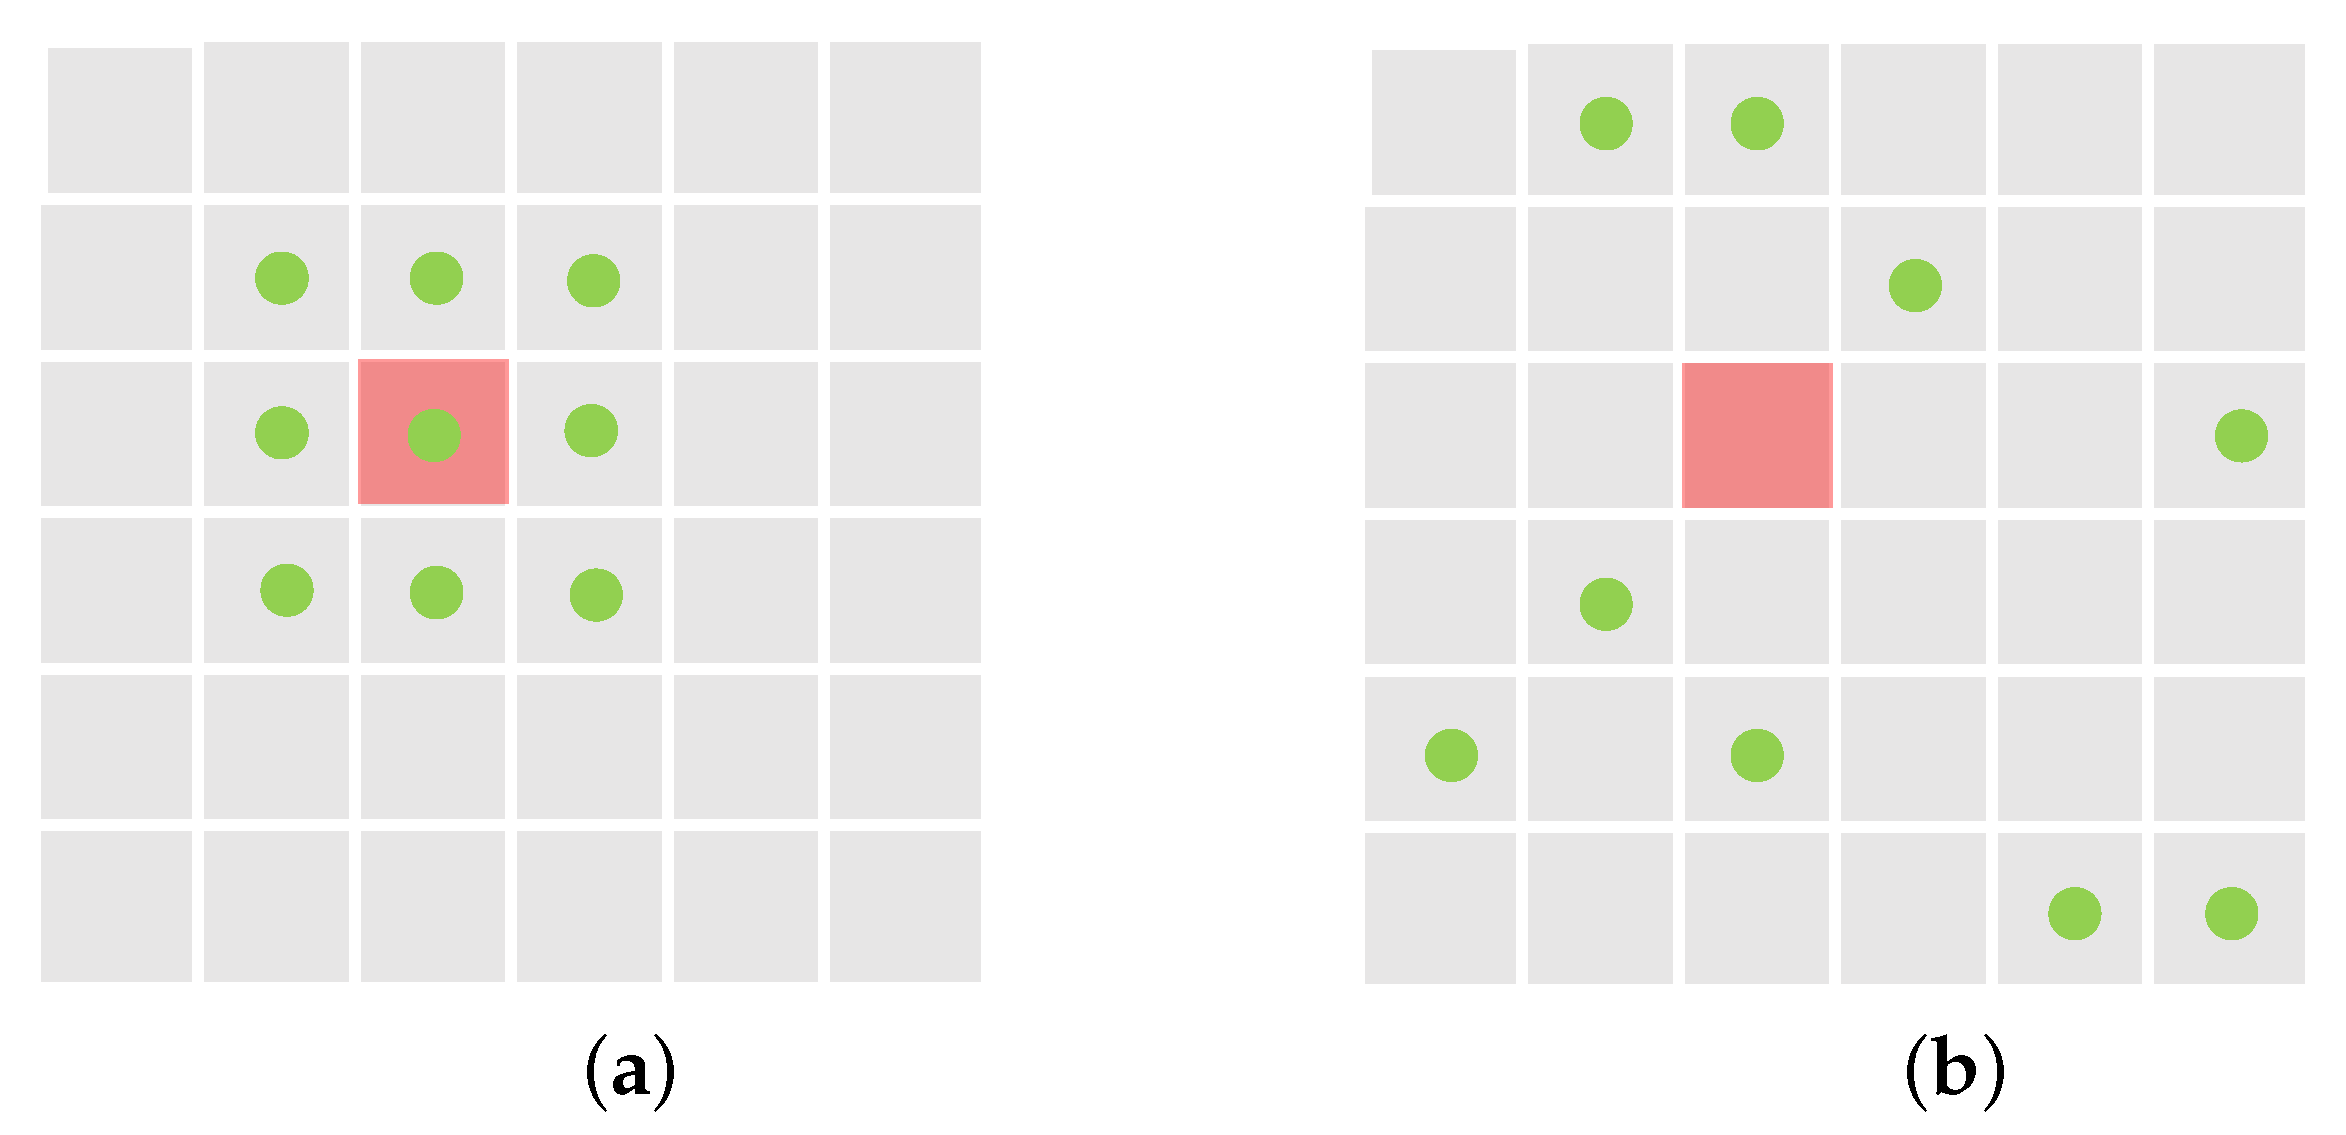
As illustrated in Figure 2a, in standard 2D convolution, the input feature map x is sampled using a regular grid R, with each sample weighted by w. For a kernel with the dilation factor 1, the grid R is defined as:
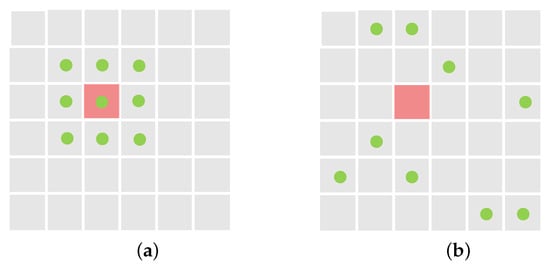
Figure 2.
Comparison of regular sampling locations and deformable sampling locations. (a) Regular sampling locations of standard convolution. (b) Deformable sampling locations. The red box indicates the location where the convolution is to be calculated, green points are sampling locations.
That is, the standard convolution can be expressed by the following formula:
As illustrated in Figure 2b, in deformable convolution, the regular grid R is augmented with offsets where . These offsets are learned through a neural network, which allows the convolution operation to adaptively adjust the sampling locations. This flexibility enhances the receptive field and provides spatial adaptability, enabling the network to better capture and represent spatial variations in the input feature map. By incorporating these learned offsets, deformable convolution can effectively handle irregularities and deformations in the input data, making it more robust to complex and diverse patterns compared to standard convolution.
Compared to the deformable convolution described above, DCNv2 introduces additional weights for each sampling point. Furthermore, DCNv3, as proposed in InternImage, builds upon DCNv2 by incorporating a grouping mechanism. The feature map outputted by DCNv3 at is defined by:
where G is the total number of aggregation groups. For the g-th group, the projection weight is location-independent, and denotes the group dimension. The modulation scalar for the k-th sampling point in the g-th group is denoted , which is normalized by the softmax function along the dimension K. The sliced input feature map is represented by . Furthermore, represents the offset corresponding to the grid sampling location in the q-th group.
Despite the basic block using DCNv3, we dod not use DCNv3 directly in our proposed module. Instead, to accommodate the needs of bitemporal image input for change detection, we extended DCNv3 to CrosDCNv3. Details of this extension will be provided in Section 3.2.2.
3.2.2. CAS Block
Change detection requires bitemporal images as input because changes are identified by comparing corresponding locations in both images. DCNv3, designed for single-image input, cannot be applied directly to bitemporal images. Using DCNv3 separately on each image is also inadequate, as it would cause each instance to learn different sampling points independently, without integrating information from the corresponding image. Since change detection relies on comparing content between images, not just analyzing individual images in isolation, we needed an approach that determined sampling point offsets by considering both images simultaneously.
As depicted in the bottom right portion of Figure 1, DCNv3 was extended to CrosDCNv3. Specifically, CrosDCNv3 is defined as follows:
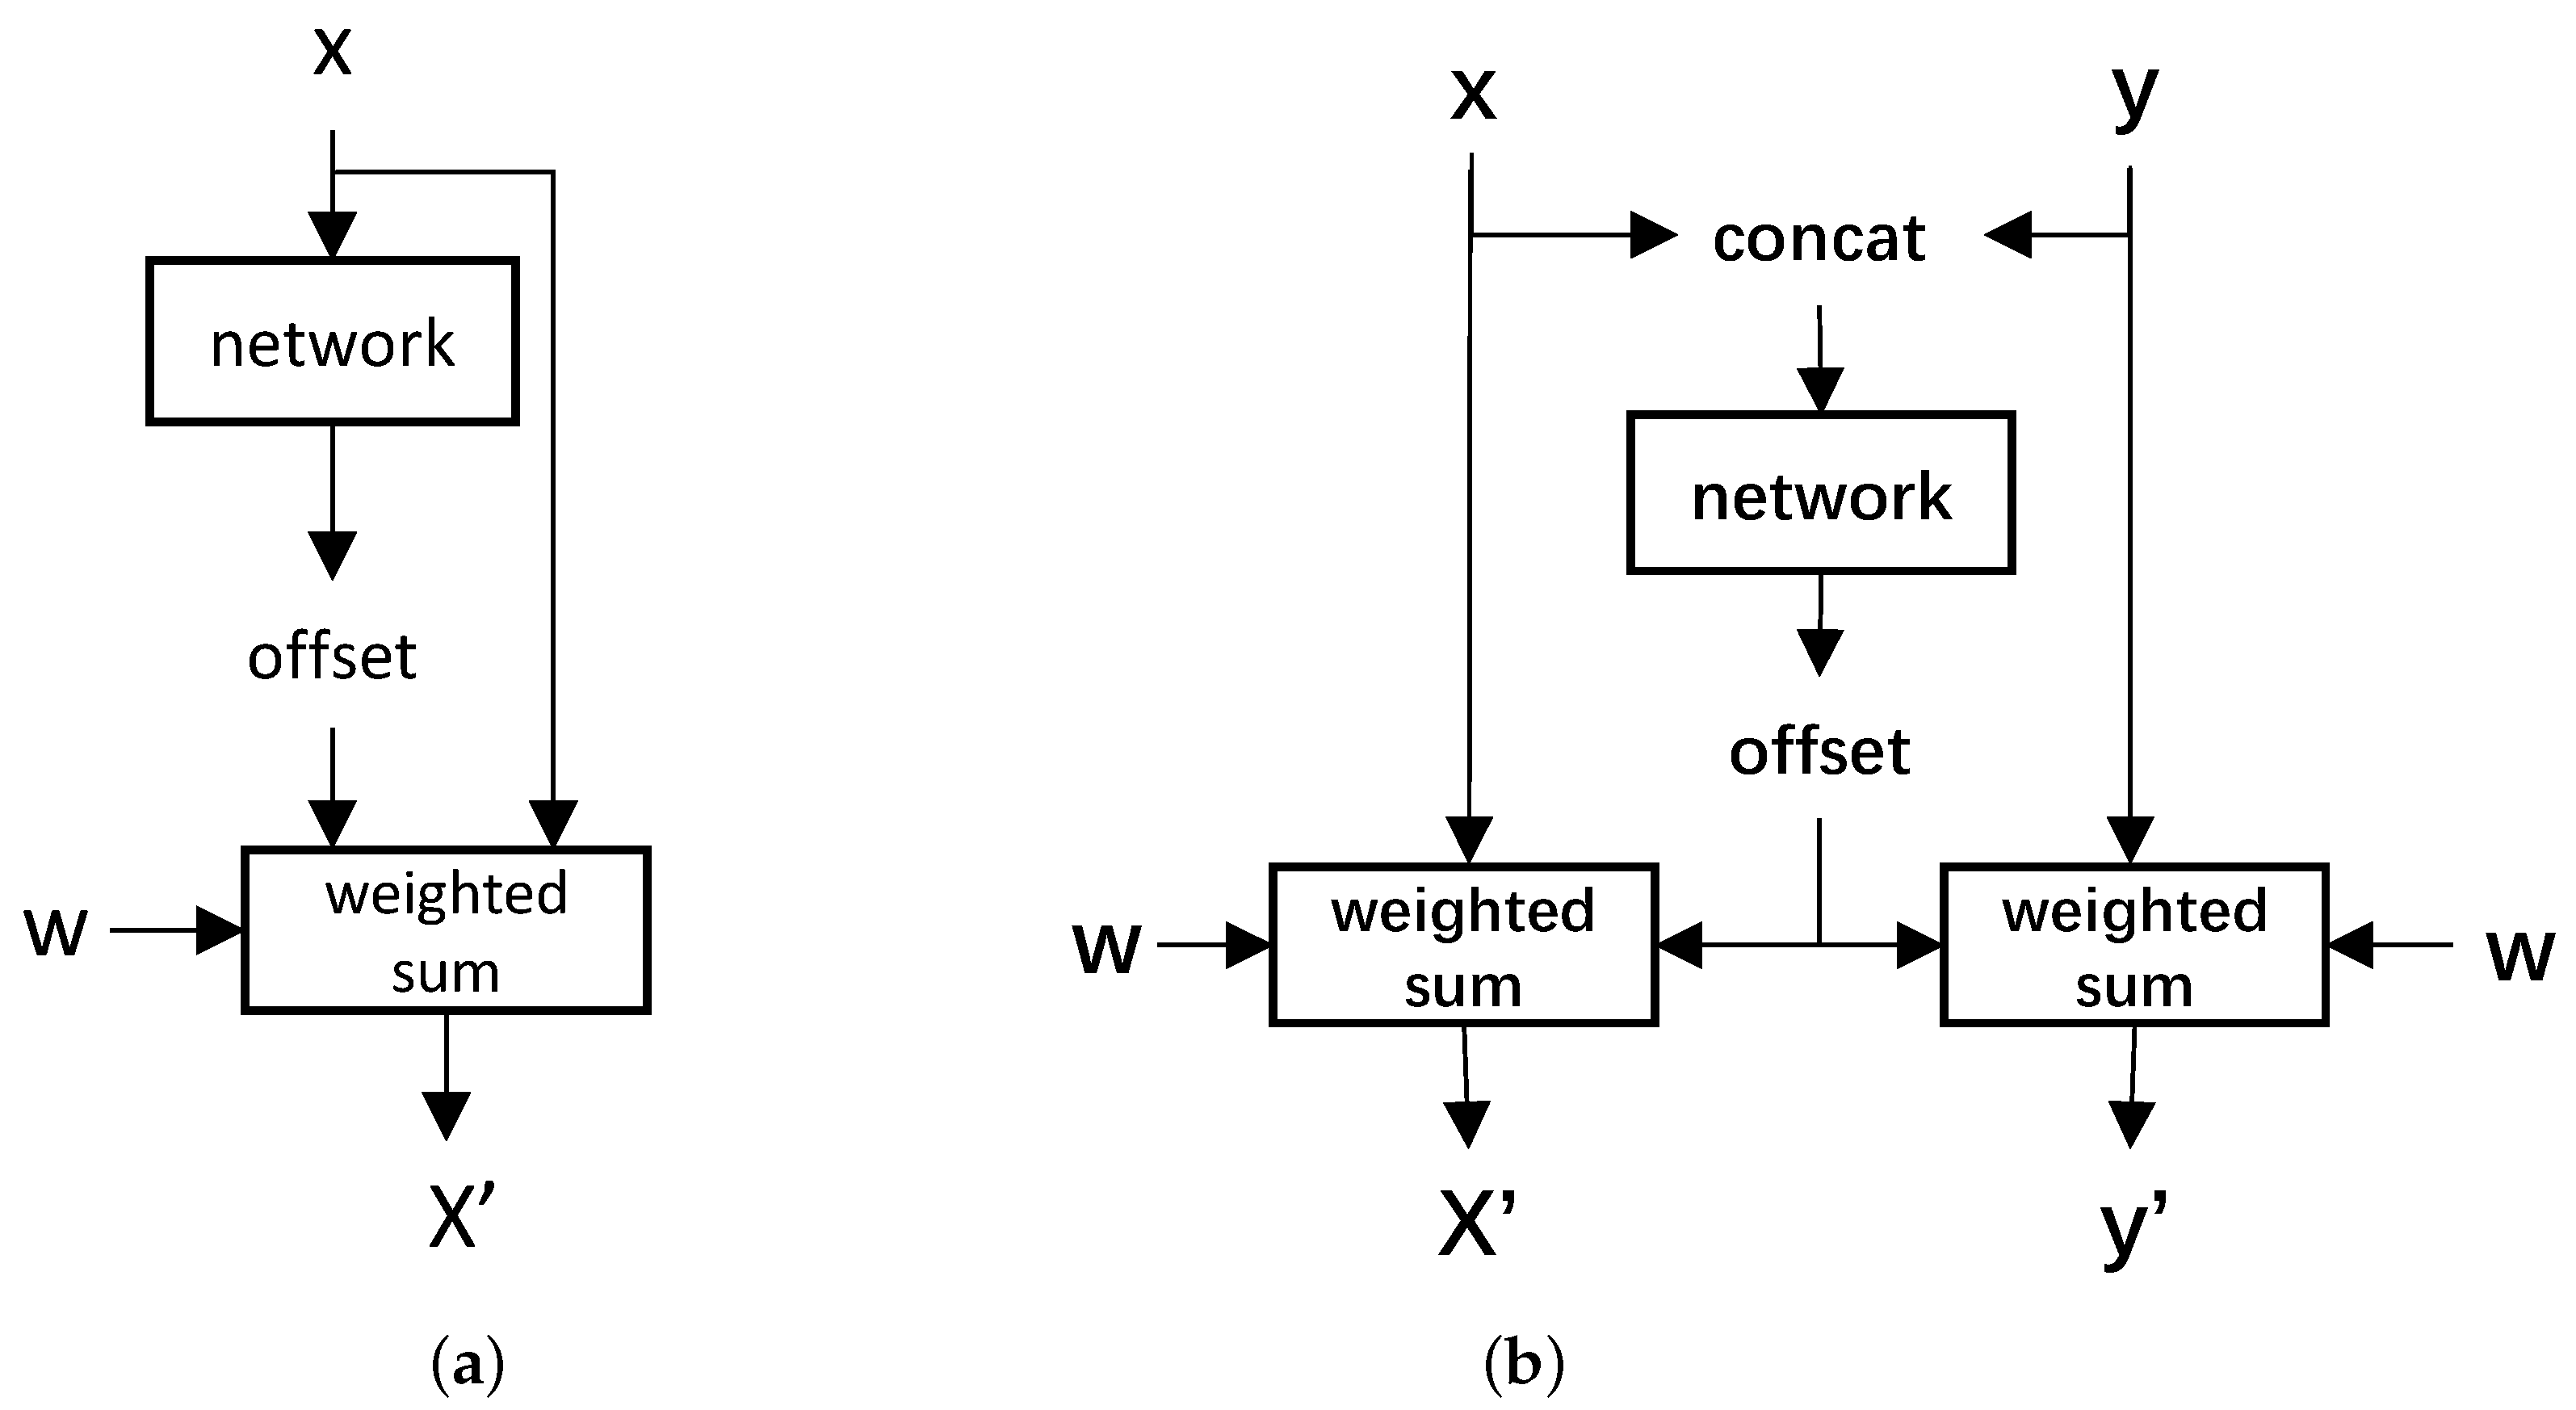
Different from Equation (3), the offsets in Equation (4) were learned from bitemporal images. Specifically, as illustrated in Figure 3, In DCNv3, linear layers learn offsets based on features from a single image. In contrast, CrosDCNv3 concatenates features from bitemporal images before feeding them into linear layers to learn offsets. After the offsets are learned, the convolution operation is performed separately on each image, as seen in Equation (3).
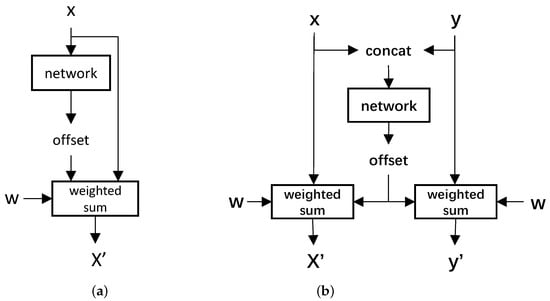
Figure 3.
Comparison of DCNv3 and our CrosDCNv3. (a) DCNv3. (b) CrosDCNv3. In DCNv3, linear layers learn offsets based on features from a single image. In contrast, CrosDCNv3 concatenates features from bitemporal images before feeding them into linear layers to learn offsets. After the offsets are learned, the convolution operation is performed separately on each image.
As illustrated by Figure 1, our approach differs from the basic block of InternImage by using three consecutive CrosDCNv3 operations in each CAS block, rather than a single DCNv3. An ablation study, detailed Section 4.3.2, demonstrated that using three layers achieves the best performance. This is because learning precise offsets from bitemporal images is more challenging than from single images. The use of consecutive CrosDCNv3 layers helped refine feature sampling points, enhancing the network’s ability to detect subtle and irregular changes across the two temporal images.
It is important to note that the CAS block considers information from both bitemporal images, extracting features based on their combined input. This is especially useful for capturing features in regions where changes have occurred. Generally, there are two types of building changes: the addition or removal of a building between the bitemporal images, and variations in the building’s appearance. The first scenario is far more common than the second, and this imbalance makes it challenging for some models to distinguish between these cases. As shown in the first row and the third row of the visualization results in Section 4.2.2 our design allowed the model to effectively extract features by analyzing both images, enabling it to model various change detection scenarios. In the visualization results of Section 4.2.2 the change areas in the first and third rows are almost identical in shape, and neither are small regions. However, it is evident that most models performed worse on the first row, mistakenly identifying unchanged areas, specifically regions with buildings, as changes. The key difference between the two images was that in the first row, aside from the actual changes, there was a large area where the building’s color had slightly shifted over time, making it much more challenging for models to identify compared to the third row. Our model, using CrosDCNv3, was able to extract robust features and accurately distinguish between these two types of changes.
Additionally, the SE (squeeze-and-excitation) layer, integrated into the CAS block, enhanced feature extraction through channel attention. The SE layer captured global information from the feature maps using a squeeze operation and adaptively learned the importance of each channel through an excitation operation, assigning different weights accordingly. In the CAS block, CrosDCNv3 was applied to the bitemporal images to extract change features, followed by the SE layer, which selectively emphasized the most informative features. As shown in the experiments section, incorporating the SE layer significantly boosted performance.
3.2.3. Refinement Block
As shown in Figure 2, in a standard convolution operation, each pixel’s feature is computed as a weighted sum of its neighboring features, capturing local information but lacking global context. On the other hand, deformable convolution computes the weighted sum of features from any position across the entire feature map, capturing global information but missing local details. To address this, we proposed a refinement block that specifically captures the local features overlooked by both DCNv3 and CrosDCNv3.
An intuitive way to enhance the details captured by deformable convolution is to apply a standard convolution to each sampling point using its nine neighboring pixels before performing the weighted summation. However, this would introduce significant computational overhead. Instead, we adopted a more efficient approach by extracting fine-grained information at the stage level. Specifically, for each feature, we used standard convolution to capture local details and deformable convolution to extract global context, then concatenated and fused the two outputs. As illustrated in Figure 1, the input to the basic stage was first passed through a standard 3 × 3 convolution layer, followed by normalization and activation. This captured local information, which was then concatenated with the output of the basic stage. The combined features were then processed through a linear layer and GELU activation. This approach enabled the model to effectively detect changes across regions of varying sizes.
3.3. Fusion Layer
At each stage, the fusion layer was designed to integrate bitemporal features, using the fusion method from [22]. Specifically, the bitemporal features were individually shuffled along the channel dimension, then concatenated and scaled by corresponding weights. This approach enhanced the integration of temporal information while maintaining spatial relationships in the data.
3.4. SE Layer
The SE layer leveraged squeeze and excitation operations to adaptively learn the interdependencies between feature channels. In the squeeze phase, global average pooling compressed the spatial dimensions of the feature map into channel-wise statistics, providing a compact summary of spatial information for each channel. During the excitation phase, two fully connected layers were employed: the first layer reduced the channel dimensionality, enabling focused extraction of channel-wise relationships, while the second layer restored the representation to its original size, preserving the richness of the feature map. The resulting vector was then used to scale each channel of the original feature map through channel-wise multiplication, effectively modulating the feature responses. By aggregating information during the squeeze stage and capturing channel dependencies in the excitation stage, the SE layer suppressed less important features and enhanced the more relevant ones.
Additionally, we discovered an interesting phenomenon: while the SE (squeeze-and-excitation) mechanism was initially developed for single-image recognition tasks, it also showed remarkable effectiveness in enhancing change detection performance. Incorporating SE mechanisms into well-designed change detection models significantly boosts their performance. This was confirmed through ablation studies across various models, underscoring SE’s potential to advance change detection research.
3.5. UperNet
At each stage, change features were obtained by subtracting the refined bitemporal features. These change features at various scales were then fed into UperNet [29] for change region segmentation. UperNet builds upon the Feature Pyramid Network (FPN) [30] by integrating the Pyramid Pooling Module (PPM) from PSPNet [31] into a multilayer pyramid architecture with lateral connections. This setup allows UperNet to capture multiscale information while effectively incorporating global context, and to combine features from different scales for improved segmentation.
4. Results
4.1. Experiment Settings
We conducted experiments using the LEVIR-CD and WHU-CD datasets to thoroughly evaluate the proposed method. All images were resized to ; the weight decay was 0.2, and the batch size was 4. Additionally, we recalculated the mean and variance of the dataset for image normalization. Other experimental settings followed the InternImage-T protocol. Our code will be available at https://github.com/jingsl5/SiamIntCD, accessed on 1 June 2024.
To assess the performance of change detection, we utilized Precision, Recall, F1 score, and IoU as evaluation metrics. These metrics were selected because they provide a comprehensive evaluation of the methods’ effectiveness. Specifically, the F1 score provides a balanced evaluation of precision and recall, crucial for evaluating classification performance. IoU quantifies the intersection over union between predicted and ground truth regions, providing a comprehensive evaluation of segmentation accuracy and localization precision. For comparison, we have selected several related methods to benchmark against our proposed approach.
- (1)
- FC-EF [15]. FC-EF is a variant of the U-Net model that directly incorporates bitemporal patches by concatenating them along the channel dimension.
- (2)
- FC-Siam-Conc [15]. The Siamese extensions of FC-EF feature two parallel streams of encoding layers with identical structures and shared weights, as seen in traditional Siamese networks. FC-Siam-conc combines the skip connections from both encoding streams by concatenating them.
- (3)
- FC-Siam-Diff [15]. The Siamese extension of FC-EF features two parallel streams of encoding layers with identical structures and shared weights, as seen in traditional Siamese networks. FC-Siam-diff combines the absolute differences between corresponding features extracted from the two temporal images.
- (4)
- USSFC-Net [7]. USSFC-Net utilizes a multiscale decoupled convolution to reduce computational redundancy and introduce an effective spatial–temporal feature fusion strategy to generate richer and more comprehensive features. By capturing intricate details across various scales and dimensions, USSFC-Net improves the overall accuracy and robustness of change detection processes.
- (5)
- HANet [20]. HANet integrates features across various scales and refines detailed features based on an hierarchical attention network implemented by Siamese architecture.
- (6)
- STNet [23]. STNet proposes a temporal feature fusion module and spatial feature fusion module to capture temporal information and fine-grained spatial information, respectively.
- (7)
- BIT [24]. BIT is a Transformer-based model that utilizes a CNN to extract features, and then utilizes a Transformer encoder–decoder architecture to learn and extract contextual information, and finally predicts change detection results through a shallow CNN.
FC-EF, FC-Siam-Conc, FC-Siam-Diff, USSFC-Net, HANet, and STNet are CNN-based methods, and BIT is a Transformer-based method.
4.2. Experiments Analysis
In this section, we provide a detailed analysis of our model’s experimental results on the LEVIR-CD and WHU-CD datasets, along with a comparative evaluation against other models.
4.2.1. LEVIR-CD
The quantitative results of various methods on the LEVIR-CD dataset are summarized in Table 1.

Table 1.
Performance comparison of different methods on LEVIR-CD dataset.
Based on Table 1, it is evident that the proposed method demonstrates superior performance compared to other approaches based on the Recall, F1 score, and IoU metrics. Specifically, on the LEVIR-CD dataset, our method achieves an F1 score of and an IoU of , surpassing other models. Notably, our method exceeds on all three metrics—Precision, Recall, and F1 score—and also surpasses other methods in IoU. Other models fail to reach this threshold. Even for more recently researched techniques like DDLNet, its Recall was only , whereas our method achieves a Recall of . To further illustrate how the proposed approach outperforms other methods, the visual results from different approaches are depicted in Figure 4.
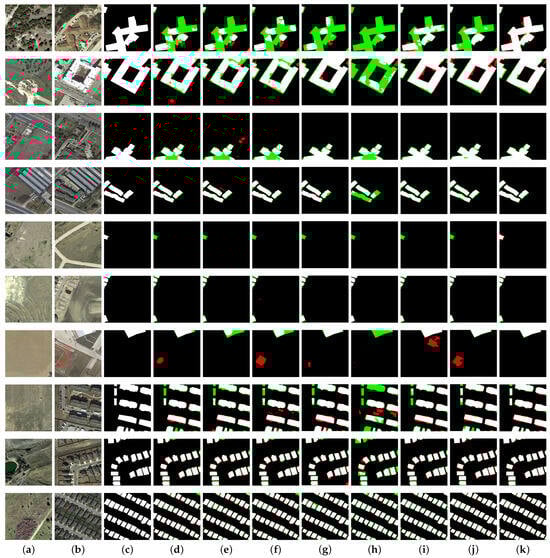
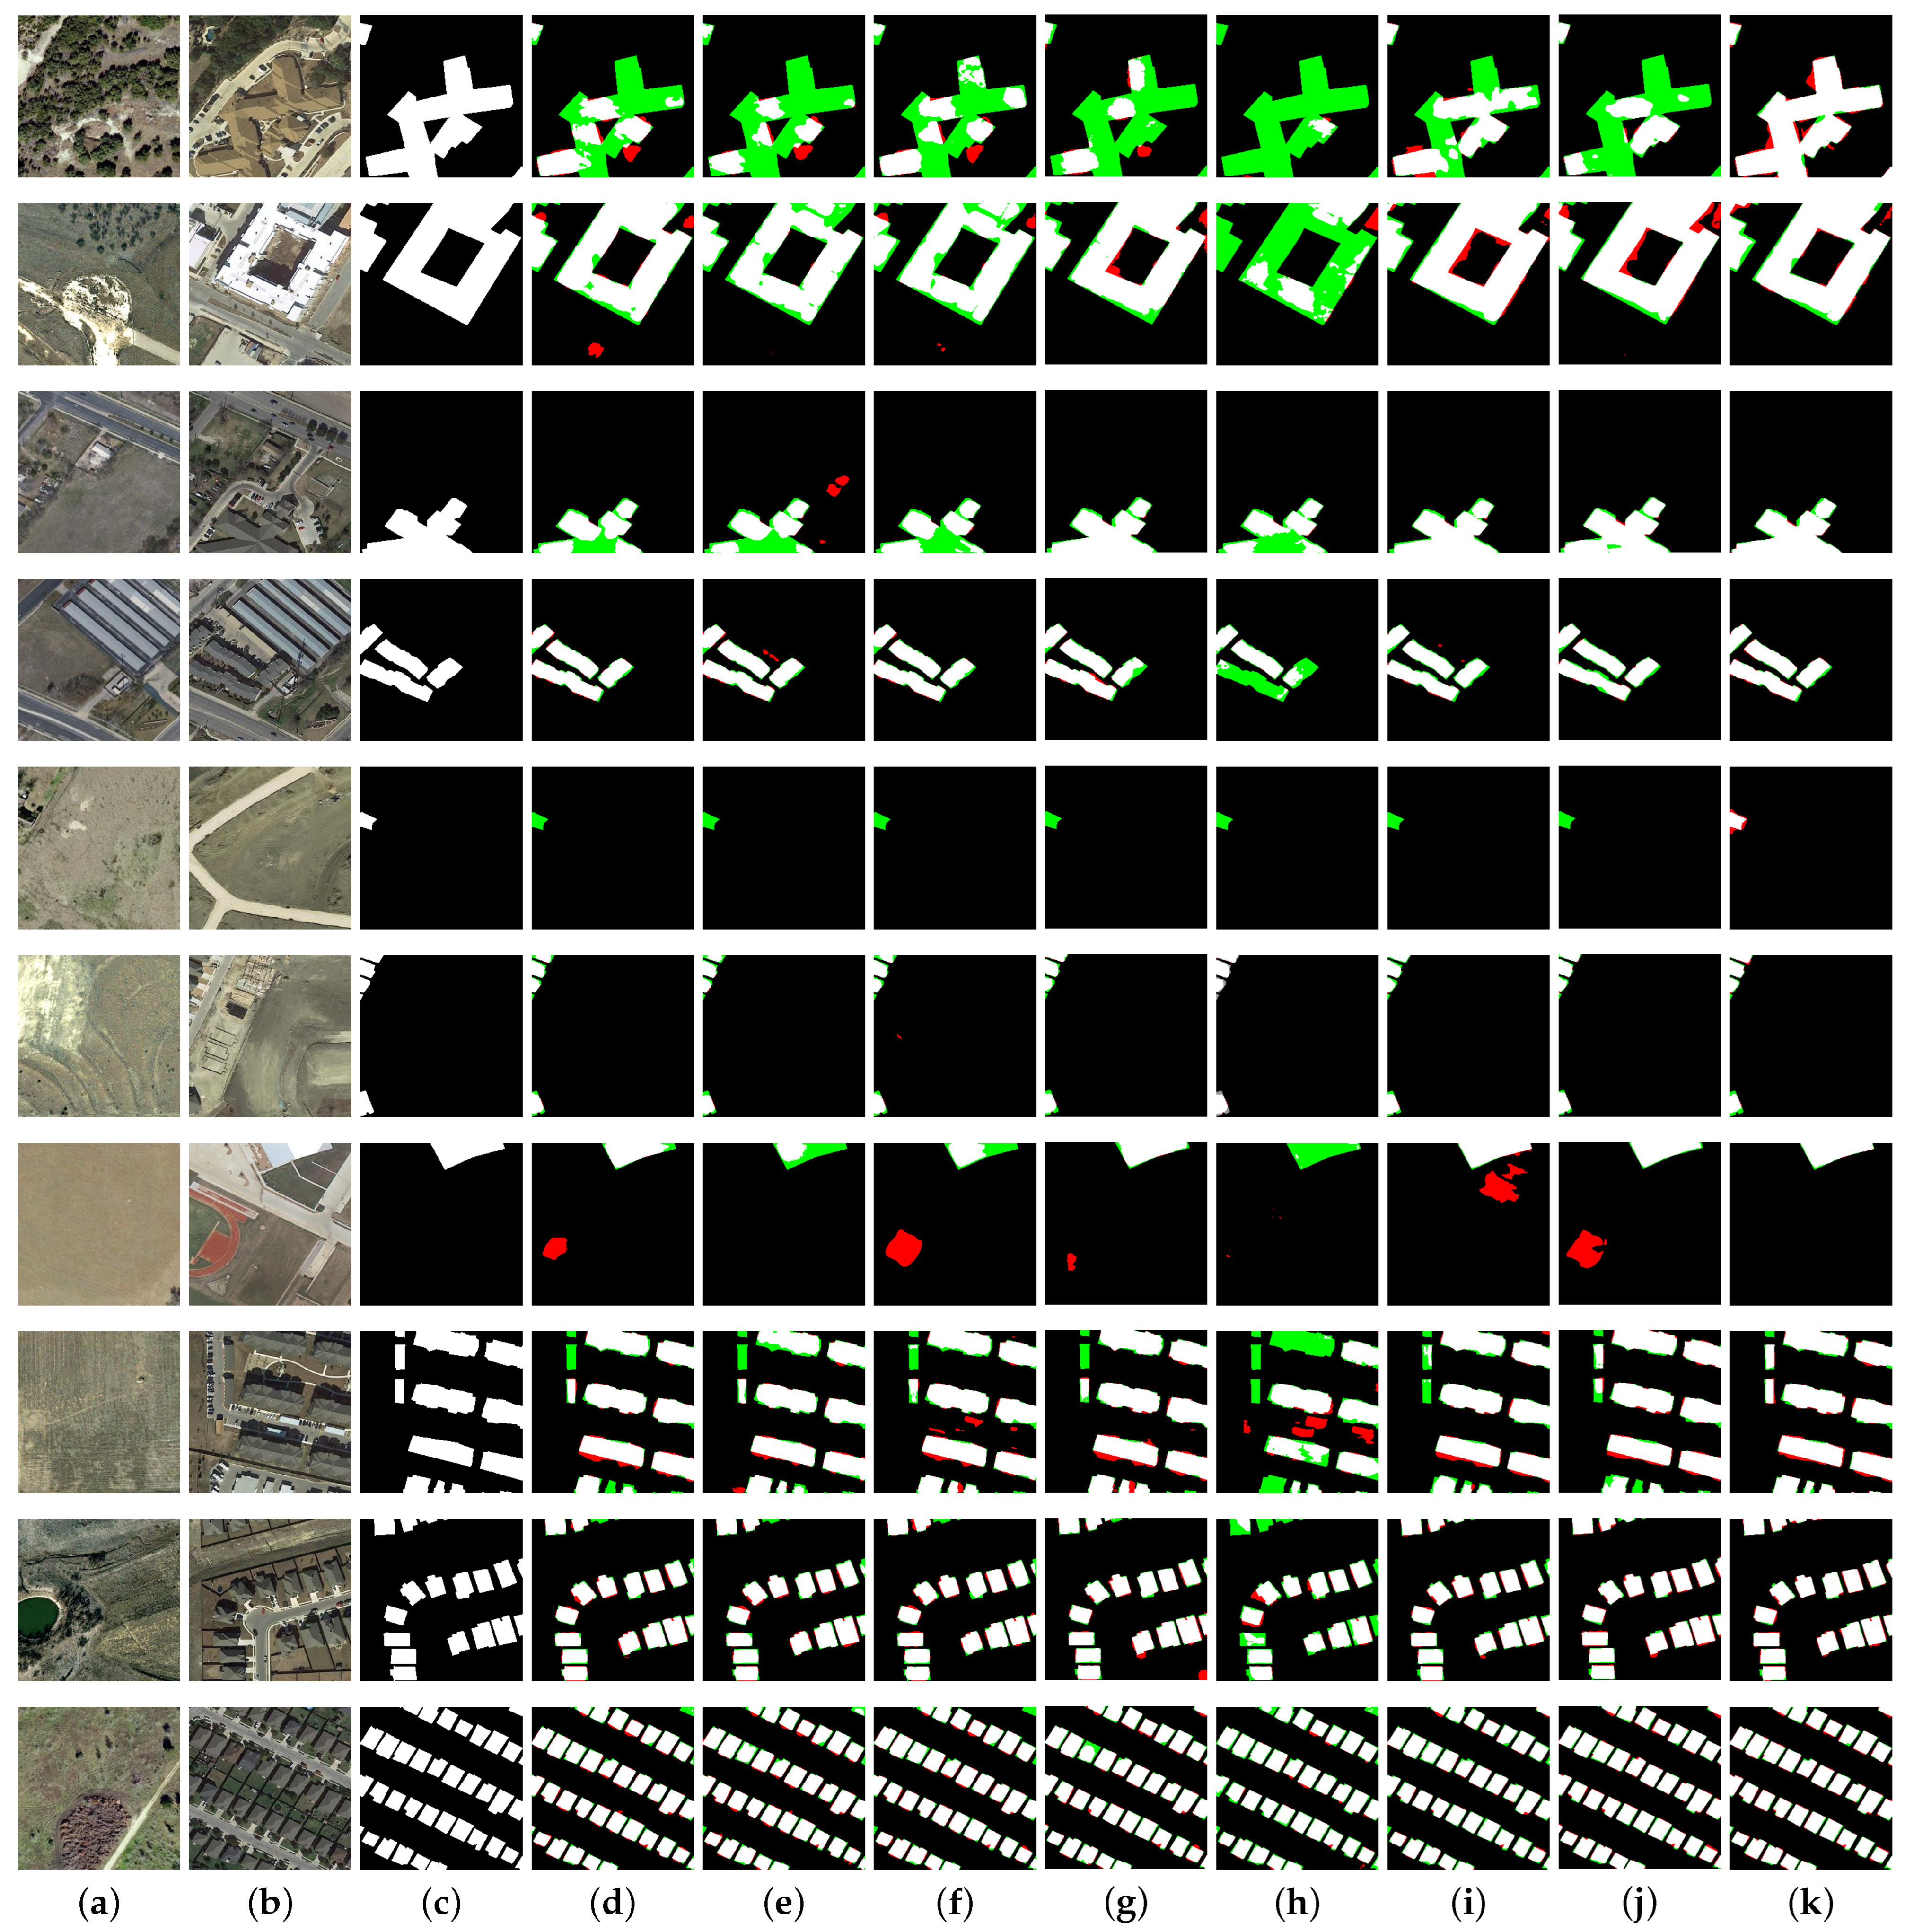
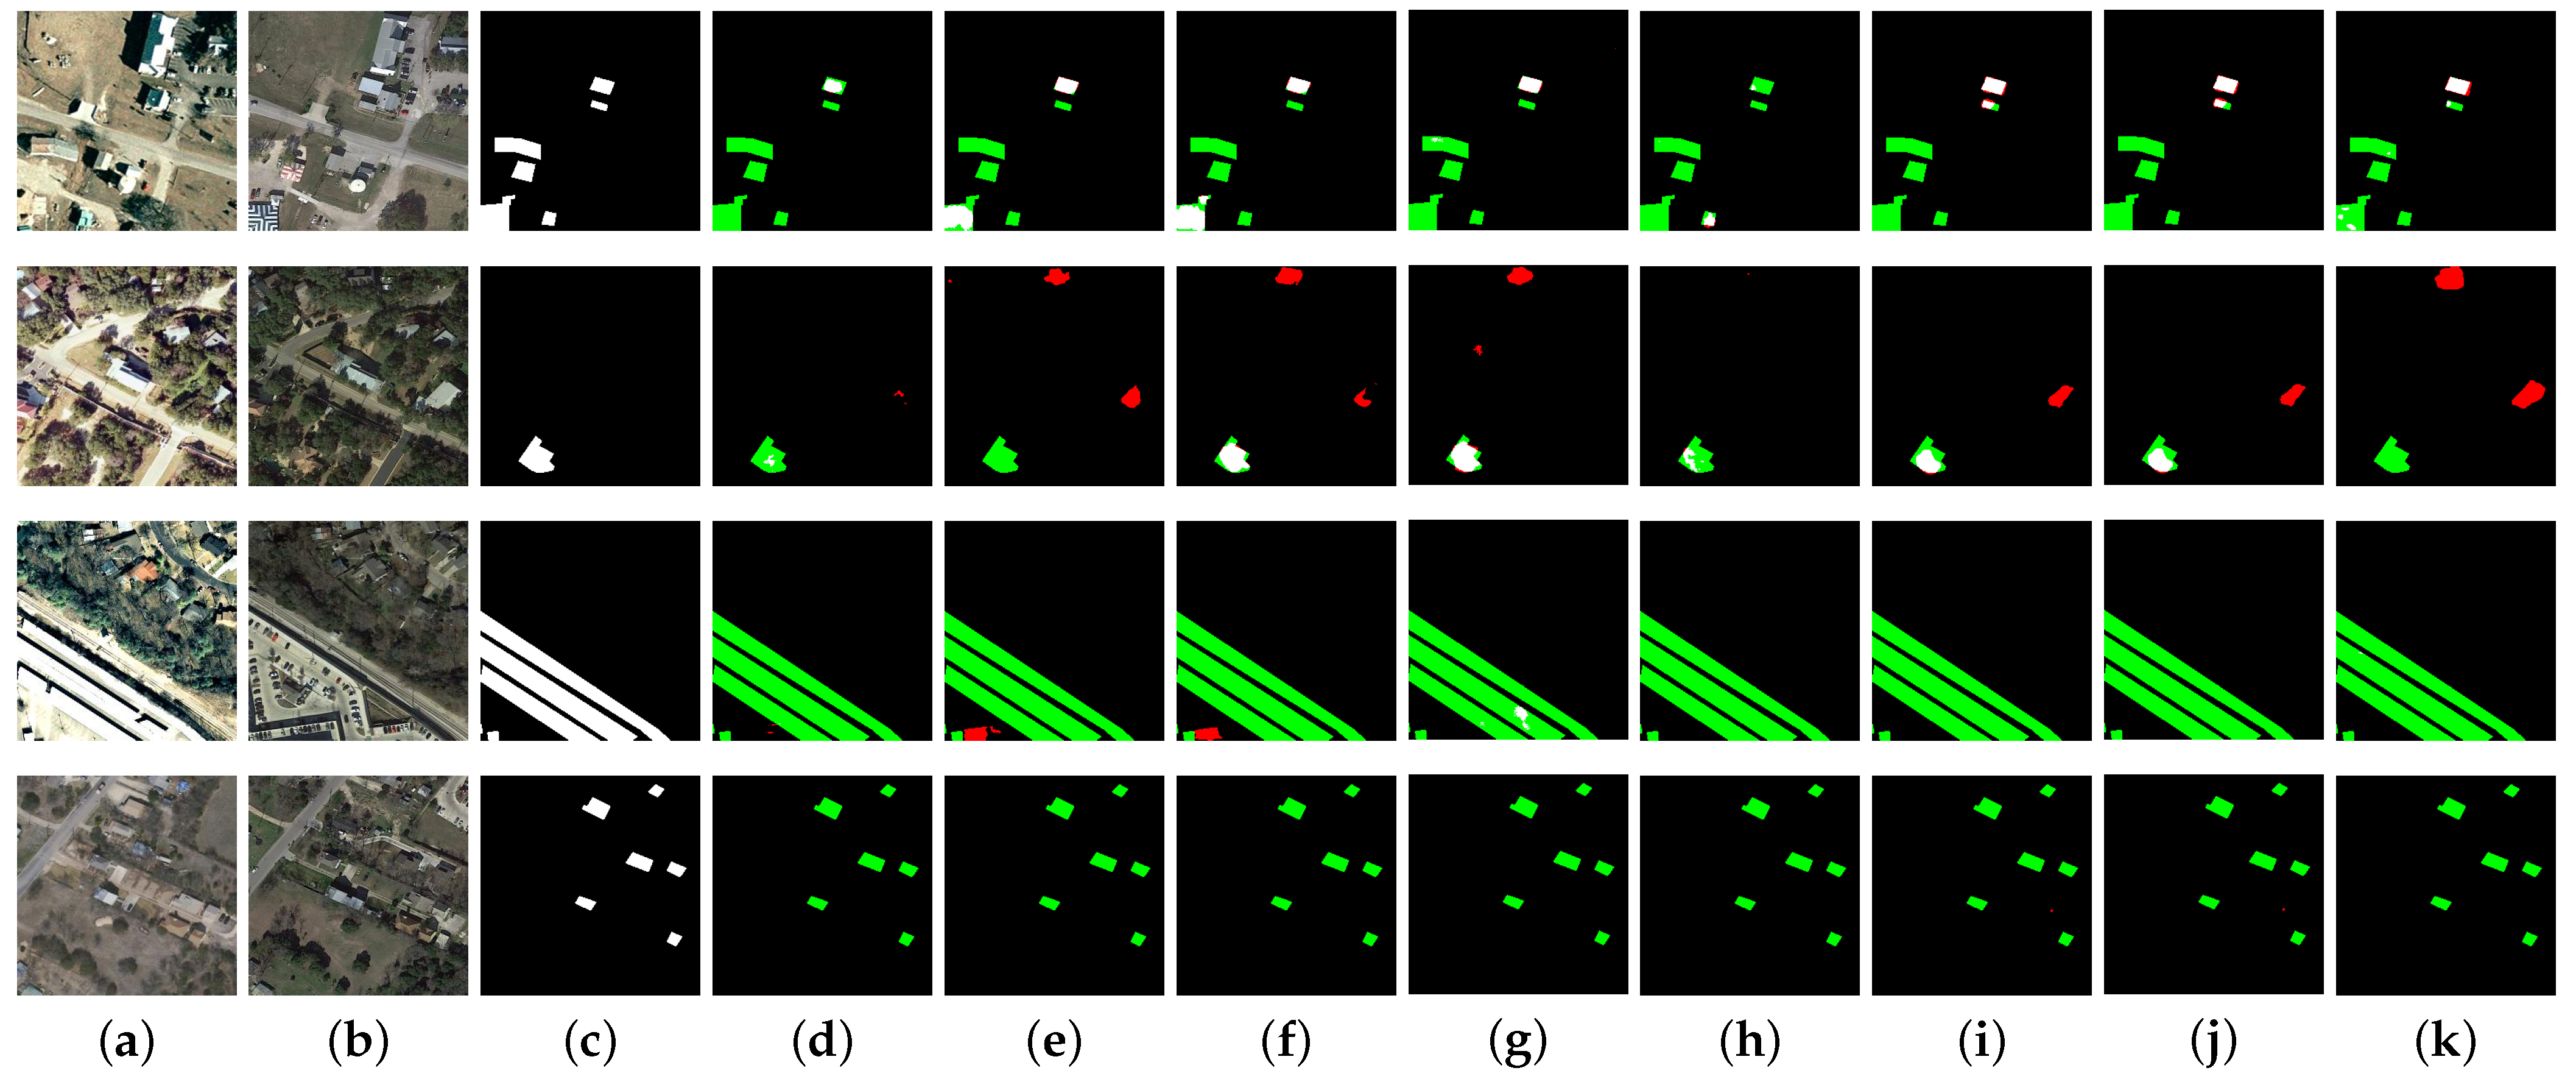
Figure 4.
Visualization comparison on the LEVIR-CD dataset: false positives are indicated in red, and false negatives are represented in green. (a,b) bitemporal images; (c) GT; (d) FC-EF; (e) FC-Conc; (f) FC-Diff; (g) USSFC-Net; (h) HANet; (i) STNet; (j) BIT; (k) ours.
In our experience, detecting irregularly shaped regions in building change detection is particularly challenging, whereas more regular areas with smaller aspect ratios are easier to identify. To showcase the strengths of our model, we present several challenging examples in Figure 4. Our model demonstrates exceptional performance on these difficult cases. Firstly, our model shows robust performance in detecting irregular shapes, as evidenced in the first three rows of Figure 4. Notably, the example in the first row is particularly challenging, with few models managing to fully identify the change area. However, our model not only detects the change accurately, but also delineates the boundaries clearly without major errors. For small, irregular areas, such as those in the third and fourth rows, our model successfully recognizes them with high precision. Secondly, our method excels in capturing global information and identifying large change areas, outperforming other models significantly. This is well-demonstrated in the first two rows of Figure 4. Thirdly, our model excels at accurately detecting very small isolated change areas and small change areas located at the edges of images. The fifth row of Figure 4 illustrates isolated small change areas at the image edges, which are challenging for other models to detect, but are accurately identified by our model. The sixth row of Figure 4 displays dense small change areas at the edges, which our model also successfully recognizes. Fourthly, our model is capable of overcoming noise between two images. As shown in the seventh row of Figure 4, a red region appears in the second timestamp, and most other models mistakenly identify it as a change. However, our model correctly recognizes it as a non-change region without compromising the detection of the change area at the top of the image. This demonstrates the robustness of our model. Fifthly, our model performs well on regular areas, such as densely packed regular-shaped change areas and conventional rectangular regions, as shown in the last three rows of Figure 4. It is worth noting that in the last three rows of Figure 4, there are generally well-identified rectangles as well as very small rectangles. While our model does not perform as well on these very small rectangles, it still outperforms other models significantly.
4.2.2. WHU-CD
The quantitative results of various methods on the WHU-CD dataset are summarized in Table 2.
Table 2.
Performance comparison of different methods on WHU-CD dataset.
Our model also performed exceptionally well on the WHU-CD dataset. While its recall of was slightly below the highest recall of , and its precision of fell short of the top value of , it achieved a commendable balance between recall and precision compared to other models. Notably, the F1 score and IoU both exceeded those of other methods, reaching and , respectively.
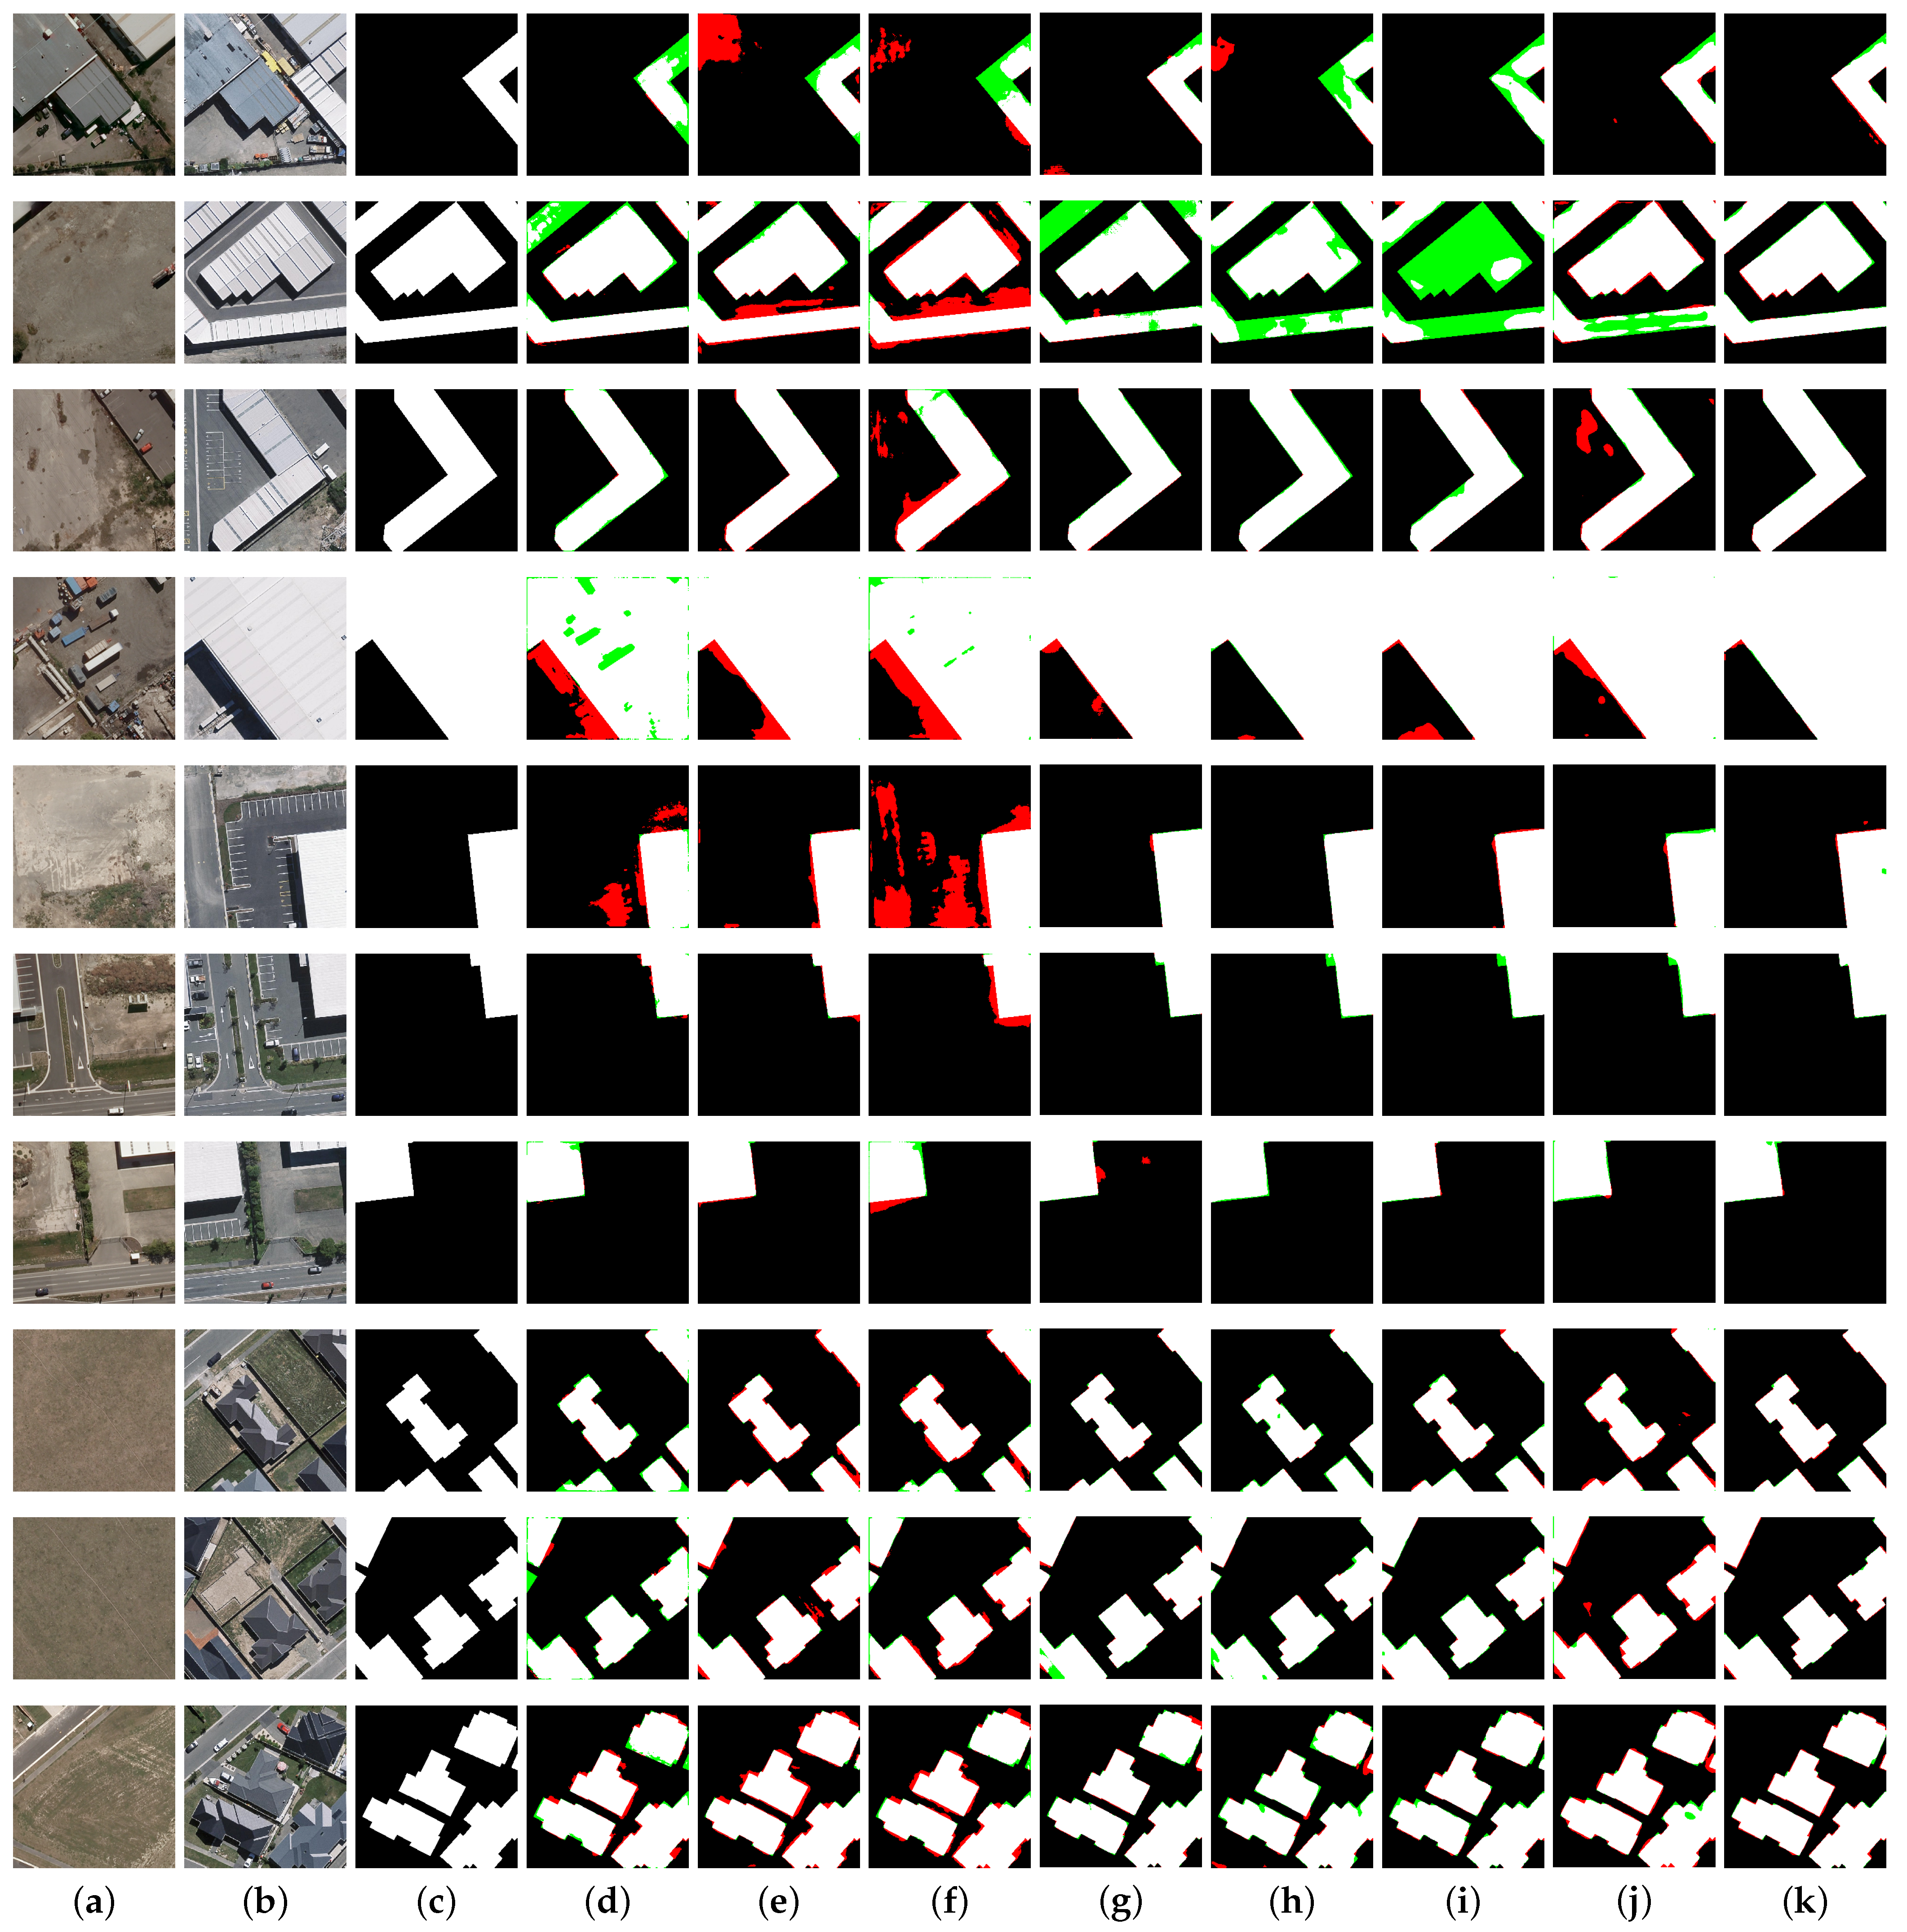
The visual results on the WHU-CD dataset, as shown in Figure 5, reflect the strong performance observed on the LEVIR-CD dataset while also highlighting some unique strengths. Our model continues to excel in identifying irregular objects, as demonstrated in rows 1 to 3 of Figure 5. Notably, the WHU-CD dataset contains very large change areas (shown in the fourth row of Figure 5), and our model effectively performs long-range modeling to accurately capture these extensive changes. In contrast to the LEVIR-CD dataset, which features many edge-regular rectangular change areas (as seen in the last two rows of Figure 4), the WHU-CD dataset presents numerous irregular edge change areas (shown in the last three rows of Figure 5). Our model handles these irregular areas with remarkable precision, identifying them with clear and accurate boundaries. Additionally, as mentioned in the CAS block, our model accurately identifies change areas in images containing both changed and unchanged regions, and it delineates these areas with clear boundaries, as illustrated in the first row of Figure 5.
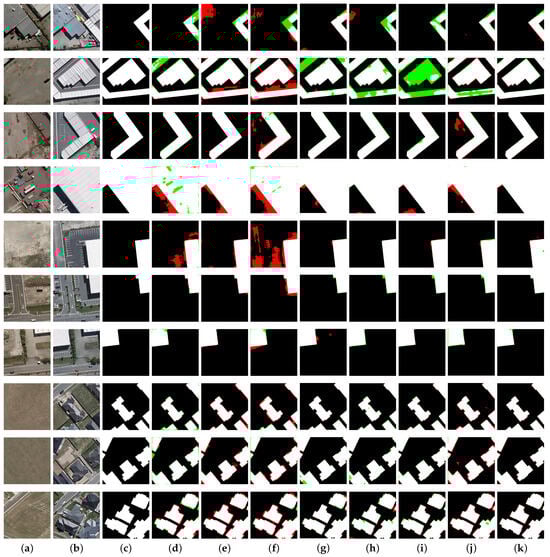
Figure 5.
Visualization comparison on the WHU-CD dataset: false positives are indicated in red, and false negatives are represented in green. (a,b) bitemporal images; (c) GT; (d) FC-EF; (e) FC-Conc; (f) FC-Diff; (g) USSFC-Net; (h) HANet; (i) STNet; (j) BIT; (k) ours.
In summary, based on the experimental results on both the LEVIR-CD and WHU-CD datasets, our model exhibits several key strengths that enhance its performance in change detection:
- (1)
- Robustness in irregular shapes: Our model demonstrates exceptional robustness in detecting irregular shapes, accurately identifying challenging examples.
- (2)
- Global information capture: Our model effectively captures global information and identifies large change areas with high precision, significantly surpassing other models.
- (3)
- Isolated and small change area Recognition: Our model excels in recognizing very small, isolated change areas and small areas at the edges of images.
- (4)
- Handling noise: Our model is adept at overcoming noise between images without compromising the detection of genuine changes.
- (5)
- Precision in mixed regions: Our model accurately identifies change areas in images containing both changed and unchanged regions, delineating these areas with clear boundaries.
- (6)
- Performance on regular areas: Our model performs well on regular areas, including densely packed regular-shaped change areas and conventional rectangular regions.
4.3. Ablation Study
To gain a deeper understanding of the novelty of the proposed approach, we conducted three ablation experiments, which will be detailed individually in the following sections. These experiments include an analysis of the different modules we proposed, an evaluation of the impact of varying the number of CrosDCNv3 layers, and an assessment of the SE layer’s effect on change detection performance.
4.3.1. Proposed Modules
The primary objective of the first ablation study is to comprehensively assess and understand the distinct contributions of each component to the model’s overall performance and effectiveness. By incrementally adding or removing individual elements, we can evaluate their unique impact and how each contributes to the method’s overall efficacy. For this reason, we compare the baseline model, which is depicted in Figure 1 with the CAS block, SE layer, and refinement block removed, against four different variants.
- (1)
- Base + Cros. Base + Cros means the baseline model with the addition of the CAS block, but excluding the SE layer.
- (2)
- Base + Refine. Base + Refine represents the baseline model with the addition of the refinement block.
- (3)
- Base + Cros + Refine. Base + Cros + Refine represents the baseline model with the addition of the CAS block and the refinement block, but excluding the SE layer.
- (4)
- Base + Cros + Refine + SE. Base + Cros + Refine + SE means the complete model with all the modules included, including the baseline, the CAS block, the SE layer, and the refinement block.
Our baseline model is a straightforward adaptation of InternImage into a dual-branch architecture, where each branch processes images from the two timestamps independently. Fusion occurs at each stage using a dedicated fusion module. As shown in Table 3, this baseline setup achieves an F1 score of and an IoU of . Upon introducing deformable convolution for bitemporal images (CrosDCNv3), the F1 score and IoU improve to and , respectively, alongside a boost in recall. This demonstrates that CrosDCNv3 effectively captures change information between the two timestamps. Next, when we incorporate a refinement block to better extract local information into the baseline model, the F1 score and IoU significantly increase to and , respectively. The refinement block enhances the baseline’s ability to capture local details, compensating for some of the limitations posed by deformable convolution. When both the refinement block and CrosDCNv3 are used together, their combined effect leads to an F1 score of and an IoU of , showing substantial improvements in both precision and recall over the baseline model. This indicates that the refinement block is particularly effective at capturing finer details and recalling a greater number of change areas.
Table 3.
Ablation study on LEVIR-CD dataset.
In change detection tasks, many models have utilized attention mechanisms with noticeable results. Therefore, we hypothesized that incorporating attention mechanisms could enhance the performance of our model. The experimental results confirm this, with the attention-augmented model achieving even better performance, with an F1 score of and an IoU of .
4.3.2. CrosDCNv3
This ablation study examines the impact of varying the number of CrosDCNv3 layers. Change detection is inherently more complex than single-image processing, as it involves extracting information from two images simultaneously. Consequently, a single layer of CrosDCNv3 may not suffice. To identify the optimal number of layers for the best performance, we evaluated configurations with 1, 2, 3, and 4 layers of CrosDCNv3. As shown in Table 4, increasing the number of CrosDCNv3 layers from one to three leads to a steady improvement in the model’s F1 score and IoU, rising from to and from to , respectively. This indicates an approximate improvement of in F1 score and in IoU. However, performance deteriorates when using four layers, with both metrics dropping below those achieved with a single layer.
Table 4.
Ablation study of CrossDCNv3 repetition on LEVIR-CD dataset.
The analysis also reveals a trade-off between recall and precision when comparing the one-layer and two-layer configurations. Specifically, precision improves while recall decreases as the number of layers increases from one to two. This suggests that additional CrosDCNv3 layers allow the model to more accurately identify change regions. At the three-layer configuration, the model achieves an optimal balance, with both precision and recall exceeding . However, with the four-layer configuration, while precision remains high, other performance metrics decline, suggesting that too many layers may lead to overly conservative results.
Thus, using three layers of CrosDCNv3 offers the best overall performance for the model.
4.3.3. SE Layer
To examine the role of SElayer, the third ablation experiments are conducted, in which FC-EF, FC-Siam-Diff, FC-Siam-Conc, and USSFC-Net are equipped with SElayer.
By comparing the results in Table 5, it can be inferred that all methods improve their performance with the help of SElayer. For example, the IoU of FC-EF is improved from to , and IoU of USSFC-Net from to . This ablation experiment validates the significance of SElayer in change detection tasks.
Table 5.
Ablation study of SE module on LEVIR-CD dataset.
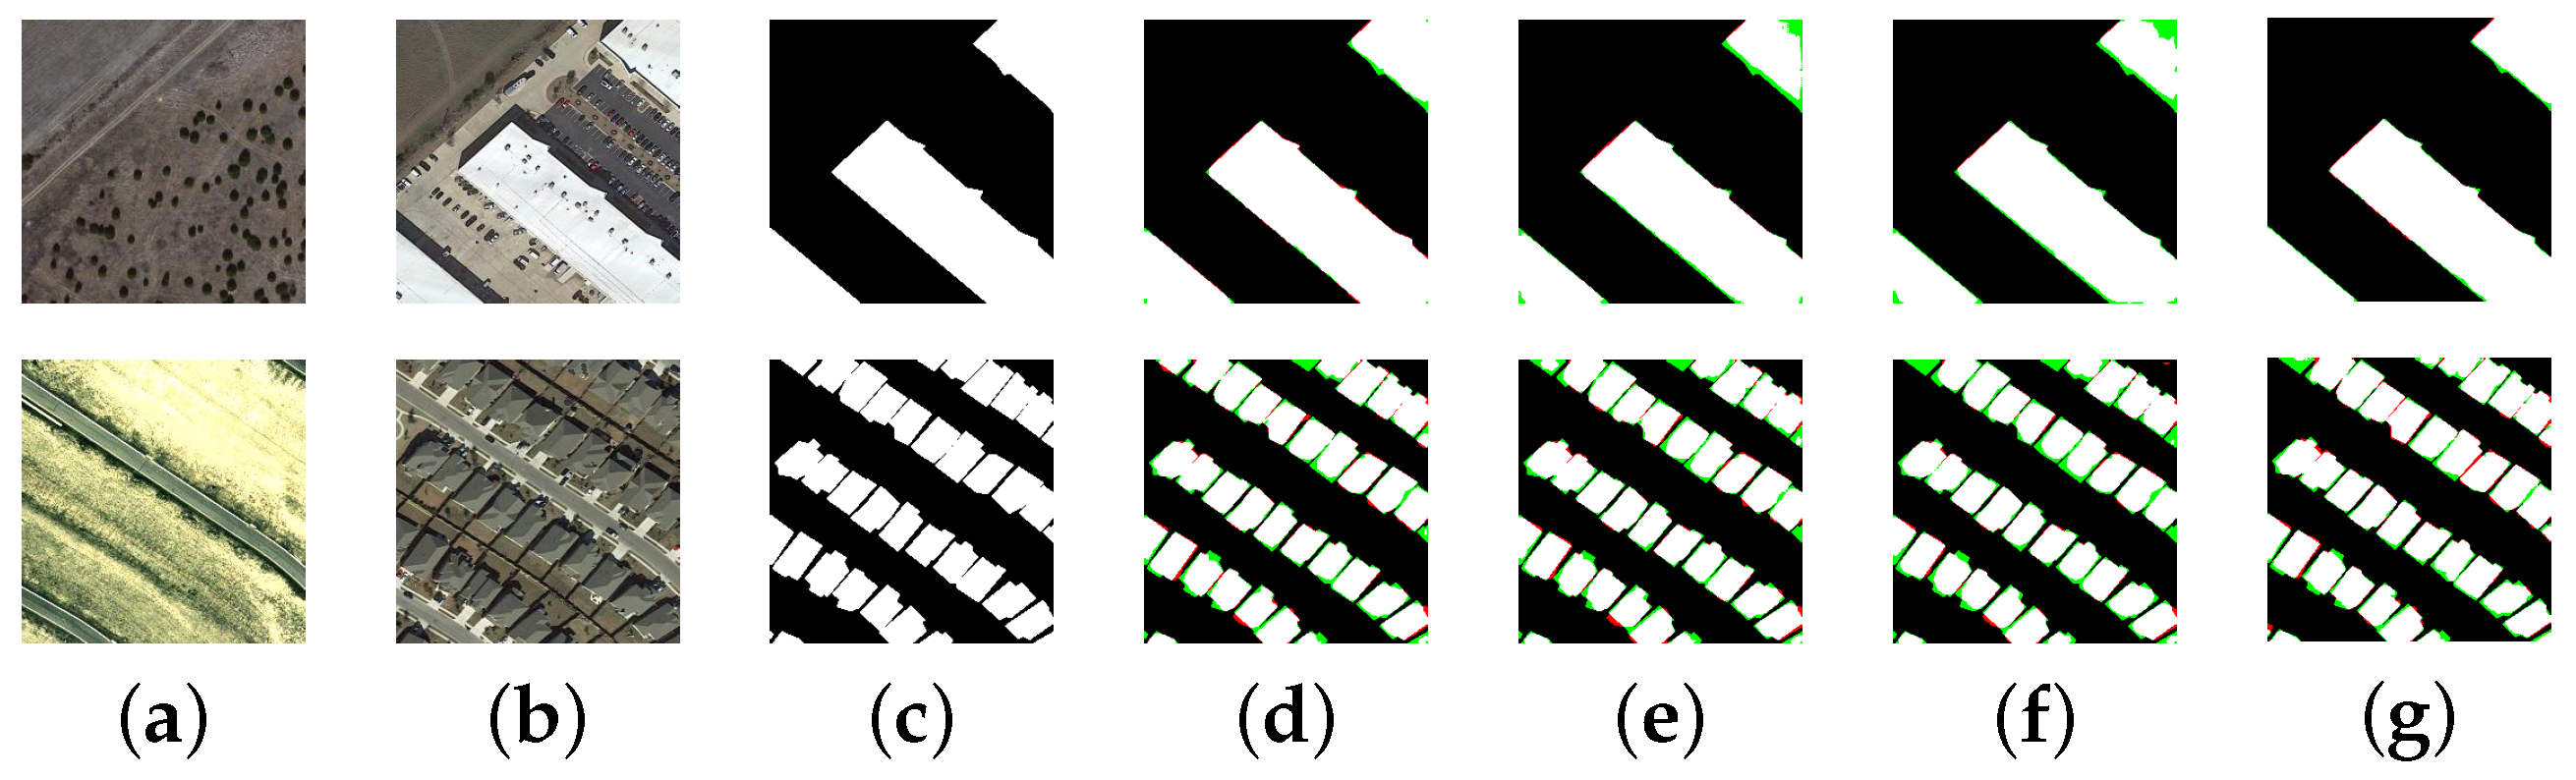
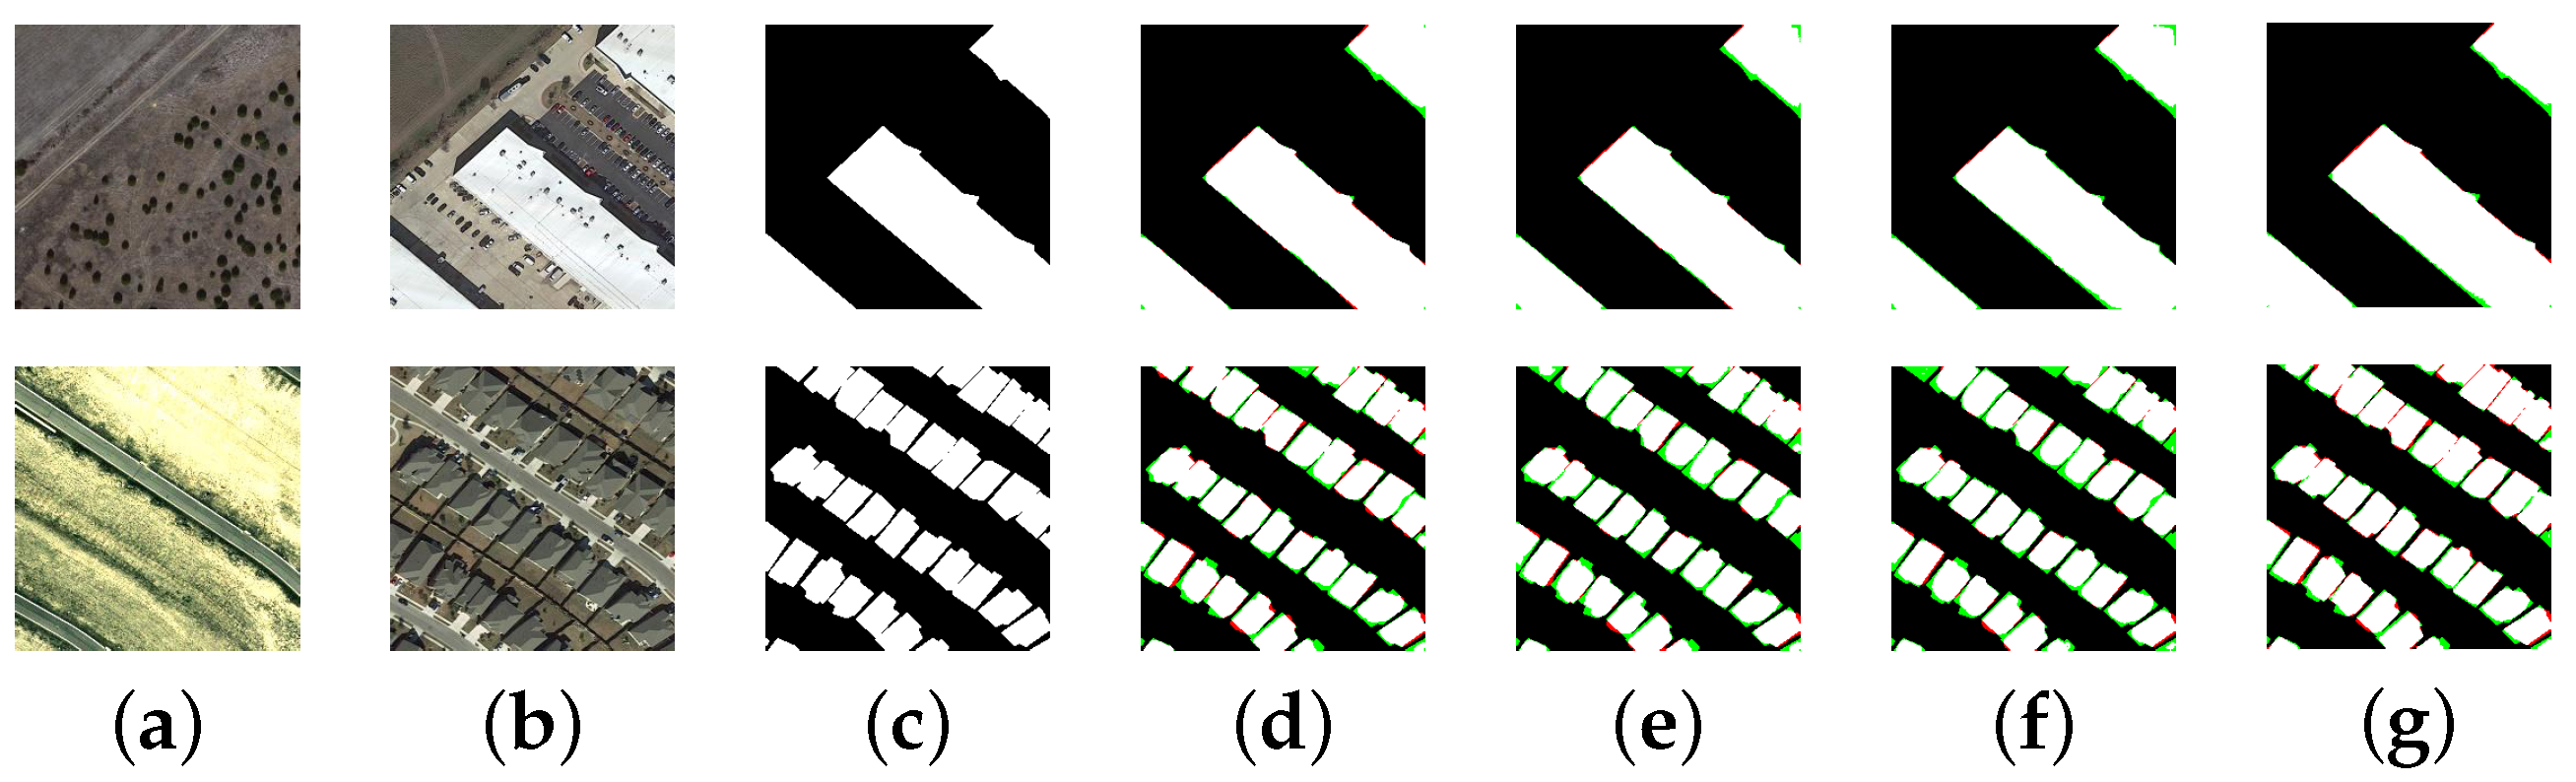
We present the visual results of the aforementioned models before and after adding the SE layer in Figure 6 and Figure 7, respectively. From the visual results, it is evident that the edges of the recognition results become clearer and the number of recognition errors decreases after adding the SE layer.
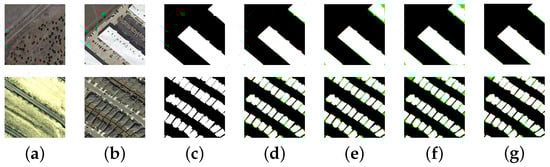
Figure 6.
Visualization on the LEVIR-CD dataset before adding SE module: false positives are indicated in red, and false negatives are represented in green. (a,b) bitemporal images; (c) GT; (d) FC-EF; (e) FC-Conc; (f) FC-Diff; (g) USSFC-Net.
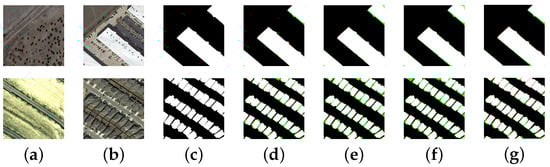
Figure 7.
Visualization on the LEVIR-CD dataset after adding SE module: false positives are indicated in red, and false negatives are represented in green. (a,b) bitemporal images; (c) GT; (d) FC-EF; (e) FC-Conc; (f) FC-Diff; (g) USSFC-Net.
In summary, our three ablation experiments demonstrate that the performance improvements seen in the model we proposed lie in the Siamese InternImage architecture, the basic stage, the refinement module, and the SE layer.
5. Conclusions
This paper presents a CNN-based vision foundation model for change detection, inspired by InternImage. We have extended DCNv3 to CrosDCNv3 to handle bitemporal images and added a refinement module to enhance local feature extraction. The incorporation of the SE layer further strengthens the model’s ability to capture robust patterns. By combining the strengths of both CNN and Transformer architectures, our approach significantly outperforms conventional deep learning methods, as demonstrated by experimental results on the LEVIR-CD and WHU-CD datasets. The model excels in identifying change areas across various scenarios. It effectively handles irregular shapes, detects small and isolated changes, and maintains precision in mixed regions containing both changed and unchanged areas. Additionally, its capability to capture global information enables accurate identification of large change areas, and it is robust in managing noisy image data.
Despite these strengths, the model faces challenges in detecting extremely small and irregularly shaped objects, as shown in Figure 8. We believe this is because, although the refinement module was designed to enhance local feature extraction, for very small regions, the downsampling that occurs throughout the various downsampling operations reduces the size of these areas to a degree that makes it difficult for the model to distinguish them effectively. In fact, the smallest feature map produced by the model is just 1/32 of the size of the original image, which further complicates the identification of such tiny regions.
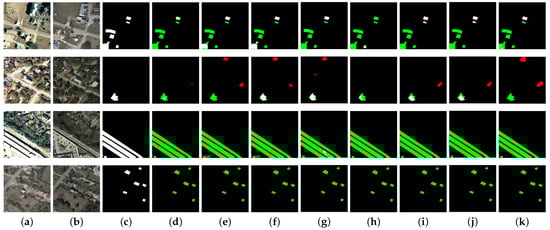
Figure 8.
Failure cases on the LEVIR-CD dataset: false positives are indicated in red, and false negatives are represented in green. (a,b) bitemporal images; (c) GT; (d) FC-EF; (e) FC-Conc; (f) FC-Diff; (g) USSFC-Net; (h) HANet; (i) STNet; (j) BIT; (k) ours.
Apart from the issue with extremely small and irregularly shaped objects, the model also struggles to distinguish between non-building objects that resemble buildings and buildings with uncommon appearances. As shown in the first row of Figure 9, the incorrectly identified change areas by the model closely resemble buildings, but they are not labeled as such. In the second row, the model misses some extremely small change areas. In the third row, it fails to detect change areas that, while not visibly resembling buildings, are in fact buildings. A similar issue arises in the fourth row, where the model incorrectly identifies non-building areas as buildings.
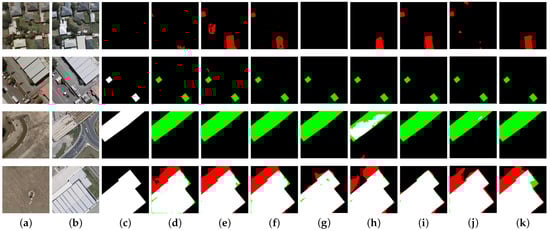
Figure 9.
Failure cases on the WHU-CD dataset: false positives are indicated in red, and false negatives are represented in green. (a,b) bitemporal images; (c) GT; (d) FC-EF; (e) FC-Conc; (f) FC-Diff; (g) USSFC-Net; (h) HANet; (i) STNet; (j) BIT; (k) ours.
In conclusion, while our proposed CNN-based change detection foundation model demonstrates significant advantages in handling various types of change areas, including irregular shapes, small isolated regions, and noisy images, it still encounters challenges with extremely small objects and distinguishing non-building structures from buildings. In future work, we plan to incorporate multi-scale training techniques and design a more refined fine-grained feature extraction mechanism to better capture extremely small and irregularly shaped objects. Additionally, enhancing the model’s ability to differentiate between non-building structures and buildings through more advanced contextual learning will also be explored.
Author Contributions
Conceptualization, J.S. and C.H.; methodology, J.S. and S.X.; investigation, J.S. and C.H.; visualization, J.S.; writing—original draft preparation, J.S.; data curation, J.S. and C.H.; writing—review and editing, J.S. and C.H.; supervision, C.H. and S.X.; funding acquisition, C.H. All authors have read and agreed to the published version of the manuscript.
Funding
This work was supported partially by the National Natural Science Foundations of China (Grants No. 62071466).
Data Availability Statement
The original contributions presented in the study are included in the article, further inquiries can be directed to the corresponding author.
Conflicts of Interest
The authors declare no conflicts of interest.
References
- Li, Z.; Shi, W.; Zhang, H.; Hao, M. Change detection based on Gabor wavelet features for very high resolution remote sensing images. IEEE Geosci. Remote Sens. Lett. 2017, 14, 783–787. [Google Scholar] [CrossRef]
- Celik, T. Unsupervised change detection in satellite images using principal component analysis and k-means clustering. IEEE Geosci. Remote Sens. Lett. 2009, 6, 772–776. [Google Scholar] [CrossRef]
- Byrne, G.F.; Crapper, P.F.; Mayo, K.K. Monitoring land-cover change by principal component analysis of multitemporal Landsat data. Remote Sens. Environ. 1980, 10, 175–184. [Google Scholar] [CrossRef]
- Volpi, M.; Tuia, D.; Bovolo, F.; Kanevski, M.; Bruzzone, L. Supervised change detection in VHR images using contextual information and support vector machines. Int. J. Appl. Earth Obs. Geoinf. 2013, 20, 77–85. [Google Scholar] [CrossRef]
- Chen, H.; Shi, Z. A spatial-temporal attention-based method and a new dataset for remote sensing image change detection. Remote Sens. 2020, 12, 1662. [Google Scholar] [CrossRef]
- Chen, Y.; Ouyang, X.; Agam, G. MFCNET: End-to-end approach for change detection in images. In Proceedings of the 2018 25th IEEE International Conference on Image Processing (ICIP) 2018, Athens, Greece, 7–10 October 2018; pp. 4008–4012. [Google Scholar]
- Lei, T.; Geng, X.; Ning, H.; Lv, Z.; Gong, M.; Jin, Y.; Nandi, A.K. Ultralightweight spatial–spectral feature cooperation network for change detection in remote sensing images. IEEE Trans. Geosci. Remote Sens. 2023, 61, 4402114. [Google Scholar] [CrossRef]
- Zhang, C.; Wang, L.; Cheng, S.; Li, Y. SwinSUNet: Pure Transformer Network for Remote Sensing Image Change Detection. IEEE Trans. Geosci. Remote Sens. 2022, 60, 5224713. [Google Scholar] [CrossRef]
- Vaswani, A.; Shazeer, N.; Parmar, N.; Uszkoreit, J.; Jones, L.; Gomez, A.N.; Kaiser, Ł.; Polosukhin, I. Attention is all you need. In Proceedings of the Advances in Neural Information Processing Systems, Long Beach, CA, USA, 4–9 December 2017; Volume 30. [Google Scholar]
- Dai, J.; Qi, H.; Xiong, Y.; Li, Y.; Zhang, G.; Hu, H.; Wei, Y. Deformable convolutional networks. In Proceedings of the IEEE International Conference on Computer Vision; 2017; pp. 764–773. Available online: https://openaccess.thecvf.com/content_iccv_2017/html/Dai_Deformable_Convolutional_Networks_ICCV_2017_paper.html (accessed on 25 May 2024).
- Zhu, X.; Hu, H.; Lin, S.; Dai, J. Deformable convnets v2: More deformable, better results. In Proceedings of the IEEE/CVF Conference on Computer Vision and Pattern Recognition, Long Beach, CA, USA, 15–20 June 2019; pp. 9308–9316. [Google Scholar]
- Wang, W.; Dai, J.; Chen, Z.; Huang, Z.; Li, Z.; Zhu, X.; Hu, X.; Lu, T.; Lu, L.; Li, H.; et al. Internimage: Exploring large-scale change detection vision foundation model s with deformable convolutions. In Proceedings of the IEEE/CVF Conference on Computer Vision and Pattern Recognition, Vancouver, BC, Canada, 17–24 June 2023; pp. 14408–14419. [Google Scholar]
- Yu, F.; Koltun, V. Multi-scale context aggregation by dilated convolutions. arXiv 2015, arXiv:1511.07122. [Google Scholar]
- Chollet, F. Xception: Deep learning with depthwise separable convolutions. In Proceedings of the IEEE conference on Computer Vision and Pattern Recognition, Honolulu, HI, USA, 21–26 July 2017; pp. 1251–1258. [Google Scholar]
- Caye Daudt, R.; Le Saux, B.; Boulch, A. Fully Convolutional Siamese Networks for Change Detection. In Proceedings of the 2018 25th IEEE International Conference on Image Processing (ICIP), Athens, Greece, 7–10 October 2018; pp. 4063–4067. [Google Scholar]
- Fang, S.; Li, K.; Shao, J.; Li, Z. SNUNet-CD: A Densely Connected Siamese Network for Change Detection of VHR Images. IEEE Geosci. Remote Sens. Lett. 2022, 19, 8007805. [Google Scholar] [CrossRef]
- Zhou, Z.; Rahman Siddiquee, M.M.; Tajbakhsh, N.; Liang, J. Unet++: A nested u-net architecture for medical image segmentation. In Deep Learning in Medical Image Analysis and Multimodal Learning for Clinical Decision Support, Proceedings of the 4th International Workshop, DLMIA 2018, and 8th International Workshop, ML-CDS 2018, Held in Conjunction with MICCAI 2018, Granada, Spain, 20 September 2018; Springer: Cham, Switzerland, 2018; Proceedings 4; pp. 3–11. [Google Scholar]
- Chen, J.; Yuan, Z.; Peng, J.; Chen, L.; Huang, H.; Zhu, J.; Liu, Y.; Li, H. DASNet: Dual Attentive Fully Convolutional Siamese Networks for Change Detection in High-Resolution Satellite Images. IEEE J. Sel. Top. Appl. Earth Obs. Remote. Sens. 2021, 14, 1194–1206. [Google Scholar] [CrossRef]
- Huang, J.; Fu, Q.; Wang, X.; Ji, Y. Remote sensing building change detection based on improved U-Net. In Proceedings of the 2022 3rd International Conference on Big Data, Artificial Intelligence and Internet of Things Engineering (ICBAIE), Xi’an, China, 15–17 July 2022; pp. 772–775. [Google Scholar]
- Han, C.; Wu, C.; Guo, H.; Hu, M.; Chen, H. HANet: A hierarchical attention network for change detection with bitemporal very-high-resolution remote sensing images. IEEE J. Sel. Top. Appl. Earth Obs. Remote Sens. 2023, 16, 3867–3878. [Google Scholar] [CrossRef]
- Zhang, C.; Yue, P.; Tapete, D.; Jiang, L.; Shangguan, B.; Huang, L.; Liu, G. A deeply supervised image fusion network for change detection in high resolution bi-temporal remote sensing images. ISPRS J. Photogramm. Remote Sens. 2020, 166, 183–200. [Google Scholar]
- Fang, S.; Li, K.; Li, Z. Changer: Feature interaction is what you need for change detection. IEEE Trans. Geosci. Remote Sens. 2023, 61, 5610111. [Google Scholar] [CrossRef]
- Ma, X.; Yang, J.; Hong, T.; Ma, M.; Zhao, Z.; Feng, T.; Zhang, W. STNet: Spatial and Temporal feature fusion network for change detection in remote sensing images. In Proceedings of the IEEE International Conference on Multimedia and Expo, Brisbane, Australia, 10–14 July 2023; pp. 2195–2200. [Google Scholar]
- Chen, H.; Qi, Z.; Shi, Z. Remote sensing image change detection with transformers. IEEE Trans. Geosci. Remote Sens. 2021, 60, 5607514. [Google Scholar] [CrossRef]
- Bandara, W.G.C.; Patel, V.M. A transformer-based siamese network for change detection. In Proceedings of the IGARSS 2022–2022 IEEE International Geoscience and Remote Sensing Symposium, Kuala Lumpur, Malaysia, 17–22 July 2022; pp. 207–210. [Google Scholar]
- Feng, Y.; Xu, H.; Jiang, J.; Liu, H.; Zheng, J. ICIF-Net: Intra-scale cross-interaction and inter-scale feature fusion network for bitemporal remote sensing images change detection. IEEE Trans. Geosci. Remote Sens. 2022, 60, 4410213. [Google Scholar] [CrossRef]
- Zhou, Y.; Huo, C.; Zhu, J.; Huo, L.; Pan, C. DCAT: Dual cross-attention-based transformer for change detection. Remote Sens. 2023, 15, 2395. [Google Scholar] [CrossRef]
- Zhu, J.; Zhou, Y.; Xu, N.; Huo, C. Collaborative Learning Network for Change Detection and Semantic Segmentation of Remote Sensing Images. IEEE Geosci. Remote Sens. Lett. 2023, 20, 6012305. [Google Scholar] [CrossRef]
- Xiao, T.; Liu, Y.; Zhou, B.; Jiang, Y.; Sun, J. Unified perceptual parsing for scene understanding. In Proceedings of the European Conference on Computer Vision (ECCV), Munich, Germany, 8–14 September 2018; pp. 418–434. [Google Scholar]
- Lin, T.Y.; Dollár, P.; Girshick, R.; He, K.; Hariharan, B.; Belongie, S. Feature pyramid networks for object detection. In Proceedings of the IEEE Conference on Computer Vision and Pattern Recognition, Honolulu, HI, USA, 21–26 July 2017; pp. 2117–2125. [Google Scholar]
- Zhao, H.; Shi, J.; Qi, X.; Wang, X.; Jia, J. Pyramid scene parsing network. In Proceedings of the IEEE Conference on Computer Vision and Pattern Recognition, Honolulu, HI, USA, 21–26 July 2017; pp. 2881–2890. [Google Scholar]

Disclaimer/Publisher’s Note: The statements, opinions and data contained in all publications are solely those of the individual author(s) and contributor(s) and not of MDPI and/or the editor(s). MDPI and/or the editor(s) disclaim responsibility for any injury to people or property resulting from any ideas, methods, instructions or products referred to in the content. |
© 2024 by the authors. Licensee MDPI, Basel, Switzerland. This article is an open access article distributed under the terms and conditions of the Creative Commons Attribution (CC BY) license (https://creativecommons.org/licenses/by/4.0/).