Abstract
Machine learning, as an increasingly prominent method in recent years, has introduced new methodologies and perspectives for extracting geological alteration information. To enhance the accuracy of remote-sensing-alteration mineral information, this study focuses on the extraction of alteration information from hyperspectral remote sensing data using the Kernel-Based Extreme Learning Machine (KELM) optimized with the Sparrow Search Algorithm (SSA). The ideal parameters of the Kernel Extreme Learning Machine model were successfully acquired by utilizing the sparrow optimization method for continuous search and iteration, avoiding the blindness and arbitrariness associated with parameter selection by humans. Spectral Angle Mapper (SAM) technology was used to extract sample data from hyperspectral imagery, which were then used to train the machine learning model for alteration information extraction. The experimental results show that, when compared to the Random Forest and the Support Vector Machine algorithms, the Kernel-Based Extreme Learning Machine algorithm achieved the highest accuracy and the best effect in the extraction results. It closely matches the known mineral points and geochemical anomalies in the area, confirming that the method has a clear advantage in the extraction of hyperspectral alteration information.
1. Introduction
In remote-sensing mineral exploration, the extraction of alteration information is a crucial step, offering valuable guidance for mineral prospecting and evaluation. However, accurately extracting and distinguishing this information from background data is challenging because the alteration signals in remote sensing images are typically weak [1]. The development of hyperspectral remote-sensing technology has greatly enhanced the ability of remote sensing to observe the earth and to identify features. Compared with multispectral imagery, hyperspectral imagery offers high spectral resolution, reflected in the subtle differences between the spectra of various features. This ability to finely delineate reflectance spectra significantly improves classification and feature extraction accuracy [2,3,4,5]. Recently, the remote sensing field has developed mature traditional methods like spectral mixture analysis and mixture-tuned matched filtering for extracting mineral alteration information from hyperspectral data [6,7,8,9]. However, the mineral data obtained by traditional alteration information extraction techniques are relatively shallow and may contain inaccurate information, which complicates the accurate identification of alteration minerals. Faced with the limitations of traditional remote-sensing mineralization-alteration information extraction methods, some scholars have tried to combine artificial intelligence methods with traditional alteration information extraction methods to improve the accuracy of alteration information extraction. For example, Support Vector Machines, Random Forest and multilayer perceptron neural networks have shown their potentials, and certain research progress has been achieved [10,11,12,13]. There are still some limitations to these methods. Hyperspectral data have hundreds of bands, and the high dimensionality may increase the model complexity of algorithms such as Random Forest and Support Vector Machines when dealing with large numbers of features. This can affect computational efficiency. When performing machine-learning model construction, these methods often encounter problems with the selection and optimization of model parameters, such as the number of iterations for model training, the learning rate, and the selection of hyperparameters. Therefore, it is particularly urgent and important to find a new technical approach for achieving the accurate extraction and separation of hyperspectral alteration information.
The machine learning method chosen for this study is the Kernel Extreme Learning Machine (KELM) method. Unlike the traditional Support Vector Machine, KELM has the advantage of not requiring iterative training. It is fast when dealing with large-scale, high-dimensional data and can achieve good classification results with fewer tuning parameters. Although KELM has been successfully applied in fields such as agriculture, medicine, and computer science, its application in remote sensing for alteration information extraction remains underexplored [14,15,16].
On this basis, in order to solve the randomness and blindness of artificial parameter selection and to reduce the continuous debugging of the parameters, this study introduces the Sparrow Search Algorithm (SSA) for optimizing KELM’s parameters. This algorithm has already demonstrated its effectiveness in solving parameter optimization problems in various engineering applications [17,18]. Moreover, as a supervised learning method, KELM’s performance depends heavily on the availability of high-quality training samples. Obtaining these samples for remote-sensing alteration extraction typically requires extensive fieldwork, creating efficiency challenges. Spectral Angle Mapper (SAM) technology quantifies similarity by measuring the angles between spectral vectors, making it a commonly employed method in geological mapping [19].
The study area, located east of Tibet and west of the Jinsha River Basin, is characterized by north–south oriented mountain ranges, complex topography, substantial elevation changes, and deeply incised valleys. These challenging geomorphological conditions complicate the understanding of local stratigraphy, tectonics, magmatism, and mineralization, which in turn hinders targeted mineral exploration efforts. In such a challenging landscape, remote sensing technology emerges as a valuable tool, offering significant potential for geological exploration and emphasizing the need for efficient applications in mineral alteration analysis.
Building on previous research, this study employs the spectral angle matching technique to extract training samples and the Sparrow Search Algorithm to optimize the parameters of the Kernel Extreme Learning Machine model, enabling the extraction of alteration mineral information from remote sensing data. The research addresses challenges in parameter selection and sample classification, ensuring both are optimized. The accuracy of the method in extracting mineralized alteration information from remote sensing is also verified through fieldwork, geological data, and other information to improve the accuracy of the alteration information extraction from ZY1-02D hyperspectral data (Figure 1).
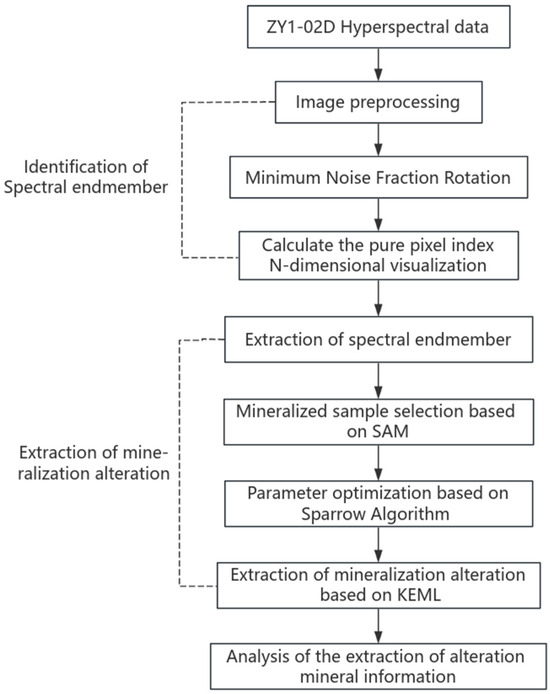
Figure 1.
Overview of the methodological flowchart.
2. Geological Setting of the Study Area
The Yulong porphyry copper belt is located east of Tibet, which is part of the Tethys–Himalayan metallogenic belt, one of the three major porphyry copper belts in the world. It is also the largest copper belt in the west of China. The Yulong porphyry copper belt lies within the Sanjiang orogenic belt, positioned in the Yulong–Xuzhong marginal mountain-basin belt in the eastern part of the Qiangtang–Changdu microplatform of the Sanjiang fold system. This region is predominantly controlled by a series of NNW-trending faults and the strike-slip fault systems of the Lachine Basin [20]. The study area is located in the southern region of the Yulong Copper Belt, which belongs to the large Tethys–Himalayan tectonic domain, and the main fracture structures are distributed in the NW-SE direction.
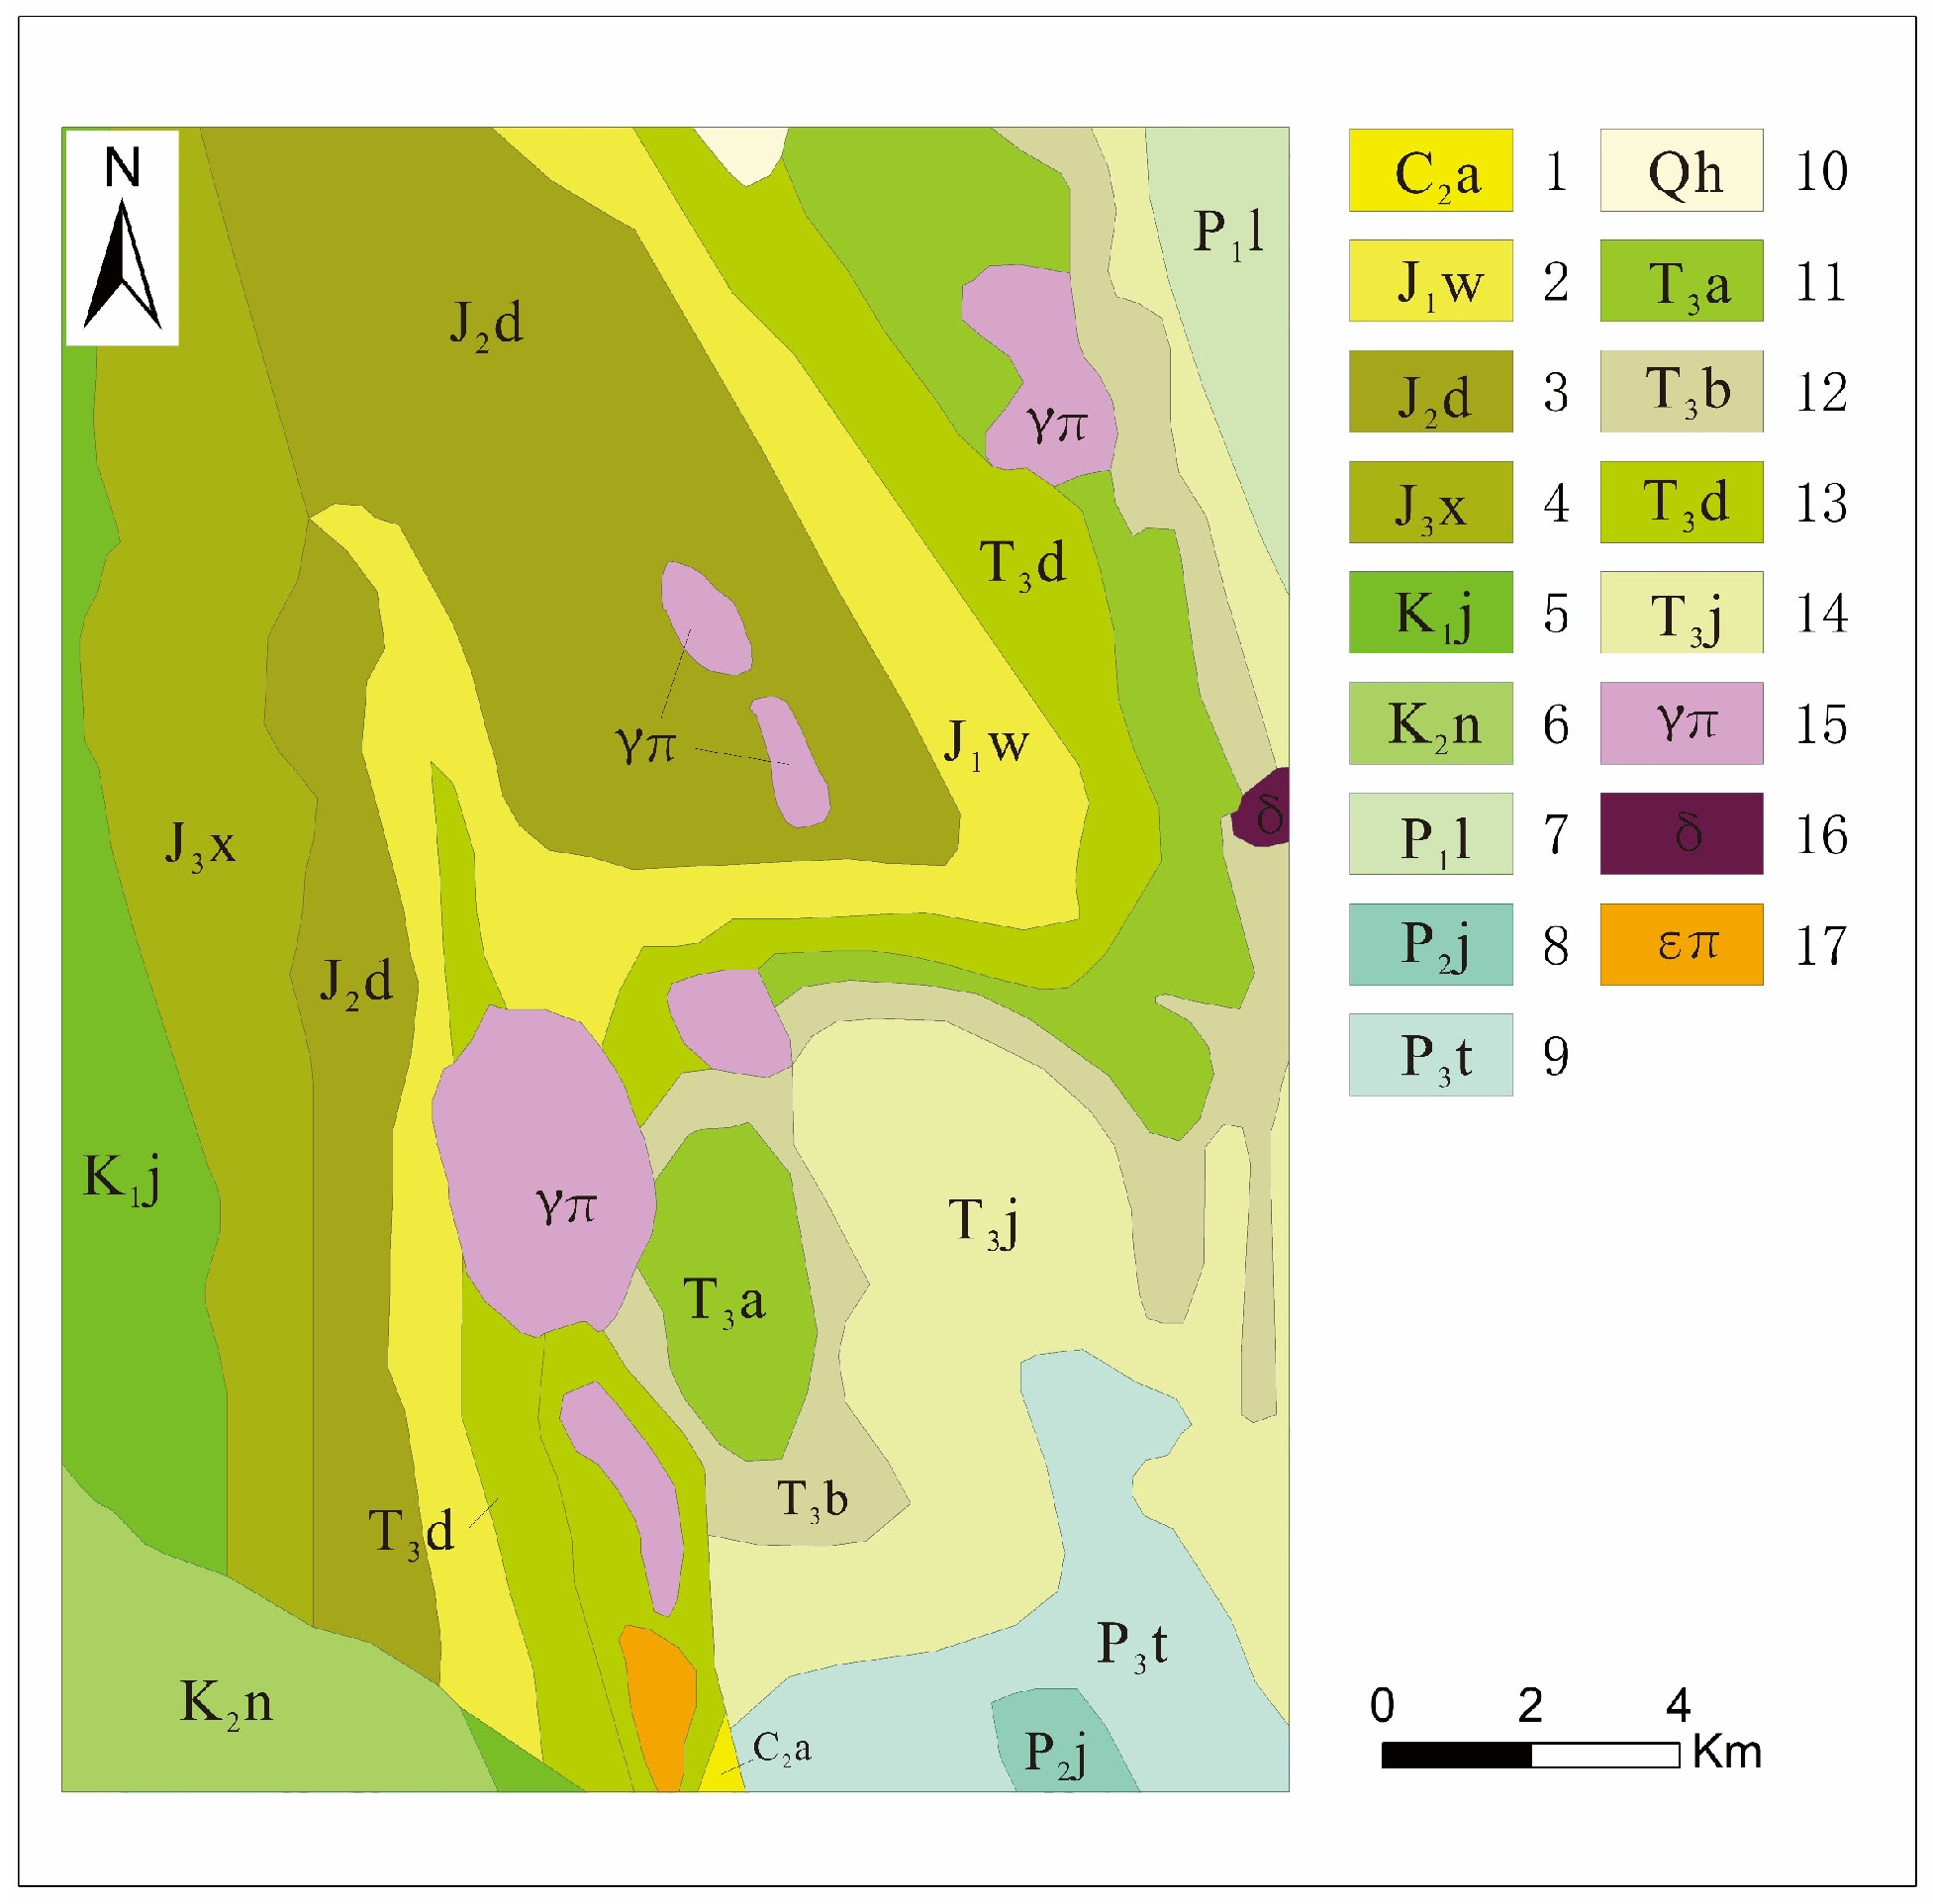
The exposed strata in the area mainly include the Ordovician, Devonian, Carboniferous, and Permian of the Paleozoic; the Triassic, Jurassic, and Cretaceous of the Mesozoic, and the Paleocene and Quaternary of the Cenozoic. Triassic strata are the predominant sedimentary formations in the mining area, particularly the Lower–Middle Triassic Malasongduo Formation (T1–2m), the Upper Triassic Jiapila Formation (T3j), the Bolila Formation (T3b), the Adula Formation (T3a), and the Duogaila Formation (T3d). These formations are extensively exposed, contributing significantly to the geological composition. The rocks in this area are well exposed, with a variety of mineral combinations. Field investigations indicate predominant alteration processes including carbonatation, sericitization, weak chloritization, and kaolinization (Figure 2).

Figure 2.
Geological map of the study area. 1–14: strata of different ages, 15: Granite porphyry, 16: Diorite, and 17: Syenite.
3. Data and Methods
3.1. Data Characteristic
The ZY1-02D satellite, with an orbital altitude of 778 km, is equipped with the Advanced Hyperspectral Imager (AHSI) capable of capturing hyperspectral images with a width of up to 60 km and a spatial resolution of more than 30 m. The hyperspectral data of the satellite consist of 166 spectral bands, which covers a wide range of wavelengths from visible light to short-wave infrared. In the visible near-infrared region, the spectral resolution is less than 10 nm, while in the short-wave infrared region, it is greater than 20 nm [21]. Compared to GF-5, its spectral resolution is halved in the near-infrared and short-wave infrared bands. It also possesses a higher signal-to-noise ratio. This study utilized a single-view ZY1-02D image captured in December 2020, graded as L1A with generally high-quality imaging (Table 1).

Table 1.
Technical characteristics of the ZY1-02D.
3.2. Data Preprocessing
The preprocessing of the hyperspectral image (ZY1-02D) involved several steps, including band screening, correction of faulty lines and bands, spectral smoothing, radiometric calibration, and atmospheric correction. Band screening helps optimize hyperspectral image data by identifying and excluding bands with zero uncalibrated pixel values and those affected by water vapor, which could interfere with subsequent analyses. In this study, the ZY1-02D image excluded overlapping bands (VN: 72–76), bands affected by water vapor (SW: 22–27, 48–59, and 82–83), and bands with low signal-to-noise ratios (88–90) [22]. Because hyperspectral data contain numerous bands, for the purpose of this study, the short-wave infrared (SWIR) band (Centre wavelength 1.997–2.5 μm) played a key role in the identification of many minerals, especially hydrated minerals (e.g., clay minerals, chlorite, albite, etc.) and iron-bearing minerals. These minerals have obvious absorption features in the short-wave infrared band, which helps to distinguish different alteration mineral types. Therefore, the last 31 bands of short-wave infrared (SWIR) were selected for the ZY1-02D data in this study for the purpose of downscaling. Following radiometric calibration and atmospheric correction, Savitzky–Golay (SG) filtering was applied to smooth the spectra. This technique aimed to remove the jagged fluctuations in reflectance between neighboring bands, which were caused by instrumental noise, dark current, etc. The SG filtering technique is based on the local multidomain filtering technique. This filtering technique uses a local polynomial least-squares fitting method to filter out the noise without changing the shape and width of the signal [23].
3.3. Spectral Angle Matching
In the application of machine learning algorithms for mineral identification, the selection of accurate training samples is critical. To improve both the representativeness and reliability of these samples, this study used the Spectral Angle Mapper (SAM) technique. SAM is a method that measures the similarity between the spectral curves of image pixels and reference spectra by calculating the vector angle between them. This technique effectively identifies image elements that closely match the reference spectrum, providing high-quality training data for machine learning models [24]. Unknown pixels in an image are classified by applying a threshold to distinguish feature characteristics. Spectral units can either be extracted from an existing spectral library or directly from selected training regions within the image. The essence of SAM lies in comparing the actual measured or collected end-member spectra with pixel spectra, analyzing the error magnitude between them to determine the proximity of each pixel to the pure endmember, thus enabling accurate identification of the target feature. The choice of a suitable threshold for the spectral angle is critical, as incorrect settings, either too high or too low, can lead to misclassification and affect the overall accuracy [25].
3.4. Kernel Based Extreme Learning Machine
3.4.1. Principles of Kernel Extreme Learning Machine
The Extreme Learning Machine algorithm is a training algorithm for the single-hidden-layer feedforward neural network (SLFN) proposed by Huang Guangbin and other scholars’ research, which randomly assigns hidden layers and analytically determines the output weights of the SLFN. Traditional algorithms for Extreme Learning Machines (ELMs) typically depend on straightforward, nonlinear feature transformations to handle data. However, when confronted with classification, regression, and other intricate nonlinear pattern recognition tasks, a significant number of hidden-layer neurons are often necessary to capture the inherent structure of the data. This not only adds complexity to the network but also places a computational burden on it. Moreover, an increase in the number of hidden layer neurons can impact the efficiency, generalization capacity, and complexity of model training and tuning. In 2012, Huang Guangbin innovatively introduced the idea of kernel function into Extreme Learning Machines (ELMs) and proposed the Kernel ELM algorithm, an innovation that provides a consistent learning model framework for regression, binary, and multiclassification problems [26].
The Extreme Learning Machine (ELM) is a single-layer feedforward neural network. The objective function F(x) can be expressed in matrix form:
F(x) = h(x) × β = H × β = L
Here, x is the input vector, h(x) and H are the outputs of the hidden layer nodes, β denotes the output weights, and L represents the expected output.
If the feature mapping h(x) of the hidden layer is not clear, the similarity between the samples must be measured by inserting a kernel function. The kernel matrix is defined as:
Thus, the expression for the output function of the Kernel Extreme Learning Machine (KELM) model is:
Here, C represents the regularization coefficient, which influences the performance of the KELM.
The Kernel Extreme Learning Machine (KELM) avoids the explicit definition of the mapping function by preselecting a kernel function. This decreases the duration needed to optimize the quantity of hidden-layer neurons when training the model. The Kernel Extreme Learning Machine (KELM) algorithm, in contrast to the traditional Extreme Learning Machine (ELM) algorithm, employs kernel mapping instead of random mapping. This choice effectively addresses the issues of reduced generalization ability and stability that can arise from the random initialization of hidden-layer neurons, resulting in higher accuracy.
3.4.2. Sparrow Search Algorithm
The Sparrow Search Algorithm (SSA) is a novel population-based intelligence optimization approach, initially introduced by Xue and other researchers in 2020 [27]. The design of the algorithm is inspired by the group behavior of sparrows in nature, especially the intra-group division of labor exhibited by sparrows during foraging and anti-predation, which provides a unique perspective for the construction of the algorithm. Within the framework of the SSA, sparrow groups are categorized into distinct roles based on their assigned responsibilities, which include discoverers, followers, and vigilantes. Each role has a unique function and behavioral pattern [28]. This program, which emulates natural behavior, seeks to enhance the capacity to tackle intricate optimization problems by replicating the social structure and behavioral methods of sparrows.
Virtual sparrows are utilized in the simulation experiment to forage for food. The population of n sparrows is represented as follows:
The variable dimensionality is represented by d, and the number of sparrows is represented by n. Therefore, the fitness values of all sparrows are represented as follows:
where f denotes the fitness function.
Within the Sparrow Search Algorithm (SSA) framework, sparrows with higher fitness scores, known as discoverers, have priority in searching for food. These discoverers lead the entire sparrow population in exploring and locating food, providing foraging guidance and strategies for the group. Consequently, discoverers are assigned a broader search range to facilitate more effective exploration of unknown areas. The position update for a discoverer is described as follows:
where t denotes the current iteration and and represent the position of the i sparrow in the j dimension at iterations t and t + 1, respectively. α is a random number in (0, 1) and R2 is the alert value, which ranges within [0, 1]. δst is the safety value within [0.5, 1]. Q is a random number that obeys a normal distribution, and L is a 1 × d matrix with all elements 1, where each element within the matrix is all 1.
The position update for a follower is described as follows:
where represents the best position of the discoverer at iteration t + 1, ; and A is a 1 × d matrix with elements of 1 or −1.
The position update for a watcher is described as follows:
where is the global best position after the t iteration, β is a parameter that controls the step size, K is a random number between −1 and 1, and represents the current fitness value of the individuals. and represent the current optimal and worst fitness values, respectively; ε is a constant that has a non-zero denominator.
4. Alteration Information Extraction Experiment
4.1. Mineralized Sample Selection Based on Spectral Angle Matching
4.1.1. Spectral Endmember Identification
Due to the ZY1-02D remote-sensing image’s limited spatial resolution, the hyperspectral images often contain many mixed pixels. Each pixel in the image corresponds to different surface cover types, each with its unique spectral response characteristics [26]. These spectral characteristics are crucial for accurate surface analysis and classification. Before extracting alteration information, it is necessary to decompose mixed pixels using the Pixel Purity Index (PPI) tool in ENVI, which separates mixed pixels from pure ones. The specific steps are as follows:
The first step in this process involves applying the Minimum Noise Fraction (MNF) transformation to reduce data noise and computational load. Next, the Pixel Purity Index (PPI) algorithm identifies extreme pixels by analyzing and comparing the reflectance characteristics of each pixel [29]. In the PPI processing, the number of iterations is set to 10,000, which refers to the number of times the data are mapped to a random vector space. Generally, increasing the number of iterations helps to more effectively identify extreme pixels. The result of the PPI processing is a single-band dataset, where the pixel values represent the frequency of being marked as extreme, with higher values indicating purer pixels. Finally, the N-Dimensional Visualizer in ENVI is used to select the spectral endmembers, which represent the spectral characteristics of the pure surface features.
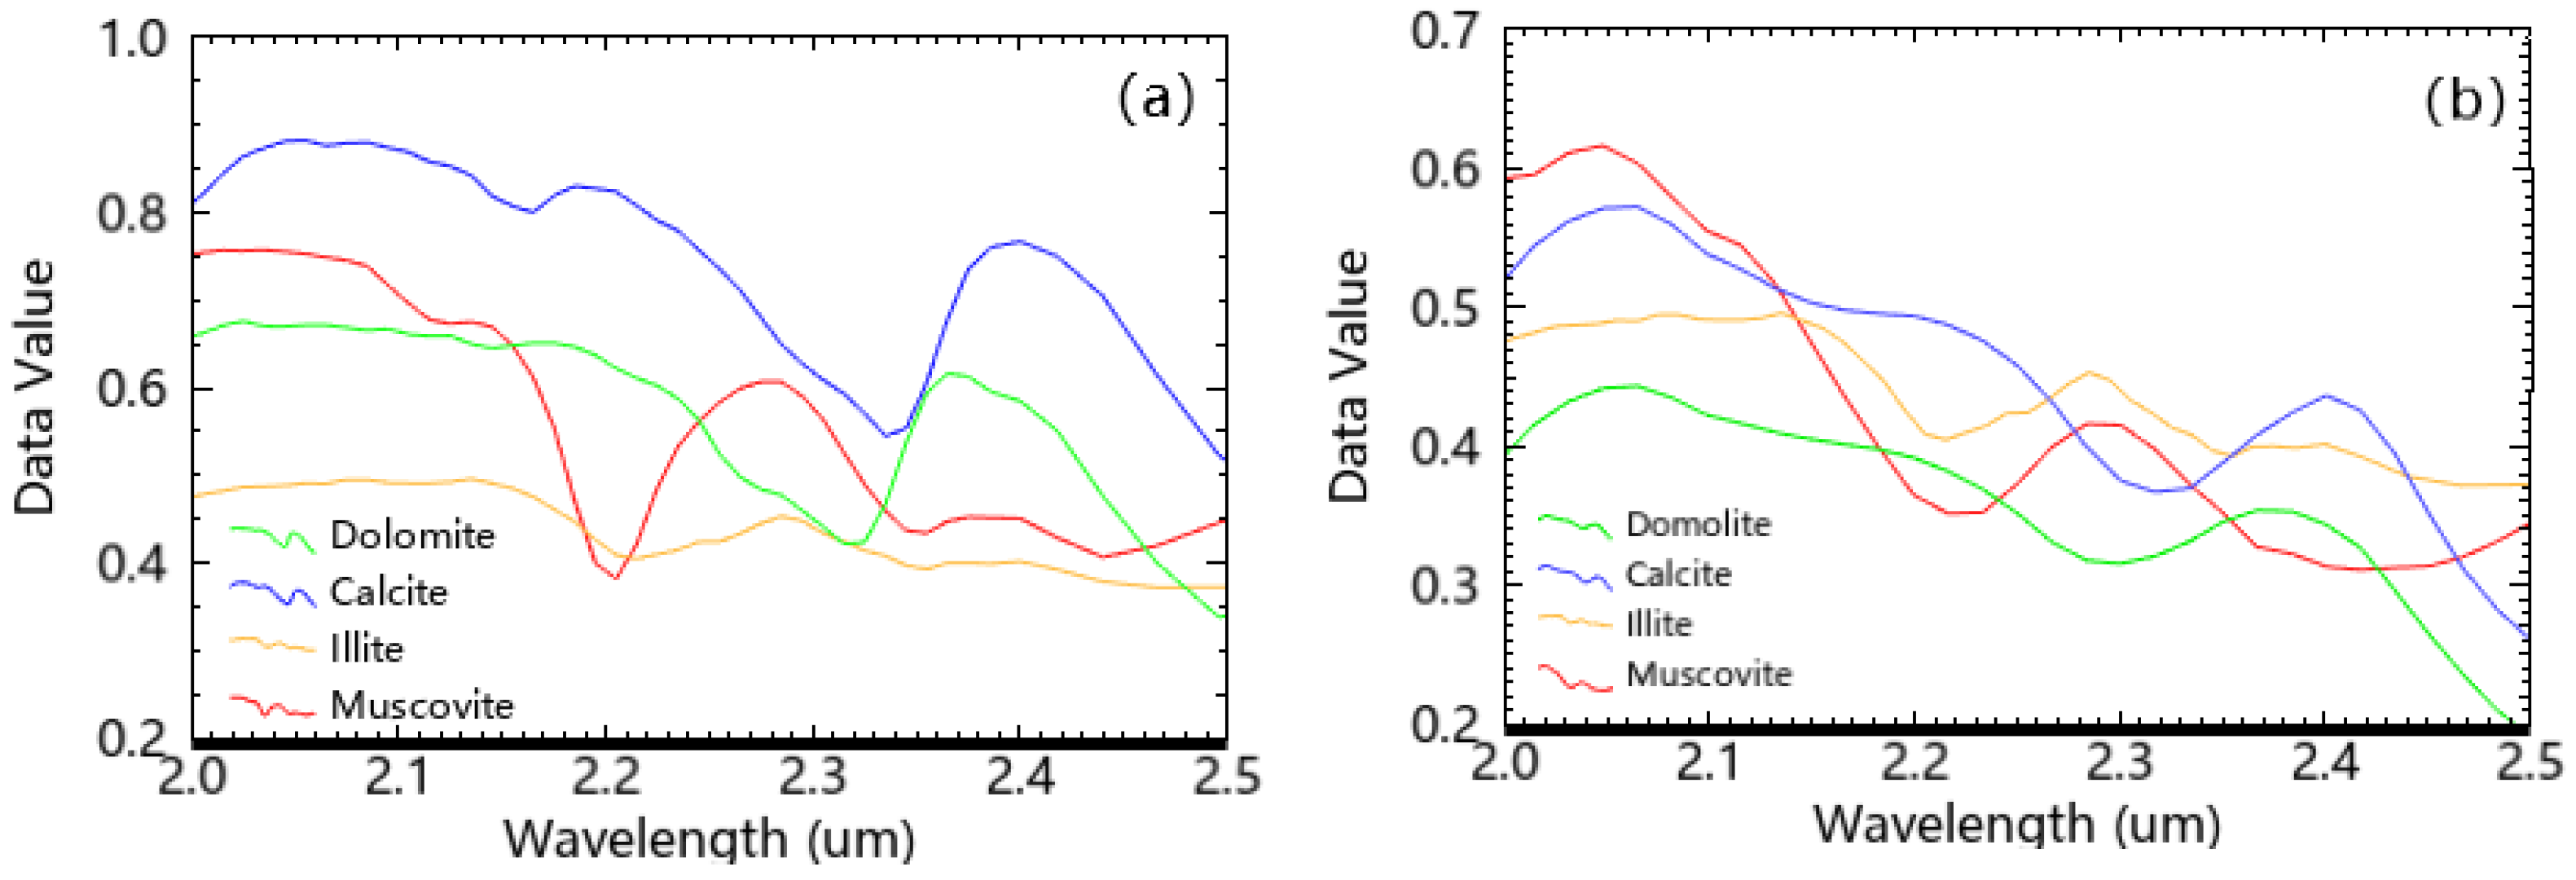
The average spectral curves of four different surface features were obtained from the training data using the ROI tool and the N-Dimensional Visualizer. The endmember spectra extracted from the remote sensing images were typically compared with the reflectance curves of the minerals in a standard spectral library and determined based on their locations in the images. The spectral endmembers were ultimately identified as calcite, dolomite, muscovite, and illite based on the shape of the spectral curves, their reflection and absorption characteristics, and the geological context of the study area. Muscovite exhibits a distinctive absorption characteristic at a wavelength of 2.20 µm. The spectral curve of muscovite obtained from the images is similar to that in the USGS spectral library. Illite shows an absorption valley near 2.20 µm and an absorption peak at 2.3 µm, with less pronounced absorption features as compared to muscovite. Calcite shows significant absorption features around 2.35 µm and 2.55 µm. The spectral characteristics of dolomite are similar to those of calcite, but due to different contents, the absorption valley shifts towards shorter wavelengths (Figure 3).
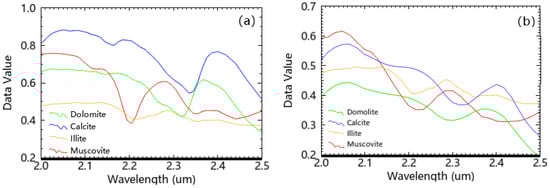
Figure 3.
(a) Typical mineral spectral curves from the USGS Spectral Library and (b) average spectral curve extracted from image end elements.
4.1.2. Extraction of Alteration Mineral Information Based on SAM
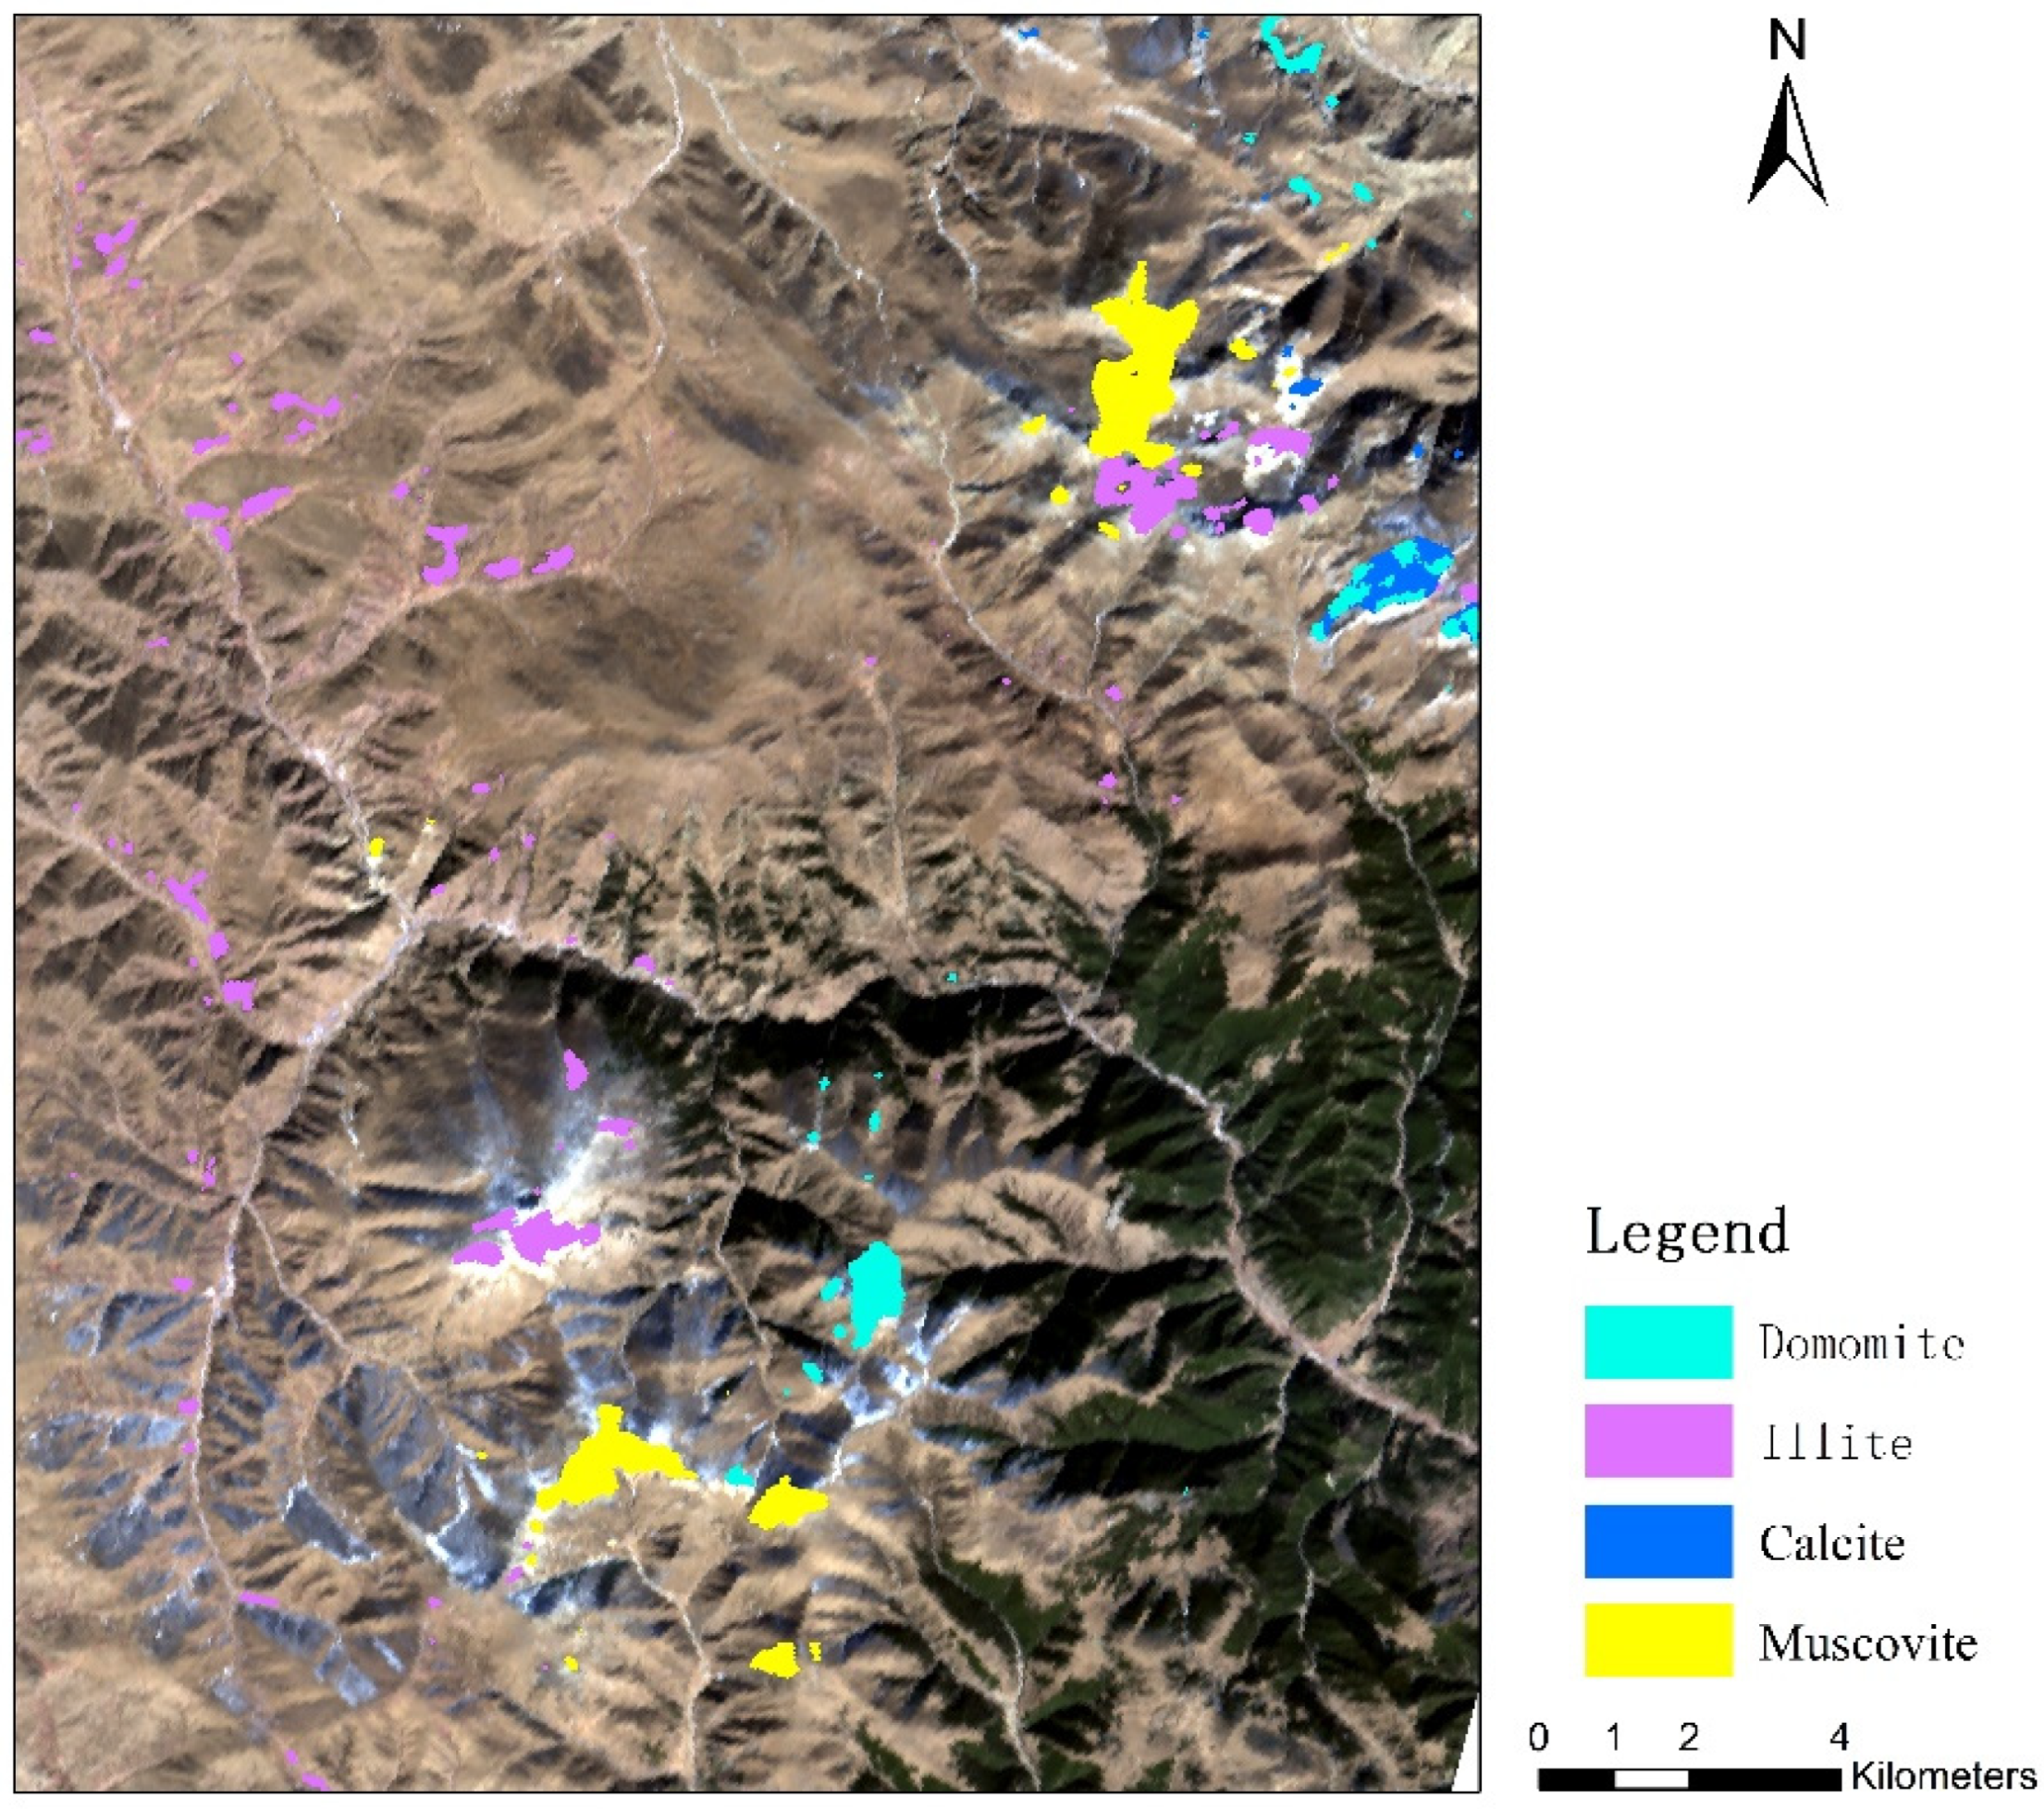
The reflectance spectra of the four alteration minerals extracted from the images, calcite, dolomite, muscovite and illite, were used as reference spectra. The spectral angle matching technique was used to obtain the spatial distribution information of four alteration minerals. The empirical threshold of the spectral angle was set at 0.10. The final classification results are shown in Figure 4. Pixels representing four different altered minerals were imported into the Region of Interest (ROI). Seventy percent of the sample image elements from each category were randomly selected to be used as the training set, with the remaining pixels used for the test set.
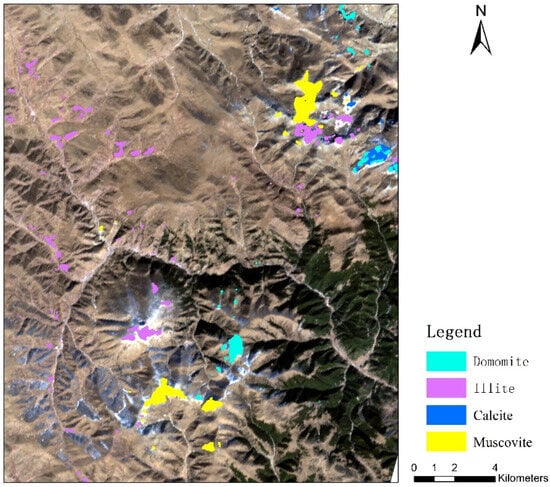
Figure 4.
Results of the mapping of the alteration based on SAM.
4.2. Extraction of Alteration Mineral Information Based on KELM
The ZY1-02D data were processed using the KELM algorithm to extract the distribution information of the alteration minerals in the study area. Based on the SAM extraction results, samples of calcite, dolomite, muscovite, and illite were selected from the images. Three additional classes of samples were selected through unsupervised classification for model training. These samples were used to build the KELM classifier for supervised classification. Both the training and test sets in this study were derived from the images (Table 2).
Table 2.
K-ELM Classification samples.
The choice of the kernel function is critical in alteration information extraction. The Radial Basis Function (RBF) kernel has classification ability comparable to the high-order polynomial and Sigmoid kernel functions. The RBF function can map the samples nonlinearly into a higher-dimensional space, solving the problem of the nonlinearity between class labels and attributes that cannot be addressed by the linear kernel function. Two key hyperparameters needed to be optimized: the penalty coefficient (C) and the RBF kernel function coefficient (σ).
The SSA-KELM program was implemented in MATLAB 9.14, where the penalty factor and kernel parameter were optimized through iterative calculations using the Sparrow Search Algorithm (SSA). The optimal penalty factor was determined to be C = 25, and the optimal kernel parameter was g = 0.3787, with 100 iterations for optimization.
On this basis, four regions of interest, including calcite, dolomite, Muscovite and illite from the SAM extraction results, were selected as validation samples for the accuracy of the alteration information extraction of the KELM algorithm. The classifier was trained by optimizing the kernel parameters, penalty factor, and training set using the SSA, resulting in an optimal KELM model (Figure 5). The extracted alteration mineral information from the ZY1-02D hyperspectral images achieved an overall accuracy of 90.54%. The evaluation metrics are shown in Table 3. The F1 score represents the balance point between precision and recall, considering both precision and recall so that both are simultaneously maximized and balanced.
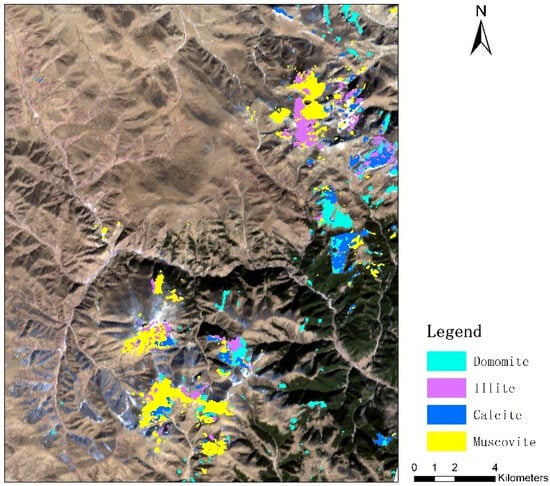
Figure 5.
Results of the mapping of alteration based on the KELM.
Table 3.
Precision indicators for the KELM classification results.
5. Discussion
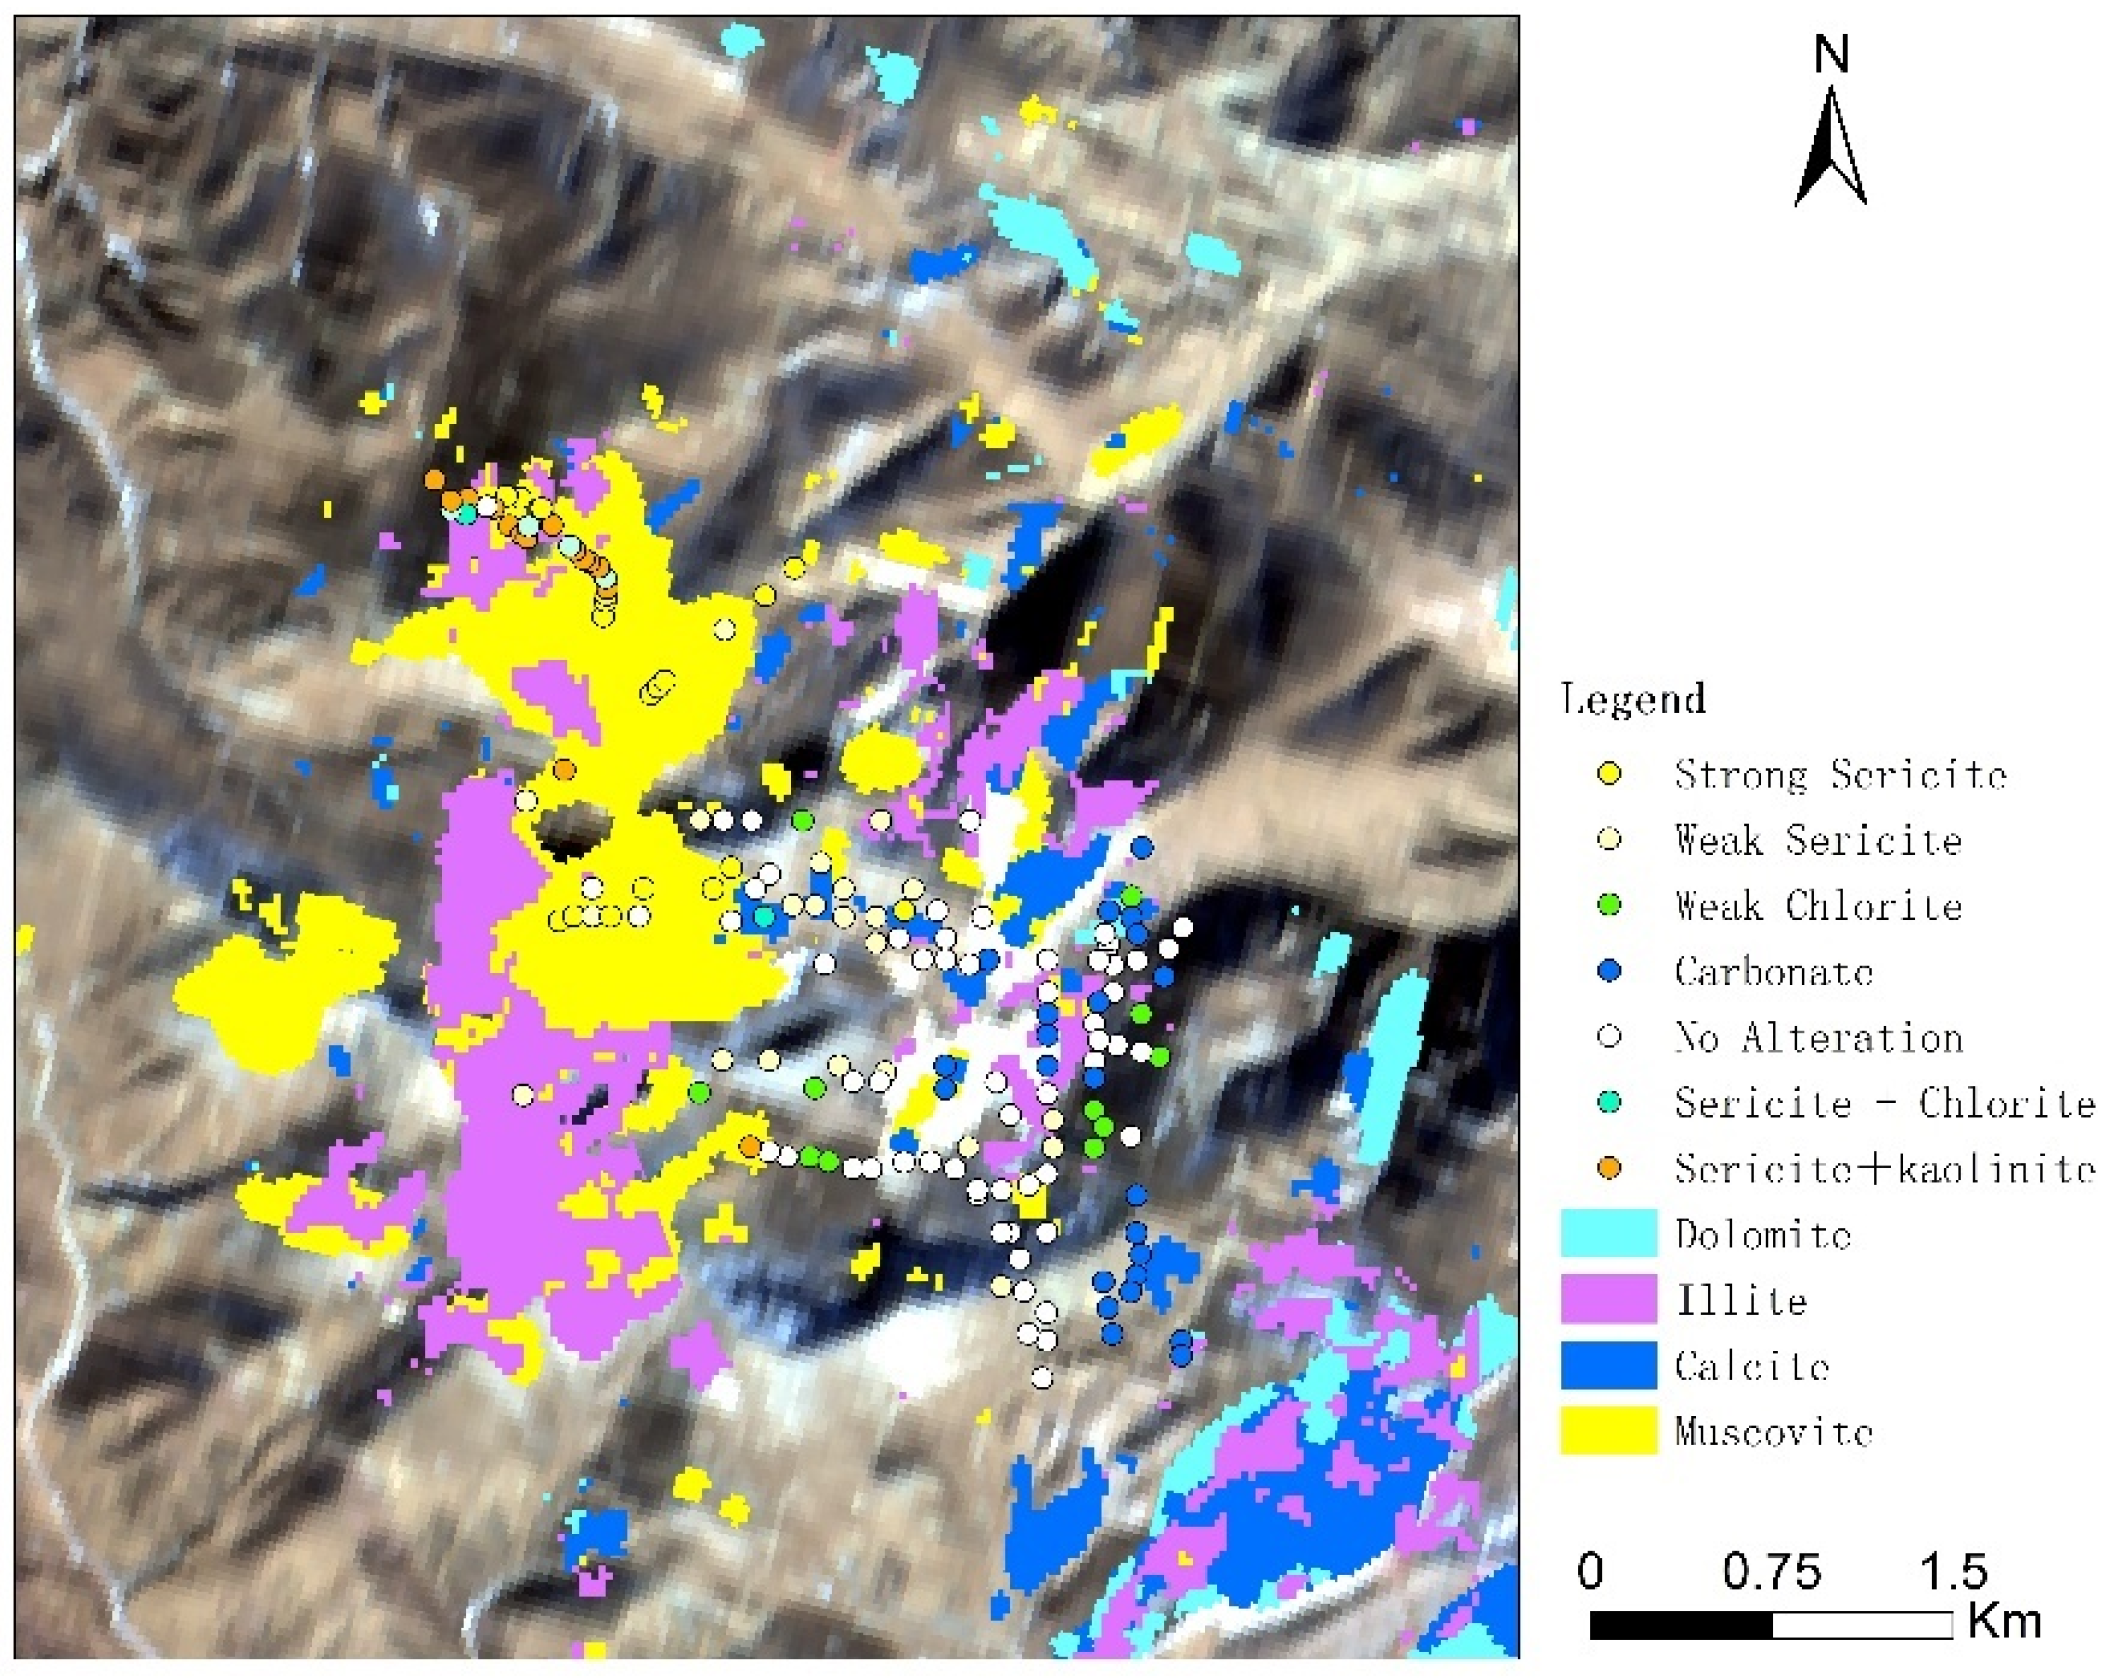
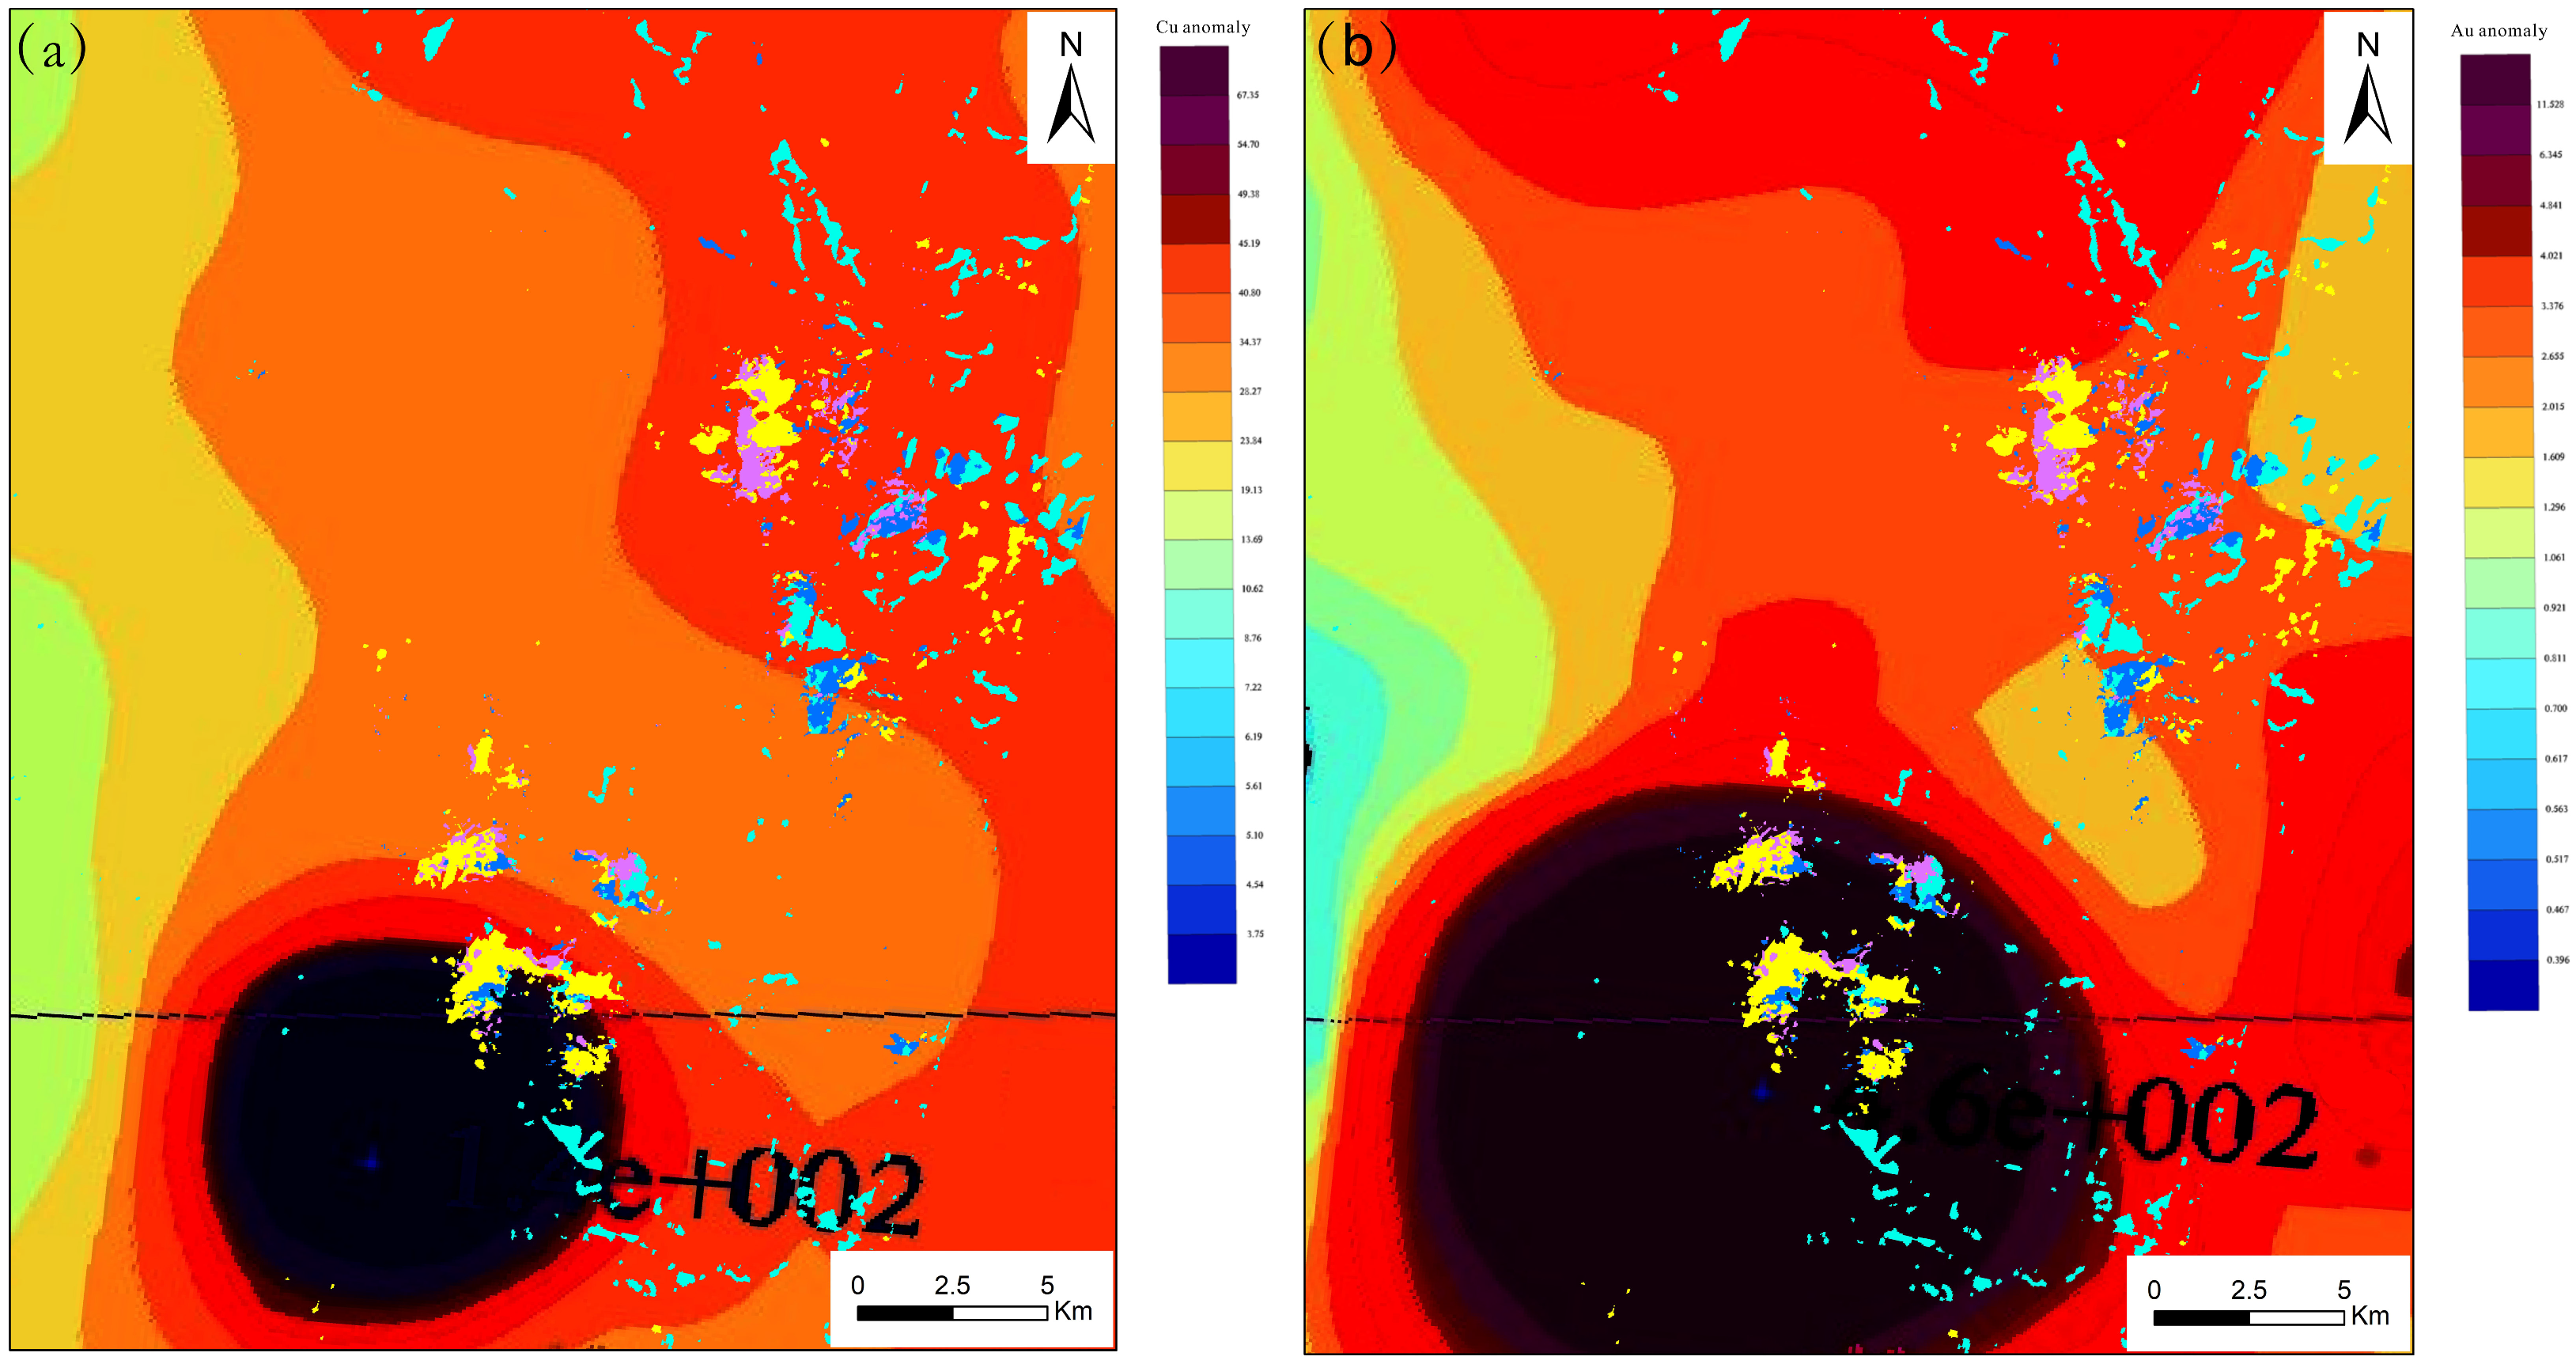
To verify the performance of the Kernel Extreme Learning Machine (KELM) algorithm in extracting mineralization alteration information, the extracted results were compared with field-measured hyperspectral mapping data from a small mining area. The comparison showed that the aerial hyperspectral extraction results closely aligned with the strong mineralization alteration results on the west and southeast sides of the rock mass (Figure 6). The alteration information extracted in this study was mainly distributed around the metal ore points, showing a high degree of consistency with the known ore (mineralization) point distribution (Figure 7). In addition, alteration mineral anomaly information is often related to geochemical factors. To verify the extraction results, we combined them with geochemical anomaly data. The areas near strong remote sensing alteration anomalies showed high geochemical values for Cu and Au, indicating these are key regions for copper and gold mineralization. The extraction results from this study were found to be consistent with the geochemical anomalies (Figure 8). These findings confirm that the KELM algorithm has high accuracy and reliability in identifying and extracting mineralization alteration information.
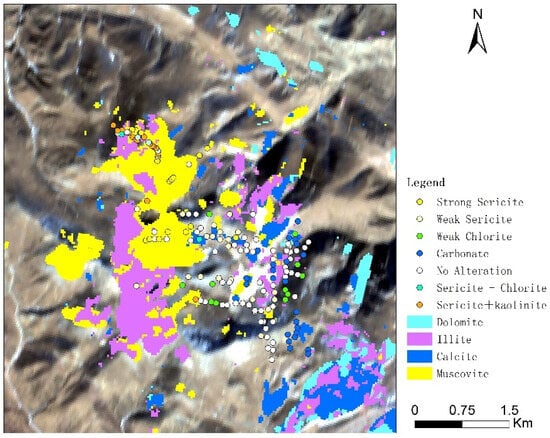
Figure 6.
Results of the measured hyperspectral mapping.
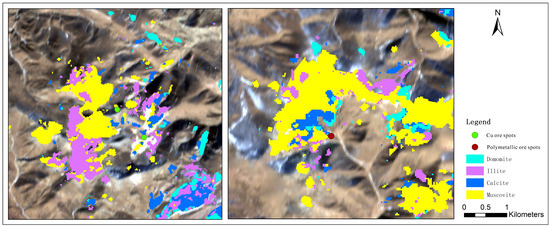
Figure 7.
Results of the known ore spot.
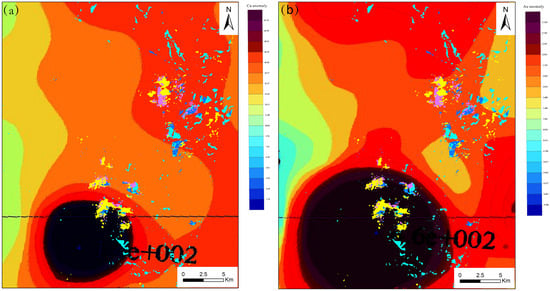
Figure 8.
Geochemical anomalies in the study area: (a) Cu anomaly and (b) Au anomaly.
In order to evaluate the classification performance of the KELM model, a comparison was conducted with the Mixture Tuned Matched Filtering (MTMF) model, which is based on spectral characteristics. The preprocessed hyperspectral data were subjected to a Minimum Noise Fraction (MNF) transform, followed by end-element extraction using the Pixel Purity Index (PPI). The extracted end-member spectra were combined with the MNF results for MTMF processing, and the final mineralization alteration information was obtained. These extraction results were superimposed on the spatial distribution of known deposits (points) in the area and evaluated for accuracy using a coincidence index. The results are shown in Table 4. As shown in Table 4, the KELM algorithm outperformed the MTMF model in terms of overall agreement, confirming that the machine-learning-based recognition model achieves superior extraction results as compared to traditional methods.
Table 4.
Result of the coincidence calculation.
The classification performance of the SSA-KEML model was also compared with that of the Random Forest (RF) and Support Vector Machine (SVM) models, as well as with classification models optimized using particle swarm optimization and grid search methods [25]. The sample dataset used for the model training was derived from spectral angle mapper techniques. The evaluation metrics for the classification results are shown in Table 5 and Table 6, including Producer’s Accuracy (PA), User’s Accuracy (UA), and Overall Accuracy (OA), where higher values indicate greater classification accuracy. The results of the experiment showed that the SSA-KELM model outperforms the other models in extraction, offering superior mapping accuracy and classification performance. Additionally, it provides more precise extraction of remotely sensed alteration mineral information.
Table 5.
Evaluation of the classification results of the three machine learning algorithms.
Table 6.
Accuracy of the results of the three parameter optimization methods.
6. Conclusions
This study presents an SSA-KELM remote-sensing alteration information extraction model using ZY1-02D hyperspectral remote-sensing data, and the results were evaluated comprehensively against regional geological and mineral data. The results indicate that the combination of the SAM method and the KELM algorithm significantly outperforms RF and SVM models in extracting alteration information. Additionally, the SSA also optimizes the parameter selection more effectively than the PSO and ACO algorithms. The extracted mineralization information aligns well with known mine locations and geochemical anomalies in the area, validating the high accuracy and reliability of the KELM algorithm in hyperspectral alteration information extraction. The results suggest that the SSA-KELM model can serve as a powerful tool for mineral resource exploration.
The method effectively addresses the limitations of traditional remote-sensing techniques in extracting mineralization alteration information, particularly in overcoming constraints related to sample size and data dimensionality. It not only reduces the reliance on field investigation and workload but also resolves the challenges associated with parameter selection, which leads to enhanced classification performance and higher classification accuracy. It proves that ZY1-02D, a new type of hyperspectral data, is effective for geological applications. Meanwhile, applying the SSA-KELM model in the southern part of the Yulong Porphyry Copper Belt successfully identified the features of ore deposits in the area, proving the model’s high efficiency and effectiveness in practical geological exploration. This research introduces a novel direction and technical approach for alteration information extraction in regional geological studies.
Due to the limitation of the dataset, this study could not validate the method in other regions to ensure the generalizability of the method. In our future research, we will collect more datasets to validate the method and continue to delve into the application of machine learning in extracting etch information to further validate the applicability of the method. We will also optimize the recognition effect of the classification model and the stability of the algorithm so that it can serve the etching information extraction in remote sensing more effectively.
Author Contributions
Conceptualization, S.Y. and S.T.; methodology, S.Y.; software, S.Y.; formal analysis, S.Y.; investigation, S.Y.; data curation, S.Y.; writing—review and editing, S.Y. and S.T.; supervision, S.T. All authors have read and agreed to the published version of the manuscript.
Funding
This research received no external funding.
Data Availability Statement
The original contributions presented in the study are included in the article. Further inquiries can be directed to the corresponding author.
Conflicts of Interest
The authors declare no conflicts of interest.
References
- Yu, X.L.; Reed, I.S.; Stocker, A.D. Comparative performance analysis of adaptive multispectral detectors. IEEE Trans. Signal Process. 1993, 41, 2639–2656. [Google Scholar] [CrossRef]
- Cheng, X.; Zhang, M.; Lin, S.; Zhou, K.; Zhao, S.; Wang, H. Two-Stream Isolation Forest Based on Deep Features for Hyperspectral Anomaly Detection. IEEE Geosci. Remote Sens. Lett. 2023, 20, 5504205. [Google Scholar] [CrossRef]
- Huo, Y.; Cheng, X.; Lin, S.; Zhang, M.; Wang, H. Memory-Augmented Autoencoder with Adaptive Reconstruction and Sample Attribution Mining for Hyperspectral Anomaly Detection. IEEE Trans. Geosci. Remote Sens. 2024, 62, 5518118. [Google Scholar] [CrossRef]
- Cheng, X.; Huo, Y.; Lin, S.; Dong, Y.; Zhao, S.; Zhang, M.; Wang, H. Deep feature aggregation network for hyperspectral anomaly detection. IEEE Trans. Instrum. Meas. 2024, 1. [Google Scholar] [CrossRef]
- Govil, H.; Gill, N.; Rajendran, S.; Santosh, M.; Kumar, S. Identification of new base metal mineralization in Kumaon Himalaya, India, using hyperspectral remote sensing and hydrothermal alteration. Ore Geol. Rev. 2018, 92, 271–283. [Google Scholar] [CrossRef]
- Bai, Y.; Lv, F.; Su, H.; Wu, Y.; Luan, Z. Review of Hyperspectral Remote Sensing Altered Mineral Information Extraction. Remote Sens. Inf. 2023, 38, 1–10. [Google Scholar]
- Zhang, C.; Ye, F.; Xu, Q.; Liu, H.; Meng, S. MTMF-based Altered Mineral Information for SASI hyperspectral images. Geol. Rev. 2015, 61, 428–429. [Google Scholar]
- Lian, C.; Yao, F.; Chen, M.; Ma, K.; Wang, H. The Study on Alteration Information Extraction of GF-5 Hyperspectral Data in Vegetation Coverage Area: A Case Study of the Yushui Copper Deposit in Guangdong Province. Geoscience 2020, 34, 680–686. [Google Scholar]
- Hecker, C.; van der Meijde, M.; van der Werff, H.; van der Meer, F.D. Assessing the Influence of Reference Spectra on Synthetic SAM Classification Results. IEEE Trans. Geosci. Remote Sens. 2008, 46, 4162–4172. [Google Scholar] [CrossRef]
- Wu, Y.; Sheng, D.; Zhou, Y. Remote sensing mineralization alteration information extraction based on PCA and SVM optimized by cuckoo algorithm. J. Remote Sens. 2018, 22, 810–821. [Google Scholar] [CrossRef]
- Zhang, S.; Xiao, K. Random Forest-Based Mineralization Prediction of the Lala-Type Cu Deposit in the Huili Area, Sichuan Province. Geol. Explor. 2020, 56, 239–252. [Google Scholar]
- Luo, J.; Zhou, Z.; Zou, T.; Liu, B.; Gong, H. Construction of deep prospecting prediction model based on PSO-CNN. J. Chengdu Univ. Technol. Sci. Technol. Ed. 2022, 49, 697–708. [Google Scholar]
- Abdelkader, M.A.; Watanabe, Y.; Shebl, A.; El-Dokouny, H.A.; Dawoud, M.; Csamer, A. Effective delineation of rare metal-bearing granites from remote sensing data using machine learning methods: A case study from the Umm Naggat Area, Central Eastern Desert, Egypt. Ore Geol. Rev. 2022, 150, 105184. [Google Scholar] [CrossRef]
- Ni, J.; Suo, L.; Liu, H.; Rui, Z. Identification of Corn Varieties Based on Northern Goshawk Optimization Kernel Based Extreme Learning Machine. Spectrosc. Spectr. Anal. 2024, 44, 1584–1590. [Google Scholar]
- Zhang, Y.; Chen, Y.; Zhao, S. A Key Data Query Model for Introducing Neural Network Extreme Learning Machine. Comput. Simul. 2024, 41, 519–523. [Google Scholar]
- Xie, B.; Ma, J.; Zhou, Y.; Han, X.; Chen, J.; Zhu, S.; Yang, M.; Huang, F. Identification of Citri Grandis Fructus Immaturus Based on Hyperspectral Combined With HHO-KELM. Spectrosc. Spectr. Anal. 2024, 44, 1494–1500. [Google Scholar] [CrossRef]
- Wang, R.; Xu, X.; Lu, J. Short-term Wind Power Prediction Based on SSA Optimized Variational Mode Decomposition and Hybrid Kernel Extreme Learning Machine. Inf. Control. 2023, 52, 444–454. [Google Scholar]
- Feng, L.; Zhang, J.; Zhan, Y. Combustion optimization of utility boilers based on ISSA and KELM. Therm. Power Gener. 2022, 51, 96–102. [Google Scholar]
- He, Z.; He, B. Weight Spectral Angle Mapper (WSAM) Method for Hyperspectral Mineral Mapping. Spectrosc. Spectr. Anal. 2011, 31, 2200–2204. [Google Scholar] [CrossRef]
- Chen, X.; Huang, W.; Zou, Y.; Liang, H.; Zhang, J.; Zhang, Y. Zircon U-Pb geochronology and geochemistry of ore-bearing porphyries in the southern Yulong porphyry copper belt, and factors resulting in the differences in scale of mineralization between the southern and northern Yulong porphyry copper belt. Acta Petrol. Sin. 2016, 32, 2522–2534. [Google Scholar]
- Sun, Y.; Liu, J.; Zhai, D.; Liu, Z.; Zhang, F.; Zhao, Y.; Liu, P.; Wang, Z. Alteration Minerals Mapping and Identification of Gold Mineralization Belt Based on ZY1-02D Hyper spectral Data in the Toudiaoquan-Nandatan Area, Gansu Province. Geol. Explor. 2022, 58, 399–409. [Google Scholar]
- Su, H. Dimensionality reduction for hyperspectral remote sensing: Advances, challenges, and prospects. Natl. Remote Sens. Bull. 2022, 26, 1504–1529. [Google Scholar] [CrossRef]
- Savitzky, A.; Golay, M.J. Smoothing and differentiation of data by simplified least squares procedures. Anal. Chem. 1964, 36, 1627–1639. [Google Scholar] [CrossRef]
- Tian, Q.; Pan, W.; Li, Y.; Zhang, C.; Chen, X.; Yu, Z. Extraction of alteration information from hyperspectral core imaging based on wavelet packet transform and weight spectral angle mapper. Remote Sens. Land Resour. 2019, 31, 41–46. [Google Scholar]
- Wang, Z.; Zhang, H. A Classification Model for Remote Sensing lmages Based on SAM and Decision Tree. J. Wuhan Univ. Sci. Technol. 2006, 478–481. [Google Scholar]
- Huang, G.; Zhou, H.; Ding, X.; Zhang, R. Extreme Learning Machine for Regression and Multiclass Classification. IEEE Trans. Syst. Man Cybern. Part B—Cybern. 2012, 42, 513–529. [Google Scholar] [CrossRef] [PubMed]
- Xue, J.; Shen, B. A novel swarm intelligence optimization approach: Sparrow search algorithm. Syst. Sci. Control. Eng. 2020, 8, 22–34. [Google Scholar] [CrossRef]
- Zhang, J.; Xia, K.; He, Z.; Yin, Z.; Wang, S. Semi-Supervised Ensemble Classifier with Improved Sparrow Search Algorithm and Its Application in Pulmonary Nodule Detection. Math. Probl. Eng. 2021, 2021, 6622935. [Google Scholar] [CrossRef]
- Qiang, Y.; Zhi, Z.; Qin, Z.; Li, W. Decomposition Technique of Mixed Pixel Used in Monitoring and Evaluation of Water Quality Based on ASTER. Remote Sens. Inf. 2011, 28, 20–25+85. [Google Scholar]


Disclaimer/Publisher’s Note: The statements, opinions and data contained in all publications are solely those of the individual author(s) and contributor(s) and not of MDPI and/or the editor(s). MDPI and/or the editor(s) disclaim responsibility for any injury to people or property resulting from any ideas, methods, instructions or products referred to in the content. |
© 2024 by the authors. Licensee MDPI, Basel, Switzerland. This article is an open access article distributed under the terms and conditions of the Creative Commons Attribution (CC BY) license (https://creativecommons.org/licenses/by/4.0/).