
Assessment of Habitat Quality in Arid Regions Incorporating Remote Sensing Data and Field Experiments


Abstract
:1. Introduction
2. Materials and Methods
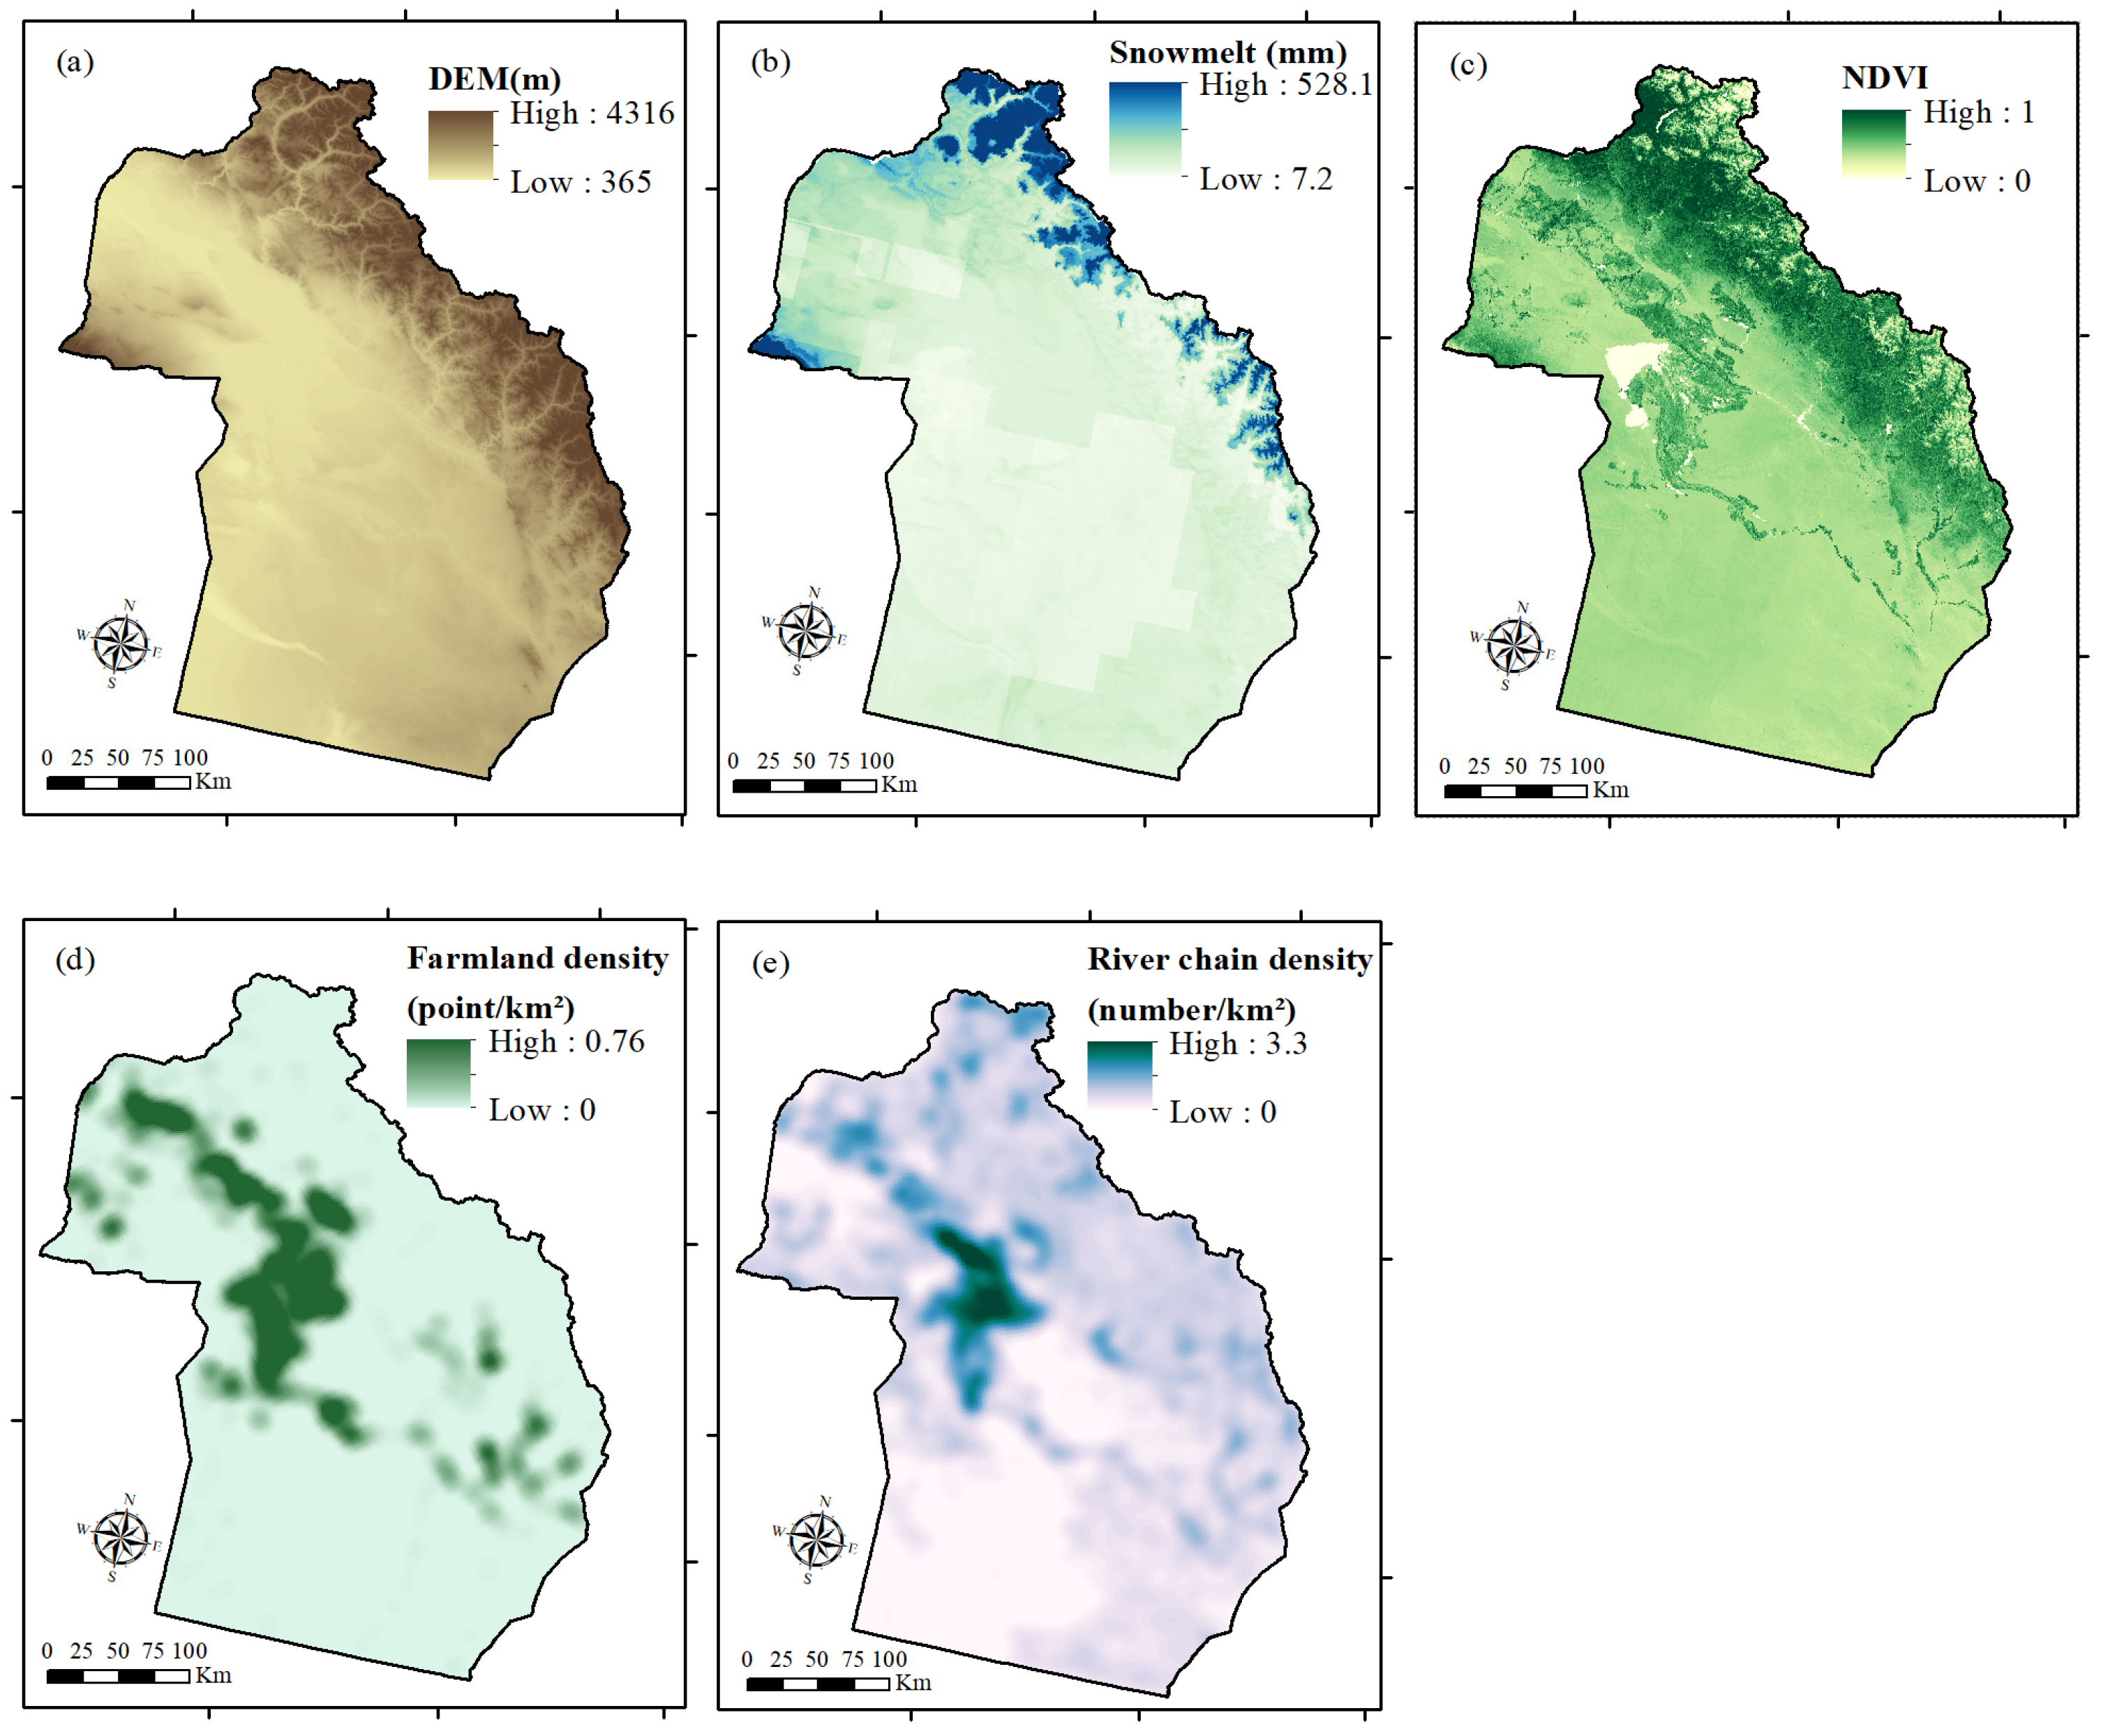
2.1. Study Area
2.2. Data Sources
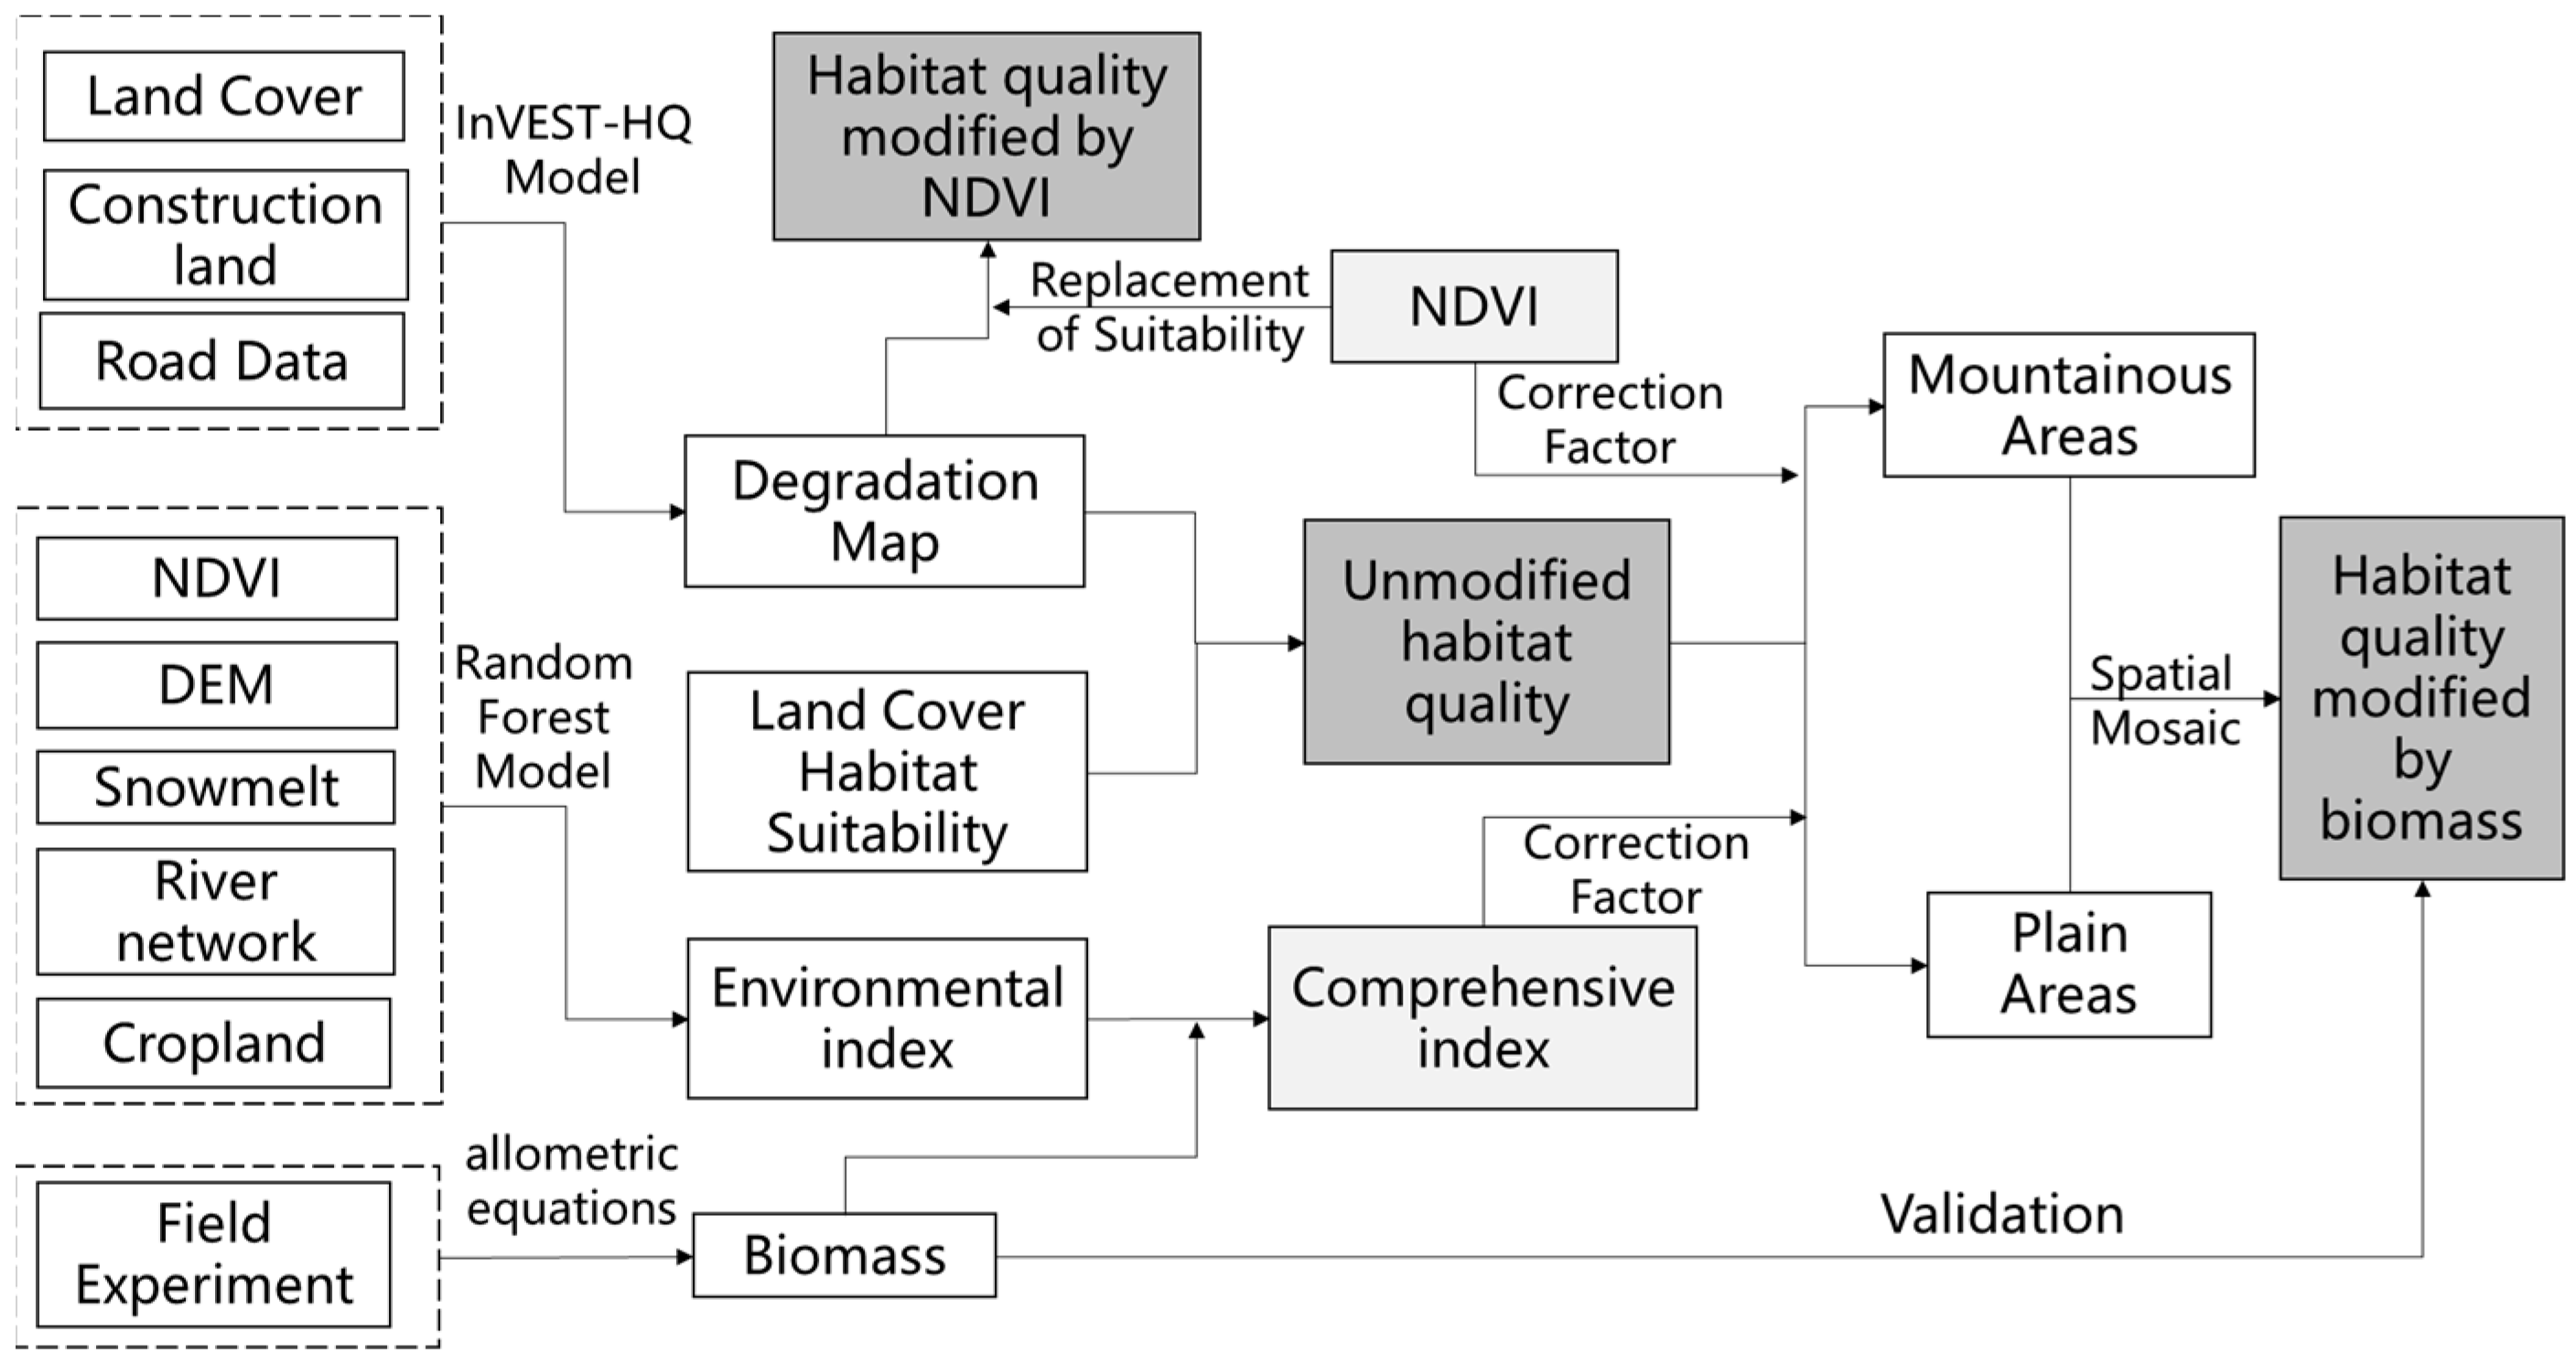
2.3. Methods
2.3.1. Biomass Estimation
2.3.2. Habitat Quality Assessment
2.3.3. Original Model Modification
3. Results
3.1. Interannual Variation in Habitat Quality in Altai Region
3.2. Trends in Habitat Quality by Region and Land Cover
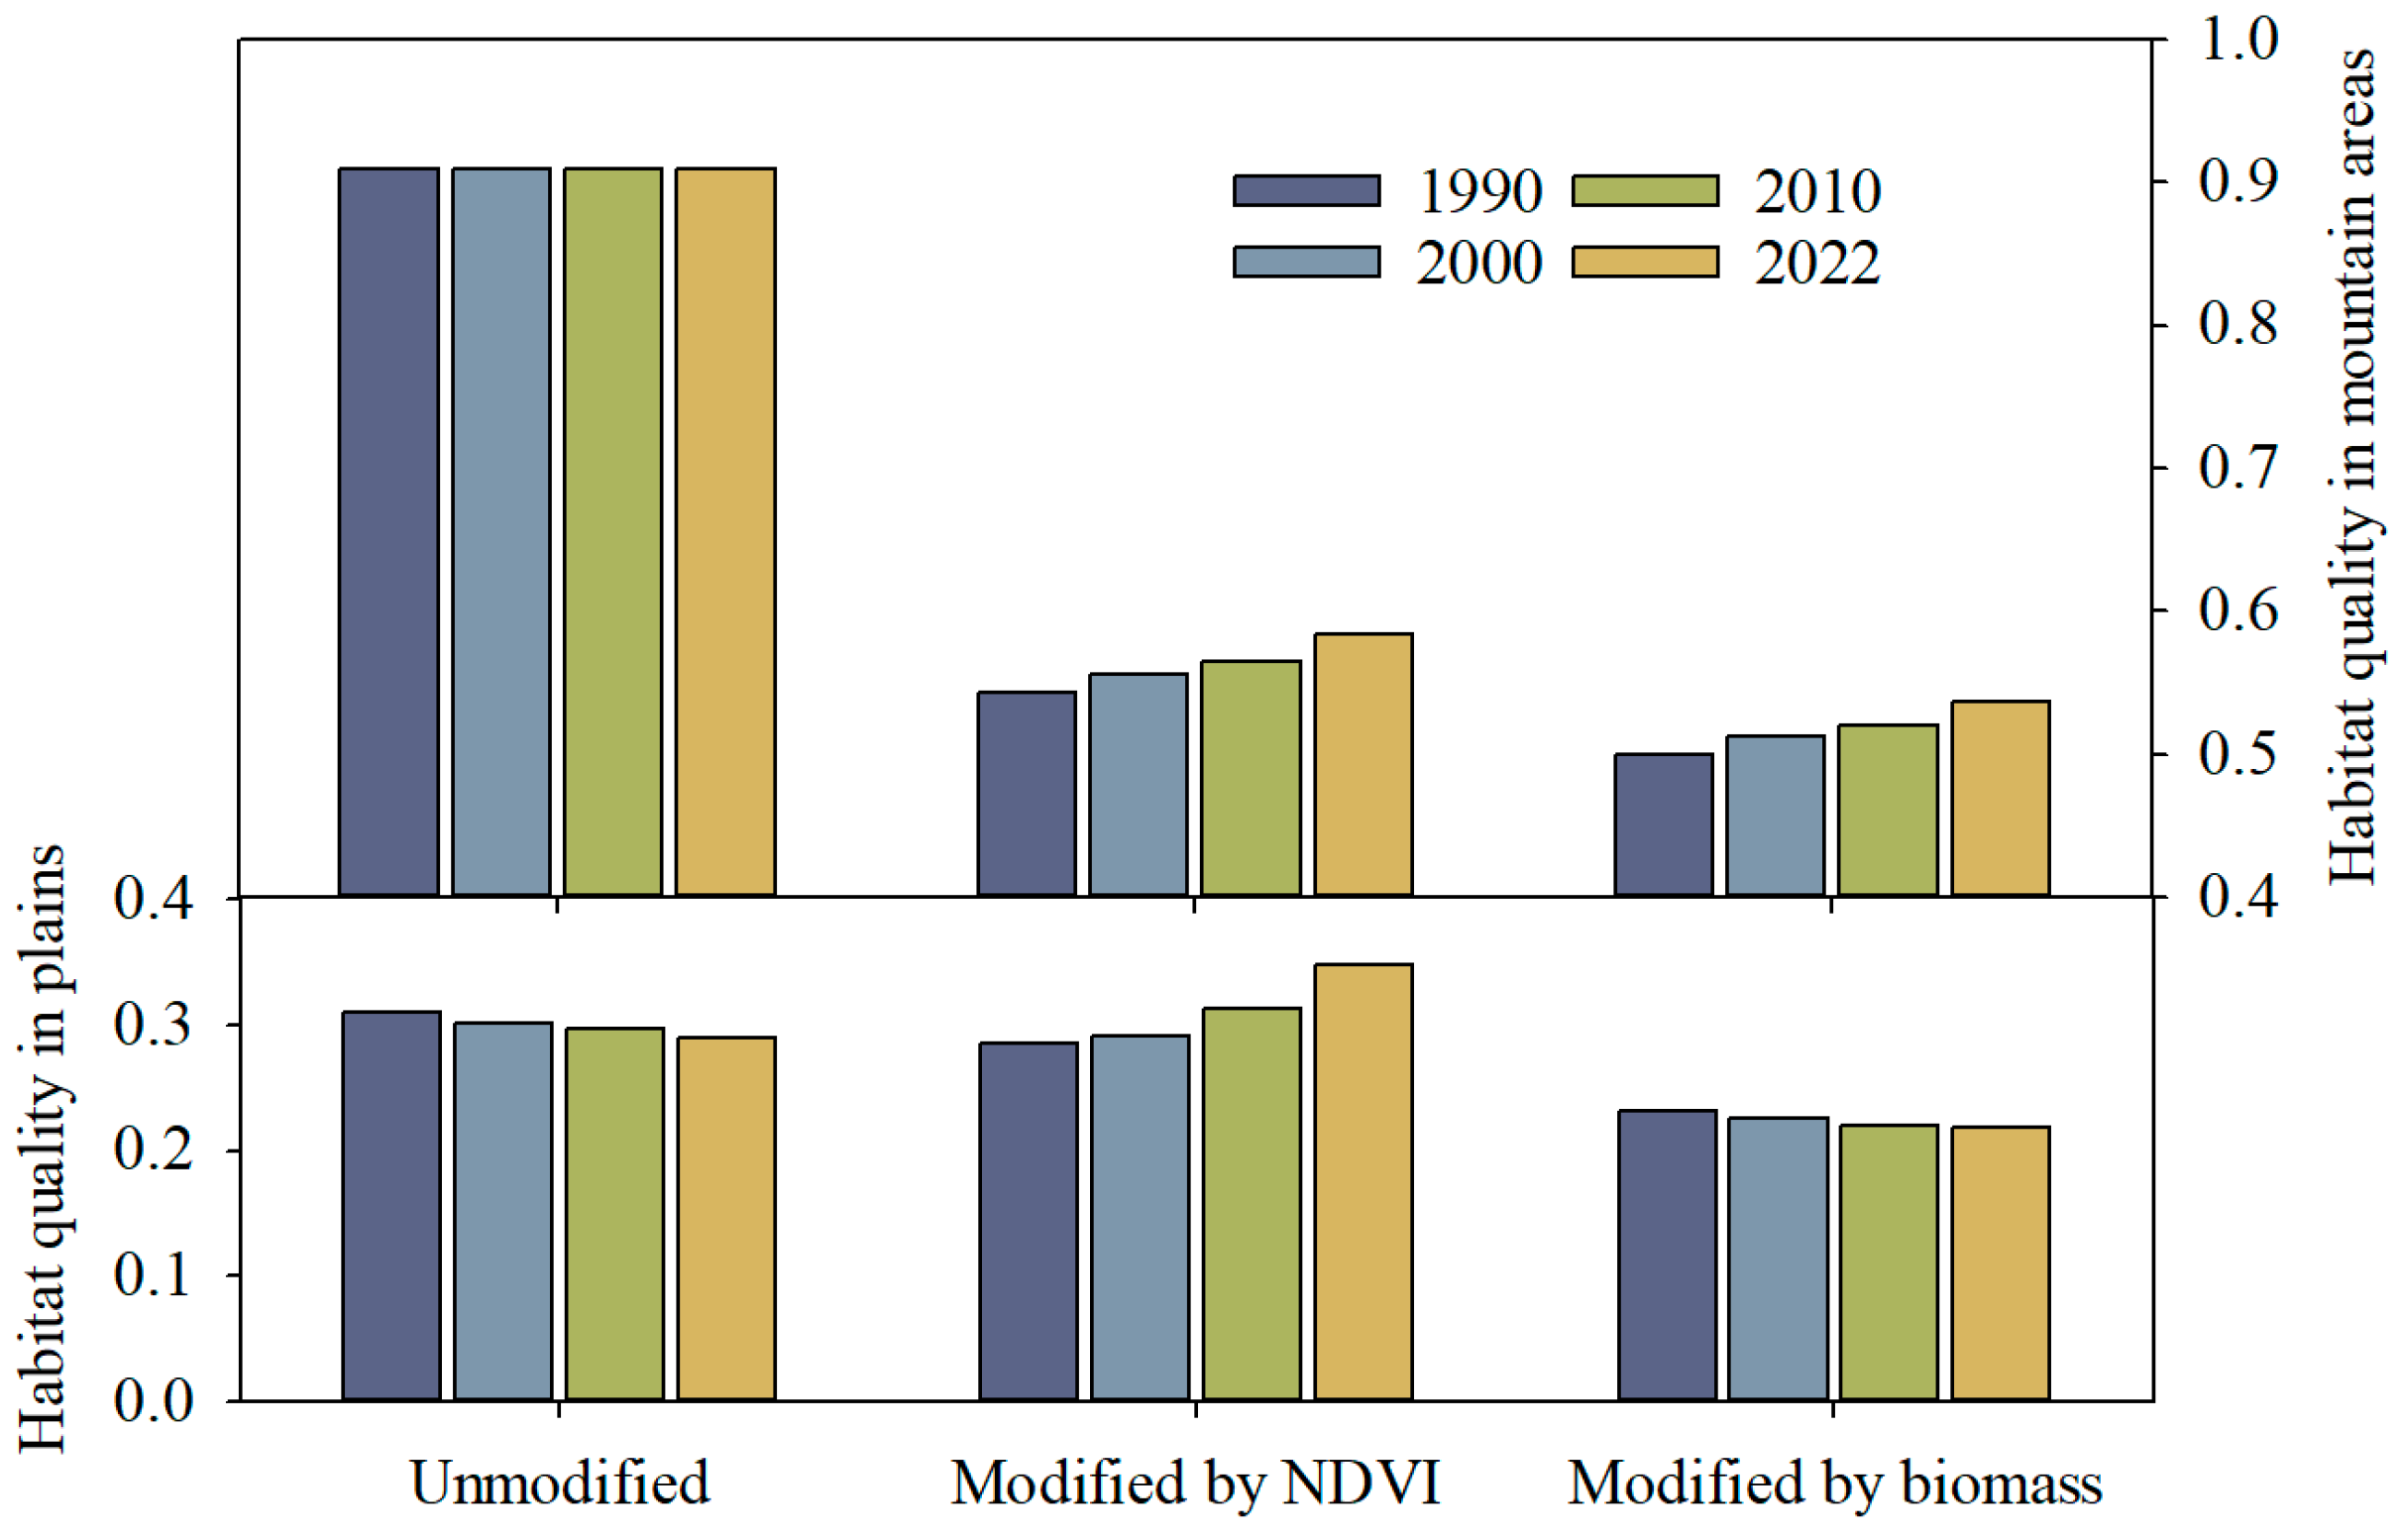
3.2.1. Habitat Quality in Mountainous and Plain Areas
3.2.2. Habitat Quality of Each Land Cover Type
3.3. Validation
4. Discussion
4.1. Dynamics of Habitat Quality
4.2. Applicability of the Model
5. Conclusions
Author Contributions
Funding
Conflicts of Interest
References
- Chen, W.; Gu, T.; Xiang, J.; Luo, T.; Zeng, J.; Yuan, Y. Ecological restoration zoning of territorial space in China: An ecosystem health perspective. J. Environ. Manag. 2024, 364, 121371. [Google Scholar] [CrossRef] [PubMed]
- Xie, Z.-X.; Zhang, B.; Shi, Y.-T.; Zhang, X.-Y.; Sun, Z.-X. Changes and protections of urban habitat quality in Shanghai of China. Sci. Rep. 2023, 13, 10976. [Google Scholar] [CrossRef]
- Tang, L.; Ke, X.; Chen, Y.; Wang, L.; Zhou, Q.; Zheng, W.; Xiao, B.J. Which impacts more seriously on natural habitat loss and degradation? Cropland expansion or urban expansion? Land Degrad. Dev. 2021, 32, 946–964. [Google Scholar] [CrossRef]
- Shao, Q.J. Assessing the sustainability of socio-economic boundaries in China: A downscaled “safe and just space” framework. NPJ Clim. Action 2023, 2, 28. [Google Scholar] [CrossRef]
- Wang, Z.; Liu, S.; Su, Y. Spatiotemporal evolution of habitat quality and its response to landscape patterns in karst mountainous cities: A case study of Guiyang City in China. Environ. Sci. Pollut. Res. 2023, 30, 114391–114405. [Google Scholar] [CrossRef] [PubMed]
- Kovac, M.; Gasparini, P.; Notarangelo, M.; Rizzo, M.; Cañellas, I.; Fernández-de-Uña, L.; Alberdi, I. Towards a set of national forest inventory indicators to be used for assessing the conservation status of the habitats directive forest habitat types. J. Nat. Conserv. 2020, 53, 125747. [Google Scholar] [CrossRef]
- Bai, L.; Xiu, C.; Feng, X.; Liu, D. Influence of urbanization on regional habitat quality: A case study of Changchun City. Habitat Int. 2019, 93, 102042. [Google Scholar] [CrossRef]
- Liu, X.; Liang, X.; Li, X.; Xu, X.; Ou, J.; Chen, Y.; Li, S.; Wang, S.; Pei, F. A future land cover simulation model (FLUS) for simulating multiple land cover scenarios by coupling human and natural effects. Landsc. Urban Plan. 2017, 168, 94–116. [Google Scholar] [CrossRef]
- Xiao, R.; Yin, H.; Liu, R.; Zhang, Z.; Chinzorig, S.; Qin, K.; Tan, W.; Wan, Y.; Gao, Z.; Xu, C.; et al. Exploring the relationship between land cover change patterns and variation in environmental factors within urban agglomeration. Sustain. Cities Soc. 2024, 108, 105447. [Google Scholar] [CrossRef]
- Li, X.; Zhang, X.; Feng, H.; Li, Y.; Yu, J.; Liu, Y.; Du, H. Dynamic evolution and simulation of habitat quality in arid regions: A case study of the Hexi region, China. Ecol. Model. 2024, 493, 110726. [Google Scholar] [CrossRef]
- Wu, J.; Luo, J.; Zhang, H.; Qin, S.; Yu, M. Projections of land cover change and habitat quality assessment by coupling climate change and development patterns. Sci. Total Environ. 2022, 847, 157491. [Google Scholar] [CrossRef] [PubMed]
- Zheng, L.; Wang, Y.; Li, J. Quantifying the spatial impact of landscape fragmentation on habitat quality: A multi-temporal dimensional comparison between the Yangtze River Economic Belt and Yellow River Basin of China. Land Cover Policy 2023, 125, 106463. [Google Scholar] [CrossRef]
- Guan, D.J.; Ran, B.W.; Zhou, L.L.; Jin, C.J.; Yu, X. Assessing and transferring social value of ecosystem services in wetland parks based on SolVES model. Ecol. Indic. 2023, 157, 111300. [Google Scholar] [CrossRef]
- Monnier-Corbel, A.; Robert, A.; Hingrat, Y.; Benito, B.M.; Monnet, A.C. Species Distribution Models predict abundance and its temporal variation in a steppe bird population. Glob. Ecol. Conserv. 2023, 43, e02442. [Google Scholar] [CrossRef]
- Wang, L.; Huang, L.; Cao, W.; Zhai, J.; Fan, J.W. Assessing grassland cultural ecosystem services supply and demand for promoting the sustainable realization of grassland cultural values. Sci. Total Environ. 2024, 912, 169255. [Google Scholar] [CrossRef] [PubMed]
- Yu, W.; Wen, J.; Chen, X.; Gong, Y.; Liu, B. Trans-Pacific multidecadal changes of habitat patterns of two squid species. Fish. Res. 2021, 233, 105762. [Google Scholar] [CrossRef]
- Zhang, J.; Fu, Y.C.; Peng, W.Q.; Zhao, J.Y.; Fu, G.S. Interactive influences of ecosystem services and socioeconomic factors on watershed eco-compensation standard “popularization” based on natural based solutions. Heliyon 2022, 8, e12503. [Google Scholar] [CrossRef] [PubMed]
- Li, H.D.; Shi, D.M. Spatio-temporal variation in soil erosion on sloping farmland based on the integrated valuation of ecosystem services and trade-offs model: A case study of Chongqing, southwest China. Catena 2024, 236, 107693. [Google Scholar] [CrossRef]
- Shi, N.A.; Yang, H.C.; Wang, Q.; Han, Y.; Yan, H.M.; Xiao, N.W. Spatiotemporal variation of habitat quality and its response to fractional vegetation cover change and human disturbance in the Loess Plateau. Front. Ecol. Evol. 2023, 11, 1302224. [Google Scholar] [CrossRef]
- Bowler, E.; Lefebvre, V.; Pfeifer, M.; Ewers, R.M. Optimising sampling designs for habitat fragmentation studies. Methods Ecol. Evol. 2022, 13, 217–229. [Google Scholar] [CrossRef]
- Feher, L.C.; Allain, L.K.; Osland, M.J.; Pigott, E.; Reid, C.; Latiolais, N. A comparison of plant communities in restored, old field, and remnant coastal prairies. Restor. Ecol. 2021, 29, 13325. [Google Scholar] [CrossRef]
- Vandever, M.W.; Elgersma, K.; Carter, S.K.; Wen, A.; Welty, J.L.; Arkle, R.S.; Assal, T.J.; Pilliod, D.S.; Mushet, D.M.; Iovanna, R. Persistence and quality of vegetation cover in expired Conservation Reserve Program fields. Ecosphere 2023, 14, e4359. [Google Scholar] [CrossRef]
- Mengist, W.; Soromessa, T.; Feyisa, G.L. Landscape change effects on habitat quality in a forest biosphere reserve: Implications for the conservation of native habitats. J. Clean. Prod. 2021, 329, 129778. [Google Scholar] [CrossRef]
- Terrado, M.; Sabater, S.; Chaplin-Kramer, B.; Mandle, L.; Ziv, G.; Acuña, V. Model development for the assessment of terrestrial and aquatic habitat quality in conservation planning. Sci. Total Environ. 2016, 540, 63–70. [Google Scholar] [CrossRef] [PubMed]
- Adelisardou, F.; Zhao, W.; Chow, R.; Mederly, P.; Minkina, T.; Schou, J.S. Spatiotemporal change detection of carbon storage and sequestration in an arid ecosystem by integrating Google Earth Engine and InVEST (the Jiroft plain, Iran). Int. J. Environ. Sci. Technol. 2022, 19, 5929–5944. [Google Scholar] [CrossRef]
- Liu, Y.; Wang, Y.; Lin, Y.; Ma, X.; Guo, S.; Ouyang, Q.; Sun, C. Habitat Quality Assessment and Driving Factors Analysis of Guangdong Province, China. Sustainability 2023, 15, 11615. [Google Scholar] [CrossRef]
- Wang, B.; Cheng, W. Effects of land use/cover on regional habitat quality under different geomorphic types based on InVEST model. Remote Sens. 2022, 14, 1279. [Google Scholar] [CrossRef]
- Fernández, M.; Vitiello, A.; Erb, M.; Poelman, E.H. Plant defense strategies against attack by multiple herbivores. Trends Plant Sci. 2022, 27, 528–535. [Google Scholar] [CrossRef]
- Chen, X.; Yu, L.; Cao, Y.; Xu, Y.; Zhao, Z.; Zhuang, Y.; Liu, X.; Du, Z.; Liu, T.; Yang, B.; et al. Habitat quality dynamics in China’s first group of national parks in recent four decades: Evidence from land cover and land cover changes. J. Environ. Manag. 2023, 325, 116505. [Google Scholar] [CrossRef] [PubMed]
- Wu, J.; Li, X.; Luo, Y.; Zhang, D. Spatiotemporal effects of urban sprawl on habitat quality in the Pearl River Delta from 1990 to 2018. Sci. Rep. 2021, 11, 13981. [Google Scholar] [CrossRef]
- Zhu, C.; Zhang, X.; Zhou, M.; He, S.; Gan, M.; Yang, L.; Wang, K. Impacts of urbanization and landscape pattern on habitat quality using OLS and GWR models in Hangzhou, China. Ecol. Indic. 2020, 117, 106654. [Google Scholar] [CrossRef]
- Tang, Z.; Zhou, Z.; Wang, D.; Luo, F.; Bai, J.; Fu, Y. Impact of vegetation restoration on ecosystem services in the Loess plateau, a case study in the Jinghe Watershed, China. Ecol. Indic. 2022, 142, 109183. [Google Scholar] [CrossRef]
- Wang, Y.; Quan, D.; Zhu, W.; Lin, Z.; Jin, R. Habitat Quality Assessment under the Change of Vegetation Coverage in the Tumen River Cross-Border Basin. Sustainability 2023, 15, 9269. [Google Scholar] [CrossRef]
- Tobisch, C.; Rojas-Botero, S.; Uhler, J.; Kollmann, J.; Müller, J.; Moning, C.; Redlich, S.; Steffan-Dewenter, I.; Benjamin, C.; Englmeier, J.; et al. Conservation-relevant plant species indicate arthropod richness across trophic levels: Habitat quality is more important than habitat amount. Ecol. Indic. 2023, 148, 110039. [Google Scholar] [CrossRef]
- Fenetahun, Y.; Yuan, Y.; Xu, X.-W.; Wang, Y.-D. Borana rangeland of southern Ethiopia: Estimating biomass production and carrying capacity using field and remote sensing data. Plant Divers. 2022, 44, 598–606. [Google Scholar] [CrossRef]
- Huang, S.; Tang, L.N.; Hupy, J.P.; Wang, Y.; Shao, G.F. A commentary review on the use of normalized difference vegetation index (NDVI) in the era of popular remote sensing. J. For. Res. 2021, 32, 1–6. [Google Scholar] [CrossRef]
- Jimenez, R.B.; Lane, K.J.; Hutyra, L.R.; Fabian, M.P. Spatial resolution of Normalized Difference Vegetation Index and greenness exposure misclassification in an urban cohort. J. Expo. Sci. Environ. Epidemiol. 2022, 32, 213–222. [Google Scholar] [CrossRef]
- Jin, H.; Chen, X.; Wang, Y.; Zhong, R.; Zhao, T.; Liu, Z.; Tu, X. Spatio-temporal distribution of NDVI and its influencing factors in China. J. Hydrol. 2021, 603, 127129. [Google Scholar] [CrossRef]
- Martinez, A.d.l.I.; Labib, S.M. Demystifying normalized difference vegetation index (NDVI) for greenness exposure assessments and policy interventions in urban greening. Environ. Res. 2023, 220, 115155. [Google Scholar] [CrossRef]
- Xue, J.; Ge, Y.; Ren, H. Spatial upscaling of green aboveground biomass derived from MODIS-based NDVI in arid and semiarid grasslands. Adv. Space Res. 2017, 60, 2001–2008. [Google Scholar] [CrossRef]
- Donovan, G.H.; Gatziolis, D.; Derrien, M.; Michael, Y.L.; Prestemon, J.P.; Douwes, J. Shortcomings of the normalized difference vegetation index as an exposure metric. Nat. Plants 2022, 8, 617–622. [Google Scholar] [CrossRef]
- Li, C.; Fu, B.; Wang, S.; Stringer, L.C.; Wang, Y.; Li, Z.; Liu, Y.; Zhou, W. Drivers and impacts of changes in China’s drylands. Nat. Rev. Earth Environ. 2021, 2, 858–873. [Google Scholar] [CrossRef]
- Li, H.; Cao, Y.; Xiao, J.; Yuan, Z.; Hao, Z.; Bai, X.; Wu, Y.; Liu, Y. A daily gap-free normalized difference vegetation index dataset from 1981 to 2023 in China. Sci. Data 2024, 11, 527. [Google Scholar] [CrossRef] [PubMed]
- Zhang, J.; Deng, M.; Yang, T.; Pang, M.; Wang, Z. Spatiotemporal pattern of reference crop evapotranspiration and its response to meteorological factors in northwest China over years 2000–2019. Environ. Sci. Pollut. Res. 2022, 29, 69831–69848. [Google Scholar] [CrossRef]
- Ma, R.; Lü, Y.; Fu, B.; Lü, D.; Wu, X.; Sun, S.; Zhang, Y. A modified habitat quality model to incorporate the effects of ecological restoration. Environ. Res. Lett. 2022, 17, 104029. [Google Scholar] [CrossRef]
- Pati, P.K.; Kaushik, P.; Khan, M.L.; Khare, P.K. Allometric equations for biomass and carbon stock estimation of small diameter woody species from tropical dry deciduous forests: Support to REDD+. Trees For. People 2022, 9, 100289. [Google Scholar] [CrossRef]
- Nematollahi, S.; Fakheran, S.; Kienast, F.; Jafari, A. Application of InVEST habitat quality module in spatially vulnerability assessment of natural habitats (case study: Chaharmahal and Bakhtiari province, Iran). Environ. Monit. Assess. 2020, 192, 487. [Google Scholar] [CrossRef] [PubMed]
- Lu, Y.; Zhao, J.; Qi, J.; Rong, T.; Wang, Z.; Yang, Z.; Han, F. Monitoring the Spatiotemporal Dynamics of Habitat Quality and Its Driving Factors Based on the Coupled NDVI-InVEST Model: A Case Study from the Tianshan Mountains in Xinjiang, China. Land 2022, 11, 1805. [Google Scholar] [CrossRef]
- Liu, F.-T.; Xu, E.-Q. Comparison of spatial-temporal evolution of habitat quality between Xinjiang Corps and Non-corps Region based on land cover. J. Appl. Ecol. 2020, 31, 2341–2351. [Google Scholar]
- Wang, B.; Cheng, W.; Lan, S. Impact of land cover changes on habitat quality in Altai region. J. Resour. Ecol. 2021, 12, 715–728. [Google Scholar]
- Cao, C.; Luo, Y.; Xu, L.; Xi, Y.; Zhou, Y. Construction of ecological security pattern based on InVEST-Conefor-MCRM: A case study of Xinjiang, China. Ecol. Indic. 2024, 159, 111647. [Google Scholar] [CrossRef]
- Yi, S.; Wang, H.; Xie, L.; Wang, C.; Huang, X. Spatio-Temporal Dynamics and Drivers of Ecosystem Service Bundles in the Altai region: Implications for Sustainable Land Management. Land 2024, 13, 805. [Google Scholar] [CrossRef]
- Fan, Y.; Wang, H.; Yang, S.; Liu, Q.; Heng, J.; Gao, Y.B. Identification of ecological protection crucial areas in Altay Prefecture based on habitat quality and ecological security pattern. Acta Ecol. Sin. 2021, 41, 7614–7626. [Google Scholar]
- Zhang, D.; Feng, Z. Holocene climate variations in the Altai Mountains and the surrounding areas: A synthesis of pollen records. Earth-Sci. Rev. 2018, 185, 847–869. [Google Scholar] [CrossRef]
- Qin, S.; Xiao, P.; Zhang, X. How do snow cover fraction change and respond to climate in Altai Mountains of China? Int. J. Climatol. 2022, 42, 7213–7227. [Google Scholar] [CrossRef]
- Rudaya, N.; Krivonogov, S.; Słowiński, M.; Cao, X.; Zhilich, S. Postglacial history of the Steppe Altai: Climate, fire and plant diversity. Quat. Sci. Rev. 2020, 249, 106616. [Google Scholar] [CrossRef]
- Cai, E.; Zhang, S.; Chen, W.; Li, L. Spatio–temporal dynamics and human–land synergistic relationship of urban expansion in Chinese megacities. Heliyon 2023, 9, e19872. [Google Scholar] [CrossRef]
- Wang, C.; Liu, S.; Zhou, S.; Zhou, J.; Jiang, S.; Zhang, Y.; Feng, T.; Zhang, H.; Zhao, Y.; Lai, Z.; et al. Spatial-temporal patterns of urban expansion by land cover/land cover transfer in China. Ecol. Indic. 2023, 155, 111009. [Google Scholar] [CrossRef]
- He, G.; Zhang, C.; Dong, Z. Survival in desert: Extreme water adaptations and bioinspired structural designs. iScience 2023, 26, 105819. [Google Scholar] [CrossRef]
- Wang, X.; Geng, X.; Liu, B.; Cai, D.; Li, D.; Xiao, F.; Zhu, B.; Hua, T.; Lu, R.; Liu, F. Desert ecosystems in China: Past, present, and future. Earth-Sci. Rev. 2022, 234, 104206. [Google Scholar] [CrossRef]
- Zhou, S.; Long, H.; Xing, H.; Zhang, K.; Wang, R.; Zhang, E. Human activities facilitated the decline of forest ecosystem in East Asia after 5000 a BP. Earth-Sci. Rev. 2023, 245, 104552. [Google Scholar] [CrossRef]
- Li, X.B.; Lyu, X.; Dou, H.S.; Dang, D.L.; Li, S.K.; Li, X.; Li, M.Y.; Xuan, X.J. Strengthening grazing pressure management to improve grassland ecosystem services. Glob. Ecol. Conserv. 2021, 31, e01782. [Google Scholar] [CrossRef]
- Deng, X.; Greet, J.; Jones, C.S. Soil moisture influences the root characteristics of a herbaceous riparian plant along a regulated river. Plant Ecol. 2024, 225, 25–36. [Google Scholar] [CrossRef]
- Manghwar, H.; Hussain, A.; Alam, I.; Khoso, M.A.; Ali, Q.; Liu, F. Waterlogging stress in plants: Unraveling the mechanisms and impacts on growth, development, and productivity. Environ. Exp. Bot. 2024, 224, 105824. [Google Scholar] [CrossRef]
- Tembata, K.; Yamamoto, Y.; Yamamoto, M.; Matsumoto, K. Don’t rely too much on trees: Evidence from flood mitigation in China. Sci. Total Environ. 2020, 732, 138410. [Google Scholar] [CrossRef]
- Feng, Y.; Shi, Y.; Zhao, M.; Shen, H.; Xu, L.; Luo, Y.; Liu, Y.; Xing, A.; Kang, J.; Jing, H.; et al. Yield and quality properties of alfalfa (Medicago sativa L.) and their influencing factors in China. Eur. J. Agron. 2022, 141, 126637. [Google Scholar] [CrossRef]
- Lv, C.; Schlecht, E.; Goenster-Jordan, S.; Buerkert, A.; Zhang, X.; Wesche, K. Vegetation Responses to Fixed Stocking Densities in Highly Variable Montane Pastures in the Chinese Altay. Rangel. Ecol. Manag. 2019, 72, 812–821. [Google Scholar] [CrossRef]
- Zhang, S.; Jia, W.; Zhu, H.; You, Y.; Zhao, C.; Gu, X.; Liu, M. Vegetation growth enhancement modulated by urban development status. Sci. Total Environ. 2023, 883, 163626. [Google Scholar] [CrossRef]
- Zhao, C.; Zhu, H.; Zhang, S.; Jin, Z.; Zhang, Y.; Wang, Y.; Shi, Y.; Jiang, J.; Chen, X.; Liu, M. Long—term trends in surface thermal environment and its potential drivers along the urban development gradients in rapidly urbanizing regions of China. Sustain. Cities Soc. 2024, 105, 105324. [Google Scholar] [CrossRef]
- Qiao, L.; Wang, X.; Smith, P.; Fan, J.; Lu, Y.; Emmett, B.; Li, R.; Dorling, S.; Chen, H.; Liu, S.; et al. Soil quality both increases crop production and improves resilience to climate change. Nat. Clim. Chang. 2022, 12, 574–580. [Google Scholar] [CrossRef]
- Yang, Z.; Fang, C.; Mu, X.; Li, G.; Xu, G. Urban green space quality in China: Quality measurement, spatial heterogeneity pattern and influencing factor. Urban For. Urban Green. 2021, 66, 127381. [Google Scholar] [CrossRef]
- Fan, J.; Abudumanan, A.; Wang, L.; Zhou, D.; Wang, Z.; Liu, H. Dynamic Assessment and Sustainability Strategies of Ecological Security in the Irtysh River Basin of Xinjiang, China. Chin. Geogr. Sci. 2023, 33, 393–409. [Google Scholar] [CrossRef] [PubMed]
- Qin, Y.; Aldyarhan, K.; Zhang, Z.; Liu, P.; Liu, H.; Li, Y. The Main Problems of the Water Ecological Environment and Protective Countermeasures in the River Basin of the Altai region, Xinjiang. J. Resour. Ecol. 2023, 14, 383–390. [Google Scholar] [CrossRef]
- Ji, X.; Sun, Y.; Guo, W.; Zhao, C.; Li, K. Land cover and habitat quality change in the Yellow River Basin: A perspective with different CMIP6-based scenarios and multiple scales. J. Environ. Manag. 2023, 345, 118729. [Google Scholar] [CrossRef] [PubMed]
- Wang, Q.; Wang, H.; Chang, R.; Zeng, H.; Bai, X. Dynamic simulation patterns and spatiotemporal analysis of land-use/land-cover changes in the Wuhan metropolitan area, China. Ecol. Model. 2022, 464, 109850. [Google Scholar] [CrossRef]
- Zheng, H.; Li, H. Spatial–temporal evolution characteristics of land cover and habitat quality in Shandong Province, China. Sci. Rep. 2022, 12, 15422. [Google Scholar] [CrossRef] [PubMed]


| Type | Forest Layer (30 m × 30 m) | Shrub Layer (5 m × 5 m) | Herbaceous Layer (1 m × 1 m) |
|---|---|---|---|
| Forest sites | 83 | 34 × 3 | 78 × 3 |
| Shrub sites | - | 20 × 3 | 5 × 3 |
| Meadow sites (100 m × 100 m) | - | - | 51 × 3 |
| Measure item | The leaf area index, plant coverage (used to verify the accuracy of biomass results) | ||
| Species, number, height, and crown spread | Biomass (a 30 × 30 cm section) | The total biomass of individual samples | |
Disclaimer/Publisher’s Note: The statements, opinions and data contained in all publications are solely those of the individual author(s) and contributor(s) and not of MDPI and/or the editor(s). MDPI and/or the editor(s) disclaim responsibility for any injury to people or property resulting from any ideas, methods, instructions or products referred to in the content. |
© 2024 by the authors. Licensee MDPI, Basel, Switzerland. This article is an open access article distributed under the terms and conditions of the Creative Commons Attribution (CC BY) license (https://creativecommons.org/licenses/by/4.0/).
Share and Cite
Zhang, M.; Zhang, H.; Deng, W.; Yuan, Q. Assessment of Habitat Quality in Arid Regions Incorporating Remote Sensing Data and Field Experiments. Remote Sens. 2024, 16, 3648. https://doi.org/10.3390/rs16193648
Zhang M, Zhang H, Deng W, Yuan Q. Assessment of Habitat Quality in Arid Regions Incorporating Remote Sensing Data and Field Experiments. Remote Sensing. 2024; 16(19):3648. https://doi.org/10.3390/rs16193648
Chicago/Turabian StyleZhang, Mingke, Hao Zhang, Wei Deng, and Quanzhi Yuan. 2024. "Assessment of Habitat Quality in Arid Regions Incorporating Remote Sensing Data and Field Experiments" Remote Sensing 16, no. 19: 3648. https://doi.org/10.3390/rs16193648