Article

Urban Perception Evaluation and Street Refinement Governance Supported by Street View Visual Elements Analysis

School of Architecture, Tianjin University, Tianjin 300072, China
*
Author to whom correspondence should be addressed.
Remote Sens. 2024, 16(19), 3661; https://doi.org/10.3390/rs16193661
Submission received: 9 August 2024 / Revised: 19 September 2024 / Accepted: 27 September 2024 / Published: 1 October 2024
(This article belongs to the Special Issue Data-Driven City and Society—a Remote Sensing Perspective)

Abstract

:
As street imagery and big data techniques evolve, opportunities for refined urban governance emerge. This study delves into effective methods for urban perception evaluation and street refinement governance by using street view data and deep learning. Employing DeepLabV3+ and VGGNet models, we analyzed street view images from Nanshan District, Shenzhen, identifying critical factors that shape residents’ spatial perceptions, such as urban greenery, road quality, and infrastructure. The findings indicate that robust vegetation, well-maintained roads, and well-designed buildings significantly enhance positive perceptions, whereas detractors like fences reduce quality. Furthermore, Moran’s I statistical analysis and multi-scale geographically weighted regression (MGWR) models highlight spatial heterogeneity and the clustering of perceptions, underscoring the need for location-specific planning. The study also points out that complex street networks in accessible areas enhance living convenience and environmental satisfaction. This research shows that integrating street view data with deep learning provides valuable tools for urban planners and policymakers, aiding in the development of more precise and effective urban governance strategies to foster more livable, resilient, and responsive urban environments.

1. Introduction

The rapid pace of urban development has led to the degradation of natural environments, necessitating a reshaping of urban landscapes, particularly in rapidly urbanizing regions like China. Nevertheless, the recent deceleration of urbanization and a shift towards human-centric urban planning have garnered increased attention to the concept of urban perception. This growing interest stems from public concerns regarding the safety and psychological impact of urban landscape interfaces on pedestrians, underlining the necessity for collaborative interventions involving urban researchers, planners, and policymakers [1]. These interventions prioritize public participation and adopt a human-centered approach to improve both urban perception and sustainability [2,3].
Urban perception refers to how city dwellers interpret their surroundings, including streets, parks, and buildings. This perception shapes preferences, cognitive judgments, and behaviors [4]. Originating from environmental psychology, this concept acts as a mediator between the physical characteristics of the built environment and human behavior [5]. Attributes such as vegetation, street width, and building height directly influence human perception, which in turn affects behavior and mental well-being across different urban settings [6].
Streets are considered the backbone of urban life, facilitating daily activities like walking, shopping, and social interaction. Compared to urban spaces such as parks and squares, streets serve more diverse and dynamic functions. However, despite their centrality, urban streets often suffer from sprawl and a decline in vitality due to continuous urbanization, adversely affecting residents’ experiences. Prolonged exposure to low-quality urban spaces can induce stress and, in severe cases, contribute to both psychological and physiological illnesses. Conversely, vibrant and aesthetically pleasing streets can elevate the city’s overall quality, reduce stress, and decrease the prevalence of chronic diseases, underscoring the importance of creating high-quality, human-centric street environments.
However, the factors influencing human perception are complex, often shaped by personal experiences and regional cultures [5,7]. These factors pose significant challenges to researchers’ understanding of urban perception [8]. Traditional methods such as surveys and interviews [9,10], while accurate, are time consuming, costly, and often yield limited results [11], with response biases further complicating the analysis [12].
With the emergence of crowdsourced mapping services and geo-tagged images from platforms like Baidu Street View (BSV), Tencent Street View (TSV), and Google Street View (GSV), new methods to capture detailed descriptions of urban street quality have been prevailing [13]. These street view images provide panoramic views of urban environments, offering a low-cost, accessible, and comprehensive data source for evaluating urban streets [14,15,16]. For instance, the use of these images has enabled large-scale analyses that align with residents’ psychological perceptions, enhancing our understanding of urban environments [17]. There is research utilizing thousands of geo-tagged street view images to explore the perceived safety, rank, and uniqueness of the built environments in Boston, New York, Linz, and Salzburg [18]. Another study demonstrated the potential of Google Street View images in describing the urban built environment, aligning with the psychological perceptions of urban residents [19]. Large-scale analyses have utilized these images to correlate built environment characteristics with street view perceptions, thus enhancing the understanding of urban environments [20].
Amidst rapid advancements in computer technology, deep learning has become increasingly integral to urban studies [21,22]. Many researchers are now using street view images combined with emerging deep learning algorithms to study one or multiple elements that influence urban street perception [23,24]. While traditional models have explored the relationship between urban perception and various factors [25], the inherent spatial heterogeneity in street view images suggests that global models may introduce errors, highlighting the need for appropriate spatial regression models. Employing appropriate spatial regression models to study spatial data has become a prominent research direction across disciplines. The integration of deep learning with geospatial technologies is creating new opportunities for nuanced studies of urban environments [26].
For instance, deep learning algorithms, represented by FCN, Resnet, and SegNet, use deep convolutional neural network architectures to deeply process the visual information of images, effectively identifying various visual features such as lanes, buildings, sky, sidewalks, trees, and greenery. This lays a solid foundation for better studying urban street quality and human perception [27,28]. Many scholars collected street view image datasets from cities and used deep learning models to explore joint models of wealth, uniqueness, and safety perception at the urban scale [29]. Similarly, the Place Pulse project by MIT Media Lab uses collected street view image data to allow visitors to compare two images based on dimensions like safety, liveliness, and wealth through an online website (http://pulse.media.mit.edu, accessed on 5 February 2024), forming a deep learning dataset applied to measuring the built environment of streets [30,31]. In addition, a study extracted 30 street features from Google Street View and used deep learning algorithms to evaluate eight perception qualities, including ecology, enclosure, and accessibility [32].
In summary, recent advances in machine learning and the availability of extensive street view datasets present an unprecedented opportunity to enhance our understanding of urban spaces, especially for tailored street governance. However, there are still gaps in the research. While the existing literature recognizes the role of urban design in shaping perceptions, there is a notable underutilization of advanced computational techniques to analyze how residents perceive their environments on a large scale.
Hence, this study raises three questions: (1) How do different visual elements captured in street view images influence residents’ perceptions such as safety, beauty, and liveliness in urban environments? (2) To what extent does spatial autocorrelation affect residents’ perceptions of urban streets, and how do these perceptions vary across different levels of accessibility? (3) How can street refinement governance be improved to enhance urban perception, especially regarding road accessibility?
By answering these questions, the paper aims to utilize the advanced deep learning techniques of street view imagery to decipher the urban perception performance and its relationship with road accessibility. Through the DeepLabV3+ neural network model, VggNet neural network model, Microsoft TrueSkill City Awareness Computing, and geospatial models, the urban perception prediction will be firstly conveyed. Secondly, the visual elements of streets will be decoded to further serve the spatial influencing factor analysis. Thirdly, by unveiling the relationship between perception and road accessibility, the spatial heterogeneity will be discovered. Last but not least, the street refinement governance implications will be in-depth delivered (see Figure 1 for the overall research flow).

2. Study Area and Data

2.1. Study Area

The focus of this study is Nanshan District in Shenzhen, Guangdong Province, one of China’s most economically advanced regions, as depicted in Figure 2. Home to approximately 1.8 million people, Nanshan represents 10.23% of Shenzhen’s permanent population. The district enjoys a subtropical maritime monsoon climate, with an average annual temperature of 22.7 °C, ideal for studying perceptual variations. Nanshan’s diverse geographical features include several hills, numerous bays like Shenzhen Bay, five islands, and many rivers and reservoirs. These characteristics of Shenzhen provide potential to examine how geographic and environmental conditions through street view data influence urban perception and highlight the vitality of street refinement.

2.2. Data Sources

The research data for this study consists of crowdsourced data, road network data, panoramic street view image data, neural network training datasets, and attribute data. The models and dataset are mainly trained and processed by Python 3.11, while the spatial road network data is analyzed in QGIS 3.36. Figure 3 illustrates the datasets and their workflows, which will be elaborated in Section 3.
The crowdsourced data, including urban street views and perception comparison results, are sourced from the MIT Place Pulse dataset (https://www.media.mit.edu/projects/place-pulse-1/overview/, accessed on 5 February 2024), released by the MIT Media Lab. The dataset contains 110,988 images from 56 cities worldwide (including Hong Kong, Taiwan, Tokyo, New York, and London) and 1,169,078 paired comparisons provided by 81,630 online volunteers from 162 developed and developing countries. The dataset classifies human perception into six categories: safety, liveliness, beauty, wealth, depression, and boredom. These indicators comprehensively represent human perception, with cultural background, income levels, and race differences not affecting the results, demonstrating the dataset’s high generalizability [33]. Then, the perception model construction requires a deep learning network based on the VGG structure, using the MIT Place Pulse dataset to train the neural network to distinguish perceptions from paired street view images, simulating residents’ perception evaluations.
For the urban road network of Nanshan District, data was extracted from OpenStreetMap (OSM) (https://www.openstreetmap.org/, accessed on 10 February 2024). The road network data is stored in shapefiles, comprising 10,578 urban road segments. The road network data serves two purposes in this study’s model construction. First, geographic calibration and densification of the road network data are used to obtain urban street view collection points, from which urban street view data is collected through the Baidu Maps Open Platform. Second, the road network data is used in DepthMapX platform to calculate urban street accessibility using space syntax theory, providing data for the coupling analysis of perception and accessibility.
A crucial data source for perception is Baidu Panoramic Street View (BSV) Image Data. BSV covers most Chinese internal urban street spaces, objectively reflecting Chinese street landscapes and expressing residents’ subjective experiences and cognition of the city. In urban science, using street view image big data for urban street quality and urban environment analysis is becoming increasingly common [34]. Street view data platforms typically provide browsing services and application programming interfaces (API), allowing users to quantitatively download large-scale street view data. The street view data in the model is used to obtain two basic data types for perception evaluation and analysis: urban perception mapping through the trained VGG neural network and urban perception evaluation through the DeepLabV3+ neural network. By deep learning BSV images based on the training data from the MIT PlacePulse dataset and Cityscapes dataset, urban perceptions of this Chinese study area will be locally and directly decoded.
The training data used for the DeepLabV3+ image semantic segmentation neural network is the Cityscapes dataset. The Cityscapes dataset (https://www.cityscapes-dataset.com/, accessed on 11 February 2024) contains 34 types of objects in daily life scenes, including sky, roads, cars, and vegetation, providing rich explanatory variables for urban perception. Cityscapes is a semantic understanding image dataset of urban street scenes, mainly including street scenes from 50 different cities in Germany, such as Zurich, Hamburg, and Aachen (2975 for training, 500 for validation, and 1525 for testing, with 19 classes enabled for training by default). In other words, this training dataset of the commonly worldwide street scenes is used for analyzing the BSV images’ visual elements, which means the analysis results are tailored in the study area. The research model uses image semantic segmentation to obtain the proportion of visual elements in urban street views, exploring the impact mechanism of each element on urban perception.
Finally, the space syntax theory is employed to analyze urban street accessibility. Space syntax can abstract complex street designs into a mathematical graph and various nodes, revealing the spatial structure characteristics of planning through graph and node analysis [35]. In urban space analysis, the axial model and segment model are frequently used. This study’s model utilizes the angular mode to study urban street accessibility. OSM road data are used as the raw data for space syntax, and due to the detailed nature of the road data, it may interfere with accessibility calculations. Therefore, QGIS 3.36 is used to buffer the roads, extract centerlines to construct a new road network, and perform street merging, street simplification, and topology processing to provide good preliminary data for accessibility calculations. Road accessibility data is obtained using space syntax theory and OSM road network data.

3. Methods

3.1. DeepLabV3+ Neural Network Model

For this study, we utilized the DeepLabV3+ neural network model, initially developed by Chen and other scholars in 2018 [36]. This model is recognized for its precision and speed in semantic segmentation, particularly in urban scene analysis. It is engineered to deliver both high accuracy and speed compared to mainstream models. Regarding network architecture, DeepLabV3+ represents the latest iteration of the DeepLab series, which has undergone multiple enhancements over the years. DeepLabV1 modified the VGG16 model to incorporate atrous convolution. DeepLabV2 introduced the Atrous Spatial Pyramid Pooling (ASPP) module. DeepLabV3 enhanced the ASPP module by arranging it in both serial and parallel configurations and emphasized the importance of 1 × 1 convolutions. DeepLabV3+ employs a slightly modified Xception backbone network as the encoder and integrates it with a decoder module. This redesign resulted in an advanced model that outperformed mainstream deep learning algorithms such as SegNet and PSPNet in performance evaluation competitions, including the Pascal VOC and Cityscapes benchmarks. These advancements make DeepLabV3+ particularly effective for identifying landscape features in urban street views [37].

3.2. VggNet Neural Network Model

Following semantic segmentation, the study employs the VGGNet model to analyze urban perception. Derived from the Visual Geometry Group at the University of Oxford [38], VGGNet was chosen for its structured design and superior performance across diverse datasets. The original paper tested various networks of different depths, labeled A to E, ranging from 11 to 19 layers, with D and E known as VGG16 and VGG19. We constructed a deep learning network based on the VGG16 architecture, widely used in image classification tasks. VGG16 consists of 13 convolutional layers and 3 fully connected layers. It was chosen for this study due to its structured design, simple and stackable convolutional blocks, and excellent performance across various datasets. Compared to its predecessor, AlexNet, VGG has greater depth, more parameters (138 million), and better effectiveness and portability, making it an ideal foundational network for this research.
Using the MIT Place Pulse data, we preprocessed and classified the data for six perception indicators. The paired perception comparisons served as input to train the network for predicting the winner in paired comparison tasks. We used a cross-entropy loss function and backpropagation to update the VGG16Net neural network gradients for binary classification perception training. The trained neural network distinguishes perception strengths between pairs of street view images, simulating residents’ perception evaluations of two street views (see Figure 4). The prediction accuracies of different perceptions in the training and validation sets are as follows: safety (81.25%), liveliness (78.13%), beauty (84.37%), wealth (81.25%), depression (81.25%), and boredom (78.13%).

3.3. Microsoft TrueSkill City Awareness Computing

Given that the perception results involve pairwise image comparisons, this study employs the Microsoft TrueSkill algorithm to rank the paired comparison images and obtain perception scores. TrueSkill is a ranking method based on Bayesian theorem, iteratively updating the ranking scores of street view images after each comparison (the original technical report is available from https://www.microsoft.com/en-us/research/publication/trueskilltm-a-bayesian-skill-rating-system-2/, accessed on 12 February 2024). TrueSkill assumes that the perception score of each street view image follows a normal distribution N (μ, σ2) among all images, with a unified expected μ set to 25 and a standard deviation σ set to 25/3. We conducted 122,875 pairwise comparisons (five times the number of street view images) on 24,575 street view images. The perception scores were then normalized and mapped to a range of [0, 1] to facilitate subsequent spatial econometric analysis.
Moreover, the TrueSkill algorithm involves using machine learning with large datasets and adhering to the Bayesian theorem to assign a “skill value” to each image in the ranking process. Since rankings are transitive, consider three street view images A, B, and C, with safety perception comparisons such that A > B and B > C. The TrueSkill algorithm and subsequent normalization would yield safety perception scores of A as 100, B as 58.1445, and C as 0 (see Figure 5).

3.4. Urban Spatial Perception Interpretation Model

To understand where and how urban street visual elements influence restorative perception in space, this study compares three different regression models: ordinary least squares (OLS) linear regression, geographically weighted regression (GWR), and multiscale geographically weighted regression (MGWR), and selects the most appropriate model for the analysis.
Many studies have used OLS as a linear regression method for parameter estimation to explore the relationships between dependent and independent variables. OLS is a global model that estimates the parameters of explanatory variables in a linear model by minimizing the sum of the squared differences between the predicted and observed values in the dataset. The OLS regression model assumes that the explanatory variables of restorative perception are spatially stationary, implying that the spatial distance and location of the data do not affect the final regression results [39]. However, many explanatory variables are spatially non-stationary, meaning that the explanatory power of data varies at different spatial locations. Therefore, spatial models can be used for modeling.
Geographically weighted regression (GWR), first proposed by Fotheringham with other scholars, is a spatial regression model that effectively addresses the issue of spatial non-stationarity in regression analysis [40]. MGWR allows each explanatory variable to have its own bandwidth, which can be adjusted according to the spatial scale, potentially reducing errors in parameter estimation. This model can significantly handle edge effects and uneven spatial distributions.
First, the study selects the top eight street elements from the image segmentation results that most influence urban perception as explanatory variables for perception. An OLS global regression is performed, as it is a commonly used curve fitting method in scientific research and engineering to process experimental data and determine the relationships between variables. The “fitting” process aims to find the fundamental trend in the data, described by the following formula:
Y i = α 0 + k = 1 m   a k X k + ε i
where Y i represents the restorative perceptual score and its coordinates ( u i , v i ); α 0 ( u i ,   v i ) indicates the intercept of the model; a k represents the regression coefficient of the k th independent variable data; X k is the k th attribute; ε i is the random error of the model.
Exploring explanatory variables using the OLS model can help determine if they are spatially stationary. If they are not, it indicates spatial heterogeneity, necessitating the use of spatial models for regression analysis. The formula for GWR is as follows:
Y i = α 0 u i , v i + k = 1 m   a k u i , v i X k u i , v i + ε i
where Y i represents the restorative perception score and its coordinates ( u I , v i ) ; α 0 ( u i , v i ) represents the intercept of the model; a k ( u I , v i ) represents the regression coefficient of the k th independent variable data at ( u I , v i ) ; X k ( u I , v i ) refers to the k th attribute of position i; ε i is the random error of the model.
Using the GWR model allows us to observe how the regression coefficients for restorative perception change across different spatial locations. This variability helps us understand how explanatory variables influence urban street restorative perception in different spatial contexts.
To apply the GWR model, it is necessary to determine a neighborhood range that includes the data points within this range. The GWR model uses a single fixed bandwidth to define the neighborhood, assuming that the regression coefficients of all explanatory variables vary at the same spatial scale. The bandwidth is measured in metric units based on distance. Using a bi-square kernel, the weights of all data points within the bandwidth are inversely proportional to their distance from the local region center, while data points outside the bandwidth have a weight of zero. We use golden section search optimization with the Akaike information criterion (AIC) as the model selection criterion. Both local R2 and global AIC can serve as evaluation parameters for the model. In GWR, the same bandwidth is used to evaluate the regression coefficients of explanatory variables. However, the spatial influence scales of explanatory variables may differ.
Multiscale geographically weighted regression (MGWR) allows each explanatory variable to have a separate bandwidth, which can be adjusted according to the spatial scale. This approach reduces errors in parameter estimation by considering the varying spatial influence scales of explanatory variables. The formula for MGWR is:
Y i = α 0 u i , v i + k = 1 m   a b w k u i , v i X k u i , v i + ε i
Building on the GWR model, the MGWR model introduces improvements by adding a bandwidth term b w for each explanatory variable X k u i , v i , allowing each to have its own spatial scale. Unlike GWR, MGWR uses an adaptive nearest-neighbor bandwidth kernel, specifying the number of data points that must be included in each local regression model. This approach effectively addresses edge effects and non-uniform spatial distributions [41]. Similar to GWR, a bi-square distance weighting function is used. For parameter optimization, we employ the golden section search algorithm with AIC as the criterion for model fit. R2 and AIC are used for model fit evaluation, and parameter estimates are mapped out as in GWR.
Finally, the explanatory level and AIC values of the three models (OLS, GWR, and MGWR) are compared. The model with the best fit is selected for the regression analysis of urban perception and street visual elements. This comparison ensures that the chosen model accurately captures the spatial variability and provides reliable insights into how visual elements of urban streets impact restorative perception.

4. Results

4.1. Multidimensional Spatial Perception Distribution

The spatial distribution of six types of spatial perceptions is illustrated in Figure 6. These perceptions are categorized into positive (safety, beauty, liveliness, wealth) and negative (depression, boredom) street perceptions, which serve as indicators of urban quality from a human-centric perspective, by following the MIT PlacePulse dataset’s classification. High scores in positive perceptions correlate with high-quality urban spaces, while high scores in negative perceptions suggest areas of concern. This dual categorization facilitates a nuanced evaluation of urban spaces based on residents’ perceptions.
To synthesize these insights, the scores from the Microsoft TrueSkill algorithm, which are normally distributed with mean (μ) and standard deviation (δ) set to 25 and 8.3333, respectively, are summed to generate an overall perception score.
It is important to note that higher scores indicate stronger perceptions. Therefore, for negative perceptions, the correct expression score is obtained by subtracting the negative perception score from the maximum value (max = 100). This process can be expressed with the following Formula (4):
P t o a l i = P s a f e t y i + P l i v e l y i + P b e a u t i f u l i + P w e a l t h y i + ( 100 P d e p r e s s i ) + ( 100 P b o r i n g i ) ( i = 1,2 , 3 , , 110563 )
The formula for P t o a l i represents the overall perception for a specific image iii. In the study area, Nanshan District of Shenzhen, there are 110,563 street view images. The components are as follows: P s a f e t y i is the safety perception of image i ; P l i v e l y i is the liveliness perception of image i ; P b e a u t i f u l i is the beauty perception of image i ; P w e a l t h y i is the wealth perception of image i ; P d e p r e s s i is the depression perception of image i ; P b o r i n g i is the boredom perception of image i .
To clearly display the geographical distribution of positive and negative perceptions in the city, we conducted a cluster analysis of the overall perception scores, categorizing them into seven levels for visualization in the geographical space. As shown in the accompanying map, there are noticeable differences in the distribution of positive and negative perceptions (see Figure 7 with overall scores and clustering performances).
In Figure 7, Area A’s positive perception space is centered around Liuxian Avenue, where a 30 m wide green belt along the road provides abundant recreational space for urban residents. Area B’s positive perception space is bounded by Shennan Avenue to the south, Shahe East Road to the west, and Qiaoxiang Road to the north. This area includes Yanhan Mountain Country Park and Happy Valley, likely contributing to the positive perceptions of residents. Area C’s positive perception space is enclosed by Binhai Avenue to the north, Houhai Avenue to the west, Houhaibin Road to the east, and Dongbin Road to the south. The adjacent Shenzhen Talent Park and the predominantly residential environment indicate higher quality living conditions and better urban infrastructure, resulting in high positive perception scores. Area D’s positive perception space is bordered by Dongbin Road to the north, Houhai Avenue to the west, and Keyuan South Road to the east. This area also features high-rise residential buildings, contributing to its positive perception. Area E is identified as a negative perception space, mainly encompassing the northeast coastal areas around Tinghai Road and Mawan Avenue near Mawan Port. These areas, characterized by open roads but lacking infrastructure and a monotonous urban skyline, contribute to the negative perceptions.

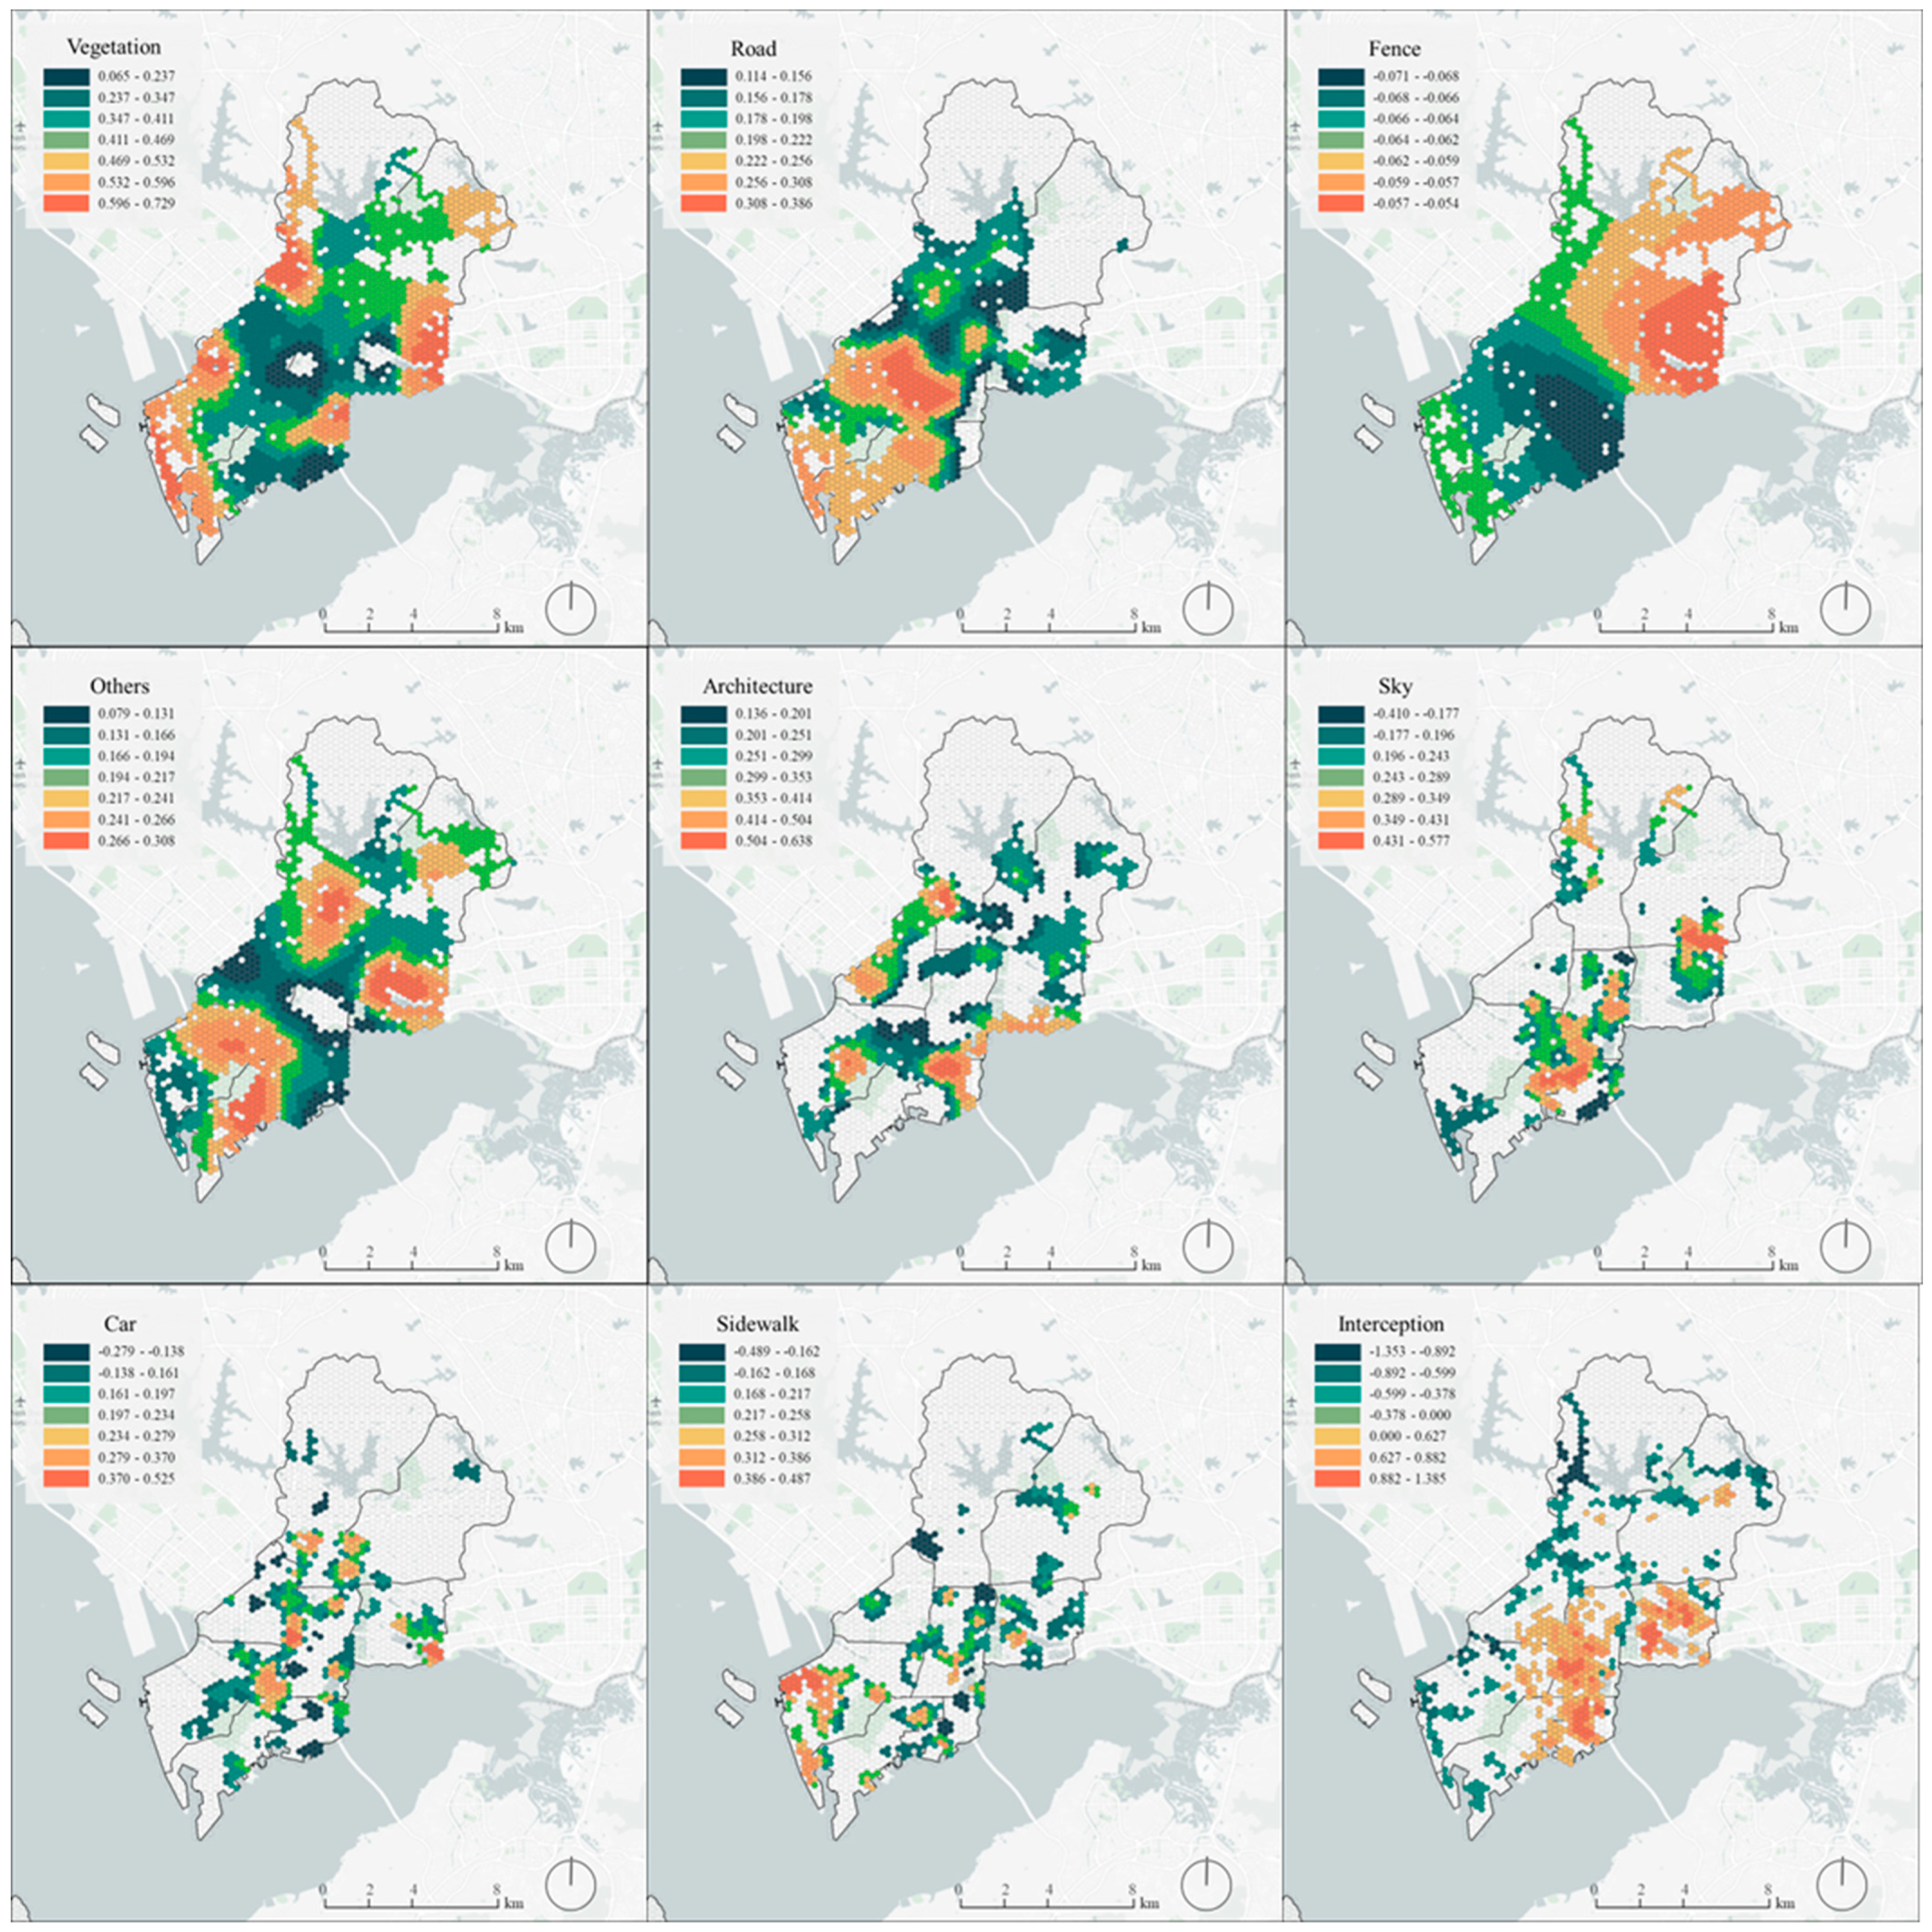
4.2. Spatial Perception and Its Influencing Factors

The study then utilized the spatial autocorrelation function in ArcGIS to conduct a global spatial perception autocorrelation analysis. The FIXED_DISTANCE method was employed to analyze each feature within the context of its neighboring features. In this method, neighboring features within the distance threshold are assigned a weight of 1, influencing the calculation of the target feature. Neighboring features outside the distance threshold are assigned a weight of 0, having no impact on the target feature’s calculation. The MANHATTAN distance method, suitable for urban blocks, was used to measure the distance between two points along the vertical axis by summing the differences in the x and y coordinates. Also, ROW standardization was applied, dividing each weight by the sum of the weights of the neighboring features. As Table 1 shows, the p-value of Moran’s I index is less than 0.01, indicating with 99% confidence that there is significant spatial autocorrelation in the perception of psychological stress. This suggests that the values of perception are significantly clustered in space.
The presence of spatial autocorrelation in urban spatial perception was further analyzed using local spatial autocorrelation. The analysis categorized the local spatial autocorrelation into four groups: low-low clusters, high-low clusters, low-high clusters, and high-high clusters. In Figure 8, these clusters illustrate how the perception of a single street view point relates to the surrounding spatial perception types, providing a more intuitive display of the distribution of spatial perception autocorrelation in the city. In detail, the “High-High” indicator means that a high perception performance point neighbors a high perception point, showing a spatial autocorrelation clustering effect. These “High-High” clusters are predominantly concentrated in the southern and eastern parts of the city. In contrast, a “Low-Low” indicator represents that a low perception performance point neighbors a low perception point, showing a spatial autocorrelation clustering as well. And these areas are mainly found on the city’s western side and coastal areas. Furthermore, “High-Low” and “Low-High” clusters convey no spatial neighboring effects.
Furthermore, in Table 2, the key visual elements from the image segmentation results that most influence urban perception are listed. The mean proportion column reflects the average proportion of each visual element. The three elements with the highest proportions are sky, road, and vegetation, while the elements with the lowest proportions are fence, sidewalk, and building.
Table 3 demonstrates that, compared to the OLS regression, the model fit (R²) significantly improves when considering spatial heterogeneity with GWR and MGWR. The R² value increased from 0.250 in OLS to 0.631 in GWR and then to 0.726 in MGWR, indicating that the model’s ability to explain the data has gradually increased. In addition, the AIC value decreased from 117,737.097 for OLS to 94,272.137 for GWR and then to 79,363.862 for MGWR. The lower the AIC value, the better the model performance, indicating that the MGWR model performs best in balancing model complexity and goodness of fit. The MGWR model considers the influence of variables at different spatial scales, significantly improving the model’s explanatory power and predictive ability.
Regardless of the model used, certain street elements such as vegetation, roads, and buildings consistently positively influence the perception performance, whereas fence is the negative influencing factor.
Moreover, it is spatially evident (see Figure 9) that vegetation, roads, fences, and other street elements exhibit more significant spatial heterogeneity (the MGWR model’s coefficients) compared to other elements. In the eastern and southwestern parts of Nanshan District, vegetation elements have a high sensitivity in enhancing perception. Implementing greening in these areas significantly improves perception. In the central and southern regions of Nanshan District, roads have a high sensitivity to enhancing perception. Increasing the proportion of roads during redevelopment in these densely built areas can expand the view and improve residents’ perceptions. In the southwestern part of Nanshan District, fences have a greater impact on perception than in other areas. Future construction in these areas should consider reducing the number of fences to enhance residents’ perceptions. Other elements show high sensitivity in urban areas of Nanshan District for enhancing residents’ perceptions. Diversifying street elements may create lively visual effects, which can be beneficial for enhancing perception. The spatial heterogeneity effects of buildings, sky, cars, sidewalks, and intercept elements are relatively weak.

4.3. Relationship between the Urban Perception and Street Accessibility

Figure 10 depicts the accessibility of urban streets in Nanshan District, Shenzhen, indicating the accessibility within a 500 m radius for residents’ daily walking activities. Major streets characterized by complexity and high density are identified as high accessibility areas (shown in red), whereas streets with low accessibility are represented in blue. The distribution of high accessibility zones is predominantly located in the northern side of Liuxian Avenue in the northeastern corner of the city, the northern side of Binhai Avenue in the central area, the northern side of Shennan Avenue in the eastern part of the city, and along both sides of Gongyuan South Road in the southern area.
To assess urban quality through the lens of street accessibility and urban perception for refined urban governance, the study conducted an overlay analysis combining the top 20% of accessibility (high accessibility) with the top 20% of spatial perception (high spatial perception) and the bottom 20% of spatial perception (low spatial perception), as depicted in Figure 11. This analysis identified two key areas: high accessibility with high perception and high accessibility with low perception. The former is primarily concentrated in areas B and C, while the latter is mainly found in areas A and D, aligning with the overall spatial perception distribution of the city. The high accessibility and high perception regions (areas B and C) are characterized by high-rise residential districts and recreational facilities, with more developed urban infrastructure. Conversely, the high accessibility and low perception regions (areas A and D) are predominantly economic development zones with lower urbanization levels, and they suffer from a lack of rational allocation of group buildings and spatial layers. Thus, these high accessibility and low perception areas require targeted urban renewal and governance efforts.

5. Discussion

5.1. Differences in Positive and Negative Spatial Perceptions in Nanshan District

In the study of spatial perception distribution in Nanshan District, Shenzhen, we observed significant geographical differences between positive and negative spatial perceptions. These differences are closely related to urban elements such as infrastructure, greenery, and recreational facilities within the region [42].
Areas with high positive perception scores are primarily concentrated in regions rich in green spaces and entertainment facilities. Specifically, the positive perception in Area A is centered around Liuxian Avenue, where a 30 m wide green belt along the road provides residents with a pleasant natural environment and recreational space. These green belts not only beautify the environment but also offer places for relaxation and socialization. In Area B, facilities such as Yanhan Mountain Country Park and Happy Valley meet the entertainment needs of residents, thereby enhancing the positive perception of the area. Area C is close to Shenzhen Talent Park and is mainly residential, with a high-quality living environment and well-developed infrastructure contributing to more positive perceptions among residents. Area D is also a residential area dominated by high-rise buildings, which not only provide ample housing but also enhance the overall quality of the living environment through modern design and high-quality management, thereby increasing residents’ positive perceptions [43].
In contrast, Area E, with high negative perception scores, is primarily located in the northeast coastal area and near Mawan Port. While these areas have broad roads, they lack sufficient infrastructure. For example, the absence of green spaces and public facilities along the roads makes the environment feel monotonous, oppressive, and boring to residents. These areas with high negative perceptions typically lack effective urban planning and management. The monotonous skyline in Area E, lacking visual diversity and appeal, is one of the reasons contributing to the higher negative perception among residents.
Through cluster analysis of overall perception, we found distinct differences in the spatial distribution of positive and negative perceptions. This disparity reflects the uneven distribution of infrastructure and public services in different areas. For instance, regions with high positive perceptions typically have well-developed infrastructure and high-quality public services, whereas areas with high negative perceptions often lack these critical urban elements. These clustering results indicate that urban planning and management play a crucial role in enhancing residents’ spatial perceptions. High-quality urban planning and management can optimize resource allocation, improve infrastructure, and thereby enhance residents’ quality of life and spatial perception. In addition, studies have shown that urban green space and open space not only improve the subjective well-being of residents but also significantly reduce the urban heat island effect and improve air quality, which are important factors affecting spatial perception [44].

5.2. Spatial Autocorrelation Analysis and Its Implications on Urban Perception in Nanshan District

Spatial autocorrelation analysis using the Moran I statistic reveals a significant spatial clustering of psychological stress perception in Nanshan District, Shenzhen. This indicates that residents’ perceptions are not randomly distributed but are influenced by the surrounding urban environment [45]. This spatial dependency further underscores the crucial impact of urban settings on residents’ psychological and emotional states.
Local spatial autocorrelation analysis shows that high-high clusters are typically found in areas with excellent infrastructure and beautiful environments, whereas low-low clusters are more common in regions with inadequate infrastructure and poor environmental quality [46]. These clustering results indicate that residents’ spatial perceptions are influenced not only by their immediate location but also by the surrounding environmental conditions. High-low clusters may arise when high-quality facilities are concentrated within low-perception areas, improving local perception quality. Conversely, low-high clusters might be due to a lack of local infrastructure, which reduces overall perception quality.
In detail, visual elements significantly influence spatial perception. Positive elements such as vegetation, roads, and buildings play a crucial role in enhancing perception. Areas with high vegetation coverage often convey a sense of beauty and comfort, while high-quality roads and buildings enhance feelings of safety and liveliness. Fences, as a negative perception element, may reduce residents’ perceptions in some areas where they are prevalent. The presence of fences can obstruct views, reduce the sense of openness, and increase feelings of oppression and boredom.
These analyses suggest that urban planning and management are pivotal in enhancing residents’ spatial perceptions. Urban planners can effectively improve residents’ quality of life and spatial perception by rationally allocating and optimizing urban resources and improving infrastructure and public services [47]. By focusing on these aspects, cities can foster environments that promote positive perceptions and reduce psychological stress among residents. Based on the results of spatial autocorrelation analysis, the study further proposes that the psychological stress can be reduced by creating more green infrastructure and enhancing community participation, so as to improve residents’ positive perception of space [48].

5.3. Spatial Heterogeneity and the Impact of Street Elements and Accessibility in Nanshan District

The results from the MGWR regression model highlight the spatial heterogeneity of vegetation, roads, fences, and other street elements. These heterogeneities can be attributed to the varying demand and sensitivity differences across regions regarding these elements. In the eastern and southwestern parts of Nanshan District, vegetation elements exhibit higher sensitivity due to the high level of greenery and substantial plant coverage in these areas, significantly improving residents’ visual and psychological experiences. The presence of vegetation beautifies the environment and provides shade, reduces noise, purifies the air, and offers various ecological services that enhance residents’ quality of life. Implementing additional greenery in these areas can significantly improve residents’ spatial perception and quality of life [49].
Road elements show higher sensitivity in the central and southern parts of Nanshan District, where the areas are densely built. Increasing the proportion of roads not only improves traffic convenience but also expands residents’ views, reducing feelings of congestion and oppression, thus enhancing overall quality of life. Proper road planning and design can promote traffic flow, increase urban efficiency, and improve residents’ life satisfaction. Future urban renovation and planning should focus on road construction in these areas to ensure that residents enjoy a higher-quality commuting and travel experience.
Fences, as a negative perception element, have a particularly noticeable impact in the southwestern part of Nanshan District. The high density of fences may obstruct residents’ views, reduce the sense of openness, and increase feelings of oppression and boredom. Reducing the number of fences and increasing open spaces and public areas in these regions can significantly enhance residents’ positive perceptions. This finding is important for urban planning and management. Reducing fence installations in these areas can increase open spaces, enhance environmental friendliness, and improve residents’ psychological comfort.
Other street elements such as buildings, sky, cars, and sidewalks exhibit weaker spatial heterogeneity effects but still impact residents’ perceptions to some extent. For instance, building quality and design style, sky openness, traffic flow and parking facilities, sidewalk width, and maintenance conditions can all influence residents’ spatial perception. Urban planners should consider these elements holistically to create more vibrant and attractive urban spaces through diversified street design and element layout.
In the analysis of urban street accessibility, we find that high-accessibility areas are primarily distributed in the city’s northeast corner, central, and eastern regions. These areas’ complex and dense street networks provide residents with convenient travel conditions and a wealth of life services. High accessibility not only improves residents’ convenience of living but also increases their positive perception of the environment. In high-accessibility areas, residents can quickly access various services and facilities, significantly enhancing their satisfaction with the living environment and spatial perception.
By overlaying urban street accessibility with spatial perception analysis, we found that areas with high accessibility and high perception are concentrated in regions with many high-rise residential areas and recreational facilities, while areas with high accessibility but low perception are mostly economic development zones and less urbanized regions. For high-accessibility and low-perception areas, urban regeneration and governance should become priorities [50]. Improving infrastructure and optimizing spatial layout can enhance the overall perception quality of these areas. In addition, research shows that life satisfaction and well-being are significantly higher in areas with good transportation and well-served services. This further illustrates the importance of improving street accessibility to enhance residents’ spatial perception [51].

6. Conclusions

This study conducted a comprehensive analysis of urban perception assessment and street refinement governance by leveraging street view data and advanced deep learning models such as DeepLabV3+ and VGGNet. By integrating these technologies with street view images, we evaluated the visual elements of urban environments in detail and on a large scale, providing a deeper understanding of how different elements collectively enhance overall urban quality.
The results indicate that urban green spaces, street design, and infrastructure quality significantly impact residents’ spatial perceptions. Areas with positive perceptions are typically concentrated in locations with well-developed infrastructure, abundant greenery, and comprehensive recreational facilities—such as Area B, home to Yanhan Mountain Country Park and Happy Valley, and Area C, near Shenzhen Talent Park. In contrast, areas with negative perceptions are mainly located in places with poor infrastructure and environmental quality, such as Area E near Mawan Port.
Spatial statistical analysis using Moran’s I revealed significant spatial clustering of resident perceptions, highlighting the influence of the surrounding urban environment and emphasizing the importance of localized urban planning. High-perception areas are concentrated in regions with high-quality infrastructure and greenery, while low-perception areas are associated with weak infrastructure and poor environmental quality.
Further analysis of the specific impact of different visual elements showed that high vegetation coverage significantly improves residents’ sense of beauty and comfort, while well-designed roads and buildings enhance feelings of safety and vitality. Negative elements such as fences reduce perception quality and increase feelings of oppression and boredom. MGWR analysis revealed spatial heterogeneity in the impact of street elements, providing precise guidance for urban planning tailored to different regions.
Additionally, the study found that high-accessibility areas with complex and dense street networks improve residents’ travel convenience and service availability, leading to higher positive perception scores. In contrast, low-accessibility areas require focused urban renewal and governance to enhance infrastructure and optimize spatial layout.
Based on these findings, we propose the following specific recommendations:
  • Increase green spaces and public open areas: Enhance visual and psychological perception quality by expanding greenery and accessible public spaces.
  • Improve road quality and traffic convenience: Enhance transportation infrastructure, especially in densely built areas, to ensure efficient mobility and reduced congestion.
  • Implement thoughtful building design and layout: Improve overall environmental safety and aesthetics through carefully planned architectural designs and layouts.
  • Reduce negative visual elements: Minimize the use of fences and other negative elements to increase openness and enhance spatial aesthetics.
  • Undertake targeted urban renewal and governance in low-perception areas: Implement focused strategies to raise environmental quality and resident satisfaction in areas with low perception scores.
This study demonstrates the immense potential of combining street view data with deep learning technologies in urban perception assessment and governance. By understanding the spatial distribution of resident perceptions and their influencing factors, urban planners and managers can formulate more precise and effective strategies to create more livable, resilient, and responsive urban spaces [52]. This not only improves residents’ quality of life but also provides a scientific basis for sustainable urban development.
Despite the valuable insights provided by this study, several limitations exist. Regarding data sampling, the street view image data we used were collected at specific time points, which may not fully reflect the actual changes in urban spaces throughout the study period. Future research could consider employing higher-frequency street view image data to capture urban spatial changes over shorter time scales. Methodologically, this work primarily focused on the relationship between visual elements and spatial perception. However, urban spatial perception is influenced by numerous other factors, such as noise and odors. Future studies could attempt to integrate multiple sensory elements to more comprehensively assess changes in urban spatial perception. Concerning model interpretability, although we analyzed the impact of visual elements on changes in urban spatial perception, future research could utilize XGBoost and SHAP (SHapley Additive exPlanations) to calculate the marginal contributions of features to model outputs, thereby interpreting the model from both global and local perspectives.

Author Contributions

Conceptualization, L.W.; methodology, L.W.; software, L.W.; validation, P.Z. and L.Z.; formal analysis, F.T.; investigation, L.W. and W.X.; resources, P.Z.; data curation, L.Z.; writing—original draft preparation, F.T.; writing—review and editing, F.T.; visualization, F.T. and L.Z.; supervision, P.Z.; project administration, W.X. All authors have read and agreed to the published version of the manuscript.

Funding

This research received no external funding.

Data Availability Statement

The original contributions presented in the study are included in the article, further inquiries can be directed to the corresponding author.

Conflicts of Interest

The authors declare no conflicts of interest.

References

  1. Matsuoka, R.H.; Kaplan, R. People Needs in the Urban Landscape: Analysis of Landscape and Urban Planning Contributions. Landsc. Urban Plan. 2008, 84, 7–19. [Google Scholar] [CrossRef]
  2. Kaklauskas, A.; Bardauskiene, D.; Cerkauskiene, R.; Ubarte, I.; Raslanas, S.; Radvile, E.; Kaklauskaite, U.; Kaklauskiene, L. Emotions Analysis in Public Spaces for Urban Planning. Land Use Policy 2021, 107, 105458. [Google Scholar] [CrossRef]
  3. Musse, M.A.; Barona, D.A.; Santana Rodriguez, L.M. Urban Environmental Quality Assessment Using Remote Sensing and Census Data. Int. J. Appl. Earth Obs. Geoinf. 2018, 71, 95–108. [Google Scholar] [CrossRef]
  4. Porzi, L.; Rota Bulò, S.; Lepri, B.; Ricci, E. Predicting and Understanding Urban Perception with Convolutional Neural Networks. In Proceedings of the 23rd ACM International Conference on Multimedia, Brisbane Australia, 26–30 October 2015; ACM: New York, NY, USA, 2015; pp. 139–148. [Google Scholar]
  5. Ewing, R.; Handy, S. Measuring the Unmeasurable: Urban Design Qualities Related to Walkability. J. Urban Des. 2009, 14, 65–84. [Google Scholar] [CrossRef]
  6. Nasar, J.L. Perception, Cognition, and Evaluation of Urban Places. In Public Places and Spaces; Altman, I., Zube, E.H., Eds.; Springer: Boston, MA, USA, 1989; pp. 31–56. ISBN 978-1-4684-5603-5. [Google Scholar]
  7. Samuelsson, K.; Giusti, M.; Peterson, G.D.; Legeby, A.; Brandt, S.A.; Barthel, S. Impact of Environment on People’s Everyday Experiences in Stockholm. Landsc. Urban Plan. 2018, 171, 7–17. [Google Scholar] [CrossRef]
  8. Das, D. Urban Quality of Life: A Case Study of Guwahati. Soc. Indic. Res. 2008, 88, 297–310. [Google Scholar] [CrossRef]
  9. Duan, J.; Wang, Y.; Fan, C.; Xia, B.; De Groot, R. Perception of Urban Environmental Risks and the Effects of Urban Green Infrastructures (UGIs) on Human Well-Being in Four Public Green Spaces of Guangzhou, China. Environ. Manag. 2018, 62, 500–517. [Google Scholar] [CrossRef]
  10. Griew, P.; Hillsdon, M.; Foster, C.; Coombes, E.; Jones, A.; Wilkinson, P. Developing and Testing a Street Audit Tool Using Google Street View to Measure Environmental Supportiveness for Physical Activity. Int. J. Behav. Nutr. Phys. Act. 2013, 10, 103. [Google Scholar] [CrossRef]
  11. Bonaiuto, M. Residential Satisfaction and Perceived Urban Quality. In Encyclopedia of Applied Psychology; Spielberger, C.D., Ed.; Elsevier: New York, NY, USA, 2004; pp. 267–272. ISBN 978-0-12-657410-4. [Google Scholar]
  12. Liu, M.; Han, L.; Xiong, S.; Qing, L.; Ji, H.; Peng, Y. Large-Scale Street Space Quality Evaluation Based on Deep Learning over Street View Image. In Proceedings of the Image and Graphics: 10th International Conference, ICIG 2019, Beijing, China, 23–25 August 2019; Zhao, Y., Barnes, N., Chen, B., Westermann, R., Kong, X., Lin, C., Eds.; Springer International Publishing: Cham, Switzerland, 2019; pp. 690–701. [Google Scholar]
  13. Biljecki, F.; Ito, K. Street View Imagery in Urban Analytics and GIS: A Review. Landsc. Urban Plan. 2021, 215, 104217. [Google Scholar] [CrossRef]
  14. Zhang, L.; Pei, T.; Wang, X.; Wu, M.; Song, C.; Guo, S.; Chen, Y. Quantifying the Urban Visual Perception of Chinese Traditional-Style Building with Street View Images. Appl. Sci. 2020, 10, 5963. [Google Scholar] [CrossRef]
  15. Tong, M.; She, J.; Tan, J.; Li, M.; Ge, R.; Gao, Y. Evaluating Street Greenery by Multiple Indicators Using Street-Level Imagery and Satellite Images: A Case Study in Nanjing, China. Forests 2020, 11, 1347. [Google Scholar] [CrossRef]
  16. Xiao, Y.; Zhang, Y.; Sun, Y.; Tao, P.; Kuang, X. Does Green Space Really Matter for Residents’ Obesity? A New Perspective From Baidu Street View. Front. Public Health 2020, 8, 332. [Google Scholar] [CrossRef]
  17. Ito, K.; Kang, Y.; Zhang, Y.; Zhang, F.; Biljecki, F. Understanding Urban Perception with Visual Data: A Systematic Review. Cities 2024, 152, 105169. [Google Scholar] [CrossRef]
  18. Salesses, P.; Schechtner, K.; Hidalgo, C.A. The Collaborative Image of The City: Mapping the Inequality of Urban Perception. PLoS ONE 2013, 8, e68400. [Google Scholar] [CrossRef]
  19. Li, X.; Zhang, C.; Li, W. Building Block Level Urban Land-Use Information Retrieval Based on Google Street View Images. GIScience Remote Sens. 2017, 54, 819–835. [Google Scholar] [CrossRef]
  20. Dong, L.; Jiang, H.; Li, W.; Qiu, B.; Wang, H.; Qiu, W. Assessing Impacts of Objective Features and Subjective Perceptions of Street Environment on Running Amount: A Case Study of Boston. Landsc. Urban Plan. 2023, 235, 104756. [Google Scholar] [CrossRef]
  21. Sun, H.; Xu, H.; He, H.; Wei, Q.; Yan, Y.; Chen, Z.; Li, X.; Zheng, J.; Li, T. A Spatial Analysis of Urban Streets under Deep Learning Based on Street View Imagery: Quantifying Perceptual and Elemental Perceptual Relationships. Sustainability 2023, 15, 14798. [Google Scholar] [CrossRef]
  22. Wang, L.; Han, X.; He, J.; Jung, T. Measuring Residents’ Perceptions of City Streets to Inform Better Street Planning through Deep Learning and Space Syntax. ISPRS J. Photogramm. Remote Sens. 2022, 190, 215–230. [Google Scholar] [CrossRef]
  23. Cui, Q.; Zhang, Y.; Yang, G.; Huang, Y.; Chen, Y. Analysing Gender Differences in the Perceived Safety from Street View Imagery. Int. J. Appl. Earth Obs. Geoinf. 2023, 124, 103537. [Google Scholar] [CrossRef]
  24. Lu, Y.; Chen, H.-M. Using Google Street View to Reveal Environmental Justice: Assessing Public Perceived Walkability in Macroscale City. Landsc. Urban Plan. 2024, 244, 104995. [Google Scholar] [CrossRef]
  25. Han, X.; Wang, L.; Seo, S.H.; He, J.; Jung, T. Measuring Perceived Psychological Stress in Urban Built Environments Using Google Street View and Deep Learning. Front. Public Health 2022, 10, 891736. [Google Scholar] [CrossRef]
  26. Min, W.; Mei, S.; Liu, L.; Wang, Y.; Jiang, S. Multi-Task Deep Relative Attribute Learning for Visual Urban Perception. IEEE Trans. Image Process. 2020, 29, 657–669. [Google Scholar] [CrossRef]
  27. Wang, L.; Zhang, L.; Zhang, T.; Hu, Y.; He, J. The Impact Mechanism of Urban Built Environment on Urban Greenways Based on Computer Vision. Forests 2024, 15, 1171. [Google Scholar] [CrossRef]
  28. Zhang, L.; Wang, L.; Wu, J.; Li, P.; Dong, J.; Wang, T. Decoding Urban Green Spaces: Deep Learning and Google Street View Measure Greening Structures. Urban For. Urban Green. 2023, 87, 128028. [Google Scholar] [CrossRef]
  29. Ordonez, V.; Berg, T.L. Learning High-Level Judgments of Urban Perception. In Proceedings of the Computer Vision—ECCV 2014: 13th European Conference, Zurich, Switzerland, 6–12 September 2014; Springer International Publishing: Cham, Switzerland, 2014; Volume 8694, pp. 494–510. [Google Scholar]
  30. Dubey, A.; Naik, N.; Parikh, D.; Raskar, R.; Hidalgo, C.A. Deep Learning the City: Quantifying Urban Perception at a Global Scale; Springer International Publishing: Cham, Switzerland, 2016; Volume 9905, pp. 196–212. [Google Scholar]
  31. Wu, Y.; Liu, Q.; Hang, T.; Yang, Y.; Wang, Y.; Cao, L. Integrating Restorative Perception into Urban Street Planning: A Framework Using Street View Images, Deep Learning, and Space Syntax. Cities 2024, 147, 104791. [Google Scholar] [CrossRef]
  32. Tian, H.; Han, Z.; Xu, W. Evolution of Historical Urban Landscape with Computer Vision and Machine Learning: A Case Study of Berlin. J. Digit. Landsc. Archit. 2021, 6, 436–451. [Google Scholar]
  33. Zhang, F.; Zhou, B.; Liu, L.; Liu, Y.; Fung, H.H.; Lin, H.; Ratti, C. Measuring Human Perceptions of a Large-Scale Urban Region Using Machine Learning. Landsc. Urban Plan. 2018, 180, 148–160. [Google Scholar] [CrossRef]
  34. Rui, Q.; Cheng, H. Quantifying the Spatial Quality of Urban Streets with Open Street View Images: A Case Study of the Main Urban Area of Fuzhou. Ecol. Indic. 2023, 156, 111204. [Google Scholar] [CrossRef]
  35. Jiang, B.; Claramunt, C.; Batty, M. Geometric Accessibility and Geographic Information: Extending Desktop GIS to Space Syntax. Comput. Environ. Urban Syst. 1999, 23, 127–146. [Google Scholar] [CrossRef]
  36. Chen, L.-C.; Zhu, Y.; Papandreou, G.; Schroff, F.; Adam, H. Encoder-Decoder with Atrous Separable Convolution for Semantic Image Segmentation. In Proceedings of the Computer Vision—ECCV 2018, Tel Aviv, Israel, 23–27 October 2022; Ferrari, V., Hebert, M., Sminchisescu, C., Weiss, Y., Eds.; Springer International Publishing: Cham, Switzerland, 2018; pp. 833–851. [Google Scholar]
  37. Zhu, H.; Nan, X.; Yang, F.; Bao, Z. Utilizing the Green View Index to Improve the Urban Street Greenery Index System: A Statistical Study Using Road Patterns and Vegetation Structures as Entry Points. Landsc. Urban Plan. 2023, 237, 104780. [Google Scholar] [CrossRef]
  38. Simonyan, K.; Zisserman, A. Very Deep Convolutional Networks for Large-Scale Image Recognition. arXiv 2014, arXiv:1409.1556. [Google Scholar]
  39. Han, X.; Wang, L.; He, J.; Jung, T. Restorative Perception of Urban Streets: Interpretation Using Deep Learning and MGWR Models. Front. Public Health 2023, 11, 1141630. [Google Scholar] [CrossRef] [PubMed]
  40. Brunsdon, C.; Fotheringham, A.S.; Charlton, M.E. Geographically Weighted Regression: A Method for Exploring Spatial Nonstationarity. Geogr. Anal. 2010, 28, 281–298. [Google Scholar] [CrossRef]
  41. Fotheringham, A.S.; Yang, W.; Kang, W. Multiscale Geographically Weighted Regression (MGWR). Ann. Am. Assoc. Geogr. 2017, 107, 1247–1265. [Google Scholar] [CrossRef]
  42. Appleyard, D. Livable Streets: Protected Neighborhoods? Ann. Am. Acad. Political Soc. Sci. 1980, 451, 106–117. [Google Scholar] [CrossRef]
  43. Donovan, G.H.; Butry, D.T. Trees in the City: Valuing Street Trees in Portland, Oregon. Landsc. Urban Plan. 2010, 94, 77–83. [Google Scholar] [CrossRef]
  44. Demuzere, M.; Orru, K.; Heidrich, O.; Olazabal, E.; Geneletti, D.; Orru, H.; Bhave, A.G.; Mittal, N.; Feliu, E.; Faehnle, M. Mitigating and Adapting to Climate Change: Multi-Functional and Multi-Scale Assessment of Green Urban Infrastructure. J. Environ. Manag. 2014, 146, 107–115. [Google Scholar] [CrossRef]
  45. Fotheringham, A.S.; Charlton, M.E.; Brunsdon, C. Geographically Weighted Regression: A Natural Evolution of the Expansion Method for Spatial Data Analysis. Environ. Plan A 1998, 30, 1905–1927. [Google Scholar] [CrossRef]
  46. Chen, H.; Yun, Z.; Xie, L.; Dawodu, A. Spatial Disparities in Urban Park Accessibility: Integrating Real-Time Traffic Data and Housing Prices in Ningbo, China. Urban For. Urban Green. 2024, 100, 128484. [Google Scholar] [CrossRef]
  47. Han, B.; Cohen, D.; McKenzie, T.L. Quantifying the Contribution of Neighborhood Parks to Physical Activity. Prev. Med. 2013, 57, 483–487. [Google Scholar] [CrossRef] [PubMed]
  48. Lachowycz, K.; Jones, A.P. Towards a Better Understanding of the Relationship between Greenspace and Health: Development of a Theoretical Framework. Landsc. Urban Plan. 2013, 118, 62–69. [Google Scholar] [CrossRef]
  49. Lovasi, G.S.; Schwartz-Soicher, O.; Quinn, J.W.; Berger, D.K.; Neckerman, K.M.; Jaslow, R.; Lee, K.K.; Rundle, A. Neighborhood Safety and Green Space as Predictors of Obesity among Preschool Children from Low-Income Families in New York City. Prev. Med. 2013, 57, 189–193. [Google Scholar] [CrossRef] [PubMed]
  50. Abercrombie, L.C.; Sallis, J.F.; Conway, T.L.; Frank, L.D.; Saelens, B.E.; Chapman, J.E. Income and Racial Disparities in Access to Public Parks and Private Recreation Facilities. Am. J. Prev. Med. 2008, 34, 9–15. [Google Scholar] [CrossRef] [PubMed]
  51. Sugiyama, T.; Leslie, E.; Giles-Corti, B.; Owen, N. Associations of Neighbourhood Greenness with Physical and Mental Health: Do Walking, Social Coherence and Local Social Interaction Explain the Relationships? J. Epidemiol. Community Health 2008, 62, e9. [Google Scholar] [CrossRef] [PubMed]
  52. Pickett, S.T.A.; Cadenasso, M.L.; Grove, J.M.; Boone, C.G.; Groffman, P.M.; Irwin, E.; Kaushal, S.S.; Marshall, V.; McGrath, B.P.; Nilon, C.H.; et al. Urban Ecological Systems: Scientific Foundations and a Decade of Progress. J. Environ. Manag. 2011, 92, 331–362. [Google Scholar] [CrossRef] [PubMed]
Figure 1. The research flowchart.
Remotesensing 16 03661 g001
Figure 2. Study area location: (a) China; (b) Guangdong Province; (c) Shenzhen City; (d) Nanshan District.
Remotesensing 16 03661 g002
Figure 3. The methodology roadmap.
Remotesensing 16 03661 g003
Figure 4. The process of VggNet neural network model.
Remotesensing 16 03661 g004
Figure 5. An example of TrueSkill algorithm computation.
Remotesensing 16 03661 g005
Figure 6. The spatial distribution of six types of perceptional scores in Nanshan District.
Remotesensing 16 03661 g006
Figure 7. An overall perception performance with scores (left) and their clustering (right).
Remotesensing 16 03661 g007
Figure 8. The spatial autocorrelation clustering.
Remotesensing 16 03661 g008
Figure 9. The spatial distribution of the urban perception’s influencing factors.
Remotesensing 16 03661 g009
Figure 10. The spatial distribution of the street accessibility.
Remotesensing 16 03661 g010
Figure 11. The spatial distribution of the perception performance with a high accessibility.
Remotesensing 16 03661 g011
Table 1. Spatial autocorrelation Moran I statistical table.
Global Moran I Summary
Moran’s I index0.306115
Expectation index−0.000022
Variance0.000000
Z-score804.380739
p-value0.000000
Table 2. Proportion of urban perceived visual elements.
NumberVisual ElementsAvgMaxMinSD
1Other0.1120.5580.0010.075
2Building0.0530.5270.0010.066
3Sky0.3000.7140.0010.112
4Road0.1760.4410.0010.084
5Sidewalk0.0290.3430.0010.035
6Car0.0830.3310.0010.045
7Fence0.0050.1060.0010.009
8Plant0.1560.6910.0010.119
Table 3. Comparison table of urban perception interpretation models.
OLS
Coefficient
GWR CoefficientMGWR Coefficient
VariableMean ValueMean ValueMaxMinMean ValueMaxMin
Interception0.0000.086−41.5389.3880.082−1.3631.555
Others0.196 ***0.205−1.6491.8300.1850.0040.309
Building0.406 ***0.239−8.2029.1070.210−0.2090.645
Sky0.078 ***0.173−4.1716.6960.109−0.4120.578
Road0.288 ***0.198−1.5151.9820.1900.0170.388
Sidewalk0.071 ***0.103−3.3389.9460.073−0.5020.495
Car0.019 ***0.082−1.4841.5920.074−0.2790.525
Fence−0.105 ***−0.048−1.8634.711−0.063−0.071−0.054
Plant0.541 ***0.447−33.6243.9220.3960.0030.730
R20.2500.6310.726
AIC117,737.09794,272.13779,363.862
Note: R2 and adjusted R2 are almost the same, so only R2 is shown. *** represent the significance levels of 0.1%.
Disclaimer/Publisher’s Note: The statements, opinions and data contained in all publications are solely those of the individual author(s) and contributor(s) and not of MDPI and/or the editor(s). MDPI and/or the editor(s) disclaim responsibility for any injury to people or property resulting from any ideas, methods, instructions or products referred to in the content.

