Abstract
Nightly images offer a special data source for monitoring fishing activities. This study used images from the Defense Meteorological Satellite Program (DMSP)/Operational Linescan System (OLS) to analyze the early development of lit fisheries in the open South China Sea (SCS), which mainly occurred around the Zhong Sha and Xi Sha Islands. Based on peak detection and a fixed threshold, lit fishing positions were extracted well from filtered, high-quality DMSP/OLS images. The results indicated that fisheries experienced an apparent rise and fall from 2005 to 2012, with the numbers of lit fishing boats rising to a maximum of ~60 from 2005 to 2008, almost disappearing in 2009, peaking at ~130 from 2010 to 2011, and starting to decline in 2012. The fish price of major fishing targets declined by ~60% in 2009, which obviously impacted the year’s fishing operations. The reason for declined fishing operations in 2012 was that most of the lit fishing operations shifted farther south to fishing grounds around the Nan Sha Islands. We also explored factors shaping the distribution patterns of lit fisheries by using MaxEnt models to relate fishing positions to environmental variables. Major environmental factors influencing the distribution of lit fishing boats varied with years, of which water depth was the most important factor across years, with an optimal depth range of 1000–2000 m. In addition to depth, the distribution of lit fisheries was also influenced by SST, especially for the years 2005–2008, and a suitable SST was found between 26 and 28 °C. This study fills the knowledge gaps of the inception of lit fisheries and their dynamic changes in the SCS.
1. Introduction
China is one of the world’s largest fishing nations, with a total catch of >14 million tons in 2019. The country’s fisheries are an important source of food and income for millions of people [1]. However, fisheries are facing a number of challenges, especially the overfishing of coastal fisheries [2]. In recent years, China has implemented a number of measures to improve the sustainability of its fisheries, including limiting the number of fishing vessels and the total fishing horsepower and establishing protected areas in coastal waters [3]. Meanwhile, fishing for pelagic species in the oceanic area has been further encouraged since the 21st century [4], in an attempt to partly relocate fishing capacity away from the heavily fished coastal and shelf waters.
There are two main fishing grounds in the oceanic area of the South China Sea (SCS), one situated in the northern portion around the Zhong Sha and Xi Sha Islands and the other located in the southern SCS around the Nan Sha Islands [5]. The main targets in both fishing grounds are purpleback flying squid Sthenoteuthis oualaniensis, tuna, and tuna-like fishes [6,7]. These pelagic species generally have a short life span, and survey and assessment indicated large standing stock and potential for exploitation [8]. The Zhong Sha and Xi Sha fishing ground is closer to China’s mainland, and its pelagic fishery was developed earlier in the beginning of the 21st century [9]. Fishing boats operating in this area mainly come from three south China provinces: Guangdong, Guangxi, and Hainan. The fishing fleet was composed of wooden boats, and their fishing gear mainly consisted of lit purse seines and lit falling nets, with a small number of fishing boats using underwater traps and gillnets [10]. Compared to the Zhong Sha and Xi Sha fishing ground, the distance from the mainland to the Nan Sha fishing ground is farther away, and its pelagic fishery development lagged behind. It was not until 2010 that this pelagic fishery was first developed [11]. This distant fishing ground attracts most of the lit fishing vessels of China in the SCS during spring seasons due to the high catch rates after 2011. The number of wooden boats decreased after 2010, and newly developed steel-hull falling netters using lights with improved cold storage became the major component of the fishing fleet [12]. As the importance of open-SCS fisheries is increasing, more and more research has also emerged [6,7,9]. However, unlike high-sea fisheries which are operated by large fishing companies, open-SCS fishing is run by individual vessel owners, and thus, data on fishing operations and catches are lacking, which poses great difficulties for fishery-related research. Early research mainly used fishing logs of a few typical vessels to investigate the yields of lit fisheries [12,13], and survey vessels were also used for a stock assessment of the major fishing targets [6] and the study of their fisheries’ biology [14]. Although the results of investigations from individual vessels can reflect certain characteristics of fisheries, to track the development and dynamic changes in entire fisheries, more comprehensive data are needed.
Nighttime satellites have been widely used and verified for the comprehensive monitoring of lit fishing vessels [15,16,17,18]. There are two main nighttime satellite sensors, namely DMSP/OLS and VIIRS/DNB. The DMSP/OLS began offering low-light imaging in the 1970s, during which it was found that data collected using the DMSP could effectively capture illuminated fishing vessels in the high seas [16]. The DMSP series had long-time coverage until now, and it will end its mission when the current satellites reach their lifetime. As for VIIRS/DNB, this sensor has collected data since late 2011 and is scheduled to record data until the 2040s [19]. The DMSP has been used in the studies of high sea lit fisheries [20,21,22,23], but its use in the SCS was quite limited, primarily due to the need to order data, which are not available for instant download. Additionally, the DMSP is limited by its 6-bit resolution, lack of radiometric calibration, and low spatial resolution [19]. In contrast, VIIRS offers 14-bit resolution, onboard calibration, and a much finer spatial resolution (~750 m). These improvements, along with free access, make VIIRS data more commonly used in research [24,25,26]. The development of open-SCS lit fisheries over the past decade which mainly occurred in the Nan Sha Islands has been analyzed using VIIRS imagery [11]. However, the evolution of fisheries during early years in the Zhong Sha and Xi Sha fishing ground has yet to be backtracked. In this study, to thoroughly document the development and dynamic changes in lit fisheries in the SCS, especially for their inception in the Zhong Sha and Xi Sha fishing ground, we established an approach suitable for extracting fishing boats using lights in the region from the DMSP/OLS. Based on the fishing positions extracted, we also explored major environmental factors shaping the spatial pattern of lit fisheries.
2. Materials and Methods
2.1. DMSP/OLS and Environmental Data
The fishing season in the Zhong Sha and Xi Sha fishing ground mainly occurs during springtime (March–May). In March, lit fishing boats start shifting fishing ground from shelf waters to the open SCS. In May, the fishing fleet gradually returns to shelf waters. The counts of lit fishing boats peak in April, and almost all the boats fish in the open SCS. Therefore, we only chose images taken in April for this study. DMSP/OLS images were selected for the years 2005–2012. Initially, a total of 390 DMSP/OLS visible band images were obtained from NOAA Earth Observation Group for the northern portion of the open SCS (14–20°N, 110–116°E). Only orbital swaths that completely covered the region were filtered to study the fishing characteristics. The quality of the images was limited by the presence of solar effects and clouds. Low-quality images were also removed. All the images had to be taken between 19:00 and 22:00 local time; this ensured the exclusion of images influenced by solar effects. Clouds would directly affect the luminosity produced by a fishing boat: thick clouds could fully obscure the light, while thinner clouds diffuse the signal, making the light spatially larger but dimmer than it would be in the absence of cloud cover [27]. Additionally, moonlight amplifies the impact of clouds—when lunar illumination is high, cloud effects become more pronounced. Images with significant contamination from both clouds and moonlight were excluded from the analysis. After a series of filtration, there were 139 high-quality images left for the extraction of lit fishing boats (Table 1).

Table 1.
Number and passing time of DMSP/OLS imagery for period 2005–2012.
In order to explore the key shaping factor, we collected environmental data, including depth, surface seawater temperature (SST), surface seawater salinity (SSS), sea surface height (SSH), mixed layer depth (MLD), surface eastward seawater velocity (UCC), and surface northward seawater velocity (VCC). The depth data were derived from ETOPO1, a comprehensive global elevation dataset crafted by NOAA (https://www.opentopodata.org/datasets/etopo1/, accessed on 28 September 2024). In contrast, additional variables were procured from the Global Ocean Physics Reanalysis product, namely GLORYS12V1 (https://data.marine.copernicus.eu/product/, accessed on 28 September 2024). GLORYS12V1 is an exemplary product from the Copernicus Marine Environment Monitoring Service. This global ocean eddy-resolving reanalysis boasts a fine horizontal resolution of 1/12° complemented by 50 vertical levels, tracing back to altimetry data since 1993.
2.2. Identification of Luminosity Pixels
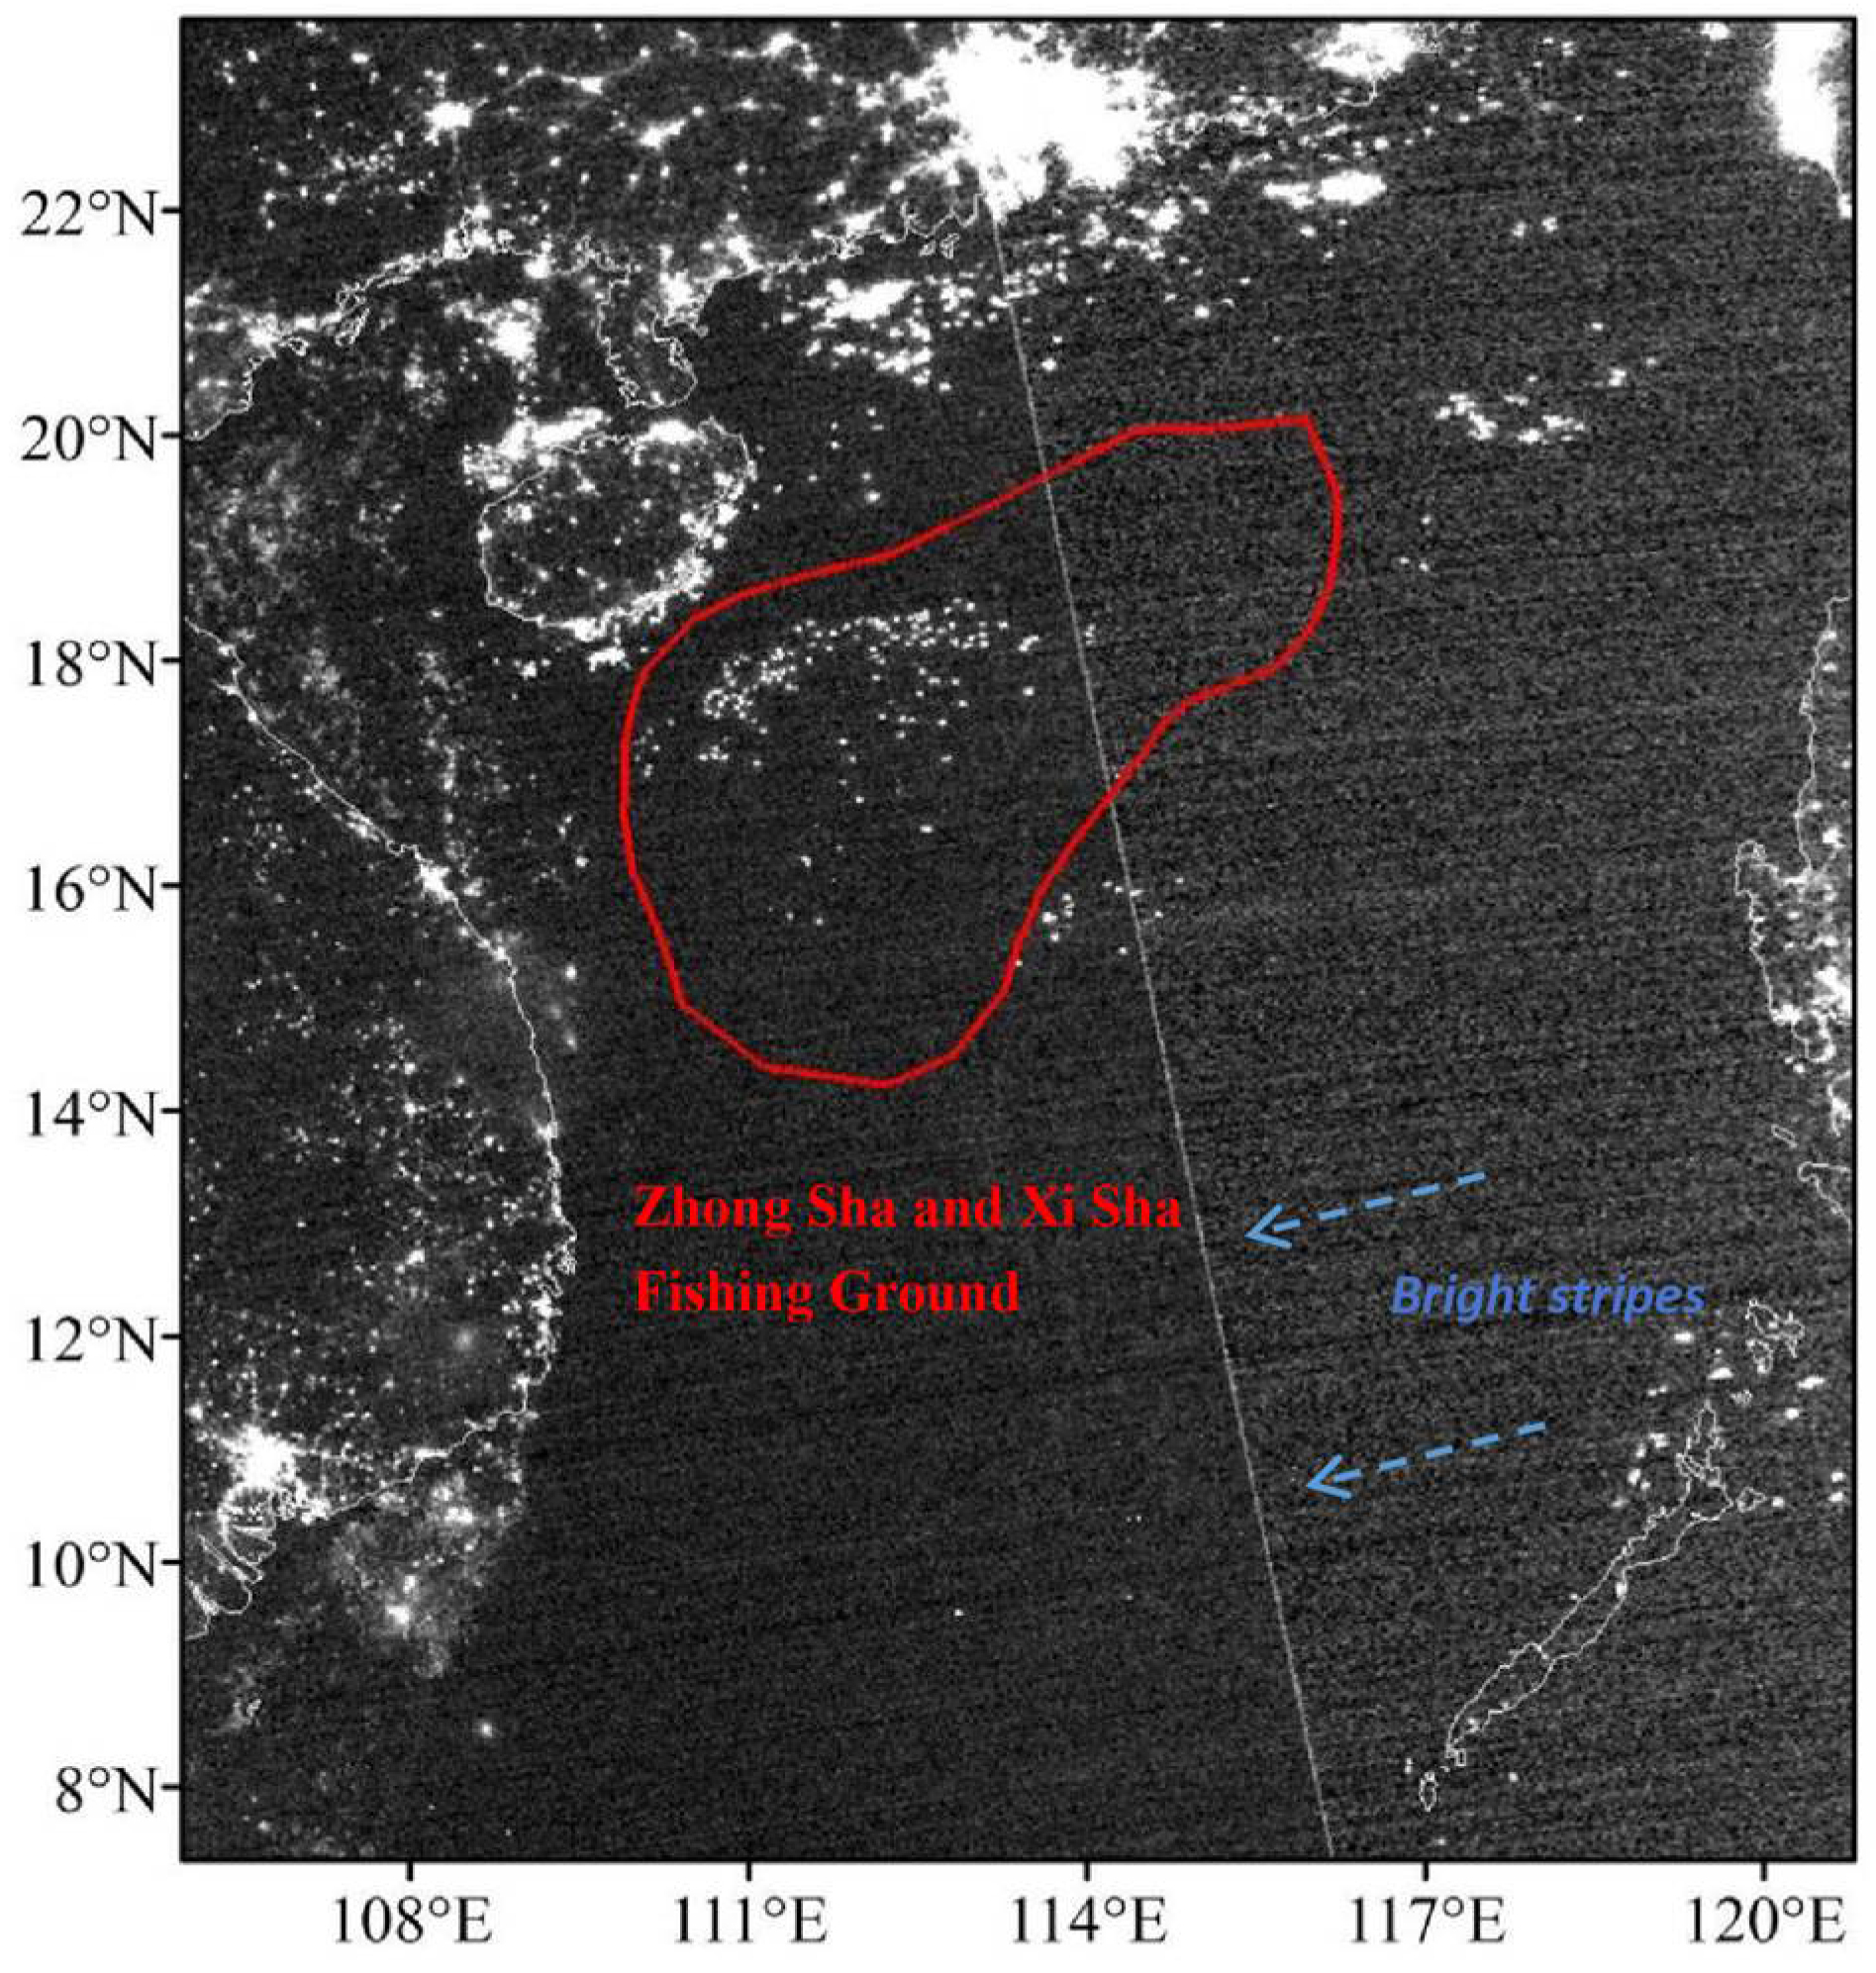
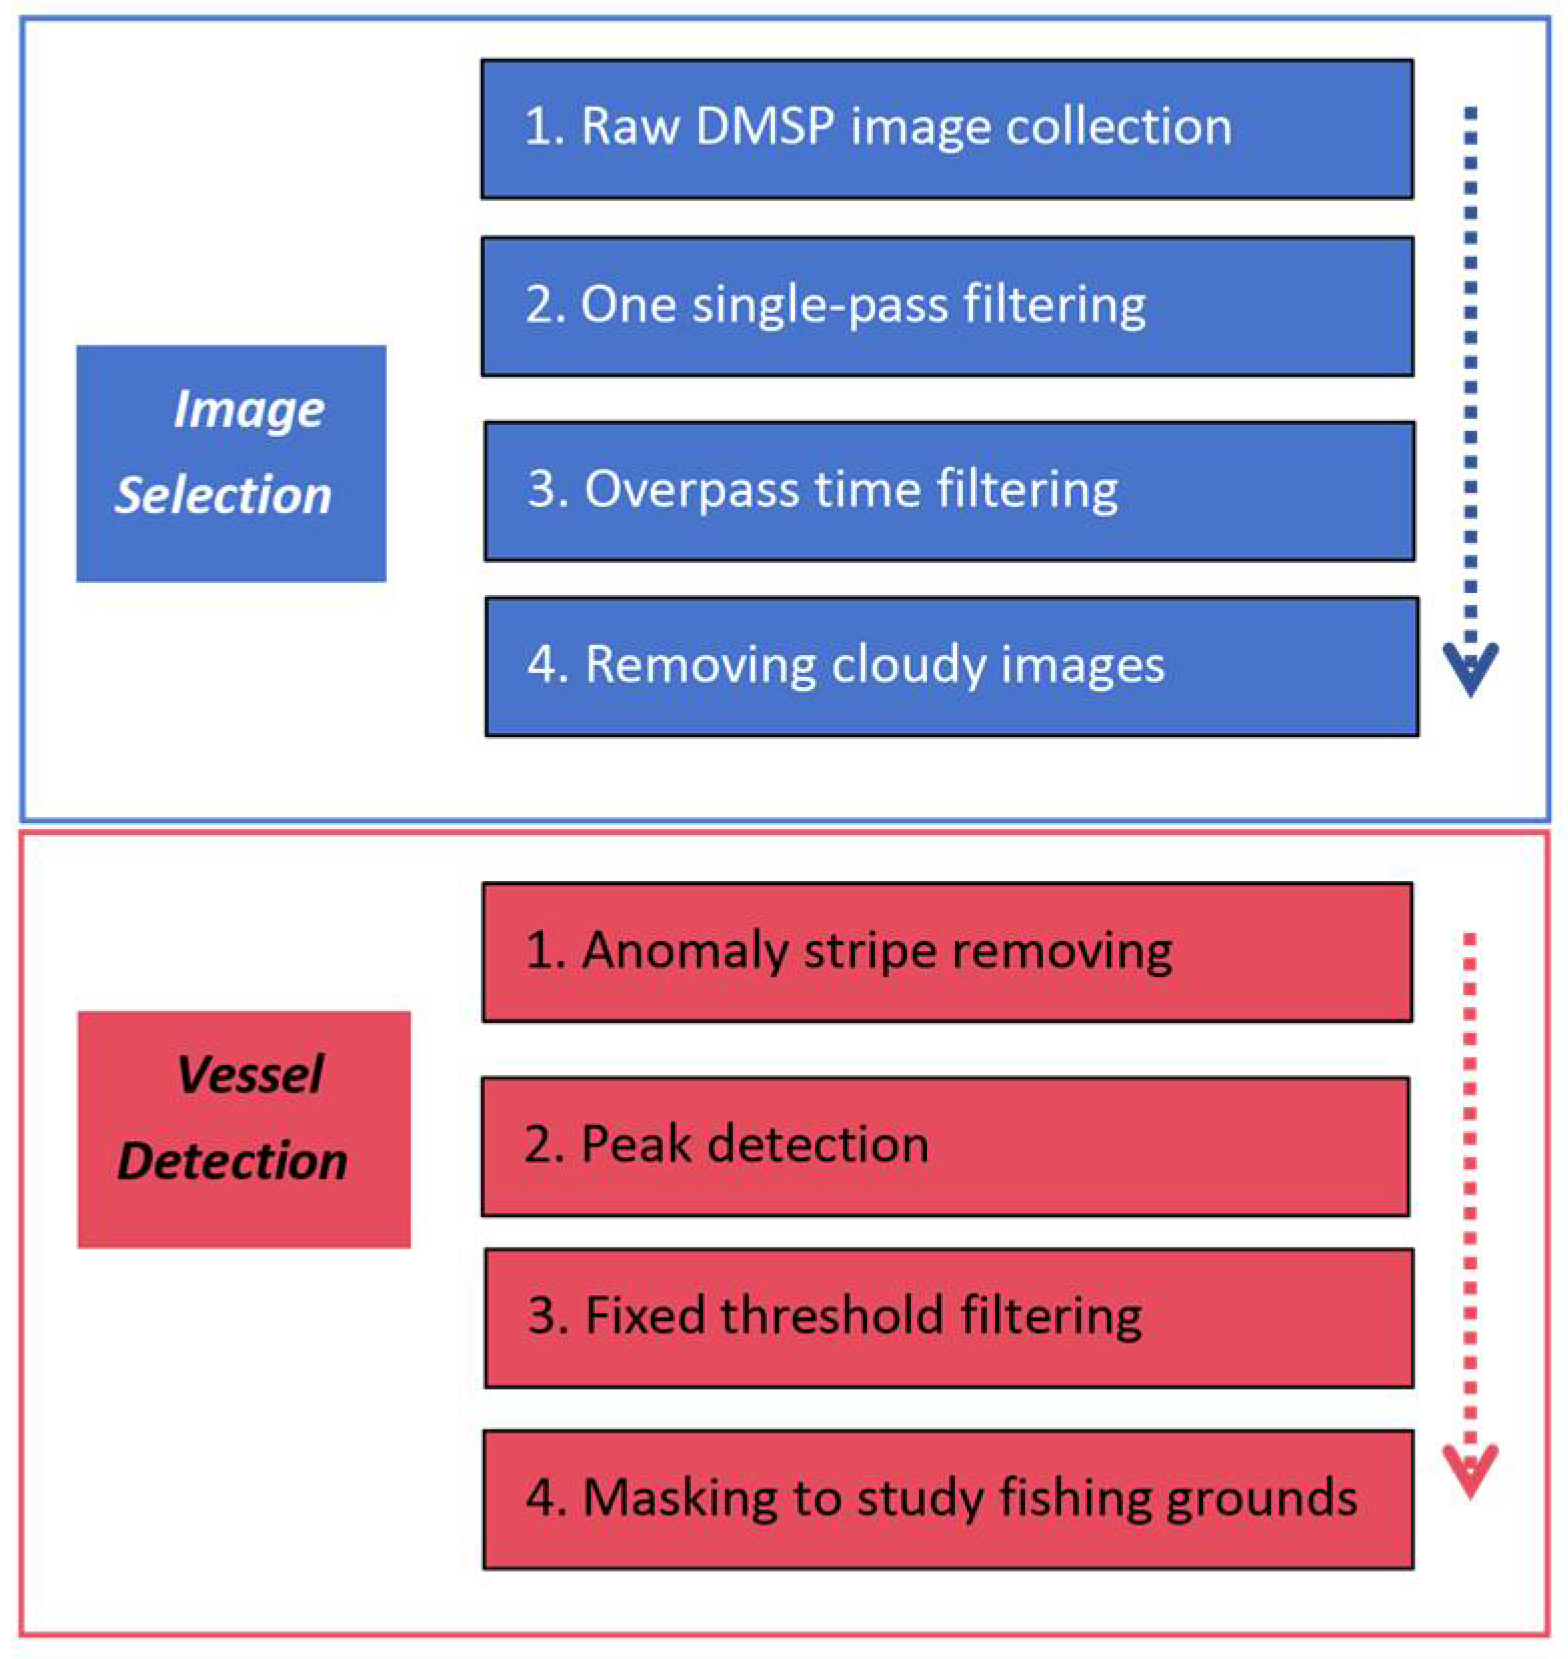
The signature characteristic of lit fishing boats in nighttime images is spikes. Before target extraction, we first removed anomalous bright stripes that usually appear in the DMSP/OLS visible band (Figure 1). These stripes occur at fixed scan angles along orbital swaths but shift geographically when ortho-rectified, depending on the orbit’s nadir location, which can affect boat extraction. Then, a median filter was used to flatten the noise levels of the image before boat extraction. For boat extraction, we used a peak detection algorithm to extract a list of spike features presented in an OLS image and a fixed digital number (DN) threshold to filter fishing boats’ spikes with strong lights. After reviewing a large number of images, a threshold of 20 was selected for the detection of fishing boats’ spikes with the DN value. Finally, the spikes were filtered to remove features on land (Figure 2). The DMSP-OLS has a spatial resolution of 2.7 km, and the typical operational distances between large lighting boats during offshore activities are usually greater than 10 km [11]. Therefore, boat detections from DMSP images in the Zhong Sha and Xi Sha fishing ground could represent the actual number of vessels.
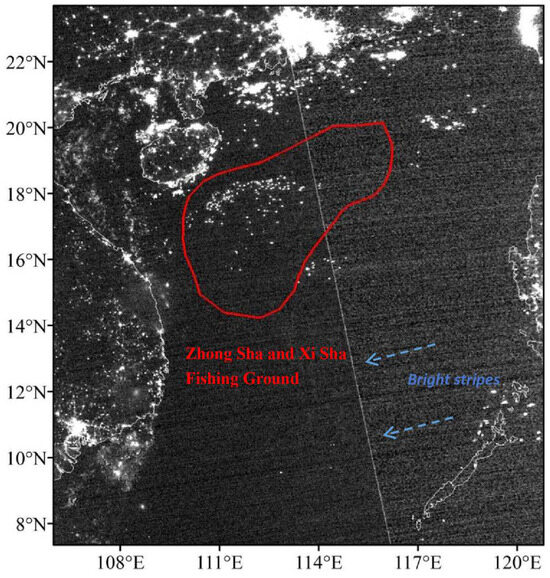
Figure 1.
Typical DMSP/OLS nighttime low-light imaging with a bright stripe. A stripe usually appears at a specific location along the scan line.
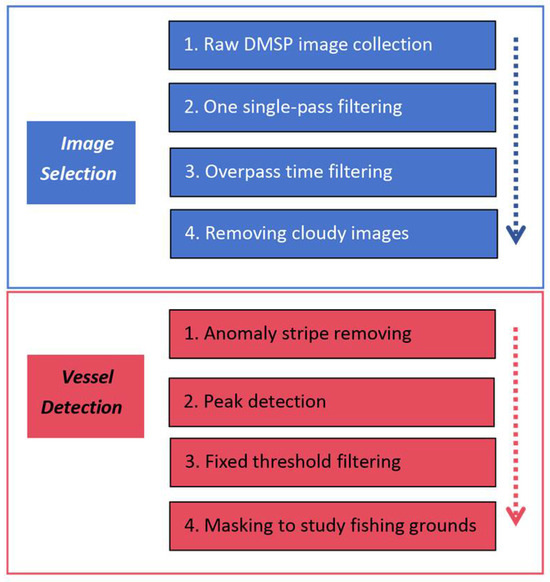
Figure 2.
Flow chart for extraction of lit fishing boats from DMSP/OLS images.
2.3. Lit Fisheries’ Habitat Model Construction
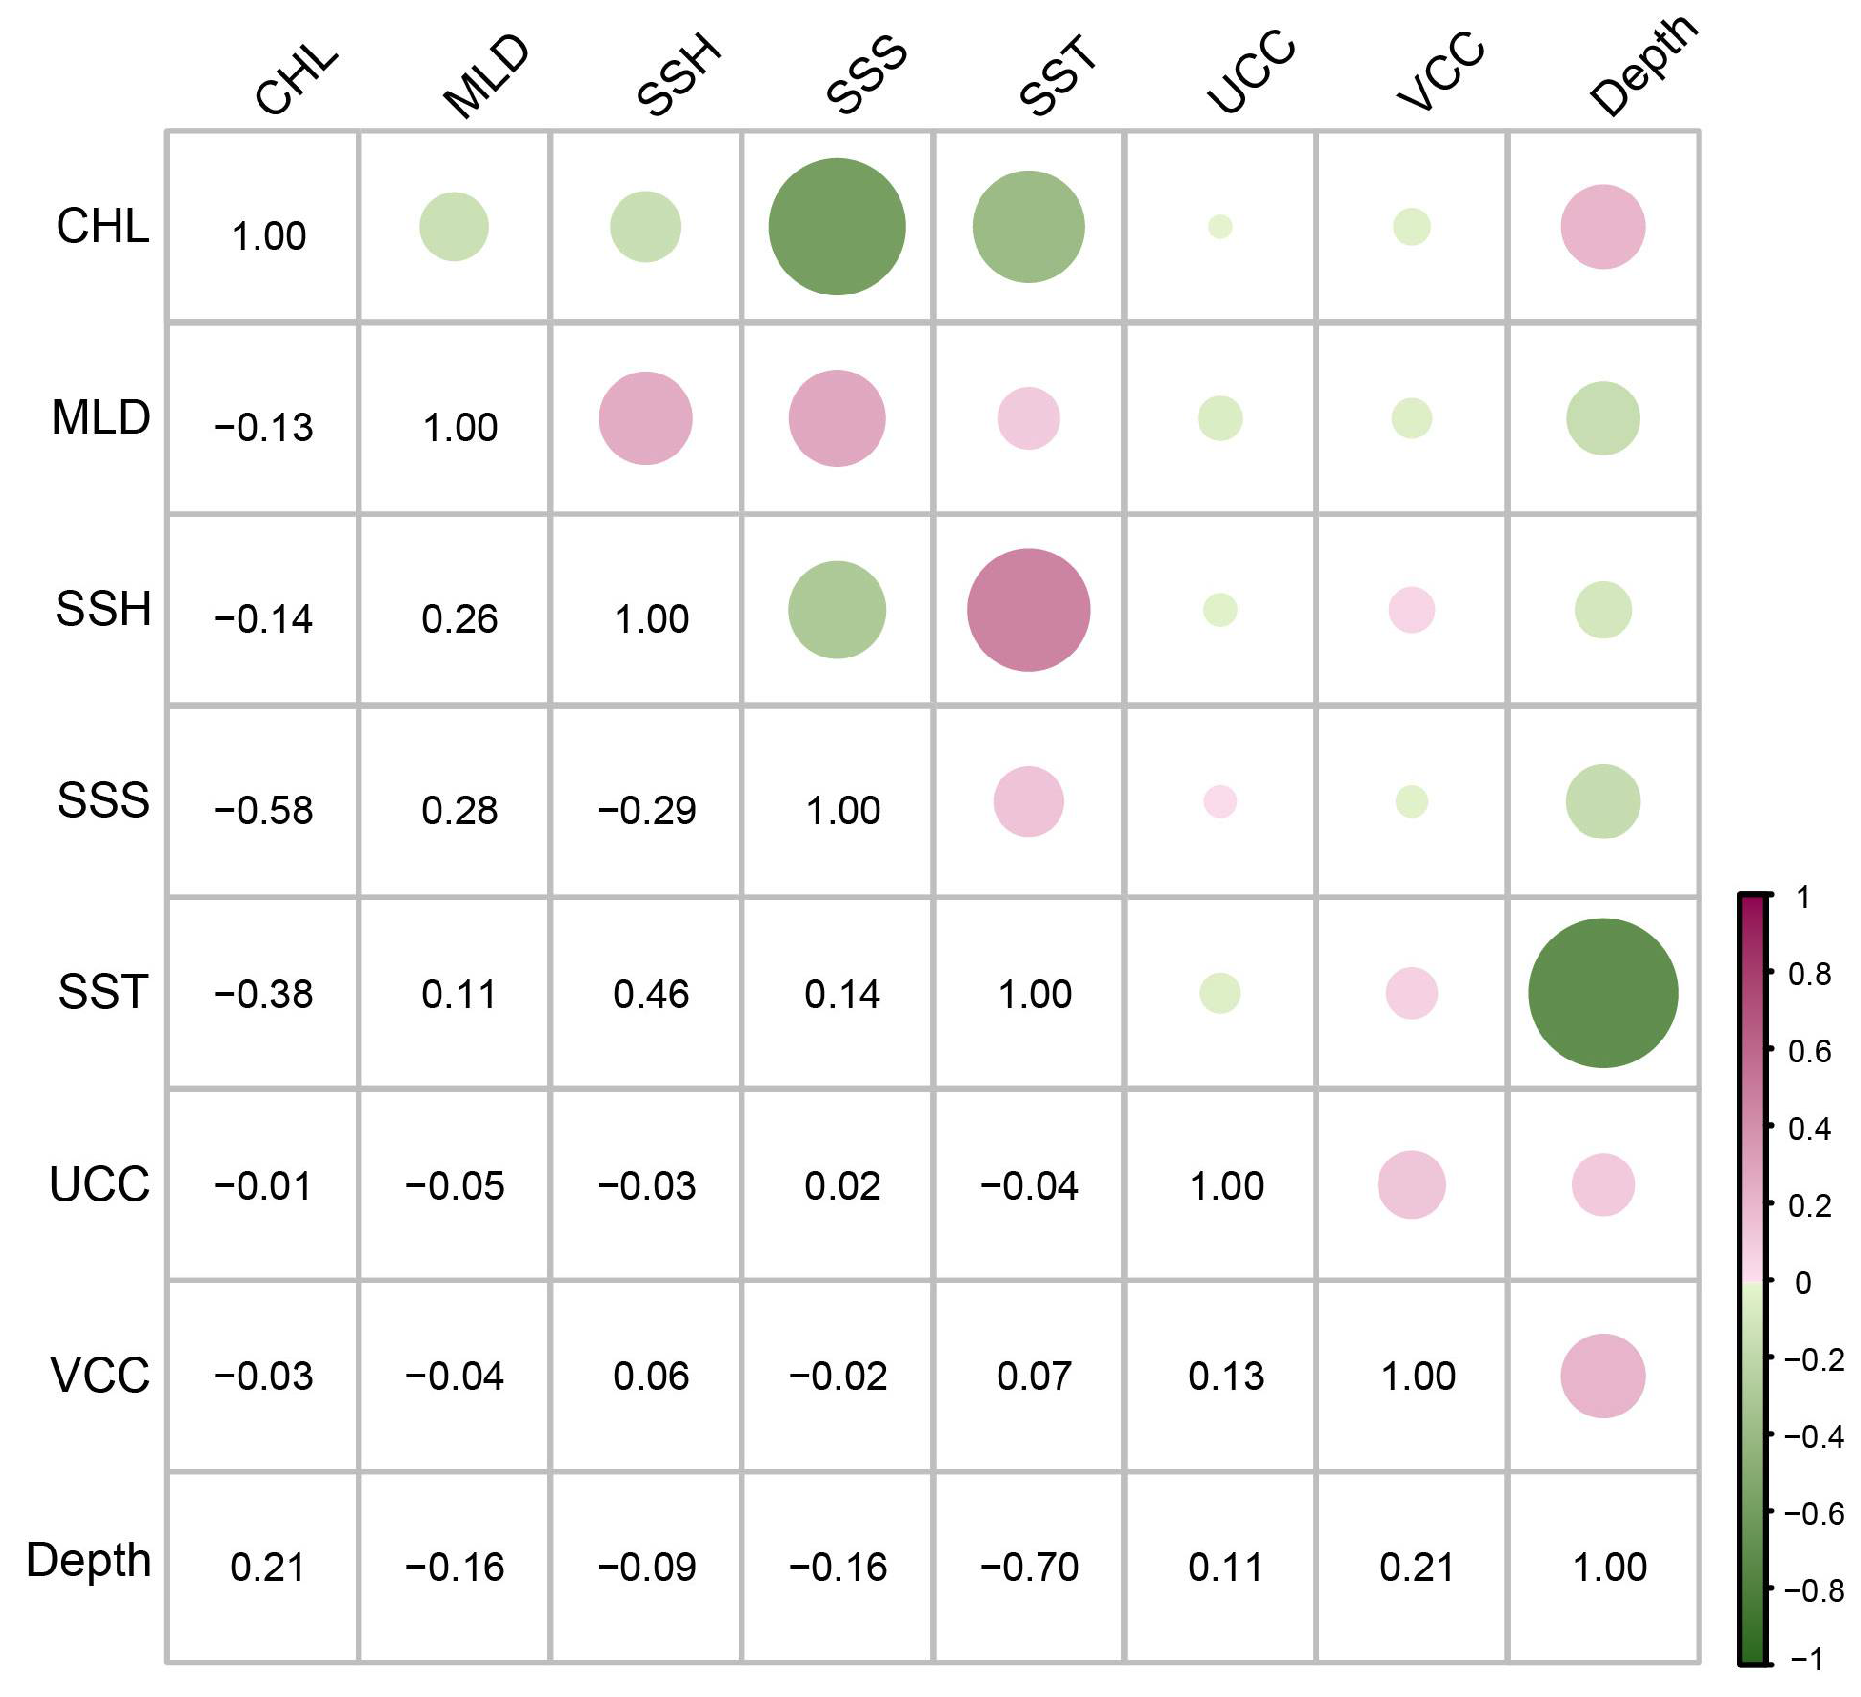
Species distribution models (SDMs) represent a powerful tool for estimating species habitat suitability through linking the distributional information of target species to environmental predictors [28]. SDMs have been successfully applied to commercially valuable fishery species [29]. In this study, we developed SDMs for lit fisheries in the Zhong Sha and Xi Sha fishing ground via the maximum entropy algorithm (MaxEnt) [30], which is a presence-only modeling approach and has been commonly applied to the marine realm [31]. In order to avoid the adverse effects of sampling bias on model fitting [32], we filtered target distribution data before modeling. To achieve this, instead of simply using all the derived fishing positions, we first kept one record per 5 arcmin grid cell only (i.e., the spatial resolution of environmental predictors) and then conducted spatial thinning and made sure that the distance between records was >20 km [33]. After data filtration, we used 140 records on average for model development (Table 2). We considered a total of eight marine predictors at a spatial resolution of 5 arcmin in our SDM analysis, including depth, SST, SSS, SSH, MLD, UCC, and VCC. These predictors are believed to influence the biology and ecology of pelagic fisheries [29]. We computed pairwise Pearson correlation coefficients (r) between the eight predictors, and the levels of all the coefficients |r| were <0.7 (Figure 3), suggesting that the eight predictors were not highly correlated [34]. Thus, all the eight predictors were included in our subsequent modeling analysis.
Table 2.
Number of fishing positions used for species distribution models.
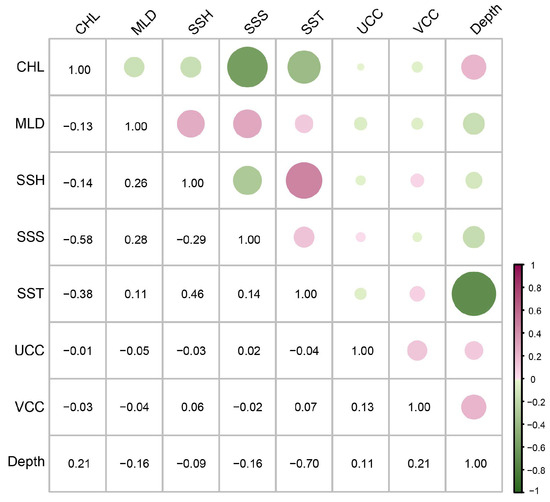
Figure 3.
Correlations among the eight marine predictors.
Model complexity has a considerable effect on model predictions [35,36]. Therefore, we developed MaxEnt models following the best practice recommendations and tuned model parameters. The MaxEnt algorithm has two critical parameters, namely feature classes and the regularization multiplier. We considered 32 different combinations of feature classes (linear, quadratic, and hinge) and a regularization multiplier (ranging from 0.5 to 4 at a step interval of 0.5). For each parameter combination, we evaluated model discrimination capacities via 5-fold cross-validation: 80% of distribution data were randomly selected for model training and the remaining 20% for model testing, and this procedure was repeated five times. We selected the optimal models by jointly considering the validation AUC (area under the receiver operating characteristic curve) and 10% omission rate [33]. We further measured the discrimination abilities of the optimal models via the TSS (true skill statistic) [37] and continuous Boyce index [38]. We applied the optimal model of each year to predict the habitat suitability of pelagic squid and fishes in the study area. We also quantified the permutation importance of the eight predictors in determining the distribution of the main targets of lit fisheries in each year.
3. Results
3.1. Rise and Fall of Fishing Activities
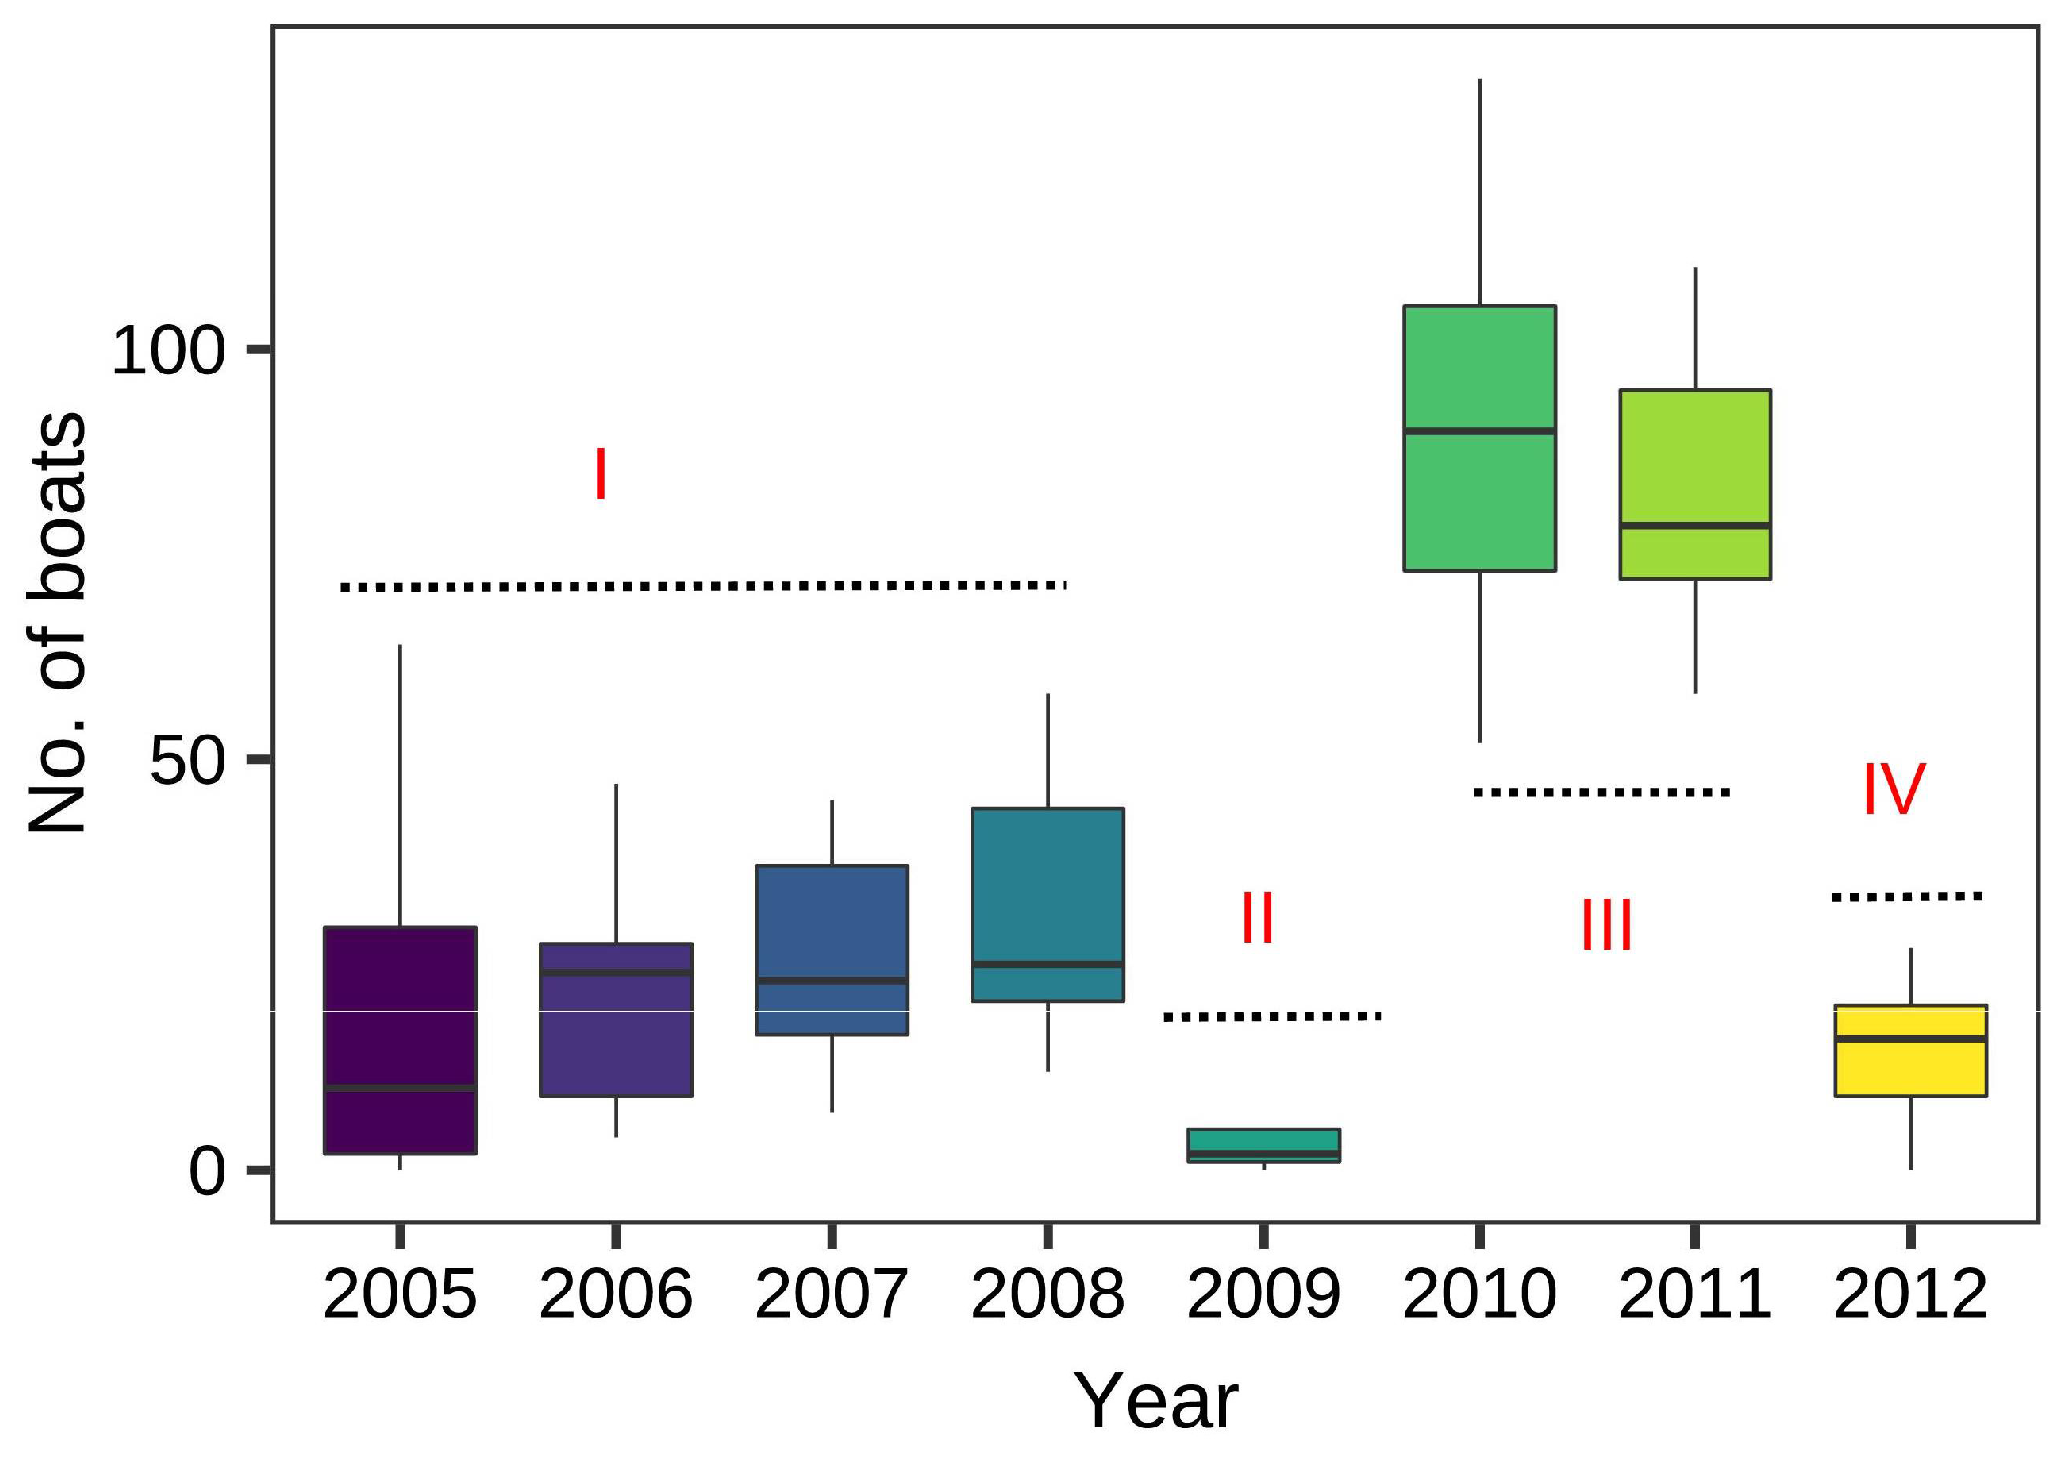
The number of boats actively fishing in the Zhong Sha and Xi Sha Islands during each April of 2005–2012 is shown in Figure 4. This fishing commenced in 2005, and the number of fishing boats from 2005 to 2008 remained largely the same, with an average of ~25 and a maximum of ~60. In April of 2009, a limited number of boats ventured into this fishing ground because of the low price of the primary fishing target, the purpleback flying squid. Based on nighttime light imagery, only up to six boats were fishing there. In 2010 and 2011, newly built steel-hull falling net vessels were strongly encouraged to fish there. The number of fishing boats doubled, with an average of ~80 and a peak of 130 boats.

Figure 4.
Boxplots of number of lit fishing boats derived from nighttime images of Zhong Sha and Xi Sha fishing ground. Development of lit fisheries was classified into four stages (I–IV).
In 2012, the discovery of another abundant open-SCS fishing ground in the Nan Sha Islands resulted in most fishing vessels shifting their operations to the southern region. The number of boats fishing in the Zhong Sha and Xi Sha Islands decreased drastically; the average number was estimated at ~14, and the maximum was 25. The remaining boats were mostly wooden ones that were not capable of going farther south. The rise and fall of fishing operations in the Zhong Sha and Xi Sha Islands could be classified into four stages according to the number of fishing boats: stage I of rising from 2005 to 2008, stage II of pause in 2009, stage III of peaking from 2010 to 2011, and stage IV of shifting in the fishing ground in 2012.
3.2. MaxEnt Model Results
The number of fishing vessels operating in the Zhong Sha and Xi Sha lit fishing ground was very low in 2009 and 2012. This small number of vessels does not adequately reflect the dynamics in the fishing ground, so our analysis excluded these two years from the fishing ground prediction study. Our MaxEnt models for the fishing positions of the six years showed discrimination capacities with AUC > 0.87, TSS > 0.64, and continuous Boyce index > 0.72 (Table 3). It is generally accepted that models with AUC ≥ 0.7, TSS ≥ 0.4, and continuous Boyce index > 0 are considered useful [38,39]; therefore, all our MaxEnt models for the six years satisfy these criteria.
Table 3.
Summary of model performance metrics.
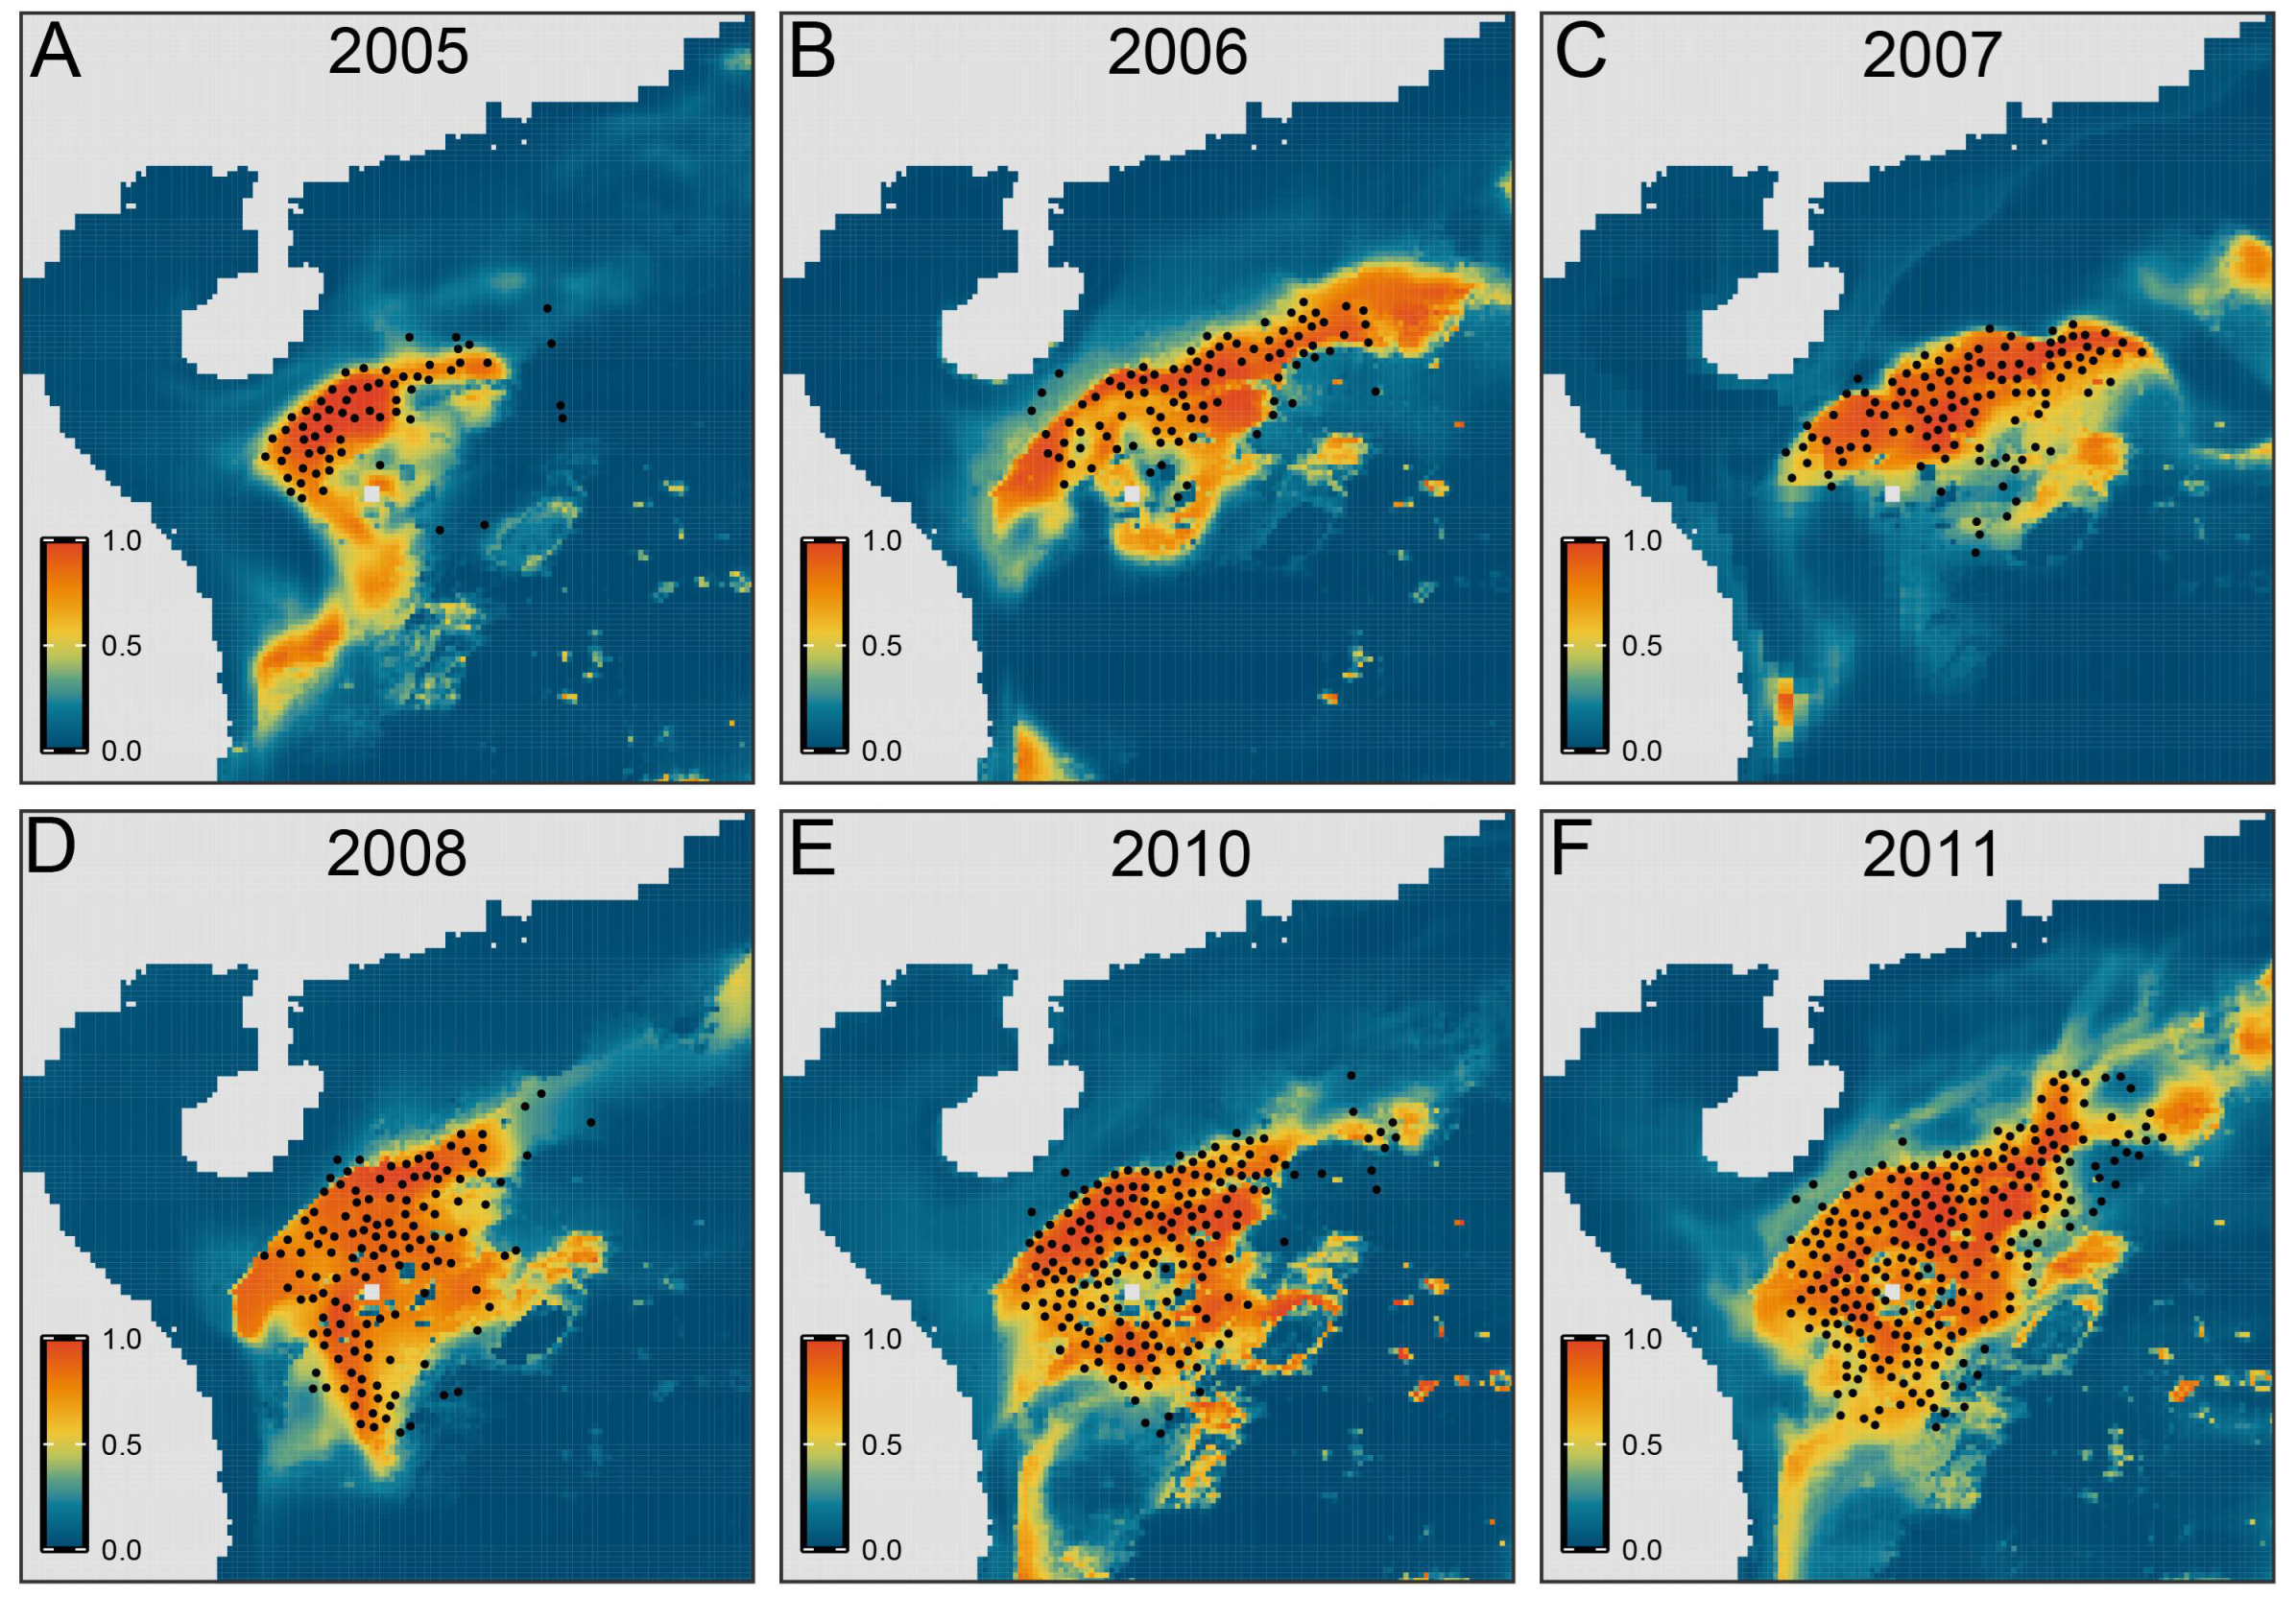
Figure 5 shows model-predicted habitats for lit fisheries, overlaid with actual fishing positions derived from the DMSP. Consistent with the distribution of actual fishing positions, from 2005 to 2011, the potential habitats of lit fisheries increased in their spatial extent. All the maps indicated that suitable habitats were mainly situated in the open northern SCS beyond shelf waters, but the spatial patterns of the predicted suitable habitats varied between years. During the early development of fisheries in 2005, the potential habitats primarily covered the northern part of the fishing ground, and fishing hotspots were confined in the northwest corner of suitable habitats. The suitable habitats and fishing positions extended further east from 2006 to 2007, with latitudinal centers slightly shifting south. In 2008, suitable habitats and fishing positions extended further south. By the peak stage of fishing, fishing positions were distributed almost all over the inferred habitats, mainly in deep waters around reefs and islands.

Figure 5.
Maps showing habitat predictions by the best models for lit fisheries from 2005–2011, where subfigures (A–F) correspond to the years 2005, 2006, 2007, 2008, 2010, and 2011, respectively. The maps display the habitat suitability index, with fishing boat positions for April indicated by the overlaid dots.
3.3. Environmental Preference of Lit Fisheries
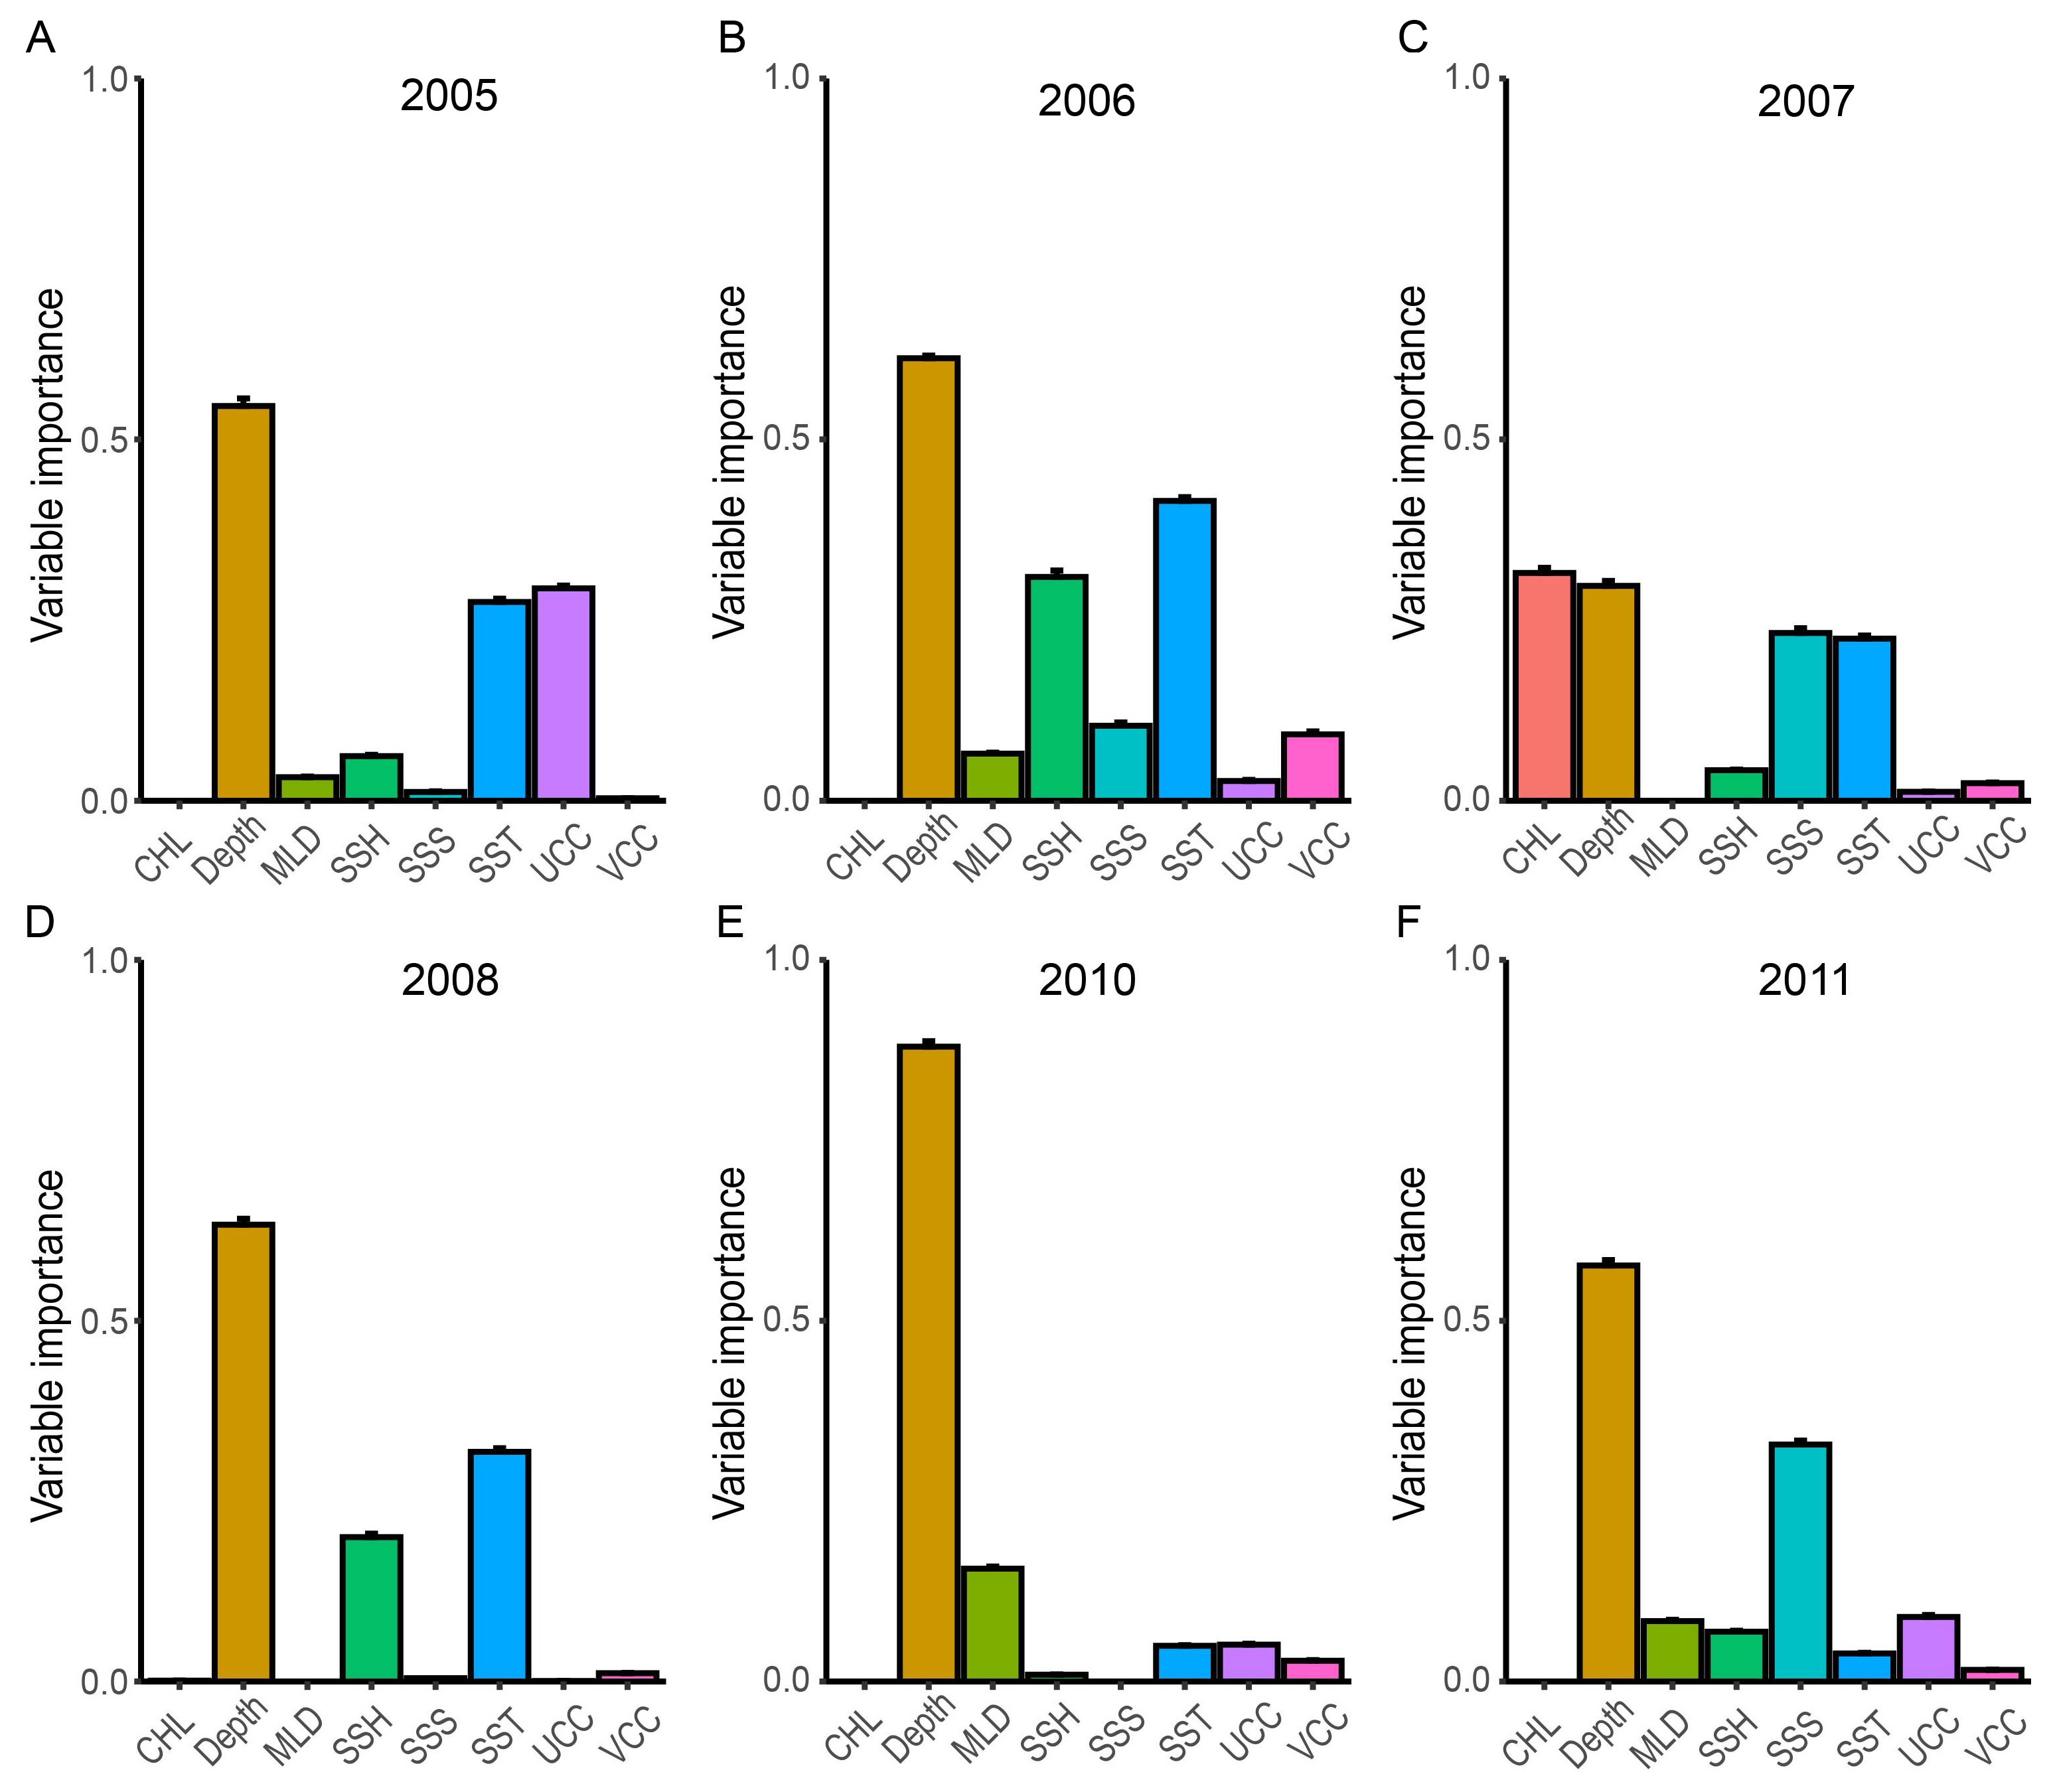
The contribution of environmental parameters to model prediction is shown in Figure 6. These results revealed that the main factors shaping the distribution of lit fisheries in the spring fishing season varied with years. Depth constantly showed a high contribution to model gains (30–88%) across years. SST also showed high importance, especially during the early stages of fishery development (2005–2008), while SSS displayed certain importance in 2006, 2007, and 2011 and SSH in 2006 and 2008.
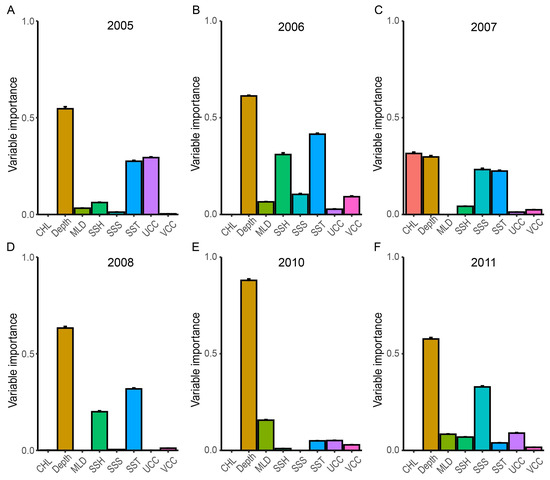
Figure 6.
Relative importance of environmental variables determined by MaxEnt models, with subfigures (A–F) corresponding to the years 2005, 2006, 2007, 2008, 2010, and 2011, respectively.
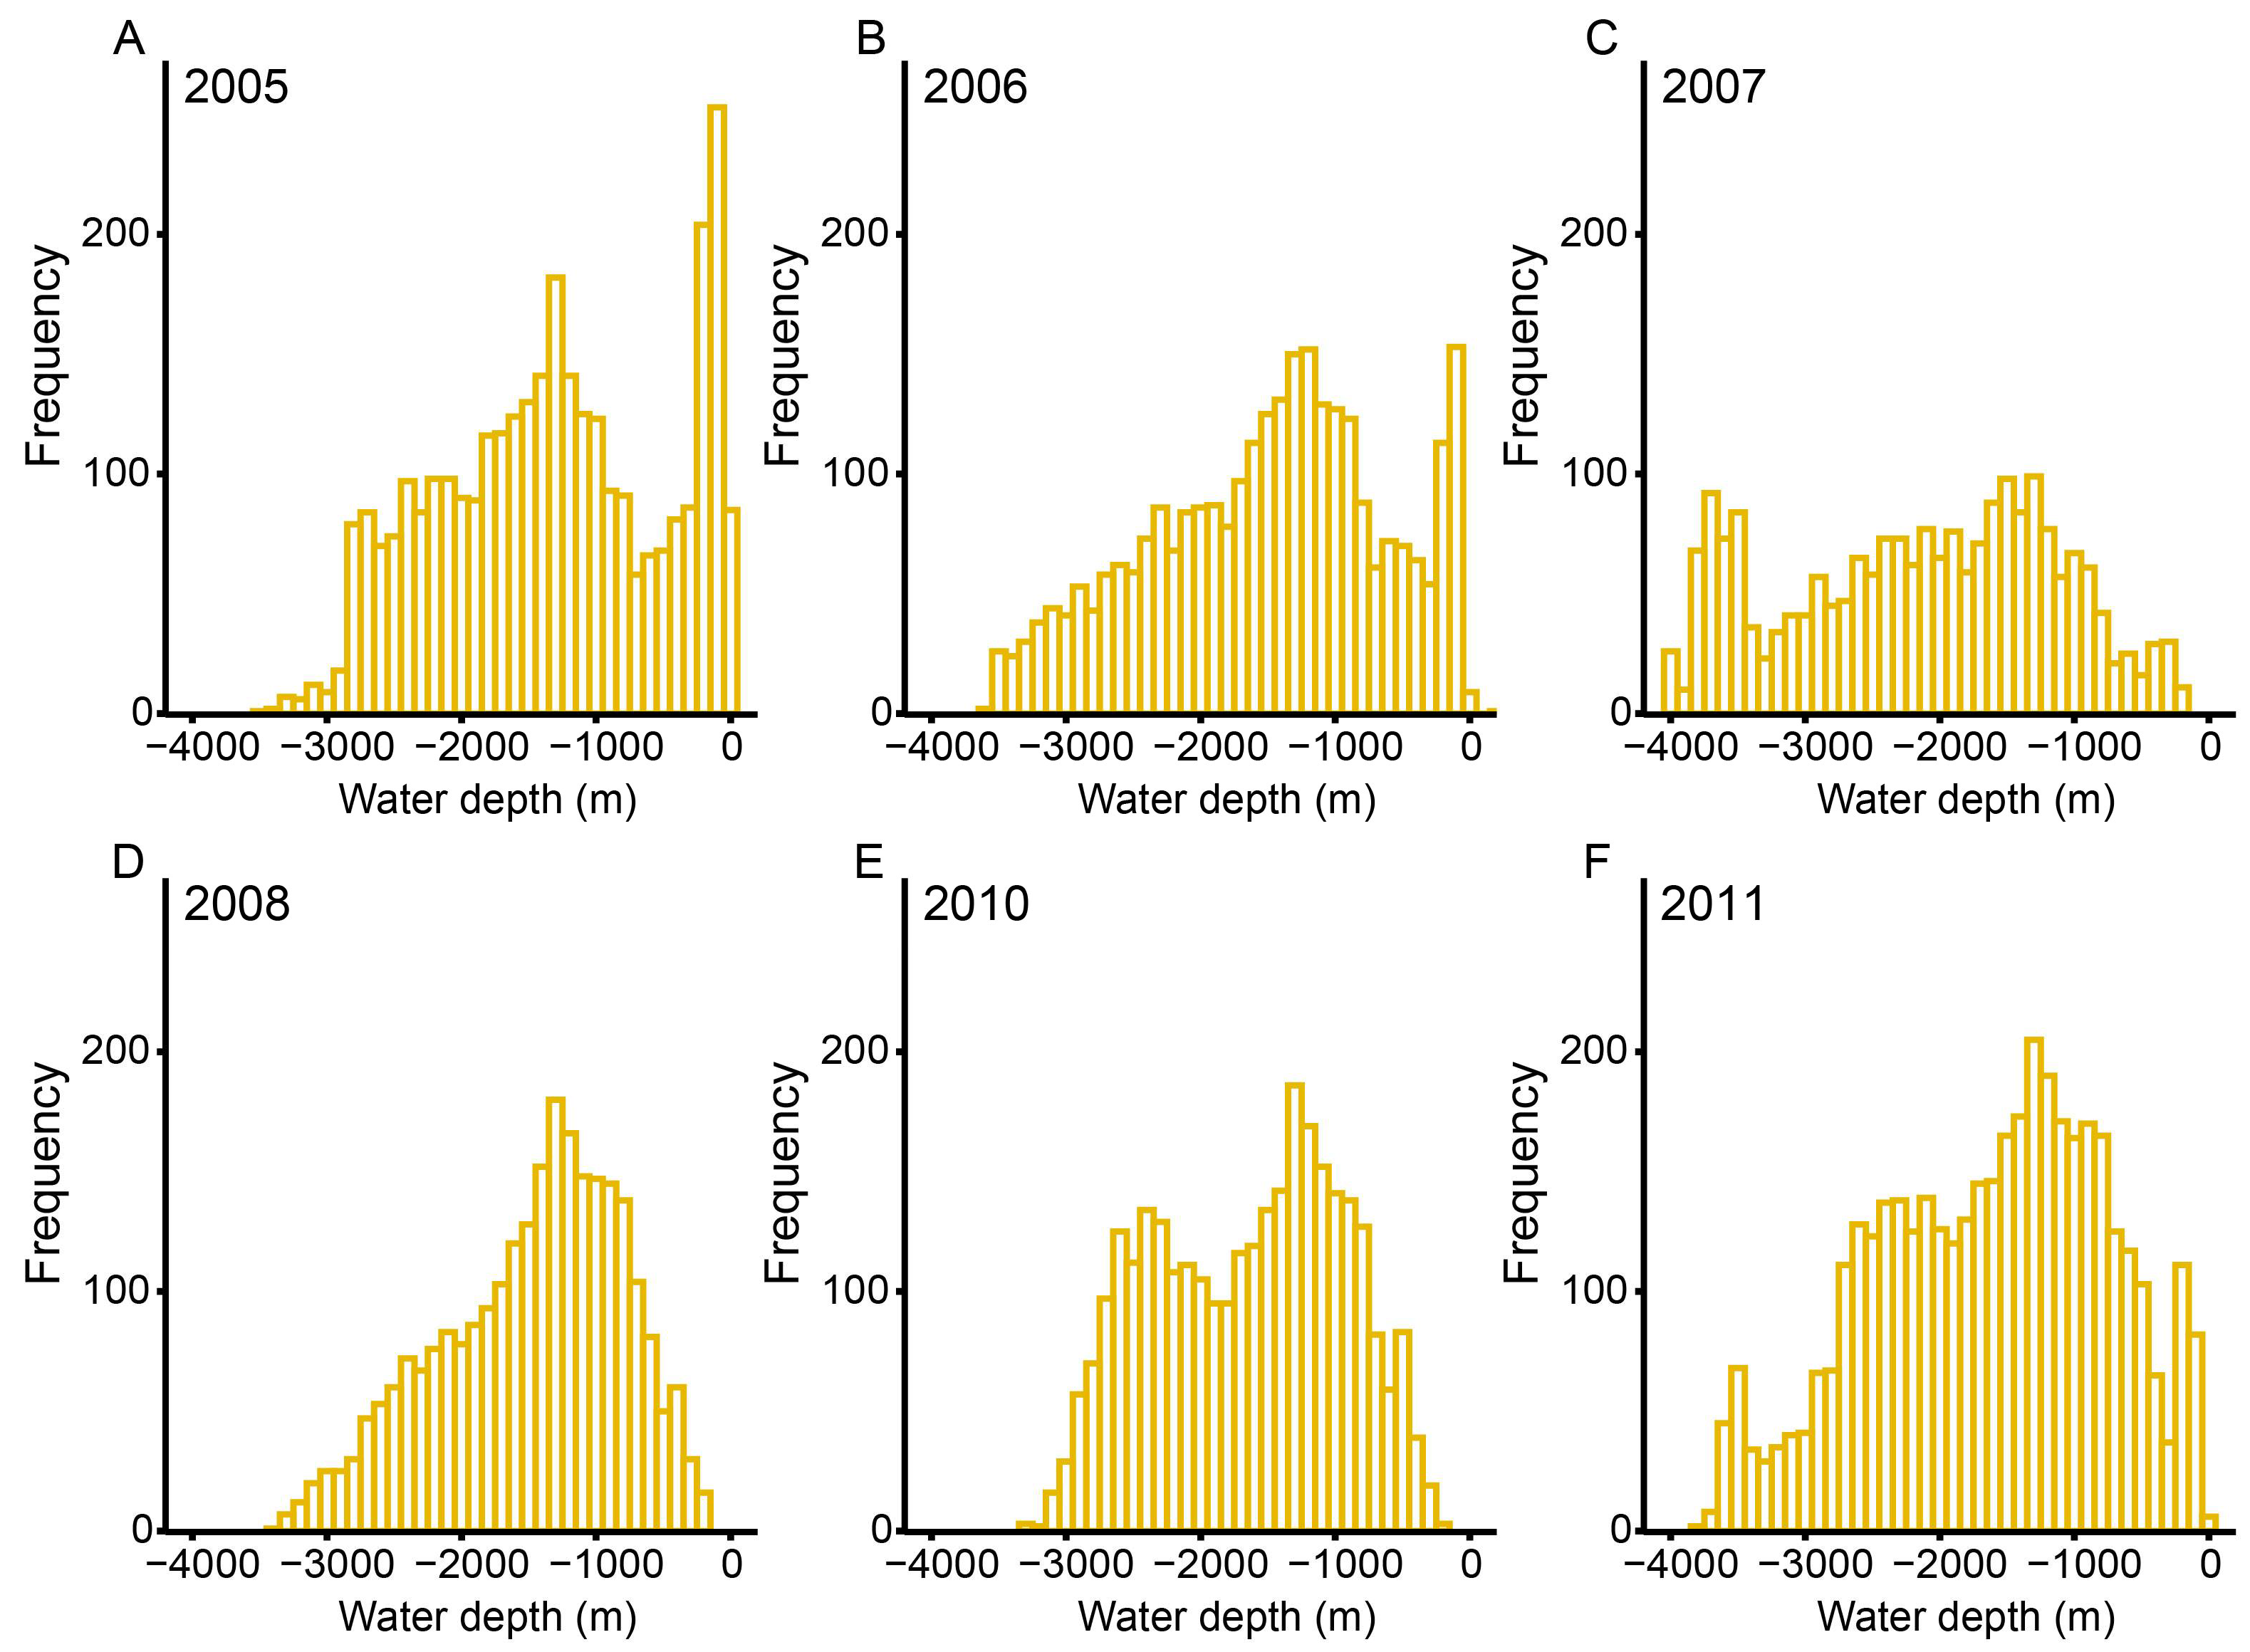
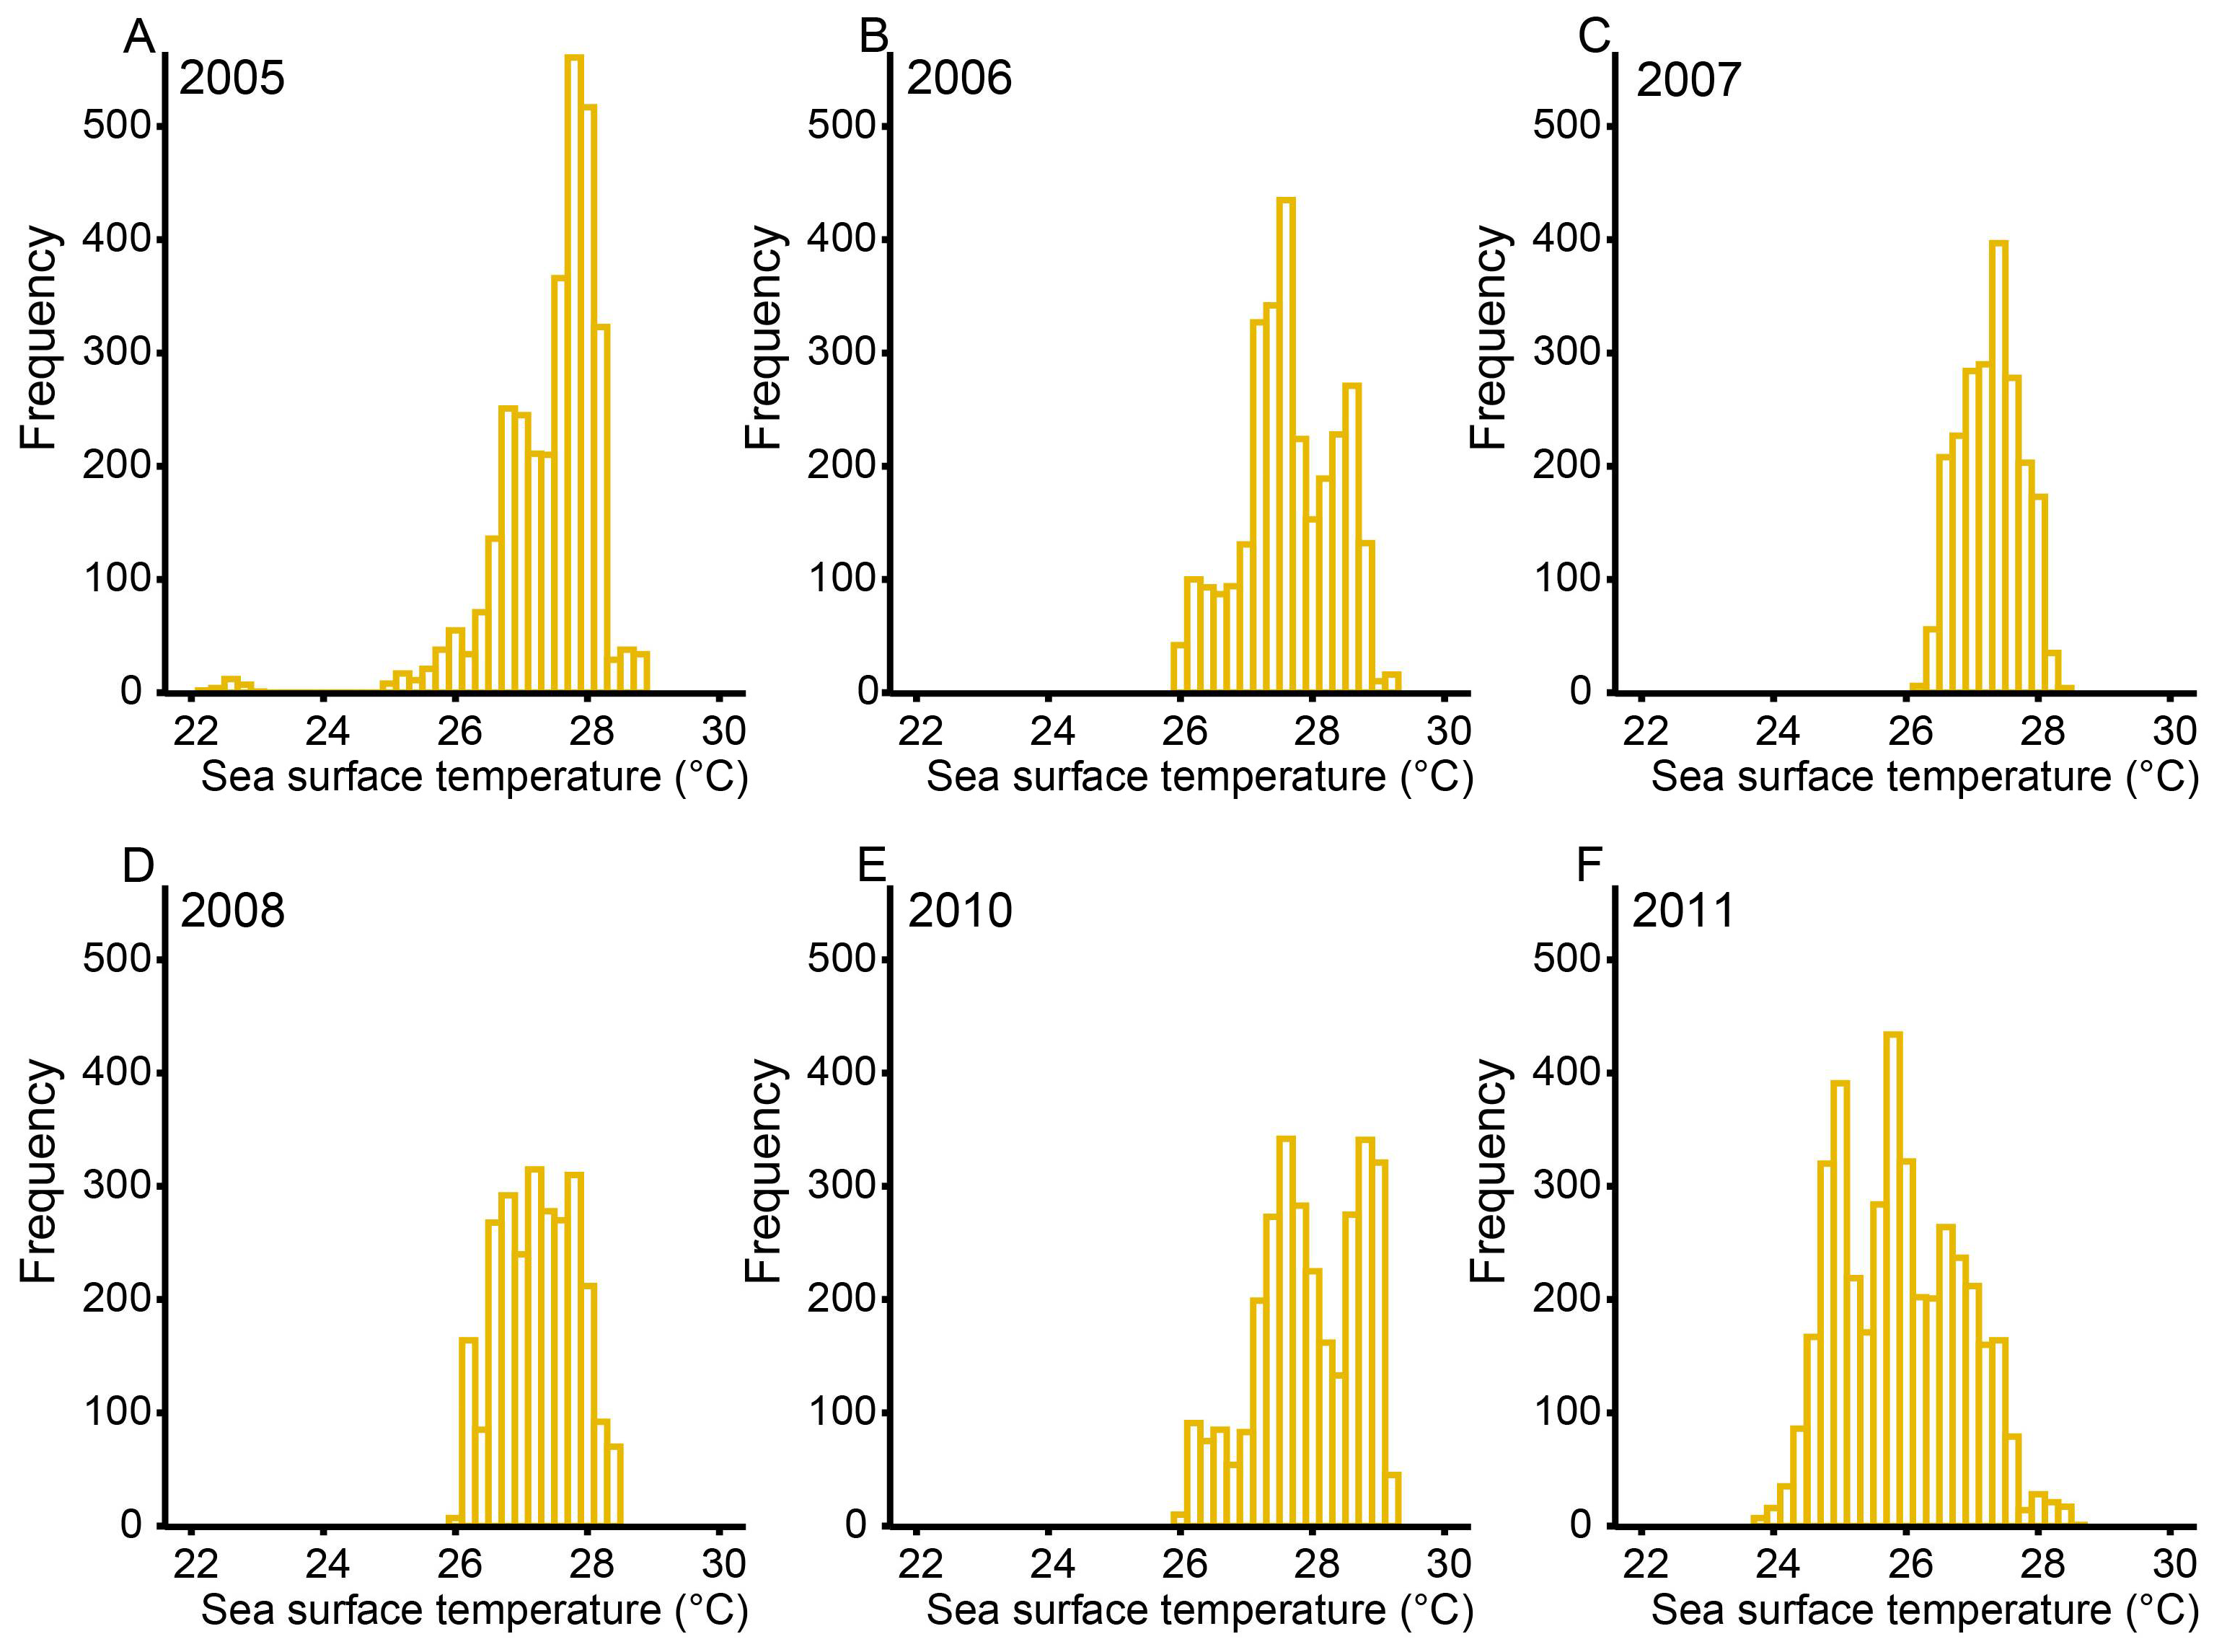
To find the ranges of the preferred environmental variables for lit fisheries, we also estimated the suitable depth and SST. Our results showed that suitable depths were found both over shallow (200 m) and deep (4000 m) areas in the Zhong Sha and Xi Sha fishing ground. However, few suitable habitats could be found in the waters with depth <500 m or >3000 m, and a pronounced peak of suitable depth was found at the depth range of 1000–2000 m (Figure 7). Compared to depth, a suitable SST was more concentrated. The SST range of suitable habitats was 26–28 °C (Figure 8).

Figure 7.
Frequency distribution of number of fishing positions against water depth for Zhong Sha and Xi Sha fishing ground, with subfigures (A–F) corresponding to the years 2005, 2006, 2007, 2008, 2010, and 2011, respectively.

Figure 8.
Frequency distribution of number of fishing positions against SST for Zhong Sha and Xi Sha fishing ground, with subfigures (A–F) corresponding to the years 2005, 2006, 2007, 2008, 2010, and 2011, respectively.
4. Discussion
4.1. Using DMSP to Detect Lit Fishing Boats
In recent years, nighttime light remote sensing has developed into an important means for monitoring lit fishing boats [16,18,39]. It has been a long-standing tradition to employ electric luring lights for fishing in the SCS, yet the recognition of fisheries in oceanic waters and the application of the DMSP to track fishing operations have been quite limited. Our study is the first to utilize DMSP low-light remote sensing to investigate lit fisheries around the Zhong Sha and Xi Sha Islands. This research significantly enhances our understanding of the early development of modern high-powered lit fisheries in the open South China Sea, providing valuable insights into their historical evolution in this region.
For the DMSP/OLS, there are two data products with contrasting temporal resolution, namely daily raw data and monthly cloud-free composite data [40]. Monthly images are widely used in social and economic research, and NOAA’s national geophysical data center (now National Centers for Environmental Information) has opened up the public acquisition of relevant data due to their extensive application [41]. Daily data are not yet available for free access. A fishing cruise of lit fisheries used to last for about one month. By making use of monthly composite data, the spatial distributions of lit fishing can be effectively discerned [42]. As shown in Supplementary Figure S1, where the fishing area is highlighted as an illuminated area, the monthly composite data are in good agreement with our findings derived from day-to-day images. Nevertheless, with monthly composite data only, we are unable to accurately determine the exact number of fishing boats operating in the study area. Additionally, DMSP satellites cannot keep their orbit timing constant, and thus, the overpass time varies among satellites [19]. When creating the DMSP-OLS monthly data, only images with high quality are included. This could make some monthly images cover only a part of the fishing ground. For example, the average nighttime overpass was earlier in 2009 than in other years (Table 2), necessitating many of the images to be taken at dusk. Because of this, there was no imaging for the north part of the fishing ground in the April of 2009 (Figure S1). This drawback should be taken into consideration when using cloud-free monthly composite data.
With daily imagery, the number of fishing vessels could be calculated. Accurately extracting vessel targets from daily nighttime imagery is the key to realizing the use of nighttime remote sensing for monitoring fishing vessels. Waluda et al. [21] established a method for quantifying the intensity of light fishing based on the positive correlation between the number of squid fishing vessels and the light-illuminated pixels of the first-generation nighttime remote sensing sensor DMSP/OLS image and by setting DN = 30 as a fixed threshold. Subsequently, most of the fishing vessel monitoring studies based on DMSP/OLS images screened vessel targets by using this fixed threshold, thereby estimating the location and number of light fishing vessels [15,23,43]. The threshold screening of light targets can quickly extract light fishing vessels in nightly images. However, a single fishing vessel usually corresponds to multiple light pixels, and the number of pixels is affected by various factors (the number and intensity of fishing lights, etc.), and a simple linear relationship cannot accurately quantify fishing boat targets.
In this study, we use peak detection combined with a threshold to extract fishing vessels; in the offshore area, lit fishing vessels always keep a certain distance from fish, and this distance make these vessels safe, and peak detection could accurately extract fishing vessels and positions [16]. Lit fishing boats in the SCS are typically smaller in size compared to high sea fishing vessels. They are also equipped with luring lights that are less powerful. Given these characteristics, it is important to set a low DN threshold value. This allows for the effective extraction of these lit fishing targets, which might otherwise be overlooked due to their lower-intensity lighting. Our study extracted the numbers and locations of these lit fishing boats well in the Zhong Sha and Xi Sha fishing ground and contributed to the understanding of the development and change in these fisheries. However, there are still some important matters that should be noticed in applying the DMSP/OLS for vessel monitoring. Firstly, a single night-light remote sensing image only provides a momentary scene each night, and the situation of off-lights exists between operation nets, so there is a certain underestimation according to the extraction results of single-scene images. Secondly, the DN threshold for extracting fishing vessels is difficult to determine, and we obtained a conservative value through a typical demonstration of fishing boats. The power of fish lights in early vessels was low, and it has grown rapidly in recent years. The fixed value we set may not be able to effectively extract ones with low power. Thirdly, though we eliminated orbits significantly affected by clouds and sunlight, the screened images may still be impacted by meteorological conditions such as thin clouds and haze. This may also be the reason why the number of vessels we extracted still fluctuates greatly, though the number of fishing boats working during fishing season is relatively stable.
4.2. Development of Lit Fishing in SCS
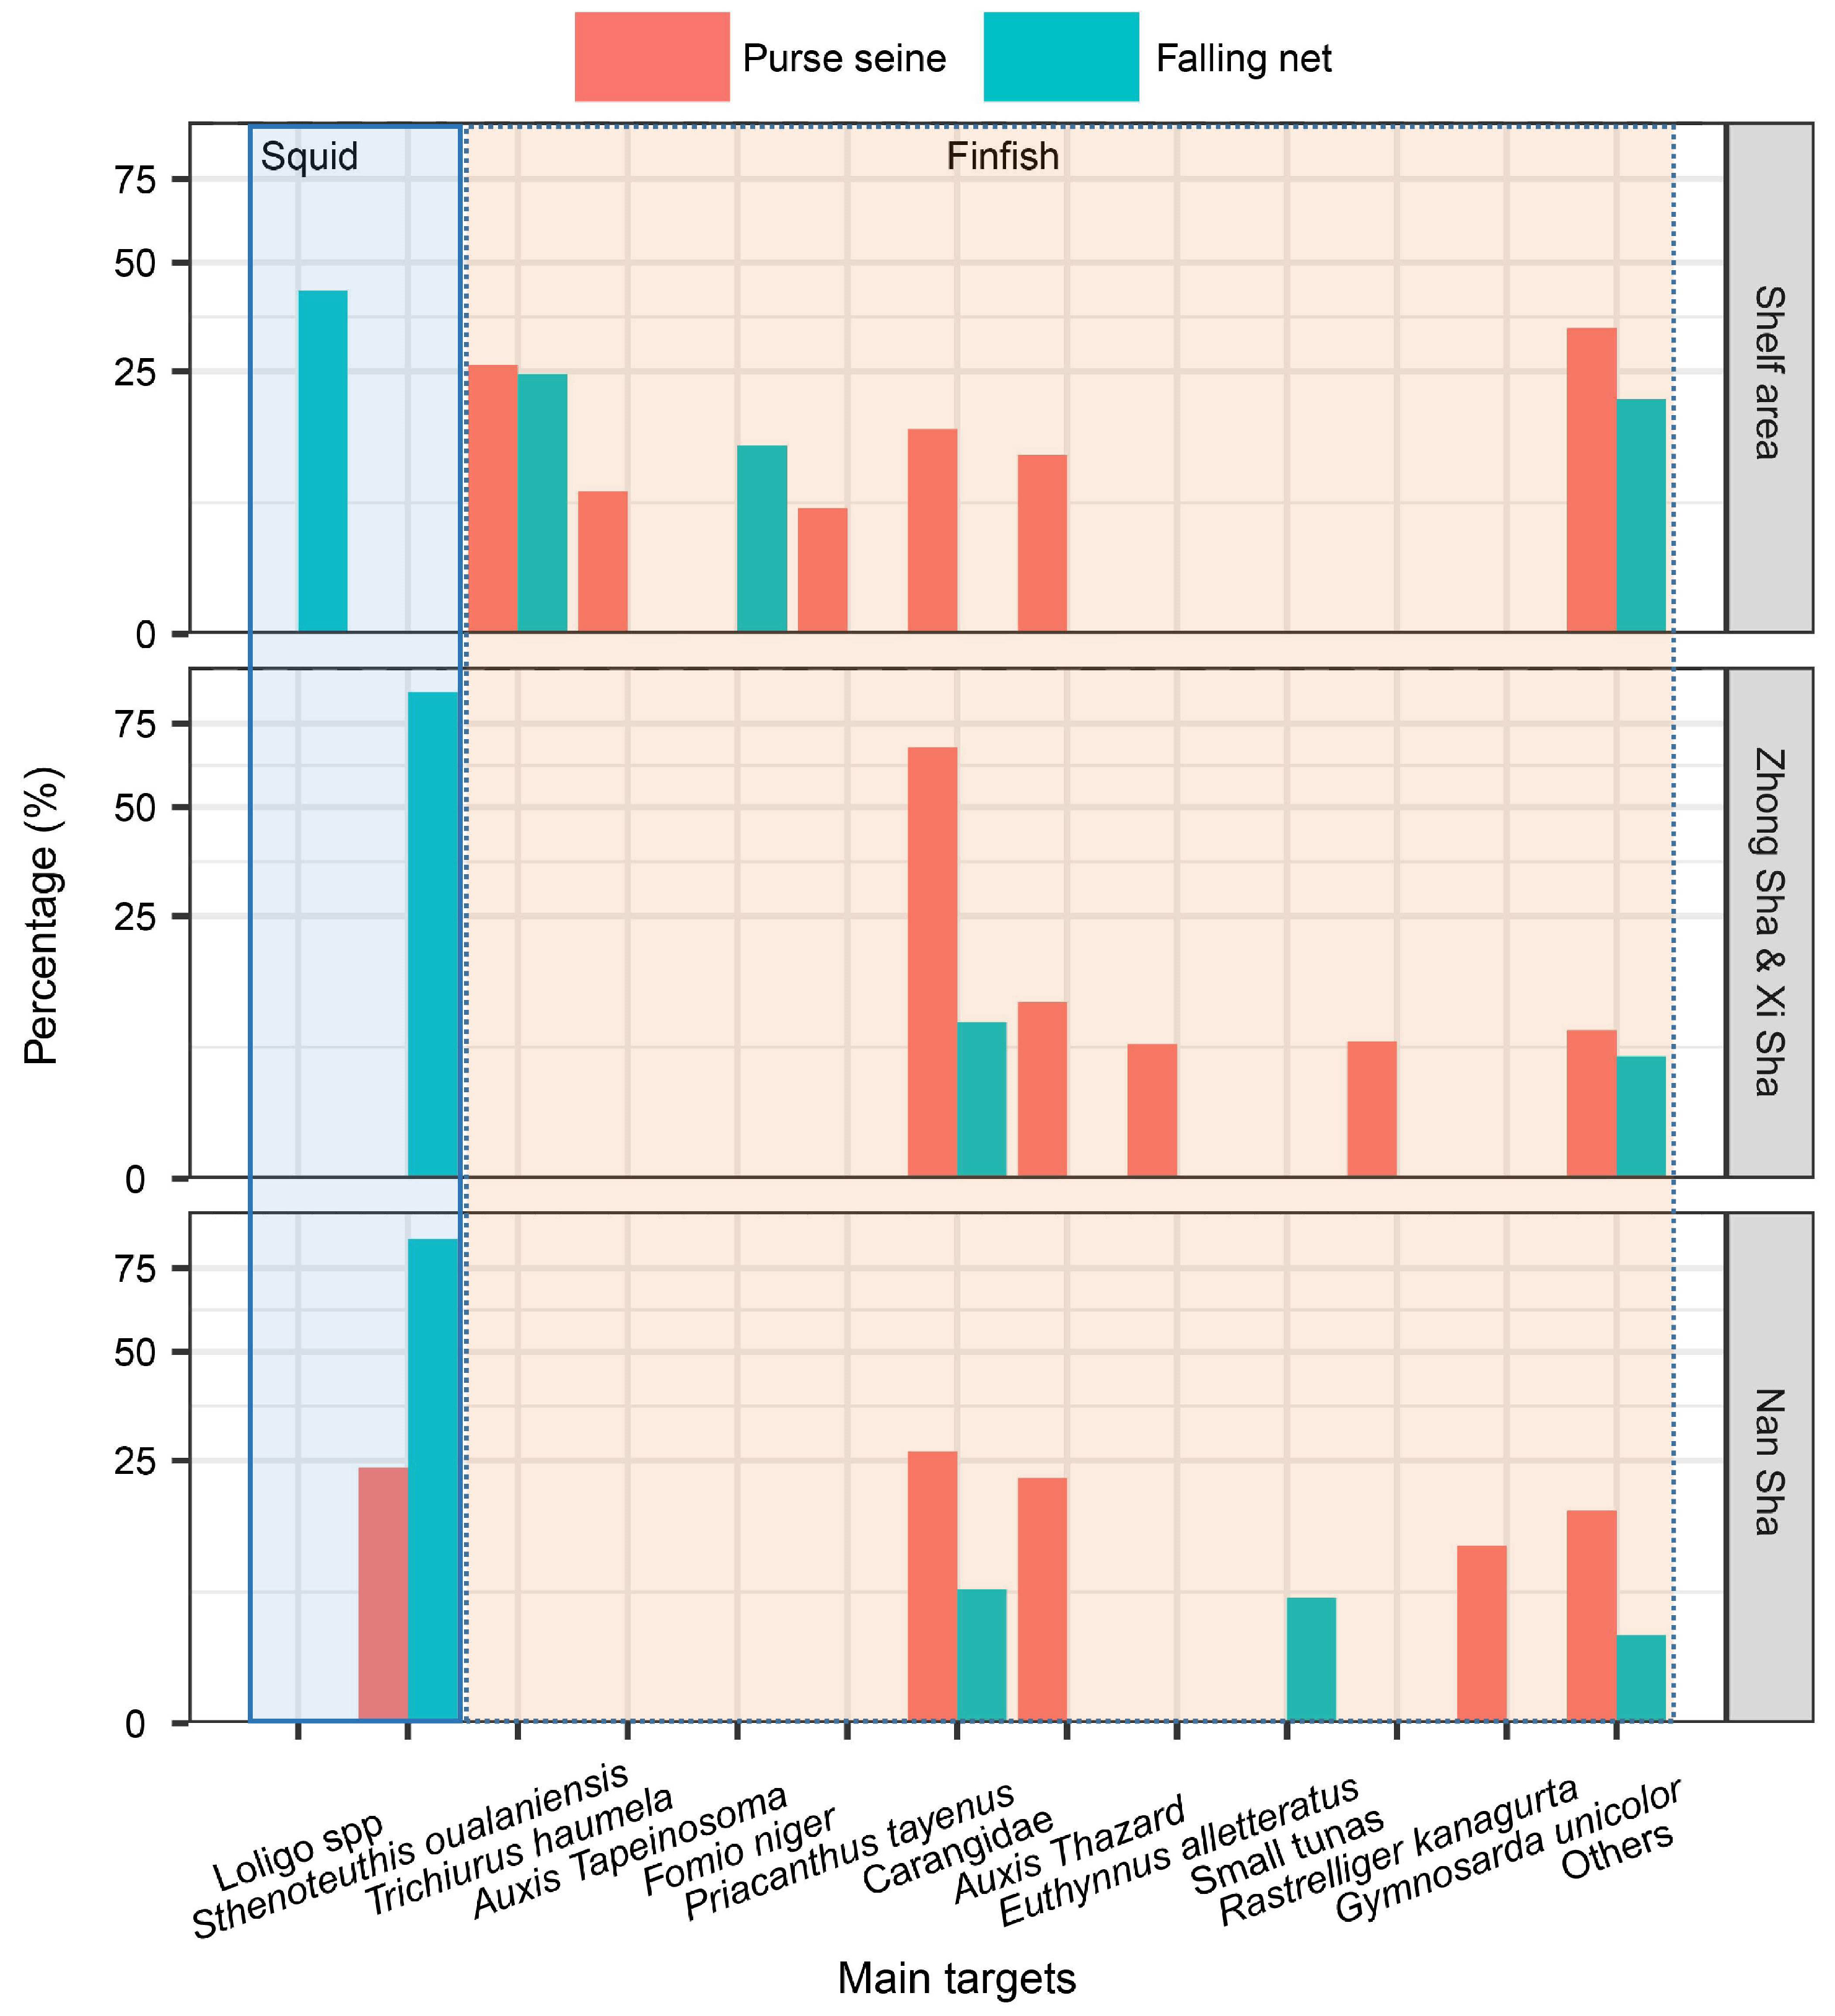
Using light to attract targets for fishing has long been documented in ancient Chinese literature. Historically, lit fishing boats were equipped with fire lights [44]. Modern lit fishing using electrical power emerged in the SCS in the early 20th century. Fishermen from China’s Guangdong Province were the first to have their purse seiners equipped with electrical luring lamps. Then, fishermen from Fujian Province introduced this fishing technique in 1938 due to its high efficacy. In the 1970s, the technique of lit purse seiners was extended to Zhejiang Province. From then on, fishing companies along the China coast started to build this type of fishing boat. Another type of fishing boat using lights is lit falling netters that appeared in China in the 1990s [12]. Both purse seiners and falling netters use light to attract fishing targets, but they are two fundamentally different fishing methods. The fishing net of a purse seiner is much larger than that of a falling netter; the circumference of a purse seine is 480–850 m, while that of a falling net is only 145–245 m. In addition, a falling netter can fish up to 10–16 hauls per night. It spends a longer time luring fish before its first haul, but the luring time for subsequent hauls is <30 min, and it takes ~20 min each for shooting and hauling. A purse seiner can only fish 2–3 hauls per night, with an average luring time of 3–4 h and shooting time of ~1 h per haul. Due to their distinct fishing operations, the targets of these two types of gear also differ remarkably. Major targets of the two types of fishing gear are presented in Figure 9, from which obvious differences could be found. Most of the targets of a falling netter are low-speed squids, while those of a lit purse seiner are quick-swimming fishes. In addition to the types of gear, fishing areas also influence target compositions. Lit falling netters mainly target purpleback flying squid in open waters, but they fish loligo squids in near-shore areas. As for purse seiners, their targets consist more of tuna-like fishes in open water and more of Trichiurus haumela in near-shore areas.
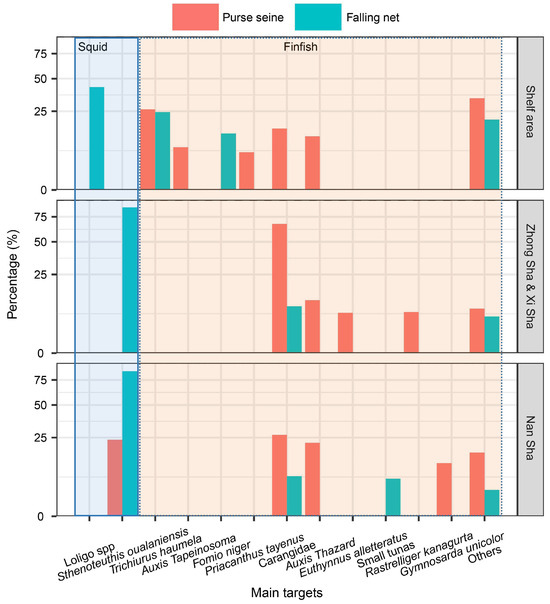
Figure 9.
Main targets of lit fisheries in SCS by two types of gear (purse seine and falling net) and three fishing grounds (northern shelf, oceanic waters in Zhong Sha and Xi Sha Islands, and in Nan Sha Islands) [10,13,14].
During the early development of lit fishing in the SCS, fishing boats using lights mainly operated in inshore waters of <40 m depth, and the number of falling netters was far less than that of lit purse seiners [12]. Early fishery yearbooks used to lump lit falling netters into lit purse seiners or classified them as miscellaneous fishing boats. In the spring of 2004, some lit fishing boats succeeded in the exploration of open-sea fishery resources in the waters in the Zhong Sha and Xi Sha Islands, which greatly enhanced fishing efficacy and stimulated the development of large fishing boats that could go as far as beyond the outer shelf of the northern SCS. Lit fisheries in the open SCS developed quickly between 2005 and 2011. By 2011, the number of lit fishing crafts seasonally operating in the open northern SCS had exceeded 200, including 35 newly built steel-hull large fishing vessels [13]. Unlike the simple operation of a falling net, purse seine operation requires high technical skill. At present, skilled fishermen who can operate a lit purse seiner have become fewer, and the overall efficacy of a falling netter is higher than that of a purse seiner. For this reason, the number of purse seiners apparently decreased from 2004 to 2012, while those of falling netters increased. In recent years, purse seiners are mainly concentrated in near-shore fishing grounds, while falling netters have gradually evolved as a major fleet of lit fishing, especially for the open SCS.
4.3. Factors Shaping Distribution of Fishing Operations
Pelagic fishes are short-lived ecological opportunists; their distribution and abundance are extremely sensitive to changes in environmental conditions [45,46]. The distributions of lit fisheries are closely related to SST, Chl-a, SSH, and the occurrence of El Niño and La Niña events [9,47]. To explore factors shaping their distribution patterns, models such as GAM, GLM, HSI, and MaxEnt have been constructed for lit fisheries of high seas and the Japan Sea [45,48,49,50]. Catch per unit effort (CPUE) and fishing effort data are considered as reliable proxies for species presence or abundance, and they have been increasingly used for developing habitat models [45,51]. Compared to fishing effort data, CPUE data, which need well-recorded fishing logs, are less available. Additionally, the results of comparative studies between effort- and CPUE-based habitat models revealed that CPUE-based models tend to overestimate the optimal ranges of habitats [51]. Studies also revealed that the positions of fishing vessels inferred from nighttime imagery matched well with the reported actual catch and the vessels’ positions [46,52]. Alabia et al. [29] succeeded in constructing presence-only habitat models using fishing effort data derived from nighttime light remote sensing and showed that the nighttime-derived fishing effort could be a good index for the distribution of pelagic resources.
As for the specific target of this study, a previous study using CPUE data from typical vessels found that temperature is always the most influencing factor shaping the distribution of fisheries [9]. According to CPUE-based models, the most suitable SST for lit fisheries in the Zhong Sha and Xi Sha Islands is 27–28.5 °C. The most important environmental factor in our models varies across years, and SST shows greater importance during the early stages of fishery development, although our models show a suitable SST range (26–28 °C) similar to the CPUE-based models. A suitable SST for the Zhong Sha and Xi Sha lit fisheries is lower than that of the Nan Sha lit fisheries. The CPUE-based model by Yan et al. [53] indicated a higher suitable SST range of 28.5–29.5 °C, suggesting that a suitable SST may vary between water areas, and latitude may be an influencing factor. This may explain why our models did not find suitable fishing grounds in the Nan Sha Islands.
In our models, instead of SST, depth is the most important factor shaping the distribution of lit fisheries. The major targets of lit fisheries, purpleback flying squids and tunas, mainly inhabit open sea with a water depth of >200 m. Mainly with water depth, our models predict the distribution patterns of lit fisheries well. Experienced skippers often look for suitable fishing grounds, taking into account both water depth and temperature. However, past studies on the prediction of SCS lit fisheries paid less attention to water depth. Our models showed that the main water depth for the Zhong Sha and Xi Sha fishing ground ranges from 1000 to 3000 m, with an optimal range of 1200–1500 m. Our models also indicated that salinity could play a critical role in certain years. The salinity of the SCS surface layer is an indication of monsoon-driven surface circulation. Our results suggested that in addition to a rising SST, the distribution pattern of lit fisheries may also be affected by changes in surface circulation associated with Kuroshio intrusion and climate change.
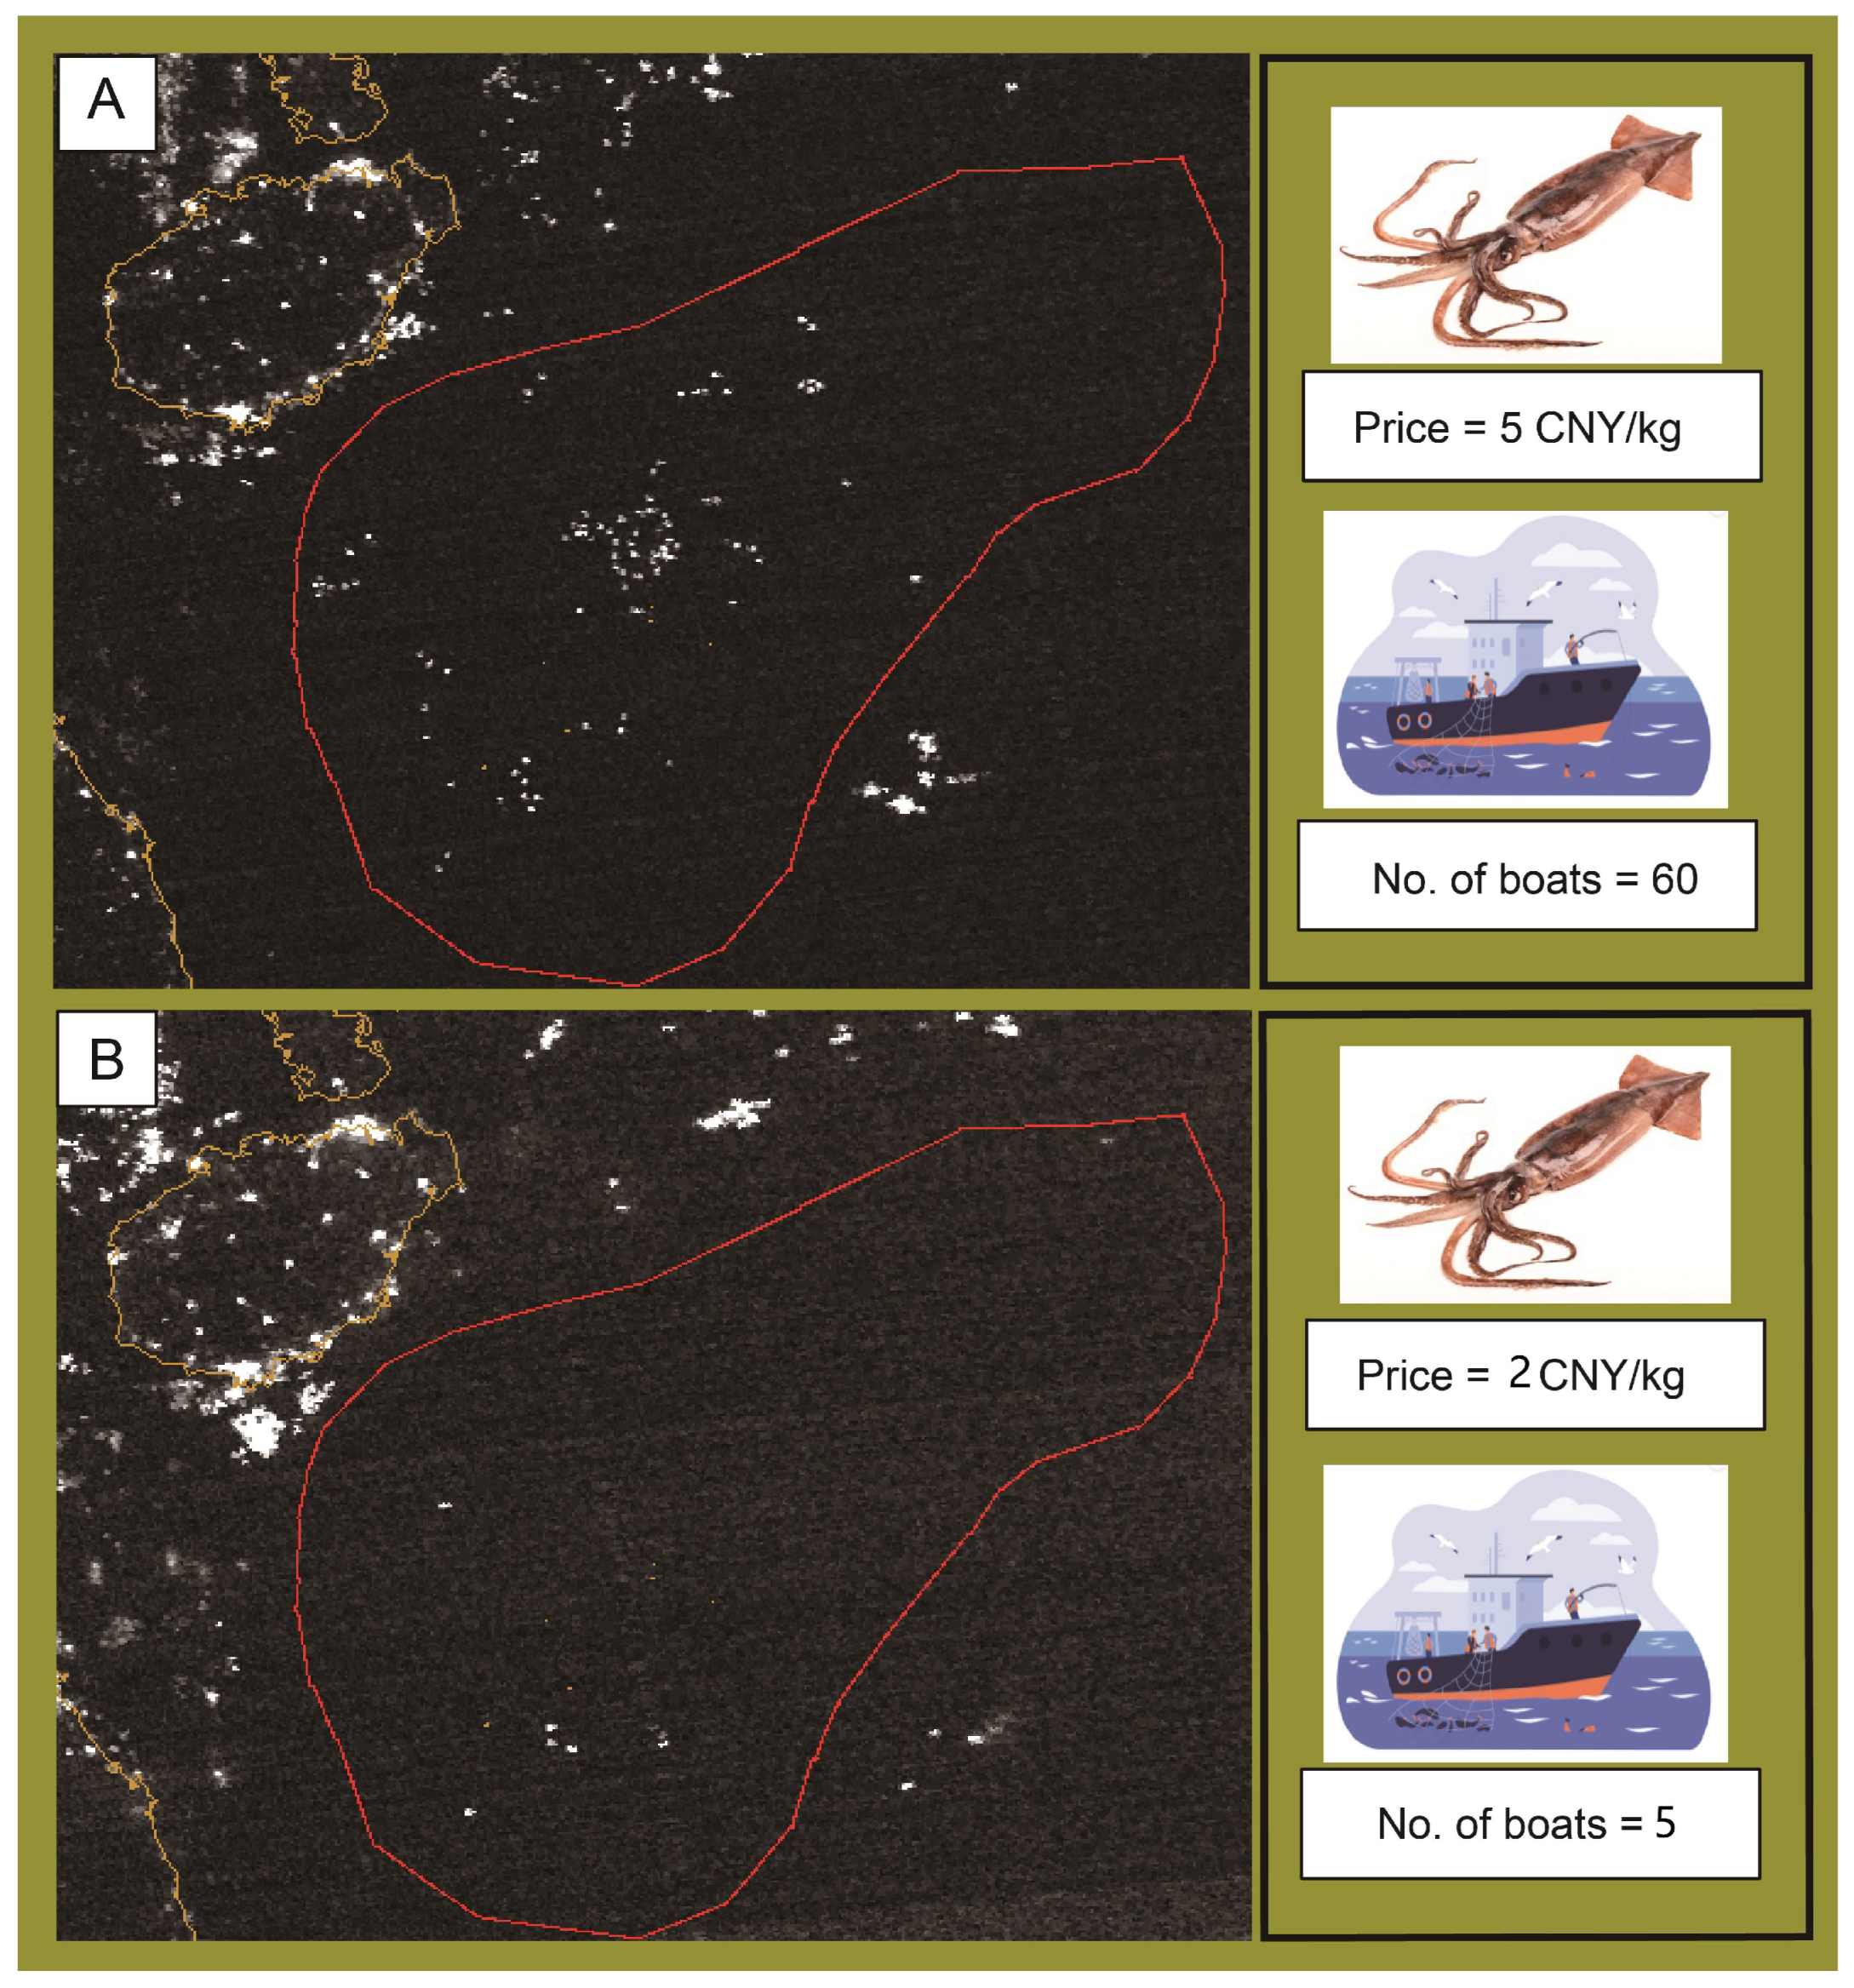
In addition to environmental factors, fish price is also an important social economic factor affecting fishing operations. Except for 2009, from 2005 to 2011, the fish prices of the major targets of lit fisheries remained basically unchanged at 5 CNY/kg. In 2009, however, fish price decreased by ~40% of that of the ordinary years. Due to the low fish price, most fishermen were unwilling to fish in distant waters. In 2009, only six lit fishing boats were detected in the fishing ground (Figure 10), indicating that fish price can also significantly shape the distribution of lit fishing boats.

Figure 10.
Typical nighttime imagery of fishing in the Zhong Sha and Xi Sha fishing ground in the spring season of 2008 (A) and 2009 (B).
5. Conclusions
In this study, we tracked the early development of lit fisheries in one of the major fishing grounds in the open SCS, the Zhong Sha and Xi Sha fishing ground, using fishing positions derived from the nighttime imagery of the DMSP/OLS. Peak detection was used to extract lit fishing positions from imagery with little or no influence of clouds and solar effect. Our results effectively document the development and changes in the fisheries during 2005–2012. Fishing operations in the study area were increasing during 2005–2008, but they almost disappeared in 2009 due to the low fish price. The fishing resumed and peaked in 2010 and 2011, but it started to decline in 2012 because of shifting fishing ground. We also constructed MaxEnt models to explore major environmental factors shaping the distribution of these vessels. Our modeling indicated that depth and SST are major environmental factors shaping the distribution patterns. The optimal water depth ranges from 1000 to 2000 m, and the suitable SST is between 26 and 28 °C. Due to the lack of long-term accurate monitoring data, research on the development of lit fisheries in the open SCS has been impeded. This study is the first to use fishing footprint derived from the nightly imagery to investigate the inception and early development of this lit fisheries. We also synthesized the experiences of local fishermen and existing research to gain insights into the types of fishing gear and species compositions of catches, which would contribute to the understanding of the early development of lit fisheries in the open SCS.
Supplementary Materials
The following supporting information can be downloaded at https://www.mdpi.com/article/10.3390/rs16193678/s1, Figure S1: April composite data from DMSP-OLS images for the Zhong Sha and Xi Sha fishing ground from 2005 to 2012.
Author Contributions
Conceptualization: J.L., Y.Q. and Z.Z.; data curation: J.L., Z.Z., K.Z., J.F. and H.L.; formal analysis: J.L.; funding acquisition: Z.C.; methodology: J.L., Z.Z., K.Z. and J.F.; software: J.L. and X.L.; validation: J.L. and Z.Z.; visualization: J.L. and Z.Z.; writing—original draft: J.L., Y.Q. and Z.Z.; writing—review and editing: Z.C. All authors have read and agreed to the published version of the manuscript.
Funding
This work was supported by the Hainan Provincial Joint Project of Sanya Yazhou Bay Science and Technology City (2021JJLH0092), National Natural Science Foundation of China (32303008), and Central Public-interest Scientific Institution Basal Research Fund, South China Sea Fisheries Research Institute, CAFS (NO. 2024RC07).
Data Availability Statement
The original contributions presented in this study are included in the article; further inquiries can be directed to the corresponding author.
Acknowledgments
The authors would like to thank the anonymous reviewers for their very competent comments and helpful suggestions.
Conflicts of Interest
The authors declare no conflicts of interest.
References
- Cao, L.; Chen, Y.; Dong, S.; Hanson, A.; Huang, B.O.; Leadbitter, D.; Little, D.C.; Pikitch, E.K.; Qiu, Y.; Mitcheson, Y.S.; et al. Opportunity for marine fisheries reform in China. Proc. Natl. Acad. Sci. USA 2017, 114, 435–442. [Google Scholar] [CrossRef] [PubMed]
- Chen, Z.; Xu, S.; Qiu, Y.; Lin, Z.; Jia, X. Modeling the effects of fishery management and marine protected areas on the Beibu Gulf using spatial ecosystem simulation. Fish. Res. 2009, 100, 222–229. [Google Scholar] [CrossRef]
- Zhang, K.; Geng, P.; Li, J.; Xu, Y.; Kalhoro, M.A.; Sun, M.; Shi, D.; Chen, Z. Influences of fisheries management measures on biological characteristics of threadfin bream (Nemipterus virgatus) in the Beibu Gulf, South China Sea. Acta Oceanol. 2022, 41, 24–33. [Google Scholar] [CrossRef]
- Chen, X.; Liu, B.; Chen, Y. A review of the development of Chinese distant-water squid jigging fisheries. Fish. Res. 2008, 89, 211–221. [Google Scholar] [CrossRef]
- Qian, J.; Li, J.; Zhang, K.; Qiu, Y.; Cai, Y.; Wu, Q.; Tian, H.; Ma, S.; Chen, Z. Spatial–temporal distribution of large-size light falling-net fisheries in the South China Sea. Front. Mar. Sci. 2022, 9, 1075855. [Google Scholar] [CrossRef]
- Zhang, J.; Chen, Z.; Chen, G.; Zhang, P.; Qiu, Y.; Yao, Z. Hydroacoustic studies on the commercially important squid Sthenoteuthis oualaniensis in the South China Sea. Fish. Res. 2015, 169, 45–51. [Google Scholar] [CrossRef]
- Zhang, J.; Zhang, K.; Chen, Z.; Dong, J.; Qiu, Y. Hydroacoustic studies on Katsuwonus pelamis and juvenile Thunnus albacares associated with light fish-aggregating devices in the South China Sea. Fish. Res. 2021, 233, 105765. [Google Scholar] [CrossRef]
- Zhang, J.; Qiu, Y.; Chen, Z.; Zhang, P.; Zhang, K.; Fan, J.; Chen, G.; Cai, Y.; Sun, M. Advances in pelagic fishery resources survey and assessment in open South China Sea. S. China Fish. Sci. 2018, 14, 118–127. [Google Scholar]
- Yu, J.; Hu, Q.; Tang, D.; Chen, P. Environmental effects on the spatiotemporal variability of purpleback flying squid in Xisha-Zhongsha waters, South China Sea. Mar. Ecol. Prog. Ser. 2019, 623, 25–37. [Google Scholar] [CrossRef]
- Yan, Y.; Feng, B.; Lu, H. Comparative analysis on fishing capability of two light attracting commercial fishing methods around Zhongsha and Xisha Islands sea areas, the South China Sea. S. China Fish. Sci. 2009, 5, 59–64. [Google Scholar]
- Li, J.; Qiu, Y.; Cai, Y.; Zhang, K.; Zhang, P.; Jing, Z.; Wu, Q.; Ma, S.; Liu, H.; Chen, Z. Trend in fishing activity in the open South China Sea estimated from remote sensing of the lights used at night by fishing vessels. ICES J. Mar. Sci. 2022, 79, 230–241. [Google Scholar] [CrossRef]
- Chen, S.; Zhang, P.; Yan, L.; Li, J.; Yang, B.; Tan, Y. Analysis on catch composition and fishing ground by new-built steel light falling-net fishing in the South China Sea. S. China Fish. Sci. 2015, 11, 125–131. [Google Scholar]
- Zhang, P.; Zeng, X.; Yang, L.; Peng, C.; Zhang, X.; Yang, S.; Tan, Y.; Yang, B.; Yan, L. Analyses on fishing ground and catch composition of large-scale light falling-net fisheries in South China Sea. S. China Fish. Sci. 2013, 9, 74–79. [Google Scholar]
- Yan, Y.; Feng, B.; Lu, H.; Lai, J.; Du, S. Fishery biology of purpleback flying squid Sthenoteuthis oualaniensis in northern sea areas around Nansha Islands in summer. Oceanol. Limnol. Sin. 2012, 43, 1177–1186. [Google Scholar]
- Choi, K.; Lee, C.I.; Hwang, K.; Kim, S.W.; Park, J.H.; Gong, Y. Distribution and migration of Japanese common squid, Todarodes pacificus, in the southwestern part of the East (Japan) Sea. Fish. Res. 2008, 91, 281–290. [Google Scholar] [CrossRef]
- Elvidge, C.D.; Zhizhin, M.; Baugh, K.; Hsu, F.C. Automatic boat identification system for VIIRS low light imaging data. Remote Sens. 2015, 7, 3020–3036. [Google Scholar] [CrossRef]
- Li, J.; Zhang, P.; Cai, Y.; Zhang, K.; Zhang, Q.; Jing, Z.; Wu, Q.; Qiu, Y.; Ma, S.; Chen, Z. Performance of VMS and nightly satellite in monitoring light fishing vessels in the open South China Sea. Fish. Res. 2021, 243, 106100. [Google Scholar] [CrossRef]
- Liu, Y.; Saitoh, S.I.; Hirawake, T.; Igarashi, H.; Ishikawa, Y. Detection of squid and pacific saury fishing vessels around Japan using VIIRS Day/Night Band image. Proc. Asia-Pac. Adv. Netw. 2015, 39, 28–39. [Google Scholar] [CrossRef]
- Elvidge, C.D.; Baugh, K.E.; Zhizhin, M.; Hsu, F.C. Why VIIRS data are superior to DMSP for mapping nighttime lights. Proc. Asia-Pac. Adv. Netw. 2013, 35, 62–69. [Google Scholar] [CrossRef]
- Paulino, C.; Aroni, E.; Xu, H.; Alburqueque, E.; Demarcq, H. Use of nighttime visible images in the study of the spatial and temporal variability of fishing areas of jumbo flying squid (Dosidicus gigas) outside Peruvian EEZ 2004–2015. Fish. Res. 2017, 191, 144–153. [Google Scholar] [CrossRef]
- Waluda, C.M.; Yamashiro, C.; Elvidge, C.D.; Hobson, V.R.; Rodhouse, P.G. Quantifying light-fishing for Dosidicus gigas in the eastern Pacific using satellite remote sensing. Remote Sens. Environ. 2004, 91, 129–133. [Google Scholar] [CrossRef]
- Waluda, C.M.; Rodhouse, P.G. Dosidicus gigas fishing grounds in the Eastern Pacific as revealed by satellite imagery of the light-fishing fleet. PMBC Res. Bull. 2005, 66, 321–328. [Google Scholar]
- Waluda, C.M.; Griffiths, H.J.; Rodhouse, P.G. Remotely sensed spatial dynamics of the Illex argentinus fishery, Southwest Atlantic. Fish. Res. 2008, 91, 196–202. [Google Scholar] [CrossRef]
- Hsu, F.C.; Elvidge, C.D.; Baugh, K.; Zhizhin, M.; Ghosh, T.; Kroodsma, D.; Susanto, A.; Budy, W.; Riyanto, M.; Nurzeha, R.; et al. Cross-matching VIIRS boat detections with vessel monitoring system tracks in Indonesia. Remote Sens. 2019, 11, 995. [Google Scholar] [CrossRef]
- Sarangi, R.K.; Nagendra Jaiganesh, S.N. VIIRS boat detection (VBD) product-based nighttime fishing vessels observation in the Arabian Sea and Bay of Bengal Sub-regions. Geocarto Int. 2022, 37, 3504–3519. [Google Scholar]
- Seto, K.L.; Miller, N.A.; Kroodsma, D.; Hanich, Q.; Miyahara, M.; Saito, R.; Griffiths, S.; Tickler, D.; Meeuwig, J.; Zeller, D.; et al. Fishing through the cracks: The unregulated nature of global squid fisheries. Sci. Adv. 2023, 9, eadd8125. [Google Scholar] [CrossRef]
- Baugh, K.; Elvidge, C.D.; Ghosh, T.; Ziskin, D. Development of a 2009 stable lights product using DMSP-OLS data. Proc. Asia-Pac. Adv. Netw. 2010, 30, 114. [Google Scholar] [CrossRef]
- Guisan, A.; Thuiller, W.; Zimmermann, N.E. Habitat Suitability and Distribution Models: With Applications in R; Cambridge University Press: Cambridge, UK, 2017. [Google Scholar]
- Alabia, I.D.; Dehara, M.; Saitoh, S.I.; Hirawake, T. Seasonal habitat patterns of Japanese common squid (Todarodes pacificus) inferred from satellite-based species distribution models. Remote Sens. 2016, 8, 921. [Google Scholar] [CrossRef]
- Phillips, S.J.; Anderson, R.P.; Schapire, R.E. Maximum entropy modeling of species geographic distributions. Ecol. Model. 2006, 190, 231–259. [Google Scholar] [CrossRef]
- Melo-Merino, S.M.; Reyes-Bonilla, H.; Lira-Noriega, A. Ecological niche models and species distribution models in marine environments: A literature review and spatial analysis of evidence. Ecol. Model. 2020, 415, 108837. [Google Scholar] [CrossRef]
- Kramer-Schadt, S.; Niedballa, J.; Pilgrim, J.D.; Schröder, B.; Lindenborn, J.; Reinfelder, V.; Stillfried, M.; Heckmann, I.; Scharf, A.K.; Augeri, D.M.; et al. The importance of correcting for sampling bias in MaxEnt species distribution models. Divers. Distrib. 2013, 19, 1366–1379. [Google Scholar] [CrossRef]
- Zhang, Z.; Kass, J.M.; Mammola, S.; Koizumi, I.; Li, X.; Tanaka, K.; Ikeda, K.; Suzuki, T.; Yokota, M.; Usio, N. Lineage-level distribution models lead to more realistic climate change predictions for a threatened crayfish. Divers. Distrib. 2021, 27, 684–695. [Google Scholar] [CrossRef]
- Dormann, C.F.; Elith, J.; Bacher, S.; Buchmann, C.; Carl, G.; Carré, G.; García Marquéz, J.R.; Gruber, B.; Lafourcade, B.; Leitão, P.J.; et al. Collinearity: A review of methods to deal with it and a simulation study evaluating their performance. Ecography 2013, 36, 27–46. [Google Scholar] [CrossRef]
- Brun, P.; Thuiller, W.; Chauvier, Y.; Pellissier, L.; Wüest, R.O.; Wang, Z.; Zimmermann, N.E. Model complexity affects species distribution projections under climate change. J. Biogeogr. 2020, 47, 130–142. [Google Scholar] [CrossRef]
- Warren, D.L.; Seifert, S.N. Ecological niche modeling in MaxEnt: The importance of model complexity and the performance of model selection criteria. Ecol. Appl. 2011, 21, 335–342. [Google Scholar] [CrossRef]
- Allouche, O.; Tsoar, A.; Kadmon, R. Assessing the accuracy of species distribution models: Prevalence, kappa, and the true skill statistic (TSS). J. Appl. Ecol. 2006, 43, 1223–1232. [Google Scholar] [CrossRef]
- Hirzel, A.H.; Le Lay, G.; Helfer, V.; Randin, C.; Guisan, A. Evaluating the ability of habitat suitability models to predict species presences. Ecol. Model. 2006, 199, 142–152. [Google Scholar] [CrossRef]
- Engler, R.; Randin, C.F.; Thuiller, W.; Dullinger, S.; Zimmermann, N.E.; Araujo, M.B.; Pearman, P.B.; Albert, C.H.; Choler, P.; Coldea, G.; et al. 21st century climate change threatens mountain flora unequally across Europe. Glob. Chang. Biol. 2011, 17, 2330–2341. [Google Scholar] [CrossRef]
- Zhao, M.; Zhou, Y.; Li, X.; Cao, W.; He, C.; Yu, B.; Li, X.; Elvidge, C.D.; Cheng, W.; Zhou, C. Applications of satellite remote sensing of nighttime light observations: Advances, challenges, and perspectives. Remote Sens. 2019, 11, 1971. [Google Scholar] [CrossRef]
- Huang, Q.; Yang, X.; Gao, B.; Yang, Y.; Zhao, Y. Application of DMSP/OLS nighttime light images: A meta-analysis and a systematic literature review. Remote Sens. 2014, 6, 6844–6866. [Google Scholar] [CrossRef]
- Ruiz, J.; Caballero, I.; Navarro, G. Sensing the same fishing fleet with AIS and VIIRS: A seven-year assessment of squid jiggers in FAO major fishing area 41. Remote Sens. 2019, 12, 32. [Google Scholar] [CrossRef]
- Kiyofuji, H.; Saitoh, S.I. Use of nighttime visible images to detect Japanese common squid Todarodes pacificus fishing areas and potential migration routes in the Sea of Japan. Mar. Ecol. Prog. Ser. 2004, 276, 173–186. [Google Scholar] [CrossRef]
- Nguyen, K.Q.; Winger, P.D. Artificial light in commercial industrialized fishing applications: A review. Rev. Fish. Sci. Aquac. 2019, 27, 106–126. [Google Scholar] [CrossRef]
- Alabia, I.D.; Saitoh, S.I.; Mugo, R.; Igarashi, H.; Ishikawa, Y.; Usui, N.; Kamachi, M.; Awaji, T.; Seito, M. Seasonal potential fishing ground prediction of neon flying squid (Ommastrephes bartramii) in the western and central North Pacific. Fish. Oceanogr. 2015, 24, 190–203. [Google Scholar] [CrossRef]
- Alabia, I.D.; Saitoh, S.I.; Igarashi, H.; Ishikawa, Y.; Usui, N.; Kamachi, M.; Awaji, T.; Seito, M. Future projected impacts of ocean warming to potential squid habitat in western and central North Pacific. ICES J. Mar. Sci. 2016, 73, 1343–1356. [Google Scholar] [CrossRef]
- Yu, W.; Zhang, Y.; Chen, X.; Yi, Q.; Qian, W. Response of winter cohort abundance of Japanese common squid Todarodes pacificus to the ENSO events. Acta Oceanol. Sin. 2018, 37, 61–71. [Google Scholar] [CrossRef]
- Geronimo, R.C.; Franklin, E.C.; Brainard, R.E.; Elvidge, C.D.; Santos, M.D.; Venegas, R.; Mora, C. Mapping fishing activities and suitable fishing grounds using nighttime satellite images and maximum entropy modelling. Remote Sens. 2018, 10, 1604. [Google Scholar] [CrossRef]
- Hua, C.; Li, F.; Zhu, Q.; Zhu, G.; Meng, L. Habitat suitability of Pacific saury (Cololabis saira) based on a yield-density model and weighted analysis. Fish. Res. 2020, 221, 105408. [Google Scholar] [CrossRef]
- Xing, Q.; Yu, H.; Liu, Y.; Li, J.; Tian, Y.; Bakun, A.; Cao, C.; Tian, H.; Li, W. Application of a fish habitat model considering mesoscale oceanographic features in evaluating climatic impact on distribution and abundance of Pacific saury (Cololabis saira). Prog. Oceanogr. 2022, 201, 102743. [Google Scholar] [CrossRef]
- Tian, S.; Chen, X.; Chen, Y.; Xu, L.; Dai, X. Evaluating habitat suitability indices derived from CPUE and fishing effort data for Ommastrephes bartramii in the northwestern Pacific Ocean. Fish. Res. 2009, 95, 181–188. [Google Scholar] [CrossRef]
- Li, J.; Cai, Y.; Zhang, P.; Zhang, Q.; Jing, Z.; Wu, Q.; Qiu, Y.; Ma, S.; Chen, Z. Satellite observation of a newly developed light-fishing “hotspot” in the open South China Sea. Remote Sens. Environ. 2021, 256, 112312. [Google Scholar] [CrossRef]
- Yan, L.; Zhang, P.; Yang, B.; Chen, S.; Li, Y.; Li, Y.; Song, P.; Lin, L. Relationship between the catch of Symplectoteuthis oualaniensis and surface temperature, as well as the vertical temperature structure in the South China Sea. J. Fish. Sci. China 2016, 23, 469–477. [Google Scholar]
Disclaimer/Publisher’s Note: The statements, opinions and data contained in all publications are solely those of the individual author(s) and contributor(s) and not of MDPI and/or the editor(s). MDPI and/or the editor(s) disclaim responsibility for any injury to people or property resulting from any ideas, methods, instructions or products referred to in the content. |
© 2024 by the authors. Licensee MDPI, Basel, Switzerland. This article is an open access article distributed under the terms and conditions of the Creative Commons Attribution (CC BY) license (https://creativecommons.org/licenses/by/4.0/).