Article

Multi-Window Fusion Spatial-Frequency Joint Self-Attention for Remote-Sensing Image Super-Resolution

School of Electronic Engineering, Xidian University, Xi’an 710071, China
*
Author to whom correspondence should be addressed.
Remote Sens. 2024, 16(19), 3695; https://doi.org/10.3390/rs16193695
Submission received: 19 August 2024 / Revised: 21 September 2024 / Accepted: 2 October 2024 / Published: 4 October 2024

Abstract

:
Remote-sensing images typically feature large dimensions and contain repeated texture patterns. To effectively capture finer details and encode comprehensive information, feature-extraction networks with larger receptive fields are essential for remote-sensing image super-resolution tasks. However, mainstream methods based on stacked Transformer modules suffer from limited receptive fields due to fixed window sizes, impairing long-range dependency capture and fine-grained texture reconstruction. In this paper, we propose a spatial-frequency joint attention network based on multi-window fusion (MWSFA). Specifically, our approach introduces a multi-window fusion strategy, which merges windows with similar textures to allow self-attention mechanisms to capture long-range dependencies effectively, therefore expanding the receptive field of the feature extractor. Additionally, we incorporate a frequency-domain self-attention branch in parallel with the original Transformer architecture. This branch leverages the global characteristics of the frequency domain to further extend the receptive field, enabling more comprehensive self-attention calculations across different frequency bands and better utilization of consistent frequency information. Extensive experiments on both synthetic and real remote-sensing datasets demonstrate that our method achieves superior visual reconstruction effects and higher evaluation metrics compared to other super-resolution methods.

1. Introduction

Image super-resolution aims to reconstruct high-resolution images from low-resolution observations, which is a widely studied topic and has been proven to be an effective method to improve spatial resolution [1]. In the field of remote sensing, high-resolution images play an important role in many application scenarios, such as target detection [2], disaster warning [3], and military reconnaissance [4]. The high resolution of Earth observation has become a hot spot in the space technology competition among various countries. Due to the limited accuracy of image acquisition sensors and many degradation factors in the imaging process [5], images collected by remote-sensing satellites often cannot meet the application needs of remote-sensing images in map updating [6], semantic segmentation [7], target detection [8], etc. The degradation process of remote-sensing images can usually be defined as
I L R = I H R k s + n
where I H R represents a high-resolution image, k represents a blur kernel, s represents a degradation model with a scale factor of s , n is a general additive white Gaussian noise. While enhancing the hardware of satellite imaging systems can mitigate some issues, leveraging advanced image super-resolution techniques provides a more cost-effective and versatile solution. Yet, the challenge lies in the ill-posed nature of the super-resolution task, where essential information lost during the degradation process must be accurately inferred. Traditional super-resolution methods [9], often based on strong assumptions about the degradation model and parameter settings, struggle particularly with the complexity of remote-sensing images, which frequently contain detailed and subtle information distributed over large areas.
Researchers have developed various super-resolution methods for remote-sensing images. Techniques such as sparse coding [10,11] decompose images into basic elements that are recombined to form higher-resolution versions. While effective, they often miss global contextual details that are crucial for accurate large-scale image reconstruction. Probabilistic graphical models [12] offer a structured approach by utilizing statistical relationships between pixels, though they primarily capture localized dependencies. SRCNN by Dong et al. [13] represents an early deep-learning approach, using a three-layer convolutional network to upscale and refine images. This method primarily enhances local features but may overlook long-range spatial relationships. DRCN by Kim et al. [14] improves upon this by incorporating recursive learning and skip connections, enhancing the model’s ability to handle details across larger areas, yet it still tends to focus on somewhat confined receptive fields. SRDenseNet by Tong et al. [15] uses densely connected networks to effectively combine low-level and high-level features, therefore improving information flow and aiding in the reconstruction of complex textures over broader areas. SRGAN by Ledig et al. [16] employs perceptual losses to generate visually pleasing high-resolution images, focusing on global consistency and textural details, which are often important for overall image context. DBPN by Haris et al. [17] introduces a feedback mechanism to iteratively refine projections, aiding in correcting both local and global projection errors, which enhances the accuracy across the image. ZSSR by Shocher et al. [18] is an unsupervised method that learns the degradation model from a single image, adapting to specific characteristics and potentially addressing broader image contexts through self-learning. RCAN by Zhang et al. [19] utilizes a channel attention mechanism to emphasize important features across extensive areas, therefore improving the handling of long-range dependencies essential for detailed textural reconstruction. EDSR by Lim et al. [20] simplifies the network structure by removing batch normalization, reducing computational load while maintaining effectiveness in enhancing image details across both local and distant regions. Although CNN-based super-resolution methods have significantly advanced the field, they suffer from limited receptive fields due to their structure and the nature of convolutional operations. This fundamental limitation restricts their ability to utilize information over large spatial extents, which is crucial for handling the vast sizes and complex details typical of remote-sensing images. Consequently, these methods often struggle to effectively capture and reconstruct the global context and interconnected details across extensive geographical areas, making them less suitable for high-fidelity super-resolution tasks in remote-sensing applications where comprehensive and accurate large-scale image reconstruction is essential.
In recent years, the success of the Transformer architecture has demonstrated its efficacy in capturing long-range dependencies and achieving state-of-the-art performance [21]. The TTSR method developed by Yang et al. [22] incorporates a texture loss function that is meticulously designed to focus on the fidelity of original texture patterns, a crucial factor for high-quality image reconstruction. Its end-to-end training framework enables direct optimization towards high-resolution outputs, significantly enhancing the model’s capability to capture and recreate fine details across extensive areas of the image. SwinIR, developed by Liang et al. [23], employs Swin Transformer blocks featuring shifted window partitions. This innovative shifting mechanism allows the model to extend its receptive field beyond the confines of fixed windows, enabling it to capture a broader range of contextual information. This capability is crucial for maintaining detail and consistency across larger expanses of an image without significantly increasing computational demands. Restormer [24] combines self-attention along the channel dimension with a U-Net [25] architecture to process features at multiple scales simultaneously. This multi-scale approach significantly enhances the model’s ability to integrate local and global information. By doing so, Restormer effectively expands its receptive field and improves its capacity to accurately reconstruct complex textures and details. The NGswin model, developed by Choi et al. [26], incorporates the N-Gram context within a sliding window self-attention framework, allowing dynamic adjustment of its focus based on the complexity and variability of specific image regions. This adaptability significantly enhances the model’s ability to extend its receptive field, improving its performance in modeling long-range dependencies and effectively handling diverse textural regions. Developed by Chen et al. [27], the Hybrid Attention Transformer ingeniously combines channel attention with window-based self-attention to optimize both global and local processing capabilities. This integration is further enhanced by an overlapping cross-attention module, which facilitates the flow of information across adjacent windows. These features collectively broaden the model’s receptive field and strengthen its capacity for long-range modeling, making it highly effective in handling complex image super-resolution tasks. Despite these advances, Transformer-based image super-resolution methods face specific challenges, particularly when applied to large images such as those in remote sensing. The primary limitation arises from the conventional design of these methods, which perform self-attention computations within local windows. This approach limits the number of pixels utilized in reconstructing any specific image area, often resulting in a reduced ability to leverage information from pixels outside the immediate window. As a result, these methods lack sufficient cross-window interaction, which is crucial for accurately capturing and reconstructing wide-area dependencies and textures across large images.
As mentioned above, the importance of considering long-range information lies in its ability to capture and reconstruct the global context of a remote-sensing image, which is crucial for restoring details that are interconnected across wide spatial extents. Traditional methods focus on local features and often overlook these broader relationships, leading to reconstructions that might be locally accurate but globally inconsistent. Due to the windowed operations, existing methods’ feature extraction is confined within a single window and is unable to capture long-range pixel dependencies. Compared to natural images, remote-sensing images often have larger dimensions (e.g., an image from the Landsat 8 satellite can have 6000 × 6000 pixels [28]), containing a large number of ground targets that often encompass finer texture details. Therefore, achieving a larger receptive field during the feature-extraction stage is necessary. In this paper, we start with the frequency-domain features of the image, therefore using the global characteristics of the frequency domain to expand the receptive field of the model and perform self-attention calculation fairly for each frequency band to better utilize the same frequency information, achieving deep feature fusion across multiple frequency bands. Additionally, to enhance the scope of self-attention calculation, we merge windows with similar textures, enabling the self-attention calculation to capture long-range information and effectively increase the receptive field of the feature extractor. In summary, the main contributions of this paper can be highlighted as follows:
  • We start from the global characteristics of the frequency domain and explore and design a spatial-frequency joint self-attention mechanism. The spatial and frequency-domain information complement each other, greatly expanding the model’s ability to extract and utilize information. As a result, our model achieves higher pixel-level evaluation metrics and better visual quality in the reconstruction results.
  • By merging and updating highly similar windows, we effectively integrate information from multiple windows, enabling self-attention to capture long-range dependencies. This expands the scope of information utilization during feature extraction, further improving image reconstruction quality.
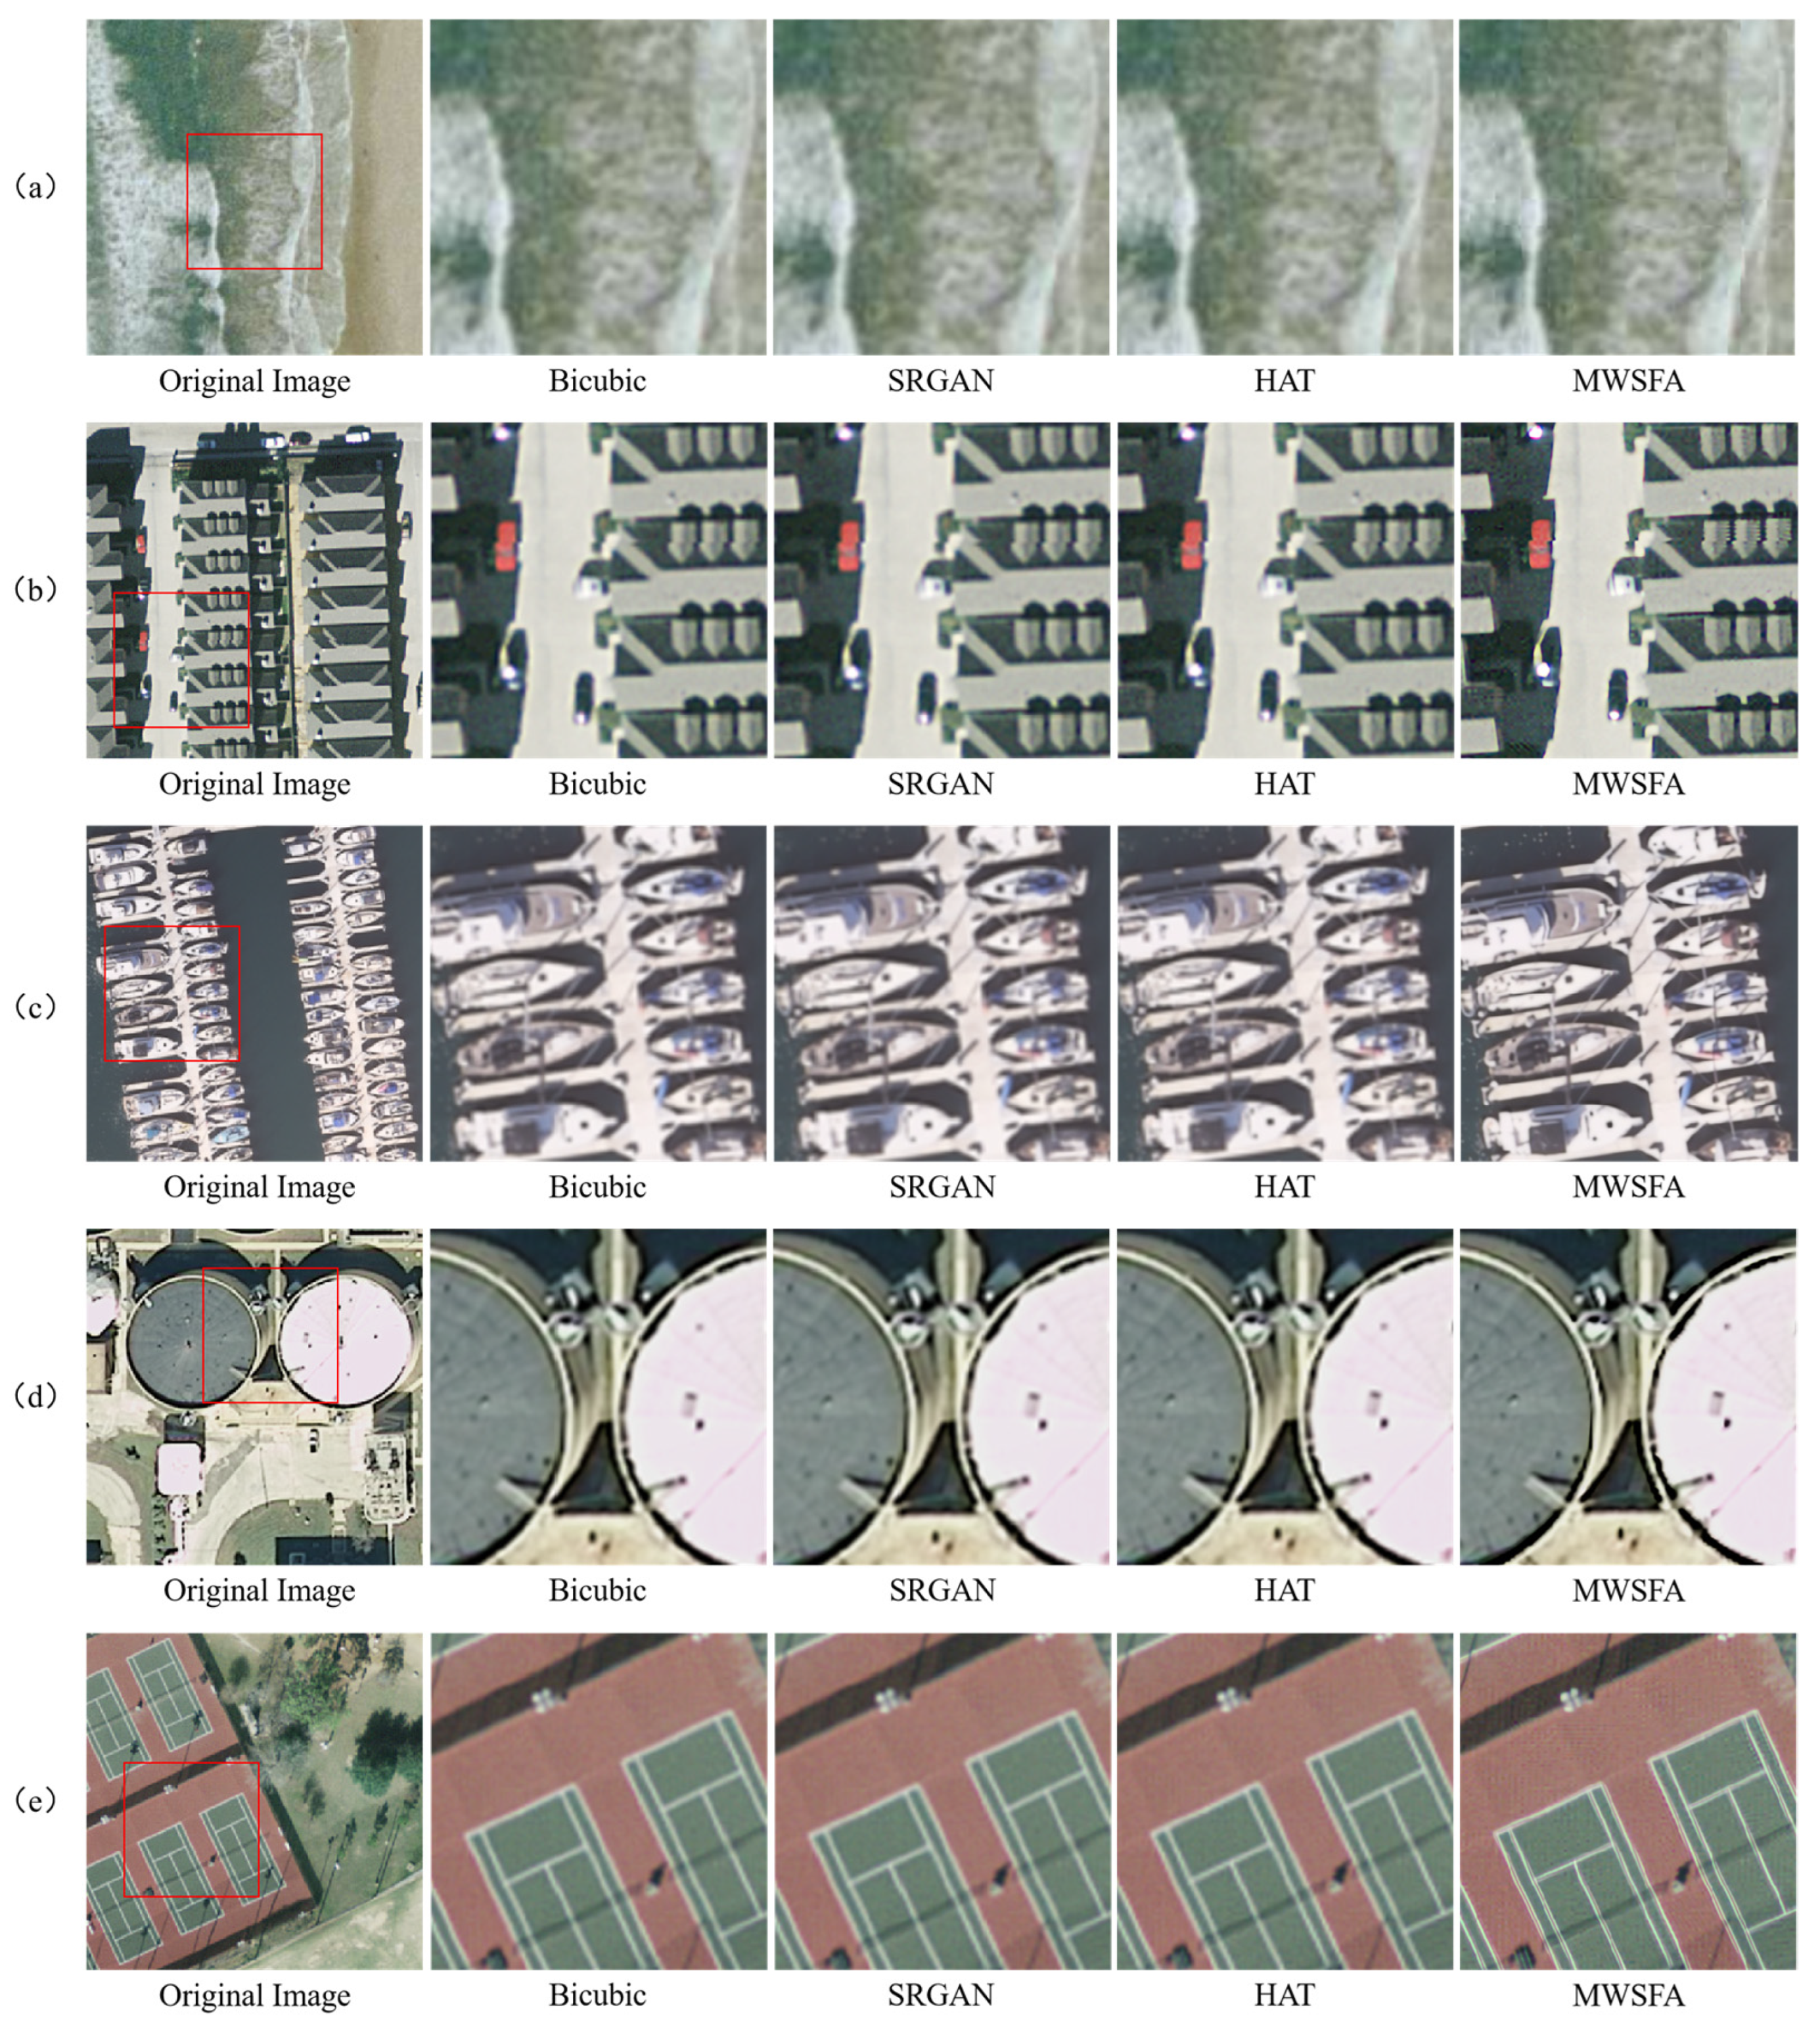
  • We validated our approach through experiments on multiple datasets, demonstrating that our method significantly outperforms other state-of-the-art techniques in both image super-resolution metrics and visual quality.

2. Materials and Methods

2.1. Methods

The remote-sensing image super-resolution task aims to estimate a super-resolution image from a low-resolution remote-sensing image, which is a key challenge in enhancing satellite image observation capabilities. Although the Transformer architecture has been proven to be effective in image super-resolution tasks, it still has shortcomings when applied to large images such as remote-sensing images. The main limitation comes from the window design of the Transformer, which performs self-attention calculations within a local window. This approach limits the number of pixels used to reconstruct any specific image region, often resulting in a reduced ability to utilize pixel information outside the direct window, which is critical for reconstructing accurate and coherent remote-sensing image details. As shown in Figure 1, we use the attribution method LAM [29] designed specifically for SR tasks to analyze the shortcomings of the Transformer and our strategy to improve image super-resolution. The figure intuitively shows the shortcomings of the traditional Transformer architecture when dealing with remote-sensing image super-resolution tasks, namely the window self-attention mechanism focuses mainly on local areas and cannot effectively capture contextual information from surrounding pixels. This localized approach is reflected in the attribution map as a concentration of highlighted pixels, which indicates that the performance of the model relies on the direct pixel neighborhood within the window, therefore ignoring the overall long-range details that are critical for accurately reconstructing the broader scene context. Long-range information is crucial for the super-resolution of remote-sensing images because remote-sensing images often contain complex features such as urban layouts, natural forms, and intricate infrastructure, which can only be accurately presented when the super-resolution process combines information from a wide receptive field. Long-range information covers a wider range of backgrounds and is essential for accurately reconstructing spatial and texture details of large-scale images such as satellite photos.
The spectrum of a remote-sensing image is obtained by performing an FFT (Fast Fourier Transform) on the entire image, considering all pixels, thus making the image spectrum a global feature-extraction method. Based on this, we have designed a frequency-domain self-attention module that operates in parallel with the existing spatial self-attention module, effectively enlarging the receptive field of the feature extractor. Additionally, to enhance the scope of the self-attention computation, we have merged windows with similar textures, enabling the self-attention mechanism to capture information from greater distances, therefore further expanding the feature extractor’s receptive field. Our model incorporates a residual connection architecture throughout its design, ensuring the integrity of information flow and the stability of the network. In this section, we mainly introduce our MWSFA model structure and loss function.
The MWSFA architecture is shown in Figure 2a. It mainly consists of three parts: Shallow Feature Extraction (SFE), Deep Feature-Extraction Network (DFEN), and High-Resolution Reconstruction Network (RN). Specifically, we input low-resolution images into the network and refer to the previous Transformer-based method to use a convolutional layer F s h a l l o w · to initially extract the shallow features of the image f s R H × W × C , expressed as:
f s = F s h a l l o w I L R ,
where C is the number of channels of the intermediate feature. The shallow feature-extraction module can map the input image from the low-dimensional RGB space to the high-dimensional feature space, and the convolutional layer of the head can help learn a better visual representation, therefore enabling optimization. The process is more stable, and then the initially extracted features f s are input into the deep feature-extraction module to obtain the features f d e e p R H × W × C . The formula can be expressed as:
f d = F d e e p f s
where F d e e p ( · ) is the deep feature-extraction module operations, which contains N cascaded spatial-frequency self-attention groups and a convolution. The deep feature-extraction module operations can be decomposed into:
f i = F S F J G f I 1
f d = C o n v f N ,
Among them, f i is the feature extracted from the i -th spatial-frequency self-attention group, F S F J G ( · ) is the operation of the spatial-frequency self-attention group, and C o n v ( · ) is the two-dimensional convolution operation of 3 × 3 . We added a global residual connection to the entire subnetwork. Fusion of shallow features and deep features. Finally, the super-resolution result I S R is obtained through the high-resolution reconstruction subnetwork. This process can be expressed as:
I S R = F R f s + f d ,
F R is the operation of the high-resolution reconstruction subnetwork, and the upsampling layer uses a sub-pixel convolution method.

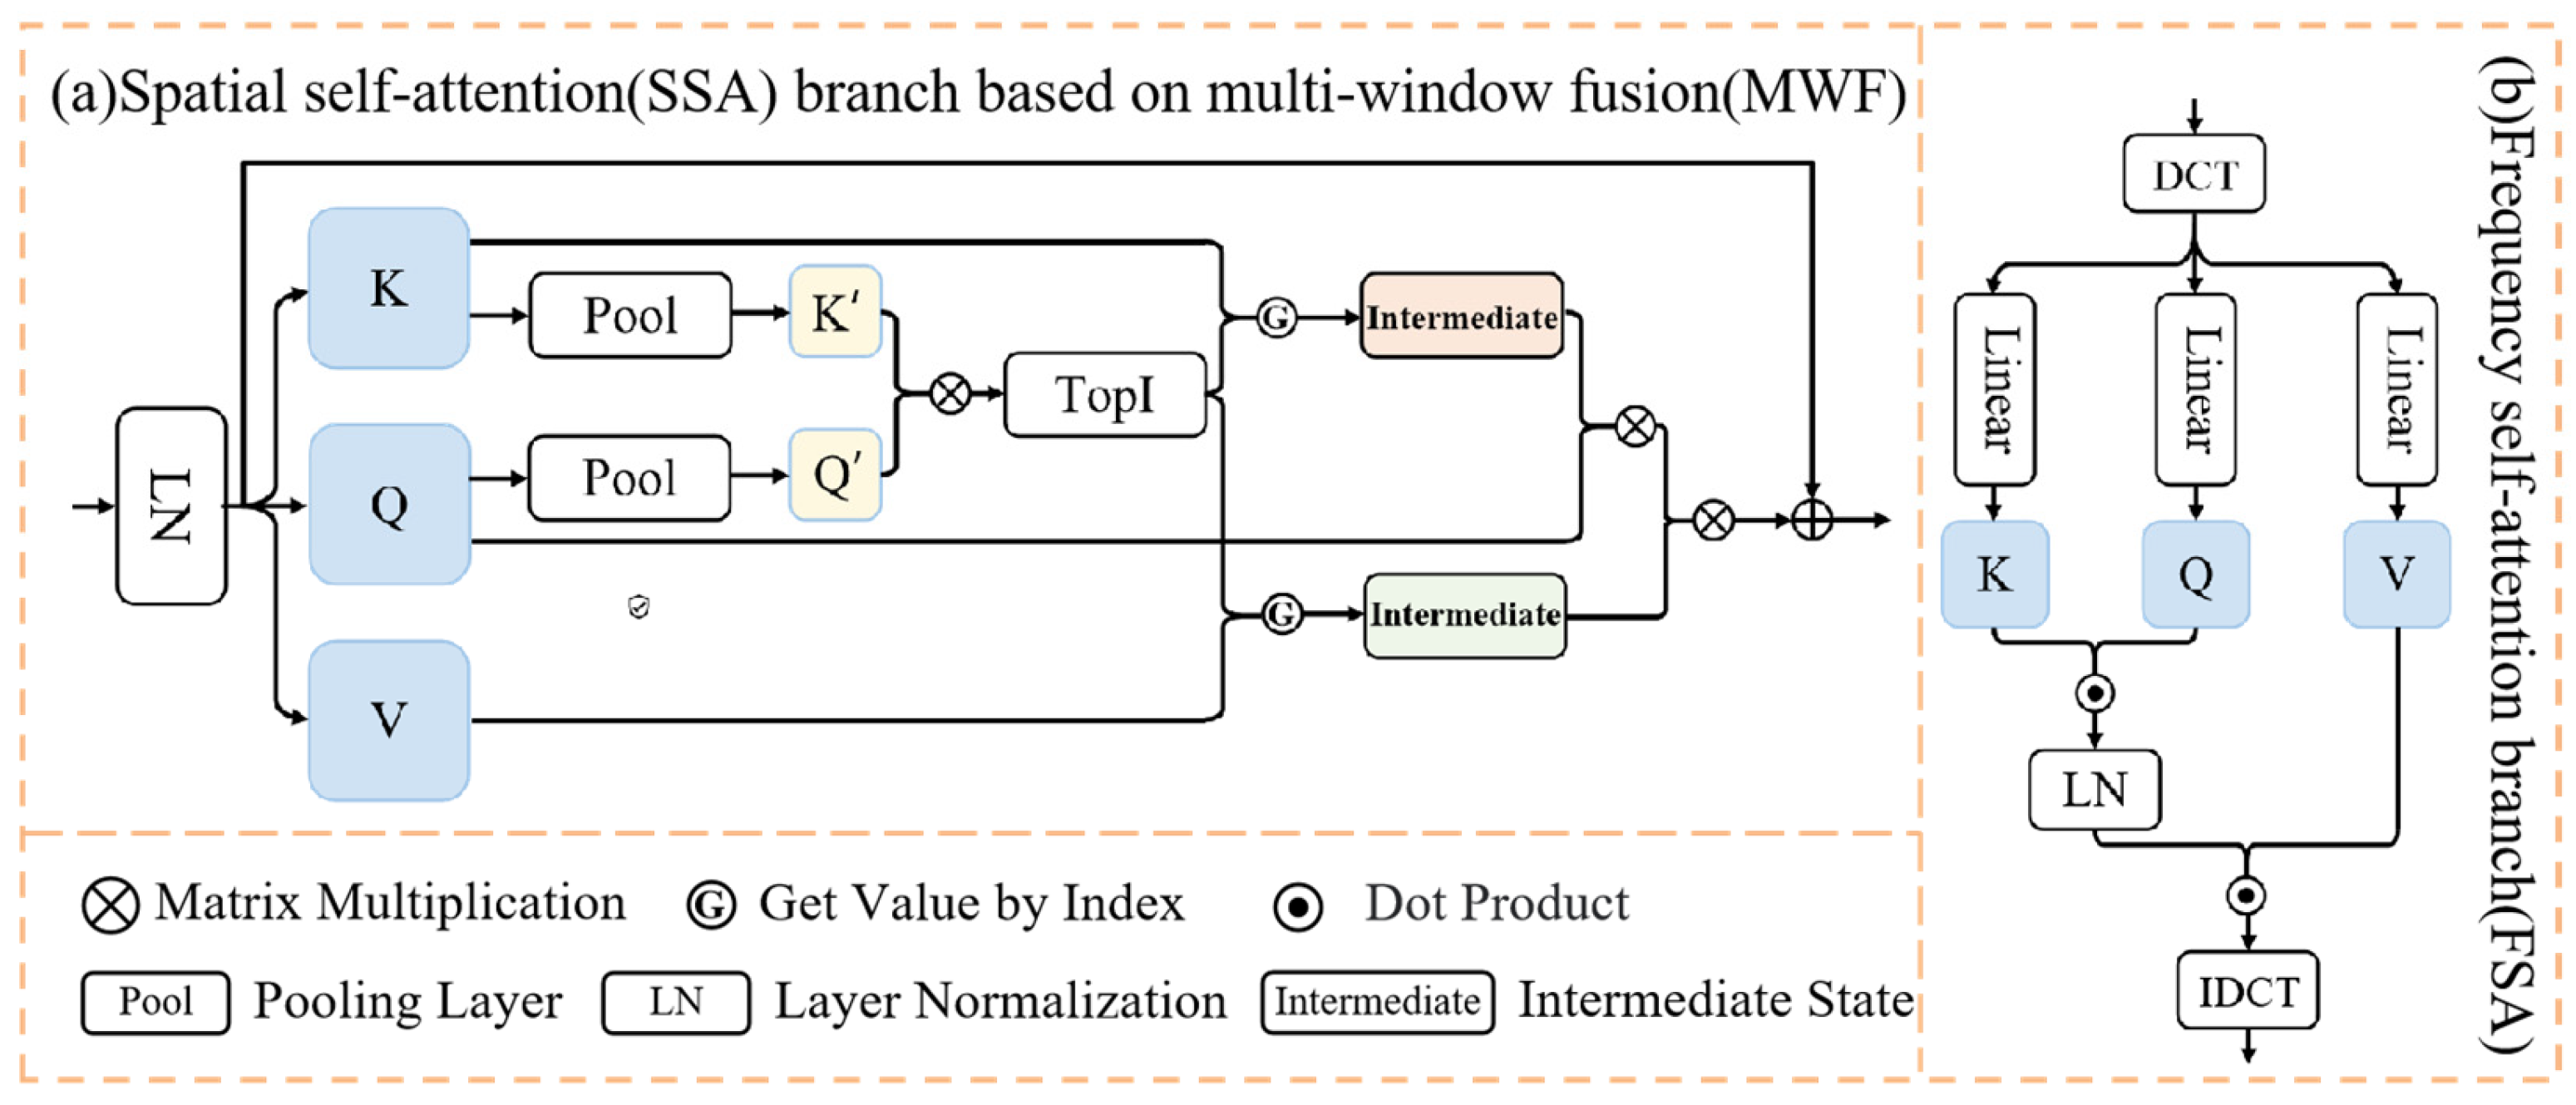
2.1.1. Spatial-Frequency Joint Self-Attention

In order to better extract the deep features of images, we designed a spatial-frequency joint self-attention group (SFJG) in the deep feature-extraction subnetwork, in which each spatial-frequency self-attention group contains M spatial-frequency self-attention blocks (SFJB). The spatial-frequency self-attention block can be expressed as:
f S F J B , j = F S F J B j f S F J B , j 1 , j = 1,2 , , M ,
f o u t = C o n v F M W F f S F J B , j + f i n ,
Among them, f S F J B , j is the feature extracted by the j -th hybrid self-attention block, and F S F J B j is the operation process of the j -th hybrid self-attention block. In order to improve the interactive ability of information flow between local windows in SFJB, we inserted the operation process F M W F of the multi-window fusion module, better aggregates cross-window information. In order to make the training process more stable, we added a residual connection.
The structure diagram of the spatial-frequency joint self-attention block is shown in Figure 2b. The block contains spatial domain branches and frequency-domain branches. After layer normalization, in the spatial branch, feature extraction is performed through the Transformer module of multi-window fusion so that self-attention calculation can extract long-distance information. The frequency-domain branch is transferred to the frequency domain through DCT transformation, and window self-attention calculation is used to extract spectral features. Finally, the two reconstruction results are combined, and the reconstructed high-resolution image is obtained through MLP. The entire calculation process can be expressed as:
f I = F L N f i n ,
f S = F S S A f I ,   f F = F F S A ( f I ) ,
f J = f S + f F + f i n ,
f o u t = M L P F L N f J + f J ,
Among them, f I and f J are intermediate features, F L N ( · ) is the layer normalization operation, F S S A and F F S A are the self-attention operations in the spatial domain and frequency domain, respectively, and M L P ( · ) is a multi-layer perceptron.

2.1.2. The Spatial Self-Attention Branch Based on Multi-Window Fusion

The calculation of the traditional spatial self-attention block first divides the features into local windows of size H M × H M , and divides each local window into sub-blocks of size M × M for local self-attention interaction, i.e., each local window contains H 2 sub-blocks, and then each local window feature obtains query Q , Key K and Value V through mapping transformation and dimension reshaping, and the dimension is N × ( C × M × M ) , N is the training batch size, and finally the scaling dot product self-attention is calculated in each local window to obtain the self-attention map V a t t :
V a t t = s o f t m a x ( Q K T C M 2 ) V ,
Super-resolution methods based on self-attention still have room for further improvement. The main challenge lies in how to expand the network’s processing range of image information to capture long-distance feature dependencies more effectively. Some studies achieve exponential expansion of the window range by constructing sparse windows, but continuous, detailed texture cannot be extracted during self-attention calculation, resulting in the texture of the reconstructed image being destroyed. Other methods expand the receptive field of the model by constructing window combinations of different shapes and sizes. Although the model performance is improved to a certain extent, the size of the receptive field still mainly depends on the size of the window and cannot effectively extract long-distance information.
As shown in Figure 3a, we integrate a window fusion module into the spatial domain feature-extraction branch to overcome the limitations of windows in Vision Transformer, fuse information from multiple different windows in the image, and achieve long-distance information interaction. The fusion module can adaptively reweight the feature maps of the two branches from the spatial and channel dimensions according to different self-attention mechanisms.
First, we propose a window pooling marking scheme in the spatial dimension, using a pooling layer to encapsulate the core information of each sub-window. The effective window labeling mechanism enables the establishment of attention relationships between windows at a relatively low cost. The window labeling is used to calculate the attention relationship between windows and generate the attention weight matrix after the layer normalization layer and the GELU activation function, select windows with similar textures at a coarse-grained level through the attention weight matrix, and combine these texture-similar windows with the original windows into new windows as key-value vectors and value vectors in self-attention calculations to participate in the final self-attention calculation. The attention calculation process can be expressed as:
Q = x r W q , K = x r W k , V = x r W v ,
Q p = P o o l Q , K p = P o o l ( K ) ,
Among them, x r is the input feature, W q , W k , W v are the projection weights of the query vector, key-value vector, and value vector, respectively, Q , K , V are the calculated query vector, key-value vector, and value vector, Q p and K p are Q , K Computational results of performing pooling operations on the window. Then perform dot product multiplication calculation on Q p , K p to obtain the adjacency matrix of similarity between windows. The calculation process is as follows:
A r = Q p ( K p ) T
In the calculated adjacency matrix A r , the size of each row value measures the similarity between the current window and other windows to select k most similar texture windows for merging and aggregating information.
I r = T o p I ( A r , k )
K g = G a t h e r ( K , I r )
V g = G a t h e r ( V , I r )
Among them, T o p I ( A r , k ) means selecting the index values of k windows with the highest similarity from A r , G a t h e r ( K , I r ) means merging the key-value vectors and value vectors of other windows with the current window according to the index values in I r , and calculating the output feature map f w o , the process is expressed as:
f w o = S o f t m a x ( Q K g T d k ) V g T
where S o f t m a x ( · ) is the activation function, and d k is the normalization parameter.
At the same time, the features are divided into multiple heads along the channel dimension within the window, and the attention of each head is calculated separately. Given an input f i , linear projection is used to generate query vectors, key vectors, and value vectors, reshape them into R h × c , and calculate multi-head attention:
[ Q c , K c , V c ] = R e s h a p e 1 ( F L N ( f i ) )
f c o = R e s h a p e 2 ( S o f t m a x ( Q c K c T d k ) V c )
Among them, R e s h a p e 1 ( · ) converts the image from R h × w × c to R h w × c , and R e s h a p e 2 ( · ) converts the image from R h w × c to R h × w × c .
Finally, the information from the window fusion module and the channel self-attention module is coupled through the adaptive aggregation module and the two branch features f c o and f w o are adaptively weighted and aggregated from the channel dimension:
f o = f w o C A f c o + C A ( f c o )
Among them, represents matrix multiplication, and C A ( f c o ) represents the extraction of channel attention weights from input f c o .

2.1.3. The Frequency-Domain Branch of the Spatial-Frequency Self-Attention Module

Discrete Fourier Transform (DFT) is an effective method for time-frequency analysis. Since image super-resolution in the frequency domain is a problem of restoring the frequency components of the image, many researchers have explored the problem of frequency-domain space and carried out modeling. Frequency-domain transformation has been widely used in deep-learning architectures. As shown in Figure 3b, we convert images from the spatial domain to the frequency domain using the widely used method of discrete cosine transform, which projects an image into a set of cosine components of different two-dimensional frequencies. The calculation process of frequency-domain image F { x } u , v is:
F { x } u , v = c u c v 1 H W h = 0 H 1 w = 0 W 1 x h , w cos 2 h + 1 u π 2 H cos [ ( 2 w + 1 ) v π 2 W ]
Among them, h and w are the two-dimensional indexes of the image, u and v are the two-dimensional indicators of frequency, the value ranges are [ 0 , H 1 ] and [ 0 , W 1 ] , respectively, and c ( · ) represents the standardized scale factor to enhance orthogonality.
According to the convolution theorem, the correlation between two signals in the spatial domain is equivalent to their dot product in the frequency domain. Therefore, the feature f F extraction process of frequency-domain self-attention is:
Q f , K f , V f = C o n v ( D F T ( f i n ) )
f F = L ( D F T 1 ( V a t t ) )
where D F T ( · ) is the DCT transform, D F T 1 ( · ) is the inverse DCT transform, and L ( · ) is the linear mapping layer.

2.1.4. Loss Function

Here, we construct a total loss function consisting of pixel loss, frequency-domain loss, and perceptual loss to jointly optimize the super-resolution network and generate realistic high-resolution remote-sensing image results. We define:
L = L 1 + L f + γ L p e r c e p t u a l
Among them, L 1 is the pixel-level loss, L f is the spectrum loss, L p e r c e p t u a l is the perceptual loss, and γ is the adjustable coefficient to balance different sub-loss terms. For pixel loss, we optimize the network by minimizing the L 1 loss function:
L 1 = 1 N i = 1 N y i n G T i 1
which · 1 refers to the L 1 paradigm. N represents the number of training images, y i n represents the enhanced image obtained by the i -th image in the n -th stage and G T i represents the i -th ideal enhanced image. In order to reconstruct high-frequency information more accurately, we draw on the idea of [30] and additionally introduce a supervised loss function in the frequency domain, i.e., based on Fast Fourier Transform (FFT) [31]. The supervised loss function can be defined as the mean square loss between the FFT transformations of the two images:
L F F T = 1 N i = 1 N F F T ( y i n ) F F T ( G T i ) 2
where F F T ( · ) represents the Fast Fourier Transform. For perceptual loss, we choose a pre-trained 19-layer VGG [32] network to measure the distance between features extracted by the 11th-layer convolution:
L p e r c e p t u a l ( I S R , I H R , , l ) = l ( I S R I H R )
where l is the 19th layer of the pre-trained 19-layer VGG network .

2.2. Dataset and Implementation Details
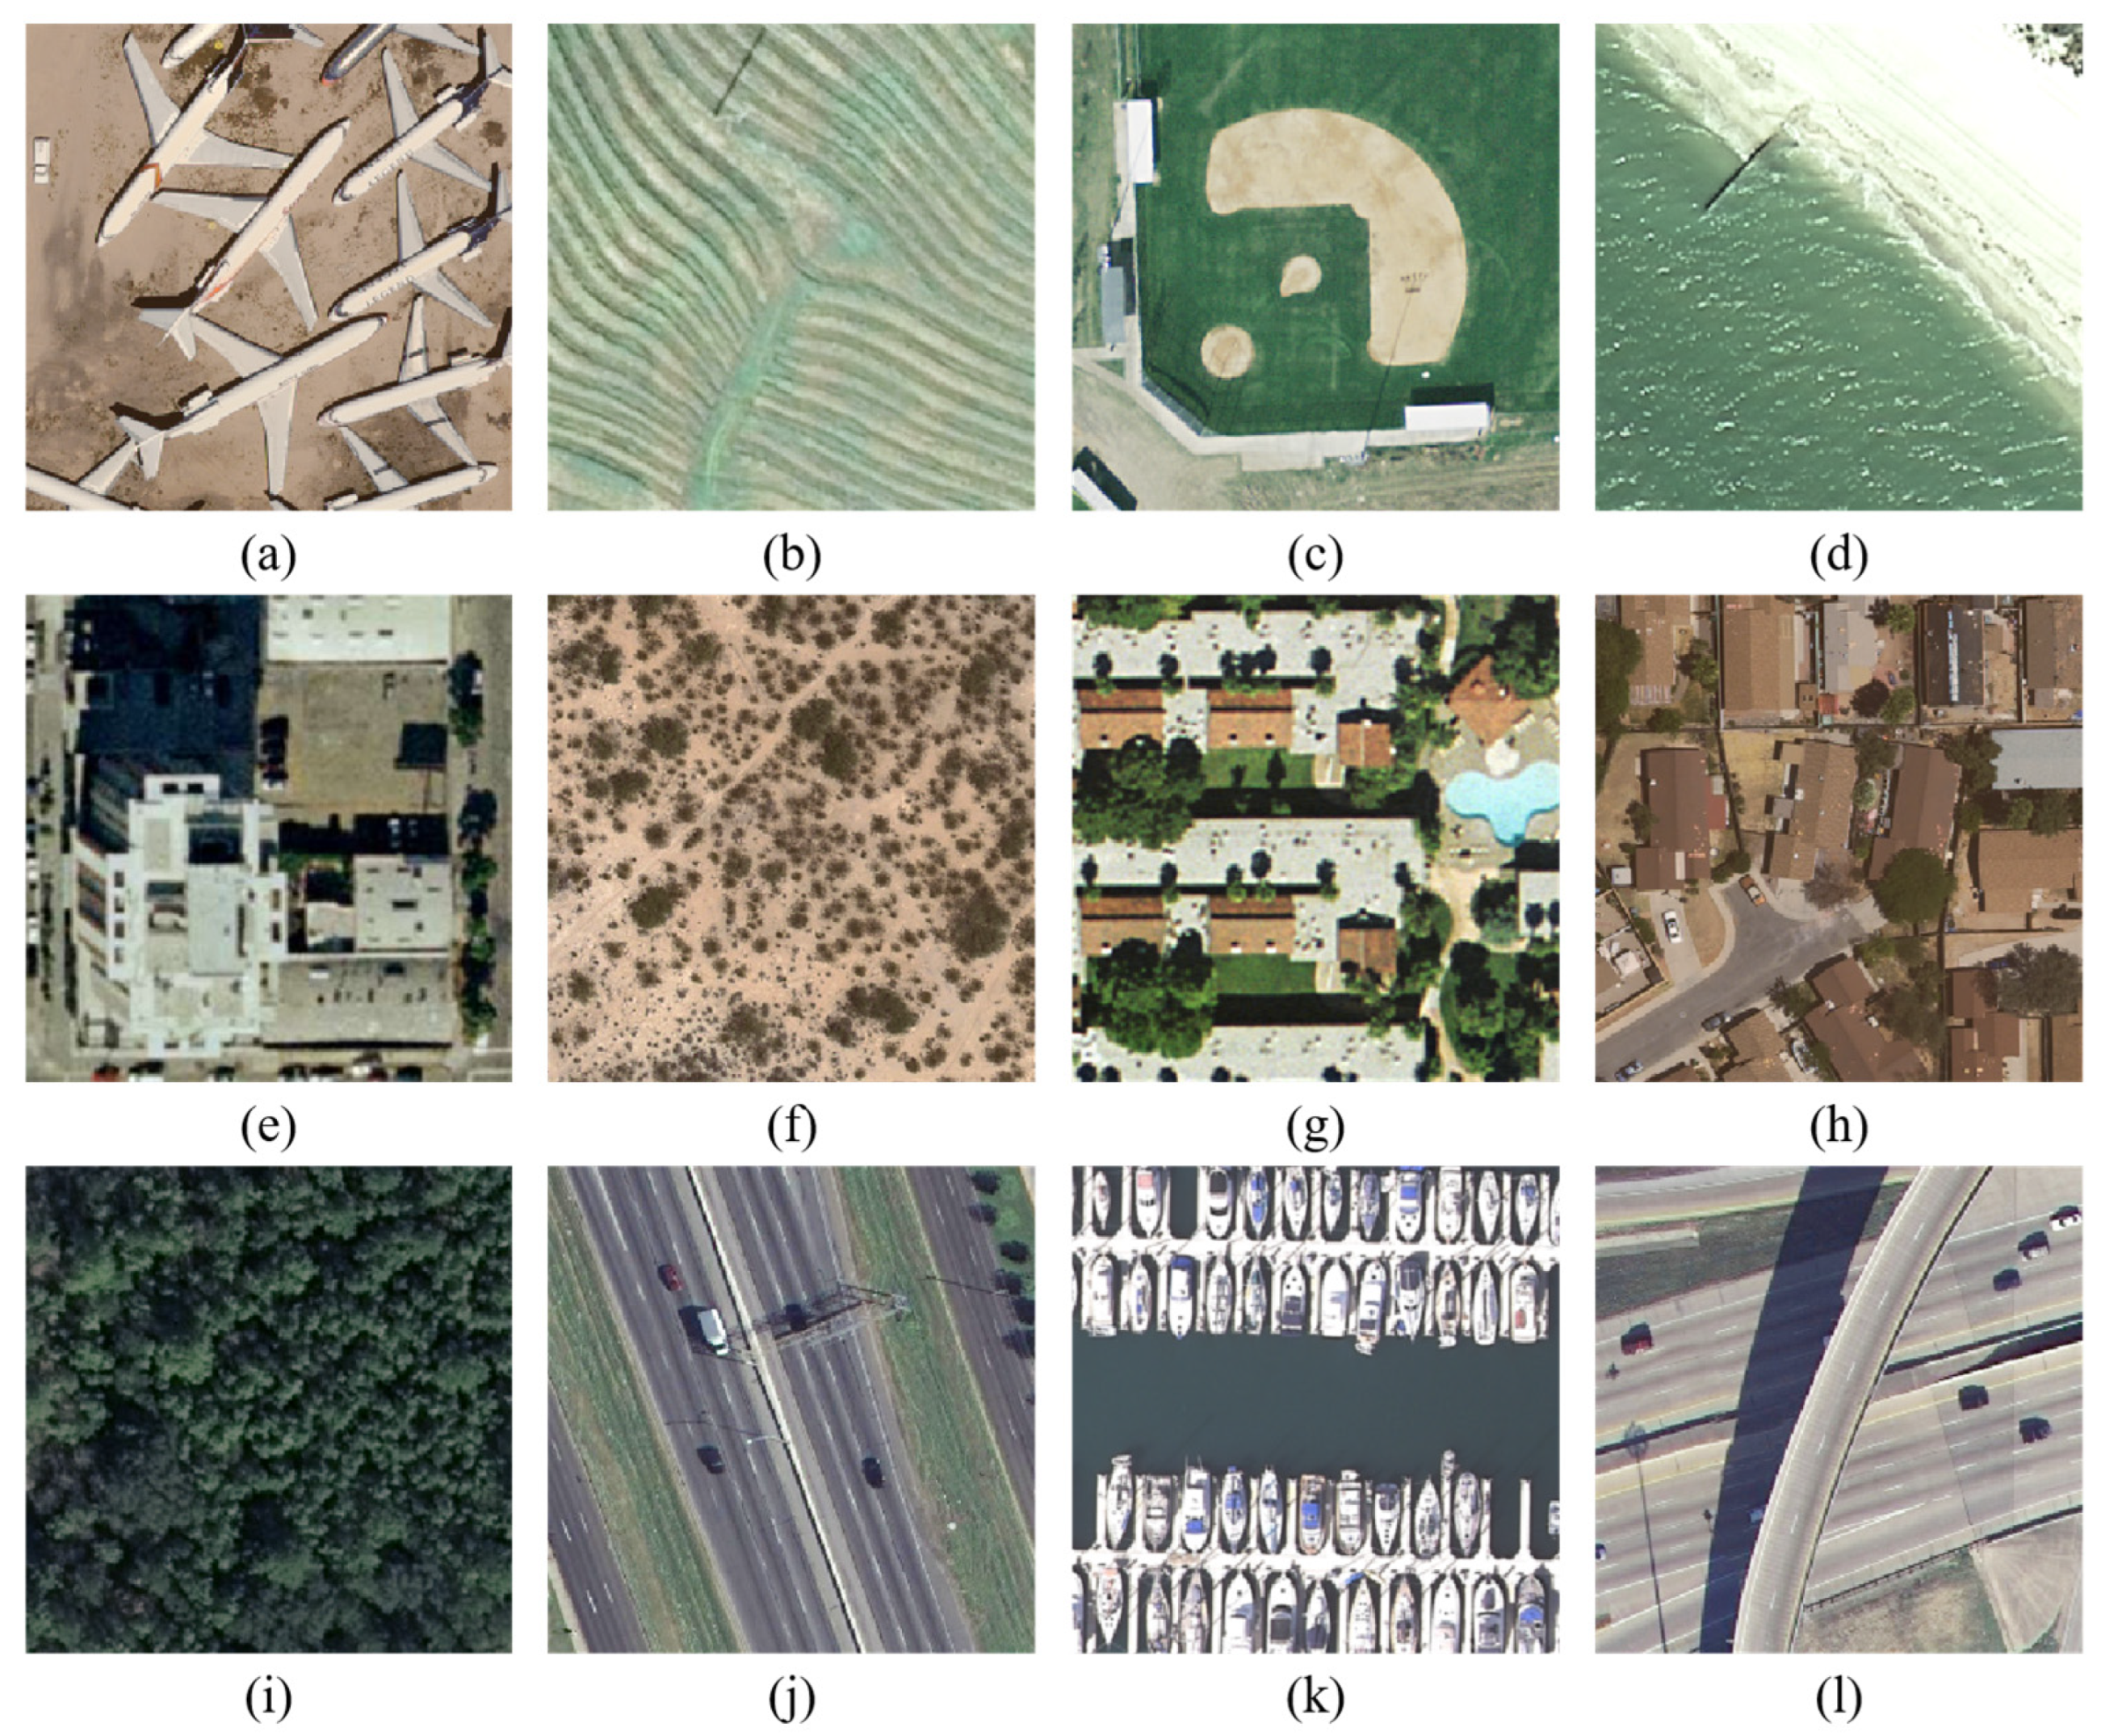
2.2.1. Dataset

Our training is conducted on four datasets, including scene classification RSCNN7, AID dataset, change detection SECOND dataset, and target detection dataset DOTA. We cropped and filtered all images, deleted some dirty data, and finally obtained 10,815 high-resolution remote-sensing images. Figure 4 shows the data from some HR images of the dataset. For a fair comparison, we retrain all methods using the above-processed training dataset and test on the land use UC Merced dataset. Our work focuses on the four magnifications of super-resolution tasks ×2, ×3, ×4, ×8.

2.2.2. Implementation Details and Metrics

As mentioned in Section 3, in our deep feature-extraction structure, we have 8 SFJGs, and within each SFJG, we stack 16 SFJBs. During training, the high-resolution images are of size 216 × 216 , and the low-resolution images are obtained through bicubic interpolation downsampling. All experiments were conducted using the PyTorch framework on eight NVIDIA-4090 GPUs. Guo et al.’s experiments demonstrated that the network performs best when the residual coefficient α is set to 0.2 [33]; therefore, the residual coefficient α of our model is set to 0.2. Liang et al.’s experiments showed that setting the EMA weight parameter β to 0.999 effectively improves the stability of model training [34]; hence, our EMA weight parameter β is set to 0.999. The number of training iterations is set to 5 × 10 5 . The initial learning rate is set to 1 × 10 4 , and the learning rate is halved every 20,000 iterations. The Adam optimizer [35] is configured with β 1 = 0.9 and β 2 = 0.99 .
To evaluate the performance of super-resolution, we calculate the PSNR and SSIM objective metrics on the Y channel of the YCbCr color space. Additionally, we use the full-reference metric LPIPS (Learned Perceptual Image Patch Similarity) to assess the perceptual quality of the reconstruction results. In accordance with super-resolution conventions, only the luminance channel is selected for full-reference image quality evaluation, as human vision is more sensitive to image intensity than chrominance.

3. Results

In this section, to evaluate the performance of our method, we describe our experimental results in detail. We compared the proposed method with other remote-sensing image super-resolution algorithms on three common image quality evaluation metrics mentioned in the previous section.

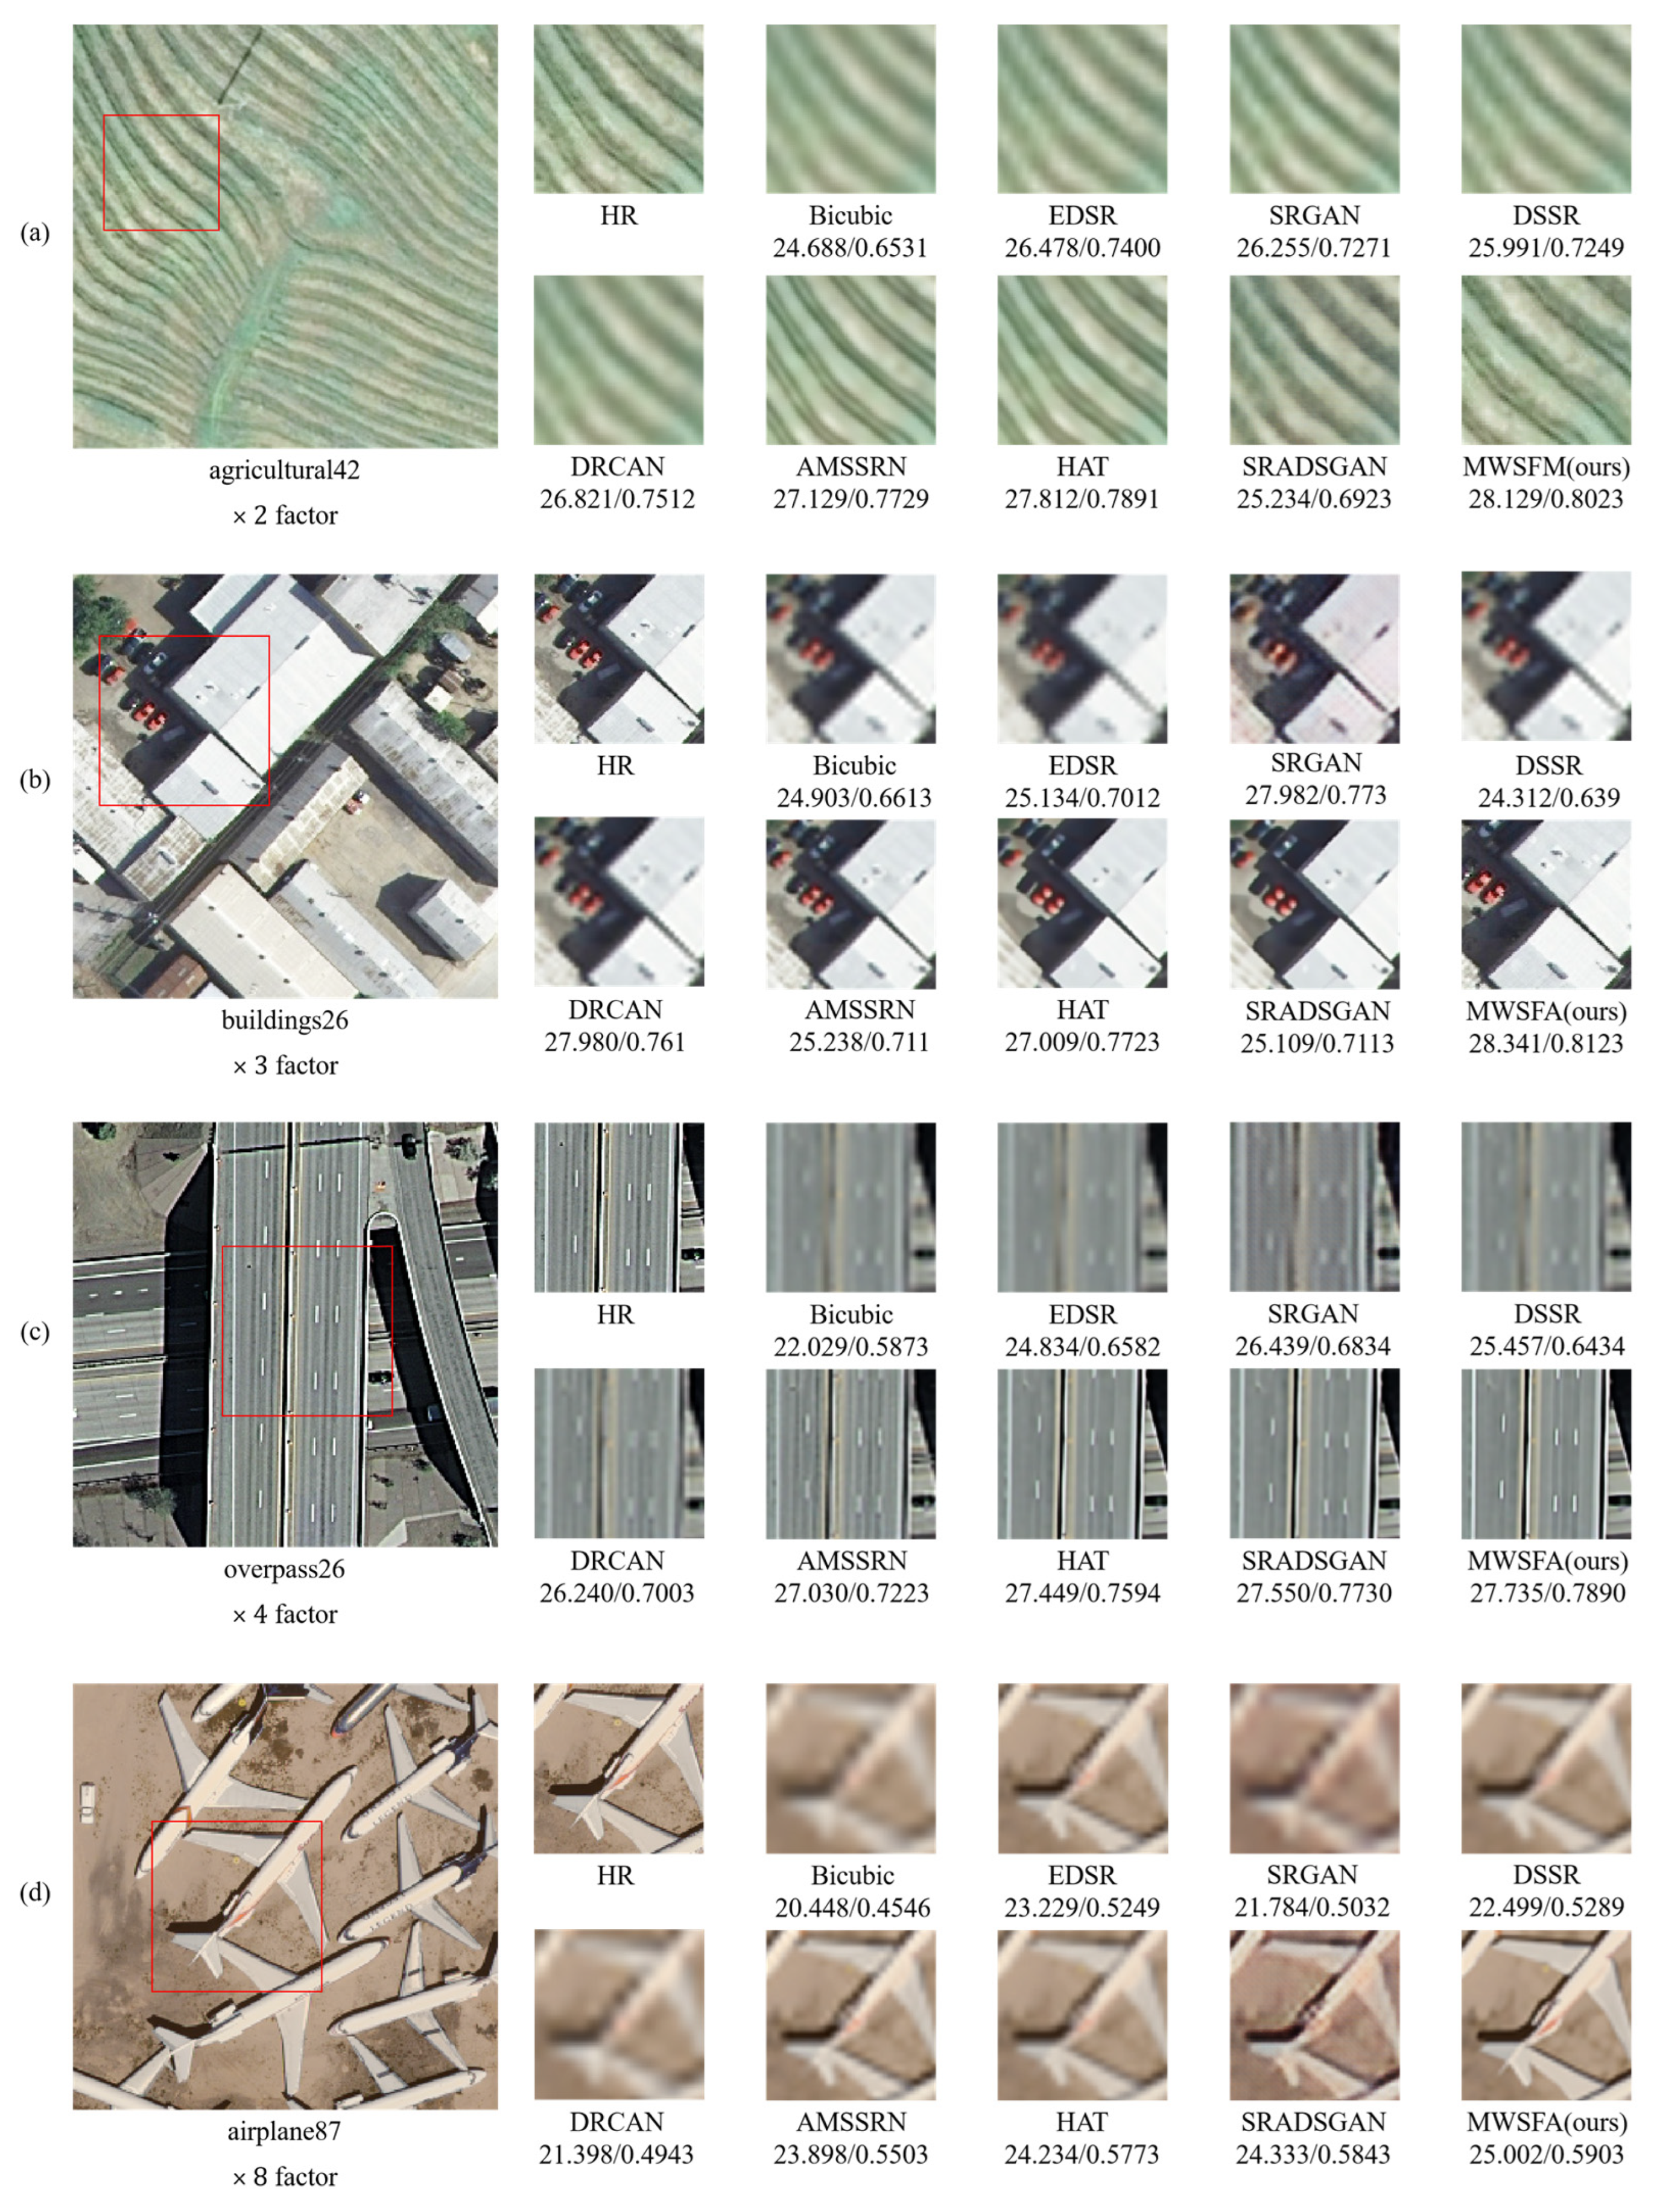
3.1. Comparisons with State-of-the-Art Methods
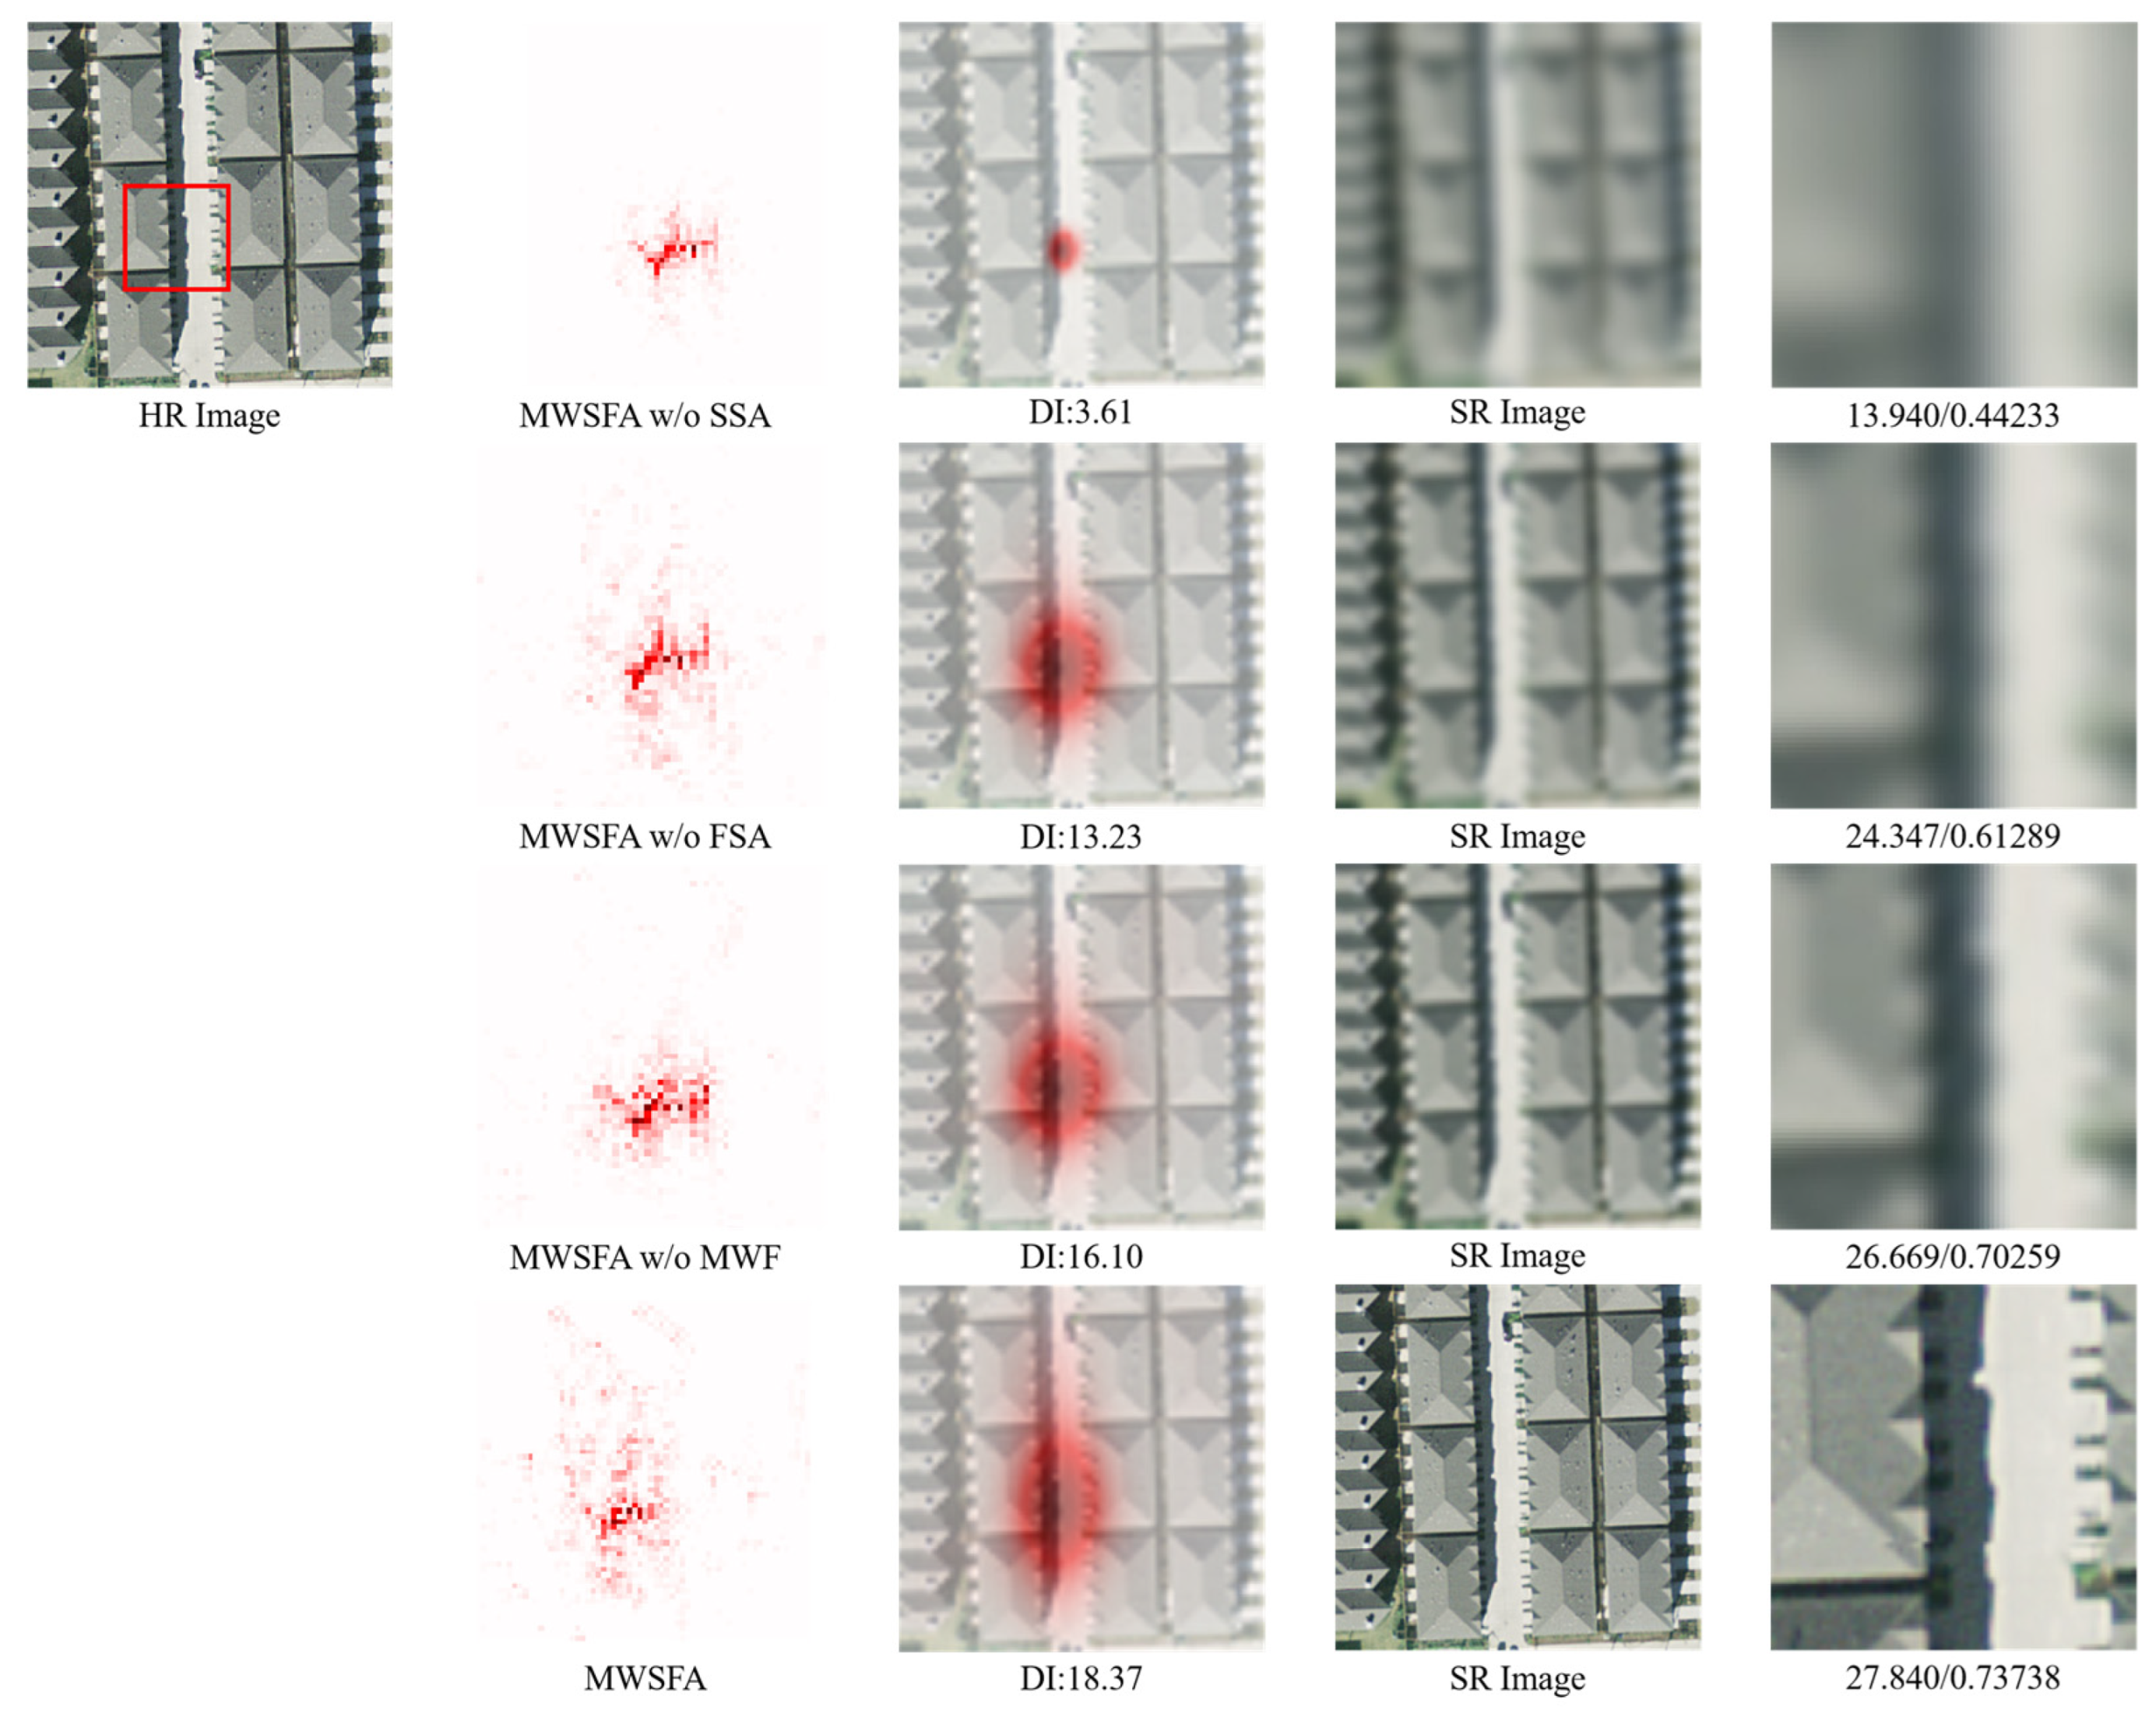
For a comprehensive comparison, we compare our method with bicubic and eight other SOTA super-resolution methods, including EDSR [20], SRGAN [16], DRCAN [36], DSSR [37], AMSSRN [38], HAT [27], and SRADSGAN [39]. Among them, SRAGAN is an excellent model published in IEEE TRANSACTIONS ON GEOSCIENCE AND REMOTE SENSING (TGRS) (2021); HAT are the latest Transformer-based approaches published at the IEEE Conference on Computer Vision and Pattern Recognition (CVPR) in 2023. These methods are trained on the RSCNN7, AID, SECOND, and DOTA datasets and tested and evaluated on the UC Merced test set with ×2 ×3 ×4 ×8 multiples. The bicubic method is used for downsampling. Bicubic degradation is the most widely used assumption in paired SR tasks, although it cannot effectively fit the original remote-sensing image degradation model.
Table 1 displays the results of our MWSFA method alongside seven comparison models on the UC Merced dataset for ×2 ×3 ×4 and ×8 scale super-resolution tasks. MWSFA surpasses all comparison models in terms of PSNR and SSIM across ×2 ×3 ×4 and ×8 scales, demonstrating superior performance even over the best CNN-based model, DSSR, in the LPIPS metrics. MWSFA achieves the best results in most cases, except at the ×3 scale factor for the LPIPS index, which is known to reflect human visual perception more closely by measuring image similarity. The importance of using the LPIPS metric stems from its ability to evaluate perceptual quality, unlike PSNR and SSIM, which focus primarily on pixel differences and the three indicators of brightness, contrast, and structure, respectively. These traditional metrics do not effectively characterize perceptual quality, leading to potential ambiguities in results, as highlighted in Wang et al.’s experiments [40]. In light of this, our inclusion of the LPIPS metric provides a more accurate assessment of how well each method reconstructs images in a way that aligns with human vision. Moreover, we also detail the number of parameters (Params) and the number of FLOPs for each model. The Params and FLOPs of MWSFA are comparable to those of HAT and are lower than those of EDSR. Despite similar or lower computational costs, MWSFA achieves better performance across all considered metrics, highlighting its efficiency advantages. This combination of high performance and efficiency underscores the effectiveness of MWSFA in handling super-resolution tasks across various magnification scales, particularly in settings where perceptual quality and computational efficiency are critical.
Figure 5 presents a visual comparison of super-resolution results from various methods. From Figure 5a, it is evident that MWSFA achieved the best PSNR and SSIM metrics, with reconstruction results that are closest to the original high-resolution image. Figure 5b displays the results of triple magnification super-resolution on the “buildings26” image, where DSSR and DRCAN produce somewhat blurry outcomes, and HAT yields a very smooth appearance but with a significant loss of spatial details. AMSSRN and SRADSGAN seem to reconstruct clearer details and textures, yet our proposed MWSFA still outperforms them in terms of overall effectiveness. Figure 5c shows the results of quadruple magnification super-resolution on the “overpass26” image. The SRGAN method results in the poorest reconstruction, with notable color deviations. The HAT method maintains its characteristic smoothness, resulting in a loss of textures on the road surface. Figure 5d showcases the reconstruction outcomes of nine methods at an eight-fold magnification. Due to the low quality of LR images, most models struggle to generate more detailed textures or, as with SRADSGAN, produce incorrect textures. In contrast, MWSFA reconstructs better edges and textures, achieving the highest PSNR and SSIM metrics. This is attributed to our method’s space-frequency joint self-attention mechanism, which captures long-range spatial dependencies across the entire image, ensuring higher clarity and coherence in the reconstructed textures.

3.2. Model Analysis

In Section 2, we design and complete the final feature-extraction module, including the spatial self-attention extraction part based on multi-window fusion and the frequency-domain self-attention extraction part. In this section, through the training of the ablation model, the ablation study is designed, and the effectiveness of the three parts of multi-window fusion, spatial self-attention, and frequency-domain self-attention is analyzed.
To verify the impact of multi-window fusion, spatial self-attention, and frequency-domain self-attention in expanding the receptive field during feature extraction, we employed the LAM attribution analysis method. This approach allowed us to analyze the pixel contribution in reconstructing specific areas of the image by comparing the original method with versions where each of these three modules was removed.
As shown in Figure 6, we can see that the pixel range used in the three model attribution analysis diagrams after removing the three modules is smaller than the original method. Therefore, our spatial-frequency joint self-attention method based on multi-window fusion is reasonable because it can maximize the receptive field of the feature extractor. In order to verify the necessity of using spatial-frequency joint self-attention based on multi-window fusion in remote-sensing image super-resolution tasks, we removed spatial domain self-attention (SSA), frequency-domain self-attention (FSA), and multi-window fusion strategy (MWF) from the MWSFA. As shown in Figure 6 and Table 2, the ablation experimental results show that the spatial-frequency joint self-attention method based on multi-window fusion plays a crucial role in remote-sensing image feature extraction.

3.2.1. The Effect of Spatial Domain Branching

As mentioned in the introduction, spatial domain self-attention is frequently employed in the field of remote-sensing image super-resolution to capture correlations and contextual information between different regions of an image. By introducing a spatial self-attention mechanism during feature extraction, the model can more flexibly adjust its focus on features at different locations, therefore more accurately restoring details and textures. Removing spatial domain self-attention results in the extracted features lacking spatial relative positional information, reducing the model’s ability to capture local features and subsequently affecting the reconstruction of image textures and details. This indicates that spatial domain self-attention is crucial for maintaining the clarity and detail integrity of high-resolution images. As shown in Figure 6, the LAM attribution analysis results for the model without the spatial domain self-attention branch show that the pixel utilization area is dispersed across the entire image, with less local feature utilization. This explains why the absence of the spatial domain feature-extraction branch leads to errors in texture reconstruction and blurred detail processing. This is also why, in Table 2, the removal of the spatial domain feature-extraction component has the most significant impact on the PSNR and SSIM metrics.

3.2.2. The Effect of Multi-Window Fusion Strategies

As described in Section 2.1.3, frequency-domain self-attention feature extraction is also crucial in remote-sensing image super-resolution. Compared to natural images, remote-sensing images are larger and contain repetitive, similar textures. To achieve reconstruction results with good visual quality and fine textures, the feature extractor needs a larger receptive field. The spectrum of remote-sensing images integrates spatial pixel information, providing stronger long-range modeling capabilities within the spatial domain. Therefore, as shown in Equation (24), we use Transformer-based feature extraction in the frequency domain to obtain information from a larger receptive field, enhancing the model’s ability to resolve high-frequency details. As shown in Figure 6, the LAM attribution analysis of the model without the frequency-domain self-attention branch reveals a smaller pixel utilization range compared to our complete model, leading to a significant decline in model performance, manifested as blurred details and loss of texture in the reconstructed images. This indicates that frequency-domain self-attention plays a key role in ensuring the detail fidelity and overall visual quality of high-resolution images.

3.2.3. The Effect of Frequency-Domain Branching

As described in Section 2.1.2, current Transformer-based image super-resolution methods limit self-attention computation to a single window, restricting the range of utilized information and consequently limiting the improvement in reconstructed image quality. We addressed this by designing a multi-window fusion strategy that enables effective integration of information from multiple windows, allowing self-attention to capture long-range information. This strategy enhances the interaction of distant information within the image, significantly improving the quality of image reconstruction. As shown in Equations (14)–(23), we detail the implementation of our multi-window fusion strategy. As illustrated in Figure 6, the LAM attribution analysis of the model without the multi-window fusion strategy shows a pixel utilization range second only to the complete model, consistent with the PSNR, SSIM, and LPIPS metrics of the model without the multi-window fusion strategy in Table 2.

4. Discussion

4.1. Method of Application

In Section 3, all experiments are based on low-resolution images obtained by the known bicubic downsampling method. However, in the real world, the information transmission and compression processes are often unknown. Therefore, it is necessary to reconstruct the original low-resolution images of unknown degradation types to further discuss the generalization performance of the proposed method.
For this purpose, we select images from the UC Merced dataset and do not perform degradation processing. Super-resolution reconstruction is performed using bicubic, SRGAN, HAT, and MWSFA methods. As shown in Figure 7, due to the lack of corresponding ground truth, the reconstruction performance of the methods can be compared by comparing the reconstructed visual effects.

4.2. Limitation

As previously discussed, while the PSNR and SSIM metrics primarily evaluate pixel-level and structural similarity, they do not fully capture the human visual system’s perception of images. The LPIPS metric, which better reflects perceptual differences, shows that our model achieves a higher score than SRGAN in 3× super-resolution tasks. However, despite achieving the best results in 2× and 4× super-resolution, the margin over other methods is relatively narrow. This suggests that, although our MWSFA model effectively captures and reconstructs high-frequency details, there is still room for improvement in how it integrates spatial and frequency-domain information. One possible explanation is that the current fusion mechanism, while beneficial, may not be fully optimized for guiding the spatial reconstruction process with frequency domain features. The challenge lies in ensuring that high-frequency information from the frequency domain is accurately utilized to enhance spatial domain reconstruction, avoiding potential issues such as blurred or incorrect details that can negatively impact perceptual quality. Additionally, the limited content in the 256 × 256 images from the UC Merced dataset may also restrict the model’s performance. Looking ahead, our future work will focus on refining the fusion of spatial and frequency-domain features to better align with perceptual quality metrics and enhance the consistency of reconstructed content.

5. Conclusions

Image super-resolution technology has been widely used in remote-sensing images. Remote-sensing images are usually large and contain repeated texture information, so the remote-sensing image super-resolution reconstruction task requires a feature-extraction network with a large receptive field. However, mainstream remote-sensing image super-resolution methods are usually based on stacked Transformer modules, and the receptive field is limited by the window size, resulting in limited reconstruction result quality. To address this challenge, we propose MWSFA.
We proposed a spatial-frequency joint self-attention network based on multi-window fusion, which paralleled a frequency-domain self-attention branch based on the original Transformer. The global characteristics of the frequency domain are used to expand the receptive field of the model, perform self-attention calculations fairly on each frequency band, and better utilize the same frequency information. At the same time, we propose a multi-window fusion strategy to fuse windows with similar textures so that self-attention calculation can extract long-range information and further effectively improve the receptive field of the feature extractor. Compared with existing methods, our model achieves higher visual reconstruction performance and achieves satisfactory results on three metrics. In addition, we conduct experiments on original unknown degradation-type remote-sensing images and obtain excellent performance, proving the robustness and practicality of our algorithm in practical applications.

Author Contributions

Conceptualization, Z.L.; methodology, Z.L., W.L. and Z.Z.; software, Z.L.; validation, Z.L., Z.Z. and J.H.; formal analysis, Z.L. and W.L.; investigation, Z.L.; resources, Z.L. and Z.W.; data curation, Z.L.; writing—original draft preparation, Z.L.; writing—review and editing, Z.L. and Z.W.; visualization, Z.L.; supervision, W.L.; project administration, L.H.; funding acquisition, W.L. All authors have read and agreed to the published version of the manuscript.

Funding

This research was supported partially by the National Natural Science Foundation of China (No. 62476207), the Chongqing Natural Science Foundation Innovation and Development Joint Fund Project under Grant CSTB2023NSCQ-LZX0085 and the Key Industrial Innovation Chain Project in Industrial Domain of Shaanxi Province (Grant No. 2020ZDLGY05-01).

Data Availability Statement

The data presented in this study are available on request from the corresponding author.

Conflicts of Interest

All authors have reviewed the manuscript and approved submission to this journal. The authors declare that there is no conflict of interest regarding the publication of this article and no self-citations included in the manuscript.

References

  1. Wang, Z.; Chen, J.; Hoi, S.C.H. Deep Learning for Image Super-Resolution: A Survey. IEEE Trans. Pattern Anal. Mach. Intell. 2020, 43, 3365–3387. [Google Scholar] [CrossRef] [PubMed]
  2. Wu, Z.; Chen, X.; Gao, Y.; Li, Y. Rapid Target Detection in High-Resolution Remote Sensing Images Using YOLO Model. Int. Arch. Photogramm. Remote Sens. Spatial Inf. Sci. 2018, 42, 1915–1920. [Google Scholar] [CrossRef]
  3. Gupta, M.; Almomani, O.; Khasawneh, A.M.; Darabkh, K.A. Smart Remote Sensing Network for Early Warning of Disaster Risks. In Nanotechnology-Based Smart Remote Sensing Networks for Disaster Prevention, 2nd ed.; Elsevier: Amsterdam, The Netherlands, 2022; pp. 303–324. [Google Scholar]
  4. Wang, Z.; Kang, Q.; Xun, Y.; Shen, Z.; Cui, C. Military Reconnaissance Application of High-Resolution Optical Satellite Remote Sensing. Proc. SPIE 2014, 9299, 301–305. [Google Scholar]
  5. Wang, Z.; Jiang, K.; Yi, P.; Han, Z.; He, Z. Ultra-Dense GAN for Satellite Imagery Super-Resolution. Neurocomputing 2020, 398, 328–337. [Google Scholar] [CrossRef]
  6. Lim, S.B.; Seo, C.W.; Yun, H.C. Digital Map Updates with UAV Photogrammetric Methods. J. Korean Soc. Surv. Geod. Photogramm. Cartogr. 2015, 33, 397–405. [Google Scholar] [CrossRef]
  7. Guo, M.; Liu, H.; Xu, Y.; Huang, Y. Building Extraction Based on U-Net with an Attention Block and Multiple Losses. Remote Sens. 2020, 12, 1400. [Google Scholar] [CrossRef]
  8. Sun, H.; Sun, X.; Wang, H.; Li, Y.; Li, X. Automatic Target Detection in High-Resolution Remote Sensing Images Using Spatial Sparse Coding Bag-of-Words Model. IEEE Geosci. Remote Sens. Lett. 2011, 9, 109–113. [Google Scholar] [CrossRef]
  9. Liang, X.; Gan, Z. Improved Non-Local Iterative Back-Projection Method for Image Super-Resolution. In Proceedings of the 2011 Sixth International Conference on Image and Graphics, Hefei, China, 12–15 August 2011; pp. 176–181. [Google Scholar]
  10. Yang, J.; Wright, J.; Huang, T.S.; Ma, Y. Image Super-Resolution Via Sparse Representation. IEEE Trans. Image Process. 2010, 19, 2861–2873. [Google Scholar] [CrossRef] [PubMed]
  11. Gu, S.; Zuo, W.; Xie, Q.; Meng, D.; Feng, X.; Zhang, L. Convolutional Sparse Coding for Image Super-Resolution. In Proceedings of the 2015 IEEE International Conference on Computer Vision (ICCV), Santiago, Chile, 7–13 December 2015; pp. 1823–1831. [Google Scholar]
  12. Peng, C.; Gao, X.; Wang, N.; Li, J. Graphical Representation for Heterogeneous Face Recognition. IEEE Trans. Pattern Anal. Mach. Intell. 2016, 39, 301–312. [Google Scholar] [CrossRef] [PubMed]
  13. Dong, C.; Loy, C.C.; He, K.; Tang, X. Image Super-Resolution Using Deep Convolutional Networks. IEEE Trans. Pattern Anal. Mach. Intell. 2015, 38, 295–307. [Google Scholar] [CrossRef] [PubMed]
  14. Kim, J.; Lee, J.K.; Lee, K.M. Deeply-Recursive Convolutional Network for Image Super-Resolution. In Proceedings of the 2016 IEEE Conference on Computer Vision and Pattern Recognition (CVPR), Las Vegas, NV, USA, 27–30 June 2016; pp. 1637–1645. [Google Scholar]
  15. Zhang, Y.; Tian, Y.; Kong, Y.; Zhong, B.; Fu, Y. Residual Dense Network for Image Super-Resolution. In Proceedings of the 2018 IEEE/CVF Conference on Computer Vision and Pattern Recognition, Salt Lake City, UT, USA, 18–23 June 2018; pp. 2472–2481. [Google Scholar]
  16. Ledig, C.; Theis, L.; Huszár, F.; Caballero, J.; Cunningham, A.; Acosta, A.; Aitken, A.P.; Tejani, A.; Totz, J.; Wang, Z.; et al. Photo-Realistic Single Image Super-Resolution Using a Generative Adversarial Network. In Proceedings of the 2017 IEEE Conference on Computer Vision and Pattern Recognition (CVPR), Honolulu, HI, USA, 21–26 July 2017; pp. 4681–4690. [Google Scholar]
  17. Haris, M.; Shakhnarovich, G.; Ukita, N. Deep Back-Projection Networks for Super-Resolution. In Proceedings of the 2018 IEEE/CVF Conference on Computer Vision and Pattern Recognition, Salt Lake City, UT, USA, 18–23 June 2018; pp. 1664–1673. [Google Scholar]
  18. Shocher, A.; Cohen, N.; Irani, M. “Zero-Shot” Super-Resolution Using Deep Internal Learning. In Proceedings of the 2018 IEEE/CVF Conference on Computer Vision and Pattern Recognition, Salt Lake City, UT, USA, 18–23 June 2018; pp. 3118–3126. [Google Scholar]
  19. Zhang, Y.; Li, K.; Li, K.; Wang, L.; Zhong, B.; Fu, Y. Image Super-Resolution Using Very Deep Residual Channel Attention Networks. In Proceedings of the European Conference on Computer Vision, Munich, Germany, 2–14 September 2018; pp. 286–301. [Google Scholar]
  20. Lim, B.; Son, S.; Kim, H.; Nah, S.; Lee, K.M. Enhanced Deep Residual Networks for Single Image Super-Resolution. In Proceedings of the IEEE Conference on Computer Vision and Pattern Recognition Workshops (CVPRW), Honolulu, HI, USA, 21–26 July 2017; pp. 136–144. [Google Scholar]
  21. Dosovitskiy, A.; Beyer, L.; Kolesnikov, A.; Weissenborn, D.; Zhai, X.; Unterthiner, T.; Dehghani, M.; Minderer, M.; Heigold, G.; Gelly, S.; et al. An Image Is Worth 16x16 Words: Transformers for Image Recognition at Scale. arXiv 2020, arXiv:2010.11929. [Google Scholar]
  22. Yang, F.; Yang, H.; Fu, J.; Lu, H.; Guo, B. Learning Texture Transformer Network for Image Super-Resolution. In Proceedings of the 2020 IEEE/CVF Conference on Computer Vision and Pattern Recognition (CVPR), Seattle, WA, USA, 13–19 June 2020; pp. 5791–5800. [Google Scholar]
  23. Zamir, S.W.; Arora, A.; Khan, S.; Hayat, M.; Khan, F.S.; Yang, M.-H. Restormer: Efficient Transformer for High-Resolution Image Restoration. In Proceedings of the 2022 IEEE/CVF Conference on Computer Vision and Pattern Recognition (CVPR), New Orleans, LA, USA, 18–24 June 2022; pp. 5728–5739. [Google Scholar]
  24. Liang, J.; Cao, J.; Sun, G.; Zhang, K.; Van Gool, L.; Timofte, R. SwinIR: Image Restoration Using Swin Transformer. In Proceedings of the 2021 IEEE/CVF International Conference on Computer Vision Workshops (ICCVW), Montreal, BC, Canada, 11–17 October 2021; pp. 1833–1844. [Google Scholar]
  25. Ronneberger, O.; Fischer, P.; Brox, T. U-Net: Convolutional Networks for Biomedical Image Segmentation. In Proceedings of the 18th International Conference, Munich, Germany, 5–9 October 2015; Part III, 18. Springer International Publishing: Berlin/Heidelberg, Germany, 2015; pp. 234–241. [Google Scholar]
  26. Choi, H.; Lee, J.; Yang, J. N-Gram in Swin Transformers for Efficient Lightweight Image Super-Resolution. In Proceedings of the 2023 IEEE/CVF Conference on Computer Vision and Pattern Recognition (CVPR), Vancouver, BC, Canada, 17–24 June 2023; pp. 2071–2081. [Google Scholar]
  27. Chen, X.; Wang, X.; Zhou, J.; Qiao, Y.; Chao, D. Activating More Pixels in Image Super-Resolution Transformer. In Proceedings of the 2023 IEEE/CVF Conference on Computer Vision and Pattern Recognition (CVPR), Vancouver, BC, Canada, 17–24 June 2023; pp. 22367–22377. [Google Scholar]
  28. Avdan, U.; Jovanovska, G. Algorithm for Automated Mapping of Land Surface Temperature Using LANDSAT 8 Satellite Data. J. Sensors 2016, 2016, 1480307. [Google Scholar] [CrossRef]
  29. Gu, J.; Dong, C. Interpreting Super-Resolution Networks with Local Attribution Maps. In Proceedings of the 2021 IEEE/CVF Conference on Computer Vision and Pattern Recognition (CVPR), Nashville, TN, USA, 20–25 June 2021; pp. 9199–9208. [Google Scholar]
  30. Deng, X.; Yang, R.; Xu, M.; Dragotti, P.L. Wavelet Domain Style Transfer for an Effective Perception-Distortion Tradeoff in Single Image Super-Resolution. In Proceedings of the 2019 IEEE/CVF International Conference on Computer Vision (ICCV), Seoul, Republic of Korea, 27 October–2 November 2019; pp. 3076–3085. [Google Scholar]
  31. Cooley, J.W.; Tukey, J.W. An Algorithm for the Machine Calculation of Complex Fourier Series. Math. Comput. 1965, 19, 297–301. [Google Scholar] [CrossRef]
  32. Simonyan, K. Very Deep Convolutional Networks for Large-Scale Image Recognition. arXiv 2014, arXiv:1409.1556. [Google Scholar]
  33. Guo, M.; Zhang, Z.; Liu, H.; Huang, Y. NDSRGAN: A Novel Dense Generative Adversarial Network for Real Aerial Imagery Super-Resolution Reconstruction. Remote Sens. 2022, 14, 1574. [Google Scholar] [CrossRef]
  34. Liang, J.; Zeng, H.; Zhang, L. Details or Artifacts: A Locally Discriminative Learning Approach to Realistic Image Super-Resolution. In Proceedings of the 2022 IEEE/CVF Conference on Computer Vision and Pattern Recognition (CVPR), New Orleans, LA, USA, 18–24 June 2022; pp. 5657–5666. [Google Scholar]
  35. Diederik, P.K. Adam: A Method for Stochastic Optimization. arXiv 2014, arXiv:1412.6980. [Google Scholar]
  36. Haut, J.M.; Fernandez-Beltran, R.; Paoletti, M.E.; Plaza, J.; Plaza, A. Remote Sensing Image Super Resolution Using Deep Residual Channel Attention. IEEE Trans. Geosci. Remote Sens. 2019, 57, 9277–9289. [Google Scholar] [CrossRef]
  37. Dong, X.; Sun, X.; Jia, X.; Xi, Z.; Gao, L.; Zhang, B. Remote Sensing Image Super-Resolution Using Novel Dense-Sampling Networks. IEEE Trans. Geosci. Remote Sens. 2020, 59, 1618–1633. [Google Scholar] [CrossRef]
  38. Huan, H.; Zou, N.; Zhang, Y.; Xie, Y.; Wang, C. Remote Sensing Image Reconstruction Using an Asymmetric Multi-Scale Super-Resolution Network. J. Supercomput. 2022, 78, 18524–18550. [Google Scholar] [CrossRef]
  39. Meng, F.; Wu, S.; Li, Y.; Zhang, Z.; Feng, T.; Liu, R.; Du, Z. Single Remote Sensing Image Super-Resolution Via a Generative Adversarial Network with Stratified Dense Sampling and Chain Training. IEEE Trans. Geosci. Remote Sens. 2023, 62, 1–22. [Google Scholar] [CrossRef]
  40. Wang, X.; Yu, K.; Wu, S.; Gu, J.; Liu, Y.; Dong, C.; Qiao, Y.; Loy, C.C. ESRGAN: Enhanced Super-Resolution Generative Adversarial Networks. In Proceedings of the 15th European Conference on Computer Vision, ECCV 2018, Munich, Germany, 8–14 September 2018. [Google Scholar]
Figure 1. LAM analysis diagram. The first row shows the local attribution map and gives the DI value. The second row shows the HR image reconstructed by each method and gives the PSNR and SSIM indicators.
Remotesensing 16 03695 g001
Figure 2. Overview of the proposed MWSFA architecture.
Remotesensing 16 03695 g002
Figure 3. (a) The spatial self-attention branch based on multi-window fusion. (b) The frequency-domain self-attention branch of the spatial-frequency self-attention module.
Remotesensing 16 03695 g003
Figure 4. Part of the test images chosen from UC Merced test sets. (a) airplane87. (b) agricultural42. (c) baseballdiamond48. (d) beach73. (e) buildings08. (f) chaparral24. (g) denseresidential23. (h) denseresidential92. (i) forest58. (j) freeway41. (k) harbor61. (l) overpass93.
Remotesensing 16 03695 g004
Figure 5. Visualization of different methods on the UC Merced dataset. (ad) ×2, ×3, ×4, ×8 SR results, respectively.
Remotesensing 16 03695 g005
Figure 6. Comparison of the visual results of LAM analysis for four groups of models. The last column is an enlarged version of the red box image and marks the reconstructed PSNR and SSIM indicators.
Remotesensing 16 03695 g006
Figure 7. Visual comparisons of the Bicubic model, SRGAN, HAT, and MWSFA when applied to original remote-sensing images in each group of pictures. (a) beach94. (b) denseresidential79. (c) harbor65. (d) storagetanks04. (e) tenniscourt27.
Remotesensing 16 03695 g007
Table 1. Average results of SR methods on UC Merced dataset with 2, 3, 4, and 8 scale factors. The best results were highlighted with bold black.
MethodBatch SizeRatio × 2
PSNRSSIMLPIPSParamsFLOPs
Bicubic/29.0980.853260.22807//
EDSR [20]1631.5400.908020.1344540.730 M166.840 G
SRGAN [16]1631.1660.900050.120191.402 M5.935 G
DRCAN [36]1631.5610.910090.1315615.445 M62.751 G
DSSR [37]1631.5630.908860.140009.134 M39.151 G
AMSSRN [38]1631.5920.909230.1355611.863 M47.193 G
HAT [27]431.6780.910550.1325625.821 M133.597 G
SRADSGAN [39]831.7230.910440.1335311.069 M45.261 G
MWSFA832.0210.912380.1078629.124 M152.324 G
MethodBatch SizeRatio  × 3
PSNRSSIMLPIPSParamsFLOPs
Bicubic/26.5490.755130.37250//
EDSR [20]1628.7930.831390.2136543.680 M179.061 G
SRGAN [16]1628.3720.816280.142191.588 M7.012 G
DRCAN [36]1628.8730.834100.2099215.629 M63.541 G
DSSR [37]1628.8200.832260.214409.319 M42.206 G
AMSSRN [38]1628.8450.833820.2178412.047 M47.984 G
HAT [27]828.9420.835130.2144326.005 M106.292 G
SRADSGAN [39]1628.9090.834220.2054311.254 M46.052 G
MWSFA1629.5150.899100.2092431.018 M153.142 G
MethodBatch SizeRatio  × 4
PSNRSSIMLPIPSParamsFLOPs
Bicubic/24.6940.652970.50819//
EDSR [20]1626.4710.739300.3131343.130 M205.834 G
SRGAN [16]1626.2350.725120.254141.402 M9.128 G
DRCAN [36]1626.6870.746640.3158315.592 M65.252 G
DSSR [37]1626.6040.743280.324809.134 M48.900 G
AMSSRN [38]1626.6480.744270.3255612.010 M49.694 G
HAT [27]1626.7380.748410.3144025.821 M136.762 G
SRADSGAN [39]1626.7840.748980.3150311.069 M47.762 G
MWSFA1627.2360.778320.2172329.124 M154.894 G
MethodBatch SizeRatio  × 8
PSNRSSIMLPIPSParamsFLOPs
Bicubic/21.8660.464790.73461//
EDSR [20]1622.7380.524170.4818240.730 M361.812 G
SRGAN [16]1622.7470.510510.421841.402 M21.900 G
DRCAN [36]1623.0390.536910.4840715.740 M75.386 G
DSSR [37]1623.0350.537220.489939.134 M87.894 G
AMSSRN [38]1623.1100.540180.4944212.210 M52.253 G
HAT [27]1622.7880.530520.4727525.821 M149.423 G
SRADSGAN [39]1623.1890.544750.4834211.069 M57.765 G
MWSFA1624.0530.555920.4389430.499 M159.449 G
Table 2. Ablation study on UC Merced test dataset.
MethodScalePSNRSSIMLPIPS
MWSFA w/o SSA × 2 17.4370.538780.49301
MWSFA w/o FSA × 2 25.8930.823230.22345
MWSFA w/o MWF × 2 29.3270.876340.13299
MWSFA × 2 32.0210.912380.10786
MWSFA w/o SSA × 3 17.2300.501000.50221
MWSFA w/o FSA × 3 26.9830.774930.35231
MWSFA w/o MWF × 3 27.0980.837210.24898
MWSFA × 3 29.5150.899100.20924
MWSFA w/o SSA × 4 15.9020.412070.51579
MWSFA w/o FSA × 4 25.2130.607520.33249
MWSFA w/o MWF × 4 26.9280.721300.26598
MWSFA × 4 27.2360.778320.21723
Disclaimer/Publisher’s Note: The statements, opinions and data contained in all publications are solely those of the individual author(s) and contributor(s) and not of MDPI and/or the editor(s). MDPI and/or the editor(s) disclaim responsibility for any injury to people or property resulting from any ideas, methods, instructions or products referred to in the content.

