Article

On the Capabilities of the IREA-CNR Airborne SAR Infrastructure

by
Carmen Esposito
1,
Antonio Natale
1,
Riccardo Lanari
1,
Paolo Berardino
1 and
Stefano Perna
1,2,*
1
Institute for Remote Sensing of Environment (IREA), National Research Council (CNR), 80124 Napoli, Italy
2
Department of Engineering (DI), University “Parthenope”, 80143 Napoli, Italy
*
Author to whom correspondence should be addressed.
Remote Sens. 2024, 16(19), 3704; https://doi.org/10.3390/rs16193704 (registering DOI)
Submission received: 20 August 2024 / Revised: 22 September 2024 / Accepted: 2 October 2024 / Published: 5 October 2024
(This article belongs to the Special Issue Monitoring Geohazard from Synthetic Aperture Radar Interferometry)

Abstract

:
In this work, the airborne Synthetic Aperture Radar (SAR) infrastructure developed at the Institute for Electromagnetic Sensing of the Environment (IREA) of the National Research Council of Italy (CNR) is described. This infrastructure allows IREA-CNR to plan and execute airborne SAR campaigns and to process the acquired data with a twofold aim. On one hand, the aim is to develop research activities; on the other hand, the aim is to support the emergency prevention and management activities of the Department of Civil Protection of the Italian Presidency of the Council of Ministers, for which IREA-CNR serves as National Centre of Competence. Such infrastructure consists of a flight segment and a ground segment that include a multi-frequency airborne SAR sensor based on the Frequency-Modulated Continuous Wave (FMCW) technology and operating in the X and L bands, an Information Technology (IT) platform for data storage and processing and an airborne SAR data processing chain. In this work, the technical aspects related to the flight and ground segments of the infrastructure are presented. Moreover, a discussion on the response times and characteristics of the final products that can be achieved with the infrastructure is provided with the aim of showing its capabilities to support the monitoring activities required in a possible emergency scenario. In particular, as a case study, the acquisition and subsequent interferometric processing of airborne SAR data relevant to the Stromboli volcanic area in the Sicily region, southern Italy, are presented

1. Introduction

Nowadays, the attention paid to environmental monitoring is increasingly growing, in addition to requests for large-scale measurements of parameters describing physical phenomena occurring on the Earth’s surface. In this context, Synthetic Aperture Radar (SAR) systems [1,2] are particularly suitable to respond to these ever-increasing needs. Thanks to their all-weather monitoring capability and the availability of advanced SAR techniques [3,4,5], it is possible to recover the physical properties of illuminated areas, retrieve the Earth surface elevation profile, measure ground deformation and so on. These are the main reasons why the number of private and public investments made in the development and exploitation of SAR systems and infrastructures [6,7,8,9,10,11,12,13,14,15] is continuously increasing. Indeed, the exploitation of different operational frequencies and electromagnetic polarizations, simultaneous high-resolution and wide swath capabilities and advanced imaging modes [16,17] are among innovative features of the latest SAR monitoring systems. Satellites [13,14,15], airplanes [18,19,20,21,22,23], helicopters [24] and drones [25,26] are the most common platforms used to mount SAR systems. Typically, airborne platforms are used as test benches for spaceborne technological developments, since they allow for low-cost experiments and operations. Moreover, airborne platforms can fly with no constraints on flight paths and revisit times, thereby overcoming some monitoring limits that typically characterize the spaceborne SAR observation network. In particular, airborne SAR systems guarantee a much quicker response time for the observation of sudden extreme events, such as flooding, earthquakes, volcanic eruptions and so on. Moreover, airborne SAR antennas are smaller than those used in spaceborne platforms due to the significantly lower operational altitude of the sensor. Therefore, for a given acquisition mode, the azimuth resolution achievable with airborne SAR systems is finer than that of the spaceborne SAR systems [1]. On the other hand, spaceborne SAR systems guarantee a much wider spatial coverage due to their much higher operational altitude [2]. Within this framework, an airborne SAR infrastructure is currently available at the Institute for Electromagnetic Sensing of the Environment (IREA) of the National Research Council of Italy (CNR). This infrastructure, which was developed for scientific purposes, also plays a key role in supporting the emergency prevention and management activities of the Department of Civil Protection of the Italian Presidency of the Council of Ministers, for which IREA-CNR serves as the National Centre of Competence.
In this work, the IREA-CNR airborne SAR infrastructure is presented. It consists of a flight segment and a ground segment. More specifically, the flight segment includes an airborne SAR system, namely, the Multiband Interferometric and Polarimetric SAR (MIPS) sensor [27]. This sensor is based on the Frequency Modulated Continuous Wave (FMCW) technology [28] and operates in two different frequency bands. In particular, it is equipped with a single pass Interferometric SAR (InSAR) configuration at X band or with a full polarimetric configuration at L band. Thanks to its limited weight and size, the MIPS sensor can be mounted even on board small aircrafts. The ground segment of the infrastructure includes an Information Technology (IT) platform for data storage and processing, namely the SAR data processing chain [1,29,30] jointly developed by IREA-CNR and University “Parthenope”. Beside, a series of supporting activities are carried out before and during the survey campaigns [21,23] to guarantee their successful execution. In this work, the flight and ground segments of the infrastructure are described in detail in Section 2. In Section 3, a special focus is placed on to the generation of single pass InSAR products, specifically, a Digital Elevation Model (DEM) of a selected test area, that is, the Stromboli volcano in the Sicily region, southern Italy [31,32]. To show the monitoring capabilities of the infrastructure during crisis events, in Section 4, we discuss the results reported in Section 3 by focusing on the response times needed to generate the presented InSAR products. In the same section, we also present the short-term future perspectives of this airborne SAR infrastructure. Some concluding remarks are reported in Section 5.

2. Materials and Methods

In this section, we describe the flight segment (Section 2.1) and the ground segment (Section 2.2) that compose the IREA-CNR airborne SAR infrastructure.

2.1. The Flight Segment

The flight segment, which ensures data acquisition, is composed of the following two major elements: radar and software tools for flight planning. The aircraft is not owned by IREA-CNR but is provided by external operators.
The airborne SAR system is MIPS [27], which is a lightweight, cost-effective FMCW imaging sensor. The radar module has a weight of approximately 35 kg and is accommodated in a compact, easily transportable rack (see Figure 1), whose dimensions are about 50 cm × 50 cm × 65 cm. MIPS operates at two different carrier frequencies, namely, in the X and L bands. The availability of two separate bands of the microwave spectrum allows widening the observation capabilities of the infrastructure. For instance, L-band SAR signals (characterized by a wavelength on the order of 20 cm) exhibit higher penetration capabilities than X-band signals ones (characterized by a wavelength on the order of 3 cm). Therefore, L-band signals carry information on soil properties, even in vegetated areas, whereas X-band signals are stopped by the upper canopy layers. L-band SAR data are, thus, sensitive to the different scattering mechanisms that characterize complex targets and much more robust than X-band signals with respect to temporal decorrelation phenomena occurring in InSAR scenarios [1,2]. Therefore, the L band is particularly suitable for the observation of natural areas, where it can be exploited, for instance, for land classification and soil moisture retrieval through the use of polarimetric techniques [3] or for ground deformation monitoring through the use of the Differential InSAR (DInSAR) technique [2]. In this regard, it is worth remarking that the phase unwrapping operation [1] is simplified at L-band, due to the lower fringe rate that characterizes the corresponding interferograms. On the other hand, the short wavelengths of the X band are able to interact with objects at finer spatial scales compared to those of the L band. X-band SAR data are, thus, usually collected at high/very high spatial resolutions, which are more suitable for the observation of anthropogenic scenarios, as, for instance, in the monitoring of urban areas based on tomographic approaches [2]. In addition, the short wavelengths of the X band allow effective single pass InSAR configurations to be obtained for the generation of highly accurate DEMs [1], even on airplanes of rather small sizes. To take advantage of the peculiarities of these two frequency bands, the MIPS system operates with a single pass InSAR configuration in the X band or with a fully polarimetric configuration in the L band. To achieve these capabilities with the FMCW technology, the system is equipped with three X-band antennas (one transmitting (Tx) and two receiving (Rx)) and four L-band antennas (two Tx and two Rx). The X-band antennas are vertically polarized, while two L-band antennas are vertically polarized and the other two are horizontally polarized. All antennas are off-the-shelf microstrips. Figure 2 shows the two possible antenna layouts relevant to the X-band interferometric configuration (left panel) and the L-band fully polarimetric configuration (right panel) achieved on a Cessna 172 aircraft. More generally, depending on the physical and aerodynamic characteristics of the aircraft, the X-band and L-band antennas can even be simultaneously mounted. In this case, the operator can decide during the flight to switch between the two different configurations described above. More details on the parameters of the MIPS SAR sensor are collected in Table 1.
The MIPS system includes a modern navigation unit directly connected to the radar module, namely, an Applanix POS-AV 610 [33], which includes an embedded Global Navigation Satellite System (GNSS) and an Inertial Measurement Unit (IMU). The use of this navigation unit, coupled with proper postflight processing techniques, guarantees very precise flight parameter measurability [19]. Finally, the flight segment includes off-the-shelf software tools for the flight planning, which are totally managed by IREA-CNR.

2.2. The Ground Segment

The ground segment of the IREA-CNR airborne SAR infrastructure is composed of two major elements, namely, an IT platform for data storage and processing, as described in Section 2.2.1, and a SAR data processing chain, as summarized in Section 2.2.4. In addition, in this section, we show the laboratory activities (Section 2.2.2) and the in situ procedures (Section 2.2.3) that we carry out before/during each survey campaign to support the infrastructure, guaranteeing the successful execution of the campaign itself and the availability of ancillary data necessary to process the SAR data.

2.2.1. IT Platform

The IT platform used to store and process the SAR datasets is installed in the IREA-CNR laboratories in Naples, Italy (see Figure 3). It consists of 22 nodes, each of which is equipped with 2 CPUs. Each CPU (AMD® EPYC 7513, 32 c, 2.6 GHz, 128 M cache 200W TDP) is equipped with 32 cores. Each node is equipped with 2 TB (3200 MHz) of RAM and with 12 16TB 7K SAS 12 Gbps 512e equal to 192TB RAW disks. The 22 nodes are interconnected through two 25 Gb/s networks. The platform is configured with the openSUSE 15.4 operating system. The specifications of this IT platform are very well tailored to the implementation of parallel programming techniques (multi-node and multi-thread), which are crucial for the efficient application of the airborne SAR data processing chain, as described in Section 2.2.4.

2.2.2. Laboratory Activities

The laboratory activities are aimed at characterizing the radar antennas of the MIPS system. More specifically, they involve the exploitation of an Anechoic Chamber (AC) to carry out the far field [34] measurements described in the following.

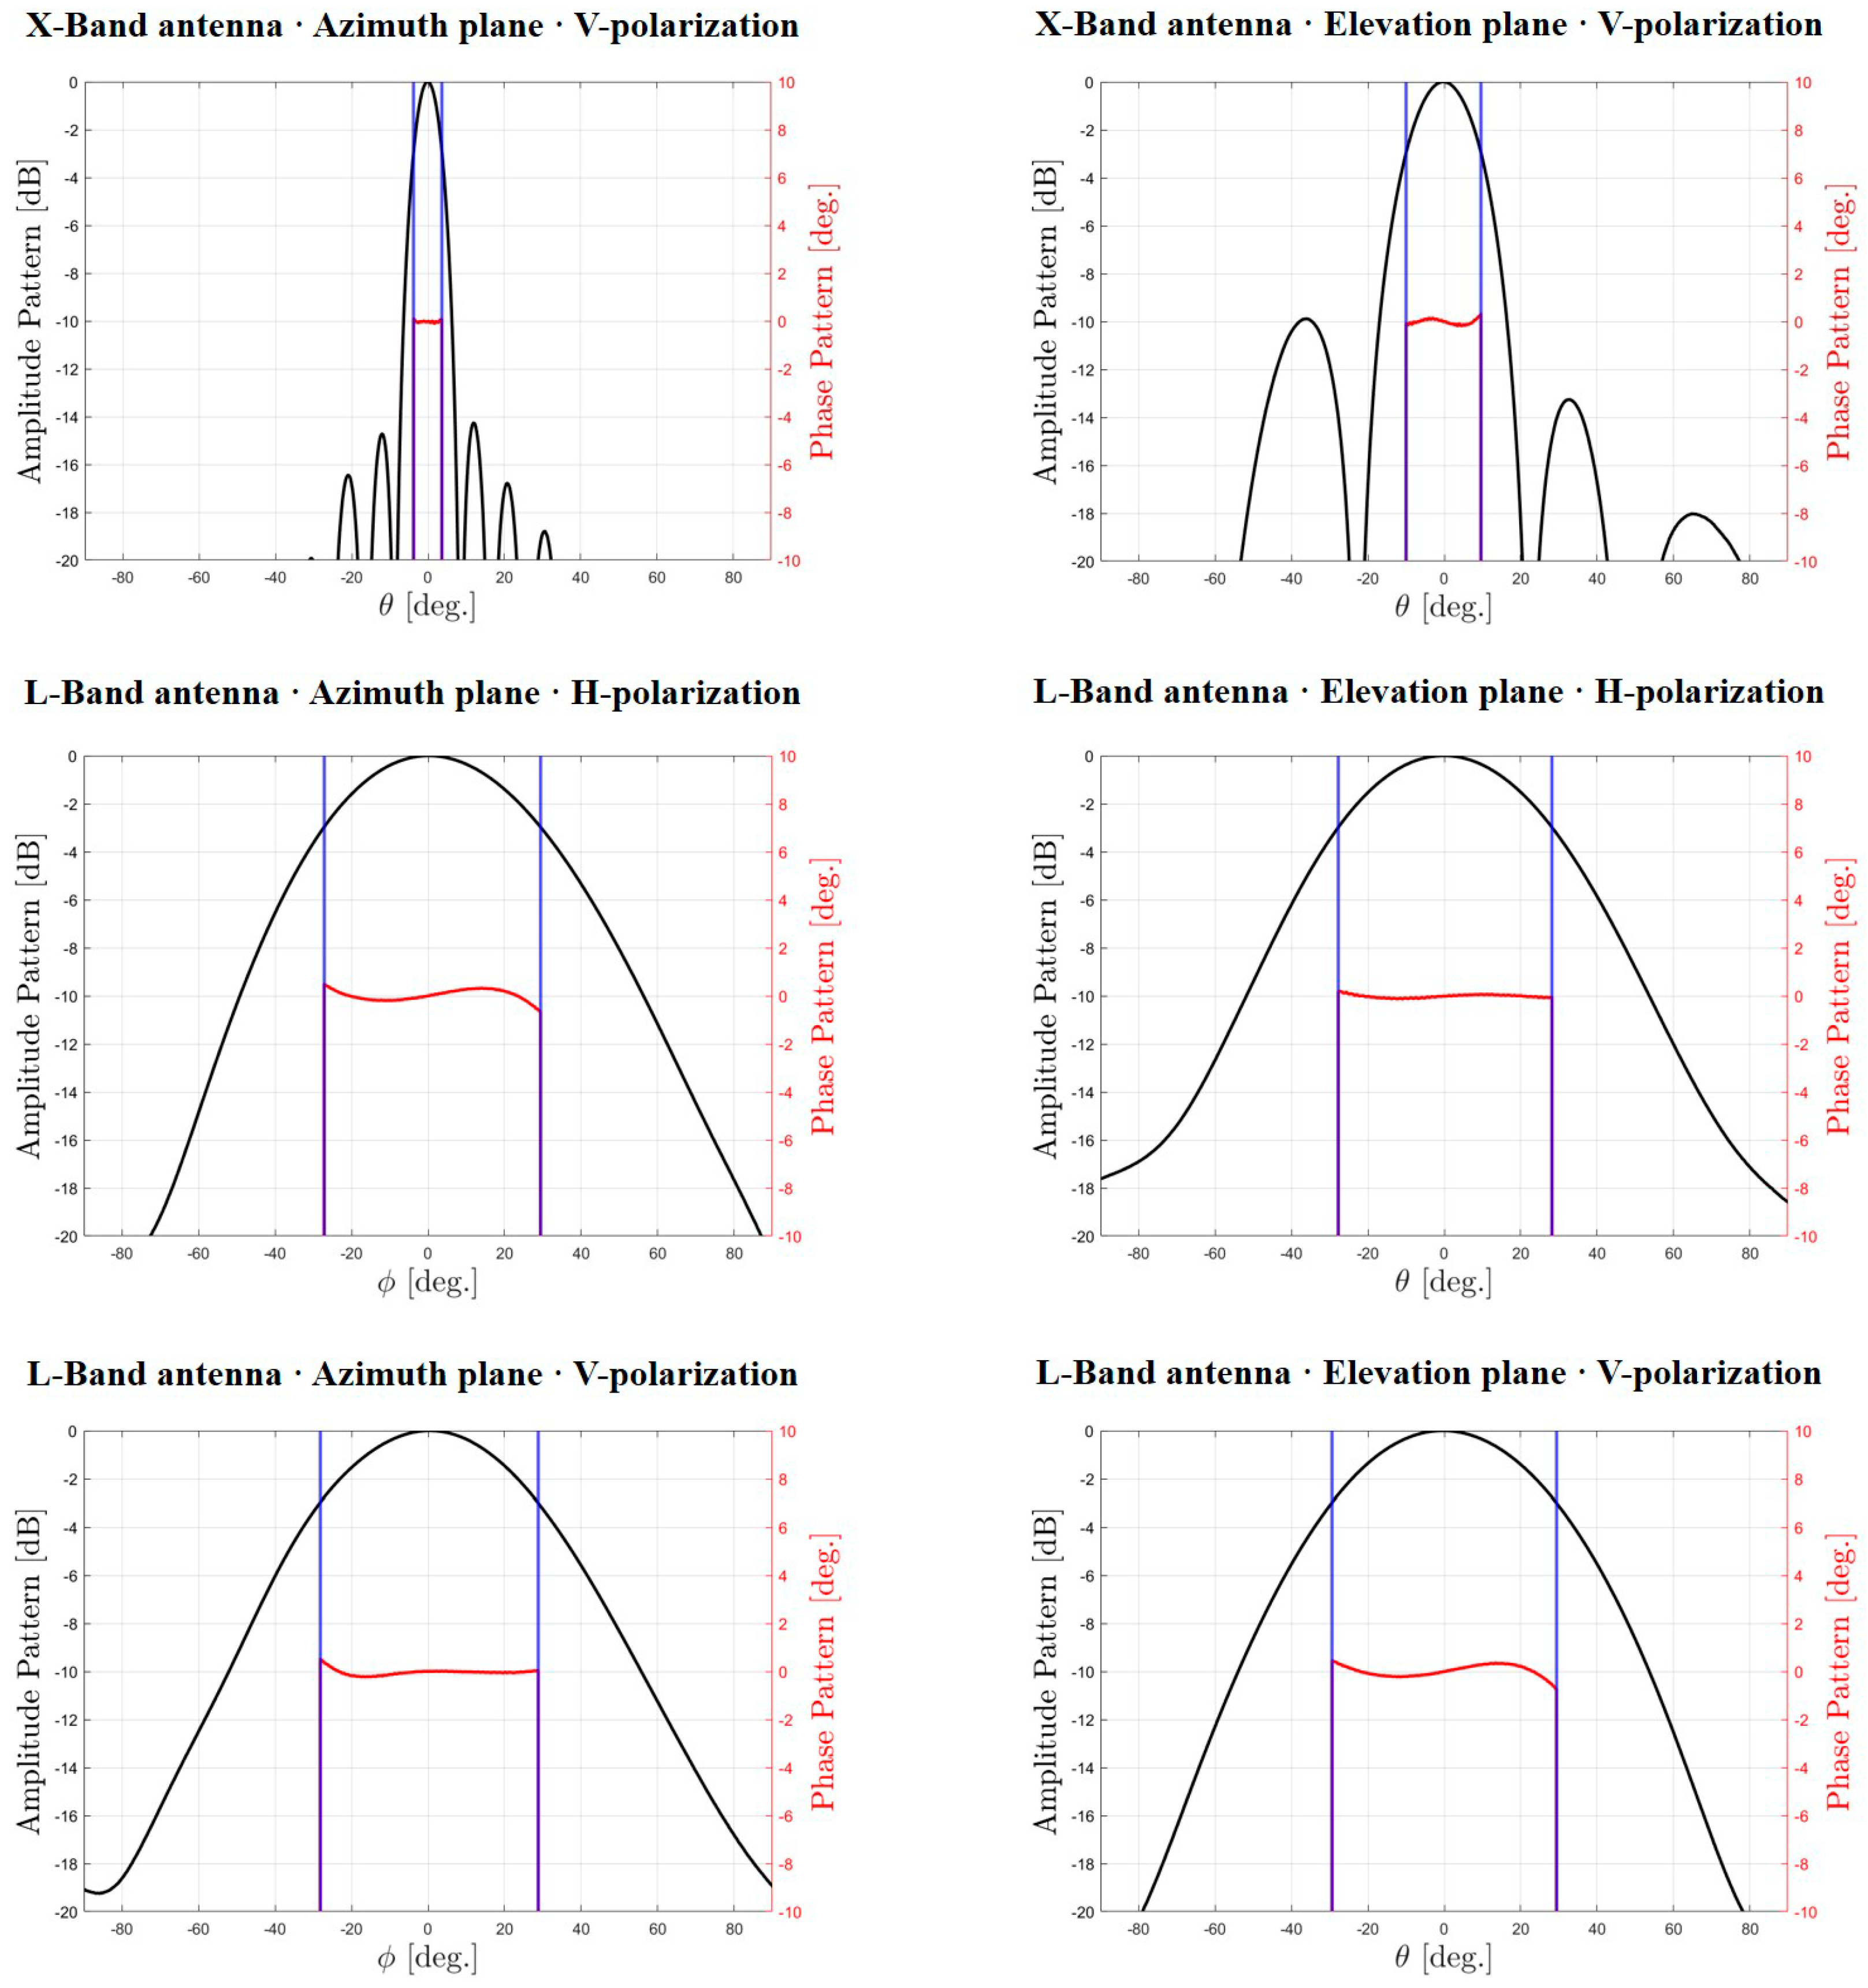
Measurement of the Antenna Patterns

The availability of the antenna patterns is necessary during the image focusing and the external radiometric calibration procedures described in Section 2.2.4. Specifically, for all radar antennas, we measured the patterns in the horizontal and vertical planes. As example, Figure 4 reports the measured co-polar, one-way amplitude patterns (black lines) of one vertically polarized X-band antenna (top panels), one horizontally polarized L-band antenna (middle panels) and one vertically polarized L-band antenna (bottom panels) of the MIPS system.

Measurement of the Antenna Phase Center (APC) Position

The accurate calculation of the position of the radar APC with respect to a local reference system defined over the antenna itself is key information for the SAR focusing procedure described in Section 2.2.4. In particular, we measured the APC position in an AC using the method proposed in [35], which can be effectively applied to a wide class of antennas, including the microstrip antennas of the MIPS system. This overcomes the limitations of other effective methods tailored to specific classes of antennas such as reflector [36,37] or horn [38] antennas. As example, in the panels of Figure 4, we overplot the phase patterns (red lines) measured by scanning the radar antennas around the estimated APC. As can be seen, in all cases, the measured phase patterns are very flat, with variations of less than two degrees within the main beam. This testifies, on one hand, to the good behavior of the radar antenna phase patterns within the main beam and, on the other hand, to the high precision of the APC positions that we estimated. Subsequent refinement of such estimates through external calibration approaches [39] is, therefore, not necessary.
The antenna measurements were carried out in the AC at the DI of the University “Parthenope”, Napoli, Italy.

2.2.3. In Situ Activities

The in situ activities described in Section 2.2.3 are essential to ensure the success of the SAR mission [21,23].

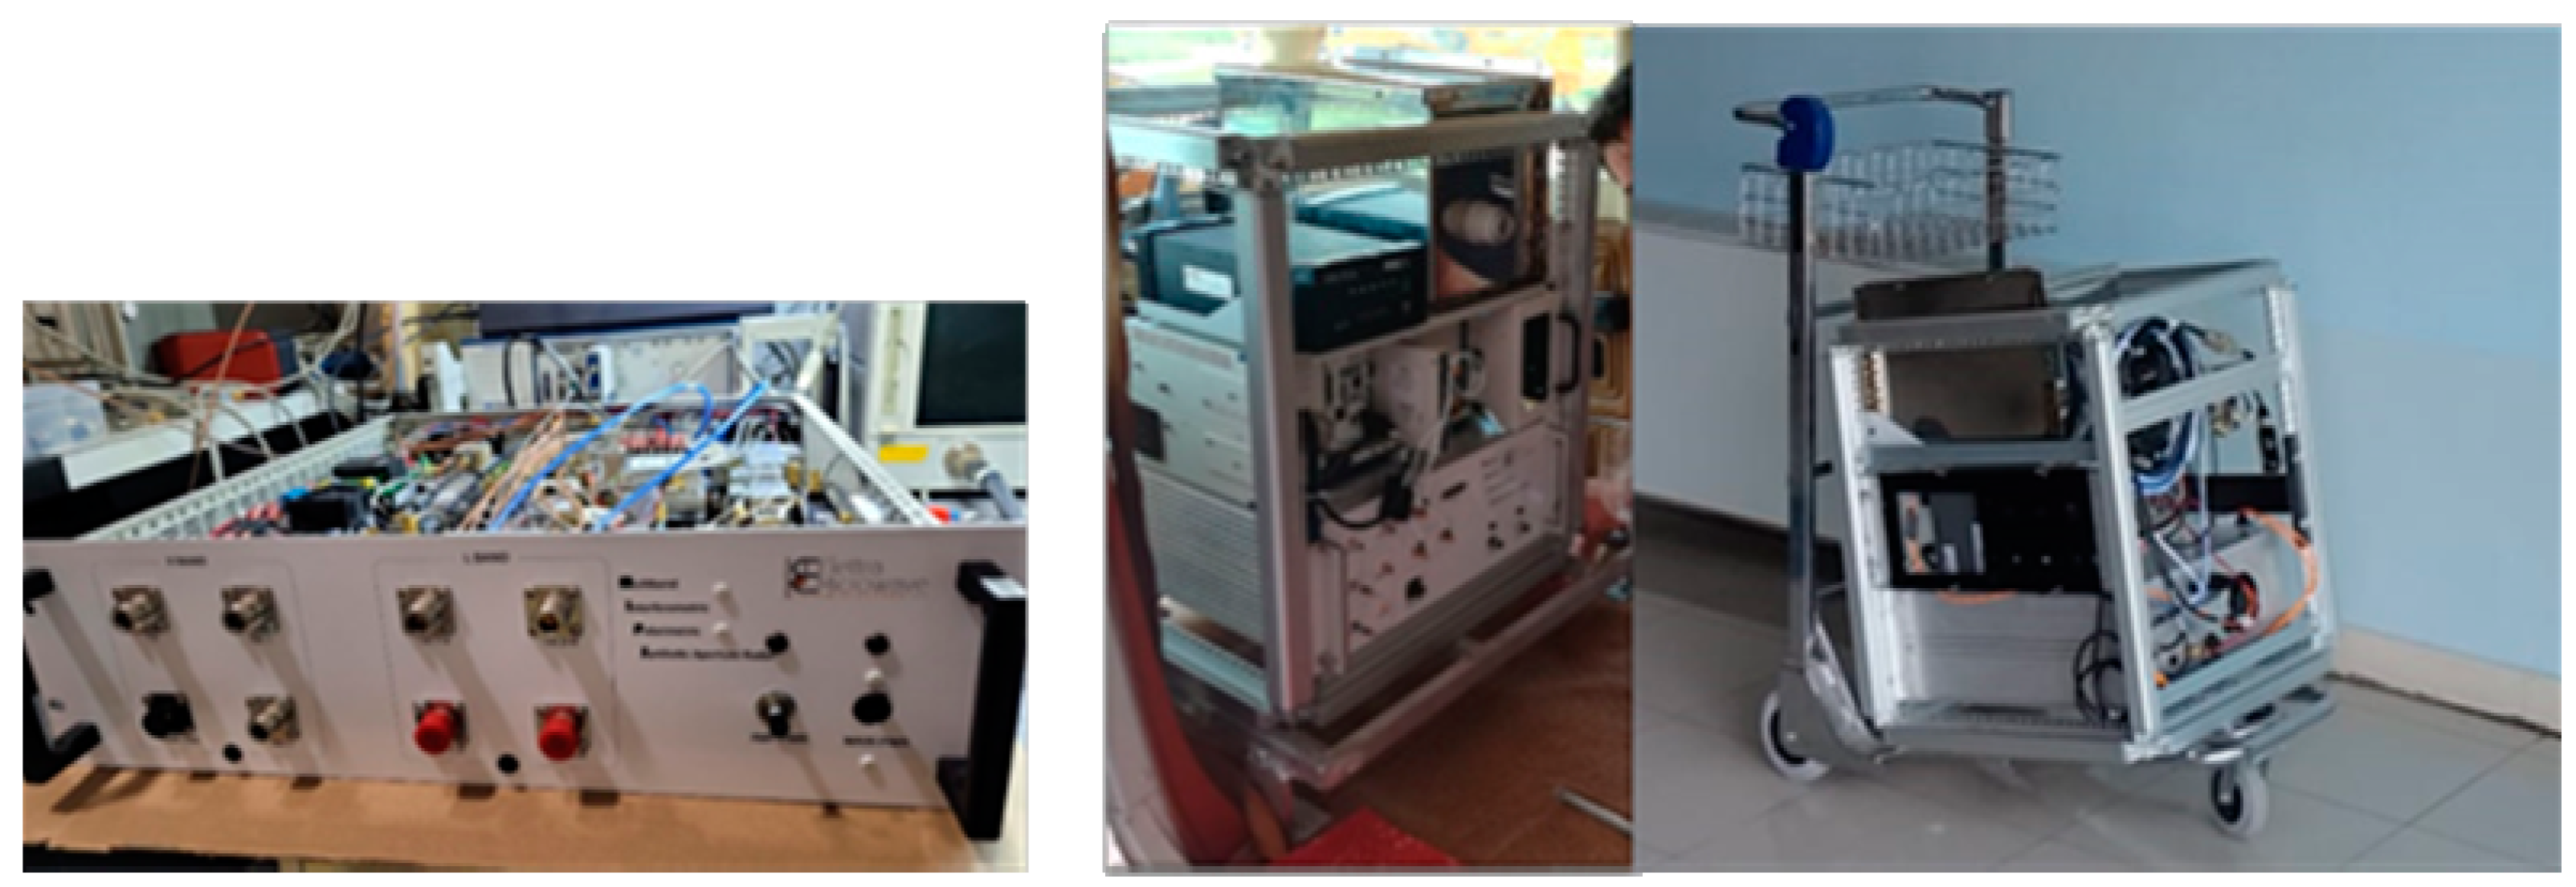
Assembly and Disassembly of the SAR Sensor Onboard the Aircraft

As remarked above, IREA-CNR does not own an aircraft. Therefore, a chartered aircraft is used for the acquisition campaigns, and the MIPS system is assembled on board just before the beginning of the campaign and disassembled just after its end. In this regard, it is worth stressing that the MIPS system is not tailored to a specific aircraft; it can even be mounted on board small/medium size aircrafts such as the Cessna 172 shown in Figure 2.

Deployment of Corner Reflectors (CRs)

Recognizable ground reference points such as CRs are of paramount importance to assess the quality of SAR products. Typically, we deploy CRs over a test area where preliminary data analysis procedures, such as that proposed in [40], are carried out before processing the entire dataset acquired during a campaign. When possible, such a test area is included in the region of interest for the planned acquisition campaign; otherwise it is chosen near to the departure/landing airport. In any case, it is recommendable that CRs be deployed over the entire range swath of the system—first of all, to assess the quality of the SAR impulse response at different ranges and, more generally, to effectively implement some preliminary analysis procedures, such as those described in [40,41], which benefit from a wide dispersion, along the range direction, of the exploited ground control points.

Measurement of CR Positions

This measurement, which is necessary to correctly locate CRs within SAR data, is carried out using the Differential Global Positioning System (DGPS) technique immediately after the deployment of the CRs, as described above. As an example, in Figure 5, we show the activities related to the measurement of the position of one CR during one MIPS campaign.

Measurement of Antenna Lever Arms

To accurately carry out an SAR campaign with a focus on the external radiometric calibration procedures described in Section 2.2.4, it is necessary to know the orientation and position of each radar antenna with respect to a global reference system during the entire period of radar data acquisition [42]. To do this, the flight information provided by the navigation unit is necessary. Moreover, the antenna orientations and positions must be known with respect to a local reference system centered on the IMU phase center. To this end, the so-called lever arms need to be measured, at least, for 3 different reference points on each radar antenna (see [42] for further details). Such measurements are performed by using a theodolite total station once that the radar antennas and the IMU are mounted on board the aircraft, with the aircraft at rest. As example, in Figure 6, we show the activities related to the measurement of the antenna lever arms during one MIPS campaign.

Data Download and Transfer

The downloading of data onto hard disks takes place at the landing airport at the end of the mission. Afterwards, the hard disks are physically transferred to the IREA-CNR laboratory in order to download the data onto the IT platform described in Section 2.2.1.

2.2.4. SAR Data Processing Chain

Once the acquired data are transferred to the IREA-CNR laboratory, the SAR data processing chain can be applied. The implementation of such data processing procedures on the IT platform described in Section 2.2.1 involves the use of:
  • a single Computing Element (CE) acting as a master node in terms of job scheduling policy control;
  • several Worker Nodes (WNs) ensuring the required computation capability, particularly to execute data processing steps based on a parallel programming strategy;
  • several Storage Elements (SEs) that are installed to store the data.
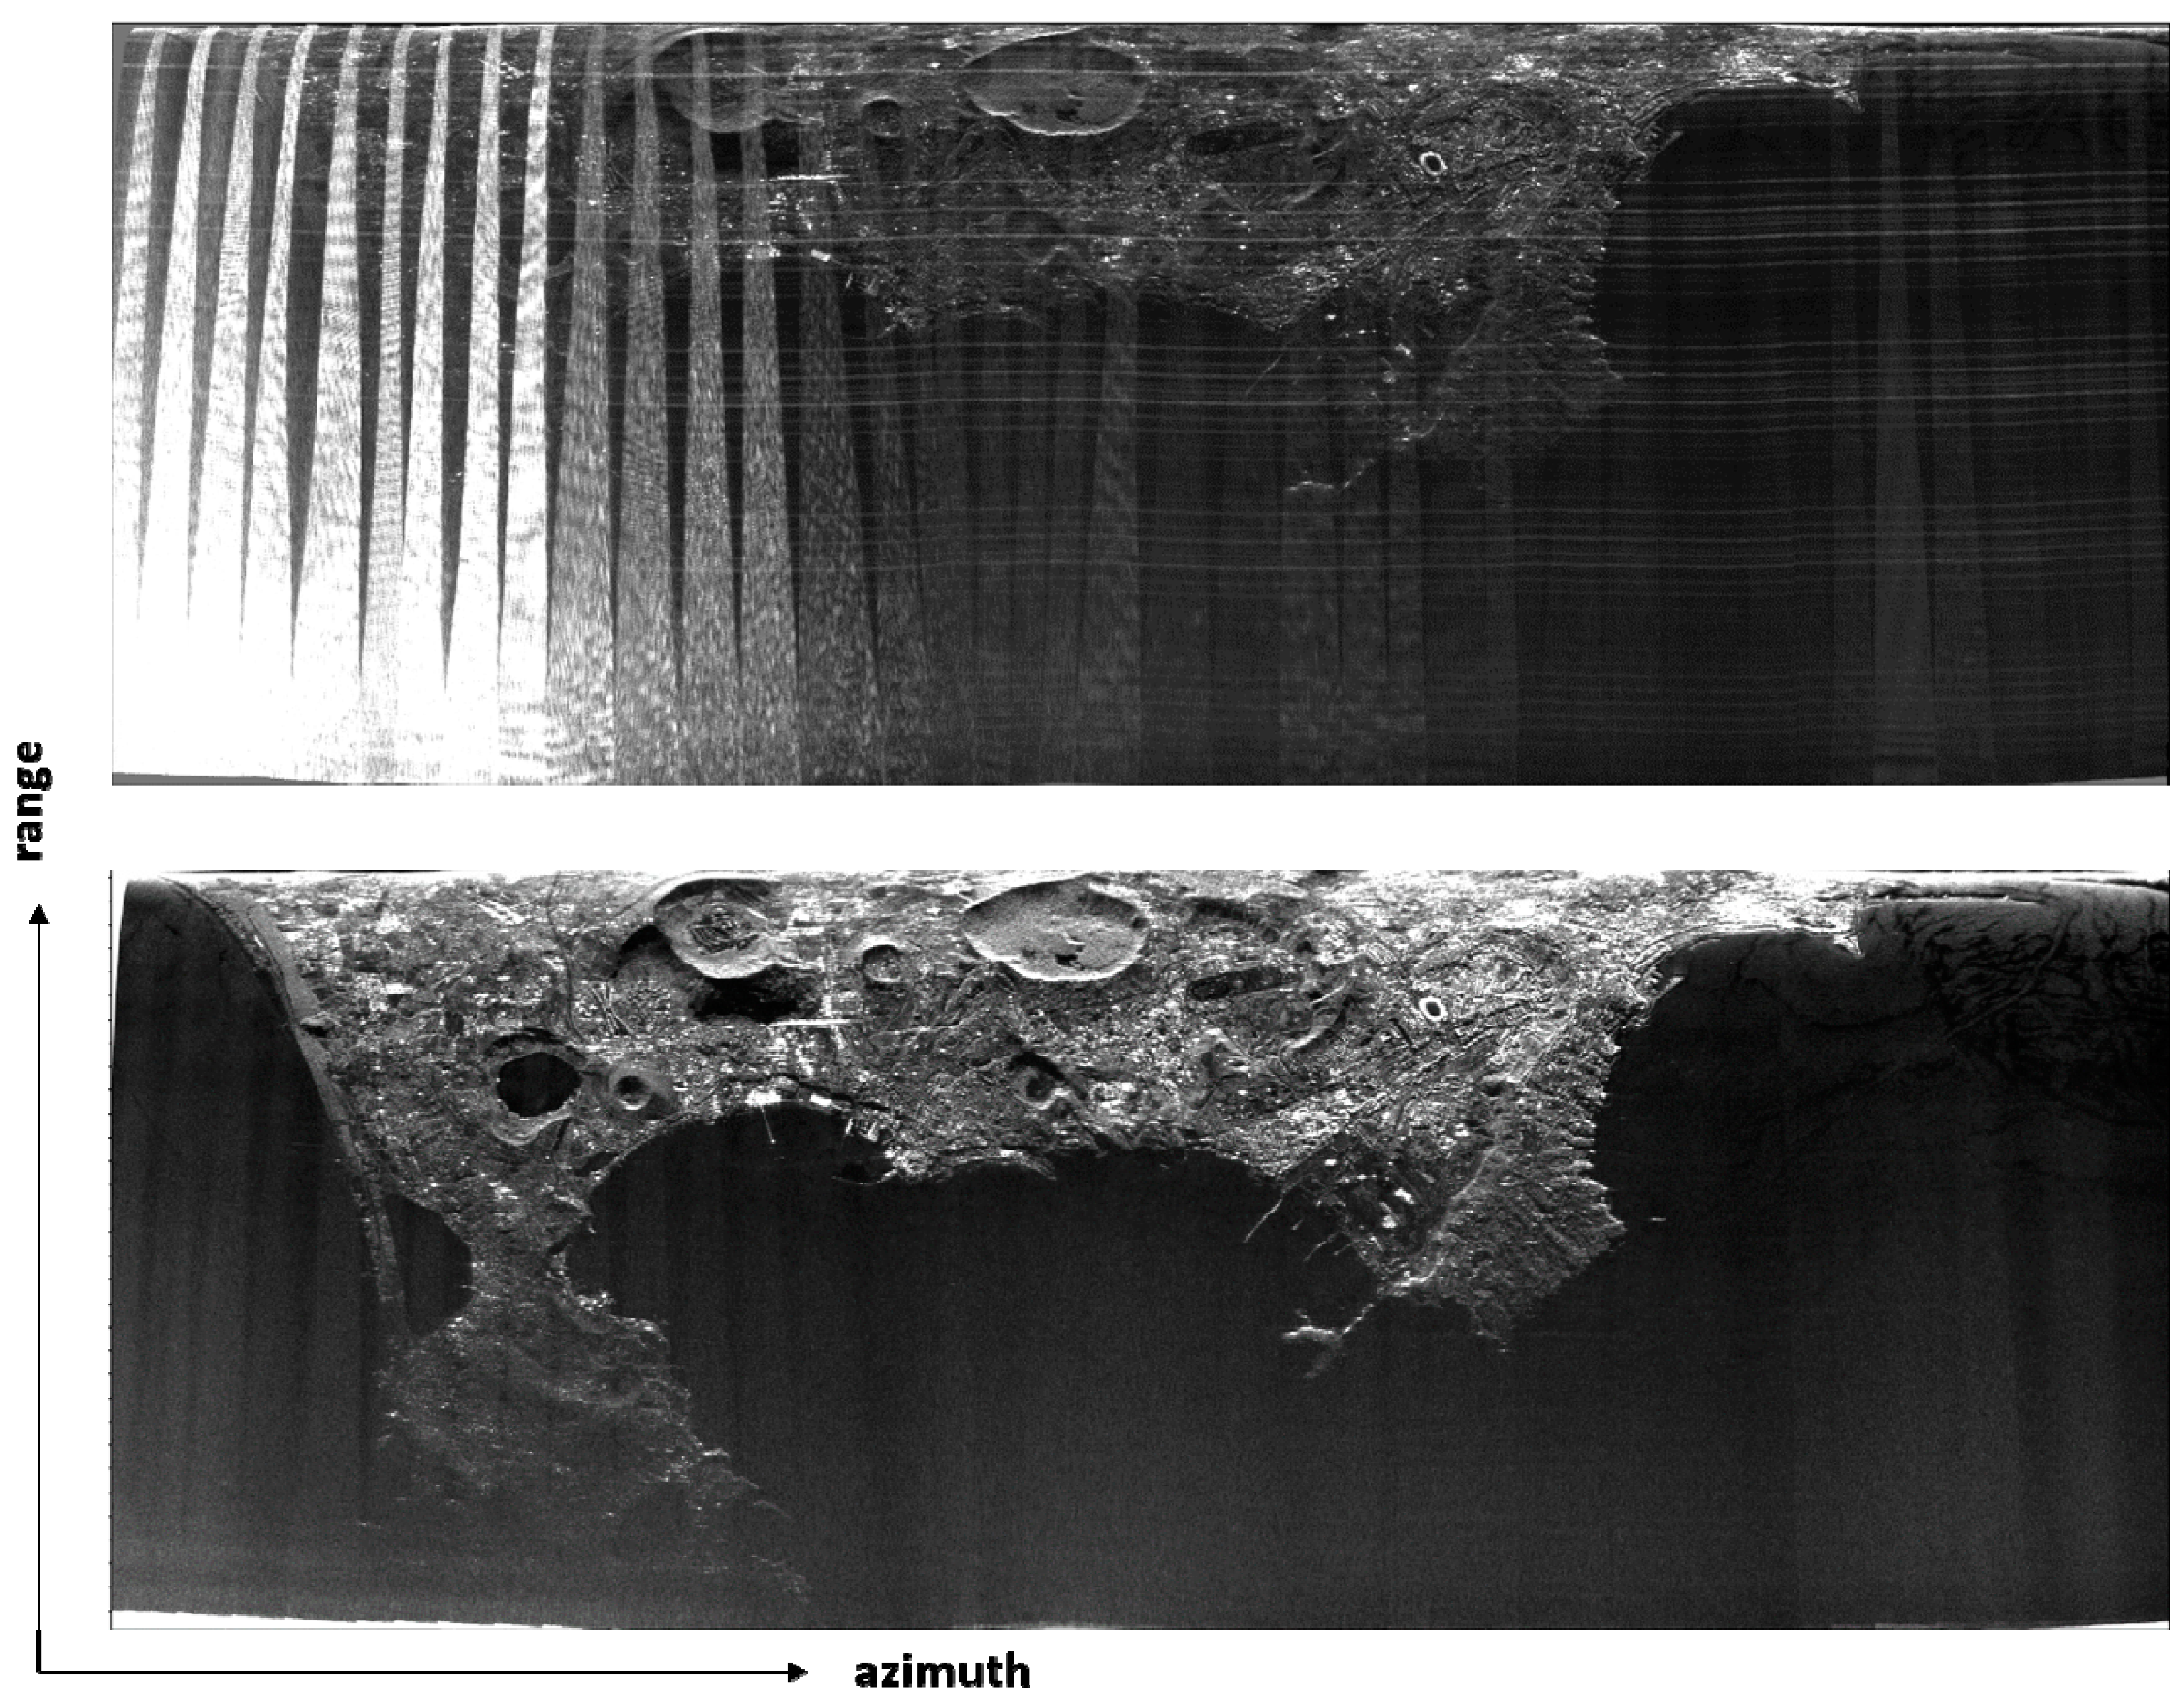
The data processing procedures are aimed, first of all, at generating Single Look Complex (SLC) images from the acquired raw airborne SAR data [1]. Following this step, named SAR focusing, other processing procedures are implemented to achieve higher-level SAR products, such as radiometrically calibrated SAR images, interferometric DEMs, soil moisture maps and so on.

SAR Focusing

SAR focusing is a 2-dimensional image processing procedure [1,29,30] that, in the airborne case, also involves compensation for the so-called motion errors, which affect the acquired radar data. Motion errors are caused by platform attitude instabilities and deviations of the trajectory from an ideal rectilinear planned track [42,43,44]. For this aim, knowledge of the phase center position and pointing direction of the radar antennas during the whole acquisition, as well as the availability of an external DEM of the illuminated scene [42,43,44], is needed. The overall procedure consists of the cascade of the following main operations:
(a)
processing of the navigation data;
(b)
Range Compression (RC) of the radar data;
(c)
Radio Frequency Interference (RFI) detection and removal at the range-compressed data level;
(d)
Azimuth Compression (AC) of the radar data.
Note that RFI detection and removal is an optional procedure, developed at IREA-CNR, which we apply only if RFI signals corrupt the acquired radar data. The processing of the navigation data is performed by using commercially available software, namely the APPLANIX POSPac MMS® tool. The remaining three procedures implement, mainly through the Interactive Data Language (IDL), algorithms jointly developed at IREA-CNR and University Parthenope. More details on the four processing procedures listed above are provided in the following paragraphs (a)–(d).
(a)
Processing of the navigation data
The processing of the navigation data is a delicate and fundamental procedure, especially when using radar data acquired at high operating frequencies (e.g., X, Ka and Ku bands). To achieve the needed centimeter level position measurement, it is necessary to correct systematic errors (related to the receiver, the satellites and propagation delays) by augmenting the basic GNSS system mounted on board the airplane. Specifically, we use the APPLANIX POSPac MMS® tool [33], which imports and processes data recorded by the Applanix INS/GNSS navigation system and by a network of reference stations.
(b)
Range Compression (RC) of the radar data
RC is an image processing operation whose specific implementation depends on the characteristics of the transmitted radar signal and, more generally, of the used radar system. In particular, when pulsed radar is used, RC is achieved through matched filtering [1,29,30]. Instead, in FMCW systems, RC is achieved by means of a signal beating procedure (typically carried out on board by the radar receiver) followed by a Fourier transform [28].
The implementation of the RC procedure on the IREA-CNR IT platform described in Section 2.2.1 exploits, to some extent, the multi-core capability of the platform. In particular, a parallel programming strategy is not adopted to carry out the RC of the data relevant to one flight track. Indeed, since this kind of procedure is not particularly time-consuming, a single job is responsible for it. However, to achieve the parallel RC of the raw data relevant to different flight tracks, different jobs are simultaneously executed on different WNs and cores available on the platform.
(c)
Radio Frequency Interference (RFI) detection and removal
This operation is aimed at filtering out interfering signals that could possibly corrupt the useful radar data. It is noted that RFI is typically relevant in the lower bands of the microwave spectrum, (e.g., L and P bands) [45,46]. The mitigation strategy that we adopt is based on a two-step RFI identification approach that works on RC SAR data [47,48], followed by a proper RFI suppression procedure. The first step of RFI identification acts only on the data samples relevant to the pre-nadir region and provides a rough estimate of the overall fraction of RFI-corrupted data. Based on this information, in the second step, RFI detection is carried out on the overall RC data by means of statistical tests applied azimuth by azimuth. Finally, the achieved detection results are used to drive a simple RFI suppression procedure easily integrated in the SAR focusing processor. Specifically, the latter treats the detected RFI as missing data.
As an example, in Figure 7, we report the results achieved with an L-band MIPS dataset acquired over the Campi Flegrei area of the Campania region, southern Italy, in 2021. In particular, the top panel reports the Multi-Look Complex (MLC) image achieved without applying any RFI filtering strategy, whereas the bottom panel reports the MLC achieved after applying the RFI filtering strategy proposed in [47].
As for the implementation of this processing procedure on the IREA-CNR IT platform, a single job is responsible for the processing of the data relevant to one flight track. To achieve parallel RFI detection and the removal of data relevant to different flight tracks, different jobs are simultaneously executed on different WNs and cores available on the platform.
(d)
Azimuth Compression (AC) of the radar data
AC is a fundamental processing step applied to RC SAR data with the aim of generating SLC SAR products. The algorithms that implement this procedure are divided into time domain and frequency domain algorithms.
Frequency domain algorithms [1], which are very computationally efficient, are well tailored to SAR data acquired from straight tracks. In the case of airborne SAR acquisitions, where the flight tracks are characterized by deviations from an ideal, straight track, original frequency domain algorithms must be properly adapted through the implementation of so-called MOtion COmpensation (MOCO) techniques [43,49,50,51], which involve approximations [52] to preserve the computational efficiency typical of the original algorithms. As a matter of fact, the more significant the track deviations, the more unsuitable the MOCO approximations and the greater the impact on the quality of the achieved SLCs [44].
On the other hand, time domain algorithms [42,53,54,55,56,57], often referred to as back projection algorithms (BPAs), do not use approximations and are very accurate, regardless of the characteristics of the acquisition track. Indeed, they operate on a pixel-by-pixel basis, thus being suited to handling arbitrary and nonlinear flight paths. Moreover, they allow for the processing of data in coordinates other than the native slant range azimuth, e.g., directly in cartographic coordinates. These advantages come at the cost of computational efficiency, which is generally worse than that of frequency domain algorithms. To overcome this drawback, in recent years, many efforts have been devoted to develop algorithms aimed at reducing the computational effort required by time domain approaches [54,55,56,57]. Moreover, the recent widespread proliferation of multi-core hardware architectures, coupled with the development of parallel programming solutions, has helped to reduce even more the processing time required by time domain algorithms, which, as observed above, are based on a pixel-by-pixel approach, resulting intrinsically tailored to parallel processing strategies.
In the processing chain of the IREA-CNR infrastructure, we implement a time domain algorithm that was recently developed and presented in [42]. The algorithm accounts not only for flight track deviations but also for the space variant nature (in both range and azimuth direction) of the squint angle induced by variations in the pointing direction of the radar antenna during acquisition. More specifically, to focus each target, we first calculate the antenna-to-target distance by using an available external DEM of the observed area and the flight data recorded by the navigation system. Then, we evaluate the number of samples of the synthetic aperture length according to the desired azimuth resolution. Finally, we use the navigation data to select the track portion from which the radar antenna illuminates the considered target within its main beam [42]. Finally, it is remarked that the AC step may be integrated with data processing procedures aimed at estimating some electronic parameters necessary for the accurate implementation of the AC step itself [40,41].
The implementation of this time domain AC procedure on the IREA-CNR IT platform takes full advantage of the multi-core capability of the platform. Indeed, a parallel programming approach is implemented for each image to be focused by splitting the corresponding output grid into a number of portions equal to the number of WNs and cores available on the platform. A set of independent jobs (one for each portion of data to be focused) is then executed on the selected WNs and cores. The procedure is managed by Linux Bash scripts concurrently running on the different WNs and cores. Following this parallel computation, a straightforward mosaicking of the different portions of the focused data is carried out to achieve the final SLC. The same rationale is also applied to achieve the parallel generation of different SLCs; in this case, each job is responsible for the processing of one portion of one image of the selected dataset.

Higher-Level Products

Following the SAR focusing step, the overall data processing chain of the IREA-CNR infrastructure, as mentioned above, also includes some processing steps leading from SAR SLCs to higher-level products, such as radiometrically calibrated images, DEMs and polarimetric maps. More details on the generation of these higher-level products are provided in paragraphs (a)–(c).
(a)
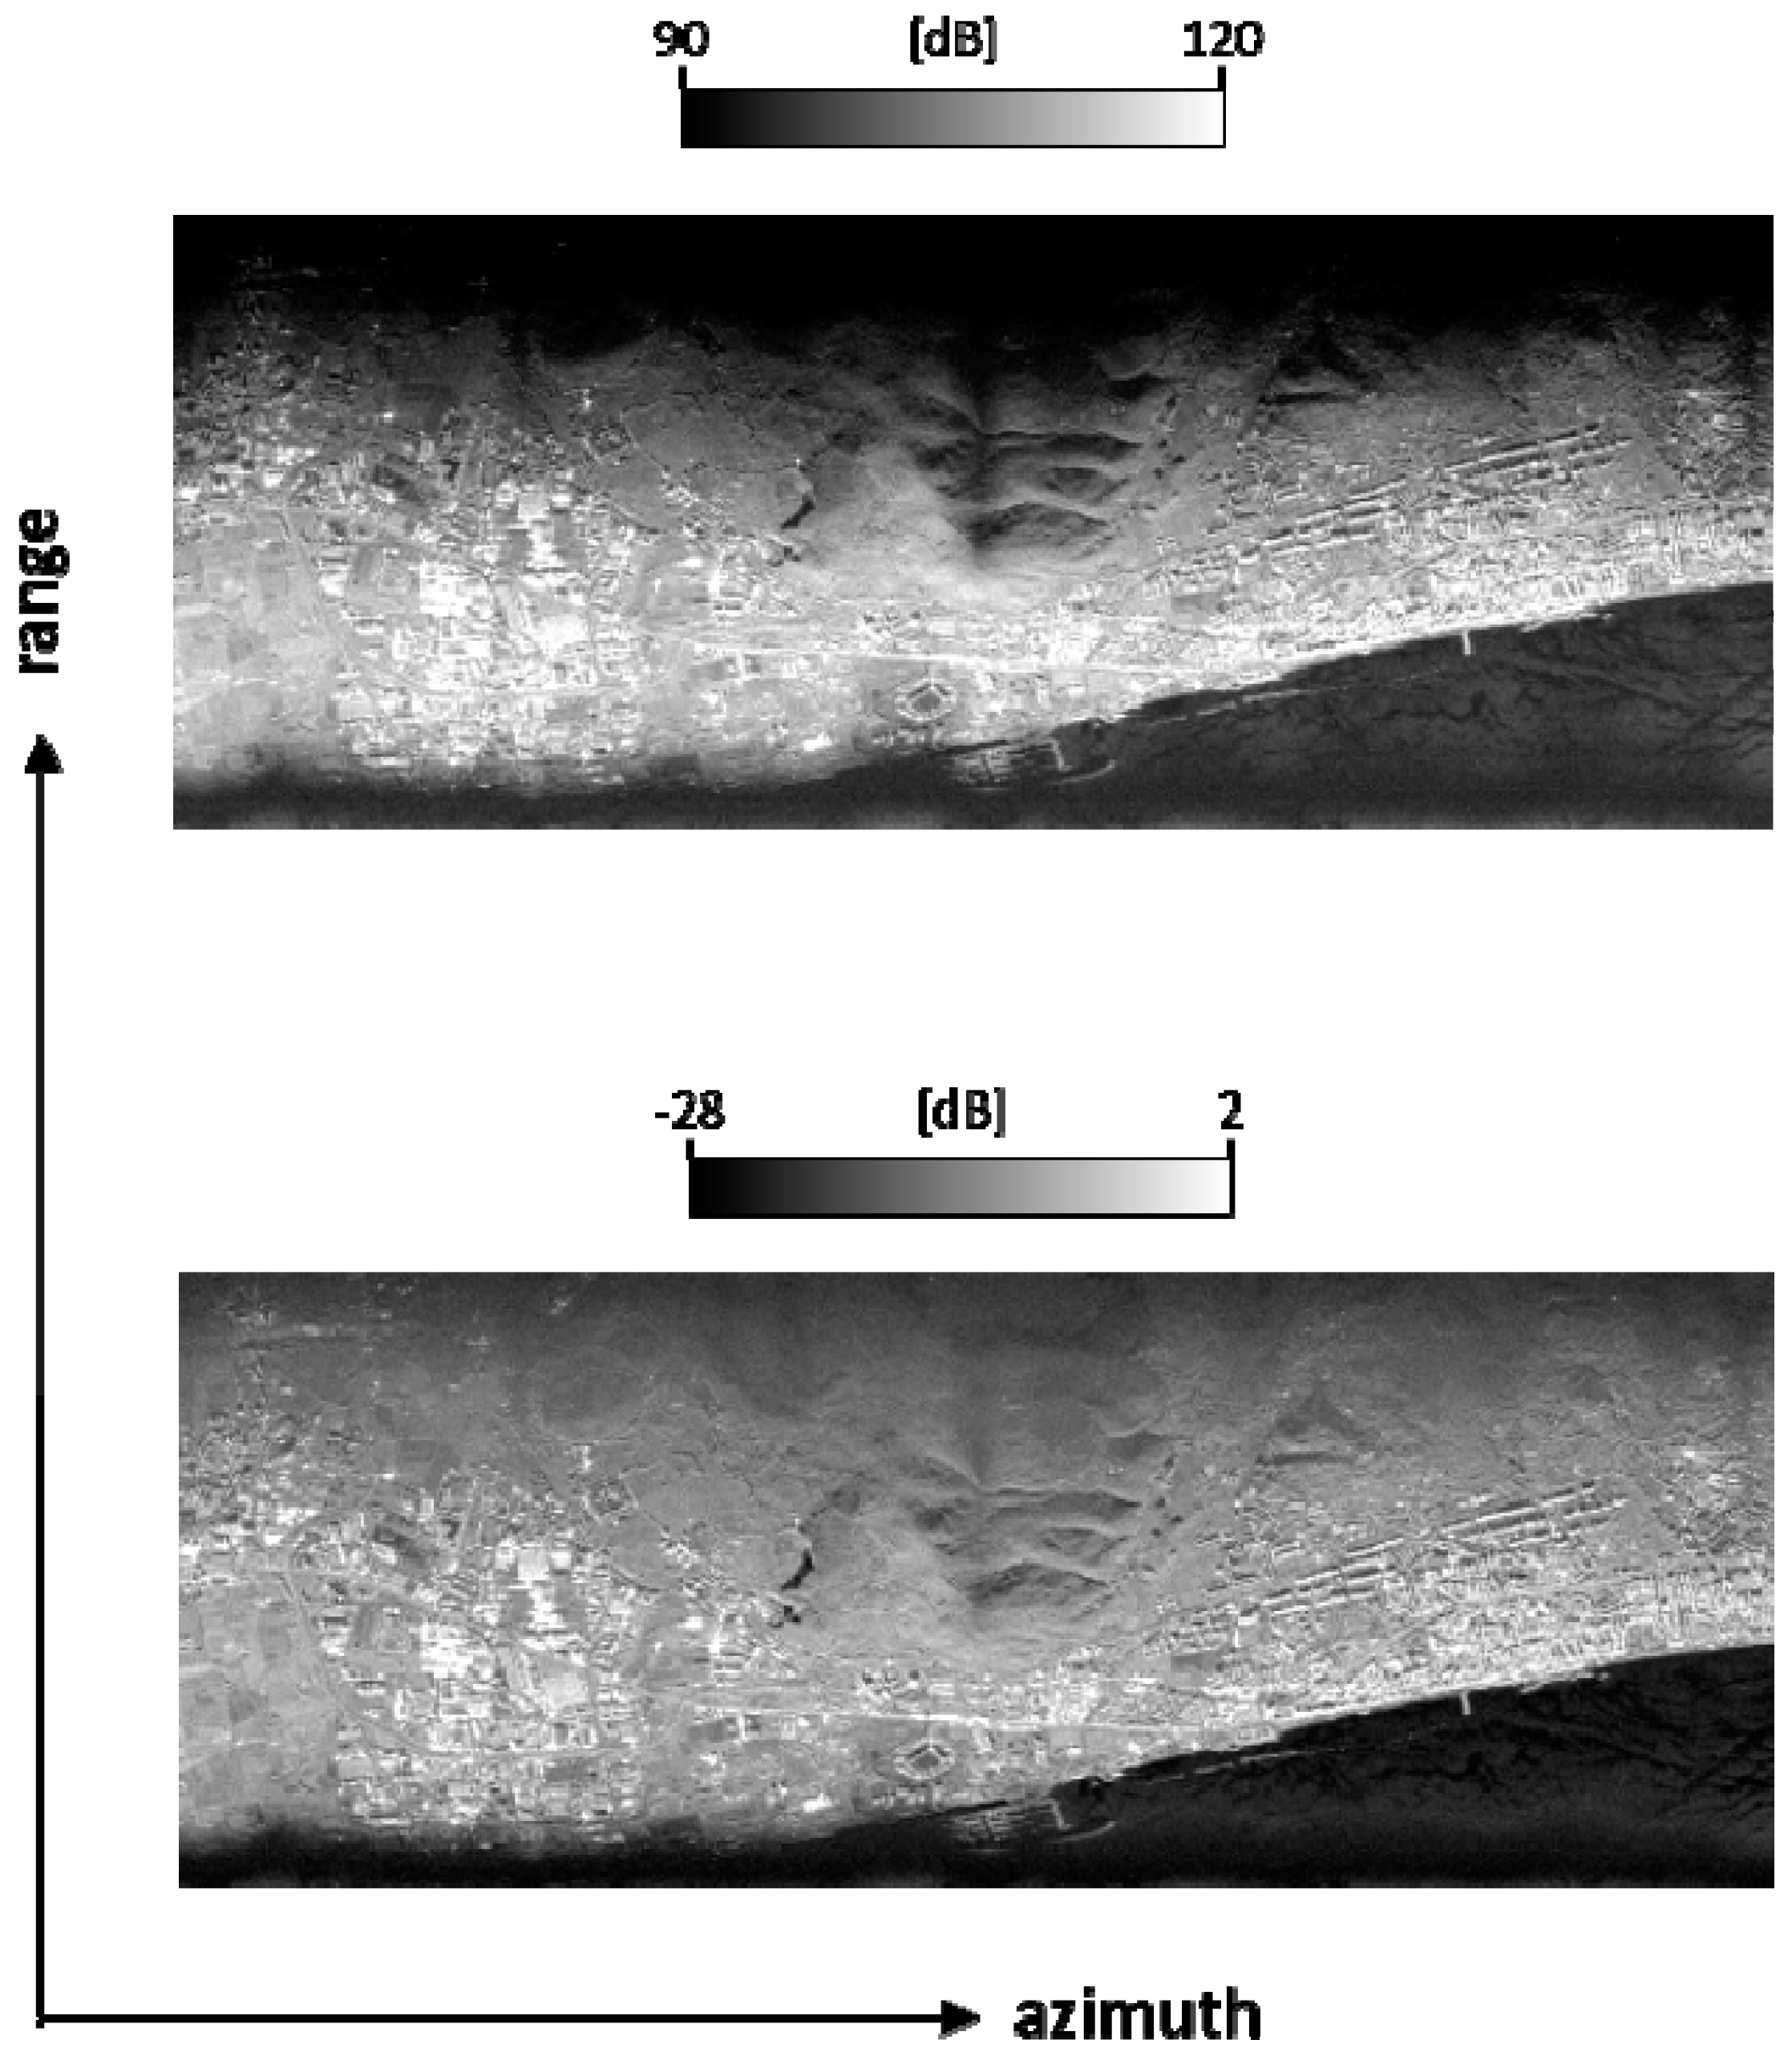
External Radiometric Calibration
External radiometric calibration is a procedural step used to convert the Digital Numbers (DNs) that compose SLC images into meaningful physical descriptors for the targets in the observed scene, such as the Normalized Radar Cross Section (NRCS). To this end, based on the radar equation, the procedure aims at compensating for constant and variable factors introduced into the recorded signals by the radar electronics, the SAR acquisition geometry, the surface topography and the focusing procedure [58]. In particular, radiometric calibration is typically split into the following two steps: relative and absolute calibration. Relative calibration compensates for the space variant terms that account for the range spreading loss, the used Tx/Rx radar antenna patterns, the azimuth compression gain and topography dependent radiometric distortions [59,60]. Depending on the particular processing needs, this step can be performed during the SAR focusing operation or using post-processing approaches applied to uncalibrated SLC images. Afterwards, the absolute calibration of such images is achieved by exploiting illuminated targets with known scattering characteristics, such as CRs [60]. As an example, in Figure 8 (bottom image) we report the Sigma Naught map [60] achieved applying the IREA-CNR SAR data processing to X-band MIPS data acquired over the Salerno coastline within the Campania region, southern Italy, in 2021.
Similarly to the RC and RFI detection and removal processing steps, a single job on the IREA-CNR IT platform is responsible for the calibration of one entire SLC, whereas to achieve the parallel calibration of different SLCs, different jobs are simultaneously executed on the different WNs and cores available on the platform.
(b)
Polarimetric Processing
Proper combinations of SAR data acquired at different polarizations allow us to characterize complex scenarios and to extract key parameters related to both natural and man-made targets [3].
As remarked above, the MIPS system of the IREA-CNR infrastructure can operate with a fully polarimetric configuration in the L band. Some activities relevant to the polarimetric calibration of MIPS data for the compensation of undesired effects, such as channel imbalances or polarimetric crosstalk [61,62], are matter of current work. Moreover, MIPS acquisition campaigns in the L band are planned for the near future, with the aim of collecting polarimetric datasets to be used for the retrieval of ground parameters, such as, for instance, soil moisture. In this regard, the SAR data processing chain available at IREA-CNR already embeds a number of procedural steps applied in the past to multi-polarized SAR data acquired by other aerial sensors [24] to provide either basic or added value products. Specifically, algorithms for the generation of widely employed (e.g., Pauli, Freeman, and Cloude) polarimetric decomposition maps useful for scene classification purposes [3] are included in the IREA-CNR SAR data processing chain. As an example, in Figure 9 we report the Pauli decomposition map (right image) achieved by the IREA-CNR SAR data processing chain with a fully polarimetric set of P-band SAR data acquired by the Italian Space Agency (ASI) helicopter borne sensor over the Manfredini area of the Apulia region, southern Italy, in 2021. Model based inversion procedures of polarimetric SAR data for the retrieval of surface parameters, such as ground roughness, soil permittivity and soil moisture content are available as well [63,64,65,66].
The implementation of the polarimetric processing on the IREA-CNR IT platform once again exploits the multi-core capability of the platform to process different polarimetric datasets relevant to different flight tracks. For this processing step, a single job is responsible for the entire processing of the polarimetric dataset relevant to one flight track.
(c)
Interferometric Processing
The interferometric processing allows for the generation of interferometric products, such as DEMs or surface deformation maps [1,2,4], starting from single pass and/or repeat pass interferometric pairs of SLCs.
As remarked in Section 2.1, the MIPS system of the IREA-CNR infrastructure may operate at two different carrier frequencies. In particular, it is equipped with a single pass InSAR configuration in the X band. Accordingly, the IREA-CNR SAR data processing chain is, first of all, tailored to the generation of single pass InSAR DEMs. It is remarked that this is a key activity in the framework of the agreement with the Department of Civil Protection of the Italian Presidency of the Council of Ministers for the monitoring of effects related to eruptive activities. By referring to the standard InSAR processing [1,2,4], the IREA-CNR chain overcomes the co-registration procedure [1], since the BP algorithm described in Section 2.2.4 is capable of generating SLCs in arbitrary output grids (that is, geometric coordinate systems). Therefore, all SAR SLCs of the considered InSAR datasets are generated with respect to the same output grid. Following the interferometric beating, the phase unwrapping procedure [67,68,69,70,71,72,73,74] is implemented through the generalized approach for sparse data [73,74]. Then, the constant offset of each unwrapped interferogram is estimated using the STopBE [75] or IPBE [76] method, which exploit CRs properly deployed in the observed area or an available external DEM when CRs are not present in the monitored zone. Finally, a pixel-by-pixel and target dependent phase-to-height conversion procedure is applied [1]. In particular, we apply a strategy that exploits the actual trajectory of the aircraft and takes into account the changing pointing direction of the antenna. First single pass InSAR experiments with data acquired by the X-band MIPS system were conducted over the volcanic area of Stromboli, Italy [31,32]. A more detailed discussion of such experiments is provided in the next section.
Turning to the processing of airborne repeat pass InSAR data, this procedure is generally more complicated than the processing of single pass InSAR data because the motion errors and the attitude variations affecting two generic interferometric acquisitions are independent of each other. Therefore, they do not tend to compensate for each other as in the case of single pass InSAR acquisitions. Generally speaking, airborne repeat pass InSAR is more critical at higher frequencies [44] for different reasons. First, the higher the frequency, the more sensitive the radar system is with respect to the errors induced by the inaccuracy of the navigation system mounted on board the airplane [44]. Secondly, for a fixed azimuth resolution, at higher frequencies the same squint angle difference between the two generic repeat pass InSAR acquisitions produces a higher relative Doppler shift between the two corresponding images [1]. Thirdly, the lower the frequency, the higher the temporal coherence [1] of repeat pass interferograms. For this reason, among the two operative frequencies of the MIPS system, the L-band is more appropriate for repeat pass InSAR applications. The IREA-CNR InSAR data processing chain is currently capable of dealing with interferometric acquisitions characterized by different squint angles, as is the case for single pass cross-eyed InSAR acquisitions [42], and by different motion errors. The performance assessment of this processing procedure with repeat pass MIPS data acquired in the L-band is a matter of ongoing work.

3. Results

Within the framework of the abovementioned agreement with the Department of Civil Protection of the Italian Presidency of the Council of Ministers, IREA-CNR has collected an archive of airborne SAR data with the aim of generating multi-temporal, single pass InSAR DEMs of the Stromboli volcano [77] to support the monitoring activities of the Department in this active volcanic area.
To show the capabilities of the overall IREA-CNR airborne SAR infrastructure, we selected from this archive an X-band MIPS dataset acquired during the mission of September 2022. During this mission, the MIPS system was installed on board a Cessna 172 airplane operating at 2.5 km altitude with a mean velocity of 48 m/s. The departure/landing airport was located in Grumento Nova, Potenza, Basilicata region, southern Italy. The selected dataset consists of eight InSAR acquisition datasets acquired from eight straight tracks describing two concentric closed circuits surrounding the island (see Figure 10). It is remarked that, depending on the considered flight track, only a portion of the volcano is visible. Moreover, the shadow and layover effects [1] are particularly relevant due to the flight altitude, the radar look angles and the topographic height of Stromboli. To mitigate all these effects, we planned the two closed and concentric circuits shown in Figure 10. A set of 16 CRs was deployed near the departure/landing airport, since it was not possible to deploy them directly over the monitored area. Moreover, all the remaining ground segment activities described in Section 2.2.3 were accomplished.
In the following, we show the main results achieved by applying the IREA-CNR SAR data processing chain described above to this specific dataset. Table 2 reports the main processing parameters set for the SAR focusing procedure and, subsequently, for the InSAR processing. Figure 11 reports the amplitude of one MLC relevant to the area where the CRs were deployed. In particular, eight CRs (highlighted by circles) are visible; the other eight CRs were, indeed, oriented in such a way to be visible in a radar acquisition carried out from a direction antiparallel to that considered in Figure 11. For the sake of brevity, the MLC (where the other eight CRs are visible) relevant to this anti-parallel track is not reported here. In any case, in both the corresponding SLCs, we measured the achieved geometric resolution for each imaged CR. The results are summarized in Table 3, where the CRs are clustered into two groups depending on their orientation (that is, depending on the SLC within which they are imaged). As it can be seen, the achieved resolution is very close to the theoretical resolution. For the sake of completeness, Figure 12 shows the azimuth (left panel) and range (right panel) cuts of the SLC amplitude image in correspondence with the CR highlighted by the green circle in Figure 11.
With reference to the eight tracks shown in Figure 10, in Figure 13 and Figure 14 we present some products of the IREA-CNR processing chain relevant to the four tracks of the internal circuit depicted in the figure. Similar results not shown here for brevity were also obtained for the other four acquisitions. In particular, Figure 13 reports the calibrated amplitudes of four MLC SAR images (one for each considered straight track). Figure 14 shows the corresponding modulo-2π interferograms (one for each considered straight track) achieved by removing the topographic contribution obtained from the external DEM exploited during the SAR focusing procedure. Specifically, the external DEM is a LiDAR-derived model dated to 2012 and characterized by a geometric resolution of 50 cm and a vertical error of 15 cm [78]. From the eight obtained interferograms (one for each straight track of each circuit in Figure 10), we obtained the corresponding DEMs, which were then properly mosaicked to achieve the final DEM reported in Figure 15.
Note that all images reported in Figure 13, Figure 14 and Figure 15 are geocoded and superimposed over a Google Earth image.
Some further considerations are now in order.
First, we stress that the processing of the SAR data was limited to the area covered by the available external DEM. Furthermore, we remark that the InSAR fringes observable in Figure 14 on the crater terrace of Stromboli and on the area known as Sciara del Fuoco [77] provide information about the topographic differences measured by the MIPS sensor and the external DEM used during the SAR focusing procedure. It is recalled that this external DEM is dated to 2012; therefore, the abovementioned fringes are due to the cumulated topographic variations induced by the volcanic activities that occurred in the past 10 years. Finally, we observe that, according to the Cramer–Rao bound reported in [79], the generated InSAR DEM is characterized by a height error with standard deviation on the order of 1.5 m.

4. Discussion

We now analyze the capabilities of the IREA-CNR infrastructure to support the monitoring activities required in a possible emergency scenario. To this end, we consider the case study presented in Section 3, which, as remarked above, was conducted within the framework of the agreement with the Department of Civil Protection of the Italian Presidency of the Council of Ministers, aimed at creating an infrastructure for the periodic monitoring of volcanic areas, and capable of being rapidly operative during crisis events. In this context, the response time of the infrastructure represents a key parameter that needs to be analyzed.
For the IREA-CNR airborne SAR infrastructure described above, this response time basically depends on the following three main terms: the activation time of the airborne SAR sensor; the time required for data download and transfer; and the processing time needed to generate the final product that, in the test case of Section 3, is represented by the final InSA-derived DEM.
To evaluate the activation time of the MIPS system, we recall that the system is not permanently installed on one specific airplane. Therefore, as described in Section 2.2.3, the execution of each acquisition campaign involves the installation of the instrumentation on an aircraft and the measurement of the radar antenna lever arms. The activation time of the MIPS system, thus, depends on the time required by these procedures, along with the time needed for the aircraft to reach the area of interest and the operational flight altitude once it has departed.
The assembly of the MIPS sensor on board an aircraft generally requires the intervention of two operators for a time of approximately 3 h.
Since the antenna positions may slightly change for each installation, it is mandatory to measure the antenna lever arms after the installation of the system on the aircraft. This activity generally requires the intervention of a surveyor and his staff collaborators (at least one person) for a time of approximately 5 h, including the time required for the proper processing of the measurement data. To save time, this operation is typically performed after the radar data acquisition, during the data download and transfer. In this regard, it is observed that if the antennas and the navigation system were jointly bound to the same physical structure, the lever arms would not change for each installation of the system on board an aircraft; therefore, they could be measured only once.
Reaching the operational flight altitude of the aircraft strongly depends on the air traffic and weather conditions. Under ideal conditions, this phase requires approximately a bit more than twenty minutes. This duration is generally shorter than that required for the airplane to reach the area of interest and to come back after the radar acquisition. In the case at hand, the time required to reach the Stromboli area from the airport was on the order of 1 h and half. Moreover, considering the flight autonomy of the used airplane, the radar acquisitions along the two circuits shown in Figure 10 were split into two missions in the same day, for a total of about 10 h.
Turning to the time required for data download and transfer, for the Stromboli campaign the download of data onto hard disks took place at the departure/landing airport, which is about 200 km far from the IREA-CNR laboratory. The hard disks were then physically transferred using a car. The overall procedure took about 5 h.
Regarding the time required to process the SAR data, we, first of all highlight that, overall, 130 GByte of data were recorded during the eight considered single pass InSAR acquisitions. For each acquisition, the range dimension of the SAR raw data was about 4 k samples, whereas the azimuth dimension changed from 110 to 180 k samples, depending on the used circuit trace. No presuming and no decimation filtering was applied. To process the SAR data, a common reference radar output grid, characterized by a spatial sampling of 75 cm in range and 4 cm in azimuth, was assumed for all the images relevant to the same flight track.
Concerning the processing of the navigation data, the integration of data recorded by the system mounted on board the aircraft and the data derived from the Crustal Dynamics Data Information System (CDDIS) and two Italian networks, namely the Rete Integrata Nazionale GNSS (RING) of the Istituto Nazionale di Geofisica e Vulcanologia (INGV) and the Permanent Stations Network of the Campania Region, was carried out by means of the APPLANIX POSPac MMS® tool [33]. For the case at hand, this procedure took about 2 h.
The external DEM was first downloaded onto the IREA-CNR IT platform. Then, the area of interest was cut out and converted onto the reference radar output grid. For this procedure, it is necessary to reserve a dedicated time of about a couple of hours. It is noted that in the case of repeated SAR acquisitions in the same area, this procedure is performed only once. Conversely, in the case of unscheduled acquisitions, as in the case of natural disaster monitoring in areas not previously illuminated by radar, this procedure must be executed before the processing of the acquired SAR dataset.
As observed above (see Table 2), the 16 SLC images (two single pass InSAR SLCs for each straight acquisition track in Figure 10) were focused with a geometric resolution of 75 cm in range and 27 cm in azimuth following the procedure described in Section 2.2.4. Since the overall acquired X-band dataset turned out to be unaffected by RFI, the procedure aimed at detecting and removing these interferences was not applied. Following the generation of the SLCs, the InSAR processing procedure described in Section 2.2.4 was applied, along with a complex multi-look procedure bringing the interferometric products to a resolution of 1.5 m in range and 2 m in azimuth (see again Table 2). The processing time required by the PhU procedure, the STopBE phase offset estimation and the phase-to-height conversion procedure (see Section 2.2.4) is much shorter than that related to the focusing procedure, which represents the most time-consuming processing step. In the considered test case, 12 h of computing time were required to execute the overall data processing chain, allowing us to generate, from the SAR raw data, the final mosaicked DEM shown in Figure 15. It is stressed that achieving such a relatively limited processing time was possible due to the parallel programming strategies adopted for all the data processing steps, particularly the AC procedure performed in the time domain (see Section 2.2.4), with the aim of taking advantage of the multi-core capability of the IREA-CNR IT platform. In particular, we used up to 448 cores of the platform. Note that with only one core and the same computing time (12 h), just a portion of only one SLC characterized by 2000 range and 23,000 azimuth lines can be focused.
Summing up, to evaluate the current response time of the presented IREA-CNR airborne SAR infrastructure in a possible emergency scenario, it must be, first of all, considered that the activation time of the MIPS sensor is on the order of 3 h, without accounting for the time needed for the operators responsible for instrument installation to be operational at the airport. Moreover, according to the flight autonomy of the specific airplane used in the Stromboli campaign case study, it must be also considered that the duration of one flight mission is on the order of 4 h. Generally, depending on the distance between the airport and the area of interest, as well as on the extension and the characteristics of the latter, one acquisition campaign typically requires at least a couple of missions for each operational mode of the system. Therefore, once the MIPS system is activated, at least 10 h are necessary to conclude the overall campaign. More generally, if we intend to fully exploit the multi-frequency capabilities of the MIPS system, we have to consider acquisition campaigns consisting of a greater number of flight missions. In this case, the corresponding time loss could be managed by separately processing the data acquired in the different flight missions of the same campaign. However, to effectively apply such a strategy, it is necessary to reduce the currently required time for data download and transfer, which, in the considered case study, was on the order of 5 h. Finally, the time required to execute the overall data processing chain must be considered, particularly the AC step, which is performed in the time domain to guarantee the high accuracy of the focused SLCs. As remarked above, to reduce the processing time, the overall data processing chain of the IREA-CNR infrastructure is based on a parallel programming strategy to take advantage of the multi-core capability of the IT platform of the infrastructure. Exploiting these features for the considered case study allowed us to process about 130 GByte of radar data in 12 h of computing, achieving 16 SLCs with 75 cm × 27 cm (range × azimuth) resolution covering the entire Stromboli island and a final DEM of the island with 2 m × 2 m (range × azimuth) resolution and a height error with a standard deviation on the order of 1.5 m.

Future Perspectives

A number of activities are already planned for the future to further exploit and strengthen the current capabilities of the IREA-CNR infrastructure.
In particular, the next MIPS acquisition campaigns are aimed at fully exploiting the L-band mode of the system. Specifically, L-band campaigns are planned for the near future to collect polarimetric SAR datasets for the retrieval of ground parameters such as soil moisture. Moreover, L-band repeat pass InSAR acquisitions are planned to retrieve ground deformation fields through the use of the DInSAR technique [2].
Furthermore, a number of actions supported by already assigned funds are currently being carried out to strengthen the infrastructure. In particular, as discussed in Section 2.2.3, the current data download and transfer procedures are quite time-consuming, because the hard disks where the data are downloaded at the end of the mission have to be manually transferred to the IREA-CNR laboratory. To speed up this overall procedure, in the near future, we plan to download and transfer the data using satellite Internet constellation links. Furthermore, as a part of the “Next Generation EU Mission 4—Project IR0000032—ITINERIS”, a fully polarimetric pulsed multifrequency SAR system will be acquired. The latter will allow for the expansion of the operational scenarios of interest for the infrastructure, guaranteeing higher operational flight heights with respect to those currently achievable with the MIPS system based on the FMCW technology. In addition, within the framework of the same project, five computing nodes, which will be added to the IT platform described in Section 2.2.1, will be acquired to further increase its dedicated multi-core capabilities

5. Conclusions

In this work, the capabilities of the airborne SAR infrastructure developed at IREA-CNR have been presented. The infrastructure consists of a flight segment and a ground segment. The flight segment includes the MIPS SAR system based on FMCW technology and operating with a single pass InSAR configuration in the X-band or with a fully polarimetric configuration in the L-band. The MIPS sensor is mounted on board chartered aircraft, since IREA-CNR is not equipped with its own aircraft. The ground segment includes a multi-core IT platform for data storage and processing and an SAR data processing chain, allowing us to generate added-value products, such as soil moisture maps, DEMs, ground motion maps and so on, from the acquired raw SAR data. The data processing chain jointly developed by IREA-CNR and Università Parthenope was designed to guarantee the high quality of the final products through the use of a time domain focusing strategy while ensuring sound processing times due to the implementation of a parallel programming strategy that takes advantage of the multi-core capability of the IT platform of the infrastructure.
Overall, the infrastructure masterfully frames the current and upcoming objectives of the remote sensing sector and allows IREA-CNR to plan and execute airborne SAR campaigns and to process the acquired data. We further remark that the infrastructure is aimed, first of all, at developing research activities; however, it also represents a valuable support for the emergency prevention and management activities of civil protection authorities.
The technical aspects related to the flight and ground segments of the infrastructure have also been presented. In particular, some preliminary products (namely, an RFI-filtered SLC) achieved with MIPS L-band data were reported. In this regard, it is stressed that MIPS acquisition campaigns in the L-band are planned for the very near future, with the aim of collecting polarimetric datasets to be used for the retrieval of ground parameters such as the soil moisture and repeat pass InSAR datasets for the application of the DInSAR technique. More advanced products achieved with MIPS X-band data were also presented. In particular, the results of the single pass InSAR processing chain leading to the generation of a DEM of the volcanic area of Stromboli, southern Italy, were reported.
The capabilities of the infrastructure were also analyzed within the framework of the activities that IREA-CNR carries out as the National Centre of Competence of the Department of Civil Protection of the Italian Presidency of the Council of Ministers with the short time target of creating an infrastructure for the periodic monitoring of volcanic areas, and capable of being rapidly operative during crisis events. In this context, the airborne infrastructure capabilities were analyzed in terms of response times and characteristics of the final products. In particular, the Stromboli dataset mentioned above was considered as a real case study. The considered airborne dataset consists of eight X-band single pass interferometric MIPS acquisitions corresponding to about 130 GByte of radar data, which guarantees full coverage of Stromboli Island. The entire SAR data processing procedure required twelve hours of computing time, exploiting up to 448 cores of the IT platform of the infrastructure and allowing us to generate 16 SLCs with 75 cm × 27 cm (range × azimuth) resolution and the final DEM of the island, with 2 m × 2 m (range × azimuth) resolution and a height error with a standard deviation on the order of 1.5 m. The complete budget for response time also includes the time required to install the system on board an aircraft and the time required to complete the entire acquisition campaign, which, for the case at hand, consisted of two flight missions for a total of about 10 h. According to the presented analysis, we can safely conclude that the IREA-CNR airborne SAR infrastructure already represents a valuable tool for the periodic monitoring of selected areas. As for the ability of the infrastructure to be operative during crisis events, according to the presented analysis, which does not account for downtime and the actual availability of dedicated manpower, we can reasonably estimate, for the presented case study, a response time on the order of a couple of days.
Finally, it is underlined that although the presented analysis is relevant to a specific case study represented by the monitoring of a volcanic area, it provides indications for the general capacity of the infrastructure to provide a rapid response to a wide variety of extreme sudden events, such as floods, earthquakes and so on.

Author Contributions

Conceptualization, C.E., A.N., R.L., P.B. and S.P.; methodology, software and validation, C.E., A.N., R.L., P.B. and S.P.; investigation, C.E., A.N., R.L., P.B. and S.P.; data curation, C.E., A.N., P.B. and S.P.; writing—original draft preparation, C.E. and S.P.; supervision, S.P. All authors have read and agreed to the published version of the manuscript.

Funding

This work was supported, in part, by the Italian Department of Civil Protection (DPC) within the framework of the DPC-IREA Agreement (2022–2024), although it does not necessarily represent official DPC opinion and policies. This research was also partially funded by the EU Project—Next Generation EU Mission 4 “Education and Research”—Component 2: “From research to business”—Investment 3.1: “Fund for the realisation of an integrated system of research and innovation infrastructures”—ITINERIS—Italian Integrated Environmental Research Infrastructures System and in part in the GRINT (PIR01_00013) project funded by the Italian Ministry for Universities and Research (MUR).

Data Availability Statement

Restrictions apply to the datasets exploited for this article. Data acquisition has been indeed carried out in the frame of funded projects: the datasets are thus subject to the restrictions imposed by non disclosure agreements signed with the partners.

Conflicts of Interest

The authors declare no conflicts of interest. The funders had no role in the design of the study; in the collection, analyses or interpretation of data; in the writing of the manuscript; or in the decision to publish the results.

References

  1. Franceschetti, G.; Lanari, R. Synthetic Aperture Radar Processing; CRC: Boca Raton, FL, USA, 1999. [Google Scholar]
  2. Moreira, A.; Prats-Iraola, P.; Younis, M.; Krieger, G.; Hajnsek, I.; Papathanassiou, K.P. A tutorial on Synthetic Aperture Radar. IEEE Geosci. Remote Sens. Mag. 2013, 1, 6–43. [Google Scholar] [CrossRef]
  3. Lee, J.; Pottier, E. Polarimetric Radar Imaging: From Basics to Applications; CRC Press: New York, NY, USA, 2009. [Google Scholar]
  4. Bamler, R.; Hartl, P. Synthetic aperture radar interferometry. Inverse Probl. 1998, 14, R1–R54. [Google Scholar] [CrossRef]
  5. Massonnet, D.; Rossi, M.; Carmona, C.; Adragna, F.; Peltzer, G.; Feigl, K.; Rabaute, T. The displacement field of the Landers earthquake mapped by radar interferometry. Nature 1993, 364, 138–142. [Google Scholar] [CrossRef]
  6. Available online: https://www.asi.it/en/earth-science/cosmo-skymed/ (accessed on 20 August 2024).
  7. Available online: https://www.esa.int/Applications/Observing_the_Earth/Copernicus/Sentinel-1 (accessed on 20 August 2024).
  8. Available online: https://www.esa.int/Applications/Observing_the_Earth/FutureEO/ESA_selects_Harmony_as_tenth_Earth_Explorer_mission (accessed on 20 August 2024).
  9. Available online: https://www.esa.int/Applications/Observing_the_Earth/Copernicus/Contract_signed_for_new_Copernicus_ROSE-L_mission (accessed on 20 August 2024).
  10. Available online: https://www.capellaspace.com/ (accessed on 20 August 2024).
  11. Available online: https://www.iceye.com/ (accessed on 20 August 2024).
  12. Available online: https://metasensing.com/ (accessed on 20 August 2024).
  13. Krieger, G.; Moreira, A.; Fiedler, H.; Hajnsek, I.; Werner, M.; Younis, M.; Zink, M. TanDEM-X: A Satellite Formation for High-Resolution SAR Interferometry. IEEE Trans. Geosci. Remote Sens. 2007, 45, 3317–3341. [Google Scholar] [CrossRef]
  14. Torre, A.; Calabrese, D.; Porfilio, M. COSMO-SkyMed: Image quality achievements. In Proceedings of the 5th International Conference on Recent Advances in Space Technologies—RAST2011, Istanbal, Turkey, 9–11 June 2011. [Google Scholar]
  15. Roa, Y.; Rosell, P.; Solarte, A.; Euillades, L.; Carballo, F.; García, S.; Euillades, P. First assessment of the interferometric capabilities of SAOCOM-1A: New results over the Domuyo Volcano, Neuquén Argentina. J. South Am. Earth Sci. 2021, 106, 102882. [Google Scholar] [CrossRef]
  16. Kellogg, K.; Hoffman, P.; Standley, S.; Shaffer, S.; Rosen, P.; Edelstein, W.; Dunn, C.; Baker, C.; Barela, P.; Shen, Y.; et al. NASA-ISRO Synthetic Aperture Radar (NISAR) Mission. In Proceedings of the 2020 IEEE Aerospace Conference, Big Sky, MT, USA, 7–14 March 2020; pp. 1–21. [Google Scholar] [CrossRef]
  17. Davidson, M.W.J.; Furnell, R. ROSE-L: Copernicus L-Band Sar Mission. In Proceedings of the 2021 IEEE International Geoscience and Remote Sensing Symposium IGARSS, Brussels, Belgium, 11–16 July 2021; pp. 872–873. [Google Scholar] [CrossRef]
  18. Baqué, R.; Bonin, G.; du Plessis, O.R. The airborne SAR-system: SETHI airborne microwave remote sensing imaging system. In Proceedings of the 7th European Conference on Synthetic Aperture Radar, Friedrichshafen, Germany, 2–5 June 2008. [Google Scholar]
  19. Ruault du Plessis, O.; Nouvel, J.; Baque, R.; Bonin, G.; Dreuillet, P.; Coulombaix, C.; Oriot, H. ONERA SAR facilities. IEEE Aerosp. Electron. Syst. Mag. 2011, 26, 24–30. [Google Scholar] [CrossRef]
  20. Magnard, C.; Frioud, M.; Small, D.; Brehm, T.; Essen, H.; Meier, E. Processing of MEMPHIS Ka-Band Multibaseline Interferometric SAR Data: From Raw Data to Digital Surface Models. IEEE J. Sel. Top. Appl. Earth Observ. Remote Sens. 2014, 7, 2927–2941. [Google Scholar] [CrossRef]
  21. Esposito, C.; Natale, A.; Palmese, G.; Berardino, P.; Lanari, R.; Perna, S. On the Capabilities of the Italian Airborne FMCW AXIS InSAR System. Remote Sens. 2020, 12, 539. [Google Scholar] [CrossRef]
  22. Horn, R.; Nottensteiner, A.; Reigber, A.; Fischer, J.; Scheiber, R. F-SAR—DLR’s new multifrequency polarimetric airborne SAR. In Proceedings of the International Geoscience and Remote Sensing Symposium, Cape Town, South Africa, 12–17 July 2009. [Google Scholar]
  23. Perna, S.; Esposito, C.; Amaral, T.; Berardino, P.; Jackson, G.; Moreira, J.; Pauciullo, A.; Vaz Junior, E.; Wimmer, C.; Lanari, R. The InSAeS4 airborne X-band interferometric SAR system: A first assesment on its imaging and topographic mapping capabilities. Remote Sens. 2016, 8, 40. [Google Scholar] [CrossRef]
  24. Perna, S.; Alberti, G.; Berardino, P.; Bruzzone, L.; Califano, D.; Catapano, I.; Ciofaniello, L.; Donini, E.; Esposito, C.; Facchinetti, C.; et al. The ASI Integrated Sounder-SAR System Operating in the UHF-VHF Bands: First Results of the 2018 Helicopter-Borne Morocco Desert Campaign. Remote Sens. 2019, 11, 1845. [Google Scholar] [CrossRef]
  25. Aguasca, A.; Acevo-Herrera, R.; Broquetas, A.; Mallorqui, J.J.; Fabregas, X. ARBRES: Light-Weight CW/FM SAR Sensors for Small UAVs. Sensors 2013, 13, 3204–3216. [Google Scholar] [CrossRef] [PubMed]
  26. Luebeck, D.; Wimmer, C.; Moreira, L.F.; Alcântara, M.; Oré, G.; Góes, J.A.; Oliveira, L.P.; Teruel, B.; S. Bins, L.; H. Gabrielli, L.; et al. Drone-borne Differential SAR Interferometry. Remote Sens. 2020, 12, 778. [Google Scholar] [CrossRef]
  27. Natale, A.; Berardino, P.; Esposito, C.; Palmese, G.; Lanari, R.; Perna, S. The New Italian Airborne Multiband Interferometric and Polarimetric SAR (MIPS) System: First Flight Test Results. Int. Geosci. Remote Sens. Symp. 2022, 2022, 4506–4509. [Google Scholar] [CrossRef]
  28. Meta, A.; Hoogeboom, P.; Ligthart, L.P. Signal Processing for FMCW SAR. IEEE Trans. Geosci. Remote Sens. 2007, 45, 3519–3532. [Google Scholar] [CrossRef]
  29. Cumming, I.G.; Wang, F.H. Digital Processing of Synthetic Aperture Radar Data: Algorithms and Implementation. Artech House Remote Sens. Libr. 2005, 1, 108–110. [Google Scholar]
  30. Richards, M.A.; Scheer, J.A.; Holm, W.A. Principles of Modern Radar: Basic Principles; Scitech Publishing: Raleigh, NC, USA, 2010; ISBN 978161353148. [Google Scholar]
  31. Lanari, R.; Esposito, C.; Berardino, P.; Natale, A.; Palmese, G.; Perna, S. Stromboli volcano monitoring with airborne SAR systems. EGU Gen. Assem. 2023. [Google Scholar] [CrossRef]
  32. Esposito, C.; Berardino, P.; Natale, A.; Lanari, R.; Perna, S. Stromboli Volcano Topography Variations Retrieval Through Airborne Single-Pass SAR Interferometry. In Proceedings of the IGARSS 2023—2023 IEEE International Geoscience and Remote Sensing Symposium, Pasadena, CA, USA, 16–21 July 2023; pp. 7989–7992. [Google Scholar] [CrossRef]
  33. Available online: https://www.applanix.com (accessed on 20 August 2024).
  34. Balanis, C.A. Antenna Theory: Analysis and Design, 3rd ed.; Wiley-Interscience: New York, NY, USA, 2005. [Google Scholar]
  35. Esposito, C.; Gifuni, A.; Perna, S. Measurement of the Antenna Phase Center Position in Anechoic Chamber. IEEE Antennas Wirel. Propag. Lett. 2018, 17, 2183–2187. [Google Scholar] [CrossRef]
  36. Kildal, P.-S. CombinedE- andH-plane phase centers of antenna feeds. IEEE Trans. Antennas Propag. 1983, 31, 199–202. [Google Scholar] [CrossRef]
  37. Rao, S.; Shafai, L. Phase center calculation of reflector antenna feeds. IEEE Trans. Antennas Propag. 1984, 32, 740–742. [Google Scholar] [CrossRef]
  38. Teichman, M. Determination of Horn Antenna Phase Centers by Edge Diffraction Theory. IEEE Trans. Aerosp. Electron. Syst. 1973, 9, 875–882. [Google Scholar] [CrossRef]
  39. Jäger, M.; Scheiber, R.; Reigber, A. External calibration of antenna pointing and positions in airborne sar systems. In Proceedings of the 16th European Radar Conference (EuRAD), Paris, France, 2–4 October 2019; pp. 41–44. [Google Scholar]
  40. Esposito, C.; Natale, A.; Palmese, G.; Berardino, P.; Perna, S. Geometric distortions in FMCW SAR images due to inaccurate knowledge of electronic radar parameters: Analysis and correction by means of corner reflectors. Remote Sens. Environ. 2019, 232, 111289. [Google Scholar] [CrossRef]
  41. Esposito, C.; Berardino, P.; Natale, A.; Perna, S. On the Frequency Sweep Rate Estimation in Airborne FMCW SAR Systems. Remote Sens. 2020, 12, 3448. [Google Scholar] [CrossRef]
  42. Berardino, P.; Natale, A.; Esposito, C.; Lanari, R.; Perna, S. On the Time-Domain Airborne SAR Focusing in the Presence of Strong Azimuth Variations of the Squint Angle. IEEE Trans. Geosci. Remote Sens. 2023, 61, 1–18. [Google Scholar] [CrossRef]
  43. Fornaro, G. Trajectory Deviations in Airborne SAR: Analysis and Compensation. IEEE Trans. Aerosp. Electron. Syst. 1999, 35, 997–1009. [Google Scholar] [CrossRef]
  44. Fornaro, G.; Franceschetti, G.; Perna, S. Motion Compensation errors: Effects on the accuracy of airborne SAR images. IEEE Trans. Aerosp. Electron. Syst. 2005, 41, 1338–1352. [Google Scholar] [CrossRef]
  45. Reigber, A.; Ferro-Famil, L. Interference Suppression in Synthesized SAR Images. IEEE Geosci. Remote Sens. Lett. 2005, 2, 45–49. [Google Scholar] [CrossRef]
  46. Tao, M.; Su, J.; Huang, Y.; Wang, L. Mitigation of Radio Frequency Interference in Synthetic Aperture Radar Data: Current Status and Future Trends. Remote Sens. 2019, 11, 2438. [Google Scholar] [CrossRef]
  47. Natale, A.; Di Vincenzo, A.; De Maio, A.; Berardino, P.; Esposito, C.; Fusco, A.; Perna, S. Detection Strategies for Radio Frequency Interferences Corrupting FMCW L-Band SAR Data. In Proceedings of the IGARSS 2023—2023 IEEE International Geoscience and Remote Sensing Symposium, Pasadena, CA, USA, 16–21 July 2023; pp. 6775–6778. [Google Scholar]
  48. Di Vincenzo, A.; Natale, A.; De Maio, A.; Berardino, P.; Esposito, C.; Lanari, R.; Perna, S. A New Detection Approach for Radio Frequency Interferences Corrupting Airborne L-Band SAR Data. In Proceedings of the TechDefense2023—2023 IEEE International Workshop on Technologies for Defense and Security, Rome, Italy, 20–22 November 2023. [Google Scholar]
  49. Moreira, A.; Huang, Y. Airborne SAR processing of highly squinted data using a chirp scaling approach with integrated motion compensation. IEEE Trans. Geosci. Remote Sens. 1994, 32, 1029–1040. [Google Scholar] [CrossRef]
  50. Demacedo, K.; Scheiber, R. Precise Topography- and Aperture-Dependent Motion Compensation for Airborne SAR. IEEE Geosci. Remote Sens. Lett. 2005, 2, 172–176. [Google Scholar] [CrossRef]
  51. Prats, P.; Reigber, A.; Mallorqui, J. Topography-Dependent Motion Compensation for Repeat-Pass Interferometric SAR Systems. IEEE Geosci. Remote Sens. Lett. 2005, 2, 206–210. [Google Scholar] [CrossRef]
  52. Fornaro, G.; Franceschetti, G.; Perna, S. On Center-Beam Approximation in SAR Motion Compensation. IEEE Geosci. Remote Sens. Lett. 2006, 3, 276–280. [Google Scholar] [CrossRef]
  53. Frey, O.; Magnard, C.; Ruegg, M.; Meier, E. Focusing of Airborne Synthetic Aperture Radar Data from Highly Nonlinear Flight Tracks. IEEE Trans. Geosci. Remote Sens. 2009, 47, 1844–1858. [Google Scholar] [CrossRef]
  54. Yegulalp, A.F. Fast backprojection algorithm for synthetic aperture radar. In Proceedings of the 1999 IEEE Radar Conference, Radar into the Next Millennium (Cat. No. 99CH36249), Waltham, MA, USA, 22–22 April 1999; pp. 60–65. [Google Scholar]
  55. Ulander, L.; Hellsten, H.; Stenstrom, G. Synthetic-aperture radar processing using fast factorized back-projection. IEEE Trans. Aerosp. Electron. Syst. 2003, 39, 760–776. [Google Scholar] [CrossRef]
  56. Zhang, L.; Li, H.-L.; Qiao, Z.-J.; Xu, Z.-W. A Fast BP Algorithm With Wavenumber Spectrum Fusion for High-Resolution Spotlight SAR Imaging. IEEE Geosci. Remote Sens. Lett. 2014, 11, 1460–1464. [Google Scholar] [CrossRef]
  57. Hettiarachchi, D.L.N.; Balster, E. An accelerated SAR back projection algorithm using integer arithmetic. In Proceedings of the 2018 Asia-Pacific Signal and Information Processing Association Annual Summit and Conference (APSIPA ASC), Honolulu, HI, USA, 12–15 November 2018; pp. 80–88. [Google Scholar]
  58. Freeman, A.; Curlander, J.C. Radiometric Correction and Calibration of SAR Images. Photogramm. Eng. Remote Sens. 1989, 55, 1295–1301. [Google Scholar]
  59. Ulander, L. Radiometric slope correction of synthetic-aperture radar images. IEEE Trans. Geosci. Remote Sens. 1996, 34, 1115–1122. [Google Scholar] [CrossRef]
  60. Freeman, A. SAR calibration: An Overview. IEEE Trans. Geosci. Remote Sens. 1992, 30, 1107–1121. [Google Scholar] [CrossRef]
  61. Quegan, S. A unified algorithm for phase and cross-talk calibration of polarimetric data-theory and observations. IEEE Trans. Geosci. Remote Sens. 1994, 32, 89–99. [Google Scholar] [CrossRef]
  62. van Zyl, J. Calibration of polarimetric radar images using only image parameters and trihedral corner reflector responses. IEEE Trans. Geosci. Remote Sens. 1990, 28, 337–348. [Google Scholar] [CrossRef]
  63. Iodice, A.; Natale, A.; Riccio, D. Polarimetric Two-Scale Model for Soil Moisture Retrieval via Dual-Pol HH-VV SAR Data. IEEE J. Sel. Top. Appl. Earth Obs. Remote Sens. 2013, 6, 1163–1171. [Google Scholar] [CrossRef]
  64. Di Martino, G.; Iodice, A.; Natale, A.; Riccio, D. Polarimetric Two-Scale Two-Component Model for the Retrieval of Soil Moisture Under Moderate Vegetation via L-Band SAR Data. IEEE Trans. Geosci. Remote Sens. 2016, 54, 2470–2491. [Google Scholar] [CrossRef]
  65. Natale, A.; Esposito, C.; Berardino, P.; Lanari, R.; Perna, S. Retrieval of Soil Surface Parameters via Helicopter-Borne P-Band Polarimetric SAR Data Acquired Along Antiparallel Flight Tracks. In Proceedings of the IGARSS 2019—2019 IEEE International Geoscience and Remote Sensing Symposium, Yokohama, Japan, 28 July–2 August 2019; pp. 7002–7005. [Google Scholar] [CrossRef]
  66. Natale, A.; Esposito, C.; Berardino, P.; Lanari, R.; Satalino, G.; Mattia, F.; Perna, S. Soil Moisture Retrieval Through Helicopter-Borne P-Band Polarimetric SAR Data. In Proceedings of the IGARSS 2023—2023 IEEE International Geoscience and Remote Sensing Symposium, Pasadena, CA, USA, 16–21 July 2023. [Google Scholar] [CrossRef]
  67. Ghiglia, D.C.; Romero, L.A. Robust two-dimensional weighted and unweighted phase unwrapping that uses fast transforms and iterative methods. J. Opt. Soc. Am. A 1994, 11, 107–117. [Google Scholar] [CrossRef]
  68. Pritt; Shipman, J. Least-squares two-dimensional phase unwrapping using FFT’s. IEEE Trans. Geosci. Remote Sens. 1994, 32, 706–708. [Google Scholar] [CrossRef]
  69. Spagnolini, U. 2-D phase unwrapping and instantaneous frequency estimation. IEEE Trans. Geosci. Remote Sens. 1995, 33, 579–589. [Google Scholar] [CrossRef]
  70. Pritt, M.D. Phase unwrapping by means of multigrid techniques for interferometric SAR. IEEE Trans. Geosci. Remote Sens. 1996, 34, 728–738. [Google Scholar] [CrossRef]
  71. Davidson, G.; Bamler, R. Multiresolution phase unwrapping for SAR interferometry. IEEE Trans. Geosci. Remote Sens. 1999, 37, 163–174. [Google Scholar] [CrossRef]
  72. Fornaro, G.; Franceschetti, G.; Lanari, R.; Rossi, D.; Tesauro, M. Interferometric SAR phase unwrapping using the finite element method. Proc. Inst. Elect. Eng. 1997, 144, 266–274. [Google Scholar] [CrossRef]
  73. Costantini, M.; Rosen, P.A. A generalized phase unwrapping approach for sparse data. In Proceedings of the IEEE 1999 International Geoscience and Remote Sensing Symposium. IGARSS’99 (Cat. No.99CH36293), Hamburg, Germany, 28 June–2 July 1999; Volume 1, pp. 267–269. [Google Scholar] [CrossRef]
  74. Costantini, M. A novel phase unwrapping method based on network programming. IEEE Trans. Geosci. Remote Sens. 1998, 36, 813–821. [Google Scholar] [CrossRef]
  75. Perna, S.; Esposito, C.; Berardino, P.; Pauciullo, A.; Wimmer, C.; Lanari, R. Phase Offset Calculation for Airborne InSAR DEM Generation Without Corner Reflectors. IEEE Trans. Geosci. Remote Sens. 2015, 53, 2713–2726. [Google Scholar] [CrossRef]
  76. Esposito, C.; Pauciullo, A.; Berardino, P.; Lanari, R.; Perna, S. A Simple Solution for the Phase Offset Estimation of Airborne SAR Interferograms Without Using Corner Reflectors. IEEE Geosci. Remote Sens. Lett. 2017, 14, 379–383. [Google Scholar] [CrossRef]
  77. Di Traglia, F.; Berardino, P.; Borselli, L.; Calabria, P.; Calvari, S.; Casalbore, D.; Casagli, N.; Casu, F.; Chiocci, F.L.; Civico, R.; et al. Generation of deposit-derived pyroclastic density currents by repeated crater rim failures at Stromboli Volcano (Italy). Bull. Volcanol. 2024, 86, 69. [Google Scholar] [CrossRef]
  78. Di Traglia, F.; Battaglia, M.; Nolesini, T.; Lagomarsino, D.; Casagli, N. Shifts in the eruptive styles at Stromboli in 2010–2014 revealed by ground-based InSAR data. Sci. Rep. 2015, 5, 13569. [Google Scholar] [CrossRef]
  79. Rodriguez, E.; Martin, J. Theory and design of interferometric synthetic aperture radars. IEE Proc. F Radar Signal Process. 1992, 139, 147–159. [Google Scholar] [CrossRef]
Figure 1. (left) MIPS radar module. (right) Rack of the MIPS system.
Remotesensing 16 03704 g001
Figure 2. The X-band (left) and L-band (right) antenna layouts of the MIPS system mounted on Cessna 172 aircraft.
Remotesensing 16 03704 g002
Figure 3. The IREA-CNR IT platform.
Remotesensing 16 03704 g003
Figure 4. Radiation patterns of the MIPS SAR antennas. Black line: amplitude pattern. Red line: phase pattern. The blue lines mark the edges of the half power beamwidth. From the top: X-band antenna with vertical polarization, L-band antenna with horizontal polarization and L-band antenna with vertical polarization. The left panels refer to the azimuth plane, and the right panels refer to the elevation plane.
Remotesensing 16 03704 g004
Figure 5. Measurement of the position of one CR during a MIPS campaign.
Remotesensing 16 03704 g005
Figure 6. Measurement of the antenna’s lever arm during one MIPS campaign.
Remotesensing 16 03704 g006
Figure 7. RFI removal from L-band MIPS data: MLC images (amplitude) achieved without applying any RFI filtering strategy (top) and after applying the RFI filtering strategy presented in [47] to the RC SAR data (bottom). Range pixel spacing: 2.38 m (SLC) and 14.3 m (MLC). Range resolution: 2.38 m (SLC) and 14.3 m (MLC). Azimuth pixel spacing: 1.84 m (SLC) and 14.75 m (MLC). Azimuth resolution: 2 m (SLC) and 14.75 m (MLC). Range extension: 8 km. Azimuth extension: 22 km.
Remotesensing 16 03704 g007
Figure 8. External radiometric calibration of X-band MIPS data: amplitude of the multi-look complex (MLC) image (top) with the corresponding Sigma Nought map (bottom). Range pixel spacing: 1.49 m (SLC) and 7.45 m (MLC). Range resolution: 1.49 m (SLC) and 7.45 m (MLC). Azimuth pixel spacing: 1.62 m (SLC) and 16.2 m (MLC). Azimuth resolution: 2 m (SLC) and 16.2 m (MLC). Range extension: 2.8 km. Azimuth extension: 8 km.
Remotesensing 16 03704 g008
Figure 9. Polarimetric processing of P-band data acquired by the ASI helicopter borne SAR sensor. Amplitude of the MLC image (left) with the corresponding Pauli decomposition map (right). Range pixel spacing: 0.75 m (SLC) and 18.75 m (MLC). Range resolution: 3.75 m (SLC) and 18.75 m (MLC). Azimuth pixel spacing: 0.725 m (SLC) and 18.12 m (MLC). Azimuth resolution: 2 m (SLC) and 18.12 m (MLC). Range extension: 2.8 Km. Azimuth extension: 4.53 km.
Remotesensing 16 03704 g009
Figure 10. Relevant to the Stromboli campaign: a pictorial view of the flown tracks (red lines) superimposed over a Google Earth orthophoto.
Remotesensing 16 03704 g010
Figure 11. Relevant to the Stromboli campaign: MLC amplitude SAR image of the area where the CRs were deployed. The 8 CRs are highlighted by circles. The green circle represents the CR analyzed in Figure 12.
Remotesensing 16 03704 g011
Figure 12. Relevant to the Stromboli campaign: azimuth (left panel) and range (right panel) cut of the SLC amplitude image shown in Figure 11 in correspondence with the CR highlighted by the green circle.
Remotesensing 16 03704 g012
Figure 13. Relevant to the Stromboli campaign: calibrated amplitude of MLC SAR images. The red lines pictorially represent the corresponding acquisition flight tracks. Processing parameters are summarized in Table 2.
Remotesensing 16 03704 g013
Figure 14. Relevant to the Stromboli campaign: single pass interferograms. The red lines pictorially represent the corresponding acquisition flight tracks. Processing parameters are summarized in the right column of Table 2.
Remotesensing 16 03704 g014
Figure 15. Relevant to the Stromboli campaign: final InSAR DEM of the observed area. Processing parameters are summarized in the right column of Table 2.
Remotesensing 16 03704 g015
Table 1. Main characteristics of the MIPS sensor.
BandXL
TechnologyFMCWFMCW
Chirp duration [μs]600.184700
Carrier frequency [GHz]9.551.35
Bandwidth [MHz]200125
Number of TX antennas12
Number of RX antennas 22
PRF [Hz]1200600
Radar rack size [cm]50 × 50 × 65
Radar weight * [kg]35
Antenna size [cm]24 × 12 × 1.520 × 40 × 4
Antenna weight [kg]0.51.5
PolarizationsVVVV-VH-HV-HH
Sampling frequency [MHz]2525
Single-pass interferometryyesno
* Includes the rack weight.
Table 2. Relevant to the Stromboli campaign: main processing parameters.
SLCMLC
Range pixel spacing [m]0.751.5
Range resolution [m]0.751.5
Azimuth pixel spacing [m]0.042
Azimuth resolution [m]0.272
Table 3. Relevant to the Stromboli campaign: measurements on CRs.
Group 1 (8 CRs)Group 2 (8 CRs)
MeanSt. dev.MeanSt. dev.
Range resolution [cm]74.0173.41.2
Azimuth resolution [cm]27.50.227.50.6
Disclaimer/Publisher’s Note: The statements, opinions and data contained in all publications are solely those of the individual author(s) and contributor(s) and not of MDPI and/or the editor(s). MDPI and/or the editor(s) disclaim responsibility for any injury to people or property resulting from any ideas, methods, instructions or products referred to in the content.

