

Synergistic Potential of Optical and Radar Remote Sensing for Snow Cover Monitoring
 ,
,  ,
,  ,
,  and
and
Abstract
:1. Introduction
2. Study Sites
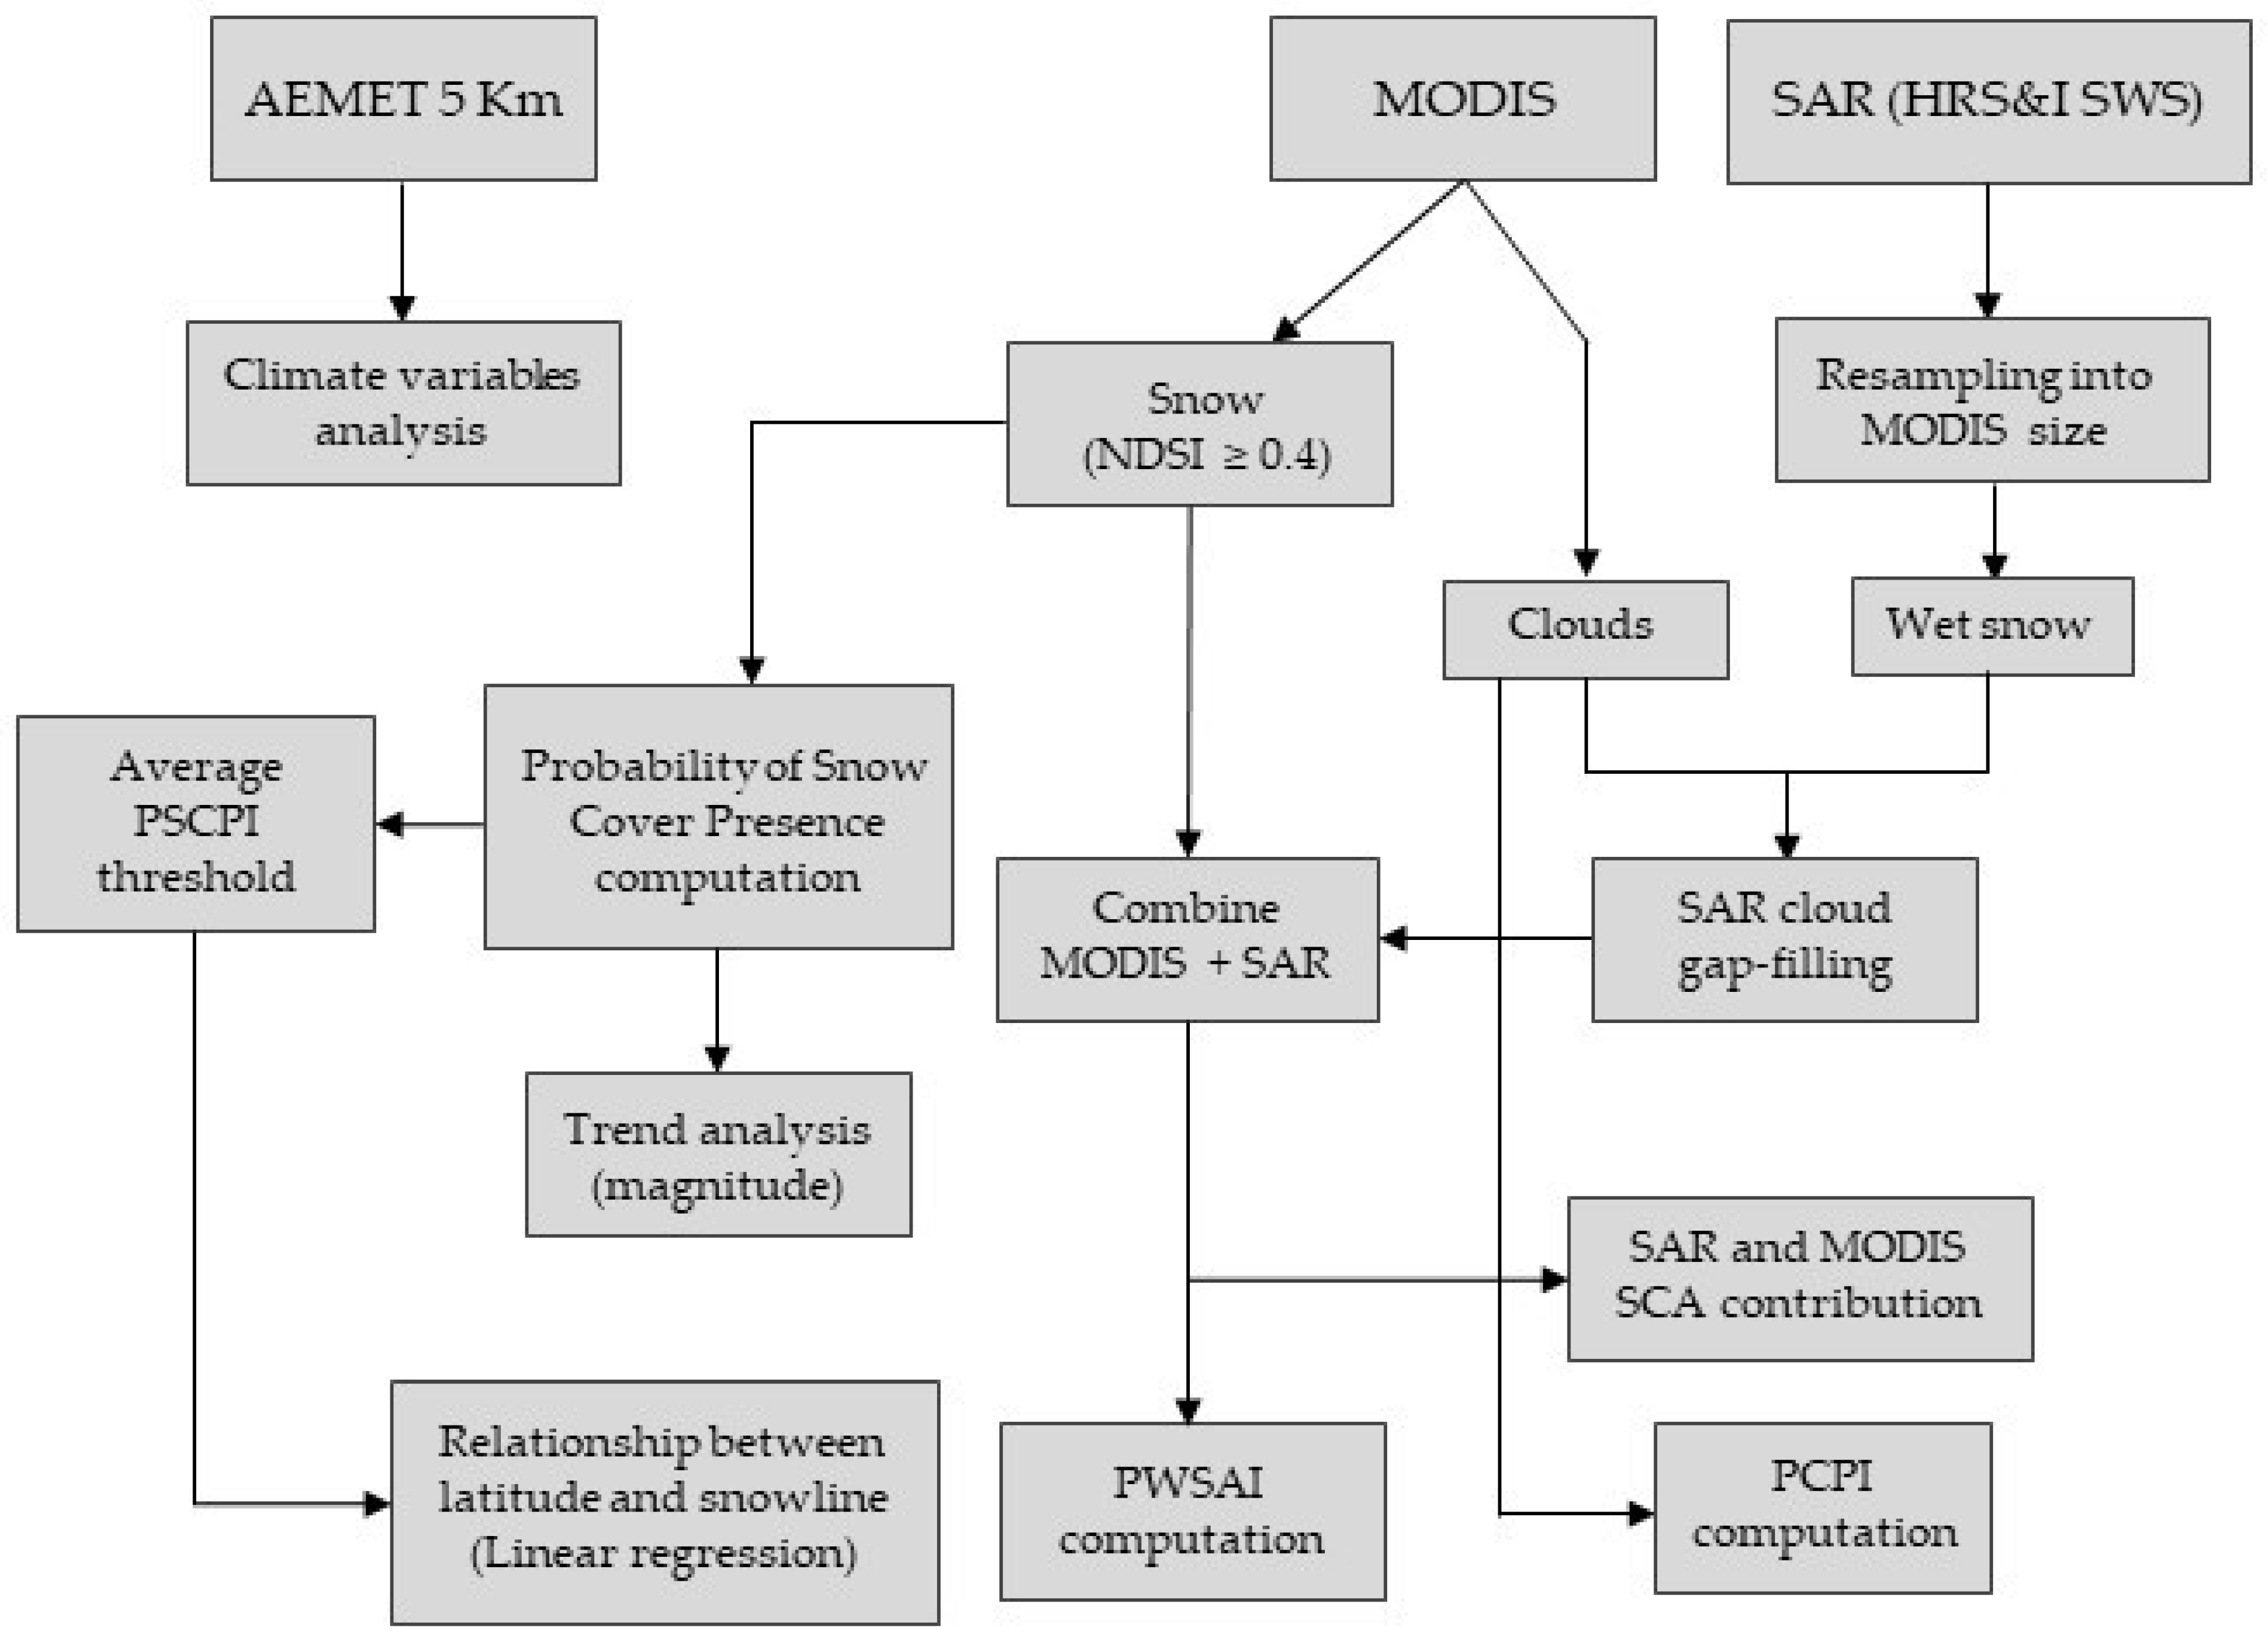
3. Data and Methods
3.1. Methods
3.1.1. Snow Characteristics
3.1.2. Analysis of the Recent Impacts of Climate Change on Snow Cover
3.1.3. Assessment of the Synergistic Use of SAR and Optical Remote Sensing
3.1.4. Potential Sources of Distortion of SAR and Optical Remote Sensing
3.2. Data
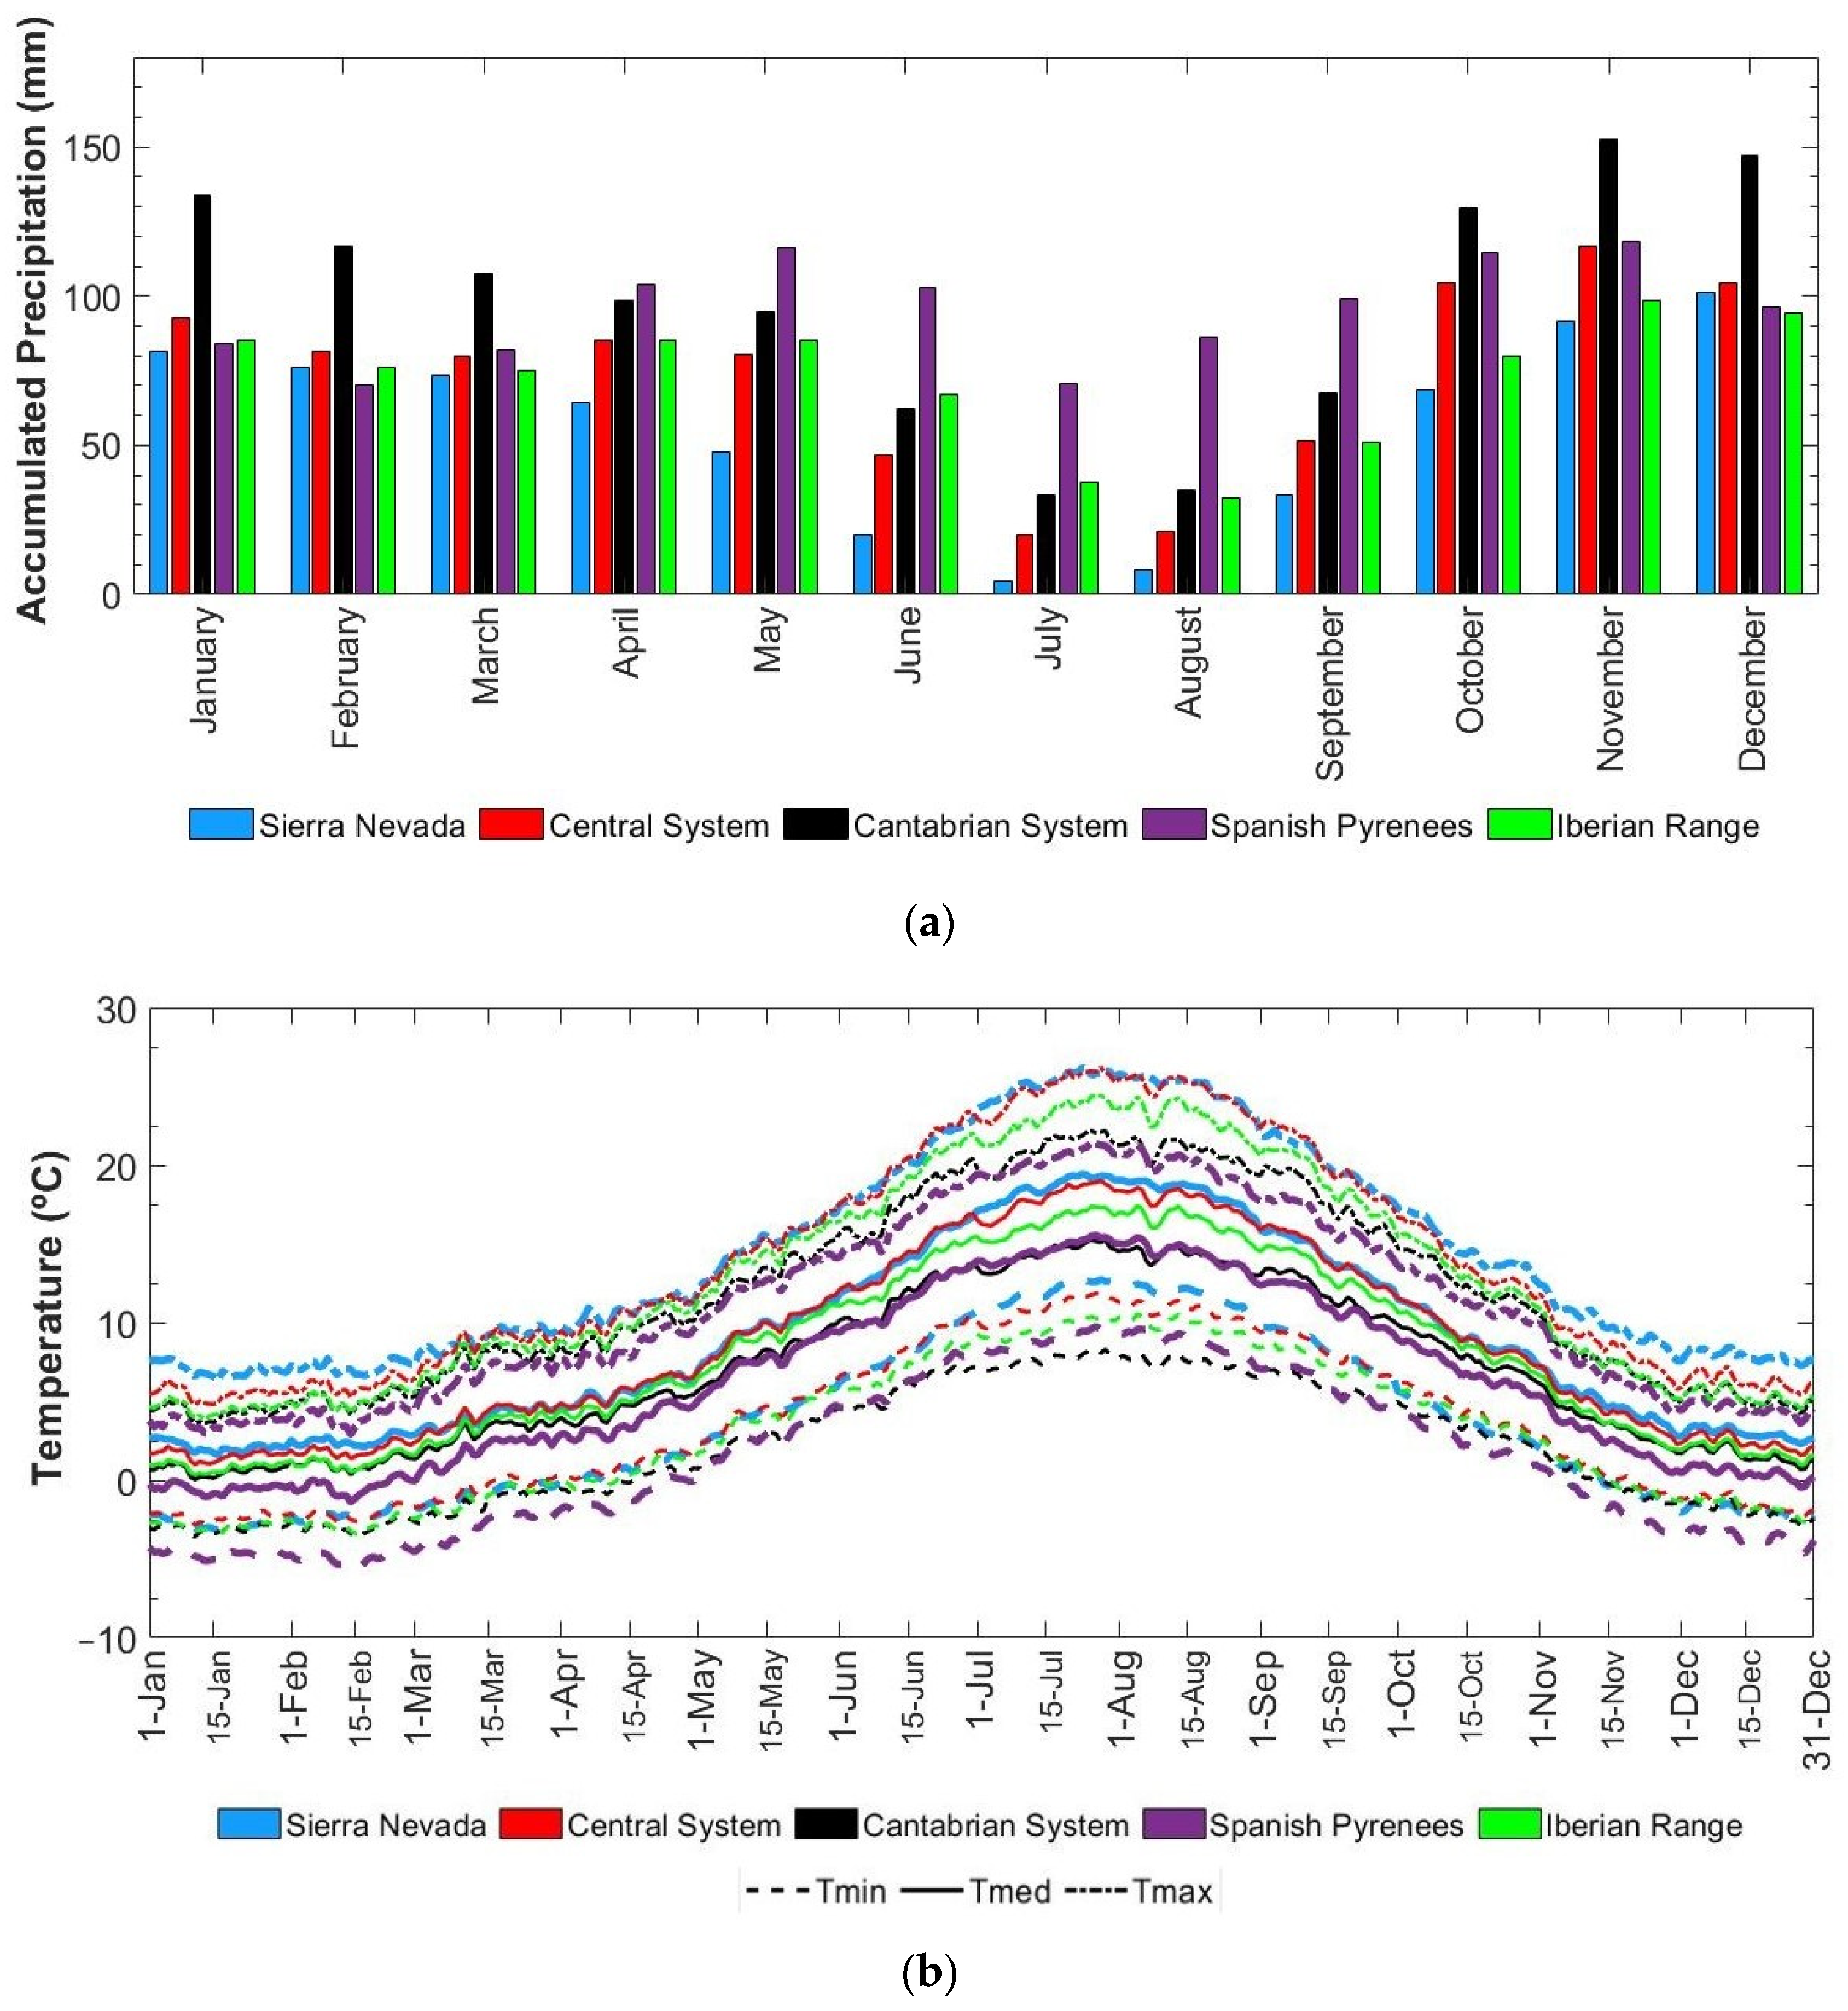
3.2.1. Climatological Data
3.2.2. Snow Data
3.2.3. Forest Density Data
4. Results
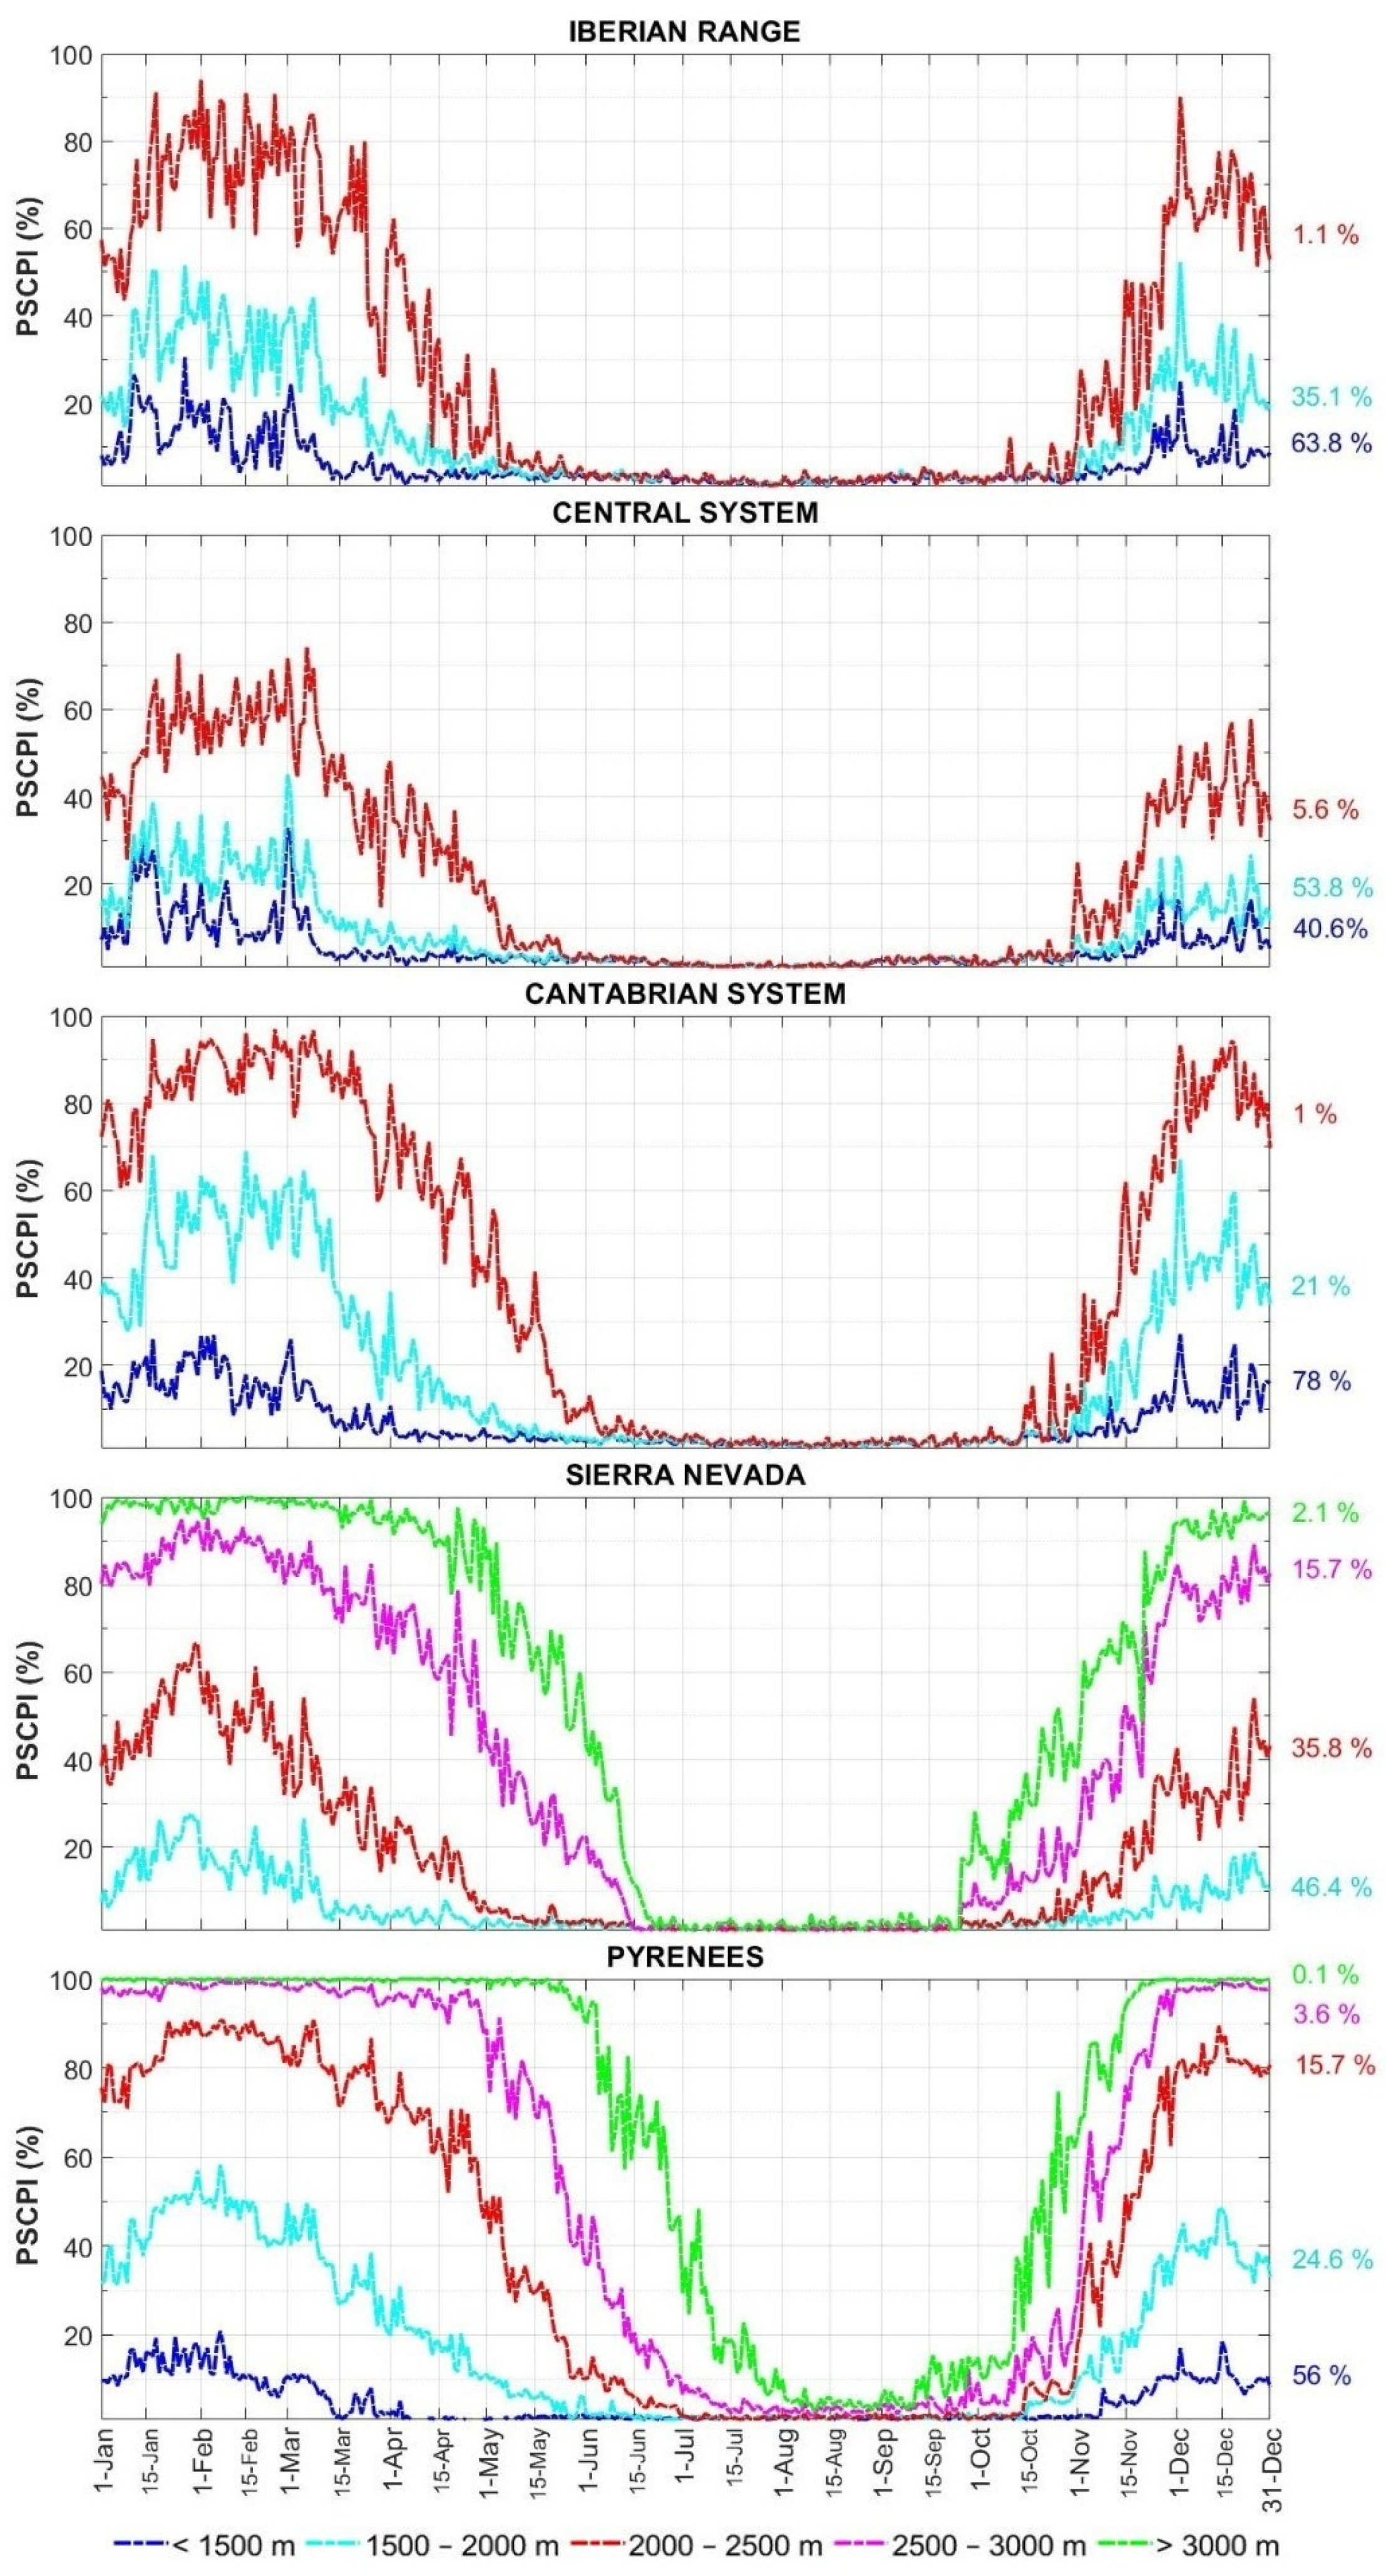
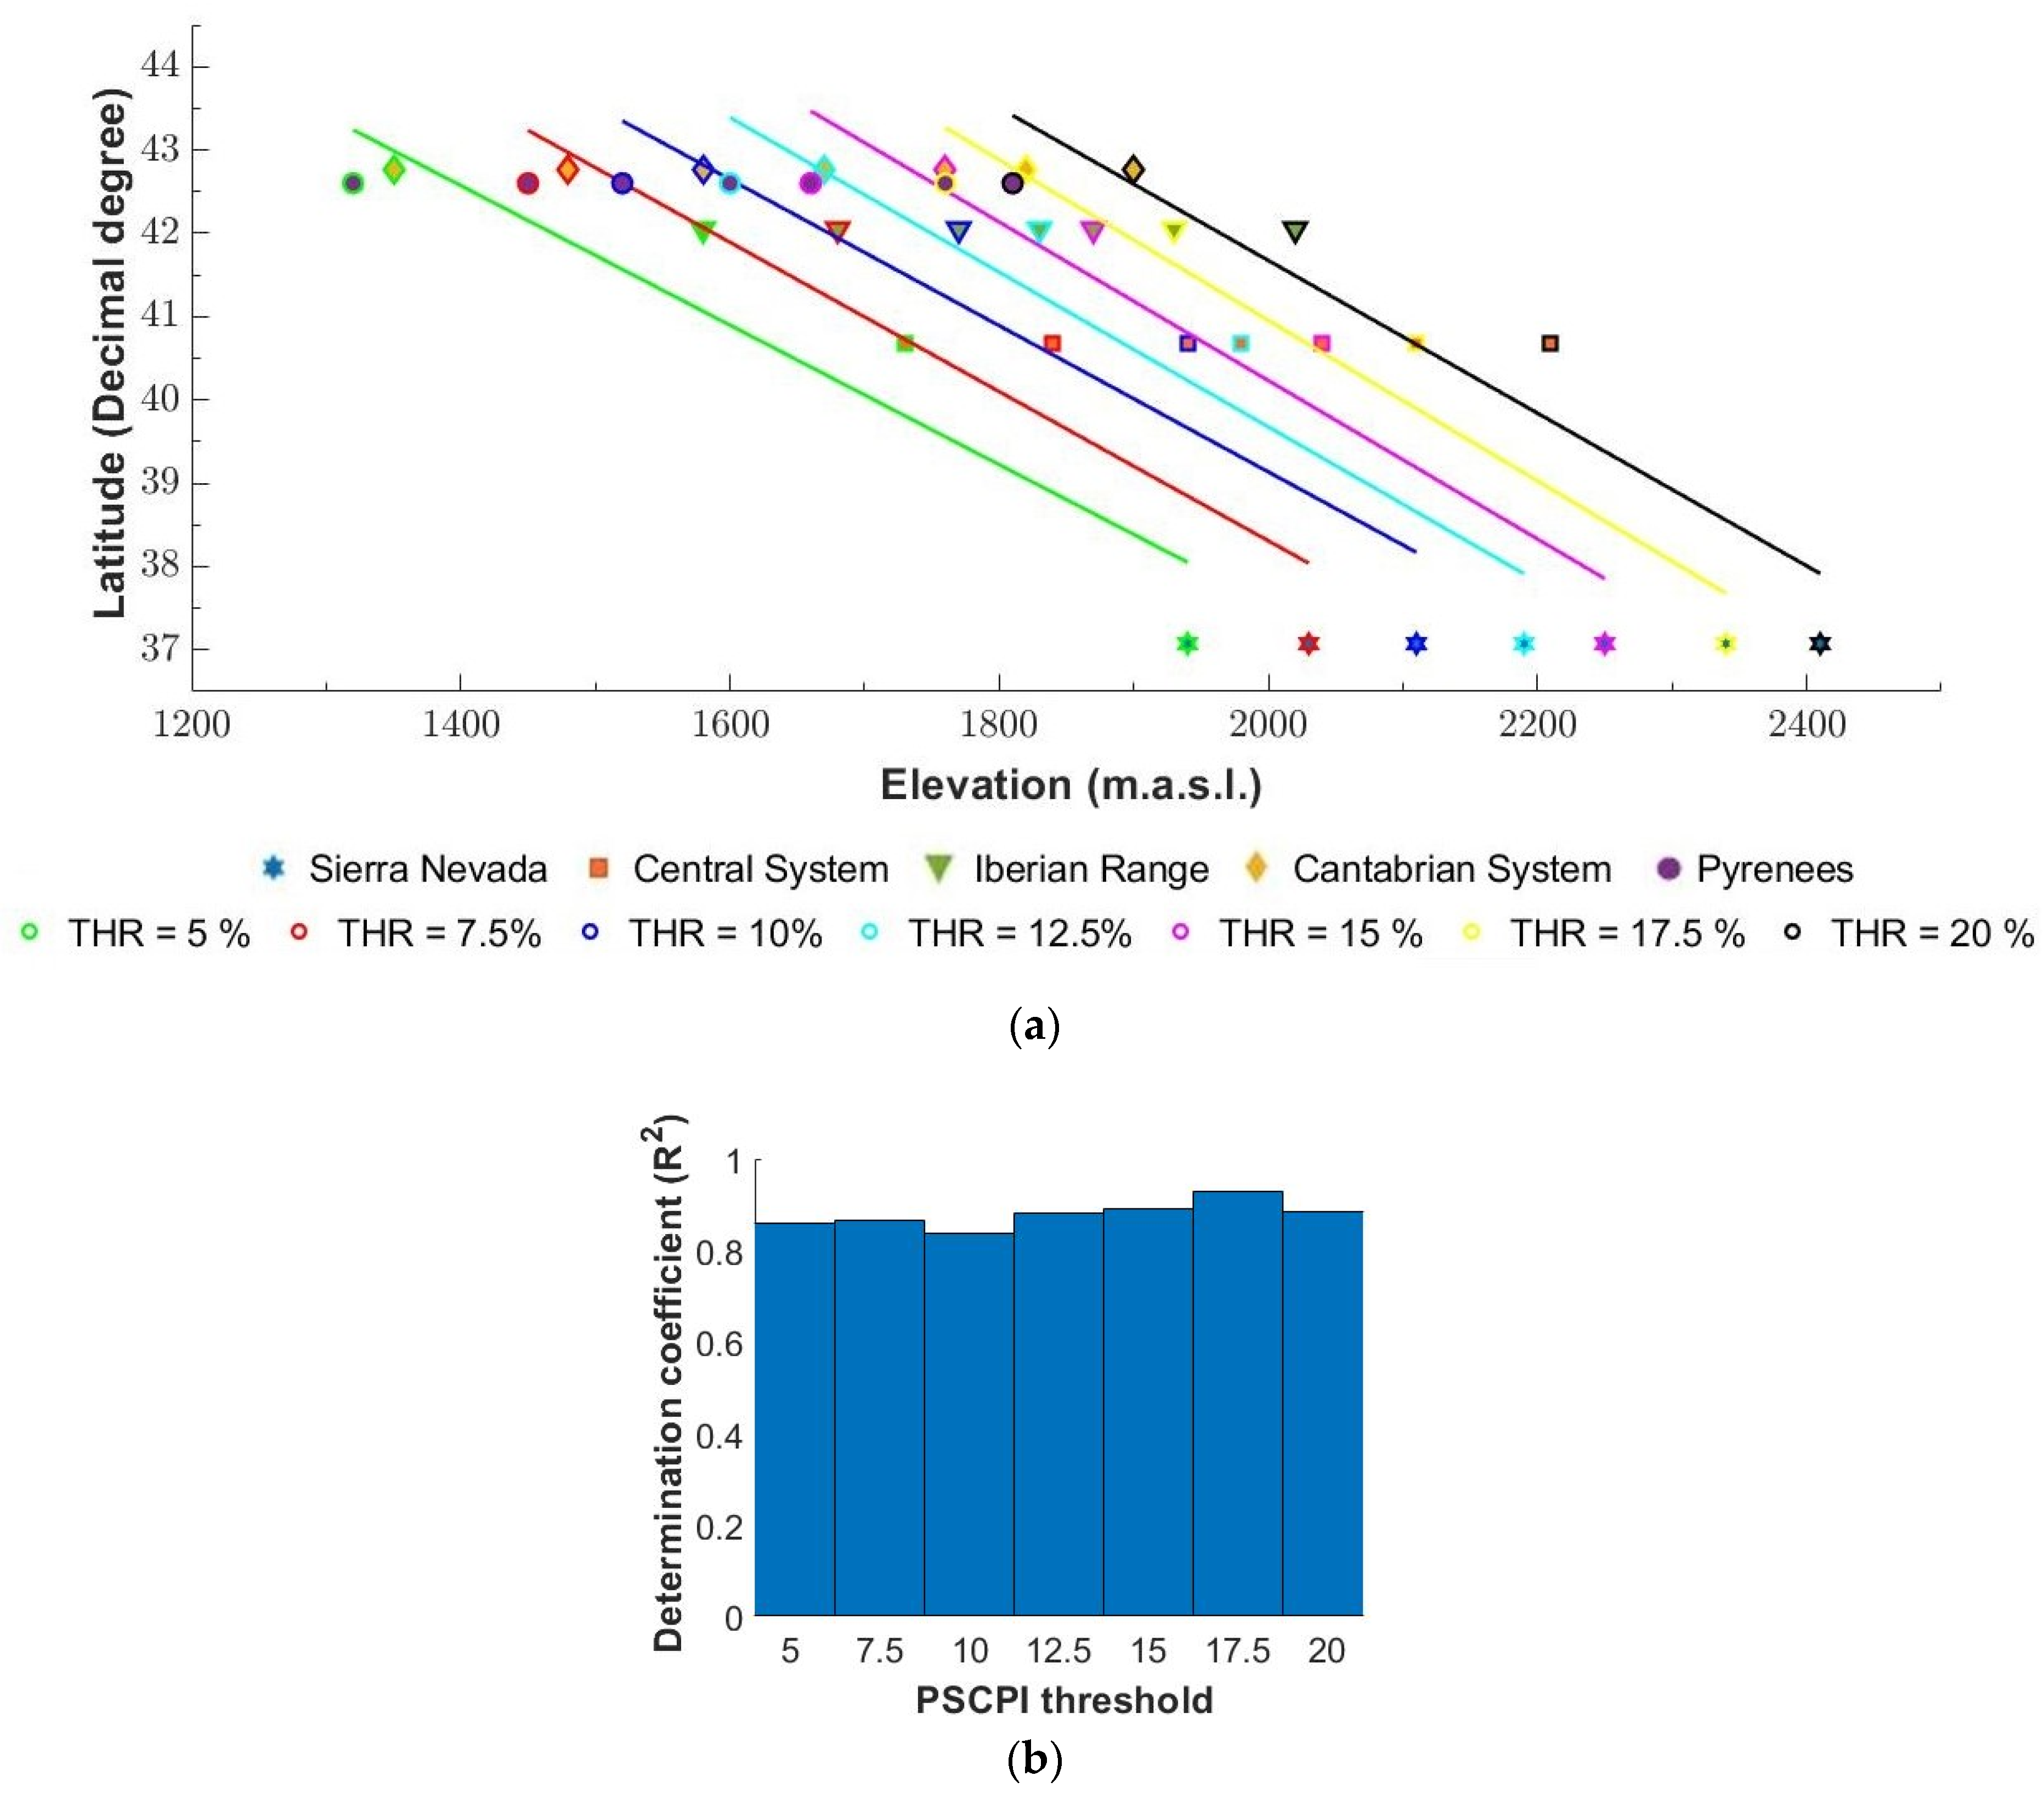
4.1. Evaluation of Snow Characteristics
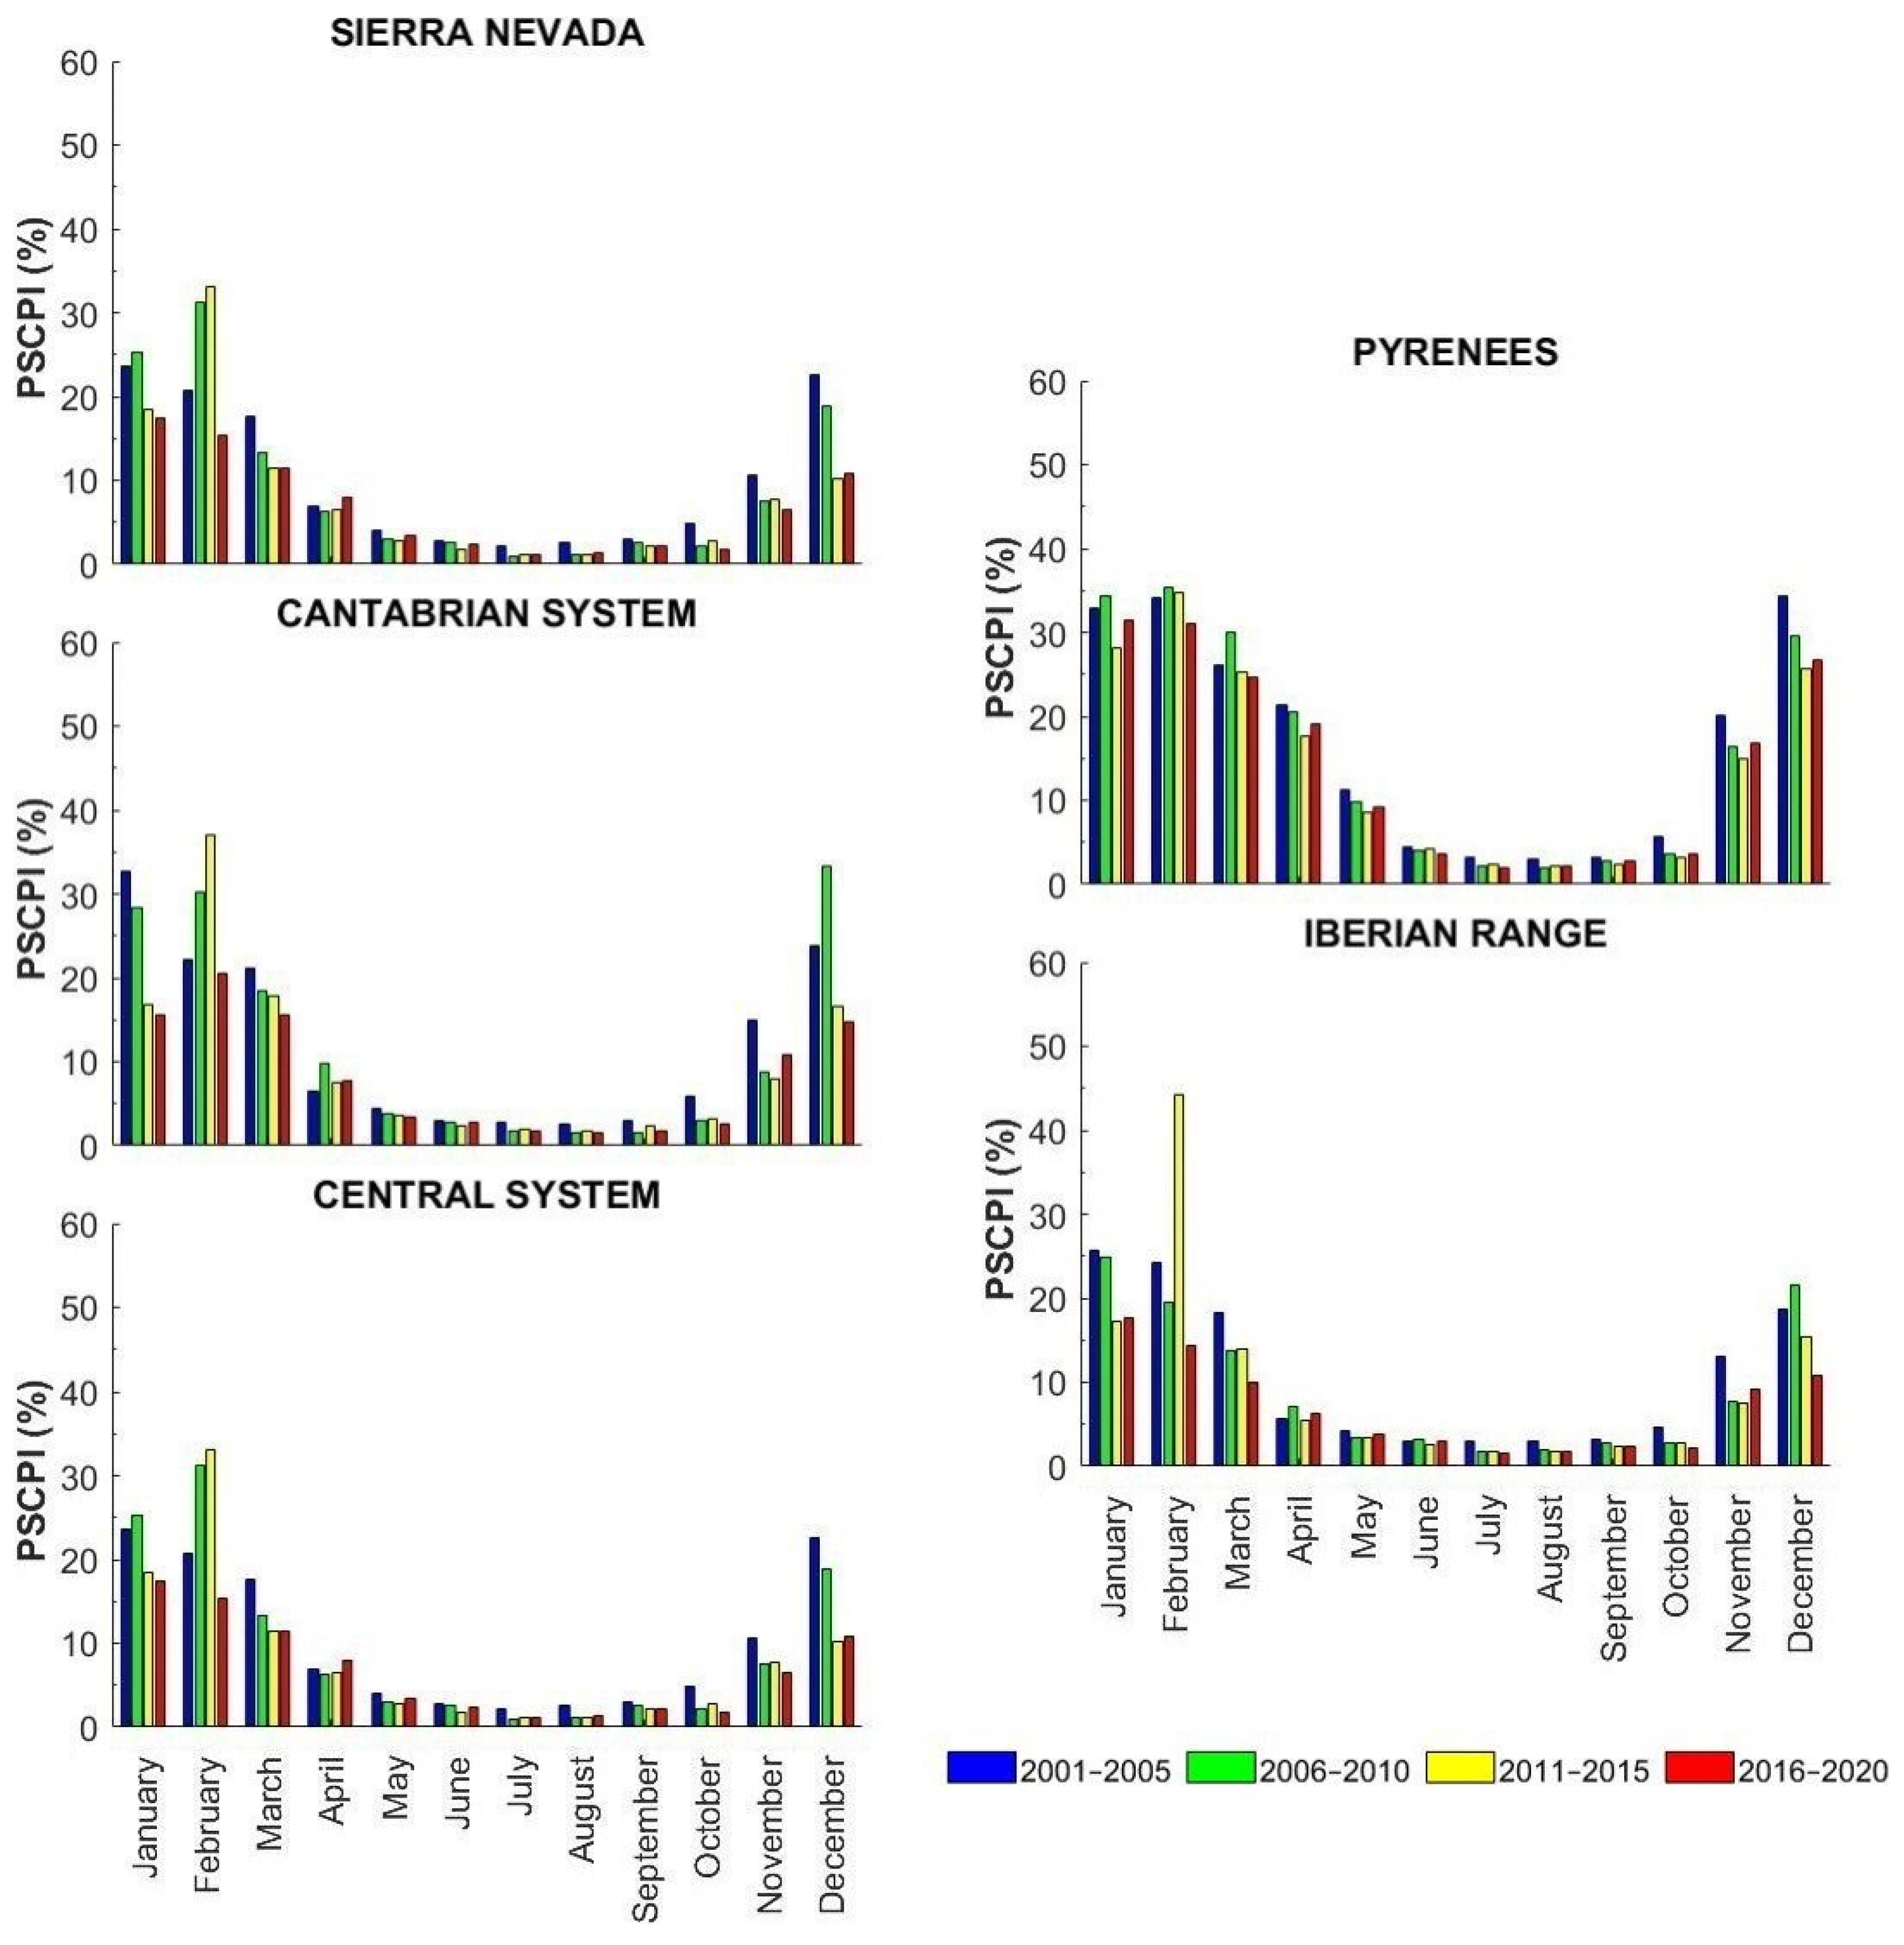
4.2. Recent Impacts of Climate Change on Snow Cover
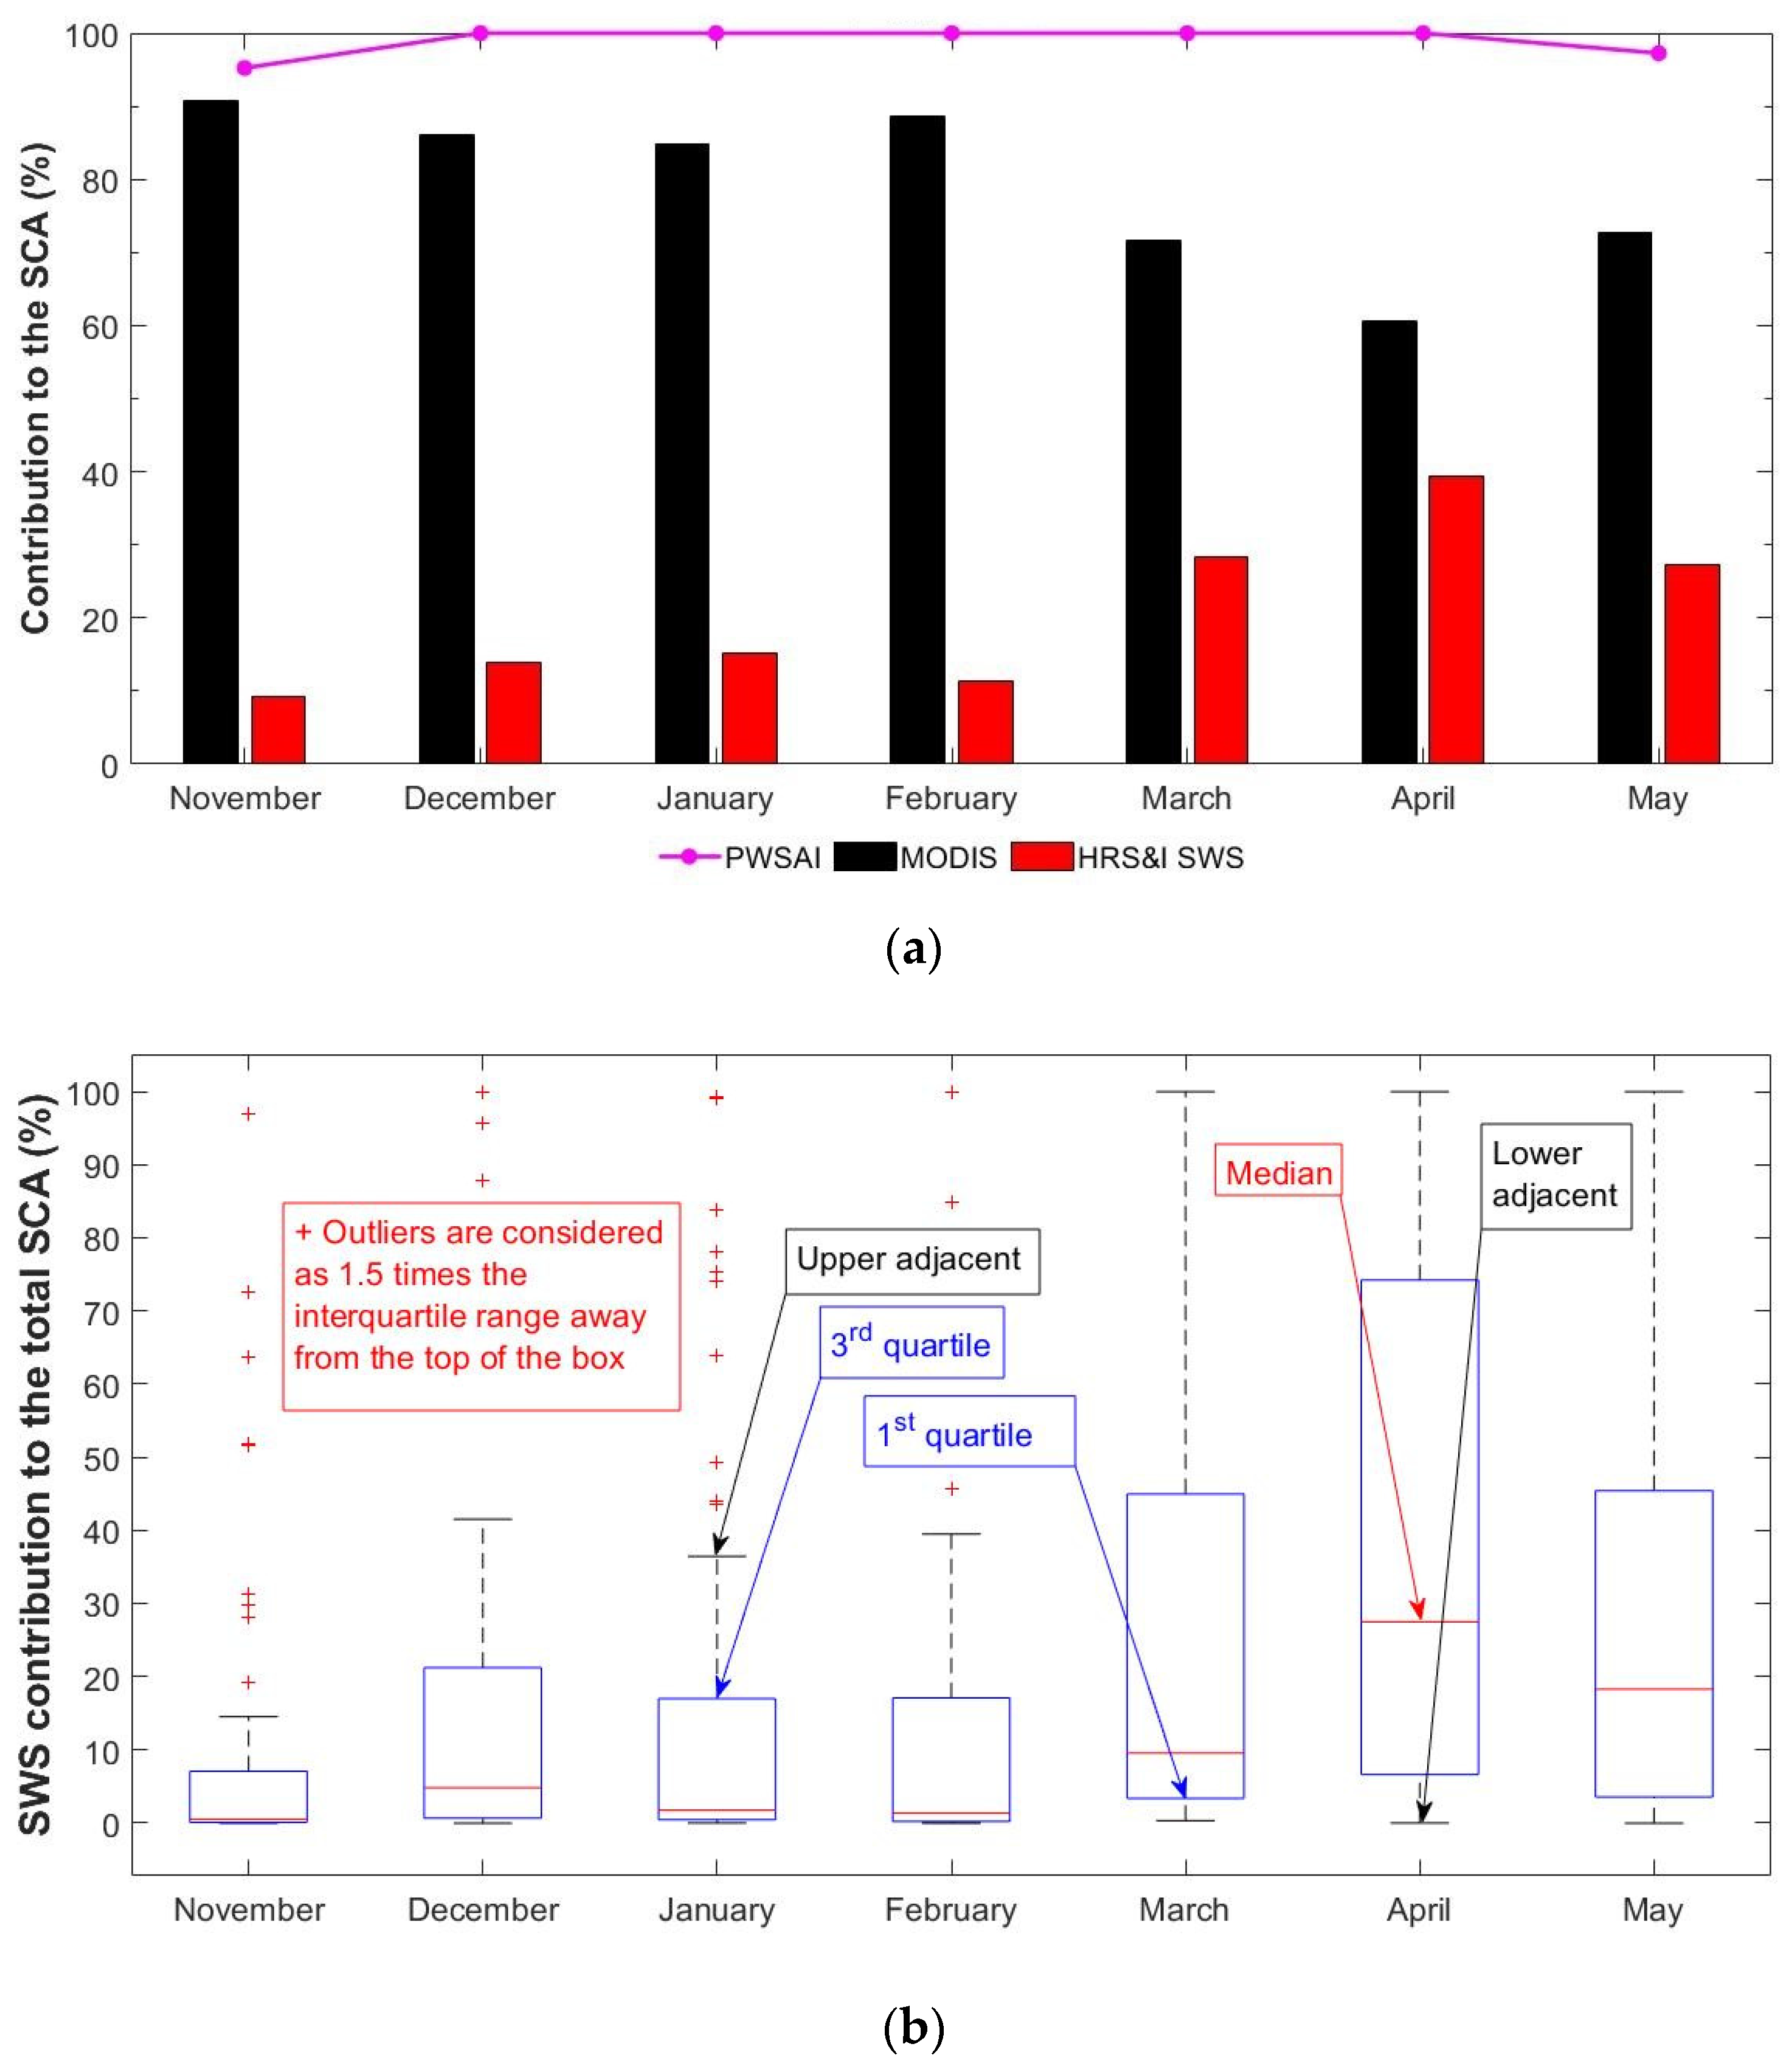
4.3. Potential of the Combined Use of SAR and MODIS for Snow Monitoring
5. Discussion
5.1. Potential Uncertainties of SAR and Optical Sensors for Snow Monitoring
5.2. Snow Characterization and Analysis of the Recent Climate Change Impacts on Snow Cover
5.3. Potential of the Combined Use of SAR and Optical Remote Sensing for Snow Cover Mapping
6. Conclusions
Author Contributions
Funding
Data Availability Statement
Conflicts of Interest
Appendix A. Generalized Methods and Limitations of Optical and Radar Sensors for Snow Cover Mapping
References
- Vavrus, S. The role of terrestrial snow cover in the climate system. Clim. Dyn. 2007, 29, 73–88. [Google Scholar] [CrossRef]
- Yeh, T.C.; Wetherald, R.T.; Manabe, S. A model study of the short-term climatic and hydrologic effects of sudden snow-cover removal. Mon. Weather Rev. 1983, 111, 1013–1024. [Google Scholar] [CrossRef]
- Biemans, H.; Siderius, C.; Lutz, A.F.; Nepal, S.; Ahmad, B.; Hassan, T.; von Bloh, W.; Wijngaard, R.R.; Wester, P.; Shrestha, A.B.; et al. Importance of snow and glacier meltwater for agriculture on the Indo-Gangetic Plain. Nat. Sustain. 2019, 2, 594–601. [Google Scholar] [CrossRef]
- Qin, Y.; Abatzoglou, J.T.; Siebert, S.; Huning, L.S.; Agha Kouchak, A.; Mankin, J.S.; Hong, C.; Tong, D.; Davis, S.J.; Mueller, N.D. Agricultural risks from changing snowmelt. Nat. Clim. Chang. 2020, 10, 459–465. [Google Scholar] [CrossRef]
- Groffman, P.M.; Driscoll, C.T.; Fahey, T.J.; Hardy, J.P.; Fitzhugh, R.D.; Tierney, G.L. Colder soils in a Warmer World: A snow manipulation study in a northern hardwood forest ecosystem. Biogeochemistry 2011, 56, 135–150. [Google Scholar] [CrossRef]
- Pauli, J.N.; Zuckerberg, B.; Whiteman, J.P.; Porter, W. The subnivium: A deteriorating seasonal refugium. Front. Ecol. Environ. 2013, 11, 260–267. [Google Scholar] [CrossRef]
- Niittynen, P.; Heikkinen, R.K.; Luoto, M. Snow cover is a neglected driver of Arctic biodiversity loss. Nat. Clim. Chang. 2018, 8, 997–1001. [Google Scholar] [CrossRef]
- Harrison, S.J.; Winterbottom, S.J.; Johnson, R.C. A preliminary assessment of the socio-economic and environmental impacts of recent changes in winter snow cover in Scotland. Scott. Geogr. J. 2001, 117, 297–312. [Google Scholar] [CrossRef]
- Yang, Y.; Wu, X.-J.; Liu, S.-W.; Xiao, C.-D.; Wang, X. Valuating service loss of snow cover in Irtysh River Basin. Adv. Clim. Chang. Res. 2019, 10, 109–114. [Google Scholar] [CrossRef]
- Wu, X.; Wang, X.; Liu, S.; Yang, Y.; Xu, G.; Xu, Y.; Jiang, T.; Xiao, C. Snow cover loss compounding the future economic vulnerability of western China. Sci. Total Environ. 2021, 755, 143025. [Google Scholar] [CrossRef]
- Moreno-Gené, J.; Sánchez-Pulido, L.; Cristobal-Fransi, E.; Daries, N. The Economic Sustainability of Snow Tourism: The Case of Ski Resorts in Austria, France, and Italy. Sustainability 2018, 10, 3012. [Google Scholar] [CrossRef]
- Moreno-Gené, J.; Daries, N.; Cristóbal-Fransi, E.; Sánchez-Pulido, L. Snow tourism and economic sustainability: The financial situation of ski resorts in Spain. Appl. Econ. 2020, 52, 5726–5744. [Google Scholar] [CrossRef]
- Parthum, B.; Christensen, P. A market for snow: Modeling winter recreation patterns under current and future climate. J. Environ. Econ. Manag. 2022, 113, 102637. [Google Scholar] [CrossRef] [PubMed]
- Kulkarni, A.V.; Randhawa, S.S.; Rathore, B.P.; Bahuguna, I.M.; Sood, R.K. Snow and glacier melt runoff model to estimate hydropower potential. J. Indian Soc. Remote Sens. 2002, 30, 221–228. [Google Scholar] [CrossRef]
- Bombelli, G.M.; Soncini, A.; Bianchi, A.; Bocchiola, D. Potentially modified hydropower production under climate change in the Italian Alps. Hydrol. Process. 2019, 33, 2355–2372. [Google Scholar] [CrossRef]
- Collados-Lara, A.-J.; Pardo-Igúzquiza, E.; Pulido-Velazquez, D. A distributed cellular automata model to simulate potential future impacts of climate change on snow cover area. Adv. Water Resour. 2019, 124, 106–119. [Google Scholar] [CrossRef]
- Collados-Lara, A.-J.; Pulido-Velazquez, D.; Pardo-Igúzquiza, E.; Alonso-González, E. Estimation of the spatiotemporal dynamic of snow water equivalent at mountain range scale under data scarcity. Sci. Total Environ. 2020, 741, 140485. [Google Scholar] [CrossRef]
- Collados-Lara, A.-J.; Pardo-Igúzquiza, E.; Pulido-Velazquez, D. Assessing the impact of climate change—and its uncertainty—on snow cover areas by using cellular automata models and stochastic weather generators. Sci. Total Environ. 2021, 788, 147776. [Google Scholar] [CrossRef]
- Pardo-Igúzquiza, E.; Collados-Lara, A.-J.; Pulido-Velazquez, D. Estimation of the spatiotemporal dynamics of snow covered area by using cellular automata models. J. Hydrol. 2017, 550, 230–238. [Google Scholar] [CrossRef]
- Collados-Lara, A.-J.; Pardo-Igúzquiza, E.; Pulido-Velazquez, D. Spatiotemporal estimation of snow depth using point data from snow stakes, digital terrain models, and satellite data. Hydrol. Process. 2017, 31, 1966–1982. [Google Scholar] [CrossRef]
- Collados-Lara, A.-J.; Pardo-Igúzquiza, E.; Pulido-Velazquez, D. Optimal design of snow stake networks to estimate snow depth in an alpine mountain range. Hydrol. Process. 2020, 34, 82–95. [Google Scholar] [CrossRef]
- Jimeno-Sáez, P.; Pulido-Velazquez, D.; Collados-Lara, A.-J.; Pardo-Igúzquiza, E.; Senent-Aparicio, J.; Baena-Ruiz, L. A preliminary assessment of the “undercatching” and the precipitation pattern in an alpine basin. Water 2020, 12, 1061. [Google Scholar] [CrossRef]
- Alvarado-Montero, R.; Uysal, G.; Collados-Lara, A.-J.; Arda Şorman, A.; Pulido-Velazquez, D.; Şensoy, A. Comparison of sequential and variational assimilation methods to improve hydrological predictions in snow dominated mountainous catchments. J. Hydrol. 2022, 612, 127981. [Google Scholar] [CrossRef]
- Dietz, A.J.; Kuenzer, C.; Dech, S. Global SnowPack: A new set of snow cover parameters for studying status and dynamics of the planetary snow cover extent. Remote Sens. Let. 2015, 6, 844–853. [Google Scholar] [CrossRef]
- Dedieu, J.; Lessard-Fontaine, A.; Ravazzani, G.; Cremonese, E.; Shalpykova, G.; Beniston, M. Shifting mountain snow patterns in a changing climate from remote sensing retrieval. Sci. Total Environ. 2014, 493, 1267–1279. [Google Scholar] [CrossRef] [PubMed]
- Notarnicola, C. Hotspots of snow cover changes in global mountain regions over 2000–2018. Remote Sens. Environ. 2020, 243, 111781. [Google Scholar] [CrossRef]
- Hori, M.; Sugiura, K.; Kobayashi, K.; Aoki, T.; Tanikawa, T.; Kuchiki, K.; Niwano, M.; Enomoto, H. A 38-year (1978–2015) Northern Hemisphere daily snow cover extent product derived using consistent objective criteria from satellite-borne optical sensors. Remote Sens. Environ. 2017, 191, 402–418. [Google Scholar] [CrossRef]
- Tekeli, A.E.; Akyürek, Z.; Arda Şorman, A.; Şensoy, A.; Ünal Şorman, A. Using MODIS snow cover maps in modeling snowmelt runoff process in the eastern part of Turkey. Remote Sens. Environ. 2005, 97, 216–230. [Google Scholar] [CrossRef]
- Brakenridge, R.; Anderson, E. Modis-based flood detection, mapping and measurement: The potential for operational hydrological applications. In Nato Science Series: IV: Earth and Environmental Sciences; Marsalek, J., Stancalie, G., Balint, G., Eds.; Kluwer Academic Publishers: Dordrecht, The Netherlands, 2006; Volume 72, pp. 1–12. [Google Scholar]
- Hammond, J.C.; Saavedra, F.A.; Kampf, S.K. How does snow persistence relate to annual streamflow in mountain watersheds of the western U.S. with wet maritime and dry continental climates? Water Resour. Res. 2018, 54, 2605–2623. [Google Scholar] [CrossRef]
- Hall, D.K.; Riggs, G.A. Accuracy assessment of the MODIS snow products. Hydrol. Process. 2007, 21, 1534–1547. [Google Scholar] [CrossRef]
- Hall, D.K.; Foster, J.L.; Chang, A.T.C.; Benson, C.S.; Chien, J.Y.L. Determination of snow-covered area in different land covers in central Alaska, U.S.A. from aircraft data—April 1995. Ann. Glaciol. 1998, 26, 149–155. [Google Scholar] [CrossRef]
- Prudente, V.H.R.; Martins, V.S.; Vieira, D.C.; e Silva, N.R.D.F.; Adami, M.; Sanches, I.D.A. Limitations of cloud cover for optical remote sensing of agricultural areas across South America. Remote Sens. Appl. 2020, 20, 100414. [Google Scholar] [CrossRef]
- Huang, Y.; Song, Z.; Yang, H.; Yu, B.; Liu, H.; Che, T.; Chen, J.; Wu, J.; Shu, S.; Peng, X.; et al. Snow cover detection in mid-latitude mountainous and polar regions using nighttime light data. Remote Sens. Environ. 2022, 268, 112766. [Google Scholar] [CrossRef]
- Hu, K.; Zhang, E.; Xia, M.; Weng, L.; Lin, H. MCANet: A Multi-Branch Network for Cloud/Snow Segmentation in High-Resolution Remote Sensing Images. Remote Sens. 2023, 15, 1055. [Google Scholar] [CrossRef]
- Liu, C.; Li, Z.; Zhang, P.; Huang, L.; Li, Z.; Gao, S. Wet snow detection using dual-polarized Sentinel-1 SAR time series data considering different land categories. Geocarto Int. 2022, 37, 10907–10924. [Google Scholar] [CrossRef]
- Karbou, F.; Veyssière, G.; Coleou, C.; Dufour, A.; Gouttevin, I.; Durand, P.; Gascoin, S.; Grizonnet, M. Monitoring Wet Snow Over an Alpine Region Using Sentinel-1 Observations. Remote Sens. 2021, 13, 381. [Google Scholar] [CrossRef]
- Tsai, N.; Dietz, N.; Oppelt, N.; Kuenzer, N. Wet and Dry Snow Detection Using Sentinel-1 SAR Data for Mountainous Areas with a Machine Learning Technique. Remote Sens. 2019, 11, 895. [Google Scholar] [CrossRef]
- Wagner, W.; Blöschl, G.; Pampaloni, P.; Calvet, J.; Bizzarri, B.; Wigneron, J.; Kerr, Y. Operational readiness of microwave remote sensing of soil moisture for hydrologic applications. Hydrol. Res. 2007, 38, 1–20. [Google Scholar] [CrossRef]
- Nagler, T.; Rott, H. Retrieval of wet snow by means of multitemporal SAR data. IEEE Trans. Geosci. Remote Sens. 2000, 38, 754–765. [Google Scholar] [CrossRef]
- Nagler, T.; Rott, H.; Ripper, E.; Bippus, G.; Hetzenecker, M. Advancements for snowmelt monitoring by means of sentinel-1 SAR. Remote Sens. 2016, 8, 348. [Google Scholar] [CrossRef]
- Rees, W.G. Physical Properties of Snow and Ice. In Book Remote Sensing of Snow and Ice, 1st ed.; CRC Press Books: Boca Raton, FL, USA, 2005; pp. 99–136. [Google Scholar] [CrossRef]
- Mätzler, C.; Schanda, E. Snow mapping with active microwave sensors. Int. J. Remote Sens. 1984, 5, 409–422. [Google Scholar] [CrossRef]
- Rott, H. Prospects of microwave remote sensing for snow hydrology. In Proceedings of the Cocoa Beach Workshop, Cocoa Beach, FL, USA, 19–23 August 1985. [Google Scholar]
- Rott, H.; Mätzler, C. Possibilities and Limits of Synthetic Aperture Radar for Snow and Glacier Surveying. Ann. Glaciol. 1987, 9, 195–199. [Google Scholar] [CrossRef]
- Attema, E.; Davidson, M.; Snoeij, P.; Rommen, B.; Floury, N. Sentinel-1 mission overview. In Proceedings of the 2009 IEEE International Geoscience and Remote Sensing Symposium, Cape Town, South Africa, 12–17 July 2009. [Google Scholar] [CrossRef]
- Pulido-Velazquez, D.; Collados-Lara, A.J.; Alcalá, F.J. Assessing impacts of future potential climate change scenarios on aquifer recharge in continental Spain. J. Hydrol. 2018, 567, 803–819. [Google Scholar] [CrossRef]
- Lopez-Bustins, J.A.; Martin-Vide, J.; Sanchez-Lorenzo, A. Iberia winter rainfall trends based upon changes in teleconnection and circulation patterns. Glob. Planet. Chang. 2008, 63, 171–176. [Google Scholar] [CrossRef]
- Castro, M.D.; Martín-Vide, J.; Alonso Oroza, S. El clima de España: Pasado, presente y escenarios de clima para el siglo XXI. In Evaluación Preliminar de los Impactos en España por Efecto del Cambio Climático; Ministerio de Medio Ambiente: Madrid, Spain, 2005; pp. 1–64. [Google Scholar]
- Alonso-González, E.; López-Moreno, J.I.; Navarro-Serrano, F.; Sanmiguel-Vallelado, A.; Revuelto, J.; Domínguez-Castro, F.; Ceballos, A. Snow climatology for the mountains in the Iberian Peninsula using satellite imagery and simulations with dynamically downscaled reanalysis data. Int. J. Climatol. 2019, 40, 477–491. [Google Scholar] [CrossRef]
- Dozier, J. Spectral signature of alpine snow cover from the Landsat thematic mapper. Remote Sens. Environ. 1989, 28, 9–22. [Google Scholar] [CrossRef]
- Salomonson, V.V.; Appel, I. Estimating fractional snow cover from MODIS using the normalized difference snow index. Remote Sens. Environ. 2004, 89, 351–360. [Google Scholar] [CrossRef]
- Salomonson, V.V.; Appel, I. Development of the Aqua MODIS NDSI fractional snow cover algorithm and validation results. IEEE Trans. Geosci. Remote Sens. 2006, 44, 1747–1756. [Google Scholar] [CrossRef]
- Härer, S.; Bernhardt, M.; Siebers, M.; Schulz, K. On the need for a time- and location-dependent estimation of the NDSI threshold value for reducing existing uncertainties in snow cover maps at different scales. Cryosphere 2018, 12, 1629–1642. [Google Scholar] [CrossRef]
- Tong, R.; Parajka, J.; Komma, J.; Blöschl, G. Mapping snow cover from daily Collection 6 MODIS products over Austria. J. Hydrol. 2020, 590, 125548. [Google Scholar] [CrossRef]
- Déry, S.J.; Brown, R.D. Recent Northern Hemisphere snow cover extent trends and implications for the snow-albedo feedback. Geophys. Res. Lett. 2007, 34. [Google Scholar] [CrossRef]
- Sen, P.K. Estimates of the Regression Coefficient Based on Kendall’s Tau. J. Am. Stat. Assoc. 1968, 63, 1379–1389. [Google Scholar] [CrossRef]
- Anderson, T.W.; Darling, D.A. Asymptotic Theory of Certain «Goodness of Fit» Criteria Based on Stochastic Processes. Ann. Math. Stat. 1952, 23, 193–212. [Google Scholar] [CrossRef]
- Anderson, T.W.; Darling, D.A. A Test of Goodness of Fit. J. Am. Stat. Assoc. 1954, 49, 765. [Google Scholar] [CrossRef]
- Peral García, M.C.; Navascués, B.; Ramos Calzado, P. Serie de precipitación diaria en rejilla con fines climáticos. In Nota Técnica 24 de AEMET; AEMET: Madrid, Spain, 2017. [Google Scholar] [CrossRef]
- Amblar-Francés, M.P.; Ramos-Calzado, P.; Sanchis-Lladó, J.; Hernanz-Lázaro, A.; Peral-García, M.C.; Navascués, B.; Dominguez-Alonso, M.; Pastor-Saavedra, M.A.; Rodríguez-Camino, E. High resolution climate change projections for the Pyrenees region. Adv. Sci. Res. 2020, 17, 191–208. [Google Scholar] [CrossRef]
- Gómez-Gómez, J.D.; Pulido-Velazquez, D.; Collados-Lara, A.J.; Fernandez-Chacon, F. The impact of climate change scenarios on droughts and their propagation in an arid Mediterranean basin. A useful approach for planning adaptation strategies. Sci. Total Environ. 2022, 820, 153128. [Google Scholar] [CrossRef] [PubMed]
- Hidalgo-Hidalgo, J.D.; Collados-Lara, A.J.; Pulido-Velazquez, D.; Rueda-Valdivia, F.J.; Pardo-Igúzquiza, E. Analysis of the Potential Impacts of Climate Change on climatic droughts, snow dynamics and the correlation between them. Water 2022, 14, 1081. [Google Scholar] [CrossRef]
- Collados-Lara, A.J.; Gómez-Gómez, J.D.; Pulido-Velazquez, D.; Pardo-Igúzquiza, E. An approach to identify the best climate models for the assessment of climate change impacts on meteorological and hydrological droughts. Nat. Hazards Earth Syst. Sci. 2022, 22, 599–616. [Google Scholar] [CrossRef]
- Collados-Lara, A.J.; Pardo-Igúzquiza, E.; Pulido-Velazquez, D.; Jiménez-Sánchez, J. Precipitation fields in an alpine Mediterranean catchment: Inversion of precipitation gradient with elevation or undercatch of snowfall? Int. J. Climatol. 2018, 38, 3565–3578. [Google Scholar] [CrossRef]
- Collados-Lara, A.J.; Fassnacht, S.R.; Pardo-Igúzquiza, E.; Pulido-Velazquez, D. Assessment of high-resolution air temperature fields at Rocky Mountain National Park by combining scarce point measurements with elevation and remote sensing data. Remote Sens. 2020, 13, 113. [Google Scholar] [CrossRef]
- Collados-Lara, A.J.; Fassnacht, S.R.; Pulido-Velazquez, D.; Pfohl, A.K.D.; Morán-Tejeda, E.; Venable, N.B.H.; Pardo-Igúzquiza, E.; Puntenney-Desmond, K. Intra-day variability of temperature and its near-surface gradient with elevation over mountainous terrain: Comparing MODIS land surface temperature data with coarse and fine scale near-surface measurements. Int. J. Climatol. 2021, 41, E1435–E1449. [Google Scholar] [CrossRef]
- Jones, P.D.; Hulme, M. Calculating regional climatic time series for temperature and precipitation: Methods and illustrations. Int. J. Climatol. 1996, 16, 361–377. [Google Scholar] [CrossRef]
- Riggs, G.A.; Hall, D.K.; Roman, M.O. MODIS Snow Products Collection 6 User Guide; National Snow and Ice Data Center: Boulder, CO, USA, 2019. Available online: https://modis-snow-ice.gsfc.nasa.gov/ (accessed on 25 May 2023).
- Wang, T.; Fetzer, E.J.; Wong, S.; Kahn, B.H.; Yue, Q. Validation of MODIS cloud mask and multilayer flag using CloudSat-CALIPSO cloud profiles and a cross-reference of their cloud classifications. J. Geophys. Res. 2016, 121, 11620–11635. [Google Scholar] [CrossRef]
- Simic, A.; Fernandes, R.; Brown, R.; Romanov, P.; Park, W.; Hall, D.K. Validation of MODIS, VEGETATION, and GOES+SSM/I snow cover products over Canada based on surface snow depth observations. In Proceedings of the IEEE International Geoscience and Remote Sensing Symposium, Toulouse, France, 21–25 July 2003. [Google Scholar] [CrossRef]
- Royé, D.; Lorenzo, N.; Rasilla, D.; Martí, A. Spatio-temporal variations of cloud fraction based on circulation types in the Iberian Peninsula. Int. J. Climatol. 2019, 39, 1716–1732. [Google Scholar] [CrossRef]
- Azorin-Molina, C.; Baena-Calatrava, R.; Echave-Calvo, I.; Connell, B.H.; Vicente-Serrano, S.M.; López-Moreno, J.I. A daytime over land algorithm for computing AVHRR convective cloud climatologies for the Iberian Peninsula and the Balearic Islands. Int. J. Climatol. 2012, 33, 2113–2128. [Google Scholar] [CrossRef]
- Azorin-Molina, C.; Vicente Serrano, S.M.; Chen, D.; Connell, B.H.; Domínguez-Durán, M.A.; Revuelto, J.; López-Moreno, J.I. AVHRR warm-season cloud climatologies under various synoptic regimes across the Iberian Peninsula and the Balearic Islands. Int. J. Climatol. 2015, 35, 1984–2022. [Google Scholar] [CrossRef]
- Schellenberger, T.; Ventura, B.; Zebisch, M.; Notarnicola, C. Wet Snow Cover Mapping Algorithm Based on Multitemporal COSMO-SkyMed X-Band SAR Images. IEEE J. Sel. Top. Appl. Earth. Obs. Remote Sens. 2012, 5, 1045–1053. [Google Scholar] [CrossRef]
- Karam, M.; Amar, F.; Fung, A.; Mougin, E.; Lopes, A.; Le Vine, D.M.; Beaudoin, A. A microwave polarimetric scattering model for forest canopies based on vector radiative transfer theory. Remote Sens. Environ. 1995, 53, 16–30. [Google Scholar] [CrossRef]
- Alonso-González, E.; Revuelto, J.; Fassnacht, S.R.; Ignacio López-Moreno, J. Combined influence of maximum accumulation and melt rates on the duration of the seasonal snowpack over temperate mountains. J. Hydrol. 2022, 608, 127574. [Google Scholar] [CrossRef]
- Musselman, K.N.; Addor, N.; Vano, J.A.; Molotch, N.P. Winter melt trends portend widespread declines in snow water resources. Nat. Clim. Chang. 2021, 2021, 418–424. [Google Scholar] [CrossRef]
- Wu, X.; Che, T.; Li, X.; Wang, N.; Yang, X. Slower snowmelt in spring along with climate warming across the Northern Hemisphere. Geophys. Res. Lett. 2018, 45, 12331–12339. [Google Scholar] [CrossRef]
- Yang, Y.; You, Q.; Smith, T.; Kelly, R.; Kang, S. Spatiotemporal dipole variations of spring snowmelt over Eurasia. Atmos. Res. 2023, 295, 107042. [Google Scholar] [CrossRef]
- Räisänen, J. Warmer climate: Less or more snow? Clim. Dyn. 2007, 30, 307–319. [Google Scholar] [CrossRef]
- López-Moreno, J.I.; Gascoin, S.; Herrero, J.; Sproles, E.A.; Pons, M.; Alonso-González, E.; Hanich, L.; Boudhar, A.; Musselman, K.N.; Molotch, N.P.; et al. Different sensitivities of snowpacks to warming in Mediterranean climate mountain areas. Environ. Res. Lett. 2017, 12, 074006. [Google Scholar] [CrossRef]
- Fassnacht, S.R.; Patterson, G.G.; Venable, N.B.H.; Cherry, M.L.; Pfohl, A.K.D.; Sanow, J.E.; Tedesche, M.E. How do we define climate change? Considering the temporal resolution of niveo-meteorological data. Hydrology 2020, 7, 38. [Google Scholar] [CrossRef]
- Musselman, K.N.; Clark, M.P.; Liu, C.; Ikeda, K.; Rasmussen, R. Slower snowmelt in a warmer world. Nat. Clim. Chang. 2017, 7, 214–219. [Google Scholar] [CrossRef]
- Verzano, K.; Menzel, L. Snow conditions in mountains and climate change—A global view. IAHS-AISH Publ. 2009, 147–154. Available online: https://www.cabdirect.org/cabdirect/abstract/20093172872 (accessed on 23 March 2024).
- Ishida, K.; Ohara, N.; Ercan, A.; Jang, S.; Trinh, T.; Kavvas, M.; Carr, K.; Anderson, M.L. Impacts of climate change on snow accumulation and melting processes over mountainous regions in Northern California during the 21st century. Sci. Total Environ. 2019, 685, 104–115. [Google Scholar] [CrossRef]
- Nagler, T.; Rott, H.; Malcher, P.; Muller, F. Assimilation of meteorological and remote sensing data for snowmelt runoff forecasting. Remote Sens. Environ. 2008, 112, 1408–1420. [Google Scholar] [CrossRef]
- Shi, J.; Dozier, J. Inferring snow wetness using C-band data from SIR-C’s polarimetric synthetic aperture radar. IEEE Trans. Geosci. Remote Sens. 1995, 33, 905–914. [Google Scholar] [CrossRef]
- Mätzler, C. Applications of the interaction of microwaves with the natural snow cover. Remote Sens. Rev. 1987, 2, 259–387. [Google Scholar] [CrossRef]
- Ulaby, F.T.; Stiles, W.H.; Abdelrazik, M. Snow cover Influence on Backscattering from Terrain. IEEE Trans. Geosci. Remote Sens. 1984, 22, 126–133. [Google Scholar] [CrossRef]
- Löw, A.; Ludwig, R.; Mauser, W. Land use dependent snow cover retrieval using multitemporal, multisensoral SAR images to drive operational flood forecasting models. In Proceedings of the EARSeL-LISSIG-Workshop on Observing our Cryosphere from Space, Bern, Switzerland, 11–14 March 2002. [Google Scholar]
- Nagler, T.; Rott, H.; Ossowska, J.; Schwaizer, G.; Small, D.; Malnes, E.; Pinnock, S. Snow cover monitoring by synergistic use of Sentinel-3 Slstr and Sentinel-L Sar data. In Proceedings of the IEEE International Geoscience and Remote Sensing Symposium, Valencia, Spain, 22–27 July 2018. [Google Scholar] [CrossRef]
- Dumont, M.; Gascoin, S. Optical Remote Sensing of Snow Cover. In Book Land Surface Remote Sensing in Continental Hydrology, 1st ed.; Baghdadi, N.A., Zibri, M., Eds.; ISTE Press—Elsevier: London, UK, 2016; pp. 115–137. [Google Scholar] [CrossRef]
- Hall, D.K.; Riggs, G.A.; Salomonson, V.V. Development of methods for mapping global snow cover using moderate resolution imaging spectroradiometer data. Remote Sens. Environ. 1995, 54, 127–140. [Google Scholar] [CrossRef]
- Hall, D.K.; Riggs, G.A.; Salomonson, V.V.; DiGirolamo, N.E.; Bayr, K.J. MODIS snow-cover products. Remote Sens. Environ. 2002, 83, 181–194. [Google Scholar] [CrossRef]
- Vikhamar, D.; Solberg, R. Subpixel mapping of snow cover in forests by optical remote sensing. Remote Sens. Environ. 2003, 84, 69–82. [Google Scholar] [CrossRef]
- Macander, M.J.; Swingley, C.S.; Joly, K.; Raynolds, M.K. Landsat-based snow persistence map for northwest Alaska. Remote Sens. Environ. 2015, 163, 23–31. [Google Scholar] [CrossRef]
- Heinilä, K.; Salminen, M.; Pulliainen, J.; Cohen, J.; Metsämäki, S.; Pellikka, P. The effect of boreal forest canopy to reflectance of snow covered terrain based on airborne imaging spectrometer observations. Int. J. Appl. Earth Obs. Geoinf. 2014, 27, 31–41. [Google Scholar] [CrossRef]
- Koskinen, J.; Pulliainen, J.; Hallikainen, M. The use of ERS-1 SAR data in snow melt monitoring. IEEE Trans. Geosci. Remote 1997, 35, 601–610. [Google Scholar] [CrossRef]
- Magagi, R.; Bernier, M. Optimal conditions for wet snow detection using RADARSAT-SAT data. Remote Sens. Environ. 2003, 84, 221–233. [Google Scholar] [CrossRef]
- Cohen, J.; Lemmetyinen, J.; Pulliainen, J.; Heinila, K.; Montomoli, F.; Seppanen, J.; Hallikainen, M.T. The effect of Boreal Forest Canopy in Satellite Snow Mapping—A Multisensor Analysis. IEEE Trans. Geosci. Remote 2015, 53, 6593–6607. [Google Scholar] [CrossRef]
- Baghdadi, N.; Gauthier, Y.; Bernier, M.; Fortin, J.P. Potential and limitations of RADARSAT SAR data for wet snow monitoring. IEEE Trans. Geosci. Remote 2000, 38, 316–320. [Google Scholar] [CrossRef]


| Month/Range | Sierra Nevada | Central System | Iberian Range | Cantabrian System | Pyrenees |
|---|---|---|---|---|---|
| November | −1.6 | −1.17 | −1.17 | −1.12 1 | −1.13 |
| December | −2.71 | −4.45 | −2.98 | −4.39 | −2.65 |
| January | −3.41 | −2.54 | −3.15 | −6.26 | −1.08 |
| February | −1.9 | −1.42 | −0.51 | +0.17 | −0.99 |
| March | −2.82 | −2.06 | −2.45 | −1.76 | +0.88 |
| April | −0.6 | +0.32 | +0.04 | +0.2 | −0.99 |
| May | −1.08 | −0.18 | −0.1 | −0.33 | −0.75 |
Disclaimer/Publisher’s Note: The statements, opinions and data contained in all publications are solely those of the individual author(s) and contributor(s) and not of MDPI and/or the editor(s). MDPI and/or the editor(s) disclaim responsibility for any injury to people or property resulting from any ideas, methods, instructions or products referred to in the content. |
© 2024 by the authors. Licensee MDPI, Basel, Switzerland. This article is an open access article distributed under the terms and conditions of the Creative Commons Attribution (CC BY) license (https://creativecommons.org/licenses/by/4.0/).
Share and Cite
Hidalgo-Hidalgo, J.-D.; Collados-Lara, A.-J.; Pulido-Velazquez, D.; Fassnacht, S.R.; Husillos, C. Synergistic Potential of Optical and Radar Remote Sensing for Snow Cover Monitoring. Remote Sens. 2024, 16, 3705. https://doi.org/10.3390/rs16193705
Hidalgo-Hidalgo J-D, Collados-Lara A-J, Pulido-Velazquez D, Fassnacht SR, Husillos C. Synergistic Potential of Optical and Radar Remote Sensing for Snow Cover Monitoring. Remote Sensing. 2024; 16(19):3705. https://doi.org/10.3390/rs16193705
Chicago/Turabian StyleHidalgo-Hidalgo, Jose-David, Antonio-Juan Collados-Lara, David Pulido-Velazquez, Steven R. Fassnacht, and C. Husillos. 2024. "Synergistic Potential of Optical and Radar Remote Sensing for Snow Cover Monitoring" Remote Sensing 16, no. 19: 3705. https://doi.org/10.3390/rs16193705