Article

Automatic Landslide Detection in Gansu, China, Based on InSAR Phase Gradient Stacking and AttU-Net

1
College of Geographic Science, Hunan Normal University, Changsha 410081, China
2
Key Laboratory of Geospatial Big Data Mining and Application, Hunan Normal University, Changsha 410081, China
3
School of Geosciences and Info-Physics, Central South University, Changsha 410083, China
4
China Institute of Geo-Environmental Monitoring, Beijing 100081, China
5
Observation and Research Station of Geological Hazard in Sichuan Ya’an, Ministry of Natural Resources, Ya’an 625000, China
*
Author to whom correspondence should be addressed.
Remote Sens. 2024, 16(19), 3711; https://doi.org/10.3390/rs16193711 (registering DOI)
Submission received: 17 August 2024 / Revised: 23 September 2024 / Accepted: 3 October 2024 / Published: 5 October 2024

Abstract

:
Landslides are the most serious geological disaster in our country, causing economic losses. Because they go undetected, a large number of landslides that have caused disasters are not in the catalogue. At present, Interferometric Synthetic Aperture Radar (InSAR) has been widely used in the identification of landslides. However, it is time-consuming, inefficient, etc., to survey landslides throughout our large country. In the context of massive SAR data, this problem is more obvious. Therefore, based on the current technique of using differential interferogram phase gradient stacking to avoid phase unwrapping errors, a landslide phase gradient dataset has been constructed. To validate the dataset’s effectiveness and applicability, deep learning methods were introduced, applying the dataset to four networks: U-Net, Attention-Unet, Bisenet v2, and Deeplab v3. The results indicate that the phase gradient dataset performs well across different models, with the Attention-Unet network demonstrating the best performance. Specifically, the precision, recall, and accuracy on the test dataset were 0.8771, 0.8712, and 0.9834, respectively, and the accuracy on the validation dataset was 0.8523. Finally, in this paper, the model is applied to landslide identification in Gansu Province, China, during 2022-2023, and a total of 1882 landslides are found. These landslides are mainly concentrated in the south of Gansu Province, where the terrain is relatively undulating. The results show that this method can quickly and accurately realize landslide automatic identification in a wide area and provide technical support for large-scale landslide disaster surveys.

1. Introduction

Landslides, as a frequent and highly destructive geological hazard, are particularly prevalent in steep mountainous regions, where their occurrence is primarily rooted in soil downslope movements under the influence of gravity. The intensification of earthquakes, frequent rainfall, and human activities have expedited this process, rendering China, a country characterized by complex geographical landscapes, variable climates, and intricate geological structures, chronically vulnerable to geological disasters [1,2,3]. Gansu Province is located in northwest China, located at the intersection of three plateaus: the Loess Plateau, Inner Mongolia Plateau, and Qinghai–Tibet Plateau. With unique geological conditions, the loess is loose and collapses easily in response to water, which increases the risk of landslides [4]. Additionally, the province’s steep terrain, particularly in mountainous and river valley regions, provides a favorable environment for landslide occurrences. Furthermore, the concentrated precipitation, especially during summer, leads to an increased soil moisture content, compromising soil stability. Consequently, Gansu Province has a long history of frequent landslides, characterized by small-scale but widespread events, underscoring the paramount importance of landslide monitoring and hazard identification to safeguard human lives and property.
Confronting the challenge of landslide monitoring and identification, Interferometric Synthetic Aperture Radar (InSAR) technology has emerged as a preeminent tool in the field of geological disaster monitoring due to its remarkable capabilities of all-weather operation, large-scale coverage, high spatial resolution, and precision. By capturing subtle surface deformations, InSAR precisely locates potential disaster sites, offering robust technical support for geological disaster prevention and mitigation, with notable achievements in practice [5].
While InSAR demonstrates immense potential in landslide detection [6,7], its application confronts several challenges. Traditional approaches rely heavily on the manual interpretation of imaging deformation monitoring, which, though revealing surface anomalies, is often hindered by natural factors such as vegetation cover and geometric distortions, leading to subjective interpretations and discrepancies [8,9,10]. Moreover, prolonged surface changes complicate phase unwrapping in data processing, further exacerbating interpretation difficulties.
To overcome these limitations, we innovatively introduce the phase gradient stacking method for the rapid identification of landslide hazard points. This method ingeniously utilizes phase gradient information from differential interferograms, not only effectively highlighting small-scale displacement variations caused by landslides but also significantly reducing data noise through stacking techniques. Bypassing complex phase unwrapping steps, it vastly enhances computational efficiency and accuracy [11,12]. This breakthrough paves a new avenue for refined and efficient landslide identification [12,13,14].
Amidst the thriving development of deep learning technologies, particularly the remarkable performance of Convolutional Neural Networks (CNNs) in optical remote sensing [15,16], we are keenly aware that integrating this cutting-edge technology with InSAR will revolutionize automatic landslide identification. The current research predominantly focuses on volcanoes and earthquakes [17,18,19,20,21,22,23], where detection performance hinges on the size of datasets, a resource-intensive requirement. Moreover, the peculiarities of InSAR landslide signatures, such as their concealment and irregular shapes, may hinder optimal performance when directly applying deep learning models. Nevertheless, our work boldly explores this frontier, fully acknowledging the uniqueness of landslide deformation signatures in InSAR differential interferograms. By leveraging phase gradient stacking to emphasize landslide deformation features and integrating these stacked images with a deep learning network, specifically our designed Attention U-Net (AttU-Net) network, we achieve the faster and more accurate intelligent identification of landslide deformation areas [24].
Specifically, leveraging the advantages of the phase gradient stacking method, we have constructed a dedicated landslide dataset and developed the AttU-Net network model. Through the precise segmentation of phase-gradient stacked images, this approach is successfully applied to large-scale automatic landslide identification tasks in Gansu Province. Practical results demonstrate that this method not only enhances the accuracy and efficiency of landslide identification but also showcases robust generalization capabilities in complex geological environments, providing a more reliable technical foundation for early warning and response mechanisms for geological disasters.
The structure of this paper is concisely outlined as follows: Section 2 introduces the study area and the data sources utilized in our research. Section 3 delves into the methodological framework, encompassing the phase gradient stacking method, Attention U-Net, and the model training datasets and their application. Section 4 discusses and analyzes the experimental results obtained while Section 5 summarizes the key contributions of this work.

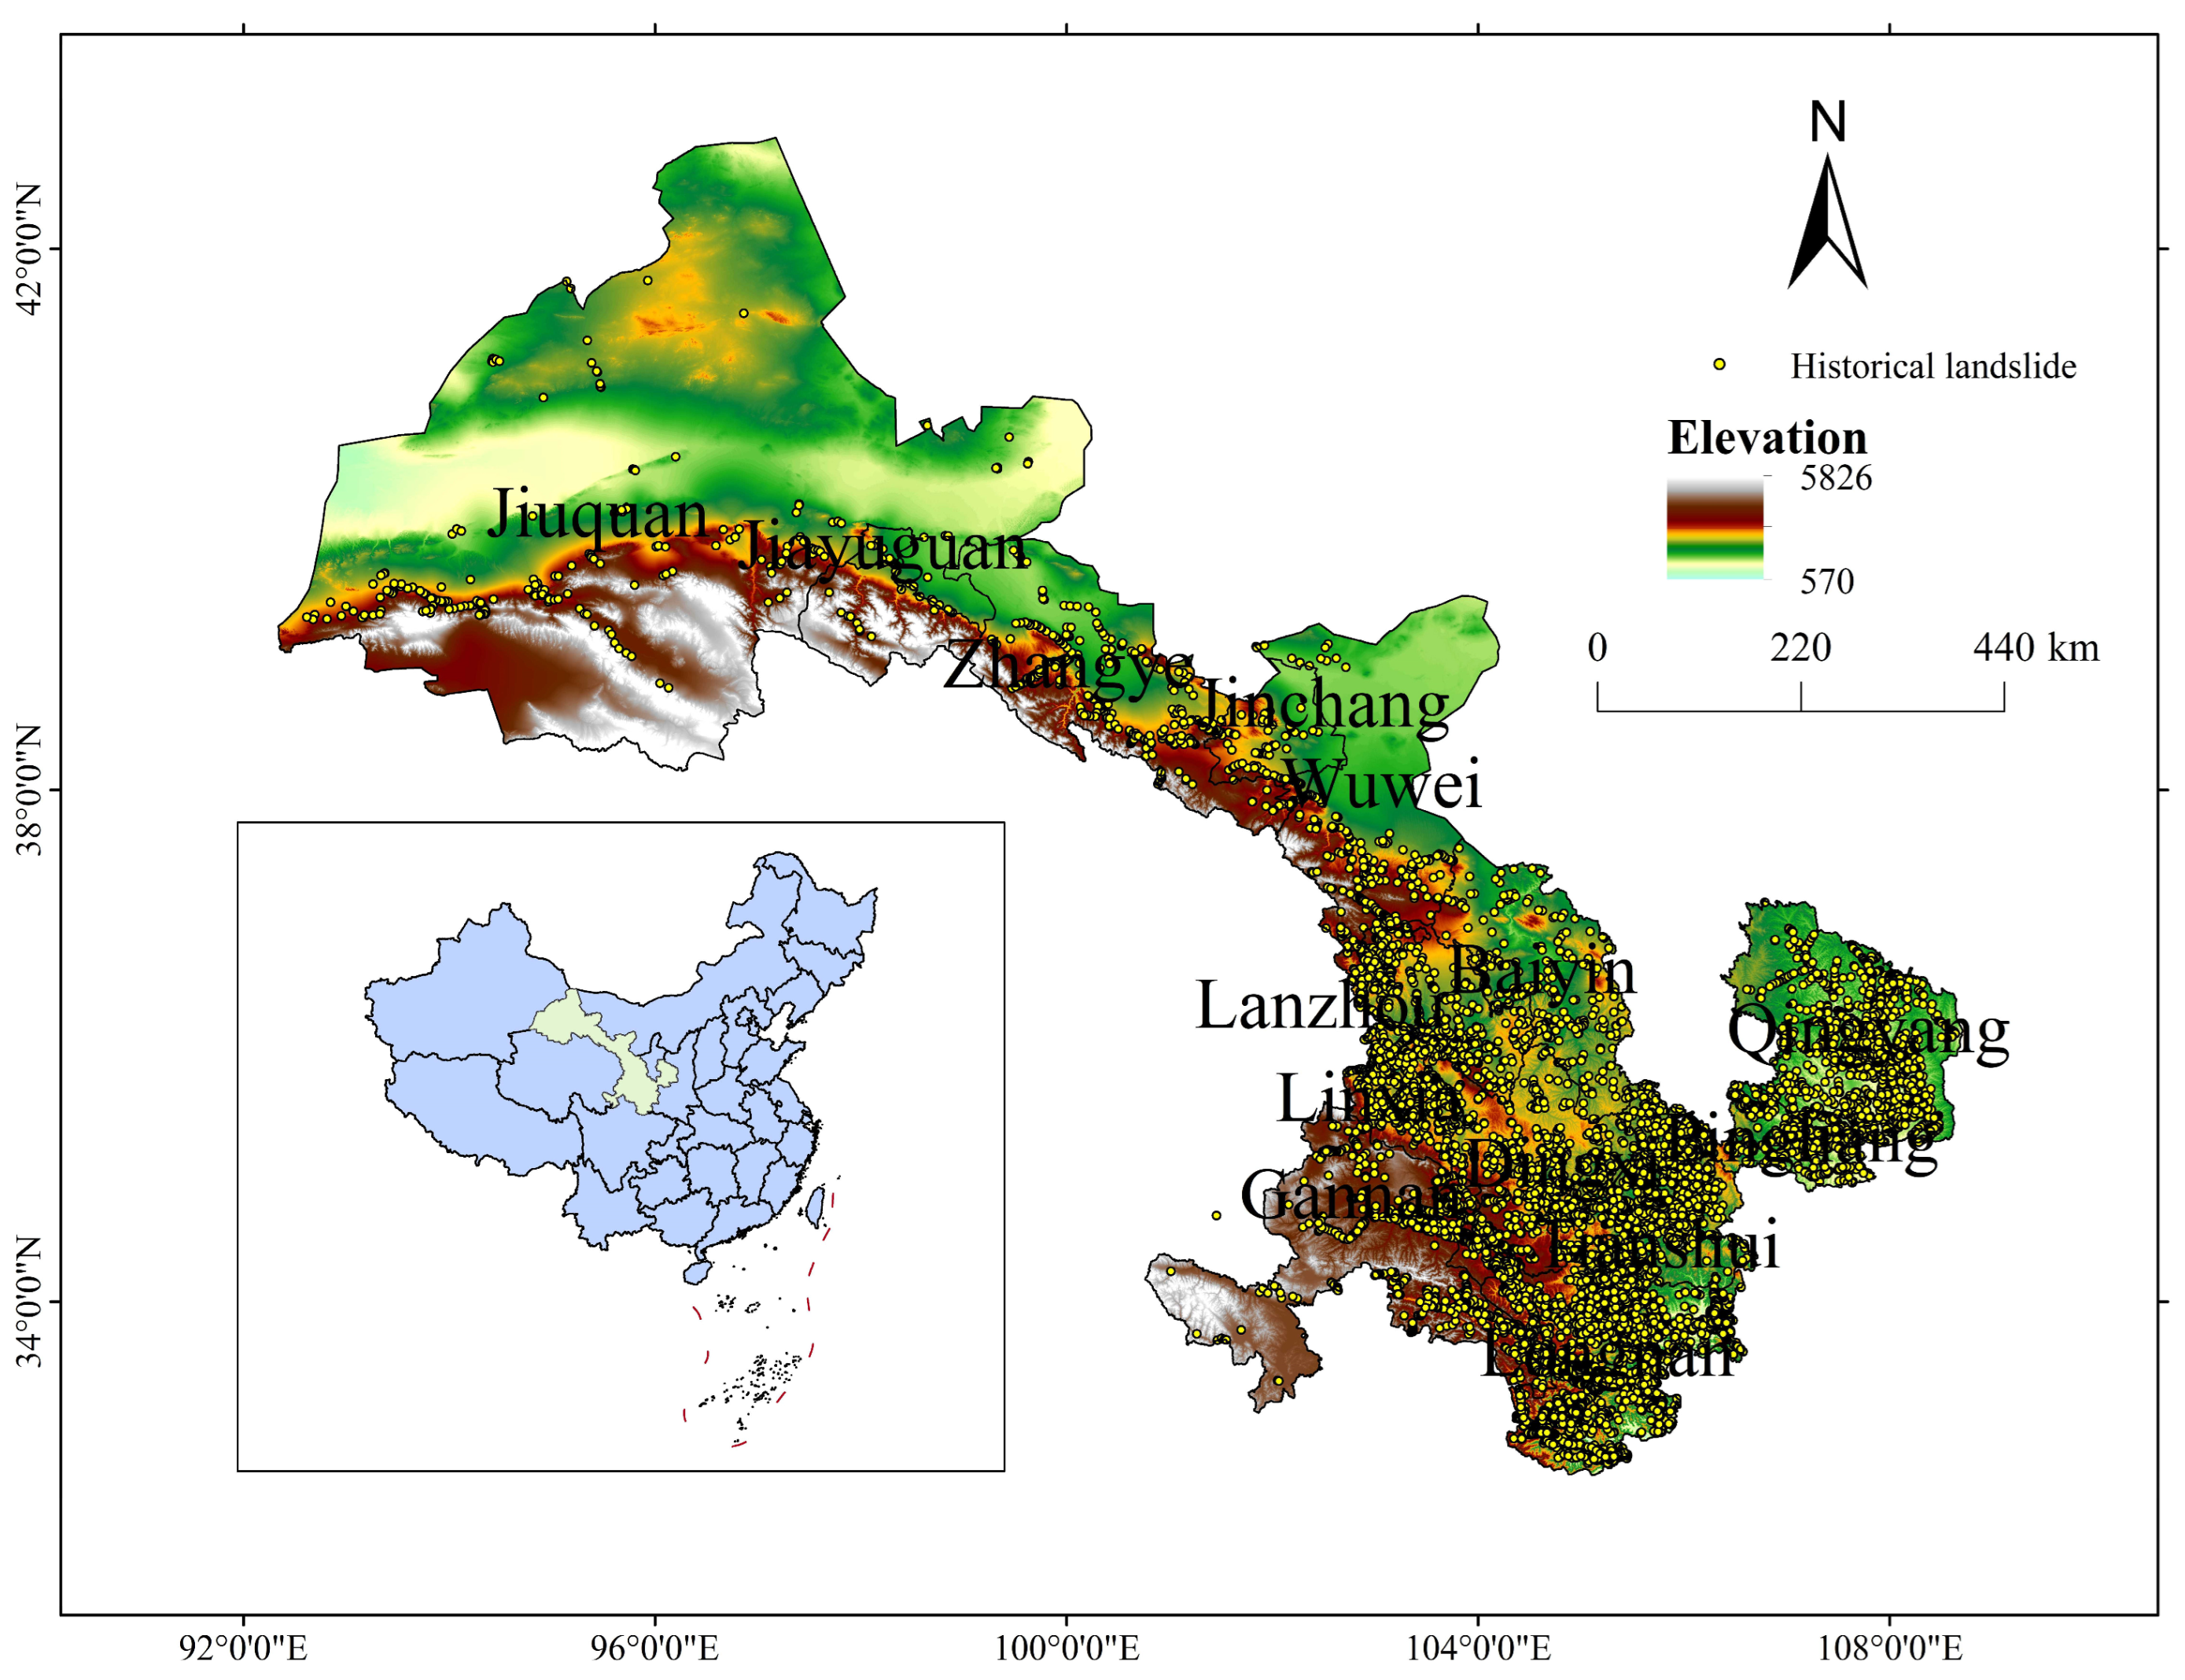
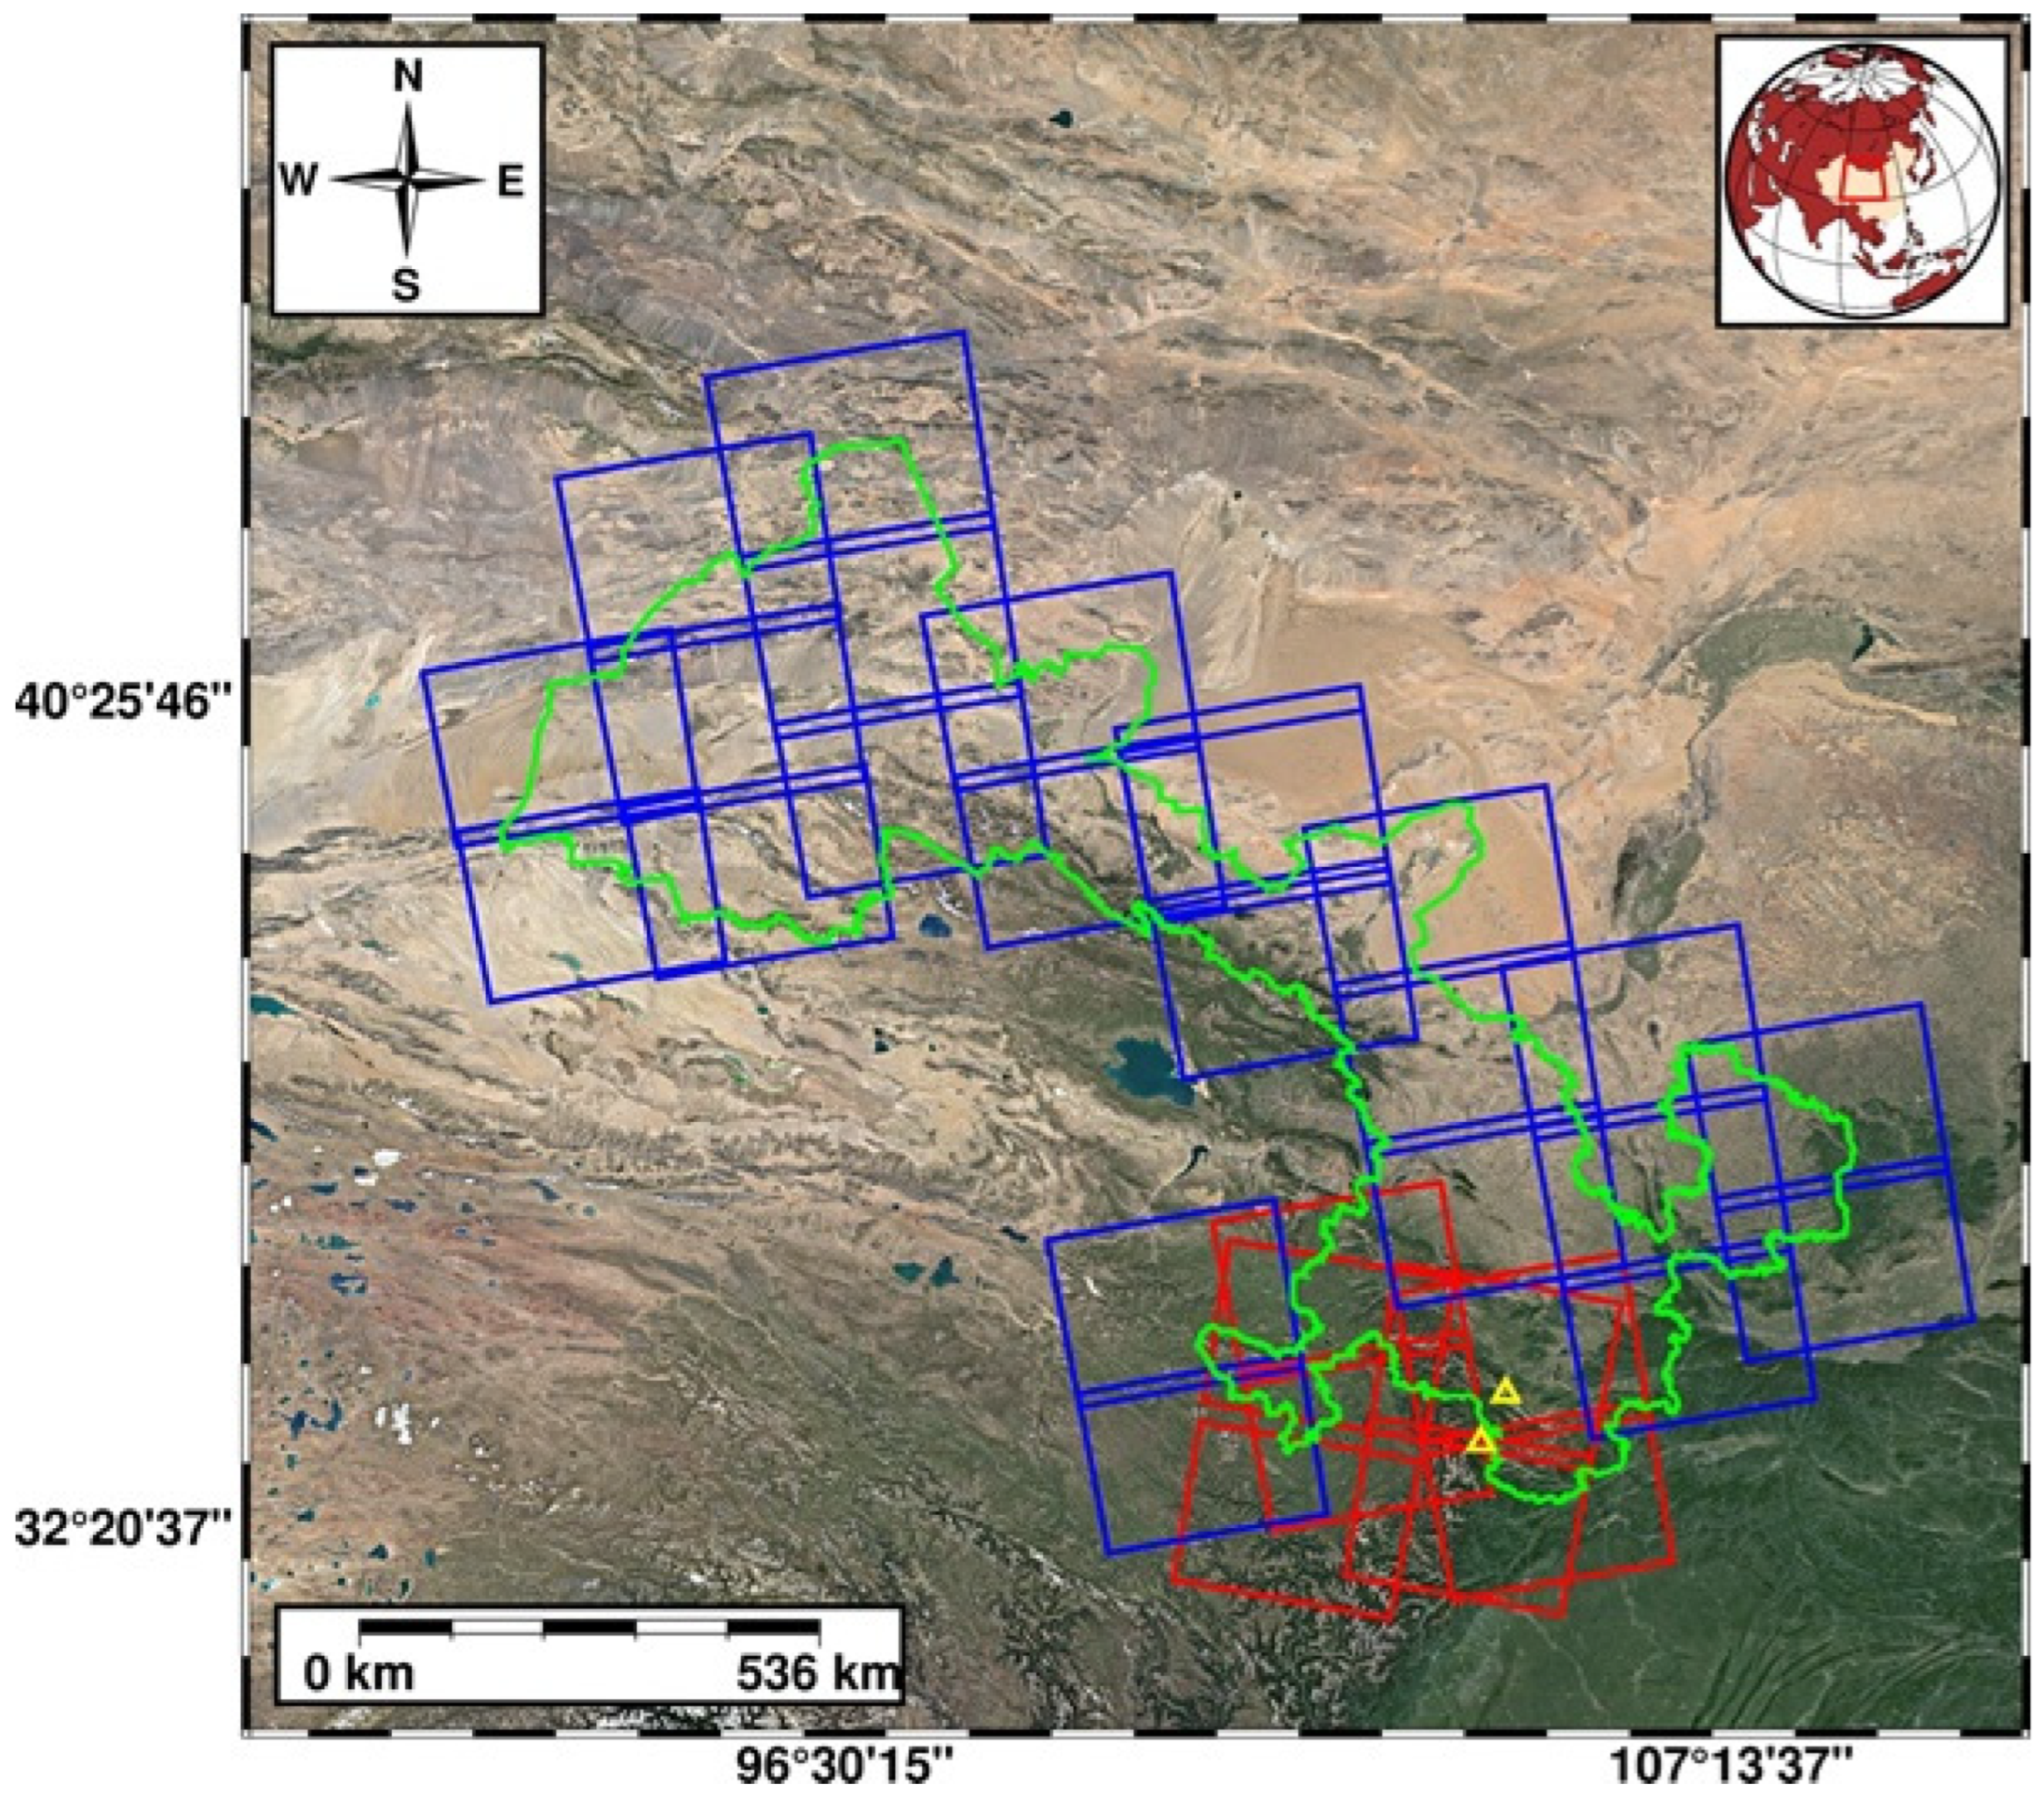
2. Study Area and Materials
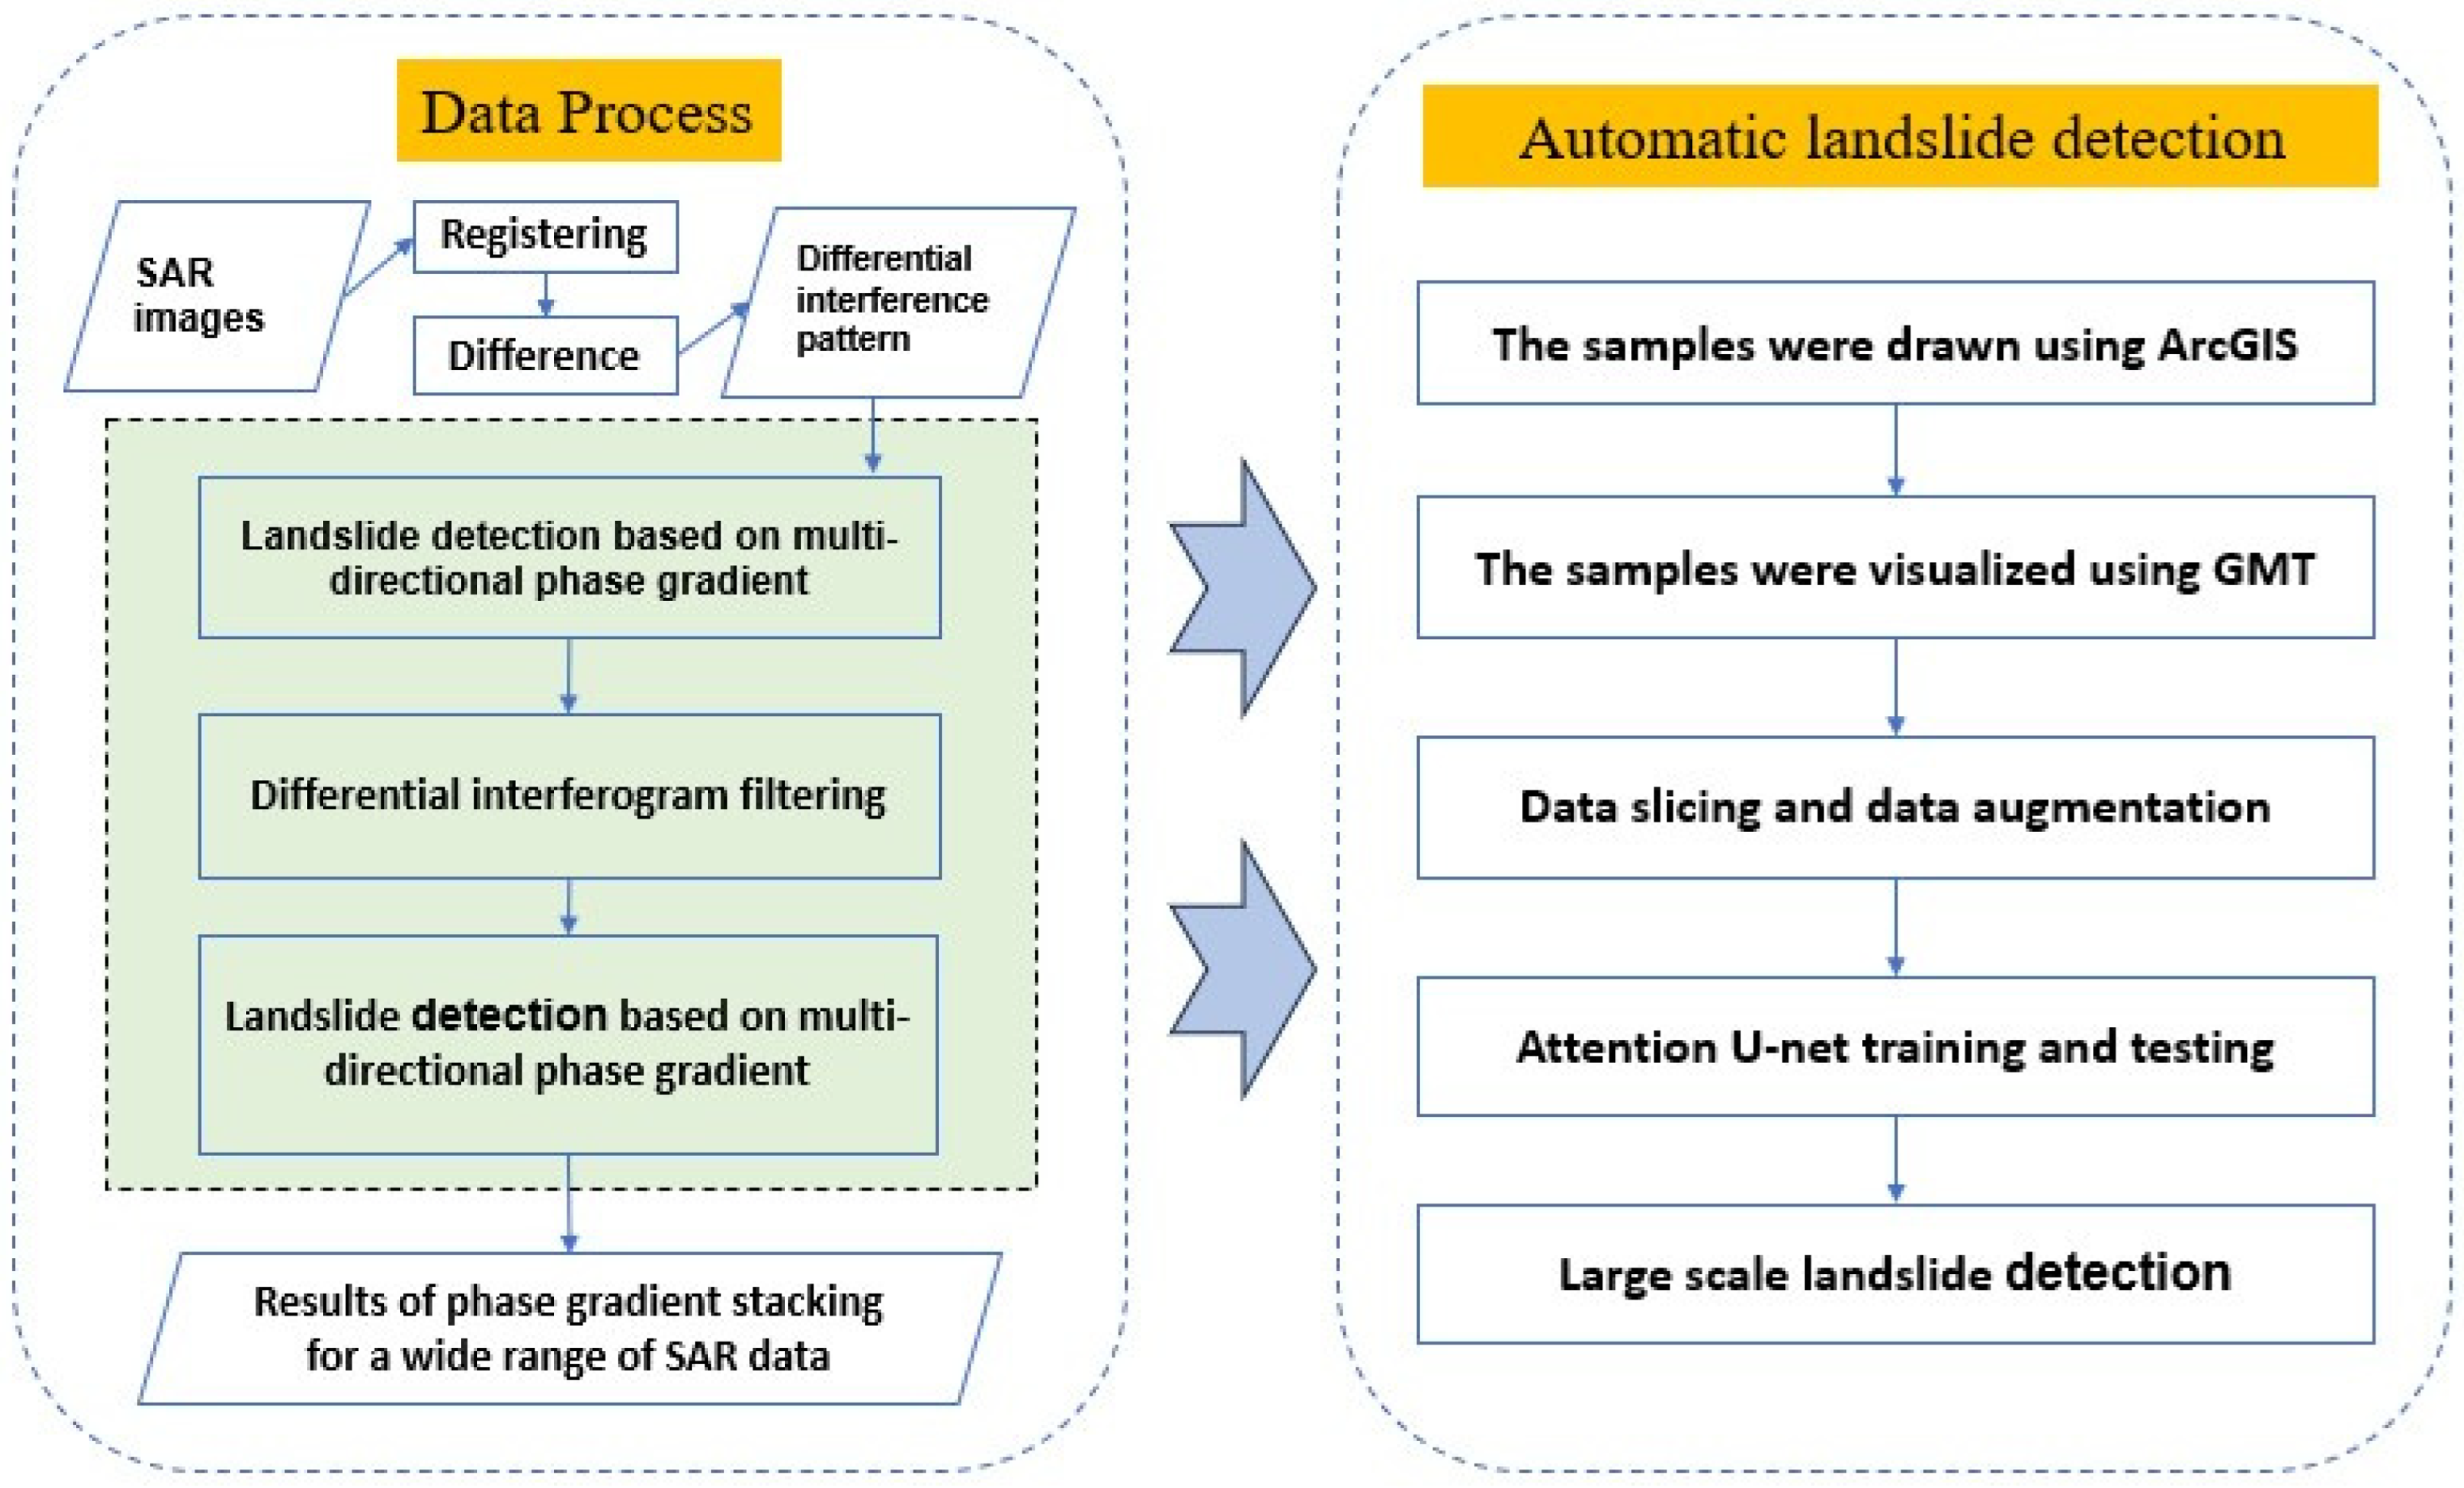
Gansu Province is in the northwest of China. Its longitude ranges from 92.32° to 108.72° and its latitude ranges from 32.56° to 42.77°. It spans about 1450 km from east to west and is adjacent to six provinces in total. Many geological tectonic movements lead to earthquakes, resulting in landslides. Figure 1 shows both the administrative zoning map of Gansu Province as well as its overall elevation and the distribution of historical landslide points. The landslide data come from the global disaster data platform and a total of 10,639 landslides have been collected for Gansu Province. The overall elevation of Gansu Province is high in the southwest and low in the northeast.
The SAR data used in this paper are from Sentinel-1, which consist of two parts. One part has been used to construct the phase gradient dataset. The data collected cover southern Gansu Province and northern Sichuan Province from January 2021 to December 2022, with about 50 images per orbit. Detailed information is shown in Table 1. The second part of the SAR data covers the whole area of Gansu Province and a total of 26 elevation orbit Sentinel-1A maps are needed to cover the whole area. The Sentinel-1A data used for landslide automatic identification in Gansu Province in this paper span from January 2022 to June 2023. Due to the absence of data for some tracks, the time periods and image quantities obtained by different tracks are varied. The image time span of 26 orbits and the number of Sentinel-1A images used by each orbit are shown in Table 2. The coverage of all the SAR data is shown in Figure 2. The DEM data used for differential interferometry processing are of Copernican DEM with a resolution of 30 m.

3. Methodology

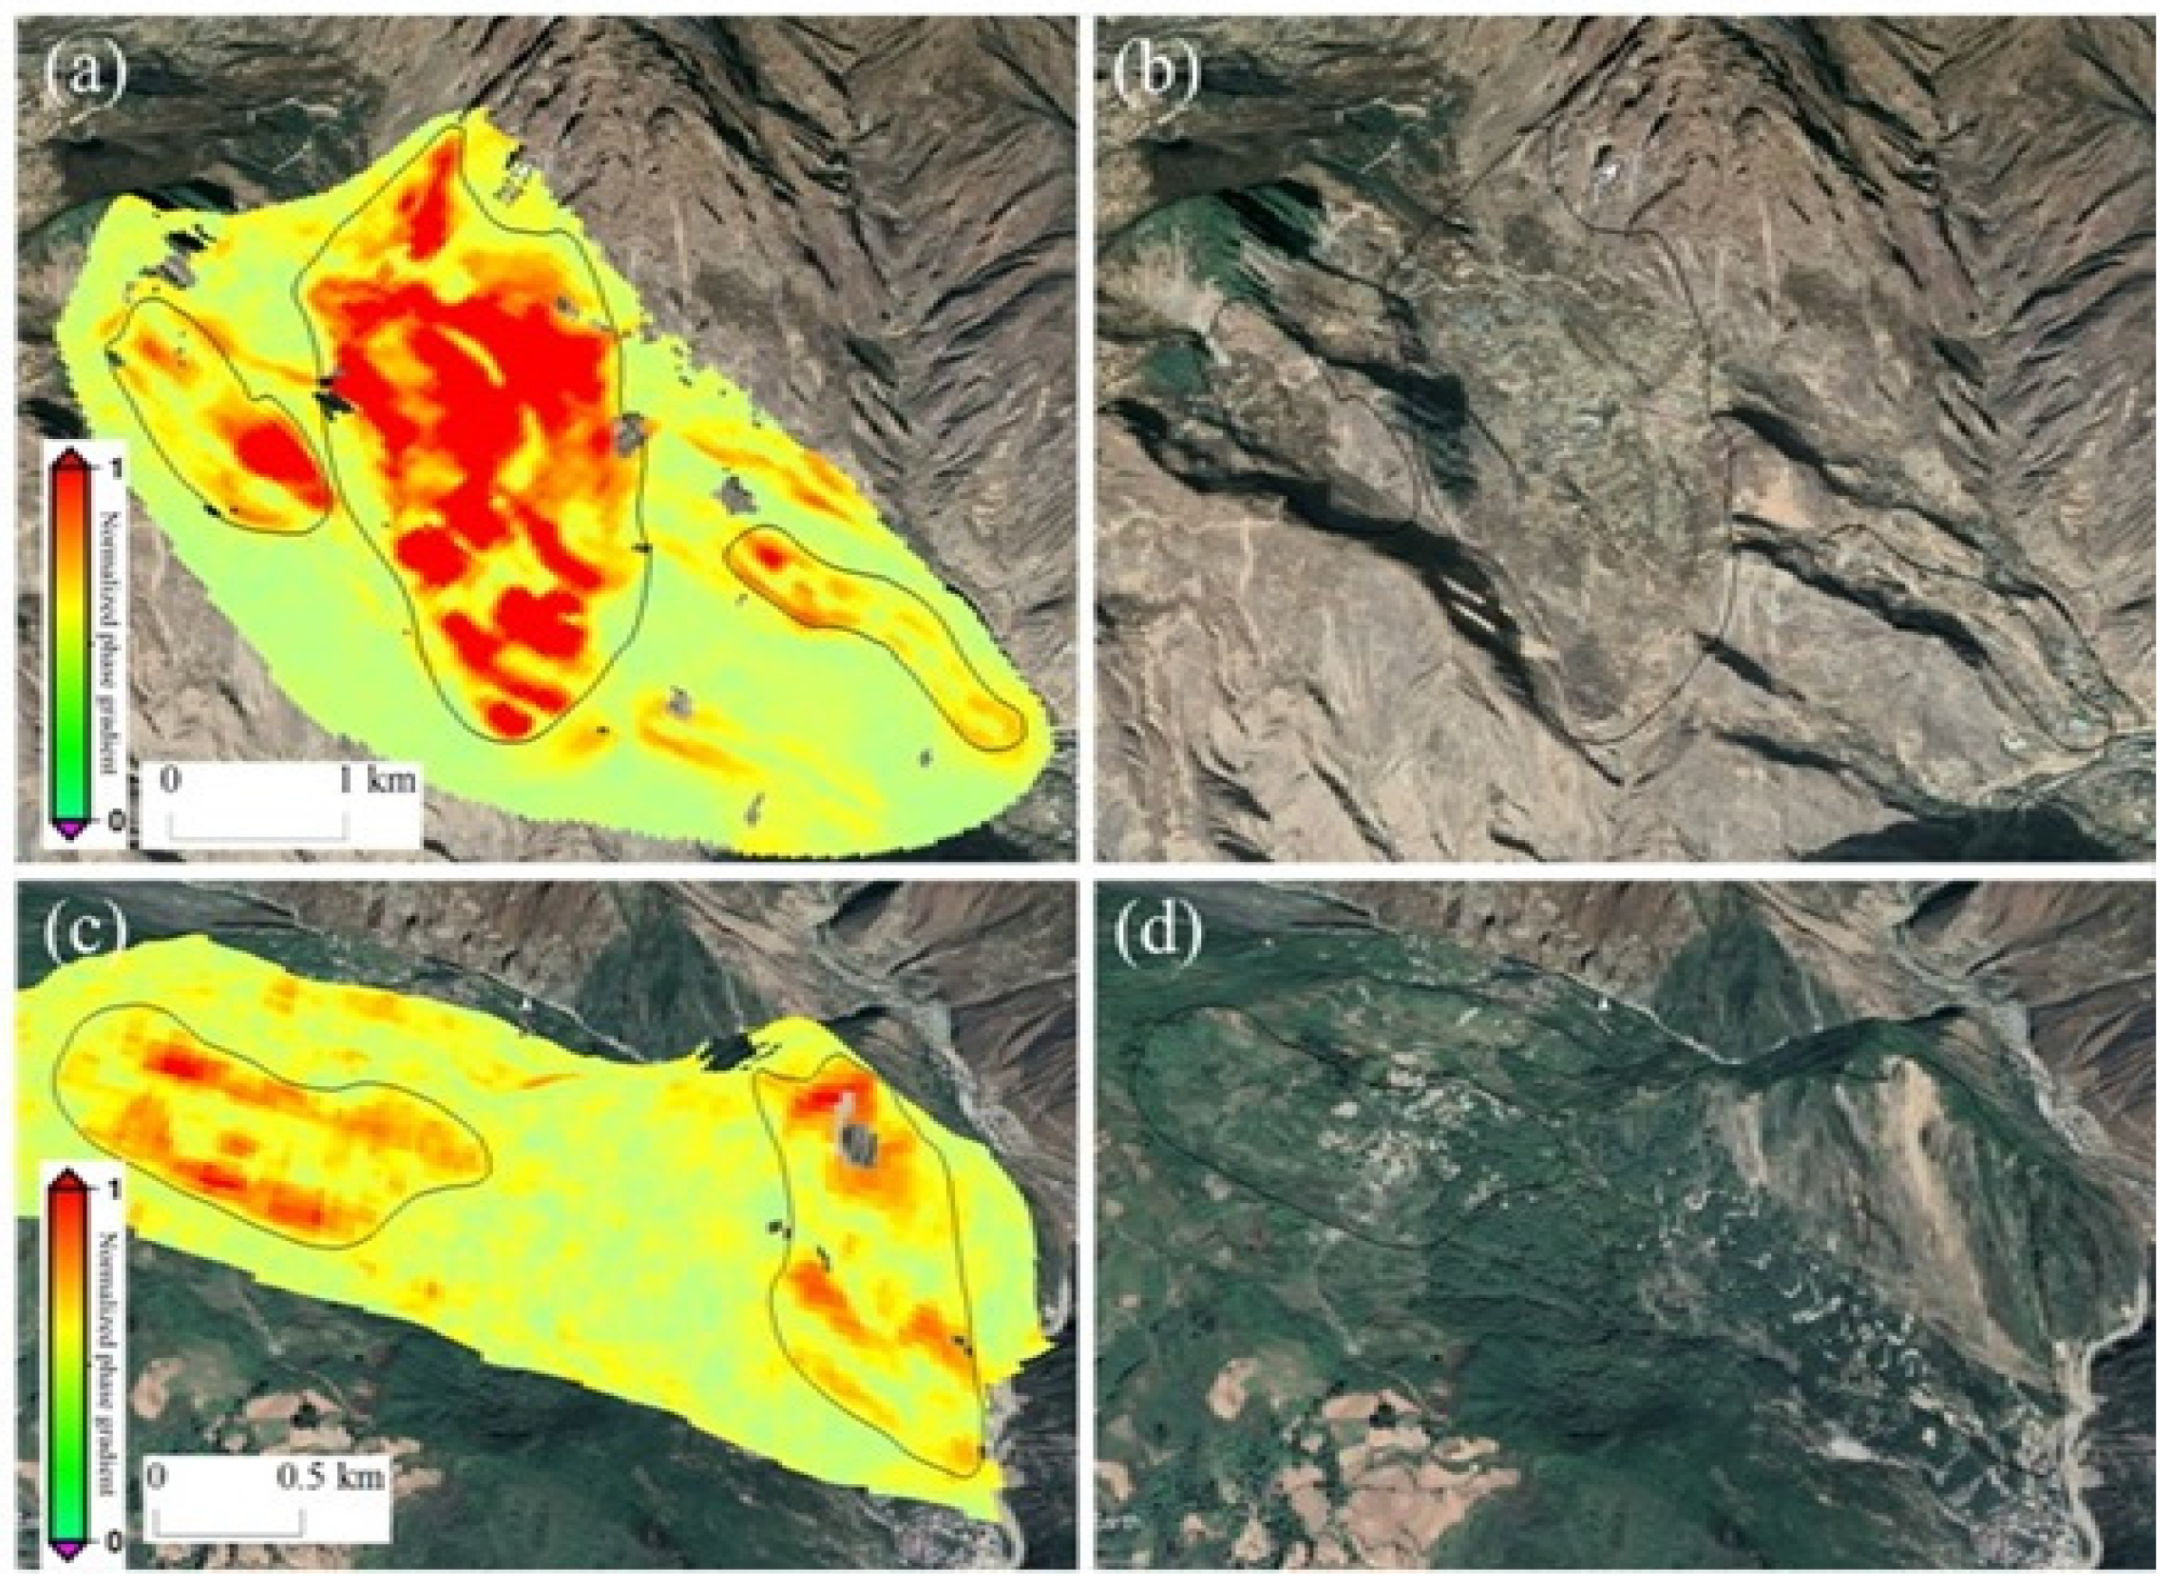
3.1. Phase Gradient Stacking

In this paper, the SLC data in the Sentinel-1A dataset are used, and they are processed using GAMMA software. Since this paper mainly uses the phase gradient stacking of differential interferograms to detect landslides, the main steps include SAR data registration, baseline estimation, differential interferometry, and other preprocessing steps. Secondly, because there is a lot of noise in the SAR images, multi-view is used to suppress noise when processing them. Multi-view mainly averages the signals in a window to improve the intensity of information, but it also sacrifices the spatial resolution. Therefore, an appropriate multi-view ratio is also the influential factor in whether the landslide signal can be detected. Considering that the sizes of landslides are different—some span a few thousand meters and some only tens of meters—we choose a multi-view window with a distance of 8 and a direction of 2 when processing. After the pretreatment, we obtain the differential interferogram based on InSAR technology and then apply the multi-direction phase gradient superposition method for further analysis. The first step of the method is to obtain the differential interferogram of the small baseline set by preprocessing, then calculate the phase gradients in the four main directions by using the central difference method. Then, the phase gradients are summed using the time-base weighted method and the fusion results of the phase gradients in four directions are obtained by absolute summation. After normalization, the final phase gradient superposition diagram is obtained [12].
The multi-directional phase gradient stacking method is used for landslide detection and the ground deformation is identified by using the phase information of the differential interferogram of the synthetic aperture radar (SAR). Firstly, SAR data at multiple time points are collected and digital elevation model (DEM) is prepared. Then, the SAR image is geocoded and processed differentially and the differential interferogram (DInSAR) is calculated to obtain the interference image [13]. Then, the phase gradients are calculated in four main directions: 0, 45, 90, and 135. The gradient calculation formula for each direction is shown in Equation (1).
φ 0 ( i , j ) = φ i , j + 1 φ i , j 1 φ 45 ( i , j ) = φ i 1 , j + 1 φ i + 1 , j 1 φ 90 ( i , j ) = φ i 1 , j φ i + 1 , j φ 135 ( i , j ) = φ i 1 , j 1 φ i + 1 , j + 1
Here, ∆φ0, ∆φ45, ∆φ90, and ∆φ135 each represent the phase gradient in a certain direction of the central pixel, and we define the phase gradient ∆φ0 in the azimuth direction, the phase gradient ∆φ45 in the upper right corner, ∆φ90 in the azimuth direction, and ∆φ135 in the upper left corner.
Then, the phase gradients in four directions are weighted and superimposed, and the weight of each direction is adjusted by using the time baseline to eliminate the atmospheric effect. The weighted superposition formula is shown in Equation (2).
G k = n = 1 M T n φ 0 n / n = 1 M T n 2
Here, Gk represents the result of phase gradient superposition in each direction, and the values of k are 0, 45, 90, and 135, representing the results of phase gradient superposition in four directions; M represents the number of differential interferograms we used for phase gradient superposition; T represents the time baseline of the two-scene composite image of the differential interferogram.
Then, median filtering and Gaussian filtering are used to denoise and detect abnormal values to detect landslide areas. Finally, the results are normalized to improve the stability and interpretability of the results, and the formula is shown in Equation (3).
G = ( | G 0 | + | G 45 | + | G 90 | + | G 135 | ) / 4
The creep landslide usually has a long time of fine deformation so as to form a continuous and stable deformation signal in a large number of differential interferograms. In contrast, the noise is still random and can be effectively eliminated by coherence analysis. Therefore, in the result G, the region describing the landslide has a significantly increased gradient value compared to the other regions. In addition, there is a tendency of spatial aggregation in these regions. These areas are defined as landslides.
Landslide detection can be divided into three main stages. First comprises data collection and preprocessing, which include obtaining synthetic aperture radar (SAR) images and digital elevation models (DEMs), geo-referencing the main images, and simulating the terrain in SAR coordinates using DEMs to select interferometric pairs following the small baseline subset (SBAS) method to obtain differential interferograms. The second stage involves the superposition and fusion of multi-directional phase gradients. Here, the phase gradients from four directions are calculated and weighted by the temporal baseline, and then, spatial filtering is applied to remove noise, resulting in a fused phase gradient. Finally, in the landslide detection phase, we utilize the fused multi-directional phase gradients to identify anomalous regions primarily caused by surface deformation. By effectively applying time-series interference patterns, we can mitigate atmospheric effects to accurately identify potential landslide areas. Notably, the calculated phase gradients do not require phase unwrapping, allowing us to directly obtain true gradient values. Additionally, since the phase gradients from multiple interferograms are independent, regions that exhibit low coherence in some interferograms may still show significant deformation signals in others. This approach provides a new perspective and effective tools for landslide monitoring.

3.2. Phase Gradient Dataset

This paper is based on the landslide phase gradient dataset, which has significant advantages and significantly improves its performance in different network architectures. The high spatial resolution of the dataset supports the precise detection of small topographic changes, which is essential for the accurate identification of landslides. Its comprehensive coverage makes it possible to detect landslides effectively in different geographical environments, reducing the risk of missed events. By integrating Sentinel-1A images and Copernicus DEM and other data sources, this dataset can also achieve robust and accurate landslide detection in complex scenarios. The sensitivity of the dataset to small surface changes supports the early detection of landslides while being compatible with a variety of machine learning models, including traditional algorithms and advanced deep learning networks, demonstrating its diversity. In addition, the dataset effectively delineates the landslide boundary, and its powerful visualization ability improves the interpretability and applicability of the data, becoming an important tool for landslide analysis and risk assessment. These advantages have enabled researchers to significantly improve landslide detection performance using different deep learning network architectures.
Based on the processed phase gradient stacking results, we employ a green-to-red color gradient for visualization, where the red areas indicate the landslide regions. Utilizing this characteristic, we initially use ArcGIS 10.4 software to visualize the encoded results and delineate the boundaries of the landslides with vector boxes. To enhance the accuracy of annotation results, we have also collected historical landslide catalogs and Google Earth imagery for auxiliary marking. Ultimately, the landslide regions are represented by polygon shapes, while the remaining areas are designated as the background values. Therefore, the images are classified into two categories: the landslide and non-landslide regions. Since the encoded results are raster data with a resolution of approximately 30 m, some minor landslides may have been missed during the annotation process. Additionally, due to the removal of geometrically distorted areas during data processing, there are void areas in the final encoded results. However, these areas indicate typically steep landslides. Therefore, during annotation, we have also classified regions with obviously high phase gradient stacking values surrounding these void areas as landslide regions. We have also employed a combination of ascending and descending orbit data to compensate for this limitation and detect as many landslides within the scope as possible. The advantage of this treatment method is that it improves the accuracy and completeness of landslide area labeling. By combining ArcGIS vector box rendering, historical landslide records, and Google-image-assisted labeling, landslide and non-landslide areas can be accurately classified. In addition, even when small landslide or geometric distortion areas are encountered during processing, the missed detection is minimized by analyzing the phase-gradient-stack high values and combining the lift rail data. This integrated approach ensures full identification of landslide areas, contributing to more accurate risk assessment and monitoring. The number of landslides in each image is presented in Table 3, and some delineated landslides in the Google Earth images are shown in Figure 3.
After visualizing the data and labels, we slice the visualized results. We crop the data into 512 × 512 sizes using a sliding window with a 128-pixel overlap. This approach prevents the issue of incomplete landslides caused by the partially cropping of some labels. Secondly, since landslides do not exist in the entire area, there will inevitably be redundant data after cropping with the sliding window. Retaining these data can affect the training process, so we remove the slices where the landslide area is less than 5%. Some samples and their corresponding labels are shown in Figure 4. In the labels, the white areas represent the landslides while the black areas represent the non-landslide regions. Through cropping and filtering, we have obtained a total of 709 samples. We use 102 data points from tracks 55~102 for final validation, leaving 607 samples for network training.
We have processed the data from a total of eight tracks to construct the dataset. However, due to the presence of extensive flat areas in some tracks, there are only a few landslides in the results of these tracks. Additionally, we have reserved the data from tracks 55~102 to validate the accuracy of our trained network in detecting large-scale landslides, resulting in a limited amount of data. Therefore, we have employed data augmentation techniques to increase our dataset size. Furthermore, data augmentation can also alleviate the issue of overfitting in the model. This paper has utilized traditional data augmentation methods, including rotation, flipping, and mirroring, to enhance the diversity and quantity of data samples. Through these operations, we have successfully increased the sample size of the original dataset to 2428, making the data richer and more diverse during the training process. Finally, we have divided the 2428 slice samples into training and testing sets at a ratio of 7:3 to train the network.

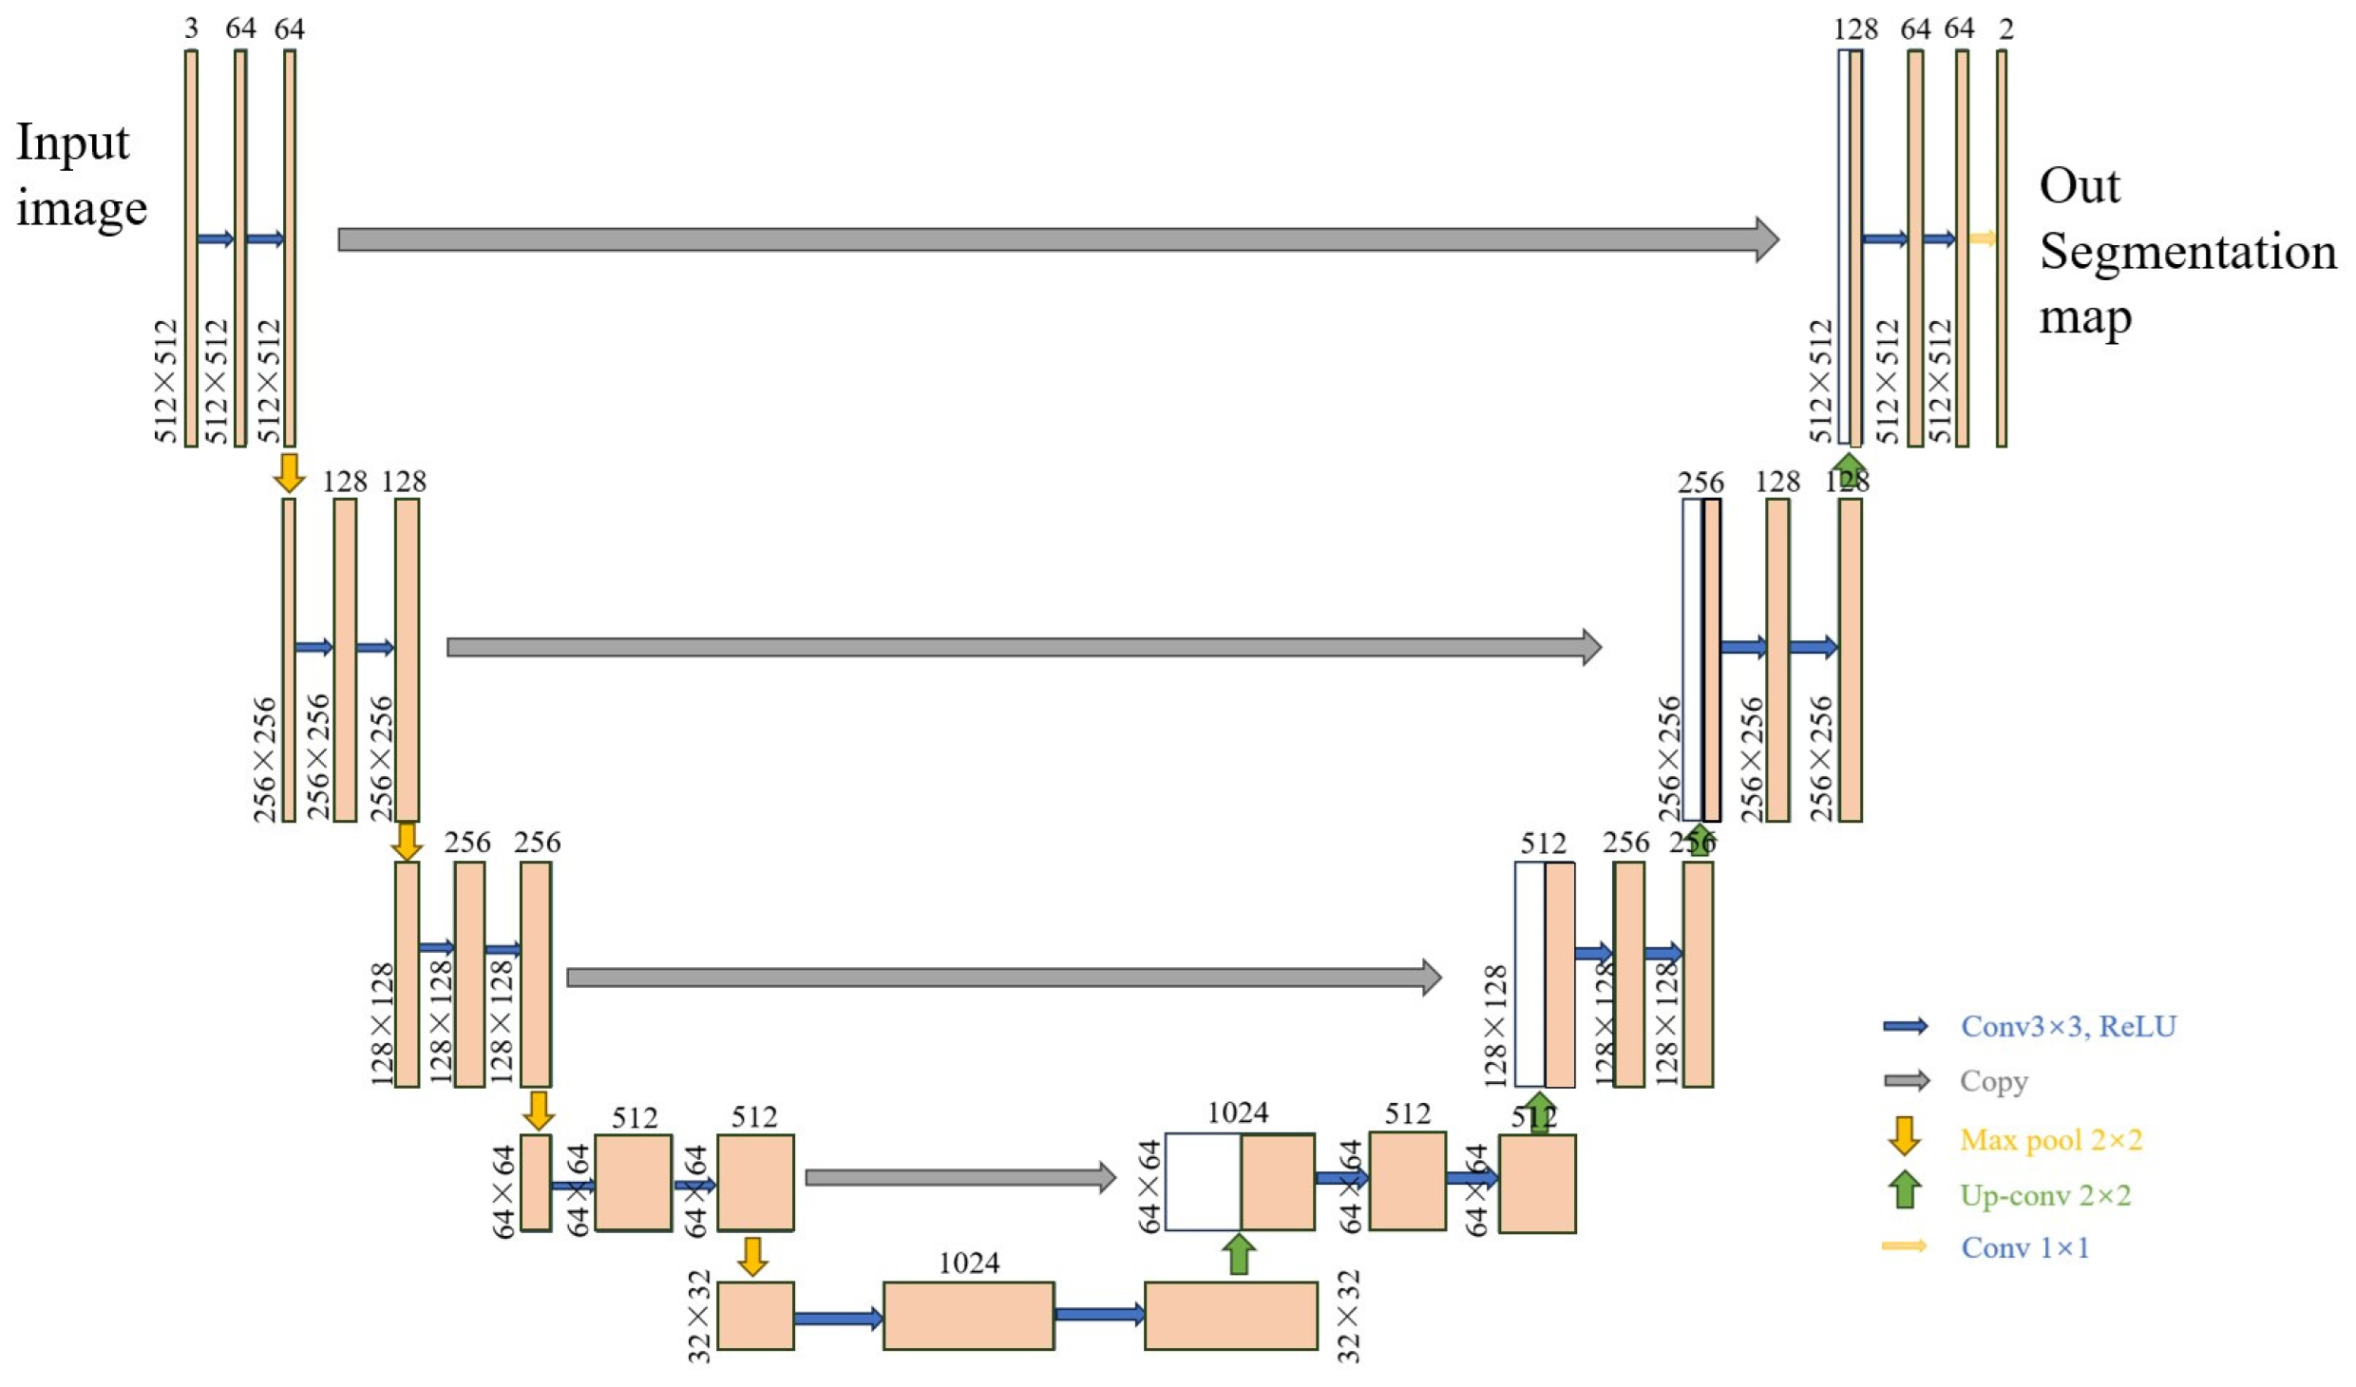
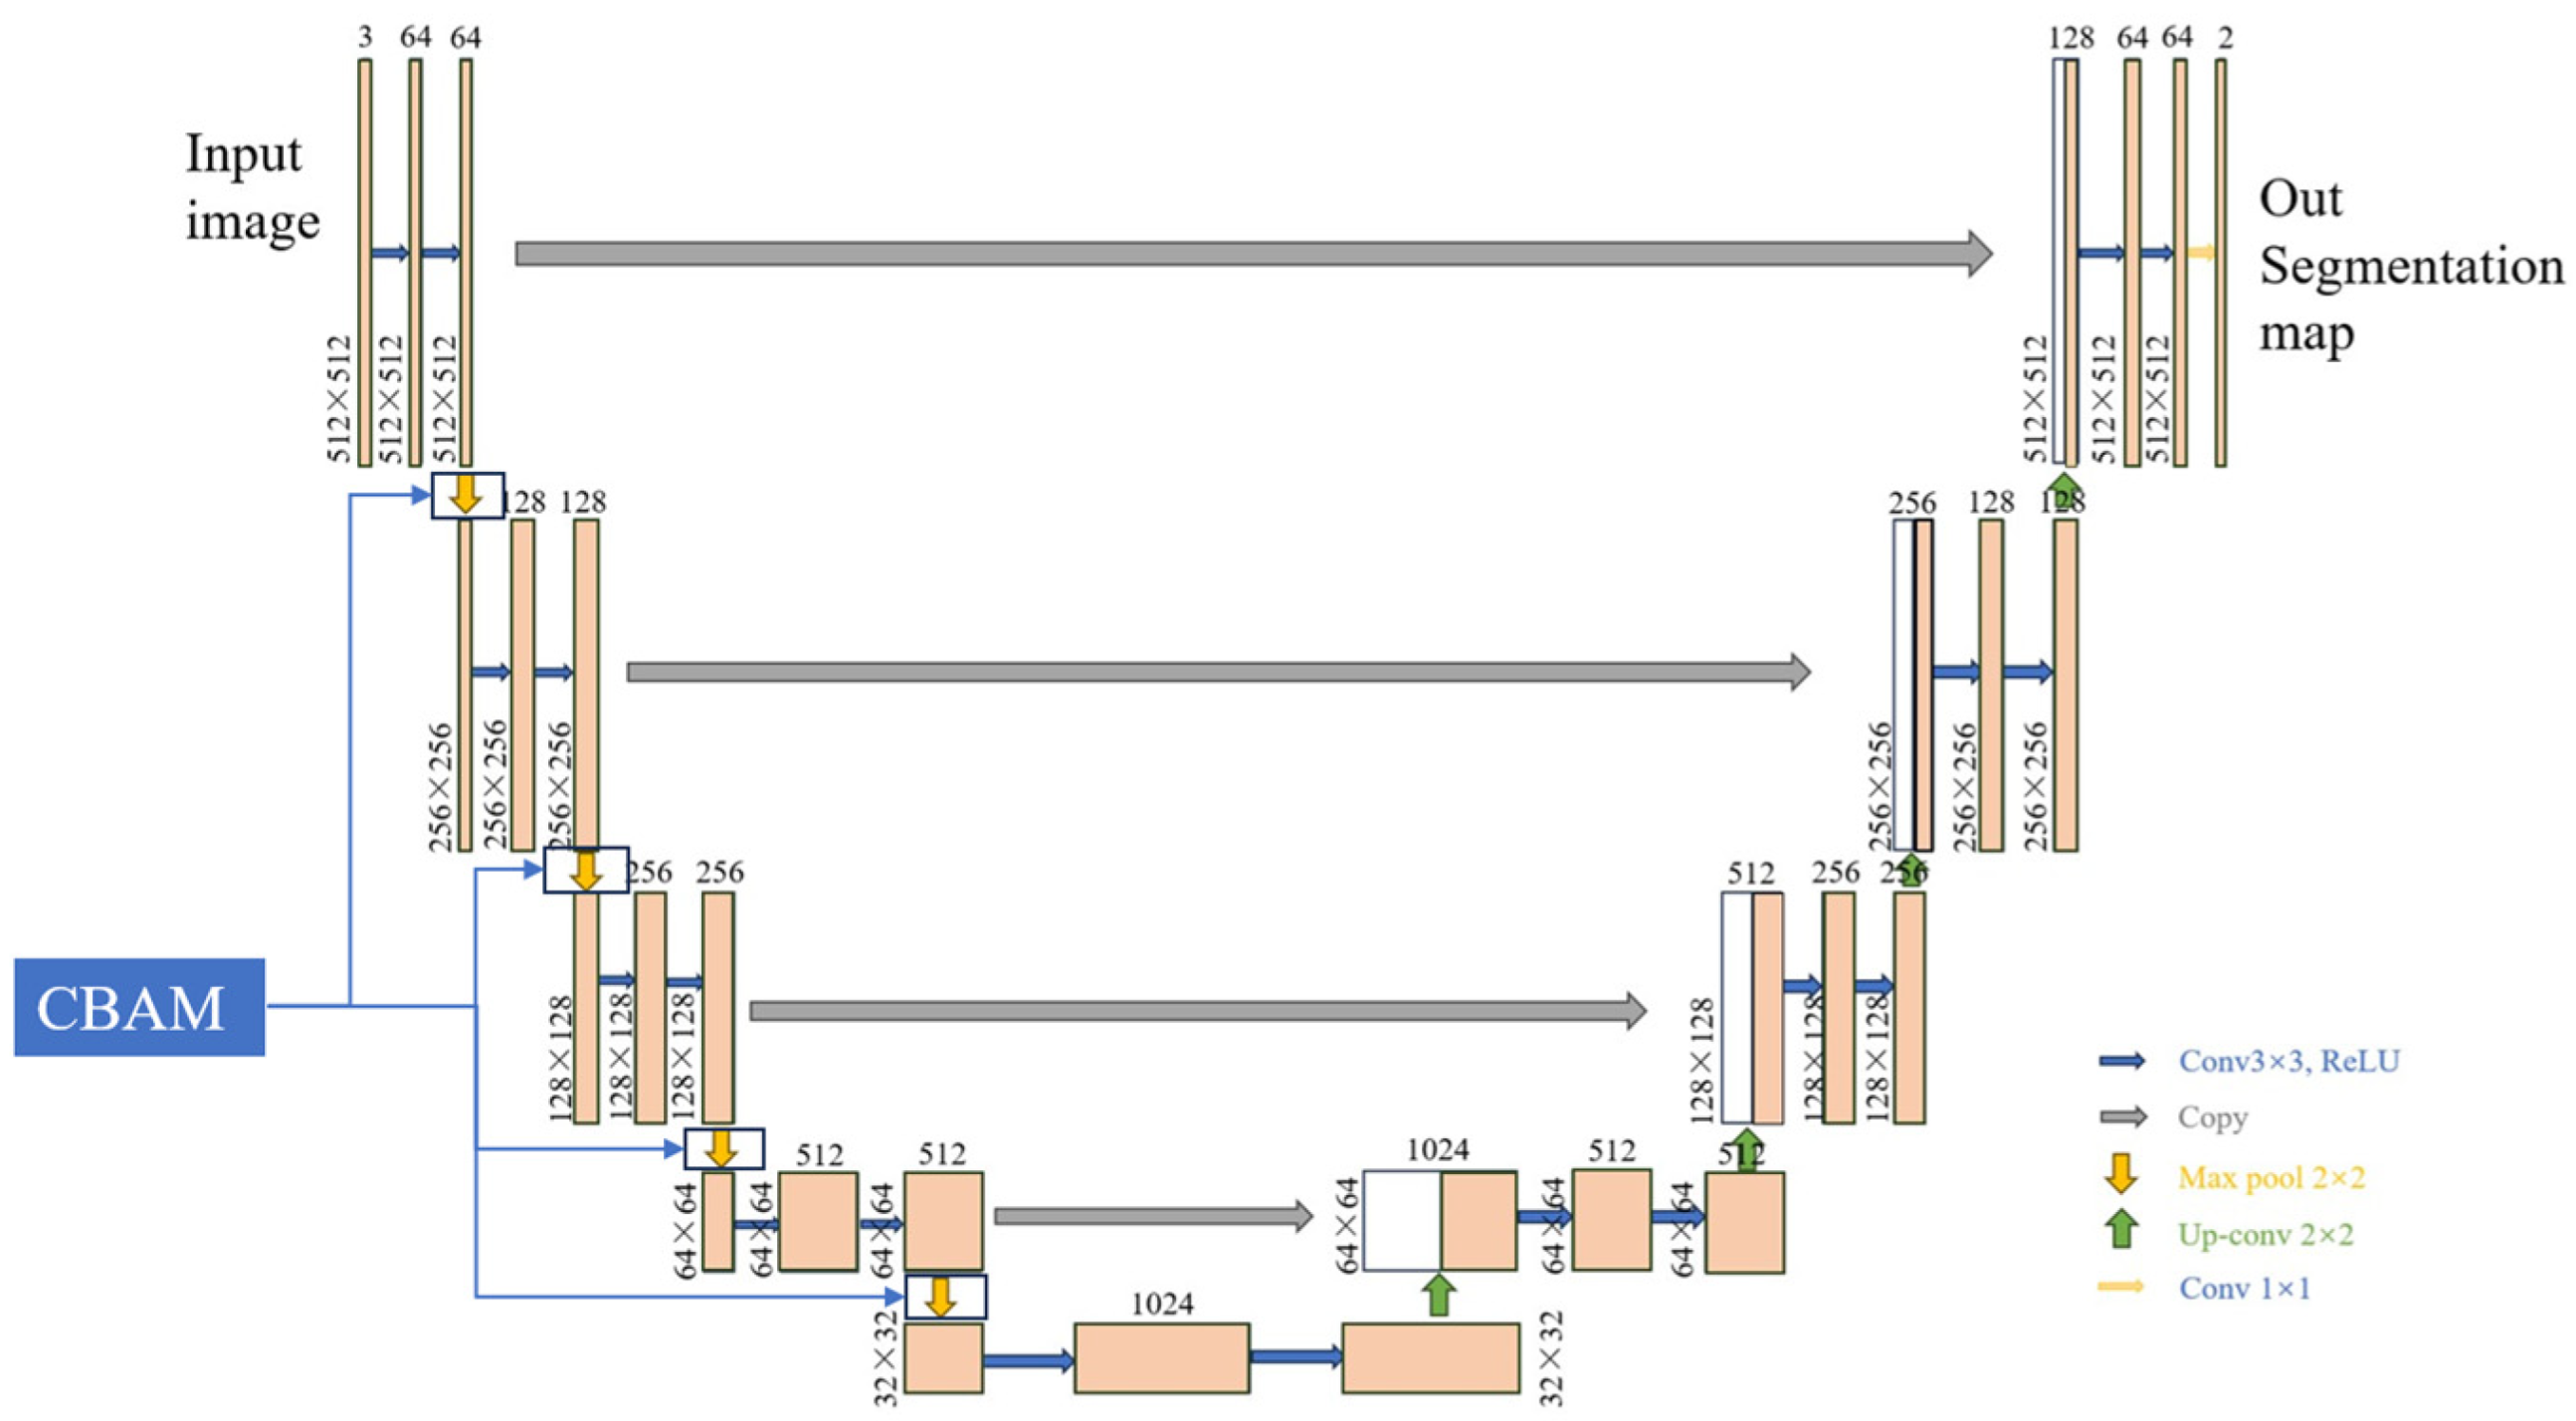
3.3. Attention U-Net

Semantic segmentation aims to classify each pixel in an image, achieving pixel-level precision and finding applications in facial detection, autonomous driving, medical image analysis, and more. Unlike traditional convolutional neural networks (CNNs) used for image classification, semantic segmentation assigns a label to every pixel in the image. Fully Convolutional Networks (FCNs) implement pixel-level segmentation using deconvolution for upsampling but are sensitive to training dataset size and network structure. U-Net, an advanced deep learning architecture, is a classic deep learning framework that was initially proposed by Ronneberger et al. in 2015 [25], and it is widely used for medical image segmentation tasks. U-Net employs a decoder structure corresponding to an encoder, as illustrated in Figure 5. The decoder part has a large number of feature channels and uses a skip connection strategy to concatenate the encoder features with the decoder features and pass them to high-resolution layers, allowing for the capture of more contextual information. The entire network exhibits a U-shaped structure, hence the name U-Net, which also makes it easier to segment large-scale images.
Attention mechanisms enhance neural networks by focusing on crucial parts of input data, mimicking human attention distribution. They primarily include spatial and channel attention mechanisms, which help the model more accurately assess the importance of input features. The Convolutional Block Attention Module (CBAM) integrates these two mechanisms, further improving model performance. CBAM strengthens feature representation through channel and spatial attention mechanisms, enabling the network to concentrate on key areas and increasing task accuracy. It also possesses adaptive adjustment capabilities to accommodate different data and tasks while maintaining low computational overhead, making it suitable for real-time applications and resource-constrained devices. CBAM excels in image classification, object detection, semantic segmentation, medical image analysis, and video analysis, effectively enhancing feature extraction accuracy and efficiency. The structure is shown in Figure 6.
In this paper, we integrate the CBAM into the downsampling area of the U-Net architecture to enhance its feature extraction capabilities, as depicted in Figure 7. This modified U-Net, termed AttU-Net (Attention U-Net), leverages the strengths of both U-Net and CBAM. U-Net’s encoder–decoder structure excels in capturing multi-scale features and preserving spatial information while CBAM further refines feature representation by applying adaptive attention mechanisms. CBAM’s channel and spatial attention modules allow the AttU-Net to focus on the most informative features and regions, improving the network’s ability to differentiate between relevant and irrelevant information. This integration leads to more accurate feature extraction, better performance in segmentation tasks, and overall enhanced model robustness. The overall process of the proposed method is shown in Figure 8.

3.4. Model Training

The experiment reported here was conducted using an RTX 3090 GPU and Ubuntu system, with Python as the programming language and PyTorch as the deep learning framework. Training parameters were set to 30 epochs, a batch size of 16, and a learning rate of 0.001.
With the continuous advancement of technology, semantic segmentation models are rapidly evolving. In addition to the previously mentioned AttU-Net and U-Net models, emerging models such as BiSeNet, BiSeNet v2, DeepLabv1, DeepLabv2, and DeepLabv3 have also begun to surface. DeepLabV3 [27] is a deep learning model for image segmentation, which is particularly good at segmenting objects in complex scenes. It expands the receptive field by introducing dilated convolution so that it can capture richer contextual information; BiSeNet V2 [28] is a deep learning model for image segmentation that aims to improve the performance and efficiency of semantic segmentation tasks. It introduces a dual-branch structure that combines high-resolution features with low-resolution features, thereby effectively capturing fine-grained spatial information and contextual information.
To assess the effectiveness and applicability of the landslide phase gradient dataset, this study conducted comparative experiments involving BiSeNetv2 and DeepLabv3 alongside the proposed AttU-Net model. Four models (U-Net, AttU-Net, BiSeNet v2, and DeepLabv3) were trained simultaneously under the same conditions. In the dataset, landslide areas were marked in red and the background in green, with minimal noise interference to ensure effective learning of landslide versus non-landslide regions. All models converged by the 20th epoch, indicating good adaptation to the dataset’s characteristics. During testing, models were evaluated on an independent dataset to measure recall and overall performance, with testing conditions consistent with training to ensure performance consistency.
Based on the semantic segmentation model, each pixel can be classified into four categories: TP (True Positive), FP (False Positive), TN (True Negative), and FN (False Negative). TP represents the pixels where the true value is a positive sample and is correctly classified as a positive sample. FP represents the pixels where the true value is a background value but is incorrectly classified as a positive sample. TN represents the pixels where the true value is a background value and is correctly classified as a background value. FN represents the pixels where the true value is a positive sample but is incorrectly classified as a background value. Based on these four categories, a confusion matrix can be constructed, and various evaluation metrics can be calculated using Equations (4)–(6).
P r e c i s i o n = T P T P + F P
R e c a l l = T P T P + F N
A c c u r a c y = T P + T N T P + F P + T N + F N

4. Results and Discussion

4.1. Model Accuracy

In our experiments, we evaluated the recall rates of four models: U-Net, AttU-Net, BiSeNet v2, and DeepLabv3. The results are presented in Table 4. AttU-Net achieved a recall rate of 0.8712, significantly surpassing U-Net’s 0.8523 and BiSeNetv2’s 0.8153, and this value was comparable to DeepLabv3’s recall rate of 0.8635. Compared to other models, AttU-Net demonstrates superior stability and consistency across various environments. Consequently, we conclude that AttU-Net excels particularly in practical applications where high recall rates and stability are crucial factors.
Based on the trained models, we visualized their performances on the dataset. As illustrated in Figure 9, the multi-directional phase gradient stacking results for the U-Net, AttU-Net, BiSeNet v2, and DeepLabv3 models indicate strong performance on the test data. However, some small landslides were under-detected by the U-Net and BiSeNet v2 models (highlighted by the green areas in Figure 9b,d) while the AttU-Net and DeepLabv3 networks successfully identified the complete landslides. Despite this, all networks generally identified the approximate locations of the landslides, demonstrating the dataset’s suitability and the models’ overall effectiveness across different networks.

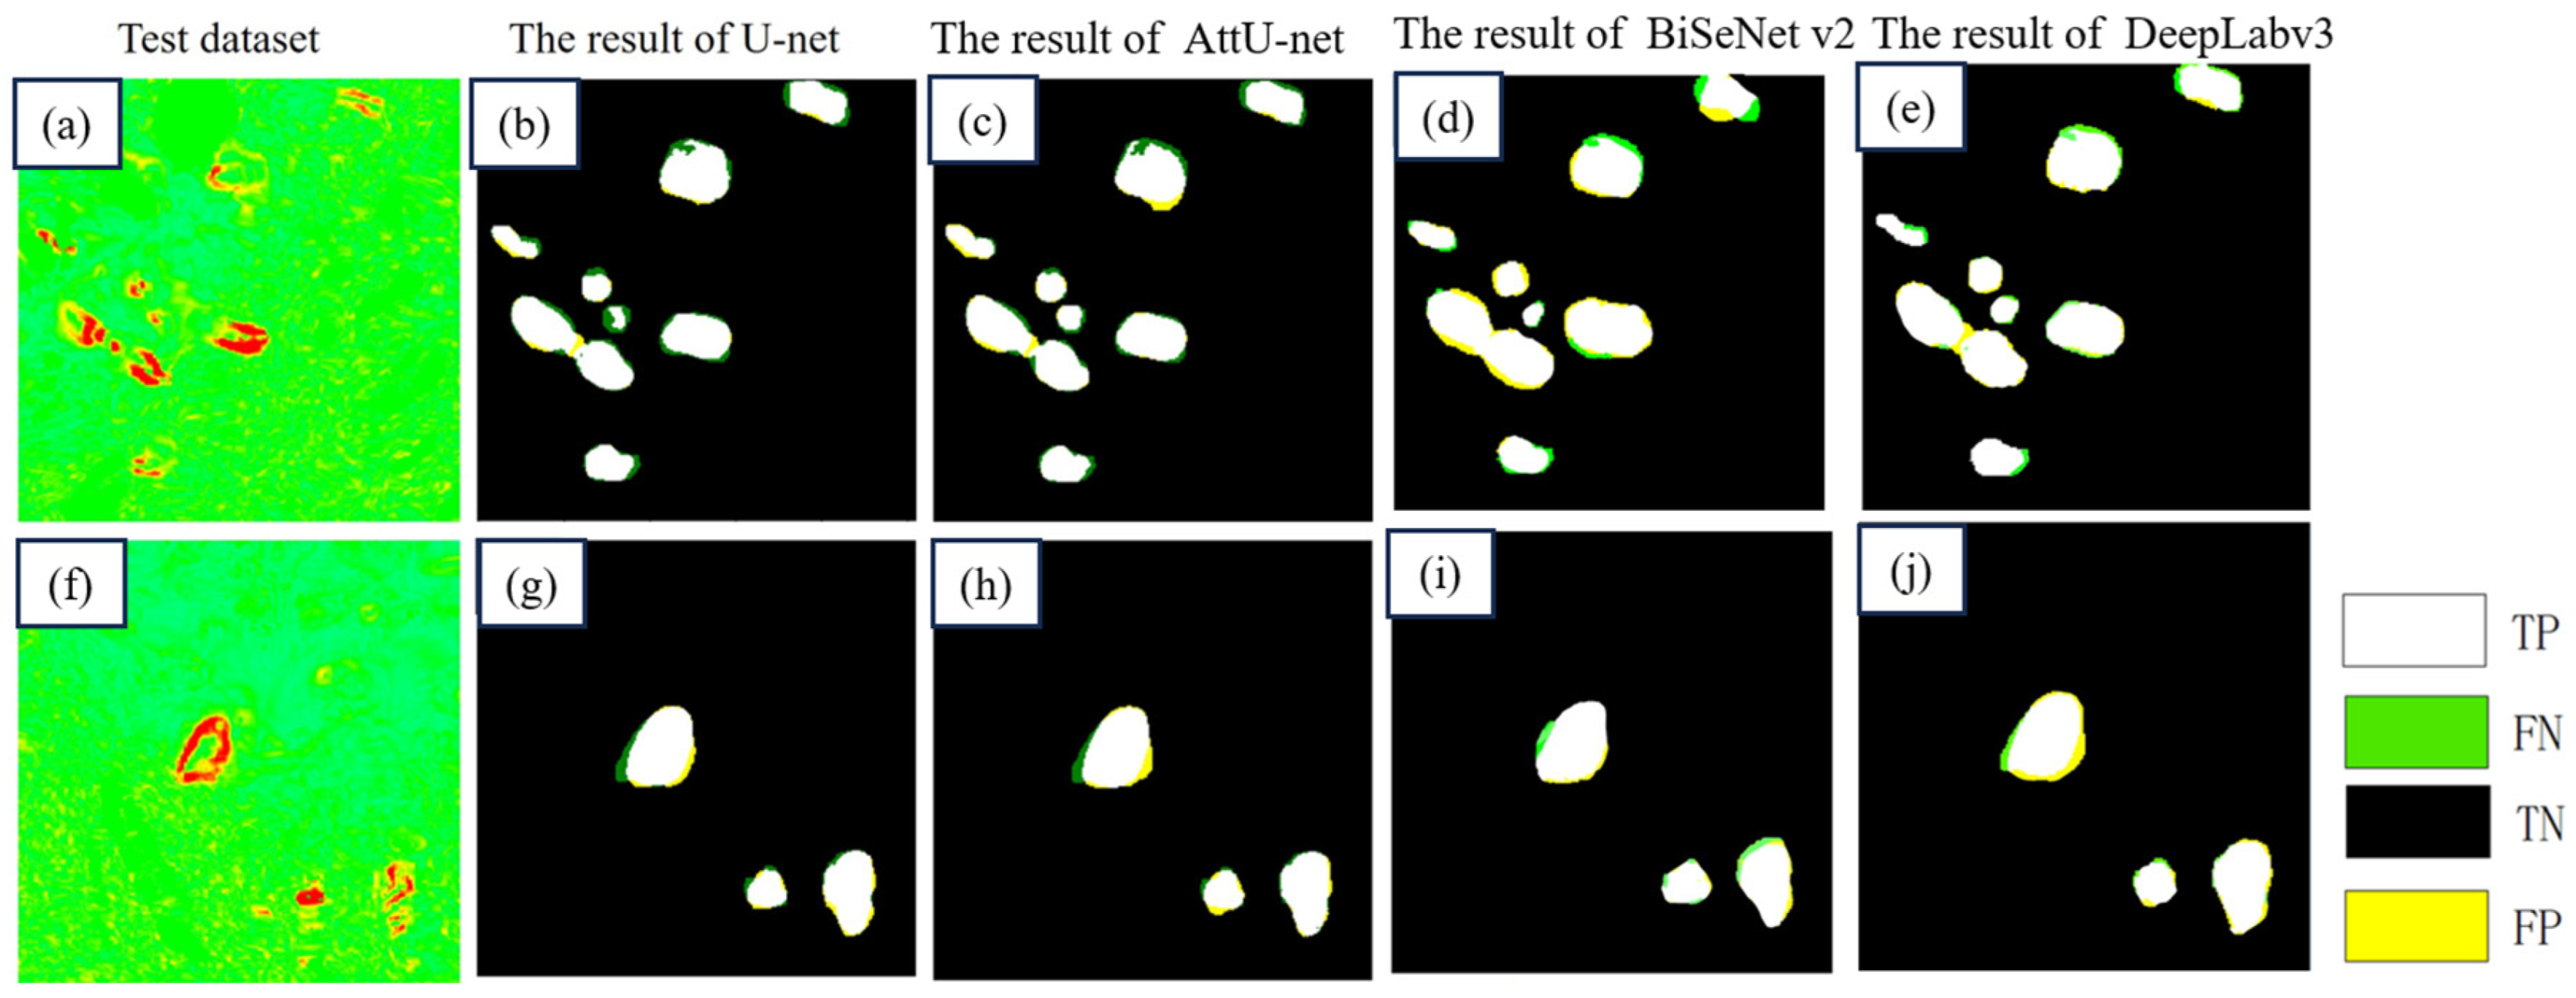
4.2. Validation Set Results

We utilized the AttU-Net model to implement automatic landslide detection on tracks 55~102 to validate its automatic detection capability. Figure 10 shows the comparison between the automatically detected results of AttU-Net and the manually delineated results. As indicated in area (a) of Figure 10, most of the landslides identified by AttU-Net coincided with the manually delineated landslide regions. Furthermore, a large number of landslides corresponded to the manually identified boundaries in area (b), though some incorrect detections were inevitably present. We statistically analyzed the detected results, defining each automatically identified landslide patch as a landslide body. Manually, 294 landslide patches were identified on tracks 55~102, whereas AttU-Net identified 298 landslide patches. Among these, 254 landslides were correctly identified, 48 were incorrectly identified by the model, and 40 landslides were missed by AttU-Net. The AttU-Net detection accuracy was calculated to be 85.23%.

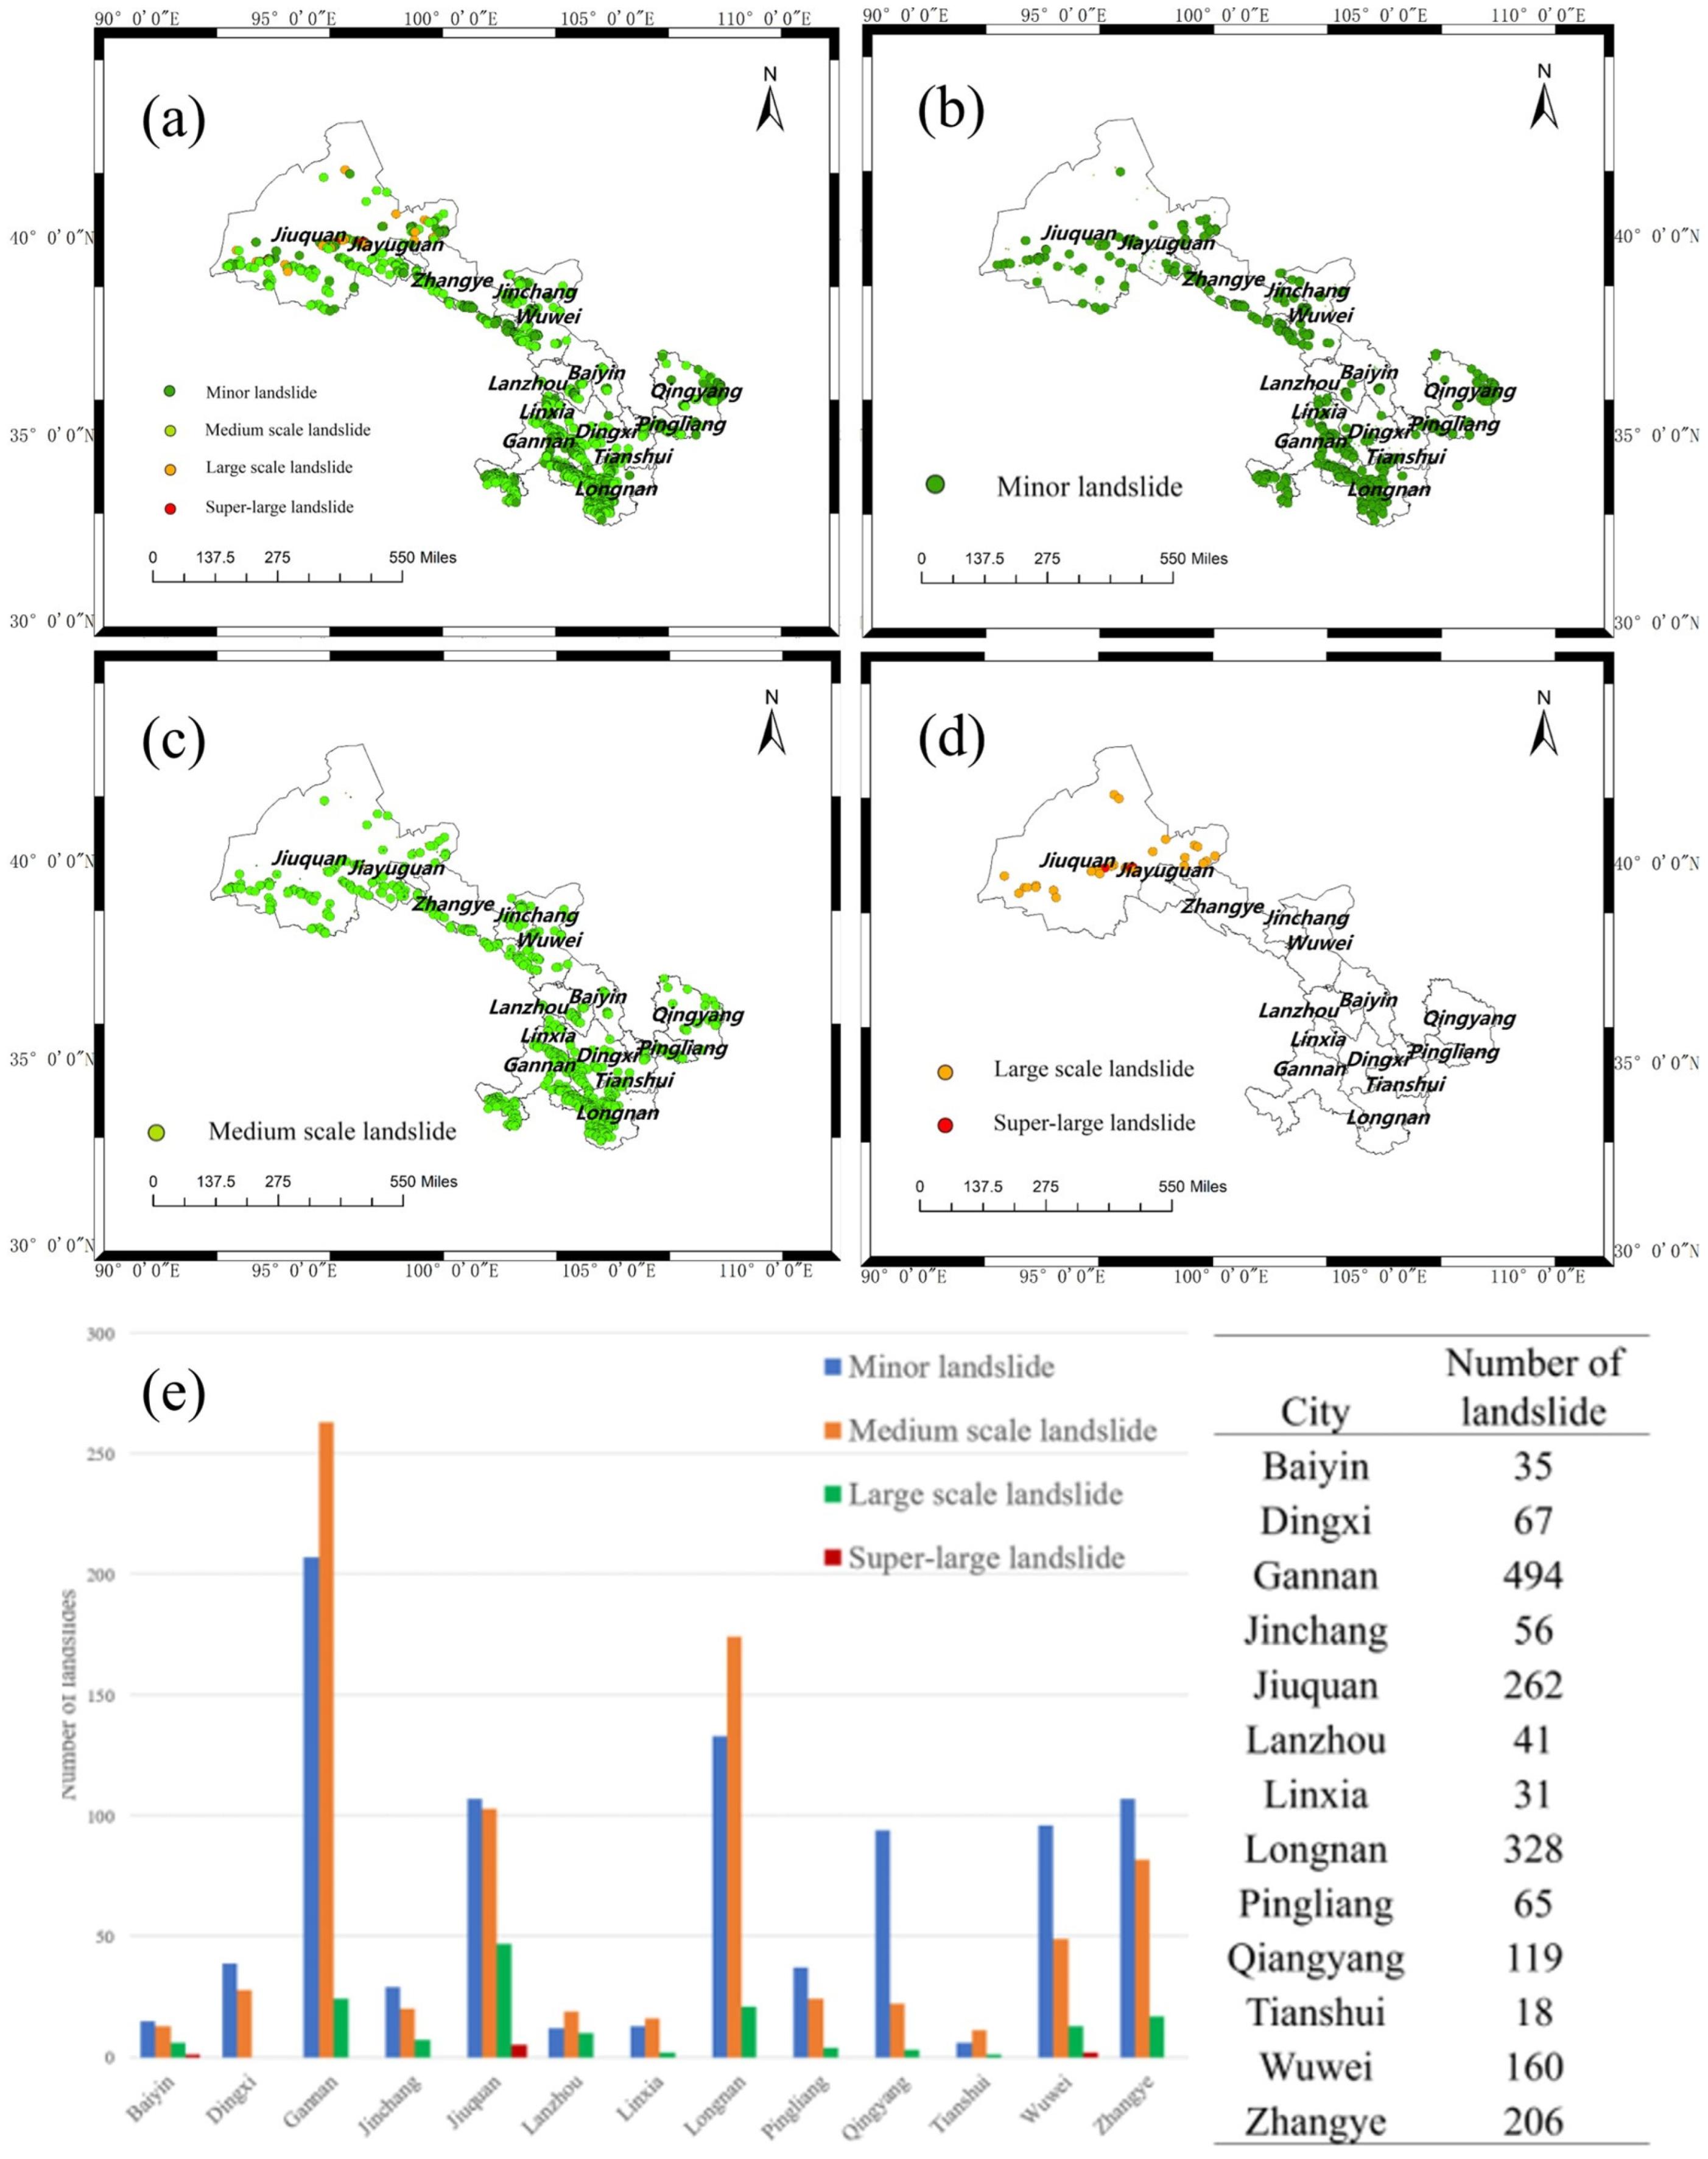
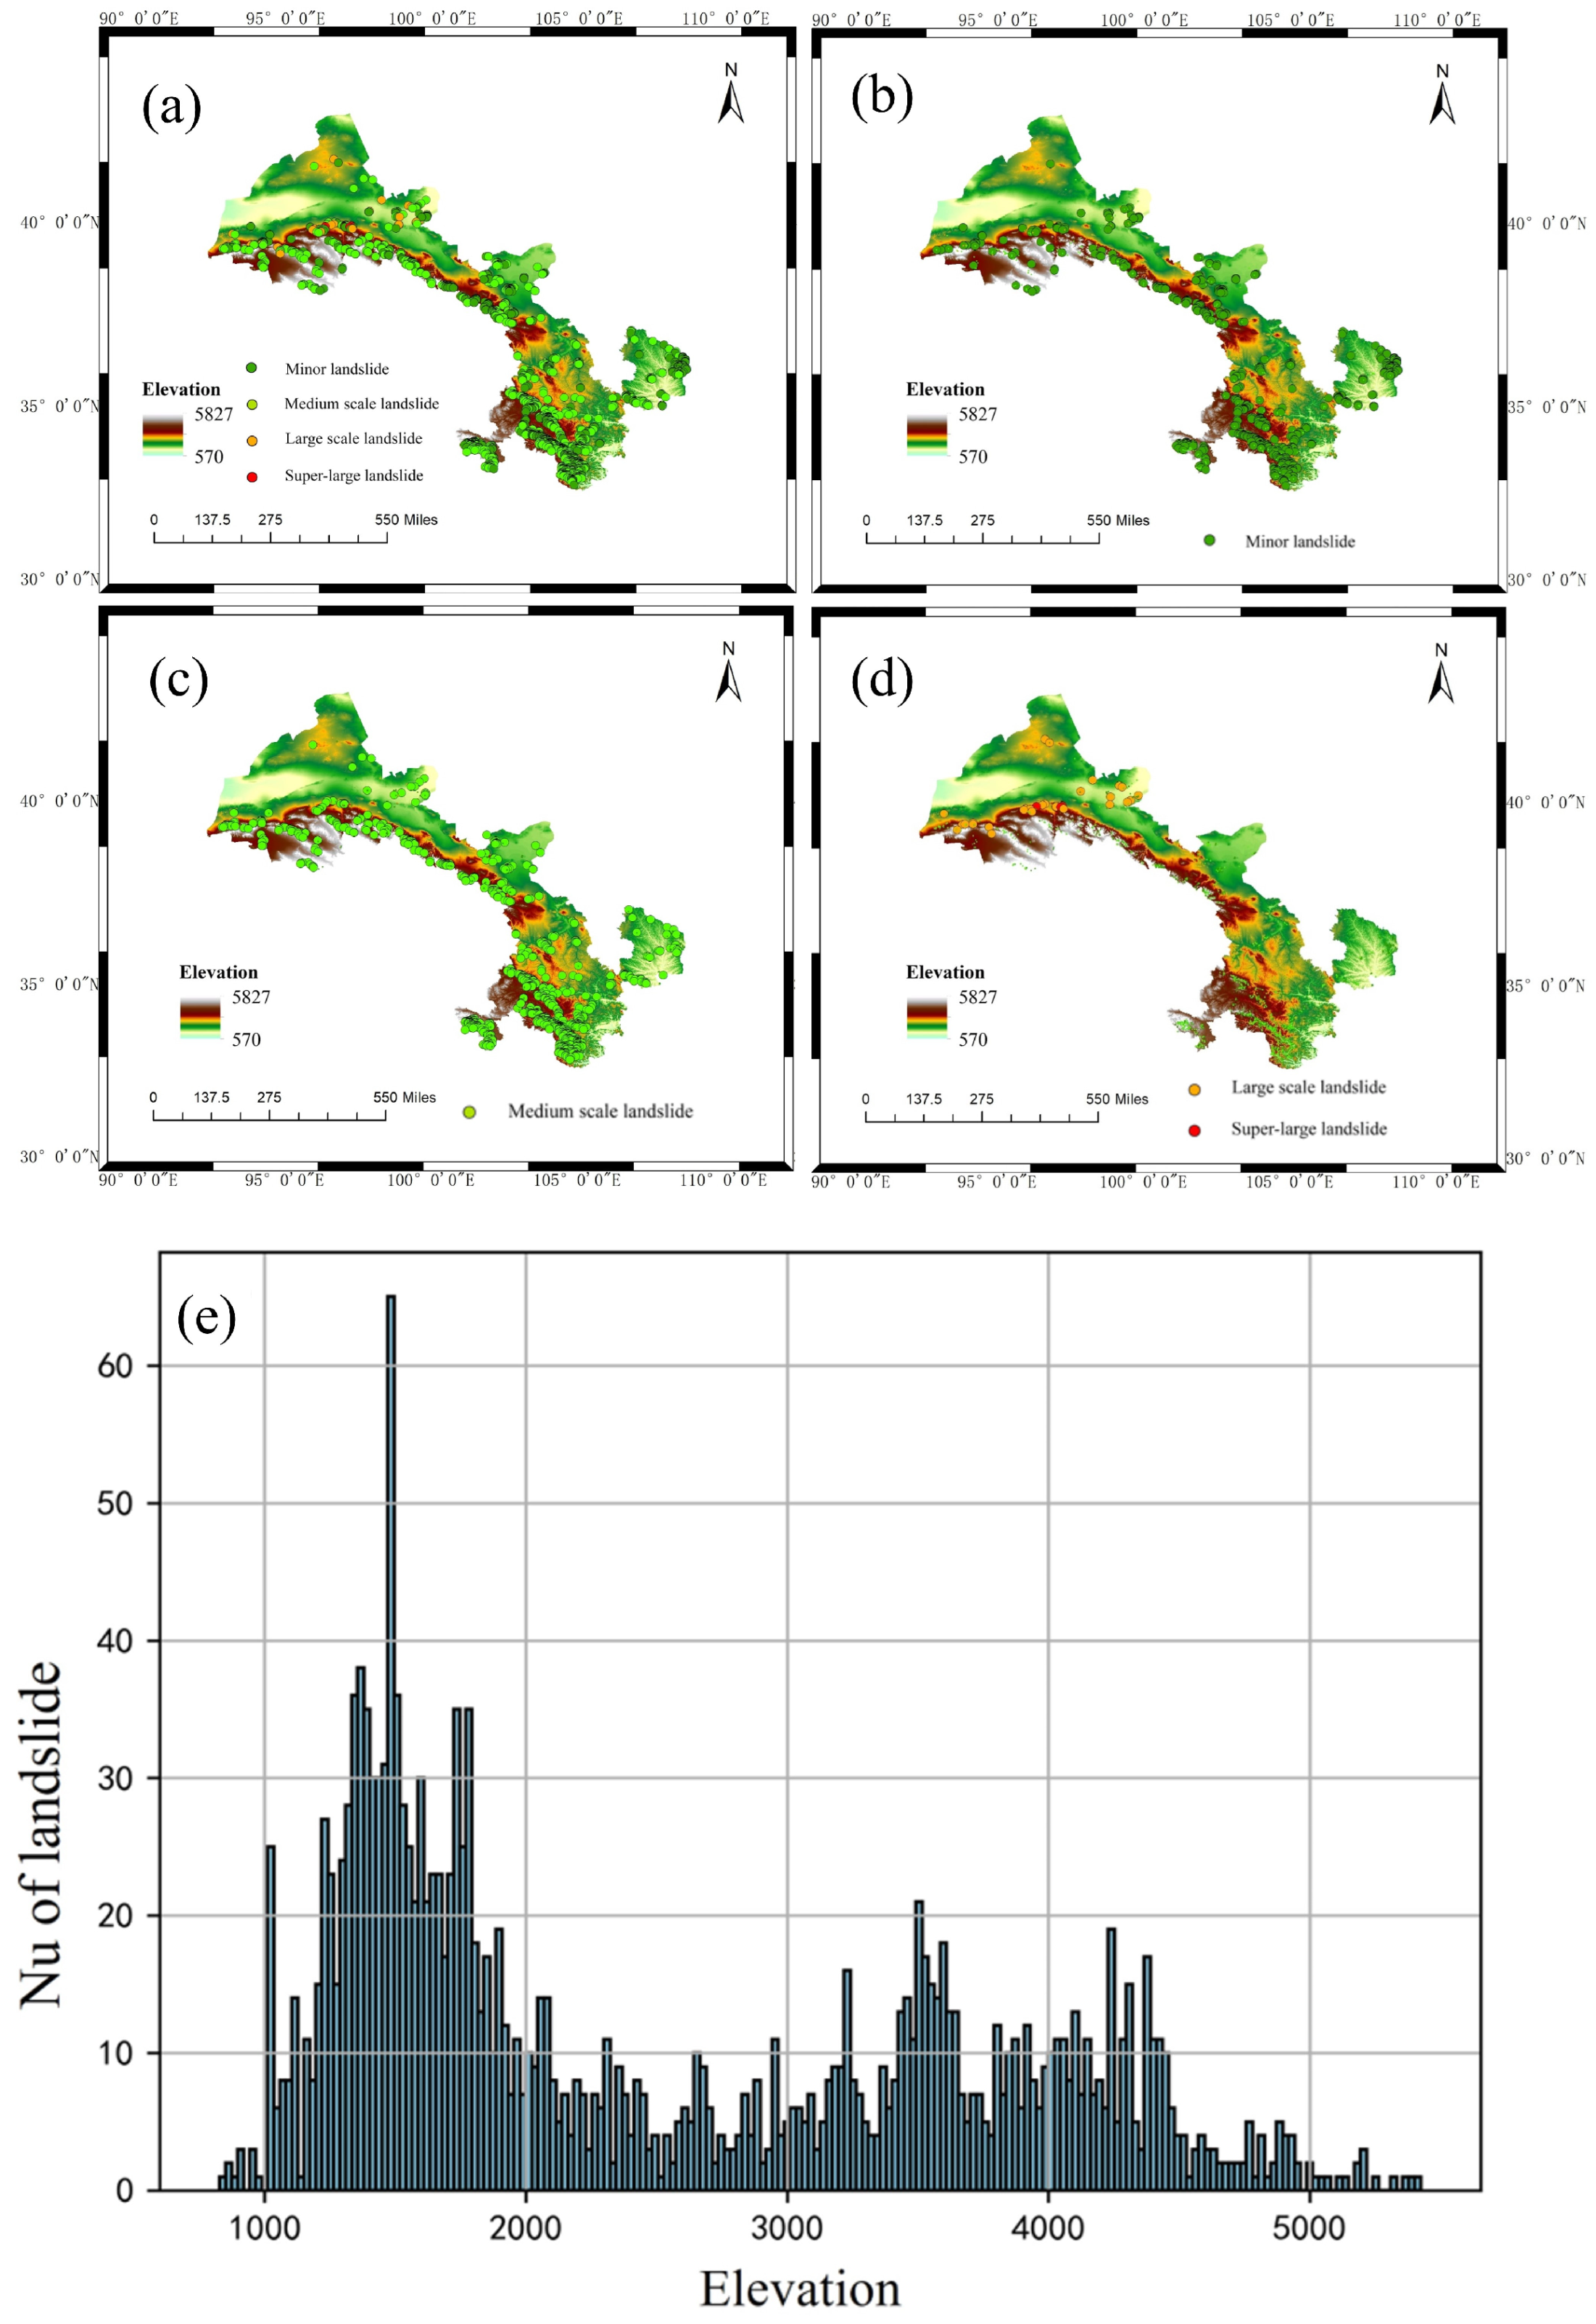
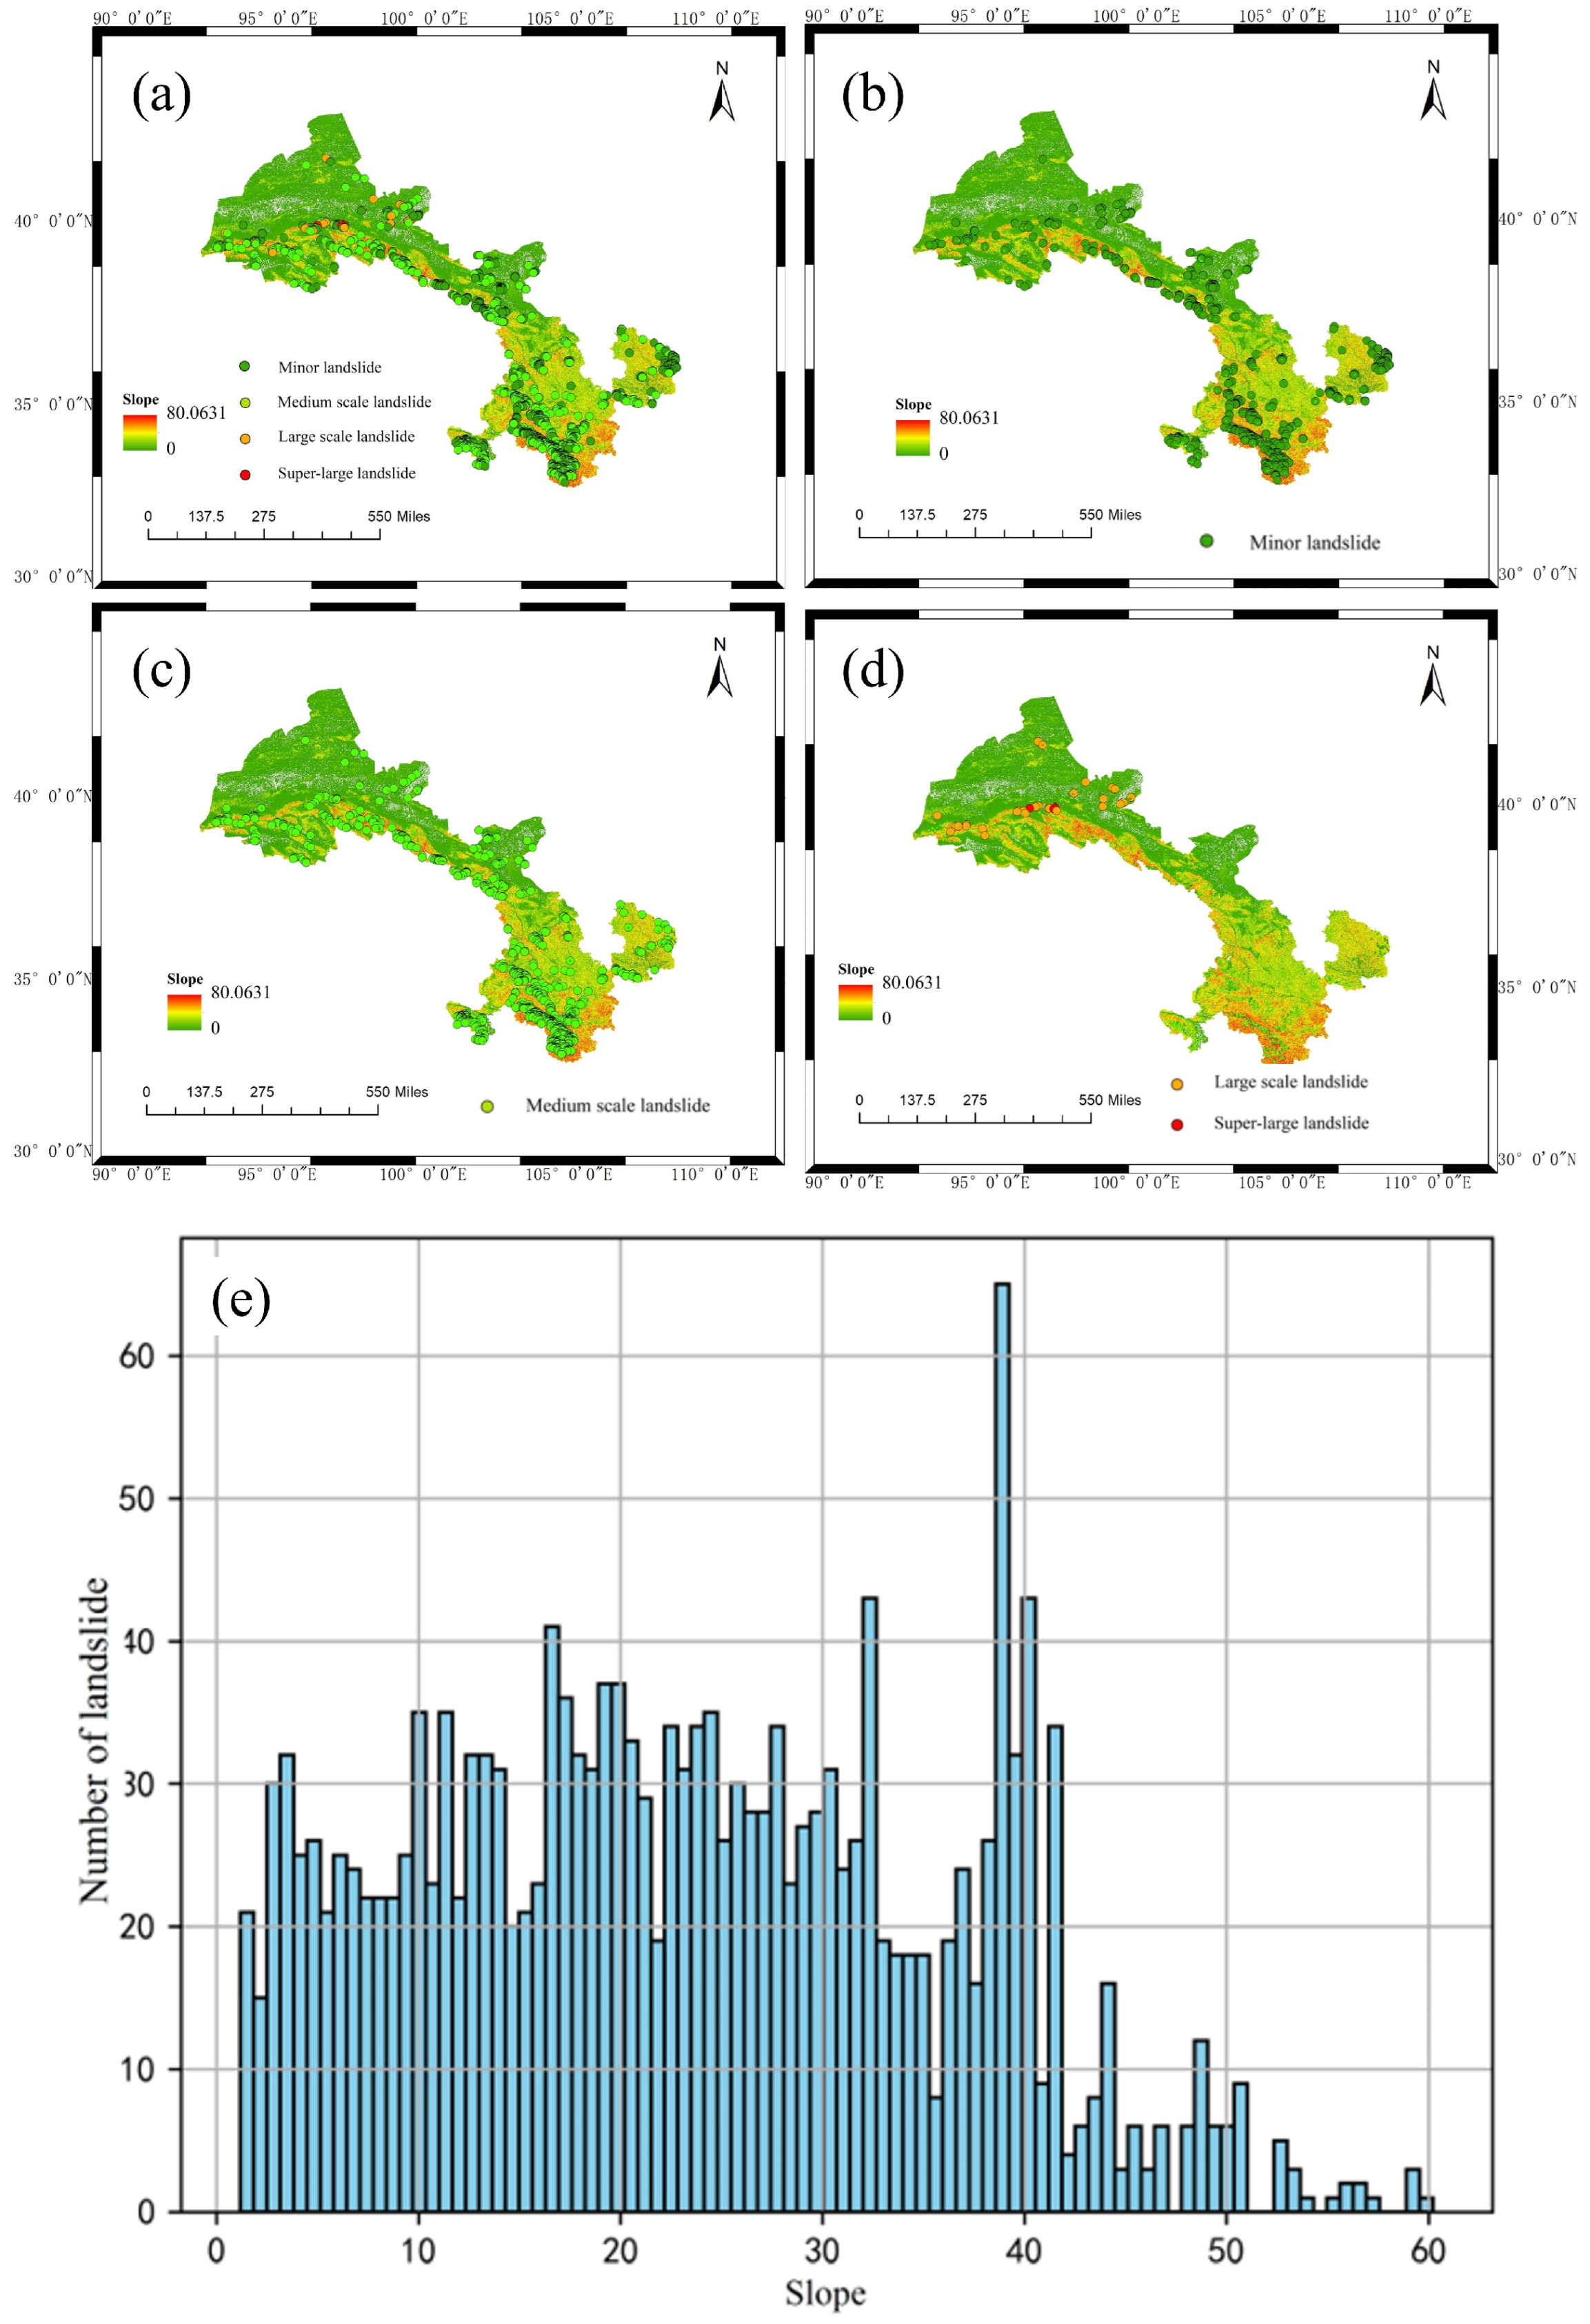
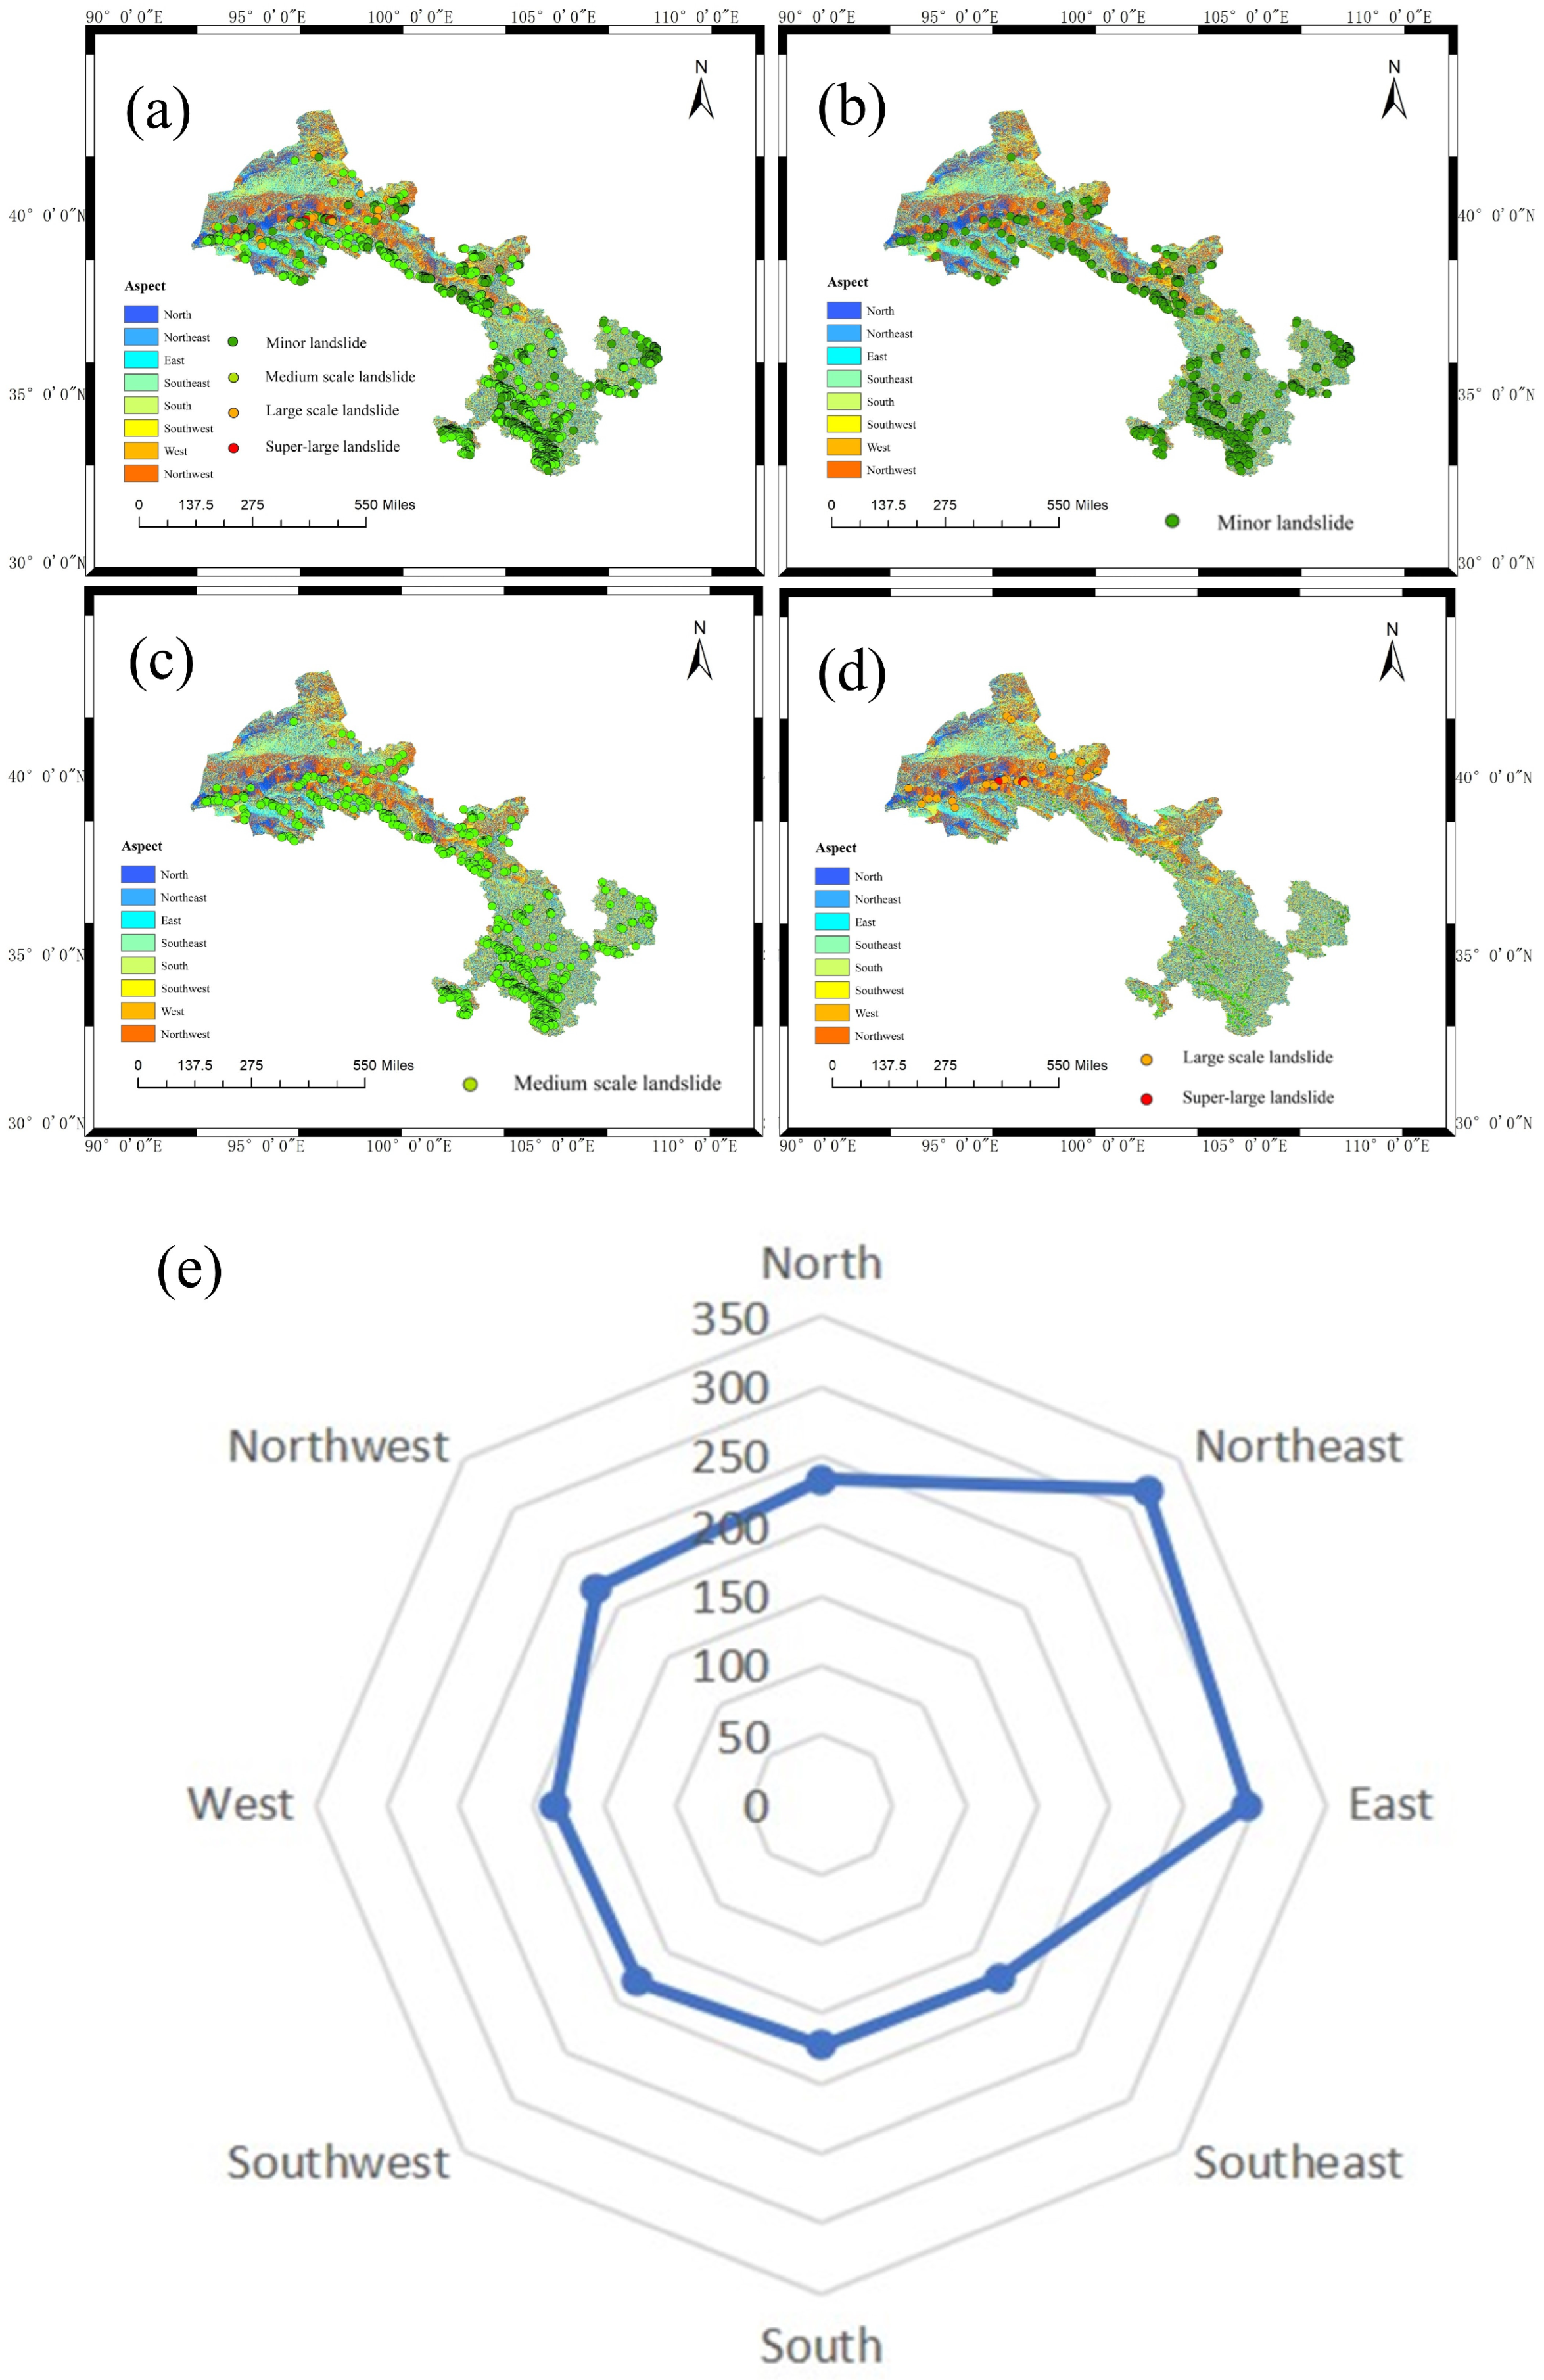
4.3. Analysis of Landslide Detection Results and Their Distribution in Gansu Province

We also validated the accuracy of the trained AttU-Net model on the validation set constructed from tracks 55 to 102. Ultimately, we used the trained model for landslide detection across the entirety of Gansu Province. Due to the large area of Gansu Province, the data from 26 tracks are required to cover the region completely. However, a substantial amount of descending orbit data was found to be missing upon retrieving the Sentinel-1A data. Therefore, only the ascending orbit data were collected for the automatic landslide detection task in Gansu Province. The final detection results are shown in Figure 11, indicating that a significant number of landslides were distributed in the southern region of Gansu Province.
Landslides are primarily categorized by volume into small, medium, large, and gigantic. As we could not obtain the depth information of the landslides and could only classify them based on their areas, in this study, landslides with an area of less than 0.1 km2 were classified as small, those between 0.1 and 1 km2 were medium, those between 1 and 5 km2 were large, and those greater than 5 km2 were gigantic. According to this classification, we identified eight-hundred-and-ninety-five small landslides, eight-hundred-and-twenty-four medium landslides, one-hundred-and-fifty-five large landslides, and eight gigantic landslides. We also compiled statistics on the number of landslides in each city in Gansu Province. Gansu Province comprises 14 cities, but no significant landslides were detected in Jiayuguan City due to its flat terrain and relatively small area.
Among the 13 cities where landslides were detected, the Gannan Tibetan Autonomous Prefecture and Longnan City had the highest numbers of landslides. These two cities are located in the southern part of Gansu Province, where the tectonic activity is more pronounced, and the terrain is more variable, resulting in numerous landslides. Figure 11a presents the distribution of all landslides throughout Gansu Province. Figure 11b illustrates the distribution of micro-landslides within the same region. Figure 11c displays the spatial distribution of medium-sized landslides. Figure 11d shows the locations of large and very large landslides. Lastly, Figure 11e categorizes the landslides of different scales across the 13 cities. It shows that most landslides in the Gannan Tibetan Autonomous Prefecture and Longnan City range from small- to medium-sized landslides, with the latter being more prevalent. Conversely, small landslides predominate in the cities of Qingyang, Wuwei, and Zhangye.
The elevation in Gansu Province ranges from 500 to 6000 m, with higher elevations in the east and lower elevations in the west. Figure 12a illustrates the correlation between the landslide distribution identified by the model and the elevation data. In Figure 12b, we show the corresponding distribution of micro-landslides in Gansu Province. Figure 12c presents the corresponding distribution of medium-sized landslides. Finally, Figure 12d displays the elevation locations for large and very large landslides. A significant number of landslides are in the southern and eastern regions of Gansu Province, where the terrain is more variable. The elevation distribution of the identified landslides was statistically analyzed and is shown in Figure 12e.
The majority of the landslides were found at elevations between 1000 and 2000 m. There were relatively fewer landslides at elevations between 2000 and 3000 m, but a substantial number were also present at elevations between 3000 and 4000 m. However, there were not many landslides at elevations above 4500 m.
A significant concentration of landslides was found in the southern part of Gansu Province. Although this area features more pronounced terrain variations, its elevation primarily ranges between 1000 and 3000 m. Notably, the western part of the Gannan Tibetan Autonomous Prefecture and the southern part of Longnan City contained the highest density of landslides, with elevations predominantly between 1000 and 3000 m.
In contrast, the numerous landslides at elevations between 3000 and 4000 m were primarily located in the southern part of Jiuquan City and the western part of the Gannan Tibetan Autonomous Prefecture. The landslides at elevations greater than 4500 m were mainly found in the southernmost part of Jiuquan City, although they were uncommon.
Slopes are a significant factor in the development of landslide hazards. When a slope is not steep, the probability of failure is minimal. Conversely, rocks and soil become unstable when a slope is very steep. This paper analyzed the slope information of the 1882 identified landslides as shown in Figure 13. Figure 13a presents the slope information for Gansu Province, highlighting that the southern part of the province has relatively steep slopes. In Figure 13b, we display the distribution of micro-landslides in Gansu Province. Figure 13c illustrates the distribution of medium-sized landslides. Finally, Figure 13d shows the spatial distribution of large and very large landslides. Additionally, the region along the eastern border with Qinghai Province also features steep slopes. The landslides identified by the model were primarily distributed in these steep-sloped areas. The statistical results in Figure 13e further illustrate that the majority of the landslides were found on slopes ranging from 20° to 40°, with the highest concentration at around 40°.
This study used only ascending orbit data to detect the landslides in Gansu Province. Since the ascending orbit data captured images from southeast to northwest, and InSAR is highly sensitive to line-of-sight deformation, we investigated whether using a single orbit might have impacted the identification results and analyzed the directional information of these landslides as shown in Figure 14.
Figure 14a presents the aspect information for Gansu Province while Figure 14e shows the number of landslides across eight different aspects. In Figure 14b, we display the distribution of micro-landslides in Gansu Province. Figure 14c illustrates the distribution of medium-sized landslides. Finally, Figure 14d shows the spatial distribution of large and very large landslides. The results indicate that the numbers of landslides identified by the model were significantly higher in the northeastern and eastern directions compared to the other six directions. This was primarily due to the ascending orbit data having an azimuth angle of approximately −15°, making them more sensitive to deformations in the northeastern and eastern directions. In contrast, detecting deformations in the flight direction was more challenging. Figure 14a shows that the slopes facing the north are mainly distributed in the northern part of Gansu Province, where a large number of landslides were not detected.

5. Conclusions

In this paper, we processed eight Sentinel-1 coverage datasets using a multi-directional phase gradient stacking method to build our own dataset and then constructed AttU-Net for automatic landslide detection, achieving high detection accuracy. We obtained ideal results on the test and validation sets and finally used the trained model to automatically detect the landslides throughout Gansu Province, totaling 1882 landslides detected between 2022 and 2023. After combining the relevant data, the landslides in Gansu Province were found to be predominantly small-scale and concentrated in the southwest region with steep terrain. Our analysis indicates that the identified landslides were primarily aligned along the eastern and northeastern slope directions, showing a clear correlation with the orientation of Sentinel-1′s ascending orbit. However, it is possible that some landslides were not identified, necessitating further analysis incorporating data from both the ascending and descending orbits to comprehensively detect landslides across the entire province.

Author Contributions

Conceptualization, Q.S. and T.X.; methodology, Q.S. and T.X.; software, C.L.; validation, R.G. and Y.T.; formal analysis, R.G., Q.S., and A.G.; resources, J.H., J.L., and B.H.; writing—original draft preparation, Q.S., C.L., and R.G.; writing—review and editing, all authors; supervision, J.H. and C.L.; funding acquisition, J.H and R.G. All authors have read and agreed to the published version of the manuscript.

Funding

This research was funded by the National Key Research and Development Program Project (grant number 2021YFC3000500), the National Natural Science Foundation of China (grant numbers 42474054, 42030112 and 42201432), and the Science and Technology Innovation Program of Hunan Province (grant number 2022RC3042).

Data Availability Statement

The Sentinel-1 data presented in this study are openly available from the ESA/Copernicus at https://scihub.copernicus.eu (accessed on 23 September 2024). The Copernicus DEM presented in this study is openly available from the ESA at https://opentopography.org/ (accessed on 23 September 2024).

Acknowledgments

The authors would like to thank the European Space Agency (ESA) for providing the Sentinel-1 data and Copernicus DEM. The authors would like to thank the editor, associate editor, and anonymous reviewers for their constructive and helpful comments that greatly improved this article.

Conflicts of Interest

The authors declare no conflicts of interest.

References

  1. Kirschbaum, D.; Stanley, T.; Zhou, Y. Spatial and temporal analysis of a global landslide catalog. Geomorphology 2015, 249, 4–15. [Google Scholar] [CrossRef]
  2. Varnes, D.J. Slope movement types and processes. Spec. Rep. 1978, 176, 11–33. [Google Scholar]
  3. Xu, Q. Understanding and Consideration of Related Issues in Early Identification of Potential Geohazards. Geomat. Inf. Sci. Wuhan Univ. 2020, 45, 1651–1659. [Google Scholar] [CrossRef]
  4. Dai, C.; Li, W.; Lu, H.; Zhang, S. Landslide hazard assessment method considering the deformation factor: A case study of Zhouqu, Gansu Province, Northwest China. Remote Sens. 2023, 15, 596. [Google Scholar] [CrossRef]
  5. Martinez, S.N.; Schaefer, L.N.; Allstadt, K.E.; Thompson, E.M. Evaluation of Remote Mapping Techniques for Earthquake-Triggered Landslide Inventories in an Urban Subarctic Environment: A Case Study of the 2018 Anchorage, Alaska Earthquake. Front. Earth Sci. 2021, 9, 673137. [Google Scholar] [CrossRef]
  6. Li, M.; Zhang, L.; Dong, J.; Cai, J.; Liao, M. Detection and Monitoring of Potential Landslides Along Minjiang River Valley in Maoxian County, Sichuan Using Radar Remote Sensing. Geomat. Inf. Sci. Wuhan Univ. 2021, 46, 1529–1537. [Google Scholar] [CrossRef]
  7. Bekaert, D.P.; Handwerger, A.L.; Agram, P.; Kirschbaum, D.B. InSAR-based detection method for mapping and monitoring slow-moving landslides in remote regions with steep and mountainous terrain: An application to Nepal. Remote Sens. Environ. 2020, 249, 111983. [Google Scholar] [CrossRef]
  8. Xu, Q.; Lu, H.; Li, W.; Dong, X.; Guo, C. Types of Potential Landslide and Corresponding Identification Technologies. Geomat. Inf. Sci. Wuhan Univ. 2022, 47, 377–387. [Google Scholar] [CrossRef]
  9. Zhu, J.; Hu, J.; Li, Z.; Sun, Q.; Zheng, W. Recent progress in landslide monitoring with InSAR. Acta Geod. Cartogr. Sin. 2022, 51, 2001–2019. [Google Scholar]
  10. Dai, H.; Zhang, H.; Dai, H.; Wang, C.; Tang, W.; Zou, L.; Tang, Y. Landslide Identification and Gradation Method Based on Statistical Analysis and Spatial Cluster Analysis. Remote Sens. 2022, 14, 4504. [Google Scholar] [CrossRef]
  11. Sandwell, D.T.; Price, E.J. Phase gradient approach to stacking interferograms. J. Geophys. Res. Solid Earth 1998, 103, 30183–30204. [Google Scholar] [CrossRef]
  12. Zhang, D.; Zhang, L.; Dong, J.; Wang, Y.; Yang, C.; Liao, M. Improved phase gradient stacking for landslide detection. Landslides 2024, 21, 1829–1847. [Google Scholar] [CrossRef]
  13. Fu, L.; Zhang, Q.; Wang, T.; Li, W.; Xu, Q.; Ge, D. Detecting slow-moving landslides using InSAR phase-gradient stacking and deep-learning network. Front. Environ. Sci. 2022, 10, 963322. [Google Scholar] [CrossRef]
  14. Xiong, T.; Sun, Q.; Hu, J. Landslide Detection Based on Multi-Direction Phase Gradient Stacking, with Application to Zhouqu, China. Appl. Sci. 2024, 14, 1632. [Google Scholar] [CrossRef]
  15. Shen, Y.; Dai, K.; Wu, M.; Zhuo, G.; Wang, M.; Wang, T.; Xu, Q. Rapid and Automatic Detection of New Potential Landslide Based on Phase-Gradient DInSAR. IEEE Geosci. Remote Sens. Lett. 2022, 19, 4514205. [Google Scholar] [CrossRef]
  16. Sameen, M.I.; Pradhan, B. Landslide Detection Using Residual Networks and the Fusion of Spectral and Topographic Information. IEEE Access 2019, 7, 114363–114373. [Google Scholar] [CrossRef]
  17. Soares, L.P.; Dias, H.C.; Garcia, G.P.; Grohmann, C.H. Landslide Segmentation with Deep Learning: Evaluating Model Generalization in Rainfall-Induced Landslides in Brazil. Remote Sens. 2022, 14, 2237. [Google Scholar] [CrossRef]
  18. Valade, S.; Ley, A.; Massimetti, F.; D’Hondt, O.; Laiolo, M.; Coppola, D.; Loibl, D.; Hellwich, O.; Walter, T.R. Towards Global Volcano Monitoring Using Multisensor Sentinel Missions and Artificial Intelligence: The MOUNTS Monitoring System. Remote Sens. 2019, 11, 1528. [Google Scholar] [CrossRef]
  19. Anantrasirichai, N.; Biggs, J.; Kelevitz, K.; Sadeghi, Z.; Wright, T.; Thompson, J.; Achim, A.M.; Bull, D. Detecting Ground Deformation in the Built Environment Using Sparse Satellite InSAR Data With a Convolutional Neural Network. IEEE Trans. Geosci. Remote Sens. 2021, 59, 2940–2950. [Google Scholar] [CrossRef]
  20. Rouet-Leduc, B.; Jolivet, R.; Dalaison, M.; Johnson, P.A.; Hulbert, C. Autonomous extraction of millimeter-scale deformation in InSAR time series using deep learning. Nat. Commun. 2021, 12, 6480. [Google Scholar] [CrossRef]
  21. Zhang, T.; Zhang, W.; Cao, D.; Yi, Y.; Wu, X. A New Deep Learning Neural Network Model for the Identification of InSAR Anomalous Deformation Areas. Remote Sens. 2022, 14, 2690. [Google Scholar] [CrossRef]
  22. Schwegmann, C.P.; Kleynhans, W.; Engelbrecht, J.; Mdakane, L.W.; Meyer, R.G. Subsidence feature discrimination using deep convolutional neural networks in synthetic aperture radar imagery. In Proceedings of the 2017 IEEE International Geoscience and Remote Sensing Symposium (IGARSS), Fort Worth, TX, USA, 23–28 July 2017; pp. 4626–4629. [Google Scholar]
  23. Kamiyama, J.; Noro, T.; Sakagami, M.; Suzuki, Y.; Yoshikawa, K.; Hikosaka, S.; Hirata, I. Detection of Landslide Candidate Interference Fringes in DInSAR Imagery Using Deep Learning. Recall 2018, 90, 94–95. [Google Scholar]
  24. Chen, X.; Yao, X.; Zhou, Z.; Liu, Y.; Yao, C.; Ren, K. DRs-UNet: A Deep Semantic Segmentation Network for the Detection of Active Landslides from InSAR Imagery in the Three Rivers Region of the Qinghai–Tibet Plateau. Remote Sens. 2022, 14, 1848. [Google Scholar] [CrossRef]
  25. Ronneberger, O.; Fischer, P.; Brox, T. U-net: Convolutional networks for biomedical image segmentation. In Proceedings of the Medical Image Computing and Computer-Assisted Intervention–MICCAI 2015: 18th International Conference, Munich, Germany, 5–9 October 2015; Proceedings, Part III 18. Springer International Publishing: Cham, Switzerland, 2015; pp. 234–241. [Google Scholar]
  26. Woo, S.; Park, J.; Lee, J.Y.; Kweon, I.S. Cbam: Convolutional block attention module. In Proceedings of the European Conference on Computer Vision (ECCV), Munich, Germany, 8–14 September 2018; pp. 3–19. [Google Scholar]
  27. Chen, L.C. Rethinking atrous convolution for semantic image segmentation. arXiv 2017, arXiv:1706.05587. [Google Scholar]
  28. Yu, C.; Gao, C.; Wang, J.; Yu, G.; Shen, C.; Sang, N. Bisenet v2: Bilateral network with guided aggregation for real-time semantic segmentation. Int. J. Comput. Vis. 2021, 129, 3051–3068. [Google Scholar] [CrossRef]
Figure 1. Map of historical landslide points and location of Gansu Province, China.
Remotesensing 16 03711 g001
Figure 2. Coverage of Sentinel-1A data used in InSAR phase gradient landslide dataset and automatic landslide identification in Gansu Province. The yellow triangle in the figure represents the research area for the experiment discussed in Section 3. The green box outlines the entire Gansu Province, while the red box indicates the area of sentinel data relevant to the experimental region in Section 3. The blue box signifies the expanded area that includes sentinel data covering the entire Gansu Province.
Remotesensing 16 03711 g002
Figure 3. The position of the label in an optical image plotted using the phase gradient stacking results. (a,c) show the landslide sample points made according to the phase gradient stacking results and superimposed on the phase gradient stacking results. (b,d) are the optical images of landslide sample points drawn. The specific latitude and longitude positions are indicated by the yellow triangles in Figure 2.
Remotesensing 16 03711 g003
Figure 4. Partial sample of multi-directional phase gradient stacking results.
Remotesensing 16 03711 g004
Figure 5. U-Net network structure.
Remotesensing 16 03711 g005
Figure 6. The CBAM for a combination of the channel and spatial attention mechanisms [26].
Remotesensing 16 03711 g006
Figure 7. Attention U-Net network structure.
Remotesensing 16 03711 g007
Figure 8. Flowchart of the overall framework.
Remotesensing 16 03711 g008
Figure 9. The test results of the four models in the multi-directional phase-gradient stacked dataset. (a,f) are the data samples in test dataset, (b,g) are the results of the U-net, (c,h) are the results of the AttU-net, (d,i) are the results of the BiSeNet v2, (e,j) are the results of the DeepLabv3.
Remotesensing 16 03711 g009
Figure 10. Comparison between the optimal model identification results for tracks 55~102 and the manual identification results. Figures (a,b) illustrate the details of the landslide areas identified by the model compared to those manually delineated. The black contour lines indicate the areas identified through manual recognition, while the blue regions represent the landslide areas identified by the model.
Remotesensing 16 03711 g010
Figure 11. The landslide distribution results obtained by AttU-Net. (a) The overall distribution of all landslides across Gansu Province. (b) The distribution of micro-landslides within the same region. (c) The spatial distribution of medium-sized landslides. (d) The locations of large and very large landslides. (e) A summary of the numbers of landslides of different scales across the 13 cities in Gansu Province.
Remotesensing 16 03711 g011
Figure 12. Landslide distribution and elevation analysis in Gansu Province. (a) Correlation between landslide distribution identified by the model and elevation data. (b) Distribution of micro-landslides within Gansu Province. (c) Distribution of medium-sized landslides. (d) Elevation locations for large and very large landslides. (e) Statistical analysis of the elevation distribution of the identified landslides.
Remotesensing 16 03711 g012
Figure 13. Slope distribution and landslide identification results in Gansu Province. (a) Slope information for Gansu Province, highlighting the relatively steep slopes in the southern part of the province; (b) Distribution of micro-landslides across Gansu Province. (c) Distribution of medium-sized landslides across different slopes. (d) Spatial distribution of large and very large landslides across different slopes. (e) Statistical analysis of the slope distribution of the identified landslides.
Remotesensing 16 03711 g013
Figure 14. Slope directions in landslide identification results in Gansu Province. (a) Aspect information for Gansu Province. (b) Distribution of micro-landslides in Gansu Province across different aspects. (c) Distribution of medium-sized landslides across different aspects. (d) Spatial distribution of large and very large landslides across different aspects. (e) Number of landslides across eight different aspects.
Remotesensing 16 03711 g014
Table 1. Data information for the eight tracks used to construct the phase gradient landslide dataset.
Path-FrameOrbital Direction Number of Images Path-FrameOrbital DirectionNumber of Images
55~102Ascending4262~479Descending57
55~107Ascending3962~484Descending53
128~104Ascending58135~478Descending53
128~109Ascending58135~484Descending47
Table 2. Sentinel-1A data information for global landslide automatic identification in Gansu Province.
Path-Frame Start Date–
End Date
Number of ImagesPath-FrameStart Date–
End Date
Number of Images
(yyyy/mm/dd–
yyyy/mm/dd)
(yyyy/mm/dd–
yyyy/mm/dd)
55~1022023/01/01–
2023/05/31
11157~1072022/01/07–
2022/08/22
14
55~1072023/01/01–
2023/05/31
11157~1122022/01/07–
2022/08/22
14
55~1122023/01/01–
2023/05/31
11157~1172022/01/07–
2022/08/22
14
55~1172023/01/01–
2023/05/31
1199~13102022/01/03–
2022/05/03
11
55~1222023/01/01–
2023/05/31
1199~13152022/01/03–
2022/05/03
11
128~1042023/01/12–
2023/06/05
1399~13202022/01/03–
2022/05/03
11
128~1092023/01/12–
2023/06/05
13172~13072022/10/11–
2023/04/21
16
128~1192023/01/12–
2023/06/05
13172~13122022/10/11–
2023/04/21
16
128~1242023/01/12–
2023/06/05
13172~13172022/10/11–
2023/04/21
16
26~1032022/10/25–
2023/05/05
1670~13072022/10/16–
2023/04/26
16
26~1082022/10/25–
2023/05/05
1670~13122022/10/16–
2023/04/26
16
2~1232022/10/25–
2023/05/05
1684~1102022/11/22–
2023/05/21
14
26~1282022/10/25–
2023/05/05
1684~1152022/11/22–
2023/05/21
14
Table 3. Landslide quantity in different image coverage areas.
Path-FrameOrbital Direction Number of Landslides Path-FrameOrbital DirectionNumber of Landslides
55~102Ascending29462~479Descending336
55~107Ascending29162~484Descending616
128~104Ascending126135~478Descending104
128~109Ascending83135~484Descending128
Table 4. Performance comparison of the different datasets when tested on the two networks.
ModelPrecisionRecallAccuracy
U-Net0.87930.85230.9825
AttU-Net0.87710.87120.9834
BiseNet v20.85740.81530.9854
Deeplab v30.87650.86350.9871
Disclaimer/Publisher’s Note: The statements, opinions and data contained in all publications are solely those of the individual author(s) and contributor(s) and not of MDPI and/or the editor(s). MDPI and/or the editor(s) disclaim responsibility for any injury to people or property resulting from any ideas, methods, instructions or products referred to in the content.

