Article

Large-Scale Spatial–Temporal Identification of Urban Vacant Land and Informal Green Spaces Using Semantic Segmentation

1
Edinburgh School of Architecture and Landscape Architecture, The University of Edinburgh, Edinburgh EH1 2LE, UK
2
School of Computer Science and Information Engineering, Hefei University of Technology, Hefei 230009, China
*
Author to whom correspondence should be addressed.
Remote Sens. 2024, 16(2), 216; https://doi.org/10.3390/rs16020216
Submission received: 19 November 2023 / Revised: 27 December 2023 / Accepted: 3 January 2024 / Published: 5 January 2024
(This article belongs to the Section Urban Remote Sensing)

Abstract

:
The large-scale identification of urban vacant land (UVL) and informal green spaces (IGSs) using conventional identification methods is challenged by the high cost of time and resources as well as inconsistent outcomes. Moreover, the spatial–temporal changes of UVL and IGSs have received limited academic attention. We introduce a methodological framework for the large-scale automatic identification of UVL and IGSs in Hangzhou, China, based on semantic segmentation. We construct and release a large-scale dataset for UVL identification, containing five different UVL categories, and one of them is IGS, with 3096 patches for training and 128 patches for evaluation. We then train five different semantic segmentation networks using the dataset and utilise Segformer to predict UVL and IGSs within the whole urban area of Hangzhou. The presented segmentation model has a hierarchically structured Transformer encoder and a multilayer perceptron decoder, which incorporates local and global information to obtain effective feature representations. Extensive experiments have been conducted to evaluate the segmentation performance of the applied Segformer. Experimental results show the good identification performance of Segformer for UVL and IGSs. Results also verify that the proposed identification framework can be effectively used to analyse the spatial–temporal changes of UVL and IGSs in Hangzhou.

1. Introduction

1.1. Urban Vacant Land (UVL) and Informal Green Spaces (IGSs)

Worldwide, a significant amount of land in some cities has been dominated by urban vacant land (UVL). Although the definition of UVL is diverse, with possible different connotations across different disciplines and among researchers, it is typically recognised as a type of urban land that is marked by its unutilised, underutilised, or abandoned condition. UVL encompasses a wide range of land morphological patterns, including vacant lots, derelict sites, brownfields, or bare land without development/use due to physical/environmental limitations [1].
As “a necessary byproduct of urban development processes” [2], UVL is generated by complex driving mechanisms, depending on specific regional/city contexts and spatial scales. UVL may appear more frequently in shrinking cities that have experienced population loss, such as Leipzig, Liverpool, and several American rustbelt cities where depopulation, deindustrialisation, economic decline, and/or suburbanisation have caused large amounts of land in these cities to become vacant [3]. However, rapidly growing cities with disordered urban expansion and sprawl also contain UVL in their certain urban areas [4]. In these growing cities, the emergence of UVL could be caused by changes in land planning, land speculation, insufficient investment, etc. [5]. While UVL has been characterised as “empty” or “useless” spaces, it is also viewed as an asset that provides opportunities for urban redevelopment and revitalisation. For example, interest in urban agriculture planning for UVL to revitalise shrinking cities such as Detroit has grown [6,7].
With little or no intervention/management, natural succession occurs on UVL, spontaneously bringing flora and even fauna species and creating informal green spaces (IGSs) in cities. Today many urban green spaces (UGSs) such as parks, gardens, and nature reserves are clearly demarcated and formally planned, designed, and managed. However, cities also contain IGSs that constitute an inseparable part of the entire UGS. Evidence suggests the potential ecological, social, and economic benefits of IGSs. For example, IGSs can serve as important habitats in cities for various flora and fauna species, supporting urban biodiversity [8]. A recent study in Zhanjiang, China, found that IGSs harboured higher spontaneous plant species richness than parks and commercial, institutional, and residential areas [9]. In urban environments, which are mostly dominated by manicured green spaces, IGSs offer residents recreational opportunities to experience “wild nature” in cities where the public can play freely and escape from rules and regulations without taking long journeys to rural areas [10]. IGSs are valued by children since they provide important spaces for them to play freely [11]. Furthermore, IGSs invite spontaneous occupation, not only by flora and fauna but also by humans, offering a cost/resource-effective way for cities experiencing economic decline to provide more green areas for residents. A recent review study reported that among the various ecosystem services offered by IGSs, habitat services, climate regulation services, and cultural services emerged as the most frequently discussed topics [12].

1.2. Identification of UVL and IGSs

Reusing or managing UVL and IGSs and integrating them into urban green infrastructure have been proposed by cities such as Berlin [8], Dresden, Leipzig [13], and New York [14]. In China, while UVL and IGSs have long been regarded as a “waste” of urban land that should be first erased and then redeveloped, they are recently viewed by some researchers as an important nature-based solution to mitigate environmental problems in Chinese cities (e.g., pollution, biodiversity loss, flooding, etc.) via appropriate management and planning [15,16]. For example, a wild IGS site with high biodiversity value near West Lake in Hangzhou has been largely conserved and planned as Jiangyangfan Eco-Park, providing a wide range of ecosystem services in an urban environment [17]. Many Chinese cities today have considerable amounts of UVL and IGSs due to both urban shrinkage (e.g., in shrinking cities like Yichun and Hegang) and disordered urban expansion (e.g., in growing cities like Hangzhou and Shanghai), which provide many opportunities for these spaces’ planning and management. It is important to identify UVL and IGSs to collect their data such as location, shape, size, etc. before considering the overall planning and management of the UVL and IGSs.
Regarding UVL data, some cities such as New York (database MapPLUTO from NYC Department of City Planning), Ottawa (from Planning, Infrastructure and Economic Development, City of Ottawa), and Glasgow (from The Scottish Government) have produced their authoritative city-scale UVL data [18]. Yet, such authoritative data are still limited in other cities worldwide and is not available in China. Research has relied on the visual inspection of satellite images for UVL identification [4,19], which is often complemented by field surveys [20,21,22,23,24], cadastral data [22,25], stakeholder questionnaires and interviews [23], street view verification [24,26], and other multi-source data (e.g., business data, Baidu heat maps, etc.) [27].
However, these conventional identification methods present challenges since (1) they are time- and resources-consuming, (2) they may yield inconsistent identification outcomes due to the subjective variances in the identification criteria among auditors, and (3) most studies focused on the fine scale, such as urban city centres or small urban areas, which impedes the generalisation to broader regional and national scales [28,29]. In recent years, automatic identification methods have gained increasing attention. They promise considerable reductions in labour and time expenditures while identifying UVL on a large scale, coupled with a high measurement accuracy. Xu and Ehlers [30] applied the rule-based data fusion method which combined remote sensing images, GIS layers, and citizen science data for the automatic detection of vacant land in Germany. By utilising deep learning techniques, Mao et al. [28] used the semantic segmentation of high-resolution remote sensing images and tested this approach in 36 major Chinese cities to automatically identify UVL. They categorised the 36 cities into three groups, selected a representative city for each (i.e., Beijing, Shenzhen, and Lanzhou), trained a semantic segmentation model on the representative, and then used it to predict UVL in other cities within the same category. Sun et al. [29] used similar deep learning to train a semantic segmentation model, complemented by population density and surface temperature data, to automatically predict industrial vacant land in Tangshan, China.
Compared with UVL, much less research has focused on IGS identification. Few studies on the identification of UVL have separately produced IGS data. Rupprecht and Byrne [31] mapped the quantity, spatial distribution, vegetation structure, and accessibility of IGSs in central Brisbane and Sapporo using field surveys and aerial photography data. Sikorska et al. [32] proposed an algorithm for urban spontaneous vegetation identification using satellite-based NDVI metrics. This was tested in Warsaw, Poland, along with field survey verification. Biernacka et al. [33] analysed basic land use datasets for the mapping of IGSs across an urban–peri-urban gradient in Poland. There is a dearth of work using automatic methods for the identification of IGSs on a large scale.
Recently, deep-learning methods have been developed rapidly and attracted great attention in various applications. Specifically, semantic segmentation has been widely used in the field of remote sensing, including forest monitoring [34], urban road detection [35], and building extraction [36]. The deep semantic segmentation networks usually adopt the encoder–decoder to segment regions of interest, such as U-Net [37], SegNet [38], and Swin Transformer [39].
While some studies have started to use semantic segmentation methods for the automatic identification of UVL, and their proposed frameworks may have been adapted and implemented in other cities or countries, little work has focused on the identification of different types of UVL (e.g., bare land, land under construction, IGSs, etc.) as well as on the identification of IGSs, a type of UVL, using automatic methods. Moreover, how the distribution of UVL and IGSs in Chinese cities changes over time has received limited academic attention. Mao et al. [28] proposed a framework based on semantic segmentation to achieve the large-scale automatic identification of UVL in 36 Chinese cities. Also, Sun et al. regarded industrial vacant land identification as a binary segmentation problem and applied HRNet [40] to achieve a satisfying performance [29]. While their work is inspiring, a knowledge gap exists in automatically identifying and mapping specific different UVL types, with IGSs being included as a type of UVL. Another knowledge gap is the investigation of the spatial–temporal changes of UVL and IGSs, especially using automatic methods, in the Chinese context. In general, previous Chinese studies tended to focus on identifying UVL distribution in a single year without considering the spatial–temporal change patterns of UVL and IGSs across years. China has been experiencing remarkable urbanisation and urban expansion, leading to significant changes in urban land use. A deeper understanding of the spatial–temporal changes of UVL and IGSs may reveal specific Chinese urbanisation modes and land use policies, thereby offering more planning and management implications.
This study, therefore, aims to propose a methodological framework for the automatic large-scale identification of UVL, including its different types, and IGSs in China based on sematic segmentation. This study also aims to use the identification outcomes for the analysis of the spatial–temporal changes of UVL and IGSs. We hypothesise that the methodological framework can be used for the large-scale automatic identification of UVL (including its different types) and IGSs, as well as for the analysis of the spatial–temporal changes of UVL and IGSs. To test this hypothesis, we propose a segmentation framework using high-resolution remote sensing images, and we apply this framework in Hangzhou, China. The results show the good performance of this framework for the large-scale automatic identification of UVL and IGSs, as well as for the analysis of their spatial–temporal changes.

2. Materials and Methods

This section first introduces the study area in this research (Section 2.1) and then presents the proposed overall identification framework (Section 2.2). The identification framework includes data labelling (Section 2.2.1), model training, evaluation and selection (Section 2.2.2), and finally, prediction (Section 2.2.3).

2.1. Study Area

In this study, Hangzhou, an eastern Chinese city and capital of Zhejiang Province, was selected for the identification and analysis of UVL and IGSs. We selected Hangzhou because it is a representative Chinese city which has experienced rapid urbanisation and disordered urban expansion, and large amounts of unused and underused land have been generated mainly due to land speculation, inadequate investment, changes in urban planning, etc. [5]. By the end of 2021, the population of permanent residents in Hangzhou was 12.20 million [41]. Overall, 13.02%, 70.12%, and 16.87% of the total population fall within the children/teenager (aged 0–14), adults (aged 15–59), and older (aged 60+) age groups, respectively [41]. In total, 29.32% of the total population has received a university education [41]. Hangzhou is a rapidly growing city with diverse industry sectors including manufacturing, light industry, e-commerce, and technology. The 2021 GDP was RMB 1810 million [42]. Hangzhou boasts a globally renowned legacy of historical temples, gardens, and parks. They are mostly situated within and around West Lake—a water body that has undergone expansion and modifications throughout centuries and has been listed as a UNESCO World Heritage site today. Hangzhou has 10 local administrative districts, two counties (Tonglu and Chun’an) and one county-level city (Jiande) with a total area of 16,850 km2. Hangzhou’s rapid urbanisation has started since the 1980s with the implementation of the Reform and Opening-up Policy. The city has developed from a single urban core and expanded in all directions. This study focused on the urban area of Hangzhou, which includes the administrative districts of Shang Cheng, Xia Cheng, Jiang Gan, Gong Shu, Xi Hu, Bin Jiang, Xiao Shan, and Yu Hang (Figure 1). Of Hangzhou’s urban region, five are city core districts that have relatively long histories, namely, Shang Cheng, Xia Cheng, Jiang Gan, Gong Shu, and Xi Hu, and three are newly established periphery districts, namely, Bin Jiang, Xiao Shan, and Yu Hang.

2.2. Identification Framework

As shown in Figure 2, the entire automatic identification framework included three main procedures: (1) data labelling; (2) model training, evaluation, and selection; and (3) prediction. Before data labelling, we conducted a series of preparation procedures, including the collection of high-resolution remote sensing (HRRS) image data, the investigation of UVL characteristics and UVL categorisation, and representative district selection.
We downloaded the Hangzhou urban area HRRS images from Bigemap (www.bigemap.com, accessed on 26 March 2023 and 12 September 2023). In Bigemap, the boundaries of the Hangzhou urban area as well as each administrative district followed the ones designated by the Hangzhou Urban Master Plan (2001–2020) [43]. The collected HRRS images were taken in 2014, 2017, 2019, 2022, and 2023, because remote sensing image acquisition is limited by the satellite revisit cycle, and only these years of data could be obtained. The images downloaded were taken in summer or autumn (except images in 2017 as summer or autumn data in 2017 were not available) to ensure the surface vegetation was actively growing. To enable the clear identification and analysis of land features, cloud interference was controlled at a very low level. The images were composed of red-green-blue channels with a spatial resolution of 1 m.
In this study, we defined UVL as urban land that is “vacant without any developed use, the lands that are abandoned from previous industrial or other developed use, or the lands that are completely unbuilt, demolished, derelict, and underconstruction” [4]. Based on this definition and also the Hangzhou HRRS images, we proposed five UVL categories to be used in this study: bare land (BL), vegetated wasteland (VW), land under construction (LUD), derelict land with garbage (LWG), and abandoned mining land (AM) (Figure 3). In particular, we separated VW as IGSs in this study. Surface characteristics of different UVL categories and non-vacant land with similar characteristics, which may present challenges in the identification process, are presented in Table 1.
We aimed to select a representative district in Hangzhou to train our semantic segmentation model and then used this semantic segmentation model to automatically predict UVL and IGSs in other districts in Hangzhou. We selected Xi Hu district as the representative district for model training because Xi Hu district has all UVL categories and also diverse land use types, which includes built-up land, forests, shrubs, water bodies, and cropland. Thus, this district has diverse urban vacant and non-vacant land, which could enhance the model’s robustness. Specifically, we created the semantic segmentation training dataset by using HRRS images of Xi Hu district for the years 2014, 2017, and 2019, as well as constructing the evaluation dataset for the years 2022 and 2023. This dataset was used to train the segmentation model, which was then employed to predict UVL and IGSs in all districts of Hangzhou in 2014, 2017, 2019, 2022, and 2023.

2.2.1. Data Labelling

Deep learning-based segmentation methods need a large number of labelled image samples. As shown in Figure 2, the training tiles were selected from the original HRRS images of Xi Hu district. The original HRRS images were acquired through optical sensors, which had a spatial resolution of 1 m. To ensure an effective model training outcome, the selection of training tiles adhered to the following criteria: (1) they should encompass diverse UVL, including the five categories, and non-vacant land to enhance the model’s robustness; (2) they should cover a large amount of UVL to minimise model bias; (3) they should be selected from different years to adapt to the challenges of different environments; and (4) a sufficient number of tiles should be ensured to control overfitting.
According to the summarised image surface characteristics of UVL (Table 1) and examples of remote sensing images (Figure 3), three professional auditors labelled UVL through the observation of the selected training tiles of the representative district. Data labelling was performed using Labelme 5.1 software with the aim of generating a high-quality labelled dataset of different UVL categories to train the model. Labelme 5.1 software was used for the pixel-wise annotation of UVL areas. In the generated labels created using Labelme 5.1, different numerical values were employed to signify different UVL categories, where 1 corresponded to LUD, 2 to BL, 3 to VW, 4 to LWG, and 5 to AM, while the background was designated as 0. In addition to training labels, we labelled test tiles that covered all five UVL categories for model evaluation.
The label area for each training tile was 2 km × 2 km, with a resolution of 2048 × 2048 pixels. Due to constraints in hardware resources, the inputs of the deep models typically have smaller dimensions. Consequently, we subdivided the HRRS image tiles into smaller patches of 512 × 512 pixels. Within the training tiles, a total of 86 label tiles were divided into 3096 patches using a splitting step of 256, serving as the input data for model training. Additionally, for model evaluation, we selected a total of 8 representative test tiles, which were then divided into 128 patches using a splitting step of 512. To verify the robustness of segmentation model, the selected test tiles encompassed diverse UVL, including the five categories, and non-vacant land. Moreover, to assess the model’s generalisation ability, testing tiles were sourced from both 2022 and 2023, differing in acquisition time from the training dataset. The well-labelled UVL dataset is available online in Supplementary Materials: https://drive.google.com/drive/folders/1zYGWaAywP3hxBZFogawwSm3kO-SWWk_9 (released on 19 November 2023).

2.2.2. Model Training, Evaluation and Selection

In order to explore the potential and efficacy of semantic segmentation models in the domain of UVL recognition, five existing deep learning-based methods were used, including Deeplabv3plus [44], HRNet [40], PSPNet [45], Swin Transformer [39], and Segformer [46]. The open source project MMSegmentation was applied to train and evaluate these five semantic segmentation methods [47].
We then used a testing dataset to evaluate the performance of the 5 segmentation models. We employed semantic segmentation models with two primary objectives. The first is to accurately realise the identification of UVL, facilitating large-scale automated interpretation. The second is to achieve the precise classification of different UVL types. To comprehensively evaluate the model’s performance in both aspects, four evaluation metrics were applied, including IoU, Dice, Precision, and Recall.
I o U = T P T P + F P + F N
D i c e = 2 T P 2 T P + F P + F N
P r e c i s i o n = T P T P + F P
R e c a l l = T P T P + F N
where T P indicates whether a pixel of UVL is predicted correctly, F P indicates whether a pixel of the background is predicted as UVL, and F N indicates whether a pixel of UVL is predicted as the background. IoU describes the proportion of the intersection between the predicted results of a certain category and the true labels to their union. Dice describes the similarity between true labels and predicted results. Precision denotes the ratio of truly identified UVL pixels to the UVL predicted by the model. Recall denotes the ratio of the truly identified UVL pixels to all UVL pixels. In semantic segmentation tasks, precision and recall are typically a trade-off. Considering the 5 different UVL categories, the average values of IoU, Dice, Precision, and Recall were used to evaluate and select the segmentation model with the best segmentation performance and were named mIoU, mDice, mPrecision, and mRecall.
Due to its good performance in all evaluation metrics, we selected Segformer as the segmentation model to identify UVL. As shown in Figure 4, Segformer mainly consisted of a Transformer-based encoder and an MLP-based decoder. Given an input image with a resolution of H × W × 3 , we performed overlapped patch merging to obtain the hierarchical feature maps with a size of H 2 i + 1 × W 2 i + 1 × C i ,   i = 1 ,   2 ,   3 ,   4 containing coarse and fine-grained features. In the Transformer block, as shown in Figure 5a, an efficient self-attention process was used to reduce the network complexity. The Mix-FFN was then formulated with a 3 × 3 convolution in the feed-forward network to eliminate the resolution mismatch.
As shown in Figure 5b, in the MLP-based decoder, multi-level features ( H 2 i + 1 × W 2 i + 1 × C i ) generated from the encoder were input into an MLP layer to obtain feature maps ( H 2 i + 1 × W 2 i + 1 × C ) with the unified channel dimension. Then, these feature maps were up-sampled to the resolution of H 4 × W 4 × C and then concatenated. The concatenated features went through another MLP layer to obtain the predicted result with a size of H 4 × W 4 × N c l s , which was then resized to H × W × N c l s as the mask output. N c l s denoted the number of categories and was set to 6 in our UVL identification task.
To enhance the generalisation performance of the model and speed up the training process, we used a pre-trained segmentation model using the ADE20K dataset. In the experimental settings of Segformer, MiT-B3 was applied with a trade-off between computation cost and model accuracy. We applied data augmentation to obtain more training samples, including random horizontal flipping, random resize, and random cropping to the size of 512 × 512 . In the training stage, we used the AdamW function to optimise the model for 160 K iterations. We performed the training on a single RTX3090 GPU, and the batch size was set to 4. The learning rate was first set to a value of 0.001 and then adjusted with the polyLR schedule.

2.2.3. Prediction

We used the well-trained Segformer to identify UVL in Hangzhou from 2014 to 2023. As shown in Figure 2, first, we split the original HRRS images of 8 administrative districts into image patches with a size of 512 × 512 . Then, we applied the trained Segformer to generate the predicted patch masks. Last, we merged the predicted patches of the 8 administrative districts into the corresponding whole images. We used the predicted UVL regions to analyse the distribution and proportion of different UVL in each administrative district as well as the whole city Hangzhou.

3. Results and Discussion

This section presents the results and discussion, including a comparison with other segmentation methods (Section 3.1), and our identification results and a discussion regarding the results (Section 3.2). Specifically, in Section 3.2, we present the identification of UVL (Section 3.2.1) and the identification of different UVL categories and IGSs (Section 3.2.2).

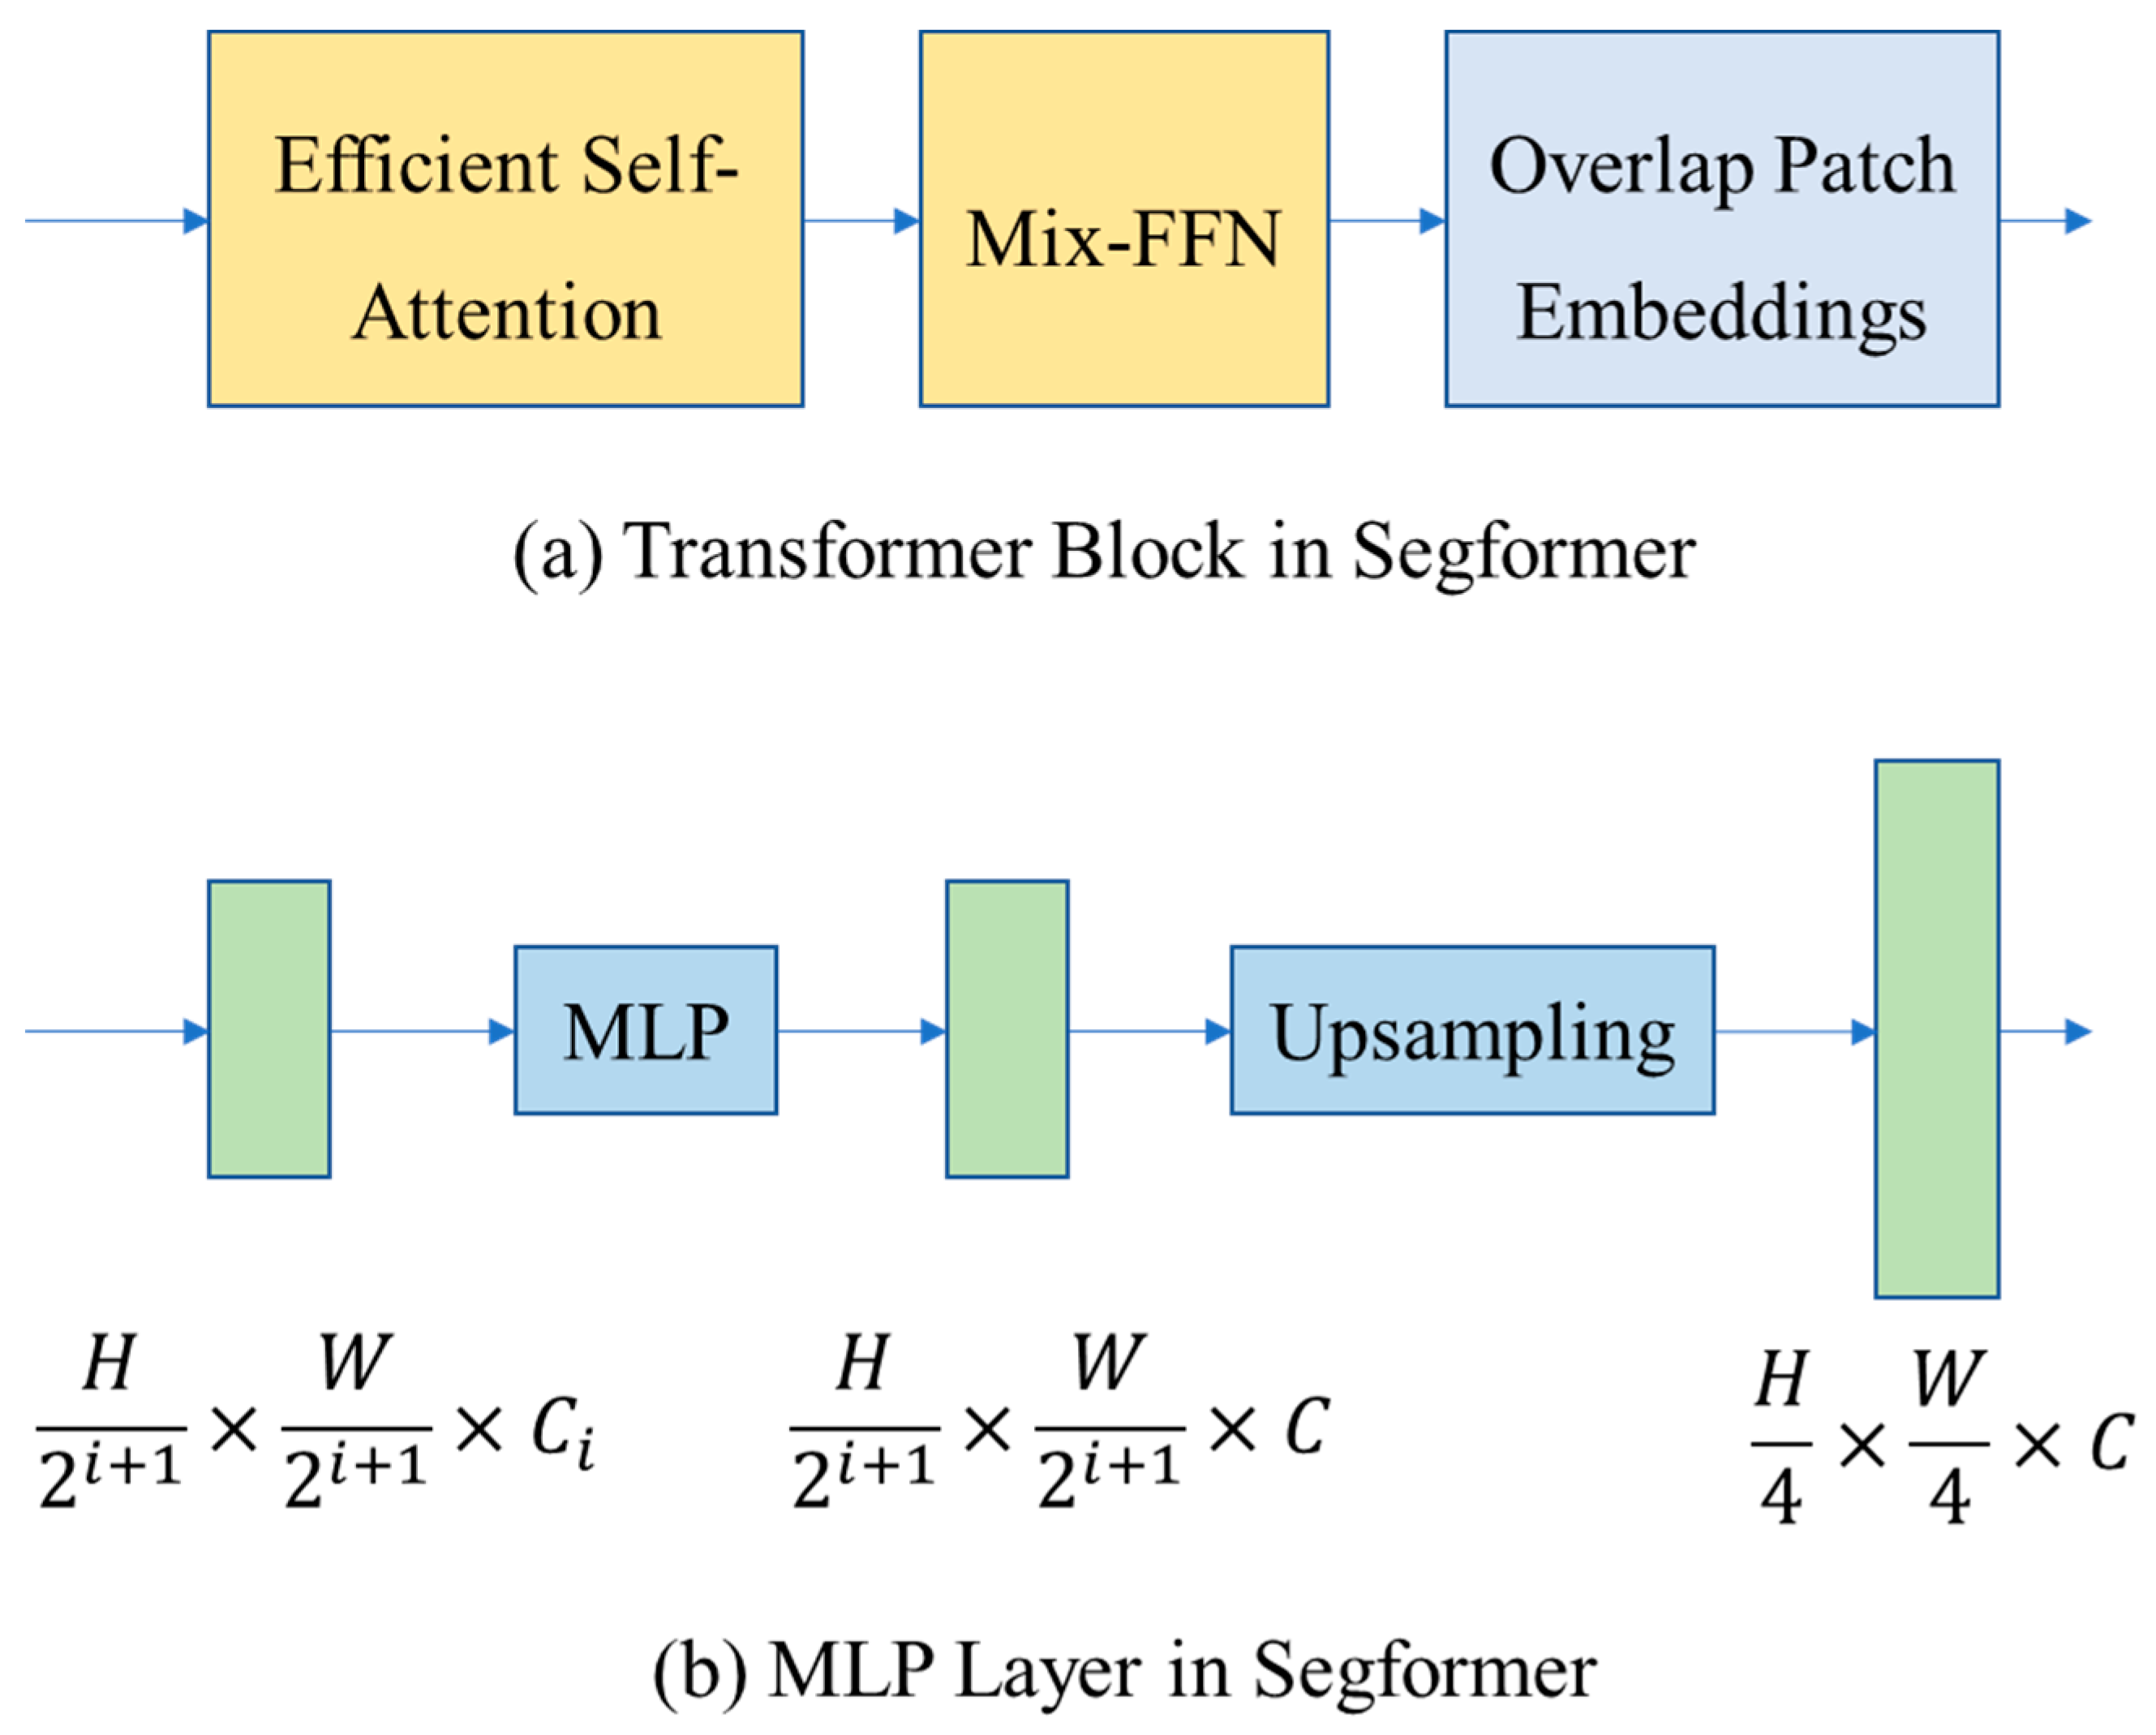
3.1. Comparison with Other Segmentation Methods

As mentioned in Section 2.2.2, we evaluated five different segmentation models and compared their UVL identification performance. For an effective comparison, we used the same training and testing datasets to train the five segmentation networks. Moreover, we used the same deep learning library, MMSegmentation, to train the five models using their corresponding pre-trained weights. Four evaluation metrics were applied, and the experimental results are shown in Table 2. We can see that Segformer had the best segmentation performance with the highest values of mIoU, mDice, mPrecision and mRecall. Swin Transformer [39] and Segformer [46] both used the Transformer as the backbone network to extract feature representation, which showed their superior feature learning ability. Compared with Swin Transformer, the selected Segformer produced both local and non-local attention that were unified to achieve powerful representations.
To further verify the recognition ability of Segformer, we show the segmentation performance of Segformer on various types of UVL in Table 3. In addition to the background, we can find that LUD and AM had comparatively higher values of IoU, Dice, Precision and Recall than the other three categories. We reasoned that this was due to the similar appearance between BL and VW/IGSs, which caused misrecognition.
For a better intuitive illustration, some examples of the remote sensing images from the testing dataset and their corresponding generated UVL segmentation results are shown in Figure 6. It is seen that most of the UVL was well identified, specifically LUD. The segmentation performance is sensitive to the changing illumination. As a result, some buildings with shadows were incorrectly identified as BL. The occurrence of shadows in both LUD and regular buildings within the training samples influenced the prediction of UVL. To improve UVL identification accuracy, building shadows can be additionally eliminated through manual image interpretation. Due to the inconsistent visual features of some UVL plots, we also find that there were some holes in the segmentation results. For example, some small-scale weeds in BL were recognised as part of the background or VW, which caused a decrease in segmentation accuracy. To visually assess the performance of the proposed model in the prediction sites, we further verified the identification of UVL in high-resolution imagery by overlaying and visualising the prediction results, as shown in Figure 7. It can be observed that the segmentation model demonstrated strong recognition performance across various types of UVL.

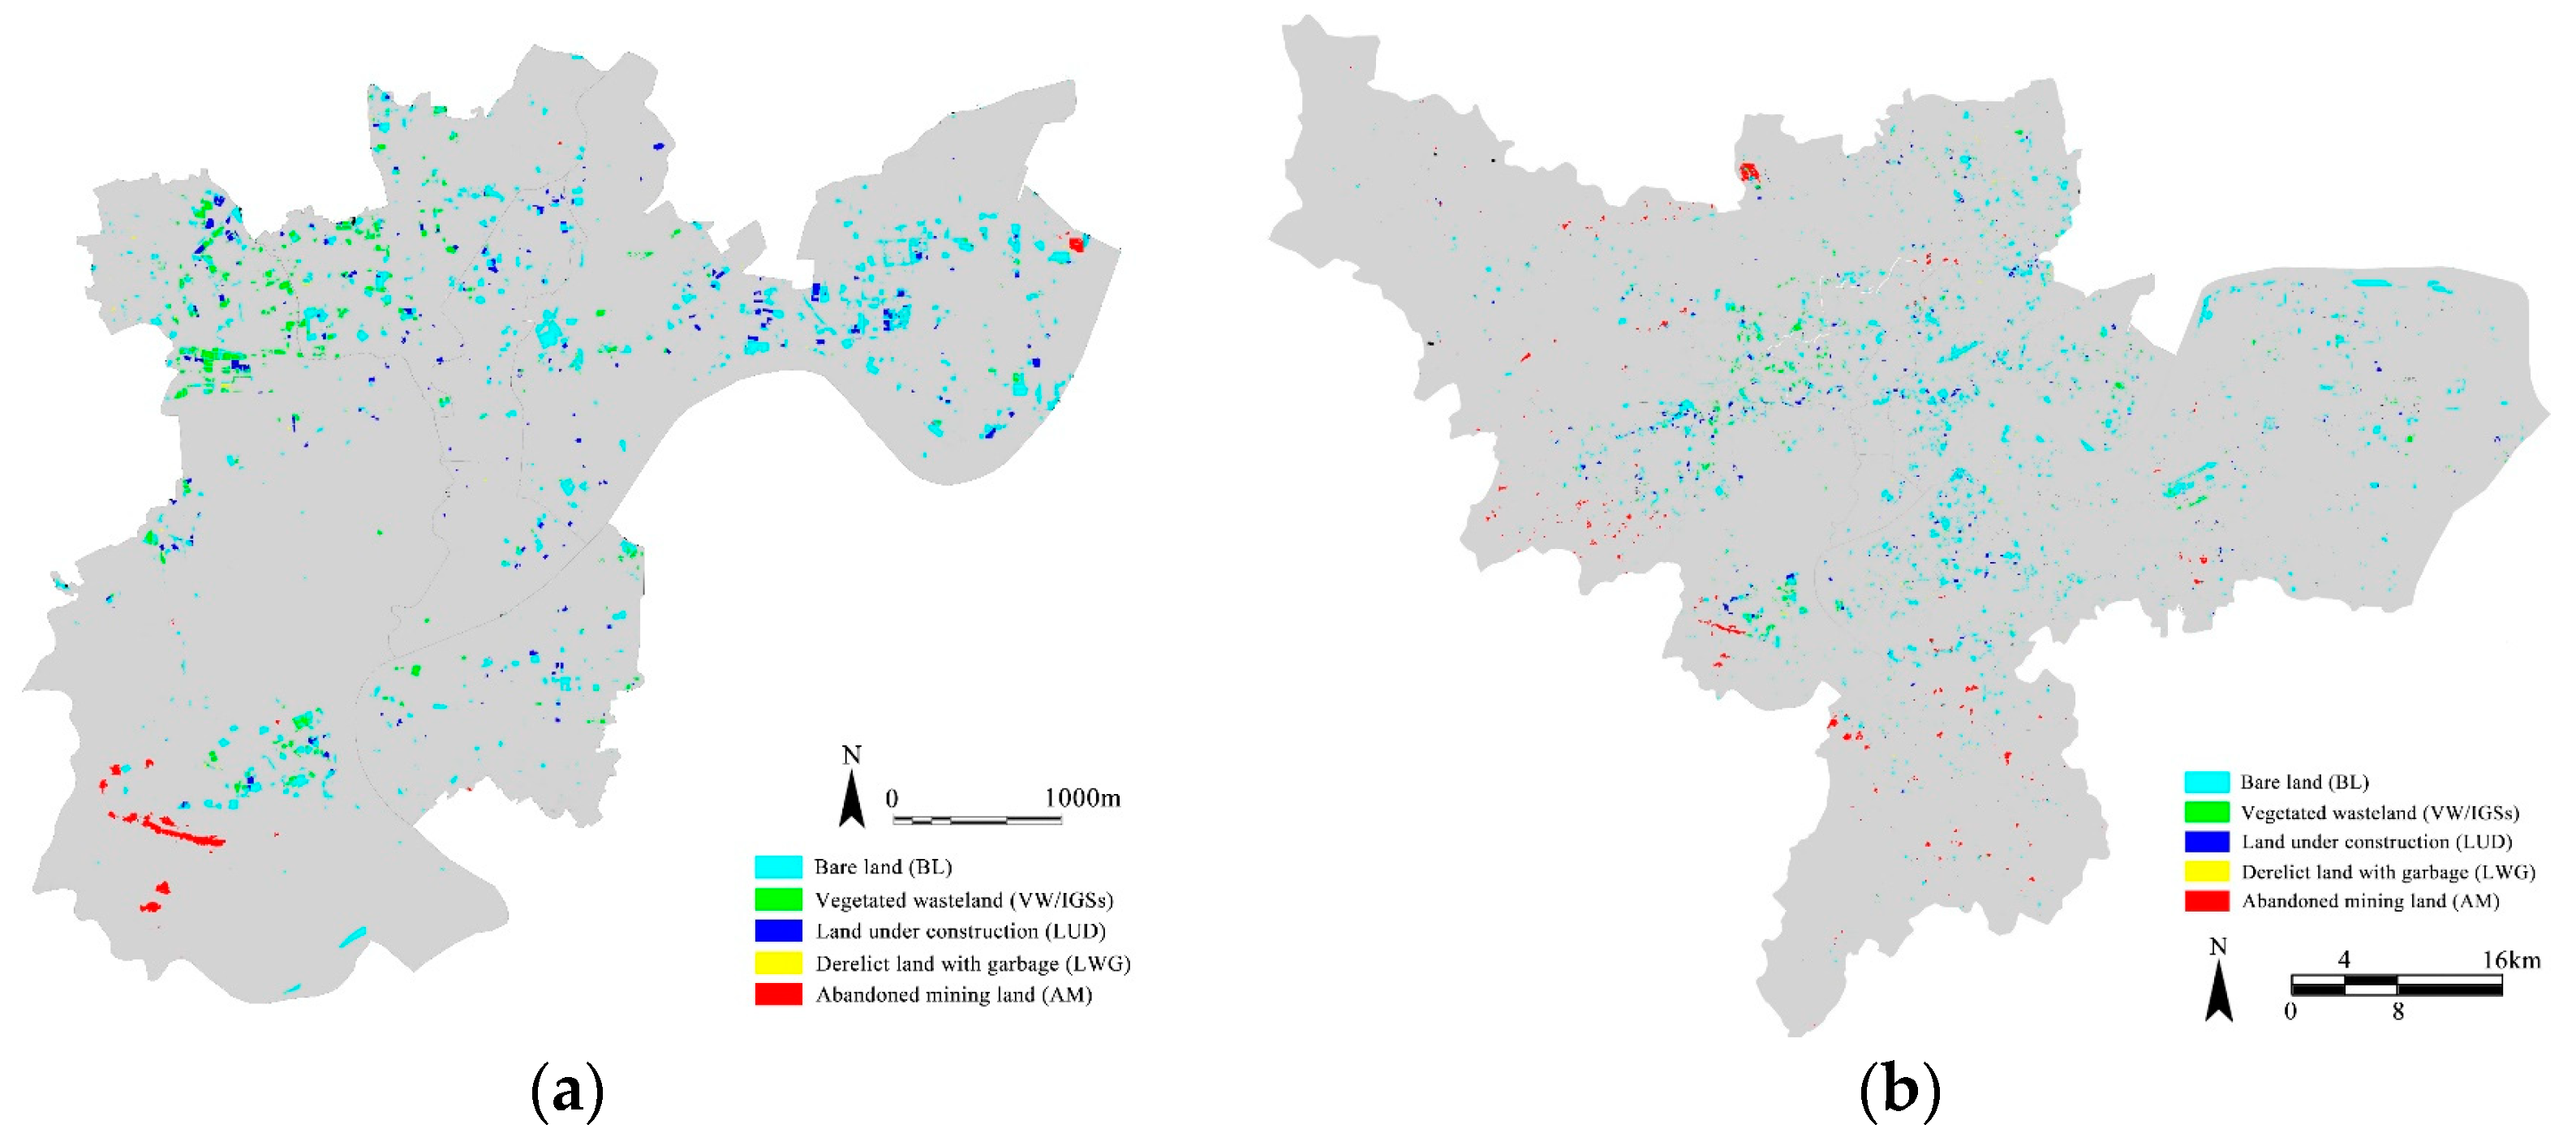
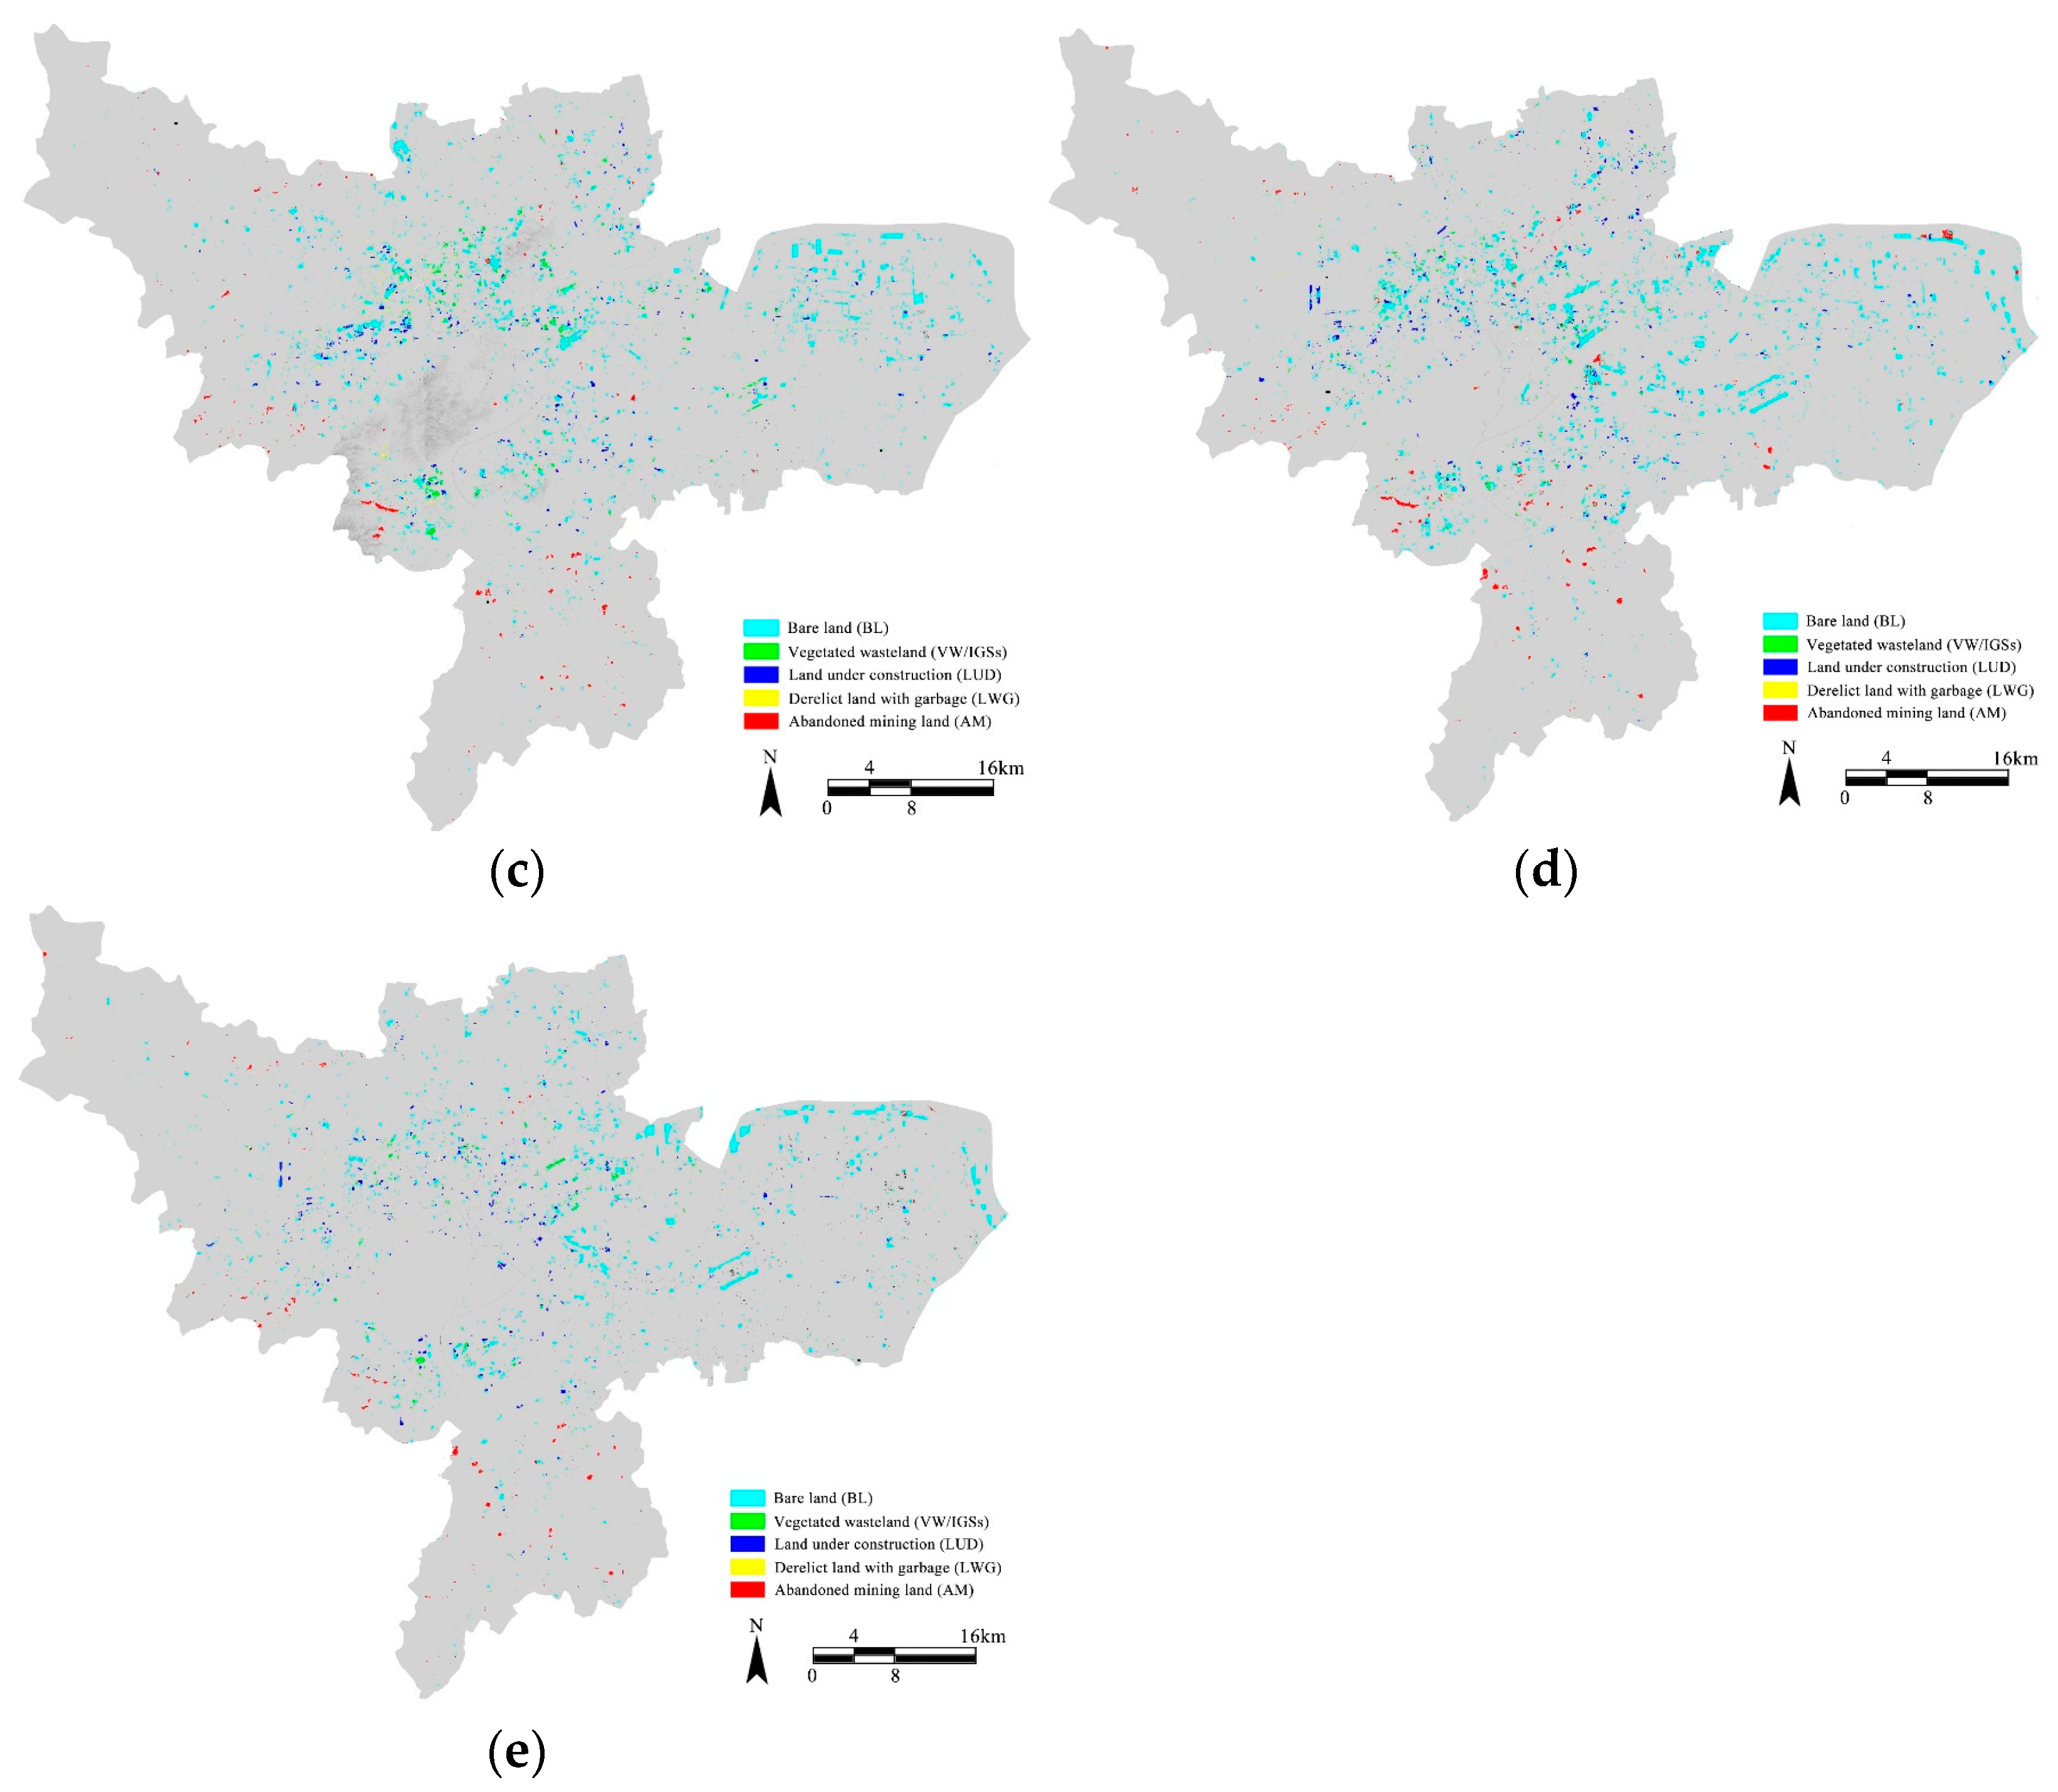
3.2. Identification Results

3.2.1. Identification of UVL

We obtained the UVL identification results (Figure 8) and UVL-related data, including the vacancy rate in the Hangzhou urban area (Table 4). From Figure 8 and Table 4, it can be seen that the overall vacancy rate in the study area (in 2014, the study area excluded Xiao Shan and Yu Hang districts due to the unavailability of HRRS images) decreased for the period of 2014–2017, from 3.84% to 2.27%, but increased slightly for the period of 2017–2022 (2.27% in 2017, 2.75% in 2019, and 3.05% in 2022). Between 2022 and 2023, however, the vacancy rate decreased from 3.05% to 2.08%. All vacancy rates for the period of 2014–2023 were below 5%, and the average rate was 2.80%, which was lower than the outcome in Shanghai (approximately 10% for the period of 2000–2010) [4], New York (5.08% in 2016) [26], Guangzhou (8.46% in 2016) [26], and much lower than some post-industrial or shrinking cities like Changchun (a northeastern rust belt city in China, 17.29% in 2016) [20]. Many post-industrial or shrinking cities have high percentages of UVL, mainly due to depopulation, deindustrialisation, economic decline, and/or suburbanisation [3]. The relatively low percentage of identified UVL in Hangzhou (average rate was 2.80%) in our study may suggest that urban shrinkage in this city was not prominently evident. In their study, Mao et al. used training images from Shenzhen and employed the DeepLabv3 model to predict UVL in the Hangzhou urban region for the year 2019 [28]. They reported a UVL rate of 5.1%, which differs from the 2.75% recorded in our study for the same year (Table 4). Such disparity might be attributed to the variations in the following: (1) the training images used: our study employed the training images of Hangzhou, while Mao et al. trained their semantic segmentation model based on the images of Shenzhen and applied the model to predict UVL in Hangzhou (their study is on a large national scale of 36 Chinese cities); (2) the model employed: we used the Segformer model, while Mao et al. used the DeepLabv3 model. The applied Segformer combined both local and global information to obtain more powerful representations for the identification of UVL; and (3) the different UVL categories examined: we studied five UVL categories, while Mao et al. considered six categories. These variations could contribute to the different UVL rates identified between our study and Mao et al.’s.
The changing dynamics of UVL should be highlighted. During our data labelling, we found that certain UVL plots in 2014 were later converted into new residential areas and parks in 2019, which means that these UVL were temporarily left vacant in 2014. Moreover, we also found a certain amount of land transitions from other land use types into UVL. Similar changing dynamics of UVL were also observed across other years. The identified changing dynamics of UVL in our study corroborates the finding from Li et al. [4], who found significant spatial–temporal changes in land transformation between UVL and other land use types between 2000 and 2010 in Shanghai. This may reflect the lack of long-term urban land use policy and land speculation in Chinese cities [4]. For example, many buildings with a housing age of less than 20 or 30 years have been demolished due to alterations in city planning, particularly to accommodate other short-term land uses [4].
In 2014, UVL was predominantly distributed in the northern part of the city core, whereas the central zone of the study area had relatively low vacancy rate (Figure 8a). Detailed UVL data across different districts (Figure 9) confirms that the districts of Gong Shu and Jiang Gan, situated in the northern city core, had the highest vacancy rates among all the studied districts in 2014. Shang Cheng district, located in the central zone of the study area, however, had the lowest vacancy rate (less than 2%) in 2014. From 2017 to 2022, UVL was mainly concentrated in Gong Shu, Jiang Gan, and Bin Jiang, and in particular, the vacancy rates in Gong Shu were more than 9% in 2019 and 2022 (Figure 9). These districts have experienced larger-scale urban development and expansion between 2017 and 2022, leading to a higher vacancy rate compared to other districts. In 2023, UVL in the study area was more evenly distributed compared to other years (Figure 8). Moreover, UVL in Shang Cheng district was consistently low from 2014 to 2023 (Figure 9), probably because of its location in the central city core along with its long history and already built-up urban form, leading to a relatively stable land use situation and low vacancy rate. This outcome contrasts with the finding of another study [4], which reported the presence of a considerable amount of UVL in already built-up areas of Shanghai (approximately 10%) between 2000 and 2010. This difference between our study and that of Li et al. [4] might be attributed to two factors. First, there is a distinction in the intensity and extent of urban renewal and redevelopment between Shanghai and Hangzhou, with Shanghai experiencing a stronger wave of urban renewal and redevelopment in urban built-up areas, leading to frequent demolitions and resulting in more UVL compared to Hangzhou. Second, the difference in study time frames is noteworthy. Our study’s time frame was set between 2014 and 2023, while Li et al.’s study investigated the time frame from 2000 to 2010 [4]. During this earlier period, Chinese cities were generally experiencing larger-scale, rapid urban expansion and sprawl, resulting in a considerable amount of land being insufficiently used within the built-up areas.

3.2.2. Identification of Different UVL Categories and IGSs

Figure 10 presents the identification results of different UVL categories by the study year and Table 5 shows related data of different categories. In each study year, BL had the highest quantity and LWG had the lowest quantity in all categories of vacant land (Figure 10 and Table 5). Moreover, AM was mainly distributed in the southern and southwestern area, where mountains and forests are densely scattered.
Regarding VW/IGSs, we found they were mostly distributed in certain parts of the urban area (Figure 11), constituting a very small part of Hangzhou’s land use from 2014 to 2023. In each study year, IGSs accounted for less than 1% of the study area (Table 5), a percentage much lower than that reported in other cities/regions such as Brisbane in Australia (6.3%) [31], Sapporo in Japan (4.8%) [31], and the Jasien and Karolewka river valleys in Lodz, Poland (26.6%) [33]. The concept of IGSs has been used inconsistently in previous studies depending on contexts and specific interpretations of informality. For example, in Rupprecht and Byrne’s study in Brisbane and Sapporo, IGSs were defined as unmanaged urban spaces with a history of human-induced disturbances, at least partially covered by non-remnant, spontaneously growing vegetation [31]. Biernacka et al.’s study in Poland categorised UGSs as formal and informal, with formal being defined as UGSs managed by the City Office and its subordinate units and informal being all other green spaces [33]. In our study, IGSs refer to UVL with unmanaged spontaneous vegetation. Inconsistencies in the definition of IGSs could impact identification results and pose difficulties for deeper comparisons across studies. Therefore, a consistent definition of IGSs is needed in future research to ensure greater consistency and facilitate comparisons across different contexts. The identified low IGS rate in our study is expected. In Chinese cities with rapid urbanisation, a large amount of urban greenery is cultivated with manicured lawns, flower beds, and artificial facilities/structures, whereas wilder, spontaneous IGSs tend to be erased and then redeveloped for utilitarian uses. Yet, IGSs play an important role in providing various ecosystem services in cities and offering potential greenspaces for residents’ recreation in addition to formal parks and gardens.

4. Conclusions

In this paper, a segmentation framework for automatically identifying UVL using high-resolution remote sensing images was presented and was applied in Hangzhou. We also explored various types of UVL in Hangzhou, China, in a view of large-scale space and time. To meet the need of labelled samples in deep semantic models, we first constructed a UVL segmentation dataset containing 3096 patch samples for training and 128 patch samples for evaluation. We then evaluated five deep semantic segmentation networks and finally selected Segformer to recognise UVL. The experimental results demonstrated that the presented Segformer had strong feature extraction and discrimination capacities, which achieved the satisfying segmentation performance. The well-trained Segformer was applied to predict various types of UVL, including IGSs in Hangzhou from 2014 to 2023. And we analysed the UVL and IGS change from the perspective of spatial–temporal remote sensing images, which can provide auxiliary information for urban planning. In future works, we believe that the constructed UVL segmentation dataset can be the database to identify UVL in other cities. Furthermore, we can use multi-spectral remote sensing images and apply post-processing operations to improve the segmentation performance of different types of UVL.

Supplementary Materials

Supplementary data of this paper is available online at: https://drive.google.com/drive/folders/1zYGWaAywP3hxBZFogawwSm3kO-SWWk_9 (released on 19 November 2023).

Author Contributions

Conceptualisation, methodology, writing—original draft preparation, writing—review and editing, X.H.; software, data curation, visualisation, funding acquisition, writing—review and editing, S.Z. All authors have read and agreed to the published version of the manuscript.

Funding

This research was funded by the National Natural Science Foundation of China (grant number 62201191) and the Anhui Natural Science Foundation (grant number 2208085QF181).

Data Availability Statement

Data are contained within the article and Supplementary Materials.

Acknowledgments

The authors thank the professional auditors who have made great contributions to labelling the original remote sensing images. We would like to thank our academic editor and reviewers for providing valuable comments to improve the manuscript.

Conflicts of Interest

The authors declare no conflicts of interest.

References

  1. Kim, G.; Miller, P.A.; Nowak, D.J. Urban vacant land typology: A tool for managing urban vacant land. Sustain. Cities Soc. 2018, 36, 144–156. [Google Scholar] [CrossRef]
  2. Németh, J.; Langhorst, J. Rethinking urban transformation: Temporary uses for vacant land. Cities 2014, 40, 143–150. [Google Scholar] [CrossRef]
  3. Lima, M.F.; Eischeid, M.R. Shrinking cities: Rethinking landscape in depopulating urban contexts. Landsc. Res. 2017, 42, 691–698. [Google Scholar] [CrossRef]
  4. Li, W.; Zhou, W.; Bai, Y.; Pickett, S.T.A.; Han, L. The smart growth of Chinese cities: Opportunities offered by vacant land. Land Degrad. Dev. 2018, 29, 3512–3520. [Google Scholar] [CrossRef]
  5. Xiong, C.; Zhang, Y.; Liu, X.; Luan, Q.; Wei, S. Urban vacant land in rapidly urbanized areas: Status, micro-level drivers, and implications. J. Chin. Gov. 2021, 6, 554–577. [Google Scholar] [CrossRef]
  6. Newell, J.P.; Foster, A.; Borgman, M.; Meerow, S. Ecosystem services of urban agriculture and prospects for scaling up production: A study of Detroit. Cities 2022, 125, 103664. [Google Scholar] [CrossRef]
  7. Zhang, Y.; Smith, J.P.; Tong, D.; Turner, B.L., II. Optimizing the co-benefits of food desert and urban heat mitigation through community garden planning. Landsc. Urban Plan. 2022, 226, 104488. [Google Scholar] [CrossRef]
  8. Kowarik, I. Urban wilderness: Supply, demand, and access. Urban For. Urban Green. 2018, 29, 336–347. [Google Scholar] [CrossRef]
  9. Cheng, X.L.; Cubino, J.P.; Balfour, K.; Zhu, Z.X.; Wang, H.F. Drivers of spontaneous and cultivated species diversity in the tropical city of Zhanjiang, China. Urban For. Urban Green. 2022, 67, 127428. [Google Scholar] [CrossRef]
  10. Jorgensen, A.; Keenan, R. Urban Wildscapes; Routledge: London, UK, 2012. [Google Scholar]
  11. Gemmell, E.; Ramsden, R.; Brussoni, M.; Brauer, M. Influence of neighborhood built environments on the outdoor free play of young children: A systematic, mixed-studies review and thematic synthesis. J. Urban Health 2023, 100, 118–150. [Google Scholar] [CrossRef]
  12. Luo, S.; Patuano, A. Multiple ecosystem services of informal green spaces: A literature review. Urban For. Urban Green. 2023, 81, 127849. [Google Scholar] [CrossRef]
  13. Mathey, J.; Arndt, T.; Banse, J.; Rink, D. Public perception of spontaneous vegetation on brownfields in urban areas—Results from surveys in Dresden and Leipzig (Germany). Urban For. Urban Green. 2018, 29, 384–392. [Google Scholar] [CrossRef]
  14. Kremer, P.; Hamstead, Z.A.; McPhearson, T. A social-ecological assessment of vacant lots in New York City. Landsc. Urban Plan. 2013, 120, 218–233. [Google Scholar] [CrossRef]
  15. Shao, Y.; Xu, X.; Yuan, J. The Intension and Values of Urban Wildscapes. Landsc. Arch. Front. 2021, 9, 14–25. [Google Scholar] [CrossRef]
  16. Yuan, J. Urban Wilderness: Nature and the Potential in the Urban Cracks. Landsc. Arch. Front. 2021, 9, 10–13. [Google Scholar] [CrossRef]
  17. Hu, X.; Lima, M.F.; McLean, R.; Sun, Z. Exploring preferences for biodiversity and wild parks in Chinese cities: A conjoint analysis study in Hangzhou. Urban For. Urban Green. 2022, 73, 127595. [Google Scholar] [CrossRef]
  18. Bowman, A.O.M.; Pagano, M.A. Transforming America’s cities: Policies and conditions of vacant land. Urban Aff. Rev. 2000, 35, 559–581. [Google Scholar] [CrossRef]
  19. Sperandelli, D.I.; Dupas, F.A.; Dias Pons, N.A. Dynamics of Urban Sprawl, Vacant Land, and Green Spaces on the Metropolitan Fringe of São Paulo, Brazil. J. Urban Plan. Dev. 2013, 139, 274–279. [Google Scholar] [CrossRef]
  20. Li, W.; Wang, D.; Li, H.; Wang, J.; Zhu, Y.; Yang, Y. Quantifying the spatial arrangement of underutilized land in a rapidly urbanized rust belt city: The case of Changchun City. Land Use Policy 2019, 83, 113–123. [Google Scholar] [CrossRef]
  21. Eanes, F.; Ventura, S. Inventorying Land Availability and Suitability for Community Gardens in Madison, Wisconsin. Cities Environ. 2015, 8, 2. [Google Scholar]
  22. Qu, Y.; Jiang, G.; Li, Z.; Shang, R.; Zhou, D. Understanding the multidimensional morphological characteristics of urban idle land: Stage, subject, and spatial heterogeneity. Cities 2020, 97, 102492. [Google Scholar] [CrossRef]
  23. Wang, Z.; Chen, X.; Huang, N.; Yang, Y.; Wang, L.; Wang, Y. Spatial identification and redevelopment evaluation of brownfields in the perspective of urban complex ecosystems: A case of Wuhu city, China. Int. J. Environ. Res. Public Health 2022, 19, 478. [Google Scholar] [CrossRef] [PubMed]
  24. Zhang, W.; Li, Y.; Zheng, C. The distribution characteristics and driving mechanism of vacant land in Chengdu, China: A perspective of urban shrinkage and expansion. Land Use Policy 2023, 132, 106812. [Google Scholar] [CrossRef]
  25. Smith, J.P.; Li, X.; Turner, B.L. Lots for greening: Identification of metropolitan vacant land and its potential use for cooling and agriculture in Phoenix, AZ, USA. Appl. Geogr. 2017, 85, 139–151. [Google Scholar] [CrossRef]
  26. Song, X.; Wen, M.; Shen, Y.; Feng, Q.; Xiang, J.; Zhang, W.; Zhao, G.; Wu, Z. Urban vacant land in growing urbanization: An international review. J. Geogr. Sci. 2020, 30, 669–687. [Google Scholar] [CrossRef]
  27. Song, Y.; Lyu, Y.; Qian, S.; Zhang, X.; Lin, H.; Wang, S. Identifying urban candidate brownfield sites using multi-source data: The case of Changchun City, China. Land Use Policy 2022, 117, 106084. [Google Scholar] [CrossRef]
  28. Mao, L.; Zheng, Z.; Meng, X.; Zhou, Y.; Zhao, P.; Yang, Z.; Long, Y. Large-scale automatic identification of urban vacant land using semantic segmentation of high-resolution remote sensing images. Landsc. Urban Plan. 2022, 222, 104384. [Google Scholar] [CrossRef]
  29. Sun, Y.; Hu, H.; Han, Y.; Wang, Z.; Zheng, X. Large-Scale Automatic Identification of Industrial Vacant Land. Int. J. Geo-Inf. 2023, 12, 409. [Google Scholar] [CrossRef]
  30. Xu, S.; Ehlers, M. Automatic detection of urban vacant land: An open-source approach for sustainable cities. Comput. Environ. Urban Syst. 2022, 91, 101729. [Google Scholar] [CrossRef]
  31. Rupprecht, C.D.D.; Byrne, J.A. Informal urban green-space: Comparison of quantity and characteristics in Brisbane, Australia and Sapporo, Japan. PLoS ONE 2014, 9, e99784. [Google Scholar] [CrossRef]
  32. Sikorska, D.; Ciężkowski, W.; Babańczyk, P.; Chormański, J.; Sikorski, P. Intended wilderness as a Nature-based Solution: Status, identification and management of urban spontaneous vegetation in cities. Urban For. Urban Green. 2021, 62, 127155. [Google Scholar] [CrossRef]
  33. Biernacka, M.; Kronenberg, J.; Łaszkiewicz, E.; Czembrowski, P.; Amini Parsa, V.; Sikorska, D. Beyond urban parks: Mapping informal green spaces in an urban–peri-urban gradient. Land Use Policy 2023, 131, 106746. [Google Scholar] [CrossRef]
  34. Bragagnolo, L.; da Silva, R.V.; Grzybowski, J.M.V. Amazon forest cover change mapping based on semantic segmentation by U-Nets. Ecol. Inform. 2021, 62, 101279. [Google Scholar] [CrossRef]
  35. Ghandorh, H.; Boulila, W.; Masood, S.; Koubaa, A.; Ahmed, F.; Ahmad, J. Semantic Segmentation and Edge Detection—Approach to Road Detection in Very High Resolution Satellite Images. Remote Sens. 2022, 14, 613. [Google Scholar] [CrossRef]
  36. Jung, H.; Choi, H.S.; Kang, M. Boundary Enhancement Semantic Segmentation for Building Extraction From Remote Sensed Image. IEEE Trans. Geosci. Remote Sens. 2022, 60, 5215512. [Google Scholar] [CrossRef]
  37. Guo, M.; Liu, H.; Xu, Y.; Huang, Y. Building extraction based on U-net with an attention block and multiple losses. Remote Sens. 2020, 12, 1400. [Google Scholar] [CrossRef]
  38. Badrinarayanan, V.; Kendall, A.; Cipolla, R. SegNet: A Deep Convolutional Encoder-Decoder Architecture for Image Segmentation. IEEE Trans. Pattern Anal. Mach. Intell. 2017, 39, 2481–2495. [Google Scholar] [CrossRef] [PubMed]
  39. He, X.; Zhou, Y.; Zhao, J.; Zhang, D.; Yao, R.; Xue, Y. Swin Transformer Embedding UNet for Remote Sensing Image Semantic Segmentation. IEEE Trans. Geosci. Remote Sens. 2022, 60, 4408715. [Google Scholar] [CrossRef]
  40. Sun, K.; Zhao, Y.; Jiang, B.; Cheng, T.; Xiao, B.; Liu, D.; Mu, Y.; Wang, X.; Liu, W.; Wang, J. High-Resolution Representations for Labeling Pixels and Regions. arXiv 2019, arXiv:1904.04514. [Google Scholar] [CrossRef]
  41. Hangzhou Municipal Statistical Bureau. Hangzhou Municipal Statistical Bureau. Hangzhou Statistical Yearbook 2022: Population and Employment. In Hangzhou Statistical Yearbook 2022; Hangzhou Municipal Statistical Bureau: Hangzhou, China, 2022; pp. 65–86. [Google Scholar]
  42. Hangzhou Municipal Statistical Bureau. Hangzhou Municipal Statistical Bureau. Hangzhou Statistical Yearbook 2022: General Survey. In Hangzhou Statistical Yearbook 2022; Hangzhou Municipal Statistical Bureau: Hangzhou, China, 2022; pp. 24–61. [Google Scholar]
  43. Hangzhou Municipal Government. Master Plan of Hangzhou (2001–2020); Hangzhou Municipal Government: Hangzhou, China, 2001.
  44. Chen, L.C.; Zhu, Y.; Papandreou, G.; Schroff, F.; Adam, H. Encoder-decoder with atrous separable convolution for semantic image segmentation. In Proceedings of the European Conference on Computer Vision (ECCV), Munich, Germany, 8–14 September 2018; pp. 801–818. [Google Scholar]
  45. Zhao, H.; Shi, J.; Qi, X.; Wang, X.; Jia, J. Pyramid scene parsing network. In Proceedings of the 2017 IEEE Conference on Computer Vision and Pattern Recognition (CVPR), Honolulu, HI, USA, 21–26 July 2017; pp. 2881–2890. [Google Scholar]
  46. Xie, E.; Wang, W.; Yu, Z.; Anandkumar, A.; Alvarez, J.M.; Luo, P. SegFormer: Simple and efficient design for semantic segmentation with transformers. Adv. Neural Inf. Process. Syst. 2021, 34, 12077–12090. [Google Scholar]
  47. MMSegmentation: OpenMMLab Semantic Segmentation Toolbox and Benchmark. 2020. Available online: https://github.com/open-mmlab/mmsegmentation (accessed on 30 March 2023).
Figure 1. Study area in Hangzhou. Source: The authors.
Remotesensing 16 00216 g001
Figure 2. Framework of automatic identification of urban vacant land.
Remotesensing 16 00216 g002
Figure 3. Representative remote sensing images of the five UVL categories: (A) bare land (BL), (B) vegetated wasteland (VW/IGSs), (C) land under construction (LUD), (D) derelict land with garbage (LWG), and (E) abandoned mining land (AM).
Remotesensing 16 00216 g003
Figure 4. Framework of the selected Segformer segmentation model.
Remotesensing 16 00216 g004
Figure 5. Transformer block and MLP layer in Segformer.
Remotesensing 16 00216 g005
Figure 6. Examples of segmentation results. (a) input image; (b) labelled ground-truth; (c) segmentation result.
Remotesensing 16 00216 g006
Figure 7. Visualisation examples of predicted results.
Remotesensing 16 00216 g007
Figure 8. Identification of UVL in Hangzhou urban area from 2014 to 2023 (Due to the unavailability of HRRS images for Xiao Shan and Yu Hang districts in 2014, our presentation of the year 2014 excludes these two districts). (a) 2014; (b) 2017; (c) 2019; (d) 2022; (e) 2023.
Remotesensing 16 00216 g008
Figure 9. Vacancy rate across different districts (share of the UVL area to that of the district area) from 2014 to 2023 (In 2014, Xiao Shan and Yu Hang districts were excluded from the study area due to the unavailability of HRRS images. BJ = Bin Jiang, GS = Gong Shu, JG = Jiang Gan, SC = Shang Cheng, XC = Xia Cheng, XH = Xi Hu, XS = Xiao Shan, YH = Yu Hang).
Remotesensing 16 00216 g009
Figure 10. Identification of different UVL categories in Hangzhou urban area from 2014 to 2023 (Due to the unavailability of HRRS images for Xiao Shan and Yu Hang districts in 2014, our presentation of the year 2014 excludes these two districts). (a) 2014; (b) 2017; (c) 2019; (d) 2022; (e) 2023.
Remotesensing 16 00216 g010aRemotesensing 16 00216 g010b
Figure 11. Identification of VW/IGSs in Hangzhou urban area from 2014 to 2023 (Due to the unavailability of HRRS images for Xiao Shan and Yu Hang districts in 2014, our presentation of the year 2014 excludes these two districts). (a) 2014; (b) 2017; (c) 2019; (d) 2022; (e) 2023.
Remotesensing 16 00216 g011
Table 1. HRRS image surface characteristics of the five UVL categories, and non-vacant land with similar characteristics for each category.
CategoriesHRRS Image Surface CharacteristicsNon-Vacant Land with Similar Characteristics
Bare land (BL)
  • Clear boundaries demarcated by buildings, roads, or plants
  • Flat terrain, land surface is unsmooth and unpaved
  • Land surface is bare and vacant without buildings or other built structures
  • Square
  • Parking lot
  • Hardened ground
Vegetated wasteland (VW/IGSs)
  • Clear boundaries demarcated by buildings, roads, or plants
  • Flat terrain
  • Land with unmanaged, unkempt vegetation (usually not trees)
  • Green lawns
  • Green farmland
Land under construction (LUD)
  • Clear boundaries demarcated by buildings, roads, or plants
  • Flat terrain
  • Has demolished structures and also built structures under construction. Construction equipment such as material stockpiles, scaffolding, etc. may be present
  • May have unique colour such as brick-red built structures under construction
-
Derelict land with garbage (LWG)
  • Clear boundaries demarcated by buildings, roads, or plants
  • Flat terrain, land surface is unsmooth, unpaved, and derelict with garbage scattered and signs of damage
-
Abandoned mining land (AM)
  • Boundaries may be marked by mountainous vegetation
  • Has large open pits or excavations. May have distinctive grey or white colours
  • May exhibit soil compaction, erosion, or other terrain alterations
-
Table 2. Segmentation performance of the five deep semantic networks.
MethodDeeplabv3plus [44]HRNet [40]PSPNet [45]Swin Transformer [39]Segformer [46]
mIoU0.4500.4910.4750.5640.698
mDice0.5720.6200.6060.6950.816
mPrecision0.7340.7120.7720.7410.862
mRecall0.4970.5650.5210.6680.780
Table 3. Segmentation performance of Segformer in various types of UVL.
ClassBackgroundLUDBLVWLWGAM
IoU0.9720.7170.6150.5850.6020.699
Dice0.9860.8350.7620.7380.7520.823
Precision0.9790.9100.8320.8690.7450.834
Recall0.9920.7720.7020.6410.7590.811
Table 4. UVL-related data of the whole study area from 2014 to 2023 (In 2014, Xiao Shan and Yu Hang districts were excluded from the study area due to the unavailability of HRRS images).
UVL Area (km2)Study Area (km2)Vacancy Rate
201427.077053.84%
201776.0133472.27%
201992.0633472.75%
2022102.0433473.05%
202369.6133472.08%
Table 5. Data about different UVL categories of the whole study area from 2014 to 2023 (In 2014, Xiao Shan and Yu Hang districts were excluded from the study area due to the unavailability of HRRS images) Note: vacancy rate means the share of the area of each category to that of the study area.
LUDBLVW/IGSsLWGAM
2014Area (km2)4.0615.485.300.271.97
Vacancy rate0.58%2.20%0.75%0.04%0.28%
2017Area (km2)7.5849.667.921.729.12
Vacancy rate0.23%1.48%0.24%0.05%0.27%
2019Area (km2)10.6161.389.324.386.37
Vacancy rate0.32%1.83%0.28%0.13%0.19%
2022Area (km2)13.6970.965.512.089.80
Vacancy rate0.41%2.12%0.16%0.06%0.29%
2023Area (km2)9.8748.985.170.804.78
Vacancy rate0.29%1.46%0.15%0.02%0.14%
Disclaimer/Publisher’s Note: The statements, opinions and data contained in all publications are solely those of the individual author(s) and contributor(s) and not of MDPI and/or the editor(s). MDPI and/or the editor(s) disclaim responsibility for any injury to people or property resulting from any ideas, methods, instructions or products referred to in the content.

