Article

Temporal Stability of Grassland Soil Moisture Utilising Sentinel-2 Satellites and Sparse Ground-Based Sensor Networks

1
VistaMilk, Teagasc Moorepark, P61 C996 Fermoy, Ireland
2
Earth and Ocean Sciences, Ryan Institute, College of Science and Engineering, University of Galway, H91 TK33 Galway, Ireland
*
Author to whom correspondence should be addressed.
Remote Sens. 2024, 16(2), 220; https://doi.org/10.3390/rs16020220
Submission received: 19 September 2023 / Revised: 1 December 2023 / Accepted: 8 December 2023 / Published: 5 January 2024
(This article belongs to the Special Issue Remote Sensing for Soil Moisture and Vegetation Parameters Retrieval)

Abstract

:
Soil moisture is important for understanding climate, water resources, water storage, and land use management. This study used Sentinel-2 (S-2) satellite optical data to retrieve surface soil moisture at a 10 m scale on grassland sites with low hydraulic conductivity soil in a climate dominated by heavy rainfall. Soil moisture was estimated after modifying the Optical Trapezoidal Model to account for mixed land cover in such conditions. The method uses data from a short-wave infra-red band, which is sensitive to soil moisture, and four vegetation indices from optical bands, which are sensitive to overlying vegetation. Scatter plots of these data from multiple, infrequent satellite passes are used to define the range of surface moisture conditions. The saturated and dry edges are clearly non-linear, regardless of the choice of vegetation index. Land cover masks are used to generate scatter plots from data only over grassland sites. The Enhanced Vegetation Index demonstrated advantages over other vegetation indices for surface moisture estimation over the entire range of grassland conditions. In poorly drained soils, the time lag between satellite surface moisture retrievals and in situ sensor soil moisture at depth must be part of the validation process. This was achieved by combining an approximate solution to the Richards’ Equation, along with measurements of saturated and residual moisture from soil samples, to optimise the correlations between measurements from satellites and sensors at a 15 cm depth. Time lags of 2–4 days resulted in a reduction of the root mean square errors between volumetric soil moisture predicted from S-2 data and that measured by in situ sensors, from ~0.1 m3/m3 to <0.06 m3/m3. The surface moisture results for two grassland sites were analysed using statistical concepts based upon the temporal stability of soil water content, an ideal framework for the intermittent Sentinel-2 data in conditions of persistent cloud cover. The analysis could discriminate between different natural drainages and surface soil textures in grassland areas and could identify sub-surface artificial drainage channels. The techniques are transferable for land-use and agricultural management in diverse environmental conditions without the need for extensive and expensive in situ sensor networks.

1. Introduction

Soil moisture is an Essential Climate Variable [1]. It is highly variable in space with scales ranging from centimetres to kilometres, and time scales from minutes to years [2]. It impacts the exchange of water, carbon and energy [3,4] and influences the distribution of rainwater between run-off, evapotranspiration and infiltration [5]. Soil moisture provides input into models for crop growth and grassland production [6], and it dictates the management of cattle grazing [7].
Soil moisture can be directly measured in the laboratory using thermogravimetric techniques on field samples or in the field using ground-based methods, such as electromagnetic sensors [8]. The availability of low-cost sensors has driven the development of regional soil moisture networks, allowing measurements at many sites and at several depths [9]. These measurements, however, have uncertainties due to salinity variations, variable local contact with the soil and site-specific calibration and they only provide measurements at depths > 5 cm in the soil, with a few exceptions [10]; moreover, local (~10 cm) sampling around the sensor is not always representative of the surrounding area [11]. Nevertheless, networks with systematic observations of soil moisture have long been useful to support agricultural decision making [12].
Satellite remote sensing technology provides a solution to measure soil moisture across scales such as a field (100s of m2), catchment (0.1–1 km2), sub-watershed (1–80 km2) and beyond. Reviews of recent satellite soil moisture products have summarised the different methods of estimation, the limitations, the advantages/disadvantages, the trends in the evolution of thermal and optical sensors [13] or microwave sensors [14], and the potential synergies from multi-sensor fusion [15]. Most of the currently employed techniques have been deployed at relatively coarse scales (>3 km) in the optical [16], thermal [17] and microwave [18] parts of the electromagnetic spectrum. Microwave sensors, on satellite missions such as Soil Moisture and Ocean Salinity (SMOS) [19], Soil Moisture Active Passive (SMAP) [18] and Advanced Scatterometer (ASCAT) [20], have the advantage of operating in all weather conditions as they are not affected by cloud or variable solar illumination. Sentinel-1 synthetic aperture radar satellites have been used for higher resolution soil moisture estimation [21,22], but are sensitive to fine-scale features and (currently) need fusion with other microwave sensors and resampling to ~1 km scale to reduce the complexity in the interpretation of their data [23,24]. The use of satellite radar soil moisture products for field-scale agricultural decision support is therefore limited but is an active area of research [25].
In situ soil moisture networks are invaluable for validating satellite soil moisture retrievals [26,27]. The comparison of in situ and satellite measurements with different spatial and temporal resolutions is complicated [28], and its investigation is partially driven by requirements for datasets at sub-daily temporal and <1 km spatial resolutions, at multiple soil depths and with consistent error information.
The objective of this study was to investigate high-resolution (10 m to 20 m) normalised Surface Soil Moisture (nSSM) at depths < 0.2 cm from Sentinel-2 (S-2) data using a modification of the Optical Trapezoid Model (OPTRAM; [16]) and very sparse soil moisture networks over grassland sites. The sites are in Ireland, a country which typifies a temperate, high-rainfall climate [29] with intensive agriculture. OPTRAM has been used to estimate soil moisture from Landsat [16], S-2 [30,31] and MODIS [32,33,34]. These studies were conducted in crop fields in arid or semi-arid climates, which are quite different from the climatic conditions in this study. They tend to follow the original OPTRAM formulation of [16] which incorporates the Normalised Difference Vegetation Index (NDVI). This study explored the use of other vegetation indices appropriate for temperate climate and poorly draining soil conditions. Previous studies [16,18,35] have obtained typical correlations between in situ Volumetric Soil Moisture (VSM) measurements and satellite-derived SSM (~0.2–0.8) but they did not take into account the sensor depths beneath the surface. This study combined laboratory measurements of saturated and residual VSM in representative soil samples with an approximate solution to the Richards’ Equation [36,37] to establish relationships between optically derived nSSM and in situ sensor VSM. This deals with the time lag between a satellite pass and a sensor measurement to reduce uncertainties in the validation process [38], especially in poorly draining soils.
This study also introduced an analysis of temporal stability (TS) [39] to the S-2 nSSM. TS studies have been used for improving hydrological models, filling of missing in situ data and some limited environmental management [40] but tend to be based upon in situ sensor networks [41]. This study is the first to use the TS of S-2 nSSM to explore 10 m scale variations in grassland to identify locations where the soil is consistently wetter or dryer than the average; this could be useful in decisions for targeted irrigation and drainage. We recognise that grassland occupies one third of the global land surface area and plays an important role in carbon sequestration, food production and other ecosystem services [42].

2. Data and Methods

2.1. Study Area

The Republic of Ireland in North-West Europe borders the Atlantic Ocean which results in humid weather all year round with abundant rainfall: ~1000–1400 mm/year in the west and ~750–1000 mm/year in the east [43]. The CORINE Land Cover 2018 inventory shows agriculture as the dominant type in Ireland, accounting for ~67% of the national land cover. Within agriculture, pastureland (grassland) is the major class (~55%) followed by pastureland interspersed with other natural vegetation (6.9%) and arable land (4.5%). The other major land cover categories include wetlands (14.9%) and forests (9.5%) [44].
The study focuses on two areas (Figure 1) ~7.5 km2 and 16 km2 in size surrounding two farms, Rossmore (52°N, 8°W) and Stradone (53°N, 7°W), respectively. Both farms are part of the Teagasc Heavy Soils Programme [45] and are ~50 ha. The objective of this programme is to improve the sustainability of grassland farms dominated by poorly drained soils used for grazing livestock. Rossmore is flat and contains loam and sandy loam soils, while Stradone has elevation differences less than ~ 3 metres and is comprised of loam and clay loam soils. A high-resolution soil survey of each farm was carried out following the protocol of the Irish Soil Information System [46]. The soils are classified [47,48] as poorly drained (those that reach saturation during rainfall events and hold excess water for multiple days following rainfall events) or moderately drained (those that hold excess water during rainfall events but not afterwards). The farms are equipped with in situ soil moisture sensors providing daily estimates of VSM and a weather station recording daily estimates of rainfall, evapotranspiration (ET) and wind speed.

2.2. Satellite and In Situ Data

The S-2 mission comprises two satellites (2A and 2B) that offer global coverage from 56°S to 84°N. The S-2 level 1C product [49] was downloaded from the United States Geological Survey (USGS) Earth Explorer platform. All the data were atmospherically corrected in QGIS using the Semi-automatic Classification Plugin (SCP) and the Dark Object Subtraction (DOS) algorithm [50]. S-2 band 12 is resampled from 20 m to 10 m using the nearest neighbour algorithm in the SCP tool [51] and as suggested by other studies [52]. The cloudy S-2 data were masked using a cloud mask available with the S-2 Level-1C product as part of the quality information [53]. The method in this study requires two S-2 datasets. The first dataset consists of cloud-masked images of the two sites, available since the launch of the S-2 satellites in 2015. A total of 30 S-2 images for Rossmore are available, out of which 17 are cloud free; for Stradone, 25 images are available, out of which 23 are cloud free (Table S1). The second dataset consists of S-2 data, resampled onto 12 windows of 3 by 3 10 m pixels, with each window covering an area of 900 m2 and centred on each in situ sensor since the start of VSM monitoring; the centre of the central pixel in each window is therefore directly above its corresponding in situ sensor. This dataset is only used to establish relationships between OPTRAM nSSM estimates and in situ VSM for the validation of the model; it consists of 13 and 12 S-2 images from January 2021 to the end of 2022 for Rossmore and Stradone, respectively (Table S1).
Two fields in each of the two farm sites are each equipped with three in situ sensors (vertically aligned according to the manufacturer’s instructions), which were placed in representative of the soil types at the sites. The in situ VSM (m3/m3) sensor data are acquired at a depth of ~15 cm to avoid disturbing the high-intensity dairy farms. Four soil samples representative of the two sites were used to calibrate the sensors. The samples were saturated in a laboratory and allowed to dry at room temperature over several weeks during which VSM was measured using the gravimetric technique [8]. This allowed a calibration of sensor readings from saturated to residual VSM for each sample.

2.3. OPTRAM Basics

The OPTRAM method [54]) estimates nSSM from optical satellite data based upon the Kubelka–Munk radiative transfer theory and vegetation indices (VI) which are spectral imaging transformations of two or more satellite image bands. OPTRAM represents a linear relationship between normalised surface soil moisture, W over bare soil, and short wavelength infrared (SWIR) transformed reflectance, S T R :
W = θ θ r e s / θ s a t θ r e s = S T R S T R d r y / S T R w e t S T R d r y
S T R = 1 R S W I R 2 / 2 R S W I R
where 0 W 1 ,     θ   is the VSM at the surface (<0.2 cm),   θ r e s is the residual VSM, θ s a t is the saturated VSM, R S W I R is the reflectance at an SWIR wavelength, and   S T R d r y and S T R w e t   are the STRs in soils with θ r e s and θ s a t , respectively. Equation (1) is valid for vegetated soil if there is also a linear relationship between root zone VSM and vegetation volumetric water content [16]. This assumption is based on studies which suggest that SWIR reflectance is sensitive to vegetation water content (and leaf internal structure), and that STR reflectance is linearly correlated with vegetation water content. In this study, following [16], SWIR Band 12 was used to compute STR.
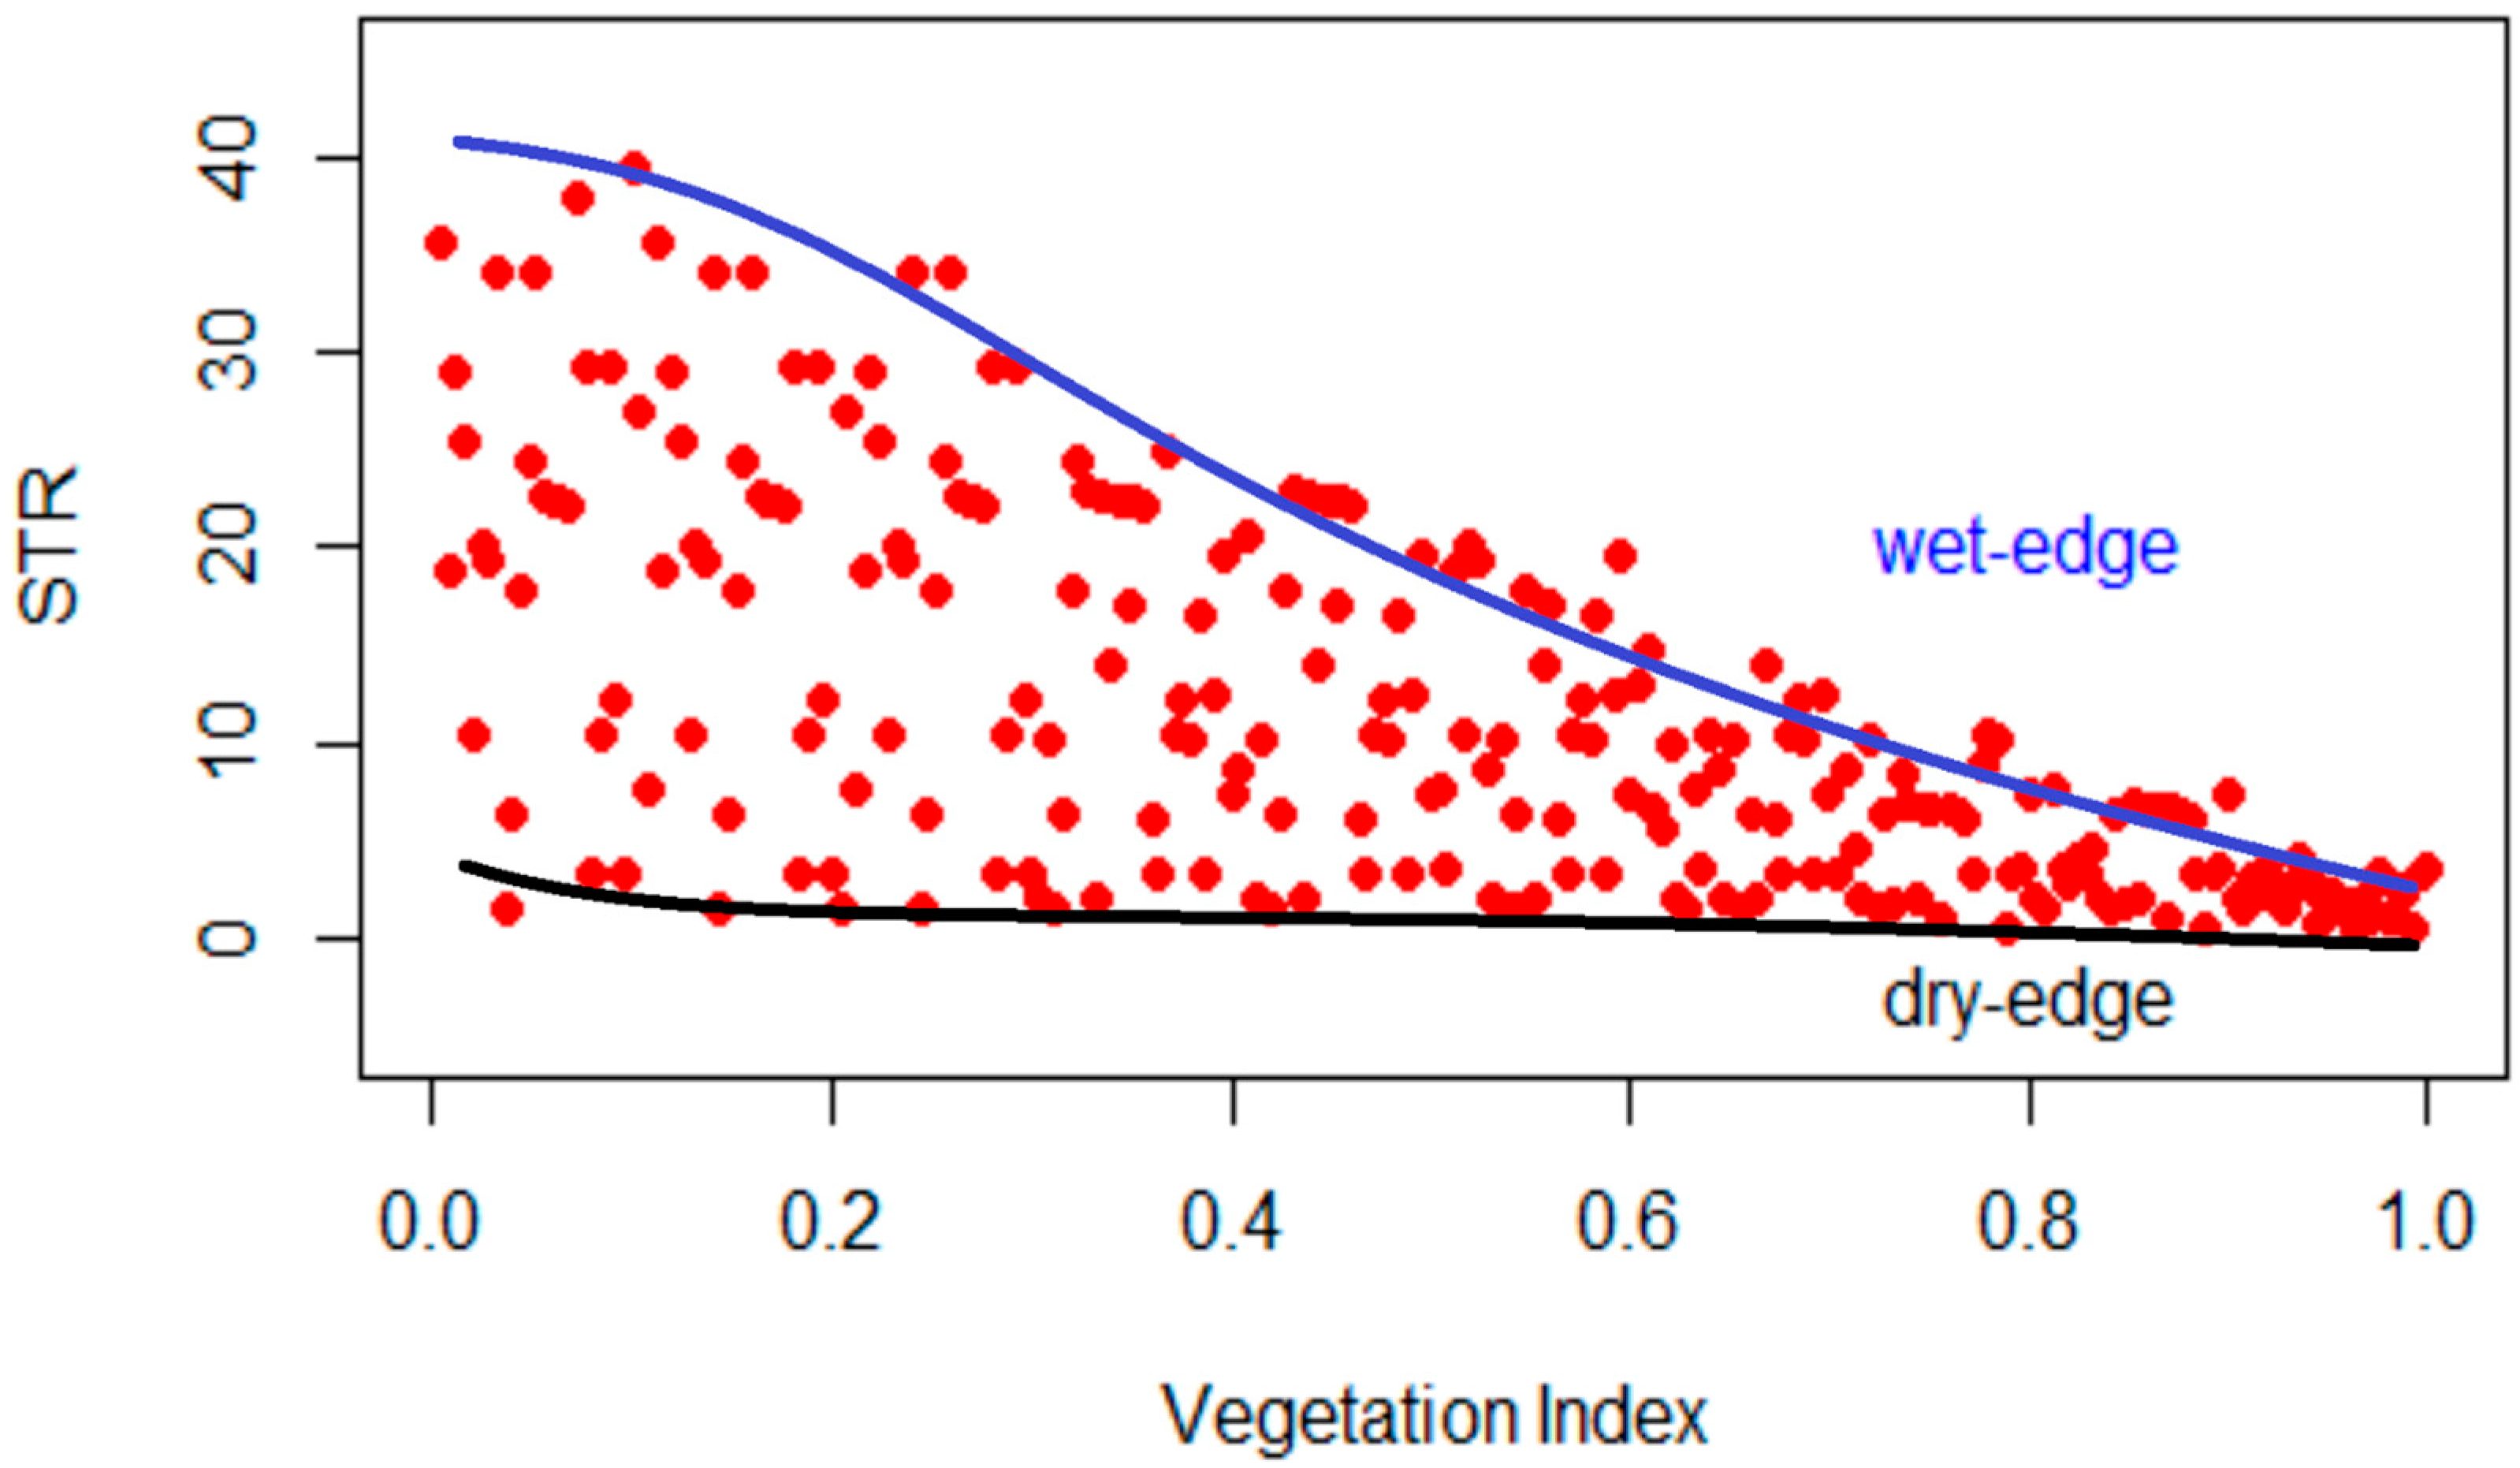
The water content of vegetation, and therefore vegetation spectral characteristics, is dependent on soil moisture status [55]. Such changes can be captured by a VI required in OPTRAM. If the VI does not change, Equation (1) assumes that a change in the STR is a linear function of nSSM. If the value of a VI changes due to a change in water content or fractional surface area of vegetation in a pixel, the values of S T R d r y and S T R w e t will change. Therefore, the estimation of nSSM over vegetated soil requires a close assessment of how time-varying rainfall, evapotranspiration and infiltration has different effects on the changes in the amplitude of the STR for changes in the VI and associated VSM. This is partly achieved in OPTRAM using a scatter plot in the STR-VI space based on many different hydro-meteorological conditions to estimate   S T R d r y and S T R w e t (Figure 2).
Optical scenes may include oversaturated pixels (e.g., due to standing surface water after heavy precipitation) above the wet edge which will increase the STR. As nSSM is only valid for partially and fully saturated soils ( 0 W 1 ) and VSM cannot increase beyond θ s a t , all pixels on and above the wet edge are assumed to be saturated W = 1 . The dry edge represents pixels with θ r e s . Equation (1) demonstrates that the nSSM for a pixel with an STR value is equivalent to the fractional distance between the two edges at the coincident VI. The geometry of the two edges changes with the choice of VI.

2.4. Relationships between VSM and nSSM

Linear correlations between a VI and its associated VSM from multiple in situ sensors within the root zone (<1 m) beneath a pixel can be optimised if the VSM has a time-delay after the VI acquisition date. [55] attribute this delay to the time required by plants to adjust their biological processes to match the surface conditions and water availability in the soil. Correlations between nSSM and VSM from sensors within the root zone used to investigate uncertainties in the satellite retrievals must therefore account for time delays between the surface signal and the sensor response. These could be days depending upon, e.g., vegetation and soil hydraulic conductivity. This study addresses this problem using a solution to a model based on a 1-dimensional Richards’ Equation, originally developed to retrieve root zone VSM from NASA’s AirMOSS mission [37]. This establishes the relationship between satellite-derived nSSM and in situ sensor VSM at depth. The solution is:
θ z = c 1 z + c 2 e x p z / h c M + c 3 1 P  
K = K s a t θ θ r e s θ s a t θ r e s P = K s a t S P  
e x p h P h c M = θ θ r e s θ s a t θ r e s  
where z is the depth; P   is related to the soil pore size distribution and is an empirical parameter that defines a relationship between saturated hydraulic conductivity, K s a t ,   and unsaturated conductivity, K ; h c M   is the effective capillary drive; c1, c2 and c3 are time-invariant constants; S is the effective saturation; and h is the pressure head. The solution is most accurate during soil drying, i.e., concurrent evapotranspiration and infiltration after a rainfall event. It represents a common scenario for acquiring optical satellite data above persistent cloud cover.
First, we estimate the VSM at the surface z ~ 0 from the nSSM, W :
θ = θ r e s + θ s a t θ r e s   W  
For VSM measured at a sensor at depth z S , Equation (6) can be written as:
θ z S = c 1 z S + c 2 e x p z S / h c M + c 3 1 P  
and at z = 0 :
θ =   c 2 + c 3 1 P  
Therefore,
θ z S = a 1 z S + a 2 e x p z S / h c M + a 3 1 P   θ  
θ z S = A z S θ r e s + θ s a t θ r e s   W = θ m i n + g   W  
where θ m i n is the intercept, g is the gradient and A z S is a positive scalar calibration constant to transform nSSM to VSM at the sensor. This establishes the relationship between satellite-derived nSSM and in situ sensor VSM at depth. In principle, if θ r e s and θ s a t are known,   A z S can be estimated using Equation (10) from a nSSM-VSM plot for multiple satellite estimates of nSSM and coincident VSM measurements under different hydro-meteorological conditions. In practice, this still requires some winnowing of data (Section 2.5) to guarantee that the VSM measurements are responding to infiltration at the S-2 acquisition date. In these scenarios, A z S > 1 , i.e., the VSM at the sensor depth z S is greater than the VSM at the surface at the time of the S-2 data acquisition. This implies that the soil reaches saturation at z S , when the nSSM W z S < 1 so that:
θ s a t = A z S θ r e s + θ s a t θ r e s   W z S  
which is only true when
W z S = θ s a t A z S   θ r e s / A z S θ s a t θ r e s  
For a value of nSSM such that W z S < W 1 , the soil reaches saturation at a depth   z s a t , where z S > z s a t 0 . The volumetric soil moisture at depths z s a t is constant θ s a t . The model is like Case B in ([37]; Figure 7). The approach is sufficient to predict VSM at a sensor from nSSM and requires no knowledge of P   or h c M .

2.5. Considerations for Implementing OPTRAM

2.5.1. Choice of Vegetation Index

Alongside the most popularly used Normalised Difference Vegetation Index (NDVI), we evaluated a suite of other VIs: Enhanced Vegetation Index (EVI), Modified Soil Adjusted Vegetation Index (MSAVI) and, since the S-2 satellite provides the only freely available optical dataset containing the red-edge band, Normalised Difference Red-Edge Index (NDREI). Their computation is summarised in Table S2. The aim was to determine which VI is least correlated with its concurrent and coincident STR to maximise the sensitivity of the soil moisture estimate from the STR in the presence of vegetation water content which influences the VI. The choice for optimum VI was quantified through Spearman’s and distance correlations between STR and VI, and the smoothness, shape, and practical range of the wet and dry edges.

2.5.2. Determination of Edge Curves and Calculation of nSSM

The original OPTRAM was developed with linear edge curves and recent studies have explored the use of non-linear edges. Some studies have shown that the VI-STR relationship with high vegetation cover may be non-linear [30,56] and that non-linear parametrization of OPTRAM leads to better accuracies in soil moisture estimates compared to linear parametrization [57]. After the choice for an appropriate VI, the STR-VI couplets were allocated to an appropriate bin with a width of 1% of the range in the VI and STR. We used a numerical method which sweeps over the STR bins and then across the VI bins in the scatter plot to guide our selection of the dry and wet edges. A double logistic function (Equation (14); [58]) was fitted to each empirically determined edge, defined as the curves below and above which 1% of the couplets are regarded as noise (e.g., cultural or over-saturated pixels beyond the wet edge). Each edge was fitted using ‘trial and error’ forward modelling with the 7 free parameters in the function:
S T R j = S T R m i n j + S T R m i d j S T R m i n j 1 + e x p a V I + b + S T R m a x j S T R m i d j 1 + e x p c V I + d
The free parameters in the double logistic function are flexible to approximate linear, exponential, or sigmoidal behaviour that is sufficiently complex to characterise the observed edge curves. The nSSM for each pixel was calculated as a linear distance between the dry and wet edges.

2.5.3. Land Cover Masks

Vegetation growth and root water uptake play an important role in soil moisture temporal dynamics at the field scale [59]. An application of OPTRAM at the field scale needs to focus on classes within a complex land cover, e.g., grassland, forests, and water bodies, to minimise soil moisture variations associated with distinct types of vegetation or stages of growth. Therefore, a mask was created for forests and water bodies to identify ‘exclusion zones’ (Figure 1). Other land cover classes were not considered since they represent less than 1% of the areas and do not influence the scatter between the VI and STR significantly.

2.5.4. Normalised SSM and Time-Delayed VSM Data

For validation of satellite-derived nSSM and in situ VSM, the nSSM was estimated at the central pixel over a window of 3 × 3 pixels, centred above each sensor, by fitting a second order polynomial over the window to minimise any local spatial heterogeneity at a scale of 10 m. This becomes the variable W   (Equation (10)). A coincident VSM can be chosen if the time series of daily sensor readings for δ t   ( 0 δ t 5 ) days after the date of the S-2 acquisition shows a monotonic decrease in VSM implying consistent drying conditions which are the most suitable for the model. The VSM, θ z S (Equation (10)), is a weighted average of any two consecutive daily VSM observations delayed by δ t   days to capture infiltration times from the surface to the sensor. The weights on the two VSM values represent the proportion of the day contributing to the weighted average.
The time-delay, δ t , and calibration constant, A z S ,   for each field can then be estimated from a linear regression of θ z S   v s . W   for the three sensors at depth z S by iteratively adjusting their values so that θ m i n = θ r e s when W = 0 , and θ m a x = θ s a t at W z S ; this is the nSSM which results in saturation at the sensor depth (Equation (12)). The final values are those which minimise the Root Mean Square Error (RMSE), maximise the coefficient of determination ( R 2 ) and are consistent with Equations (9) and (10) and laboratory measurements of VSM from the soil samples.

2.6. Temporal Stability (TS) Metrics

Temporal stability is traditionally used in hydrology [2]. It is based on a statistical approach to analyse any time-varying dataset. This study used TS equations to analyse the nSSM dataset. TS is a result of complex interactions among local (<30 m) and nonlocal weather, soil properties, vegetation, surface topography, sub-surface hydrology and agricultural practices [2].The grassland sites have minimal topographic variations, so the prima facie assumption is that TS is primarily controlled by time-invariant soil properties. The Mean Relative Difference (MRD) and the Standard Deviation Relative Difference (SDRD) are the most popular metrics to evaluate the TS of soil [40]:
R D i j = W i j W j / W j  
M R D i = ( 1 / J ) j = 1 j = J R D i j
S D R D i = 1 / J 1   j = 1 j = J ( R D i j M R D i ) 2    
where   R D i j is the relative difference between the nSSM, W , at pixel i ,   satellite pass j   and J is the number of passes. We modified these equations to obtain the Median Relative Difference Ŵ i and Median Absolute Deviation Relative Difference σ i .

3. Results

3.1. Satellite and VSM Data

The nSSM interpolated onto the centres of the central pixels in each of the 3 × 3 windows (Section 2.5.4) surrounding each sensor showed minor differences (~0.01) from nSSM values at each pixel in the corresponding window. This indicates that (1) interpolation of the 10–20 m optical data onto a 10 m grid does not introduce significant uncertainties, and (2) surface moisture conditions are homogeneous over 30 m scales. For the validation exercise only, the nSSM value was calculated for the centre of the central pixel and is directly located above the in situ VSM measurement.
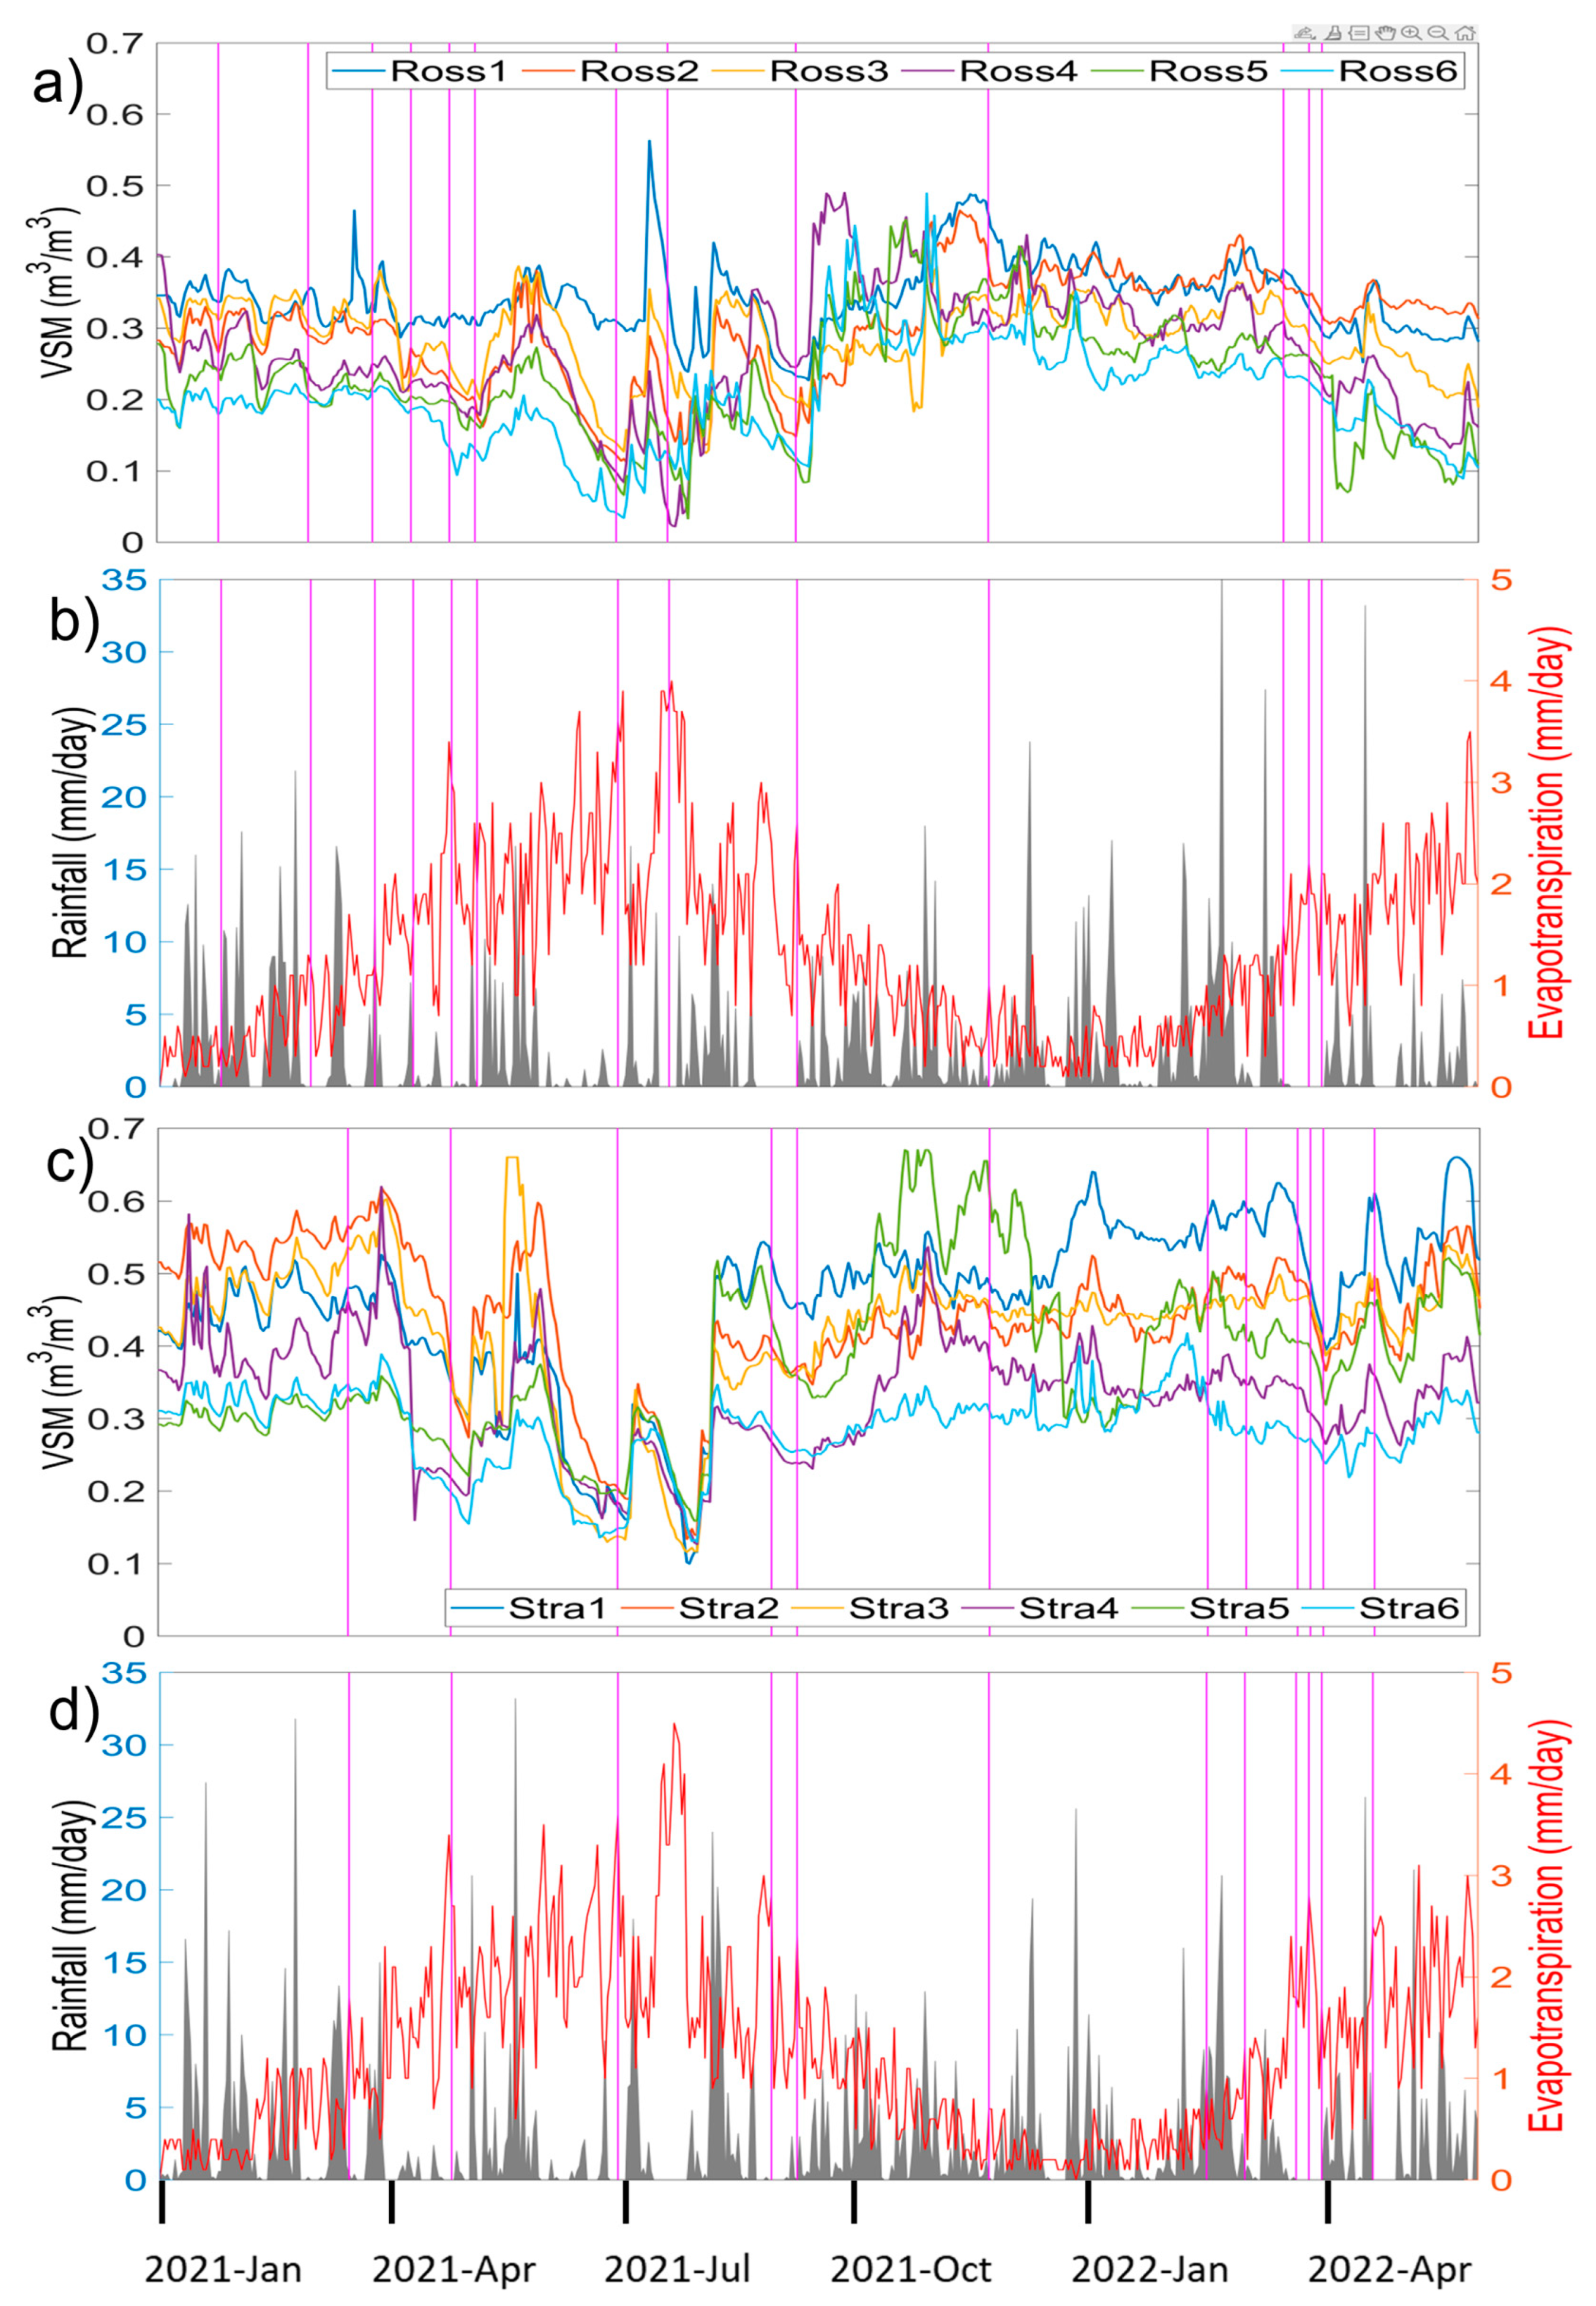
The laboratory calibrations (Table 1) indicate that the soils have higher than average values for saturated VSM (e.g., [37]; Table 1), consistent with the characteristics of poorly drained soils which dominate these sites. The hydro-meteorological time series (Figure 3) showed that the VSM ranged from 0.03 to 0.49 m3/m3 for Rossmore and 0.10 to 0.67 m3/m3 for Stradone. Although the normalised linear correlations for the six sensors at both sites were >0.96, some sensors had significantly different amplitudes from the other sensors in the same field. The differences (≲0.2 m3/m3) in concurrent VSM values are explained by heterogeneity in soil hydraulic properties and a possible systematic difference between the sensor used for laboratory calibration and the sensor in the field.

3.2. Choice of Vegetation Index

The results (Table 2) of the pair-wise correlations between STR and VIs show that the STR-EVI Spearman’s coefficients for Rossmore and Stradone were consistently negative and had lower values compared to the MSAVI and NDREI. STR was negatively correlated with NDVI and NDREI at Stradone and positively at Rossmore. The difference in scatter plots between the two sites is responsible for the change in sign in the Spearman’s coefficients (Section 4.1). The average STR-EVI distance correlation coefficient from the two sites was consistently at the low end.

3.3. Fitting of Edge Curves

The STR-EVI scatter plots (Figure 4) for both sites show that the edges are non-linear. The double logistic function defined the wet and the dry edges well. For both sites, a bulge in the scatter was seen around an EVI of 0.7 and STR of 20 and 15 for Rossmore and Stradone (Figure 4a,c), respectively, indicating the effect of water bodies and forests. After masking these land cover classes, the bulges in the EVI-STR scatter plots were removed (Figure 4b,d).
The STR-VI scatter plots for the other VIs (Figure 5) demonstrated complicated behaviour at the wet edges for NDVI and NDREI; it is difficult to meaningfully fit edge curves. The STR-MSAVI scatter plots are comparable to the STR-EVI scatter plots, as expected from the correlations in Table 2. We noted that the maximum values of MSAVI and EVI were ~0.85 and ~1.0, respectively. The low STR-EVI correlations, the smoothness, shape, and full range of the edge curves for the EVI scatter plots led us to choose EVI as the preferred VI for further analyses.

3.4. Relationships between Satellite and In Situ Sensor Soil Moisture

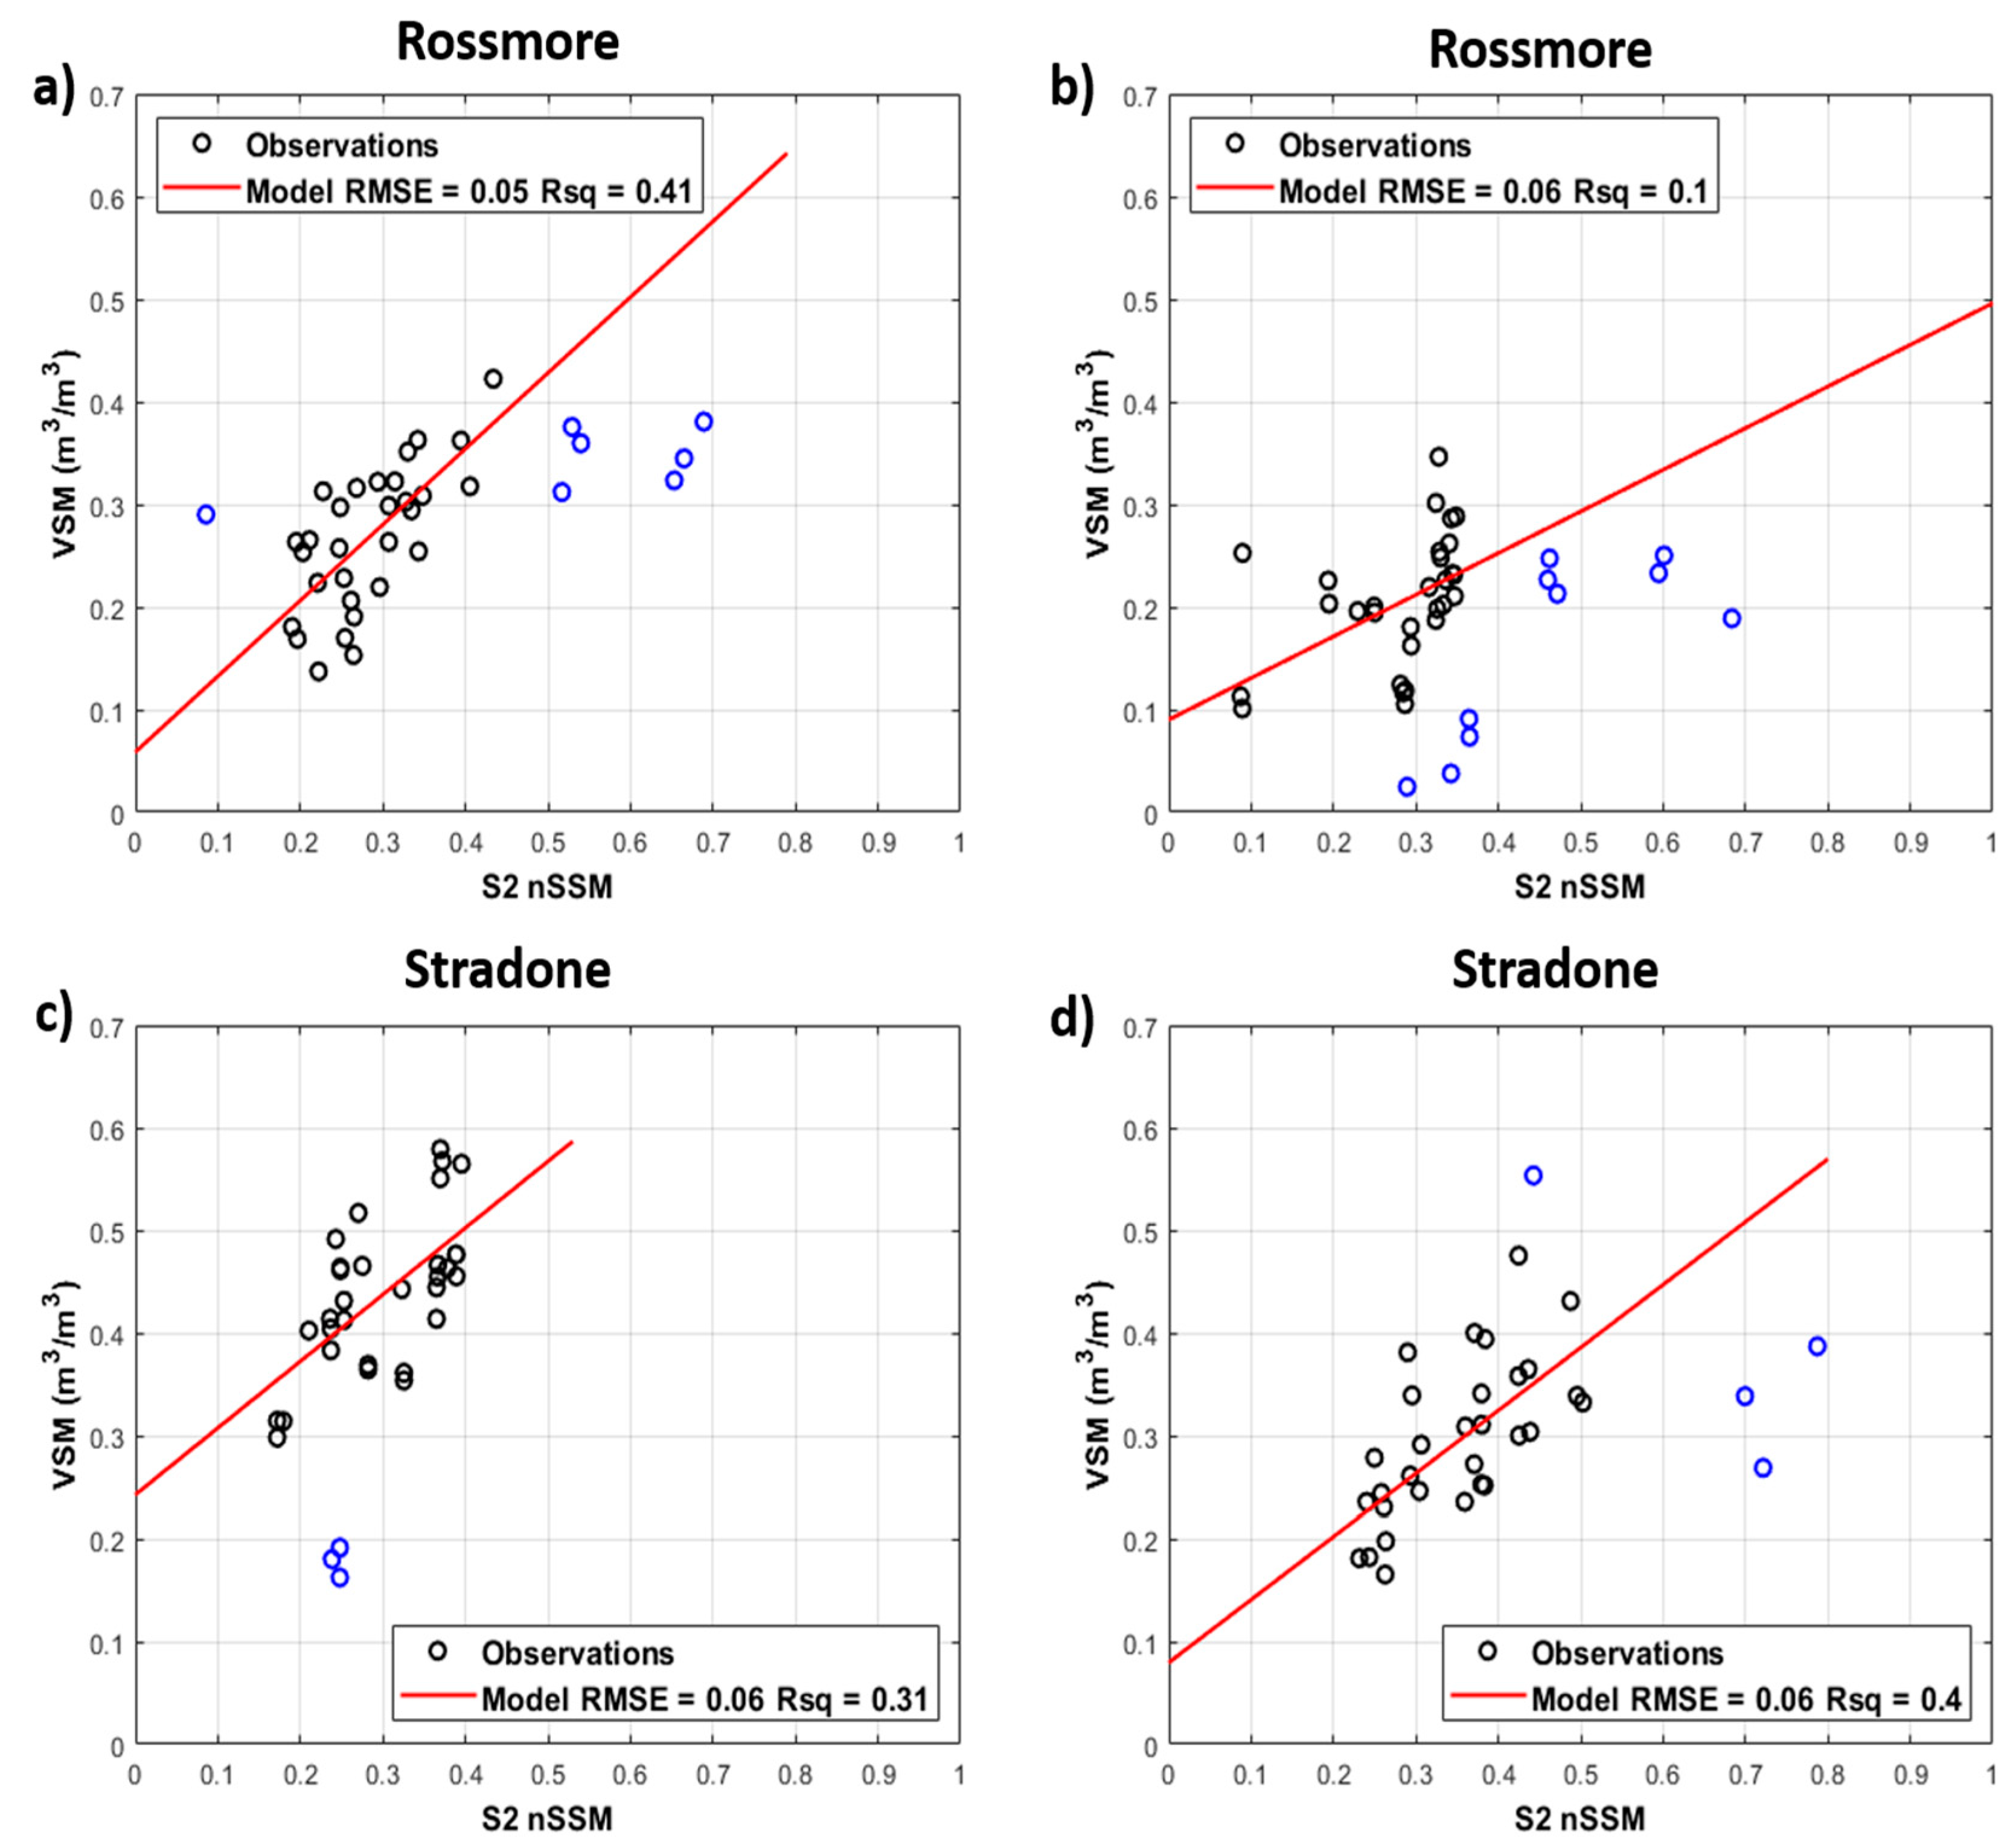
Regressions between VSM and normalised SSM after choosing an A z S   consistent with Equation (6) and the laboratory measurements of θ r e s and θ s a t were used to make a quantitative judgement on uncertainties in the relationship between S-2 estimates and in situ VSM measurements. The results (Figure 6) suggest that a linear transformation of nSSM to VSM is associated with RMSE uncertainties of ~0.06 m3/m3 for regressions limited to nSSM < 0.5. Without the introduction of time lags, the RMSE uncertainties were ~0.1 m3/m3. The best fit line started at the residual VSM and finished at the saturated VSM determined from the laboratory measurements of the soil sample in each of the four fields. The calibration constants were 1.0   A z S < 1.65 .

3.5. Maps of nSSM

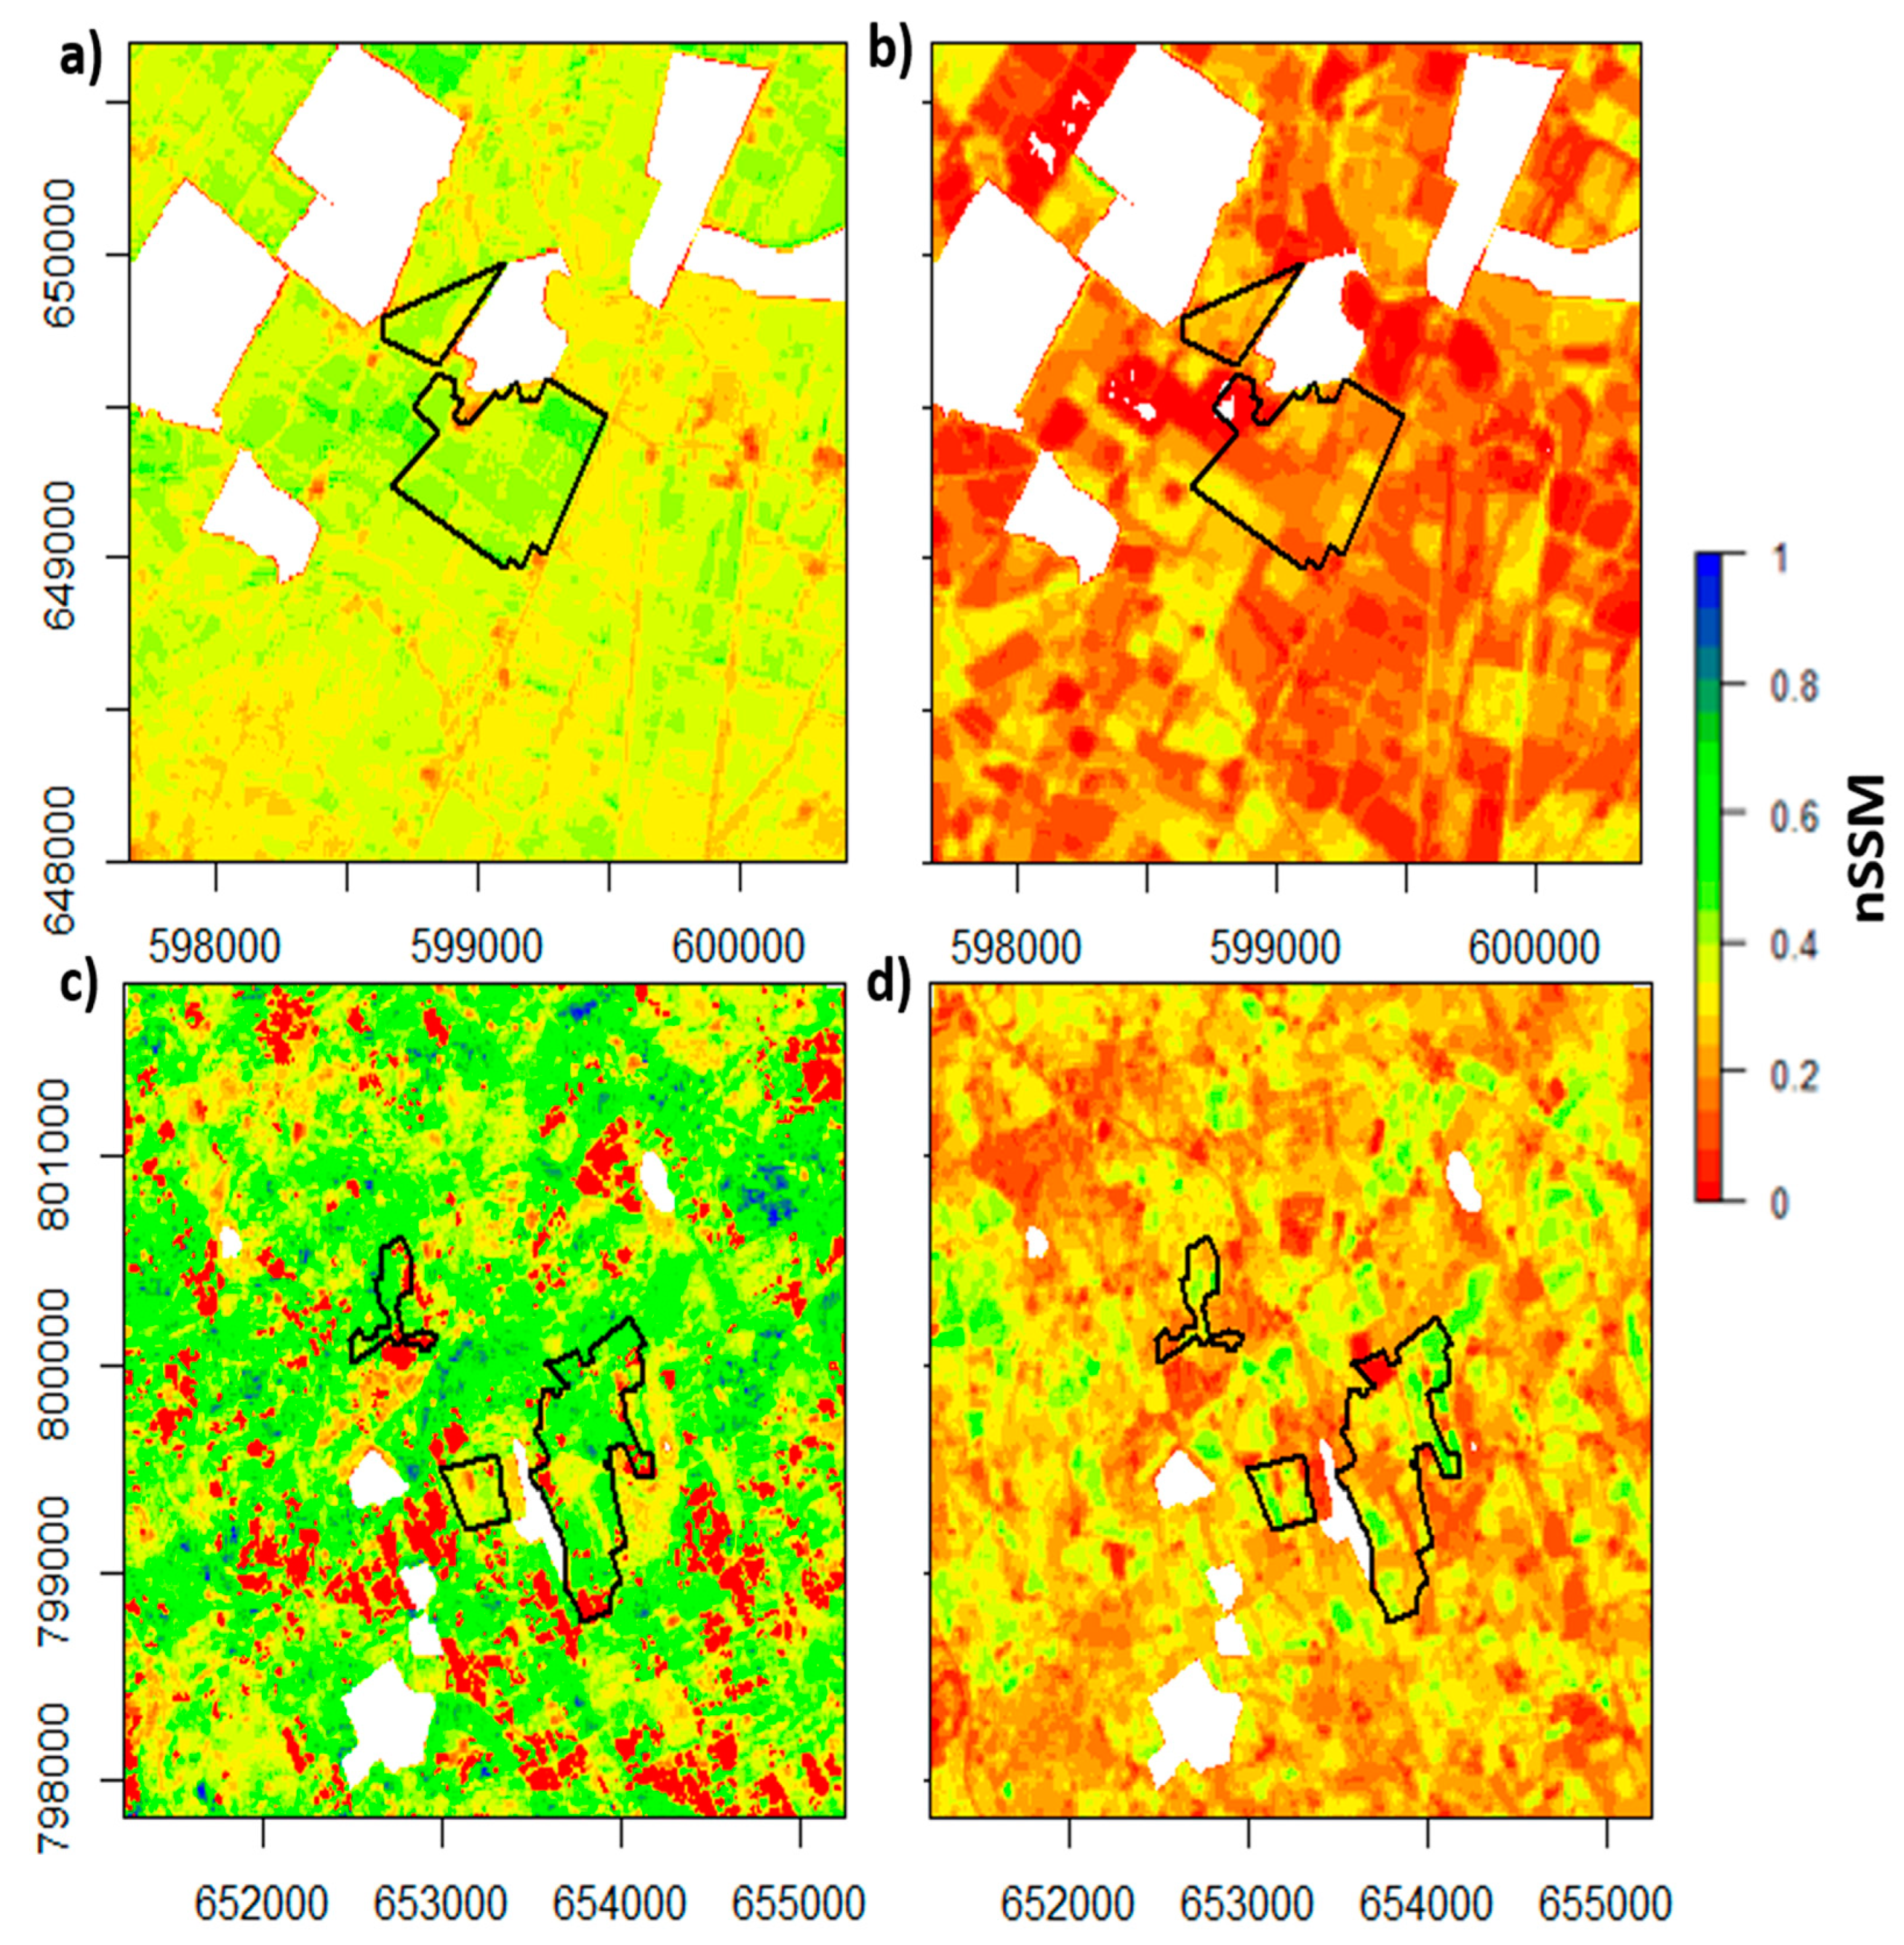
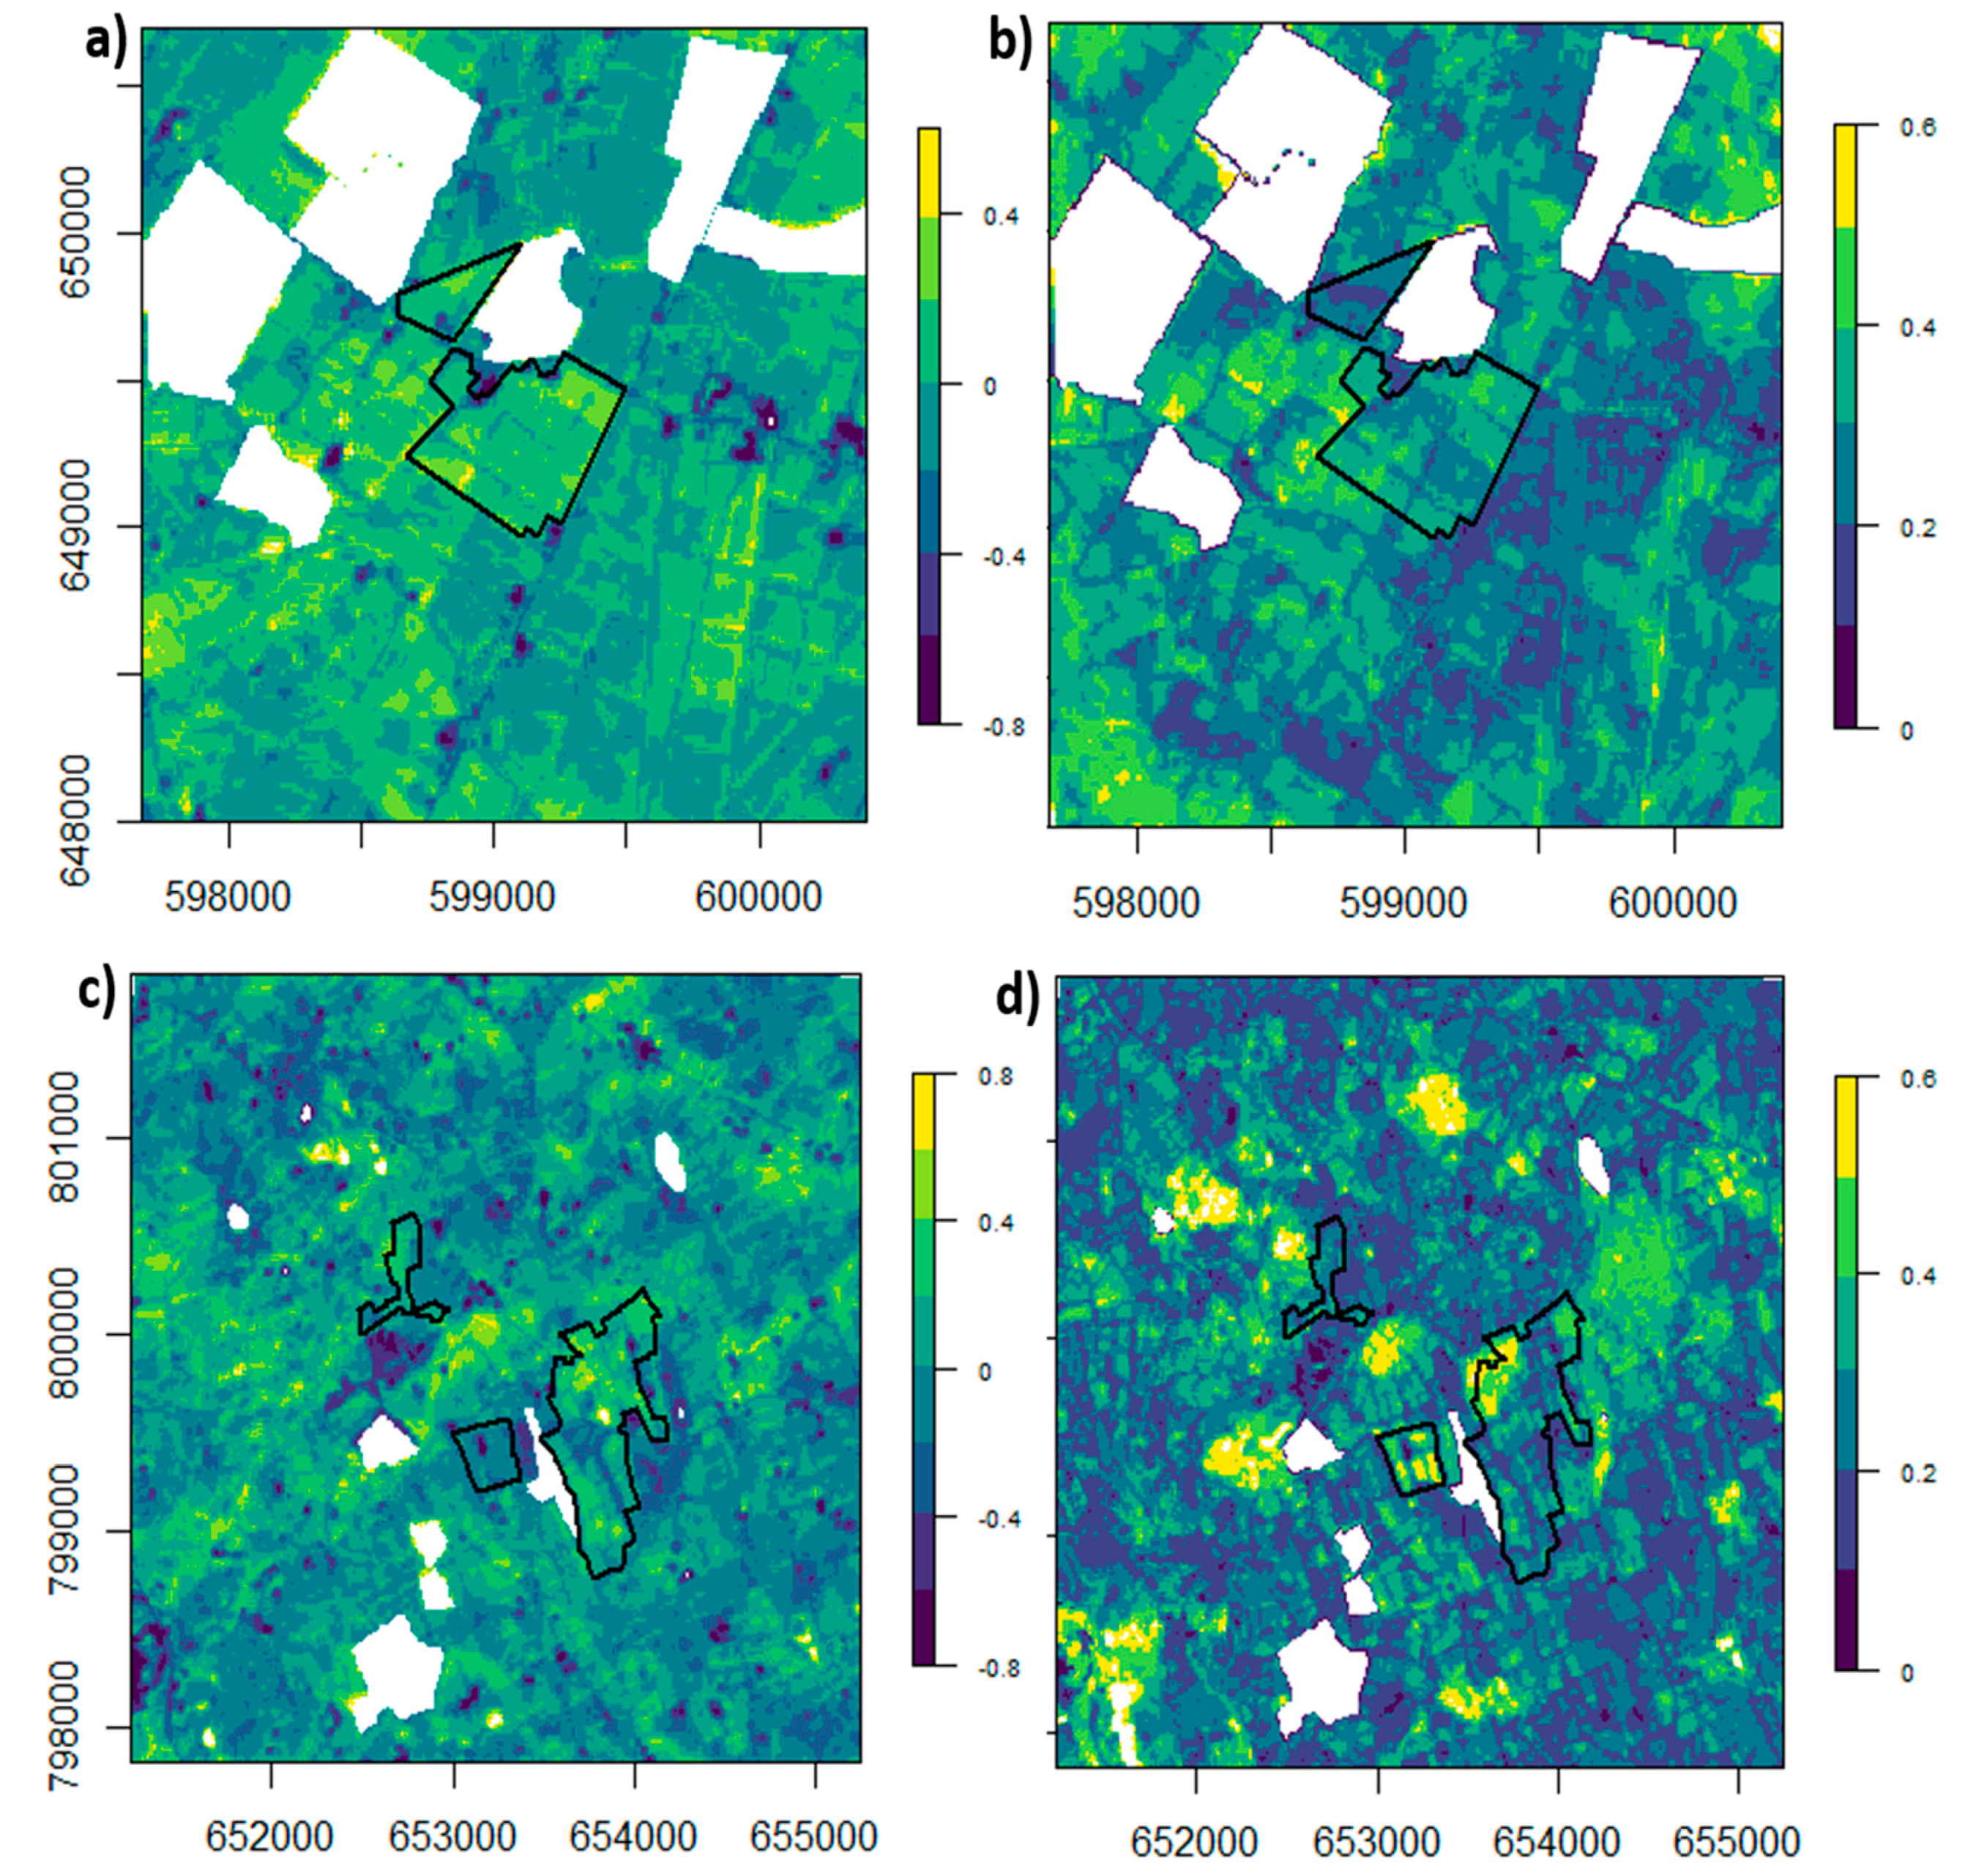
Figure 7 shows examples of nSSM values derived from the STR-EVI scatter plots with land cover masks after events of high and low net water flux (NWF; the difference between cumulative infiltration and evapotranspiration) over 5 days prior to and including the day of the S-2 pass. The maps show the overall differences in nSSM and a spatial variability in nSSM that was correlated strongly with high and low NWF conditions within farm areas.

3.6. Temporal Stability of nSSM

The maps of Median Relative Difference, Ŵ , and Median Absolute Deviation Relative Difference, σ , showed spatial variations (Figure 8) that were less noisy than the maps of MRD and SDRD. Linear features (roads and field boundaries) and buildings could be identified, and variations within fields were visible.
The distinctive patterns in the TS behaviour can be better appreciated by focusing on the farm sites with Ŵ and 𝜎, shown with Great Soil Groups (GSGs) based on the extrapolation of data from auger points and soil pits, and local expert knowledge (Figure 9). In Rossmore, features 2 (Figure 9a) and 4 (Figure 9b) represent areas of high TS ( Ŵ ~ 0 and σ ~ 0 ), associated with roads and a sub-surface artificial drain, respectively. Feature 1 (Figure 9b) with σ ~ 0.2   represents one of the driest areas on this farm over moderately drained soil, while feature 3 (Figure 9b) with σ ~ 0.5   represents an area of low TS over poorly drained soil. In Stradone (Figure 9d), feature 1 with Ŵ ~ 0.1 was associated with a dry area on this farm, feature 2 with Ŵ ~ 0.7 was associated with a building, feature 4 with Ŵ > 1 was associated with a wet area around small tree patches which were not excluded by masking, and feature 5 with Ŵ ~ 0 was associated with sparse vegetation (scrub) and/or bare soil. Feature 3 (Figure 9e) with σ ~ 0.5   is in an area of low TS over poorly drained soil. In both sites, individual fields could be identified from Ŵ and σ , and variations in TS could be observed within the presumed Great Soil Groups.
Features or areas that are moderately- to well-drained were associated with a high TS of surface moisture whereas poorly drained areas had a low TS, although there is insufficient evidence to rigorously quantify these associations.

4. Discussion

4.1. Edge Curves and Vegetation Index

The choice of the most appropriate VI for our study sites, EVI, was based on correlation analyses between STR and the selected VIs (Table 2) and the simplicity of the shape of the edge curves over the largest range of the VI (Figure 4).
If the edge curves are approximately linear, a non-zero Spearman’s or distance correlation would result from a non-zero algebraic sum of the (signed) slopes of the two edge curves, e.g., if the wet edge has a negative slope whose magnitude is greater than the positive slope of the dry edge, the STR is negatively correlated with the VI in proportion to the difference. Electromagnetic radiative transfer theory requires a non-zero correlation between STR and a VI due to interactions with a vegetated canopy over soil. The reflectance from soil increases monotonically with wavelengths from ~500–900 nm (the range encompassing the VIs considered here), plateaus, dips and then peaks at ~2200 nm [60] in the S-2 SWIR Band 12 used to compute the STR. Vegetation with increasing leaf water content is associated with increasing canopy reflectance, particularly at wavelengths > 700 nm, which increases the VI values [61] and decreases the SWIR band reflectance [62]; the canopy reflectance can even exceed that from the soil at a high VI [63]. The negative STR-EVI (and STR-MSAVI) Spearman’s correlation coefficients are therefore consistent with theory. As EVI increased (e.g., in the growing season), the reduced transmittance through the canopy lowered the sensitivity of the STR to soil conditions. The reduced STR difference between the wet and dry edges in an STR-EVI scatter plot is therefore also consistent with theory.
Other studies [64] have documented the limitations of NDVI (it plateaus over areas with high vegetation density, it is influenced by soil in sparsely vegetated areas and is affected by atmospheric noise) and the benefits of EVI, which was developed to mitigate against these shortcomings. Our study showed that there was no improvement using NDREI within OPTRAM. A comparison of Figure 4 and Figure 5 also demonstrates that there is little practical difference between the scatter plots of STR-EVI and STR-MSAVI at low values of vegetation cover, probably because grass is present at all stages of the agricultural/cattle grazing cycle for the study areas. The study also corroborates results from Sentinel-1 and S-2 imagery which indicate that EVI is optimum for the classification of Irish grassland [65].

4.2. Variable Vegetation Cover and Soil Moisture

The use of land cover masks to exclude water bodies and forests demonstrates that STR values associated with forests are higher than those over grassland with the same EVI (Figure 4). A previous study on peatlands [66] concluded that OPTRAM is insensitive to water table depth, especially for high (>50%) tree-cover areal density. This result also implies insensitivity to soil moisture in tree-covered areas and justifies the use of land masks to focus the analysis on grassland. Where data from small tree patches were included in the analysis (e.g., feature 4 in Figure 9d), they showed high values of soil moisture TS. This is consistent with observations which demonstrate that soil moisture below trees is higher than that below grassland in pasture landscapes because of reduced soil evaporation, greater soil infiltrability and groundwater recharge, and preferential water flow under trees [67].
In grassland with high vegetation cover at high values of EVI, there was stronger coupling of soil moisture to vegetation water content; in these conditions, it was more accurate to categorise ‘normalised surface soil moisture’ estimated from OPTRAM as ‘normalised surface moisture’.

4.3. Time-Delayed VSM and nSSM

Previous studies have identified the problem of deriving soil moisture at depth from (near-) surface remote sensing data [25,68,69]. At present, there are limitations in our understanding of water fluxes in near-surface, variably saturated, porous soil. These are due to complex interactions among wetting and drying which can create large transient downward and upward water fluxes, respectively [70,71], bioturbation and water uptake by plant roots [55]) and time-varying pore structure dynamics of, e.g., soil bulk density, pore size distribution and connectivity [72]. In agricultural regions, tillage, compaction due to animal and vehicle traffic, freeze/thaw events, periods of bare soil, etc., are common [73] and can exacerbate changes in soil structure dynamics. The theory under-pinning numerical models for relationships between soil moisture in the upper few cm and the deeper root zone is lacking and while classical approaches (e.g., Richards’ Equation) can deal with variable soil hydraulic parameters, they are limited when dealing with root water [74],an important mechanism for controlling VSM in the top 15 cm and deeper. This study demonstrated that there is a (weak) statistical correlation between nSSM satellite retrievals with in situ VSM measurements at a depth of 15 cm. It can provide reasonably accurate estimates of the time lags introduced to account for vertical flow of water between the surface and the in situ sensor. In general, time lags may be considerable, e.g., 15 to 20 days at depths of 20 cm to 100 cm, respectively [68], or 5–10 days depending on chlorophyll content, growth rate and previous weather conditions [55]. In our study with sensors at a depth of 15 cm, the optimal choice of time lags was ~2–3 days and ~3–4 days for the fields in Rossmore and Stradone, respectively. These lags correspond to an effective unsaturated hydraulic conductivity of ~4–7 cm/day. The resulting uncertainties in the correlations between nSSM and VSM are comparable with those from the agriculture study of [35] and regional studies in the United States [32] and China [33]. The maximum reliable value of nSSM in our dataset to establish the nSSM–VSM relationships was ~0.5 because of the unavailability of S-2 data due to persistent cloud cover during and after heavy rainfall events when the soil approaches saturation. This is a source of bias in the linear regressions which can only be remedied by additional data. The permanent wilting point and field capacity are also critical reference points for soil moisture, but we have no data on these variables.

4.4. Satellite-Derived Surface Moisture TS for Land-Use Management

Whilst most land-use managers would probably prefer to work with temporal stability of volumetric soil moisture, this is not practical for high spatial resolution temporal stability analysis over large areas. VSM is the time-varying volumetric soil moisture that exists at a point in the soil. Satellite-derived VSM, predicted using correlations in Figure 6, are estimates of VSM at specific times and at specific locations/pixels of the in situ sensors. A map of predicted VSM for an area would have the same pattern of colours as the map of nSSM if (a) there is a perfect correlation, and (b) the residual and saturated VSM is constant over the whole area; the only difference would be in the values allocated to the colours in the colour bar. In OPTRAM, residual and saturated VSM are assumed to have the same value in every pixel with the same VI because vegetation is a major contributor to soil moisture in the top few cm. The OPTRAM’s use of nSSM is attractive because it is based only on satellite data and its assumptions are transparent. The predicted VSM contains soil hydraulic parameters of residual and saturated VSM which are only appropriate for the limited number of pixels that contain the observed in situ VSM used in the validation. It is practically not feasible to create a map of VSM from nSSM without residual and saturated VSM observations at every pixel. Without these observations, spatial variations in residual and saturated VSM due to soil texture variations will not be captured over a broad study area. Any subsequent analysis of temporal stability based on the predicted VSM will be corrupted by introducing noise associated with spatial variations in hydraulic and soil texture properties over the area.
This study therefore used satellite-based normalized surface soil moisture temporal stability. It focused on areas of moderately- to poorly-drained soil within a pastoral system where surface moisture is closely linked to soil drainage and grass productivity [48]. The deployment of livestock and machinery can be severely compromised in poorly draining soil (e.g., associated with ~50% of Irish farms) that can be saturated for prolonged periods of the year, resulting in economic impacts on production. Forecasts of the most likely areas with saturated soils within a farm can support management strategies to locate artificial drainage, reduce the risk of soil compaction from grazing cattle [75] and minimise parasite infection of cattle [76].
We suggest that the dominant factor leading to the Ŵ patterns (Figure 9) is the near-surface soil texture, which controls soil hydraulic properties and the spatial distribution of soil moisture, particularly in wet conditions [77]. Terrain variations, which could drive sub-surface water flow are minimal, and time-varying net water flux patterns over two years are both unlikely to influence Ŵ over these km-scale areas. A combination of seasonal changes, weather and time-varying management intervention of grass production is probably responsible for σ patterns.
The meteorological data (Figure 3) demonstrate that cumulative rainfall is higher in winter, and evapotranspiration peaks around the end of June in mid-summer and is minimum around the end of December in mid-winter; the mid-summer peak is inversely correlated with VSM at depth. Seasonal variation in nSSM probably follows this pattern, especially as the evapotranspiration is most active in the top few cm. Without claiming that these are representative of long-term (>10 years) seasonal variations, they are probably the main causes of seasonal changes in net water flux, illustrated in Figure 7, e.g., by high net water flux at Rossmore in winter (1 March 2020) and low net water flux in summer (30 June 2018). The temporal stability maps (Figure 8) are based on 30 and 25 S-2 passes, respectively, over Rossmore and Stradone. Table S1 shows that there are 19 S-2 passes in the 2 months either side of mid-winter and 14 S-2 passes in the 2 months either side of mid-summer. This is not substantial, but it is probable that there are unquantifiable biases in temporal stability statistics due to the limited period over which the data have been acquired.
More generally, surface moisture TS derived from S-2 optical data has implications for land use scenarios which require information on local areas that are significantly drier or wetter than the surroundings. These include indications for the onset of fires, drought, and flood risks, modelling hydrological processes, managing water resources, agricultural plant production and productivity, and sustaining ecosystem services [2].
TS analyses at sub-field level have mainly been confined to ground-based techniques [41,78]. Whilst other studies have used satellite radar to estimate soil moisture TS, mostly at coarser spatial scales [79,80,81,82], we have demonstrated that surface moisture TS derived from S-2 optical data can identify distinct natural areas at 10 m spatial scale. We note however that its efficacy at broader spatial scales (~500 m) is degraded due to an increase in vegetation mixtures with different water contents, and the reduction of variance in the data [83].The complexity of soil moisture TS results in agricultural fields over many scales and environmental conditions is well-summarised in [41].
The approach in this paper may have implications as global grassland systems are monitored for irrigation design and land use intensity [84,85]. It is relevant for rewetting efforts in the European Union [86] where member states are committed to restoring 20% of degraded ecosystems, including grassland and drained peatlands under agricultural use, after centuries of wetland loss due to artificial drainage [87]. Soil moisture information at ~10 m scale can also help target the re-wetting of peatlands for carbon sequestration [66,88,89] which require assessments of soil moisture and drainage status prior to, during and after re-wetting efforts.

5. Conclusions

The paper demonstrated the potential of Sentinel-2 satellite optical data to provide meaningful retrievals of normalised surface soil moisture at a 10 m resolution in a region with persistent cloud cover. The study was conducted on moderately to poorly drained soil within a pastoral system where soil moisture is linked to soil drainage. The data were analysed using OPTRAM but required a re-assessment of the model to suit the wet conditions associated with heterogeneous land cover overlying soil with low hydraulic conductivity. The modification and validation of OPTRAM, and interpretation of the results are summarised below.
(1)
An exploration of four vegetation indices used in scatter plots of STR-VI identified EVI as the index which provided upper and lower boundaries (wet and dry edges, respectively) best suited to estimate normalised surface soil moisture. The wet and dry edges in the STR-VI space were clearly non-linear and could be characterised, for example, using a double logistic function.
(2)
The introduction of a time lag for the responses of in situ volumetric soil moisture sensors improved correlations with the normalised soil moisture by a factor of ~2 but only if S-2 data were used at the start of a dry-down period. The time lag was estimated from a semi-empirical solution to the Richards’ Equation and measurements of residual and saturated soil moisture from field soil samples. The results are comparable with other validation studies despite the sparse sensor networks in this study.
(3)
Retrievals of OPTRAM normalised surface soil moisture are most suited to temporal stability analyses, given the absence of regular time series of satellite optical data in cloudy regions.
(4)
An interpretation of the surface soil moisture temporal stability, where local topographic controls on subsurface-water flow are negligible and the vegetation type is uniform, suggest that local areas are systematically wetter or dryer than their surroundings. This is associated with local drainage, hydraulic conductivity and soil texture.
These techniques are useful for any grassland sites in temporal climates and may be extended to other applications for agricultural and land-use management, including the identification of areas at risk from extreme natural events (drought, flooding), soil compaction, parasite infection associated with ruminant grazing, land rewetting for carbon sequestration and input into crop growth models.

Supplementary Materials

The following supporting information can be downloaded at: https://www.mdpi.com/article/10.3390/rs16020220/s1.

Author Contributions

Data curation, R.B. and A.S.; Formal analysis, R.B.; Funding acquisition, P.T.; Investigation, R.B. and E.D.; Methodology, C.B.; Project administration, E.D. and P.T.; Software, C.B.; Supervision, E.D. and P.T.; Validation, A.S.; Visualization, R.B.; Writing—original draft, R.B.; Writing—review and editing, E.D., C.B., A.S. and P.T. All authors have read and agreed to the published version of the manuscript.

Funding

This research was funded by Science Foundation Ireland (SFI), the Vista Milk SFI Research Centre and the Department of Agriculture, Food and Marine on behalf of the Government of Ireland under Grant Number 16/RC/3835.

Data Availability Statement

The Sentinel-2 data used in this study are available from the USGS EarthExplorer https://earthexplorer.usgs.gov/. The in situ digital data may be available upon request to P.T. subject to restrictions.

Acknowledgments

The authors thank the farmers who provided land access, time, and resources for the study.

Conflicts of Interest

The authors declare no conflict of interest.

References

  1. Global Climate Observing System, (GCOS). Available online: https://gcos.wmo.int/en/essential-climate-variables/soil-moisture (accessed on 20 October 2022).
  2. Vereecken, H.; Huisman, J.A.; Pachepsky, Y.; Montzka, C.; van der Kruk, J.; Bogena, H.; Weihermüller, L.; Herbst, M.; Martinez, G.; Vanderborght, J. On the Spatio-Temporal Dynamics of Soil Moisture at the Field Scale. J. Hydrol. 2014, 516, 76–96. [Google Scholar] [CrossRef]
  3. Berg, A.; Sheffield, J. Climate Change and Drought: The Soil Moisture Perspective. Curr. Clim. Chang. Reports 2018, 4, 180–191. [Google Scholar] [CrossRef]
  4. Seneviratne, S.I.; Corti, T.; Davin, E.L.; Hirschi, M.; Jaeger, E.B.; Lehner, I.; Orlowsky, B.; Teuling, A.J. Investigating Soil Moisture-Climate Interactions in a Changing Climate: A Review. Earth-Science Rev. 2010, 99, 125–161. [Google Scholar] [CrossRef]
  5. Mimeau, L.; Tramblay, Y.; Brocca, L.; Massari, C.; Camici, S.; Finaud-Guyot, P. Modeling the Response of Soil Moisture to Climate Variability in the Mediterranean Region. Hydrol. Earth Syst. Sci. 2021, 25, 653–669. [Google Scholar] [CrossRef]
  6. Krueger, E.S.; Ochsner, T.E.; Levi, M.R.; Basara, J.B.; Snitker, G.J.; Wyatt, B.M. Grassland Productivity Estimates Informed by Soil Moisture Measurements: Statistical and Mechanistic Approaches. Agron. J. 2021, 113, 3498–3517. [Google Scholar] [CrossRef]
  7. Tuohy, P.; Fenton, O.; Holden, N.M.; Humphreys, J. The Effects of Treading by Two Breeds of Dairy Cow with Different Live Weights on Soil Physical Properties, Poaching Damage and Herbage Production on a Poorly Drained Clay-Loam Soil. J. Agric. Sci. 2015, 153, 1424–1436. [Google Scholar] [CrossRef] [PubMed]
  8. Robinson, D.A.; Campbell, C.S.; Hopmans, J.W.; Hornbuckle, B.K.; Jones, S.B.; Knight, R.; Ogden, F.; Selker, J.; Wendroth, O. Soil Moisture Measurement for Ecological and Hydrological Watershed-Scale Observatories: A Review. Vadose Zone J. 2008, 7, 358–389. [Google Scholar] [CrossRef]
  9. Babaeian, E.; Sadeghi, M.; Jones, S.B.; Montzka, C.; Vereecken, H.; Tuller, M. Ground, Proximal, and Satellite Remote Sensing of Soil Moisture. Rev. Geophys. 2019, 57, 530–616. [Google Scholar] [CrossRef]
  10. Sheng, W.; Zhou, R.; Sadeghi, M.; Babaeian, E.; Robinson, D.A.; Tuller, M.; Jones, S.B. A TDR Array Probe for Monitoring Near-Surface Soil Moisture Distribution. Vadose Zone J. 2017, 16, 1–8. [Google Scholar] [CrossRef]
  11. Petropoulos, G.P.; Griffiths, H.M.; Dorigo, W.; Xaver, A.; Gruber, A. Surface Soil Moisture Estimation: Significance, Controls, and Conventional Measurement Techniques. In Remote Sensing of Energy Fluxes and Soil Moisture Content; CRC Press: Boca Raton, FL, USA, 2013; pp. 29–48. ISBN 9781466505797. [Google Scholar]
  12. Robock, A.; Vinnikov, K.Y.; Srinivasan, G.; Entin, J.K.; Hollinger, S.E.; Speranskaya, N.A.; Liu, S.; Namkhai, A. The Global Soil Moisture Data Bank. Bull. Am. Meteorol. Soc. 2000, 81, 1281–1299. [Google Scholar] [CrossRef]
  13. Zhang, D.; Zhou, G. Estimation of Soil Moisture from Optical and Thermal Remote Sensing: A Review. Sensors 2016, 16, 1308. [Google Scholar] [CrossRef] [PubMed]
  14. Mohanty, B.P.; Cosh, M.H.; Lakshmi, V.; Montzka, C. Soil Moisture Remote Sensing: State-of-the-Science. Vadose Zone J. 2017, 16, 1–9. [Google Scholar] [CrossRef]
  15. Petropoulos, G.P.; Ireland, G.; Barrett, B. Surface Soil Moisture Retrievals from Remote Sensing: Current Status, Products & Future Trends. Phys. Chem. Earth 2015, 83–84, 36–56. [Google Scholar]
  16. Sadeghi, M.; Babaeian, E.; Tuller, M.; Jones, S.B. The Optical Trapezoid Model: A Novel Approach to Remote Sensing of Soil Moisture Applied to Sentinel-2 and Landsat-8 Observations. Remote Sens. Environ. 2017, 198, 52–68. [Google Scholar] [CrossRef]
  17. Shafian, S.; Maas, S.J. Index of Soil Moisture Using Raw Landsat Image Digital Count Data in Texas High Plains. Remote Sens. 2015, 7, 2352–2372. [Google Scholar] [CrossRef]
  18. Entekhabi, D.; Njoku, E.G.; O’Neill, P.E.; Kellogg, K.H.; Crow, W.T.; Edelstein, W.N.; Entin, J.K.; Goodman, S.D.; Jackson, T.J.; Johnson, J.; et al. The Soil Moisture Active Passive (SMAP) Mission. Proc. IEEE 2010, 98, 704–716. [Google Scholar] [CrossRef]
  19. Kerr, Y.H.; Waldteufel, P.; Wigneron, J.P.; Delwart, S.; Cabot, F.; Boutin, J.; Escorihuela, M.J.; Font, J.; Reul, N.; Gruhier, C.; et al. The SMOS L: New Tool for Monitoring Key Elements Ofthe Global Water Cycle. Proc. IEEE 2010, 98, 666–687. [Google Scholar] [CrossRef]
  20. Wagner, W.; Hahn, S.; Kidd, R.; Melzer, T.; Bartalis, Z.; Hasenauer, S.; Figa-Saldaña, J.; De Rosnay, P.; Jann, A.; Schneider, S.; et al. The ASCAT Soil Moisture Product: A Review of Its Specifications, Validation Results, and Emerging Applications. Meteorol. Z. 2013, 22, 5–33. [Google Scholar] [CrossRef]
  21. Bhogapurapu, N.; Dey, S.; Homayouni, S.; Bhattacharya, A.; Rao, Y.S. Field-Scale Soil Moisture Estimation Using Sentinel-1 GRD SAR Data. Adv. Sp. Res. 2022, 70, 3845–3858. [Google Scholar] [CrossRef]
  22. Singh, A.; Gaurav, K.; Meena, G.K.; Kumar, S. Estimation of Soil Moisture Applying Modified Dubois Model to Sentinel-1; A Regional Study from Central India. Remote Sens. 2020, 12, 2266. [Google Scholar] [CrossRef]
  23. Bauer-Marschallinger, B.; Freeman, V.; Cao, S.; Paulik, C.; Schaufler, S.; Stachl, T.; Modanesi, S.; Massari, C.; Ciabatta, L.; Brocca, L.; et al. Toward Global Soil Moisture Monitoring with Sentinel-1: Harnessing Assets and Overcoming Obstacles. IEEE Trans. Geosci. Remote Sens. 2019, 57, 520–539. [Google Scholar] [CrossRef]
  24. Das, N.N.; Entekhabi, D.; Dunbar, R.S.; Chaubell, M.J.; Colliander, A.; Yueh, S.; Jagdhuber, T.; Chen, F.; Crow, W.; O’Neill, P.E.; et al. The SMAP and Copernicus Sentinel 1A/B Microwave Active-Passive High Resolution Surface Soil Moisture Product. Remote Sens. Environ. 2019, 233, 111380. [Google Scholar] [CrossRef]
  25. Peng, J.; Albergel, C.; Balenzano, A.; Brocca, L.; Cartus, O.; Cosh, M.H.; Crow, W.T.; Dabrowska-Zielinska, K.; Dadson, S.; Davidson, M.W.J.; et al. A Roadmap for High-Resolution Satellite Soil Moisture Applications—Confronting Product Characteristics with User Requirements. Remote Sens. Environ. 2021, 252, 112162. [Google Scholar] [CrossRef]
  26. Dorigo, W.; Himmelbauer, I.; Aberer, D.; Schremmer, L.; Petrakovic, I.; Zappa, L.; Preimesberger, W.; Xaver, A.; Annor, F.; Ardö, J.; et al. The International Soil Moisture Network: Serving Earth System Science for over a Decade. Hydrol. Earth Syst. Sci. 2021, 25, 5749–5804. [Google Scholar] [CrossRef]
  27. Bogena, H.R.; Huisman, J.A.; Güntner, A.; Hübner, C.; Kusche, J.; Jonard, F.; Vey, S.; Vereecken, H. Emerging Methods for Noninvasive Sensing of Soil Moisture Dynamics from Field to Catchment Scale: A Review. Wiley Interdiscip. Rev. Water 2015, 2, 635–647. [Google Scholar] [CrossRef]
  28. Gruber, A.; De Lannoy, G.; Albergel, C.; Al-Yaari, A.; Brocca, L.; Calvet, J.C.; Colliander, A.; Cosh, M.; Crow, W.; Dorigo, W.; et al. Validation Practices for Satellite Soil Moisture Retrievals: What Are (the) Errors? Remote Sens. Environ. 2020, 244, 111806. [Google Scholar] [CrossRef]
  29. Cui, D.; Liang, S.; Wang, D. Observed and Projected Changes in Global Climate Zones Based on Köppen Climate Classification. Wiley Interdiscip. Rev. Clim. Chang. 2021, 12, e701. [Google Scholar] [CrossRef]
  30. Mananze, S.; Pôças, I. Agricultural Drought Monitoring Based on Soil Moisture Derived from the Optical Trapezoid Model in Mozambique. J. Appl. Remote Sens. 2019, 13, 024519. [Google Scholar] [CrossRef]
  31. Acharya, U.; Daigh, A.L.M.; Oduor, P.G. Soil Moisture Mapping with Moisture-Related Indices, OPTRAM, and an Integrated Random Forest-OPTRAM Algorithm from Landsat 8 Images. Remote Sens. 2022, 14, 3801. [Google Scholar] [CrossRef]
  32. Babaeian, E.; Sadeghi, M.; Franz, T.E.; Jones, S.; Tuller, M. Mapping Soil Moisture with the OPtical TRApezoid Model (OPTRAM) Based on Long-Term MODIS Observations. Remote Sens. Environ. 2018, 211, 425–440. [Google Scholar] [CrossRef]
  33. Chen, M.; Zhang, Y.; Yao, Y.; Lu, J.; Pu, X.; Hu, T.; Wang, P. Evaluation of the OPTRAM Model to Retrieve Soil Moisture in the Sanjiang Plain of Northeast China. Earth Sp. Sci. 2020, 7, e2020EA001108. [Google Scholar] [CrossRef]
  34. Sun, H.; Liu, H.; Ma, Y.; Xia, Q. Optical Remote Sensing Indexes of Soil Moisture: Evaluation and Improvement Based on Aircraft Experiment Observations. Remote Sens. 2021, 13, 4638. [Google Scholar] [CrossRef]
  35. Babaeian, E.; Sidike, P.; Newcomb, M.S.; Maimaitijiang, M.; White, S.A.; Demieville, J.; Ward, R.W.; Sadeghi, M.; LeBauer, D.S.; Jones, S.B.; et al. A New Optical Remote Sensing Technique for High-Resolution Mapping of Soil Moisture. Front. Big Data 2019, 2, 37. [Google Scholar] [CrossRef] [PubMed]
  36. Farthing, M.W.; Ogden, F.L. Numerical Solution of Richards’ Equation: A Review of Advances and Challenges. Soil Sci. Soc. Am. J. 2017, 81, 1257–1269. [Google Scholar] [CrossRef]
  37. Sadeghi, M.; Tabatabaeenejad, A.; Tuller, M.; Moghaddam, M.; Jones, S.B. Advancing NASA’s AirMOSS p-Band Radar Root Zone Soil Moisture Retrieval Algorithm via Incorporation of Richards’ Equation. Remote Sens. 2017, 9, 17. [Google Scholar] [CrossRef]
  38. Urraca, R.; Gracia-Amillo, A.M.; Koubli, E.; Huld, T.; Trentmann, J.; Riihelä, A.; Lindfors, A.V.; Palmer, D.; Gottschalg, R.; Antonanzas-Torres, F. Extensive Validation of CM SAF Surface Radiation Products over Europe. Remote Sens. Environ. 2017, 199, 171–186. [Google Scholar] [CrossRef] [PubMed]
  39. Vachaud, G.; Passerat De Silans, A.; Balabanis, P.; Vauclin, M. Temporal Stability of Spatially Measured Soil Water Probability Density Function. Soil Sci. Soc. Am. J. 1985, 49, 822–828. [Google Scholar] [CrossRef]
  40. Vanderlinden, K.; Vereecken, H.; Hardelauf, H.; Herbst, M.; Martínez, G.; Cosh, M.H.; Pachepsky, Y.A. Temporal Stability of Soil Water Contents: A Review of Data and Analyses. Vadose Zone J. 2012, 11, vzj2011.0178. [Google Scholar] [CrossRef]
  41. Fry, J.E.; Guber, A.K. Temporal Stability of Field-Scale Patterns in Soil Water Content across Topographically Diverse Agricultural Landscapes. J. Hydrol. 2020, 580, 124260. [Google Scholar] [CrossRef]
  42. Sollenberger, L.E.; Kohmann, M.M.; Dubeux, J.C.B.; Silveira, M.L. Grassland Management Affects Delivery of Regulating and Supporting Ecosystem Services. Crop Sci. 2019, 59, 441–459. [Google Scholar] [CrossRef]
  43. MetEireann: The Irish Meteorological Service. Available online: https://www.met.ie/climate/what-we-measure/rainfall (accessed on 20 October 2022).
  44. Environmental Protection Agency. EPA Current Trends: Land and Soil. Available online: https://www.epa.ie/our-services/monitoring--assessment/assessment/irelands-environment/land--soil/current-trends-land-and-soil/ (accessed on 5 January 2023).
  45. Teagasc. A Guide to the Key Findings of the Teagasc Heavy Soils Programme to-Date; Animal & Grassland Research and Innovation Centre: Moorepark, Ireland, 2021; Available online: https://www.teagasc.ie/publications/2021/teagasc-heavy-soils-programme--lessons-learned.php (accessed on 18 September 2023).
  46. Creamer, R. Secure Archive For Environmental Research Data (SAFER) Managed by Environmental Protection Agency Ireland. Irish Soil Information System Synthesis Report. Available online: https://eparesearch.epa.ie/safer/resource?id=1bfe6109-3b92-11e4-b233-005056ae0019 (accessed on 18 September 2023).
  47. Schulte, R.P.O.; Simo, I.; Creamer, R.E.; Holden, N.M. A Note on the Hybrid Soil Moisture Deficit Model v2.0. Irish J. Agric. Food Res. 2015, 54, 128–131. [Google Scholar] [CrossRef]
  48. Tuohy, P.; O’ Loughlin, J.; Peyton, D.; Fenton, O. The Performance and Behavior of Land Drainage Systems and Their Impact on Field Scale Hydrology in an Increasingly Volatile Climate. Agric. Water Manag. 2018, 210, 96–107. [Google Scholar] [CrossRef]
  49. ESA User Guides-Sentinel-1 SAR. Available online: https://sentinels.copernicus.eu/web/sentinel/user-guides/sentinel-2-msi/product-types/level-1c (accessed on 25 October 2022).
  50. Gilmore, S.; Saleem, A.; Dewan, A. Effectiveness of DOS (Dark-Object Subtraction) method and water index techniques to map wetlands in a rapidly urbanising megacity with Landsat 8 data. In Proceedings of the Research@Locate in Conjunction with the Annual Conference on Spatial Information in Australia and New Zealand, Brisbane, Australia, 10–12 March 2015; Veenendaal, B., Kealy, A., Eds.; Volume 1323, pp. 100–108. [Google Scholar]
  51. Congedo, L. Semi-Automatic Classification Plugin: A Python Tool for the Download and Processing of Remote Sensing Images in QGIS. J. Open Source Softw. 2021, 6, 3172. [Google Scholar] [CrossRef]
  52. Asam, S.; Gessner, U.; González, R.A.; Wenzl, M.; Kriese, J.; Kuenzer, C. Mapping Crop Types of Germany by Combining Temporal Statistical Metrics of Sentinel-1 and Sentinel-2 Time Series with LPIS Data. Remote Sens. 2022, 14, 2981. [Google Scholar] [CrossRef]
  53. Coluzzi, R.; Imbrenda, V.; Lanfredi, M.; Simoniello, T. A First Assessment of the Sentinel-2 Level 1-C Cloud Mask Product to Support Informed Surface Analyses. Remote Sens. Environ. 2018, 217, 426–443. [Google Scholar] [CrossRef]
  54. Sadeghi, M.; Jones, S.B.; Philpot, W.D. A Linear Physically-Based Model for Remote Sensing of Soil Moisture Using Short Wave Infrared Bands. Remote Sens. Environ. 2015, 164, 66–76. [Google Scholar] [CrossRef]
  55. Santos, W.J.R.; Silva, B.M.; Oliveira, G.C.; Volpato, M.M.L.; Lima, J.M.; Curi, N.; Marques, J.J. Soil Moisture in the Root Zone and Its Relation to Plant Vigor Assessed by Remote Sensing at Management Scale. Geoderma 2014, 221–222, 91–95. [Google Scholar] [CrossRef]
  56. Hassanpour, R.; Zarehaghi, D.; Neyshabouri, M.R.; Feizizadeh, B.; Rahmati, M. Modification on Optical Trapezoid Model for Accurate Estimation of Soil Moisture Content in a Maize Growing Field. J. Appl. Remote Sens. 2020, 14, 034519. [Google Scholar] [CrossRef]
  57. Ambrosone, M.; Matese, A.; Di Gennaro, S.F.; Gioli, B.; Tudoroiu, M.; Genesio, L.; Miglietta, F.; Baronti, S.; Maienza, A.; Ungaro, F.; et al. Retrieving Soil Moisture in Rainfed and Irrigated Fields Using Sentinel-2 Observations and a Modified OPTRAM Approach. Int. J. Appl. Earth Obs. Geoinf. 2020, 89, 102113. [Google Scholar] [CrossRef]
  58. Lipovetsky, S. Double Logistic Curve in Regression Modeling. J. Appl. Stat. 2010, 37, 1785–1793. [Google Scholar] [CrossRef]
  59. Hupet, F.; Vanclooster, M. Intraseasonal Dynamics of Soil Moisture Variability within a Small Agricultural Maize Cropped Field. J. Hydrol. 2002, 261, 86–101. [Google Scholar] [CrossRef]
  60. Lobell, D.B.; Asner, G.P. Moisture Effects on Soil Reflectance. Soil Sci. Soc. Am. J. 2002, 66, 722–727. [Google Scholar] [CrossRef]
  61. Gao, B.C. NDWI—A Normalized Difference Water Index for Remote Sensing of Vegetation Liquid Water from Space. Remote Sens. Environ. 1996, 58, 257–266. [Google Scholar] [CrossRef]
  62. Yilmaz, M.T.; Hunt, E.R.; Jackson, T.J. Remote Sensing of Vegetation Water Content from Equivalent Water Thickness Using Satellite Imagery. Remote Sens. Environ. 2008, 112, 2514–2522. [Google Scholar] [CrossRef]
  63. Yang, P.; Verhoef, W.; van der Tol, C. The MSCOPE Model: A Simple Adaptation to the SCOPE Model to Describe Reflectance, Fluorescence and Photosynthesis of Vertically Heterogeneous Canopies. Remote Sens. Environ. 2017, 201, 1–11. [Google Scholar] [CrossRef]
  64. Ojha, N.; Merlin, O.; Suere, C.; Escorihuela, M.J. Extending the Spatio-Temporal Applicability of DISPATCH Soil Moisture Downscaling Algorithm: A Study Case Using SMAP, MODIS and Sentinel-3 Data. Front. Environ. Sci. 2021, 9, 40. [Google Scholar] [CrossRef]
  65. Saadeldin, M.; O’Hara, R.; Zimmermann, J.; Mac Namee, B.; Green, S. Using Deep Learning to Classify Grassland Management Intensity in Ground-Level Photographs for More Automated Production of Satellite Land Use Maps. Remote Sens. Appl. Soc. Environ. 2022, 26, 100741. [Google Scholar] [CrossRef]
  66. Burdun, I.; Bechtold, M.; Aurela, M.; De Lannoy, G.J.M.; Desai, A.R.; Humphreys, E.; Kareksela, S.; Komisarenko, V.; Liimatainen, M.; Marttila, H.; et al. Hidden Becomes Clear: Optical Remote Sensing of Vegetation Reveals Water Table Dynamics in Northern Peatlands. Remote Sens. Environ. 2023, 296, 113736. [Google Scholar] [CrossRef]
  67. Benegas, L.; Hasselquist, N.; Bargués-Tobella, A.; Malmer, A.; Ilstedt, U. Positive Effects of Scattered Trees on Soil Water Dynamics in a Pasture Landscape in the Tropics. Front. Water 2021, 3, 736824. [Google Scholar] [CrossRef]
  68. Wagner, W.; Lemoine, G.; Rott, H. A Method for Estimating Soil Moisture from ERS Scatterometer and Soil Data. Remote Sens. Environ. 1999, 70, 191–207. [Google Scholar] [CrossRef]
  69. Collow, T.W.; Robock, A.; Basara, J.B.; Illston, B.G. Evaluation of SMOS Retrievals of Soil Moisture over the Central United States with Currently Available In Situ Observations. J. Geophys. Res. Atmos. 2012, 117. [Google Scholar] [CrossRef]
  70. Salvucci, G.D.; Entekhabi, D. Equivalent Steady Soil Moisture Profile and the Time Compression Approximation in Water Balance Modeling. Water Resour. Res. 1994, 30, 2737–2749. [Google Scholar] [CrossRef]
  71. Brutsaert, W. The Daily Mean Zero-Flux Plane during Soil-Controlled Evaporation: A Green’s Function Approach. Water Resour. Res. 2014, 50, 9405–9413. [Google Scholar] [CrossRef]
  72. Schwen, A.; Zimmermann, M.; Bodner, G. Vertical Variations of Soil Hydraulic Properties within Two Soil Profiles and Its Relevance for Soil Water Simulations. J. Hydrol. 2014, 516, 169–181. [Google Scholar] [CrossRef]
  73. Meurer, K.; Barron, J.; Chenu, C.; Coucheney, E.; Fielding, M.; Hallett, P.; Herrmann, A.M.; Keller, T.; Koestel, J.; Larsbo, M.; et al. A Framework for Modelling Soil Structure Dynamics Induced by Biological Activity. Glob. Chang. Biol. 2020, 26, 5382–5403. [Google Scholar] [CrossRef] [PubMed]
  74. Verrot, L.; Geris, J.; Gao, L.; Peng, X.; Oyesiku-Blakemore, J.; Smith, J.U.; Hodson, M.E.; Zhang, G.; Hallett, P.D. A Simple Modelling Framework for Shallow Subsurface Water Storage and Flow. Water 2019, 11, 1725. [Google Scholar] [CrossRef]
  75. Paul, C.; Fealy, R.; Fenton, O.; Lanigan, G.; O’Sullivan, L.; Schulte, R.P.O. Assessing the Role of Artificially Drained Agricultural Land for Climate Change Mitigation in Ireland. Environ. Sci. Policy 2018, 80, 95–104. [Google Scholar] [CrossRef]
  76. Naranjo-Lucena, A.; Munita Corbalán, M.P.; Martínez-Ibeas, A.M.; McGrath, G.; Murray, G.; Casey, M.; Good, B.; Sayers, R.; Mulcahy, G.; Zintl, A. Spatial Patterns of Fasciola hepatica and Calicophoron daubneyi infection in ruminants in Ireland and modelling of C. daubneyi infection. Parasites Vectors 2018, 11, 1–13. [Google Scholar] [CrossRef]
  77. Baroni, G.; Ortuani, B.; Facchi, A.; Gandolfi, C. The Role of Vegetation and Soil Properties on the Spatio-Temporal Variability of the Surface Soil Moisture in a Maize-Cropped Field. J. Hydrol. 2013, 489, 148–159. [Google Scholar] [CrossRef]
  78. Abdu, H.; Robinson, D.A.; Boettinger, J.; Jones, S.B. Electromagnetic Induction Mapping at Varied Soil Moisture Reveals Field-Scale Soil Textural Patterns and Gravel Lenses. Front. Agric. Sci. Eng. 2017, 4, 135–145. [Google Scholar] [CrossRef]
  79. Mohanty, B.P.; Skaggs, T.H. Spatio-Temporal Evolution and Time-Stable Characteristics of Soil Moisture within Remote Sensing Footprints with Varying Soil, Slope, and Vegetation. Adv. Water Resour. 2001, 24, 1051–1067. [Google Scholar] [CrossRef]
  80. Wagner, W.; Pathe, C.; Doubkova, M.; Säbel, D.; Bartsch, A.; Hasenauer, S.; Blöschl, G.; Scipal, K.; Martínez-Fernández, J.; Löw, A. Temporal Stability of Soil Moisture and Radar Backscatter Observed by the Advanced Synthetic Aperture Radar (ASAR). Sensors 2008, 8, 1174–1197. [Google Scholar] [CrossRef] [PubMed]
  81. Rötzer, K.; Montzka, C.; Bogena, H.; Wagner, W.; Kerr, Y.H.; Kidd, R.; Vereecken, H. Catchment Scale Validation of SMOS and ASCAT Soil Moisture Products Using Hydrological Modeling and Temporal Stability Analysis. J. Hydrol. 2014, 519, 934–946. [Google Scholar] [CrossRef]
  82. Zhang, S.; Shao, M. Temporal Stability of Soil Moisture in an Oasis of Northwestern China. Hydrol. Process. 2017, 31, 2725–2736. [Google Scholar] [CrossRef]
  83. Burdun, I.; Bechtold, M.; Sagris, V.; Lohila, A.; Humphreys, E.; Desai, A.R.; Nilsson, M.B.; De Lannoy, G.; Mander, Ü. Satellite Determination of Peatland Water Table Temporal Dynamics by Localizing Representative Pixels of A SWIR-Based Moisture Index. Remote Sens. 2020, 12, 2936. [Google Scholar] [CrossRef]
  84. Reinermann, S.; Asam, S.; Kuenzer, C. Remote Sensing of Grassland Production and Management-A Review. Remote Sens. 2020, 12, 1949. [Google Scholar] [CrossRef]
  85. Lange, M.; Feilhauer, H.; Kühn, I.; Doktor, D. Mapping Land-Use Intensity of Grasslands in Germany with Machine Learning and Sentinel-2 Time Series. Remote Sens. Environ. 2022, 277, 112888. [Google Scholar] [CrossRef]
  86. EU. The EU NatureRestoration Law. Available online: https://environment.ec.europa.eu/topics/nature-and-biodiversity/nature-restoration-law_en#documents (accessed on 31 March 2023).
  87. Fluet-Chouinard, E.; Stocker, B.D.; Zhang, Z.; Malhotra, A.; Melton, J.R.; Poulter, B.; Kaplan, J.O.; Goldewijk, K.K.; Siebert, S.; Minayeva, T.; et al. Extensive Global Wetland Loss over the Past Three Centuries. Nature 2023, 614, 281–286. [Google Scholar] [CrossRef]
  88. Ojanen, P.; Minkkinen, K. Rewetting offers rapid climate benefits for tropical and agricultural peatlands but not for forestry-drained peatlands. Global Biogeochem. Cycles 2020, 34, e2019GB006503. [Google Scholar] [CrossRef]
  89. Schwieger, S.; Kreyling, J.; Couwenberg, J.; Smiljanić, M.; Weigel, R.; Wilmking, M.; Blume-Werry, G. Wetter Is Better: Rewetting of Minerotrophic Peatlands Increases Plant Production and Moves Them Towards Carbon Sinks in a Dry Year. Ecosystems 2021, 24, 1093–1109. [Google Scholar] [CrossRef]
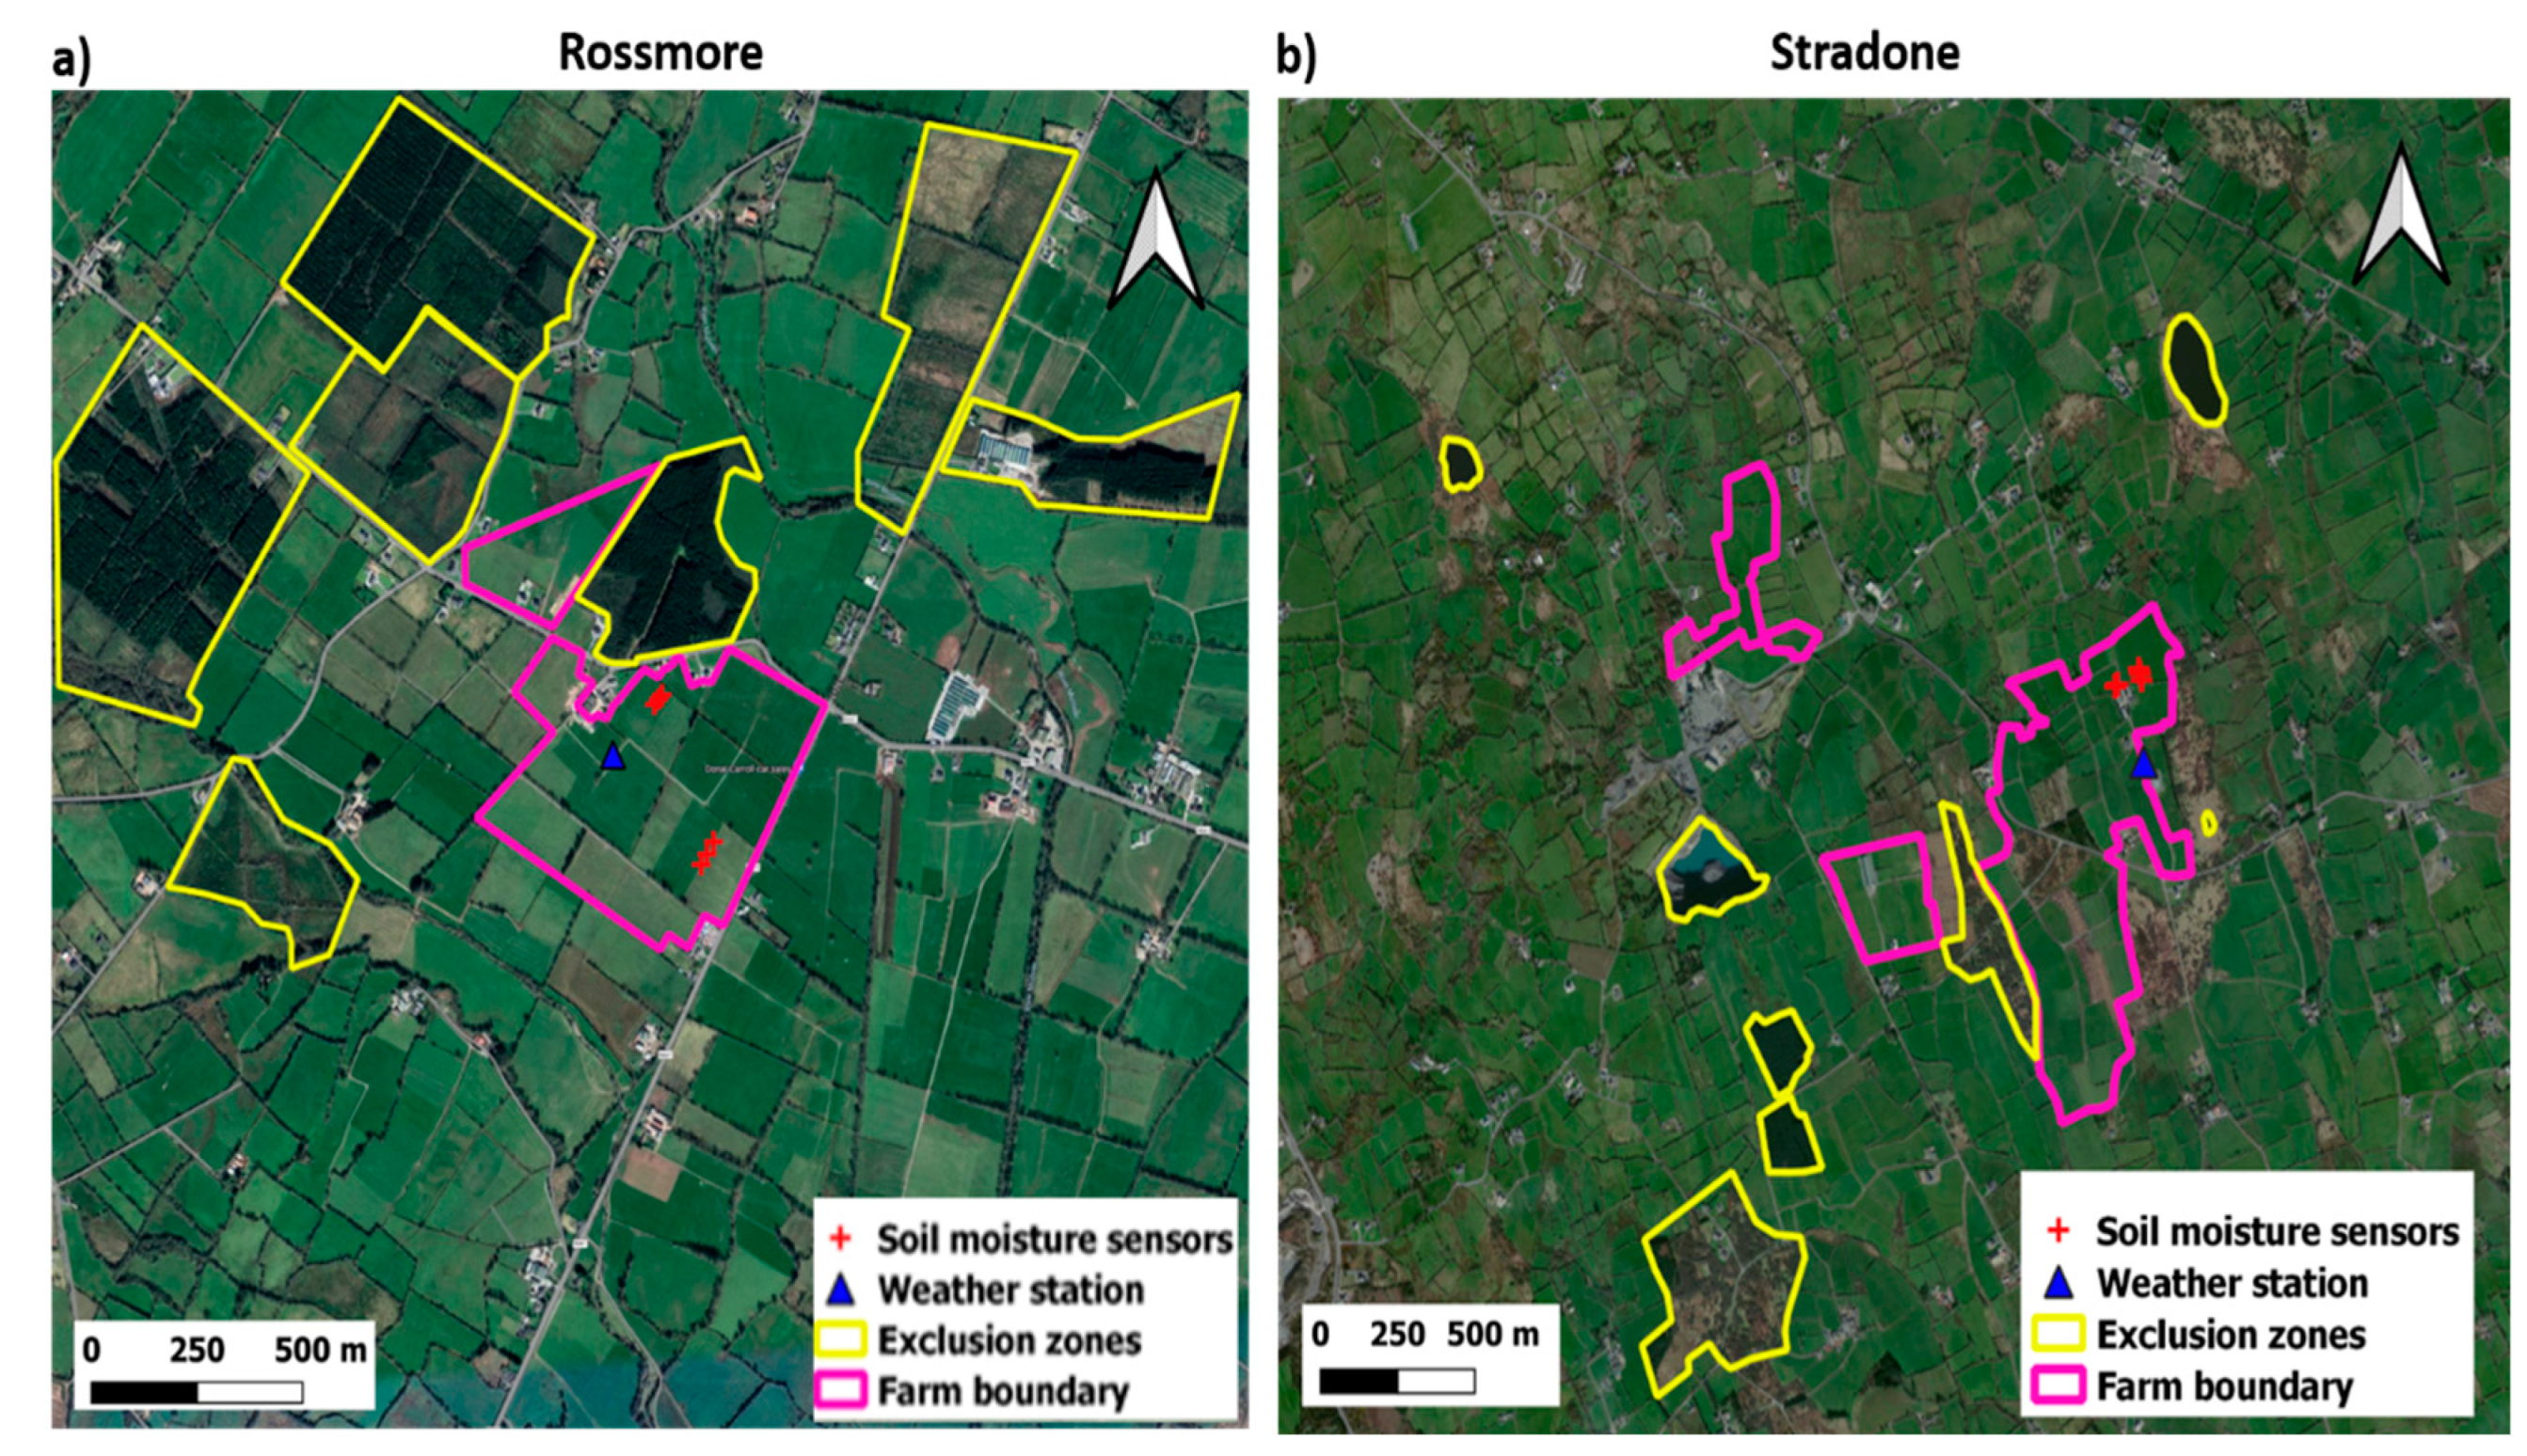
Figure 1. Locations of (a) Rossmore and (b) Stradone sites. Yellow polygons indicate zones of forests and water bodies excluded from the analysis. Note the different scales for each area.
Remotesensing 16 00220 g001
Figure 2. Idealised representation of OPTRAM STR-VI scatter plot. The blue line represents the (saturated) wet edge, the black line represents the dry edge and red dots represent STR-VI couplets allocated to VI bins of width 0.01 and STR bins of height 0.01 multiplied by the range of STR.
Remotesensing 16 00220 g002
Figure 3. (a) VSM and (b) daily rainfall and evapotranspiration for Rossmore; (c,d) equivalent time series for Stradone. Vertical lines date S-2 observations since the installation of the network. Stra1, Stra3 and Stra5 VSM sensors record values > saturated VSM after high rainfall/low ET events, indicating over-saturated conditions with free water at the surface. ET peaks and VSM is at its minimum in mid-summer (July); cumulative rainfall is higher in winter (October–March) than summer.
Remotesensing 16 00220 g003
Figure 4. STR-EVI scatter plots. (a) Rossmore without land cover masks; (b) Rossmore with land cover masks; (c) Stradone without land cover masks; and (d) Stradone with land cover masks.
Remotesensing 16 00220 g004
Figure 5. Scatter plots of STR-VI with land cover masks at each site. (a) Rossmore STR-MSAVI, (b) Stradone STR-MSAVI, (c) Rossmore STR-NDVI, (d) Stradone STR-NDVI, (e) Rossmore STR-NDREI, (f) Stradone STR-NDREI.
Remotesensing 16 00220 g005
Figure 6. Correlations between VSM and nSSM for the two farm sites. Each circle corresponds to a sensor reading. The S-2 data that did not meet the conditions of drying (Section 2.5.4), i.e., during a period with an increase in VSM, were excluded from the regression (blue circles). The absolute differences in the means (MD m3/m3), the unbiased Root Mean Square Deviations (m3/m3) and Percent Bias (PB) between the predicted VSM and observed VSM are, respectively, (a) 0.001, 0.05 and 0.23, (b) 0.003, 0.06 and −1.25, (c) 0.001, 0.06 and 0.19, (d) 0.003, 0.06 and −0.96. The MD and PB between the predicted and observed VSM are insignificant in the limited range of 0.1 < nSSM < 0.5.
Remotesensing 16 00220 g006
Figure 7. nSSM maps for Rossmore for (a) high NWF and (b) low NWF, and Stradone for (c) high NWF and (d) low NWF. White areas are exclusion zones. Co-ordinates are in meters in the Irish Transverse Mercator (ITM) projection.
Remotesensing 16 00220 g007
Figure 8. Temporal Stability for Rossmore (a) Ŵ and (b) σ , and Stradone (c) Ŵ and (d) σ . Farm boundaries shown by solid black lines. White areas are exclusion zones. Co-ordinates are in meters in the Irish Transverse Mercator (ITM) projection.
Remotesensing 16 00220 g008
Figure 9. Median Relative Difference, Ŵ , Median Absolute Deviation Relative Difference, σ , and Great Soil Groups for the two farm sites. (a) Rossmore Ŵ , (b) Rossmore σ , (c) Rossmore Great Soil Groups, (d) Stradone Ŵ , (e) Stradone σ , (f) Stradone Great Soil Groups. Numbers refer to areas discussed in the text.
Remotesensing 16 00220 g009
Table 1. Laboratory measurements of soil samples around sensors at the two sites. The measurement uncertainties are <±0.02 m3/m3. Ross = Rossmore, Stra = Stradone.
SensorsSoil TypeSoil TextureSaturated VSM (m3/m3)Residual VSM (m3/m3)
Ross 1–3Brown EarthLoam0.640.06
Ross 4–6Surface Water GleySandy Loam0.500.04
Stra 1–3LuvisolLoam0.590.09
Stra 4–6Stagnic Brown EarthClay Loam0.570.08
Table 2. Distance correlation coefficient d c o r and Spearman’s rank correlation coefficient ρ c o r (in brackets) between STR and VIs for Rossmore (lower triangle with orange background) and Stradone (upper triangle with blue background). Coefficients are for data that have been masked to remove exclusion zones.
NDREIMSAVIEVINDVISTR
STR1.00 (1.00)0.89 (0.92)0.58 (0.87)0.96 (0.95)0.27 (−0.07)NDREI
NDVI0.23 (0.17)1.00(1.00)0.69 (0.93)0.90 (0.96)0.36 (−0.29)MSAVI
EVI0.26 (−0.13)0.51 (0.53)1.00 (1.00)0.57 (0.90)0.30 (−0.08)EVI
MSAVI0.32 (−0.18)0.79 (0.83)0.80 (0.83)1.00 (1.00)0.30 (−0.15)NDVI
NDREI0.31 (0.34)0.88 (0.89)0.51 (0.53)0.71 (0.73)1.00 (1.00)STR
STRNDVIEVIMSAVINDREI
Disclaimer/Publisher’s Note: The statements, opinions and data contained in all publications are solely those of the individual author(s) and contributor(s) and not of MDPI and/or the editor(s). MDPI and/or the editor(s) disclaim responsibility for any injury to people or property resulting from any ideas, methods, instructions or products referred to in the content.