Abstract
Monitoring and assessing coastal subsidence is crucial to mitigating potential disaster risks associated with rising sea levels. Nansha District in Guangzhou City, representing global coastal soft-soil urban areas, faces significant challenges related to ground subsidence. However, the current understanding of the status, causative factors, and risk (includes subsidence susceptibility and vulnerability) assessment of ground subsidence in Nansha District is unclear. To address this gap, we utilized the SBAS-InSAR technique, analyzing 49 Sentinel-1A images from December 2015 to June 2019, for systematic ground subsidence monitoring. Subsequently, we assessed subsidence risk using a comprehensive index method and a risk matrix. Our findings indicate that subsidence velocity primarily ranged from −40 to −5 mm/a, with a spatial pattern of increasing subsidence from inland to coastal areas. The cumulative subsidence process unfolded in four distinct stages. The genesis of land subsidence was linked to an endogenous geological context dominated by soft-soil deposition, influenced by external factors such as surface loading and groundwater extraction. High-risk zones were concentrated in key engineering development areas, transportation pipeline trunk lines, and densely populated regions, demanding special attention. This study provides a foundational resource for disaster prevention and control strategies in Nansha District and similar coastal cities.
1. Introduction
Coastal cities and regions worldwide face significant threats from rising sea levels attributed to global warming [1]. Ground subsidence, defined as the gradual consolidation and compression of surface soil leading to a continuous decrease in ground elevation, represents a slowly evolving urban geohazard, influenced by both natural and anthropogenic factors [2]. When coupled with sea level rise, the compounded impact of ground subsidence exacerbates the relative significance of rising sea levels [3]. Research conducted by Shirzaei et al. [4] demonstrates that coastal subsidence intensifies the risk of flood hazards, with predictions indicating a tripling of the world’s at-risk population by 2070. Previous studies have identified various factors contributing to land subsidence, including geological tectonic activity [5], surface sediment characteristics [6], and climatic conditions [7], as well as the exploitation of underground resources such as groundwater, oil, and natural gas [8]. Additionally, static and dynamic ground loads resulting from rapid urbanization and population growth further contribute to subsidence [9]. The diverse array of subsidence factors and the intricate nature of the risk evaluation system present formidable challenges for disaster prevention and control efforts related to ground subsidence [10].
Accurate and extended time-series data on ground subsidence are indispensable for the comprehensive understanding of subsidence processes, conducting risk assessments, and implementing effective countermeasures. Su et al. [11] meticulously gathered and organized precision-level data and GNSS data spanning from 1952, enabling the reconstruction of the spatial and temporal evolution pattern of subsidence in the North China Plain. Their work elucidated the primary influences of groundwater depletion, Quaternary soft clay thickness, and tectonic loading. Traditional geodetic techniques used for subsidence monitoring, such as the Global Navigation Satellite System, Precise Leveling, and Total Station, feature high monitoring accuracy and extensive time-series data. However, they are constrained by limitations in spatial resolution, elevated monitoring costs, restricted coverage area, and diminished efficiency. These limitations notably impede the efficacy of conventional deformation monitoring across expansive regions like urban economic zones, mining and production zones, and transportation zones [12]. In addition, aerial photogrammetry using unmanned aerial vehicles as camera carriers has been employed for monitoring surface deformation due to its adaptability to complex and inaccessible areas. However, it is constrained by weather conditions and flight time [13]. In contrast, interferometric synthetic aperture radar (InSAR), as an advanced technology, offers full-coverage, all-day, and all-weather fine measurements, proving instrumental in various deformation monitoring applications, including slope instability monitoring, mining subsidence monitoring, and sea-ice terrain inversion [14,15,16,17]. Despite the constraints posed by atmospheric interference, surface reflection characteristics, and the complexity of data processing, the InSAR technique has gained widespread adoption. This is attributed to the introduction of atmospheric correction models and the ongoing simplification and optimization of the technical process. Specifically, the Small Baseline Subset Interferometric Synthetic Aperture Radar (SBAS-InSAR), a representative time-series InSAR approach utilizing SAR time-series image stacking, is extensively employed for ground stability monitoring in urban areas with robust infrastructures. This widespread usage can be largely attributed to the characteristic low vegetation cover and regular infrastructure in urban areas, which serve to minimize the impact of uncorrelated content [18]. For example, Cianflone et al. [19] applied the SBAS-InSAR technique to examine the spatial and temporal distribution characteristics of land subsidence in the Sibari plain of the Calabria region during the period from 2003 to 2013. Their study provided preliminary insights into potential factors influencing ground subsidence, encompassing geodynamics, seismotectonic activity, Quaternary sediment loading, and anthropogenic factors. Du et al. [20] conducted a study in the eastern Tianshan Mountains using SBAS-InSAR to analyze surface changes over three years, revealing significant subsidence and uplift rates and identifying geological hazard-prone regions, crucial for environmental protection and hazard prevention. Glave et al. [21] assessed a surface velocity map produced by the Geohazard Exploitation Platform (GEP) through an analysis of satellite data using SBAS, revealing new insights into geological processes and demonstrating the platform’s potential in hazard monitoring. Nayak et al. [22] employed SBAS to uncover ground displacements resulting from the 2023 Moroccan earthquake, showcasing temporal alterations in the ground. Despite the advancements offered by InSAR technology, its retrospective capabilities are limited by the availability of satellite image data and monitoring accuracy uncertainties. Consequently, a judicious approach involves combining traditional geodetic methods with radar technology for more scientifically robust subsidence monitoring.
The integration of multi-source data and various monitoring techniques for ground subsidence enables a visual assessment of subsidence degrees as well as spatial and temporal distribution characteristics during the study period. However, the absence of research on subsidence risk evaluation poses a challenge in offering reliable assistance for practical management. The comprehensive risk evaluation process for ground subsidence typically involves three key stages: indicator selection, determination of indicator weights, and construction of a mathematical model [23]. Monitoring and analyzing the spatial and temporal characteristics of ground subsidence constitute fundamental research, while uncovering and exploring influencing factors represent a research process. Realizing risk evaluation and accomplishing visual zoning, based on the aforementioned research, constitute managerial research. This integrated approach can effectively provide guidance for land use and urban planning. Presently, InSAR technology is predominantly applied in risk evaluation for geological hazards with a focus on landslides. For instance, Dai et al. [24] integrated a geological evaluation model with InSAR technology to assess landslide susceptibility on a reservoir bank during the water storage process. Similarly, Zhao et al. [25] utilized a combination of SBAS-InSAR, logistic regression, and random forest modeling to map landslide susceptibility zones along the Karakorum Highway. However, there is a notable scarcity of studies addressing the evaluation of ground subsidence risk in expansive urban areas. An illustrative example is the work by Cigna et al. [2], who evaluated that surface fractures in the Valley of Mexico Metropolitan Area could pose a threat to 457,000 properties and the productive lives of 1.5 million inhabitants. Consequently, there is an urgent need to incorporate multi-source techniques to promptly assess subsidence risk in urban areas.
Coastal subsidence represents a geological hazard that is inherently more intricate and susceptible to associated risks compared to inland subsidence. The monitoring of coastal subsidence and the assessment of subsidence risk are pivotal in mitigating the hazards associated with sea level rise. Nansha District, situated in the southernmost region of Guangzhou City within the Pearl River Delta (PRD), plays a vital role as a key hub connecting city clusters on both sides of the PRD and facilitating communication with Hong Kong and Macao. It stands as a growth pole for the future Chinese economy [26,27]. Characterized by the confluence of three rivers—Xijiang, Beijiang, and Dongjiang—the district exhibits a widespread distribution of Holocene marine sedimentary soft soil layers, silt, and silty soil. These geological features, marked by substantial compressibility, poor stability, and a high pore ratio, render the area highly susceptible to ground subsidence [28,29,30]. Furthermore, Nansha District has undergone a transformative shift from a global manufacturing hub to a burgeoning urban area in the 21st century. This transition has been accompanied by extensive engineering activities, land reclamation efforts, and significant surface and subsurface disturbances, exacerbating the inherent risk of ground subsidence [31]. The district’s ground stability is notably precarious, with records indicating 87 ground subsidence incidents as of 2022. These incidents frequently manifest in construction zones, along roadways, and within engineering construction sites [32]. Given the economic importance of coastal cities, there is a compelling need to explore the characteristics and influencing factors of coastal soft soil subsidence in Nansha District. Such an inquiry serves as a critical entry point for conducting prompt and effective risk evaluations. Prior to 2016, studies on ground subsidence in Nansha District primarily relied on level measurements and GPS, limiting their ability to capture comprehensive ground deformation information across the entire district. Post-2016, there has been a gradual shift towards the application of InSAR technology, although the analyses of causative factors have predominantly been qualitative, hindering the ability to specify intrinsic correlations quantitatively and scientifically. Furthermore, there remains a paucity of research on subsidence risk evaluation [33,34,35,36,37,38].
Here, we selected the European Space Agency (ESA) Sentinel-1A satellite images and used the SBAS-InSAR technique to monitor ground subsidence from 12 December 2015 to 18 June 2019 in Nansha District, Guangzhou City, China, as an example. In addition, we acquired borehole field monitoring data for accuracy verification and systematically investigated the spatio-temporal dynamic patterns of ground subsidence. The analysis of factors affecting subsidence was then carried out quantitatively using correlation analysis. Finally, we combined the subsidence information and economic indicators with the application of risk matrix, comprehensive index method, and GIS spatial analysis techniques to evaluate the susceptibility, vulnerability, and risk of subsidence. With the overarching objective of systematically elucidating the spatial and temporal distribution characteristics, influencing factors, and risk evaluation of coastal subsidence, this study enhances the quantitative analysis of causal mechanisms rooted in subsidence characterization. It further proposes evaluations and recommendations that integrate managerial understanding. The study is expected to provide a scientific basis for the overall layout of urban development and disaster prevention in Nansha District, as well as a reference for the development planning of global coastal cities with extensive soft soils.
2. Materials and Methods
2.1. Study Area
Nansha District (113°13′~113°43′E, 22°26′~23°06′N) is situated in the southernmost part of Guangzhou City within the PRD, strategically positioned at the geographic center of the Guangdong–Hong Kong–Macao Greater Bay Area (GBA) (Figure 1). Meteorologically and hydrologically, the district experiences a typical subtropical monsoon climate, characterized by an average annual precipitation of approximately 1673 mm, with seasonal variations influenced by typhoons. Notably, Nansha District is endowed with abundant surface water resources, boasting 5 major waterways and 116 inland river channels. The intricate surface water system, combined with seasonally varying atmospheric precipitation, significantly impacts the groundwater environment in the region [39,40]. From a geological perspective, Nansha District is situated within the Yuezhong Massif of the South China Fold System, with strata comprising Precambrian gneiss (Ptgn), Proterozoic Yunkai Rock Group (PtY), Paleogene terrestrial red clastic sedimentary rocks (E1x), and Quaternary loose sediments (Qhdw, Qs, Qhg, Qel). Of particular interest is the prevalence of Quaternary strata, exhibiting considerable thickness variations, where soft soils like silt and silty clayey soils reach an average thickness of 20~40 m. Consequently, this area has emerged as the most extensively developed region of soft soils in the Pearl River Delta Plain, laying the geological groundwork for the manifestation of urban geohazards such as ground subsidence [41,42] (Figure 1b). Positioned as a key transportation hub and a focal point for economic development, Nansha District has experienced rapid growth in advanced manufacturing and modern service industries in recent years. Notably, the gross regional product of Nansha District reached 168.323 billion yuan in 2019. The district’s prominence is further underscored by the opening of 85 international liner routes in 2017, ranking third in tourist throughput nationwide. Additionally, the cargo port achieved a substantial 282 million tons of cargo throughput in 2015, with individual port volumes ranking in the top 12 globally. This elevated level of urban engineering and construction activities surpasses that of other urban areas, resulting in surface and subsurface disturbances that present opportunities for the manifestation of ground subsidence [43,44].
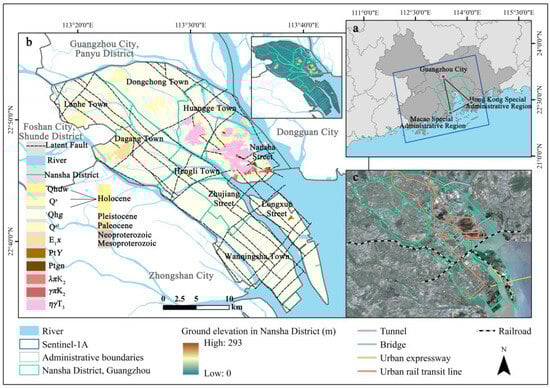
Figure 1.
An overview map of the study area. The location of Nansha District in the geometric center of the GBA is shown in (a), while this section shows the key role of Nansha District (at the green star-shaped dots) in linking the center of Guangzhou, and the blue and green rectangular boxes indicate the extent of the Sentinel-1A and the Nansha District, respectively; the types of geotechnical strata and the corresponding stratigraphic age distribution in Nansha District are shown in (b), and the ground elevation information of the district is also indicated in the upper right corner of (b); the railroads, tunnels, bridges, urban expressways, and urban rail transit lines in Nansha District are shown in (c), where the green lines indicate the administrative boundaries of Nansha District containing towns and streets.
2.2. Overall Framework
The acquisition of ground subsidence data involved radar image processing through the SBAS-InSAR module within the ENVI 5.3 SARScape 5.2.1 software. Initially, we designated the radar image from 26 October 2017 as the super-master image, aligning primary and secondary images based on a temporal baseline threshold of 365 days and a spatial baseline threshold of 2% to generate a connectivity map. Subsequently, interferometric phase calculation was performed, involving the removal of the flat phase based on spatial baseline and earth ellipsoid parameters, along with the elimination of terrain phase using AW3D-DEM data. The Goldstein and Minimum Cost Flow methods were employed for filtering and phase unwrapping to generate the differential interferograms. The threshold value for the unwrapping correlation coefficient is contingent on geological conditions. As geological complexity increases, the threshold is systematically lowered. Experimental validation has demonstrated that the chosen threshold value of 0.3 in this study consistently yields reliable unwrapping results. The selection of 50 well-coherent ground control points (GCPs) facilitated the removal of residual terrain phases. Linear deformation phase in both time and space domains was estimated, utilizing the singular value decomposition (SVD) method to initially gauge deformation rate information and residual topography. The subsequent steps involved the removal of residual phases, including atmospheric, noise, and elevation factors, through atmospheric filtering and nonlinear deformation. Ultimately, deformation in the line-of-sight direction was computed and converted, yielding ground subsidence velocity and cumulative subsidence change information through geocoding (Figure 2a). Validation of InSAR monitoring accuracy was conducted by fitting InSAR ground subsidence data with field borehole monitoring data in Nansha District (Figure 2b). Incorporating soft-soil thickness, ground dynamic and static loads, groundwater extraction, and field research information, a correlation study was undertaken to discern the influencing factors of subsidence in the Nansha District (Figure 2c). Leveraging the subsidence data and soft-soil geological information, supplemented by economic indicators such as project building density, population density, project importance degree, and traffic data, we established a three-level indicator evaluation system. Subsequently, we applied the risk matrix and comprehensive index method to sequentially assess the subsidence susceptibility and vulnerability of the study area, culminating in an overarching risk evaluation (Figure 2d).
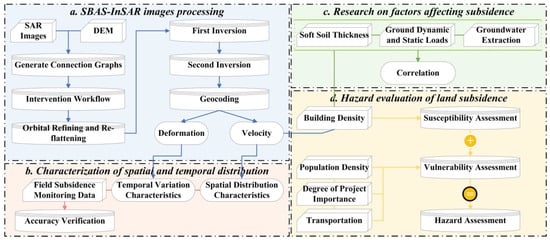
Figure 2.
Experimental flow. The blue arrows in series indicate the process of SBAS-InSAR experiment, the pink arrows in series represent the process of analyzing the spatial and temporal distribution characteristics of subsidence, the green arrows in series show the process of investigating subsidence’s causes, and the yellow arrows in series indicate the process of subsidence risk evaluation.
2.3. Technology and Methodology
2.3.1. SBAS-InSAR Technology
SBAS-InSAR represents a multimaster image time series technique designed for extracting ground deformation information. This method relies on the selection of interferometric pairs with small spatio-temporal baselines to delimit the influence of spatio-temporal decorrelation. The key procedural steps involve the creation of multiple interferometric pairs through the application of suitable spatial and temporal baseline thresholds. Coherent target points are then chosen, and linear phase models are employed for both modeling and unwrapping. The least squares method is subsequently applied to derive surface deformation within each subset. Addressing the rank deficit issue is achieved through the singular value decomposition (SVD) method. The integration of multiple subsets is employed to collectively address challenges associated with temporal and spatial decorrelation, effectively minimizing errors such as those arising from elevation discrepancies, atmospheric disturbances, and noise artifacts. This approach has gained widespread acceptance for ground subsidence monitoring in areas characterized by low coherence [45,46,47]. The fundamental process is outlined below.
Assuming that there are N + 1 SAR images acquired by the time sequence t = [t0, …, tN]T in the study area, one of the images is selected as the primary image for alignment, and the interferometric pairs that meet the spatiotemporal baseline thresholds are selected to obtain M differential interferograms, where M is satisfied:
Assuming that the two images acquired at and periods (>) differentially interfere with the reference image at time , the interferometric phase obtained in interferogram j at pixel point (x, r) can be expressed as
where is the interferometric phase at a pixel point; and are the phases at the moments of and corresponding to the moment of , respectively; the phase is the deformational phase induced by the change in the target-radar distance along the line-of-sight; and , , , and are the phase information induced by the topography, satellite orbital error, atmospheric effect, and noise, respectively.
The SBAS-InSAR method obtains the deformation phase by removing the residual components of the interferometric phase, which can form a system of equations about M equations with N unknowns as
where A is the M × N order coefficient matrix, and each row corresponds to each interferometric pair. is the N × 1 order unknown deformation phase vector; is the N × 1 order untangling phase variable. Set B to represent the M × N order coefficient matrix and ν to represent the average phase velocity, then it can be transformed into
where B denotes the M × N order coefficient matrix and ν denotes the average phase velocity. The SVD of B can obtain the average phase velocity for each time period, and ν can be expressed as
Finally, the cumulative deformation over a specific period is determined. At this point, the surface deformation results are acquired for the radar line-of-sight direction of displacement, and the predominant ground subsidence in Nansha manifests as vertical displacement. Therefore, a transformation is essential to disregard horizontal displacement and preserve the vertical displacement.
where dLOS is the displacement in the radar line-of-sight direction, dv is the vertical displacement after projection transformation, and θ is the local incidence angle.
Derived from the aforementioned principles, the SBAS-InSAR technology process is segmented into six primary steps, encompassing the generation of connection graphs, interferometric workflow, orbit refinement and reflatting, first inversion, second inversion, and geocoding.
2.3.2. Risk Evaluation Methods
Ground subsidence is influenced by various interconnected factors, necessitating a thorough and scientific approach to its risk evaluation. This requires a comprehensive consideration of the interplay between subsidence and natural, social, economic, and environmental systems. The construction of an indicator system should systematically eliminate redundancy and repetition, emphasizing dominant factors and adhering to principles of maneuverability, measurability, completeness, and effectiveness [48,49]. Researchers have explored the application of InSAR in evaluating surface deformation risks related to urban geohazards like ground subsidence and secondary natural geohazards such as landslides. However, these studies underscore the adaptability of the risk evaluation system, meaning that indicators within the system can be added, deleted, or modified based on the actual circumstances and attributes of the study area [23,48,50].
Based on this, this study centers on the specific attributes of the Nansha District. Employing the literature research method and drawing guidance from the “Guidelines for Geological Hazard Risk Evaluation” and the “Implementation Rules for Geological Hazard Risk Evaluation in Guangdong Province”, we extensively gathered and systematically organized potential indicators for urban ground subsidence risk evaluation. Ultimately, six representative indicators were chosen, encompassing susceptibility indicators (soft-soil thickness, building density, and subsidence velocity) and vulnerability indicators (population density, engineering importance, and transportation pipeline buffer zones) (Table 1 and Table 2). The weights assigned to each evaluation indicator and the value of the composite index were determined through the expert review method and the composite index method. The calculation of the composite index applied in the evaluation of susceptibility and vulnerability is expressed by the following formula:
where S is the value of the susceptibility comprehensive index, is the value of the evaluation indicator measure, is the weight of the evaluation indicator, and n is the number of evaluation indicators.
where V is the value of the vulnerability comprehensive index, is the value of the evaluation indicator measure, is the weight of the evaluation indicator, and m is the number of evaluation indicators.

Table 1.
Ground subsidence susceptibility evaluation index and grading assignment.
Table 2.
Ground subsidence vulnerability evaluation index and grading assignment.
The visual expression was carried out by spatial analysis methods such as GIS interpolation analysis, reclassification, and raster computation. Based on the above results, a risk matrix of nine risk categories and five risk levels for ground subsidence in Nansha District was established, and a three-level evaluation index system was constructed (Figure 3) [50], with a view to laying a theoretical foundation for the visualization and zoning of urban geohazard risk of ground subsidence in Nansha District.
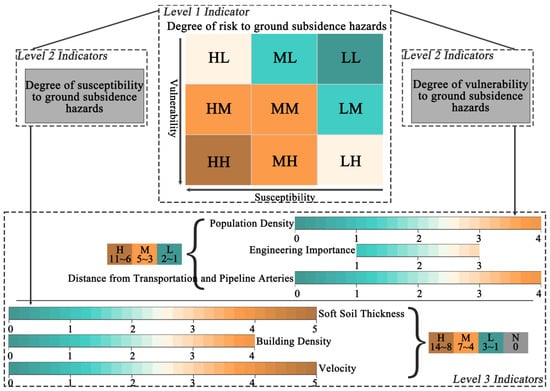
Figure 3.
Evaluation system of three-level indicators of ground subsidence risk in Nansha District. From top to bottom, the first level is the risk evaluation indicator expressed as the risk matrix, and the color is from orange to green, with gradually decreasing riskiness. The second level includes vulnerability and susceptibility evaluation indicators. The third level includes soft-soil thickness, building density, and subsidence velocity indicators corresponding to the susceptibility indicators, population density, building importance, and distance from transportation pipelines corresponding to the vulnerability indicators. The assigned values and corresponding ranges of the indicators can be found in Table 1 and Table 2, as well as in Figure 2. In the figure, H indicates a high degree, M indicates a medium degree, L indicates a low degree, and N indicates no degree.
2.4. Data Sources
A dataset comprising 49 ascending-orbit Sentinel-1A images, spanning from 12 December 2015 to 18 June 2019, was procured. The key attributes of these images include an interferometric wide swath (IW) imaging mode, a wavelength of 5.63 cm, a spatial resolution of 5 m × 20 m, and vertical transmission vertical reception (VV) polarization. To mitigate the impact of orbit errors and topographic undulations, Sentinel-1A satellite precision orbit ephemerides with a positioning accuracy better than 5 cm and AW3D-DEM data from JAXA/EORC (spatial resolution of 30 m, elevation accuracy of 5 m) were employed. Subsequently, information regarding the subsidence rate and cumulative subsidence was derived for 1,061,747 SBAS-InSAR monitoring points across the entire Nansha District throughout the study period. Furthermore, settlement data from field borehole monitoring points were acquired to validate the accuracy of InSAR monitoring. Additional datasets, including field borehole monitoring data on soft-soil thickness, hydrogeological data, and high-precision optical remote sensing images, were obtained for analyzing factors influencing ground subsidence. These borehole datasets were sourced from the “Guangzhou Multi-Element Urban Geological Survey” project. The comprehensive ground subsidence risk evaluation incorporated socio-economic condition category data, encompassing project building density, population density, and project importance. This multidimensional approach aims to provide a thorough understanding of the complex dynamics associated with ground subsidence in the Nansha District.
3. Results
3.1. Ground Subsidence Spatial and Temporal Distribution Characteristics
3.1.1. Spatial Distribution Characteristics
The topography of the Nansha District is marked by elevated central regions and lower peripheral areas, primarily comprising plains and low-hill terraces (Figure 1a). Given Nansha District’s coastal position, low average elevation, and the presence of thick soft land layers, it is susceptible to ground subsidence hazards and associated risks. Monitoring results indicate that ground subsidence in Nansha District demonstrates a spatial distribution characterized by overall subsidence across the entire area and localized subsidence in specific regions. As illustrated in Figure 4a, overall ground subsidence is evident throughout Nansha District, with an average subsidence velocity of −5.45 mm/a and a maximum velocity of −167.66 mm/a, notably observed at the southernmost end of Longxue Street. The district is broadly categorized into two subsidence zones: the northwestern region (encompassing Dongyong Town, Huangge Town, Nansha Street, Hengli Town, Dagang Town, and Lanhe Town), where the subsidence rate ranges from −20 to 0 mm/a, exhibiting sporadic instances of uplift within certain areas. Additionally, the southeastern subsidence area (encompassing Zhujiang Street, Longtan Street, and Wanqingsha Town) features a subsidence velocity ranging from −100 to −20 mm/a, characterized by significant internal subsidence dynamics.

Figure 4.
The spatial distribution of subsidence velocity at the SBAS-InSAR monitoring sites in Nansha District is shown in (a), with the redder color indicating the larger subsidence velocity; the characteristics of the spatial distribution of the subsidence rate in the whole area obtained by geostatistical analysis (kriging interpolation) are shown in (b), with the redder color indicating the larger subsidence rate, and there are four key subsidence zones (A, B, C, and D). A, B, C, and D subsidence zones correspond to the optical remote sensing images (with a spatial resolution of 0.55 m) of the early and end moments of the InSAR monitoring period, and the areas where significant land cover changes (areas selected by white dotted rectangular borders) are shown in (c).
The kriging interpolation results depicting subsidence rates across the 1,061,747 InSAR monitoring points are elucidated in Figure 4b, delineating priority subsidence areas. These areas include the northeastern segment of Dongyong Town (referred to as Zone A subsidence), the junction of Huangge Town and Nansha Street (referred to as Zone B subsidence), the southeastern part of Dagang Town (referred to as Zone C subsidence), and the southern part of Longxue Street and Wanqingsha Town (referred to as Zone D subsidence). The spatial patterns observed in Nansha District reveal a tilted extension of subsidence from inland to the coast, the enlargement of subsidence funnel areas, and the deepening of subsidence. This characteristic may be linked to the functional planning of urban areas. In Nansha District, Longxue Street and Wanqingsha Town coastal areas are hubs for a thriving port transportation industry. Additionally, these areas are frequently targeted for reclamation and land expansion. Consequently, subsidence tends to be tilted and intensified towards these specific areas to some extent. Examination of optical remote sensing images (with a spatial resolution of 0.55 m) captured at the study period’s initial and final moments for key subsidence zones reveals notable land-use changes. These changes are manifested in the proliferation of village and town buildings along the river in Zone A, the expanding coverage of high-rise buildings in Zone B, and extensive engineering and construction activities in Zones C and D (Figure 4c).
3.1.2. Temporal Evaluation Characteristics
The temporal evolution characteristics of ground subsidence in Nansha District reveal overarching phase changes and the sporadic and irregular emergence times of key subsidence zones. As depicted in Figure 5a, subsidence zones B and C materialized on 16 May 2016, while zones A and D became apparent on 20 August 2016. By this date, a mesh-sieve-like subsidence pattern, resulting in cumulative subsidence within the range of −20 mm, had encompassed the entire district. Notably, the B subsidence zone transitioned from negative to positive ground deformation in the year leading up to October 2017. Conversely, the D subsidence zone, having a pronounced impact on urban development since its inception, exhibited a notable subsidence dominance surpassing the other three subsidence zones. As of 18 June 2019, the average cumulative subsidence across the entire area is −8.63 mm, with the maximum cumulative subsidence reaching −533.28 mm, concentrated in the southern part of Longxue Street. It is noteworthy that this location does not align with the spatial location of the maximum subsidence rate. In conclusion, the emergence of four key subsidence areas sequentially over time suggests that ground subsidence in Nansha District is not a uniform, general subsidence across the entire area. Instead, there exist specific subsidence transportation paths and changing patterns.
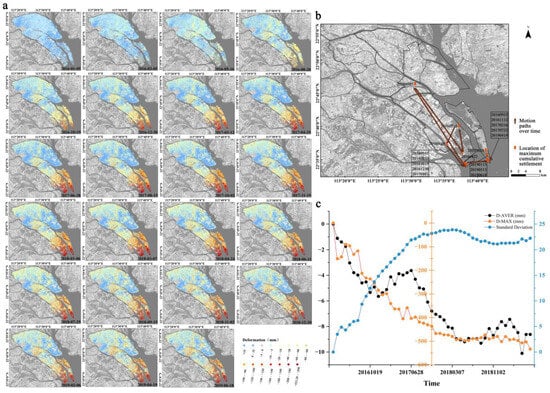
Figure 5.
The temporal variation in the typical time cumulative subsidence in Nansha District is shown in (a). The transport of the location of the maximum cumulative subsidence in each period is shown in (b), in which the orange arrow indicates the direction of the transport, and the initial moment is 20160105. Since there is a situation in which the spatial location of the maximum cumulative subsidence at different times has not been transported, the time record indicates only the moment of the sudden change in the location. The mean cumulative subsidence, maximum cumulative subsidence, and standard deviation of subsidence over time are shown in (c).
In Figure 5b, the trajectory of the location exhibiting the maximum cumulative subsidence in Nansha follows a path from southern Wanqingsha Town to central Hengli Town, then south-central Wanqingsha Town, northeastern Wanqingsha Town, west-central Wanqingsha Town, southern Wanqingsha Town, and finally southern Longxue Street. This trajectory illustrates an initially disorganized dispersion of spatial distribution before August 2016, followed by an agglomeration of spatial distribution afterward. The spatial location of the maximum cumulative subsidence often coincides with the subsidence center, serving as an indicator of the current subsidence base and potential future subsidence to some extent. Consequently, the subsidence hazard in the early stages in Nansha District is situated in the hinterland of the study area, gradually moving southward in the later stages under the influences of urban construction and soft-soil compaction. In Figure 5c, the temporal evolution of subsidence in the entire area unfolds in four discernible stages: accelerated subsidence, slow uplift, sharp subsidence, and uneven lifting. These stages are demarcated by three key time nodes—6 December 2016, 28 June 2017, and 18 May 2018. The numerical dispersion of cumulative subsidence progressively increases over time, reaching saturation on 8 September 2017, marking the onset of a stable differential subsidence state across the entire area.
3.1.3. Verification of Monitoring Accuracy
This study involved the acquisition of annual average subsidence velocity and cumulative subsidence data from 57 field borehole monitoring points in Nansha District. We extracted information from neighboring InSAR monitoring points using each field borehole monitoring point as a reference, subsequently conducting a linear fitting process to obtain the fitting results for ground subsidence velocity in the district (as illustrated in Figure 6a). Furthermore, considering the actual circumstances, we analyzed the time series changes in cumulative subsidence for eight individual field measurement points with extended effective overlapping periods between the two methods, employing a fitting process to align field measurements and InSAR monitoring data (as depicted in Figure 6b). The accuracy of the experimental monitoring was validated based on these two fitting results. Additionally, we documented observable subsidence phenomena at key locations through field research photography, providing supplementary evidence to verify the accuracy of the experimental outcomes. Through the above experiments, we found that the SBAS-InSAR monitoring results and the field monitoring results were in significant agreement, with both R2 and Pearson coefficients indicating the reliability of the ground subsidence monitoring results of SBAS-InSAR technology.
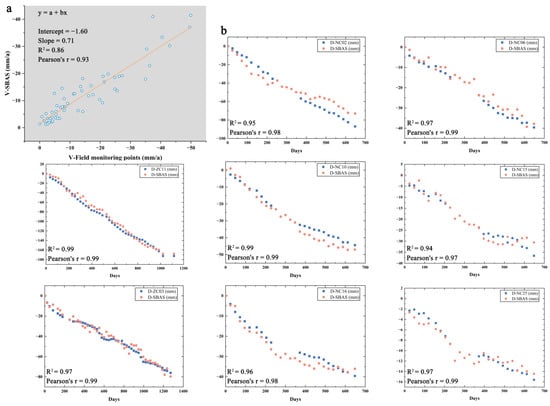
Figure 6.
The result of linear fitting of the subsidence velocity of the 57 field sites in Nansha District to the adjacent InSAR monitoring sites is shown in (a); the results of linear fitting of the cumulative subsidence of the individual field sites to the adjacent InSAR monitoring sites are shown in (b). In the figure, “V-” represents the subsidence velocity, and “D-” represents the cumulative subsidence.
Figure 6 illustrates that the field sites and InSAR monitoring sites exhibit commendable fitting results for ground subsidence velocity, boasting an R2 value of 0.86 and a Pearson’s coefficient of 0.93. Furthermore, concerning the trend and amplitude of the temporal changes in cumulative subsidence at individual field sites and adjacent InSAR monitoring sites, the fitting results are highly satisfactory, supported by a linear fitting analysis yielding R2 and Pearson’s coefficient values exceeding 0.95. Notably, the time-series changes in subsidence at the ZC11 field measurement site closely align with the SBAS-InSAR results. These findings affirm the robust alignment of this study with InSAR experimental subsidence data, encompassing both the subsidence velocity across all field measurement points and the temporal sequences of cumulative subsidence values for individual field measurement points. The R2 or Pearson’s coefficient often exceeds 0.9, which indicates a good fitting result, so we believe that the SBAS-InSAR experiments in this study have a high accuracy and the experimental results are as expected.
3.2. Factors Affecting Ground Subsidence
3.2.1. Effect of Soft-Soil Thickness on Ground Subsidence
The distribution of 164 soft-soil boreholes in Nansha District is depicted in Figure 7a. The overall soft-soil thickness exhibits a shallow zone ranging from 0 to 15 m in the northwestern part of the district and a deep zone ranging from 25 to 45 m in the southeastern part of the district. The spatial distribution of soft-soil thickness is characterized by the tilted extension of soft-soil thickness from the inland to the coast, accompanied by the expansion of the area and deepening of thickness in localized areas. Notably, these localized areas of deep thickness spatially align with the identified key subsidence zones. Qualitatively, there is a convergence observed between the spatial distribution characteristics of soft-soil thickness and ground subsidence.

Figure 7.
The distribution of 164 soft-soil thickness borehole locations and the results of GIS kriging interpolation processing in Nansha District are shown in (a). The Lower Hengli Channel–Wanqingsha Town–Xinken Community–Nanhai section of the engineering geological profile is shown in (b). The following table is a brief explanation of the geotechnical stratum, in which the yellow highlighted part corresponds to the geotechnical type of soft soil. The result of the correlation analysis of the soft-soil borehole monitoring value and the ground subsidence rate value is shown in (c). To visualize the correlation characteristics of both, here, the subsidence rate is expressed as a positive value, and the larger the value is, the greater the rate of subsidence.
Quantitatively, the linear function has an R2 of 0.59 and a Pearson coefficient of 0.77, and the nonlinear function Boltzmann model has an R2 of 0.62, thus indicating a positive correlation between soft-soil thickness and subsidence velocity. This correlation implies that ground subsidence tends to intensify with the deepening of soft-soil thickness. Specifically, at monitoring locations where the soft-soil thickness exceeds 30 m, the subsidence velocity increases significantly, surpassing −30 mm/a. During this period, the mean subsidence velocity rises to −44.58 mm/a, with the maximum subsidence velocity reaching −75.04 mm/a (Figure 7c). It is worth noting that the monitoring points with subsidence rate exceeding −50 mm/a do not correspond to large soft-soil thicknesses, which appear to be significantly offset. These points were investigated to be distributed on both sides of the river and in the coastal area, thus indicating that the effect of soft-soil thickness on ground subsidence is significantly amplified in areas close to the water system.
Furthermore, we acquired the vertical spatial distribution of soft-soil thickness along the section extending from the Lower Hengli River Channel to Nanhai by reconstructing the engineering geologic profile (Figure 7b). This analysis revealed that the Quaternary stratum’s thickness ranges approximately from 40 to 50 m, primarily composed of silt, silty sand, and silty clay. These geological characteristics render the stratum highly susceptible to urban geological hazards associated with ground subsidence, attributed to its physical properties such as high compressibility, low bearing capacity, and pronounced interaction with overlying static and dynamic loads [51]. The mentioned physical properties of the soft soil in Nansha District entail that an increase in the thickness of the soft soil results in greater pressure exerted by the soil layer above on the layer below. This prompts increased susceptibility to compaction in the soft-soil layer below. Simultaneously, a thicker soft-soil layer intensifies the stress-transferring effect when surface loads are transferred to the soil layer below, consequently exacerbating ground subsidence.
3.2.2. Effects of Groundwater Extraction on Ground Subsidence
Hydrogeological information pertaining to Nansha District, encompassing the spatial distribution of groundwater types and groundwater quality across various mineralization ranges, is depicted in Figure 8a. In correlation with groundwater quality, Figure 8b illustrates the quantification of the groundwater area at distinct mineralization levels, specifically delineating the portion of each level utilized for aquaculture purposes. Predominantly, Nansha District featured brackish water, covering a total area of 526.65 km2, with slightly brackish water constituting 42.30% of this expanse, followed by brackish water and semi-brackish water. Notably, the aquaculture area in brackish water constituted 72.3% of the total area, concentrated spatially in the southern region of Wanqingsha Town and the majority of Longxue Street. Upon investigation, we discovered that a substantial volume of groundwater was extracted for brackish water aquaculture in these regions. Extraction primarily occurred during the initial stages of shrimp aquaculture, notably in April and August each year. At other times, minimal groundwater extraction was observed, primarily for replenishing the shrimp ponds. Our experimental analysis revealed a temporal alignment between the cumulative subsidence detected by InSAR and the phased process of groundwater extraction.
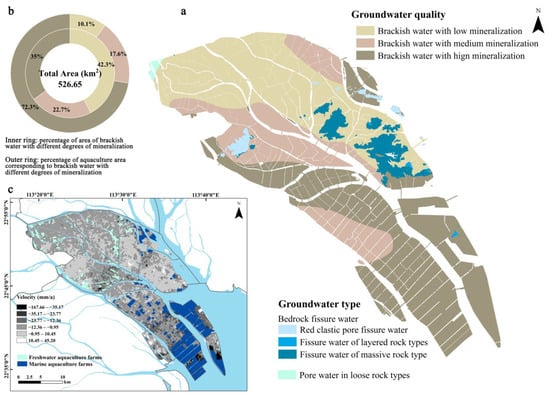
Figure 8.
Hydrogeological information of Nansha District, including groundwater type and groundwater quality, is shown in (a), in which the groundwater type is divided into bedrock fissure water with blue patches and loose rock pore water with green patches, and the groundwater quality is divided into slightly salty water in the range of 1–3 g/L mineralization, semi saline water in the range of 3–10 g/L mineralization, and salty water in the range of mineralization >10 g/L. The proportion of the area of groundwater with different mineralization levels and the respective proportion of the area applied to aquaculture are shown in (b). The spatial distribution of subsidence velocity and fresh (marine) water aquaculture is shown in (c).
The subsidence velocity data derived from SBAS-InSAR underwent kriging interpolation and standard deviation stretching sequentially. Subsequently, a comprehensive analysis was conducted, integrating this processed data with the spatial distributions of freshwater aquaculture and marine aquaculture using the GIS spatial overlay analysis method. As illustrated in Figure 8c, freshwater aquaculture predominates in the northwestern region of Nansha District, whereas marine aquaculture prevails in the southeastern region. Notably, the spatial distribution of aquaculture aligns with the overall pattern of subsidence, characterized by scattered uplift in the −20~0 mm/a range in the northwestern subsidence area and prominent subsidence in the −100~−20 mm/a range in the southeastern subsidence area. At a local scale, the concentration areas of aquaculture patches exhibit a high degree of consistency with the A, B, C, and D subsidence zones. This observation underscores the impact of groundwater extraction on ground subsidence, particularly under the influence of soft-soil consolidation across the entire region. In conclusion, groundwater extraction in Nansha District, primarily employed for aquaculture, significantly influences the temporal variation and local spatial characteristics of subsidence.
3.2.3. Effects of Ground Loads on Ground Subsidence
The B subsidence zone, encompassing Nansha Street and Huangge Town in Nansha District, exhibits high population densities with both registered and floating populations. Additionally, this zone demonstrates elevated development intensity, characterized by a densely distributed urban infrastructure. To investigate the correlation between ground loading and ground subsidence, we initiated our analysis from the B subsidence zone due to its distinctive characteristics.
Information pertaining to InSAR monitoring points within and around the B subsidence zone was extracted. As depicted in Figure 9a, the average subsidence velocity flanking both sides of the Jiaomen waterway within the B subsidence zone falls within the range of −40 to −10 mm/a, with the maximum subsidence velocity reaching −54.22 mm/a and cumulative subsidence exceeding −200 mm. This has led to the development of an inclined pattern of ground subsidence extending from the northwest and southeast sides toward the interior of the Jiaomen Waterway.
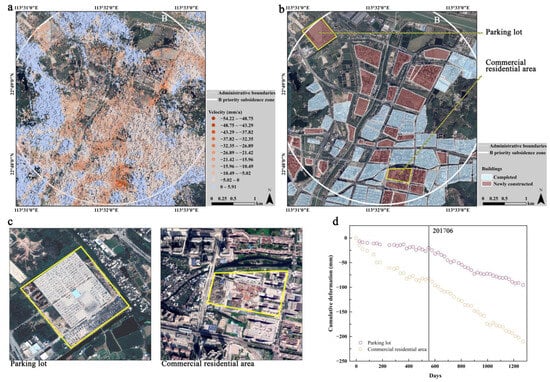
Figure 9.
The subsidence velocity information of the B subsidence zone in Nansha District is shown in (a); the distribution of the newly added sites and completed sites in the B subsidence zone during the study period is shown in (b), where the yellow boxed area is the location of the site in (c); the remote sensing images of the parking lot and the commercial residential area among the newly added sites (with a spatial resolution of 0.30 m) are shown in (c); the cumulative subsidence change in the parking lot and the commercial residential area sites is shown in (d).
In terms of spatial characteristics, Google historical images, with a spatial resolution of up to 0.3 m, spanning from 21 October 2015 to 18 November 2019, were procured. We verified the primary newly developed and constructed sites within the B subsidence zone throughout the study period through field investigations and visual interpretation of remote sensing images, as depicted in Figure 9b. The outcomes of our field investigation and comparative analysis revealed extensive engineering and construction activities conducted on soft-soil foundations within the B subsidence zone during the study period. Notably, the newly developed sites constituted 41% of the total land area allocated for construction, displaying a notable congruence with the conspicuous locations of subsidence concerning spatial distribution.
In terms of temporal characteristics, we conducted a detailed examination of a parking lot and a commercial residential area within the B subsidence zone. Illustrated in Figure 9a,c,d, the subsidence velocity in the parking lot predominantly ranges from −30 to −15 mm/a, with an average subsidence velocity of −21.12 mm/a and an average cumulative subsidence of −71.73 mm. Notably, the absence of soft foundation treatment during the initial construction phase led to self-consolidation of the soft soil, maintaining a subsidence velocity of −13.08 mm/a. The completion and utilization of the parking lot around June 2017 marked the commencement of a significant increase in subsidence velocity, attributed to the static load compaction from numerous parked vehicles and human activities. In the commercial residential area, identified as experiencing the most pronounced subsidence within the B subsidence zone, the overall average subsidence rate was −33.27 mm/a, with a maximum cumulative subsidence reaching −209.96 mm. As depicted in Figure 9d, the ground surface in the commercial residential area exhibits a substantial and consistent subsidence process, indicating that the feedback of ground subsidence from high-rise buildings is continuous and more impactful compared to low-rise buildings.
The influencing factors of ground subsidence in the Nansha District can be summarized and categorized as follows:
- (1)
- Ground subsidence across the entire domain is primarily influenced by the thickness of soft-soil deposits, exhibiting a significant positive correlation.
- (2)
- Ground subsidence in the broader domain is mainly influenced by groundwater extraction, and variations in subsidence align with seasonal changes in aquaculture.
- (3)
- Ground subsidence in localized areas is primarily affected by ground loading, with significant subsidence phases corresponding to different stages of engineering projects, indicating substantial ground disturbance induced by these activities.
Through an amalgamation of both overarching and localized influencing factors, the urban geohazard of ground subsidence manifests as a phenomenon characterized by complexity, diversity, and comprehensiveness.
3.3. Evaluation of Ground Subsidence Risk
3.3.1. Ground Subsidence Susceptibility
The susceptibility to ground subsidence in Nansha District is primarily influenced by the geological conditions of soft soil, anthropogenic disturbances, and the existing foundation of subsidence. In this study, considering the monitored ground subsidence, pertinent influencing factors, and the availability of supplementary data in Nansha District, we opted for subsidence rate (Figure 10a), soft-soil thickness (Figure 10b), and the density of engineered buildings (Figure 10b) as the assessment indicators for susceptibility. The assignment of grades for each indicator was determined through the synthesis of expert evaluations, as illustrated in Table 1.
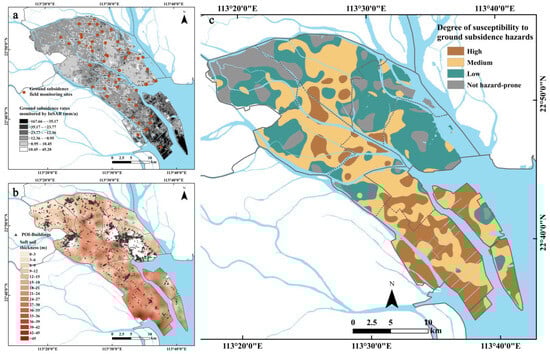
Figure 10.
The monitoring information of ground subsidence in Nansha District is shown in (a), where the background is the result of the subsidence rate of InSAR monitoring points after kriging interpolation and standard deviation stretching, and the orange dots indicate the field measurement sites. The distribution of building POI points in Nansha District is shown in (b), where the background is the result of soft-soil thickness grading. The result of ground subsidence susceptibility grading in Nansha District obtained based on the subsidence rate, soft-soil thickness, and density of building POI points is shown in (c).
Figure 10c delineates the zoning of ground subsidence susceptibility across the entirety of Nansha District, as derived from the application of the comprehensive index method and GIS superposition analysis. The susceptibility pattern for the entire district exhibits a decreasing trend from the center to the periphery and from the coast to the inland. High susceptibility zones manifest as discrete blocks in Dongyong, Dagang, Hengli, and Huangge towns, mirroring the spatial characteristics of the northwestern subsidence zones. In contrast, these zones are concentrated in Zhujiang Street, Waningsha Town, and Longxue Street, resembling the spatial features of the southeastern subsidence zones, covering a total area of 134.98 km2. The high susceptibility areas are situated in deep soft-soil regions within the delta alluvial plain, where soft-soil thickness exceeds 20 m. Predominantly located in commercial, residential, and industrial areas with high construction intensity and significant ground subsidence development, these regions exhibit an annual subsidence velocity mostly ranging from −40 to −15 mm/a, with local areas surpassing −80 mm/a and cumulative subsidence reaching −200 mm. Additionally, the medium-susceptible area spans approximately 239.09 km2, the low-susceptible area encompasses around 192.86 km2, and the nonsusceptible area covers approximately 100.24 km2. We advocate prioritizing “prevention” strategies for ground subsidence in the high susceptibility zones. This necessitates careful consideration in urban planning, design, and construction activities to mitigate the source of disasters and proactively prevent their occurrence.
3.3.2. Ground Subsidence Vulnerability
The vulnerability to subsidence is predominantly influenced by the inherent characteristics of the disaster-bearing body itself and the socioeconomic conditions. Drawing on statistical yearbook data and point of interest (POI) data specific to Nansha District, we have chosen population density (Figure 11a), engineering significance, and proximity to the primary transportation pipeline’s mainline (Figure 11b) as indicators for vulnerability evaluation. Additionally, Yang et al.’s work [52] on China’s land cover data, with a spatial resolution of 30 m, has been referenced to elucidate population density. The assignment of grades for each indicator has been determined through the amalgamation of outcomes from expert reviews, as depicted in Table 2.
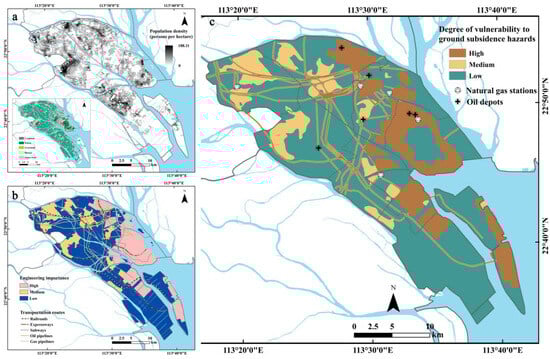
Figure 11.
The population density raster information of Nansha is shown in (a). The engineering importance zoning and the distribution of important transportation routes in Nansha District are shown in (b). The vulnerability grading results of the ground subsidence in Nansha District based on the population density, engineering importance, and distance from the transportation pipeline trunk line are shown in (c). In the figure, the dashed lines indicate the administrative boundaries of towns and streets within Nansha District, and the solid lines indicate the administrative boundaries of districts within Guangzhou City.
Figure 11c illustrates the vulnerability degree to ground subsidence in Nansha District, employing the comprehensive index method and GIS superposition analysis. The entire area displays a pattern characterized by the discrete distribution of medium and high vulnerability, forming clusters or lines based on low subsidence vulnerability. The highly vulnerable areas are concentrated in key planning zones of Nansha, including Nansha Street, Qing Sheng Hub Area, Harbor Area, Nansha Bay Area, Jiaomenhe Central Area, Pearl Bay Starting Area, Nansha Hub Area, and Wanqing Sha Bonded Port Processing and Manufacturing Area. They are also arranged in a strip-like fashion along vital hubs such as key oil and gas pipelines and transportation arteries, encompassing an approximate area of 161.56 km2. Furthermore, the medium vulnerability zone covers an area of about 91.94 km2, while the low vulnerability zone spans approximately 413.66 km2. Notably, oil depots and gas stations in Nansha are widely distributed in the northeast, with many situated within or close to highly vulnerable zones. Therefore, special attention must be given to potential operational disruptions, pit maintenance, and the protection of life and property during oil and gas extraction activities. Similarly, routine maintenance and inspections are essential for subways, oil and gas pipelines, and crucial highway arteries to mitigate resource wastage and potential traffic accidents stemming from changes in ground elevation.
3.3.3. Ground Subsidence Risk Evaluation
Fang et al. [53] previously conducted a ground subsidence risk assessment in Cangzhou City, Hebei Province, offering an illustrative example. They established a three-tiered risk evaluation indicator system, comprising ground subsidence risk as the first-level indicator and ground subsidence susceptibility and vulnerability as second-level indicators, further delving into the impacts and driving factors at the third level. The evaluation of ground subsidence risk is rooted in the comprehensive assessment outcomes of both susceptibility and vulnerability. Building upon this framework, we amalgamated the susceptibility zones into four degrees—high, medium, low, and non-susceptible (as shown in Figure 10c)—and the vulnerability zones into three degrees—high, medium, and low (as depicted in Figure 11c). We conducted a GIS reclassification assignment, ultimately yielding the degree of ground subsidence risk across the entirety of Nansha District (Figure 12a). Furthermore, optical remote sensing images (acquired in 2022, with a spatial resolution of up to 0.28 m) and ground elevation raster data (spatial resolution up to 8.81 m) from high-risk, high-level zones were extracted for an in-depth analysis of the specific impacts of ground subsidence on urban construction.

Figure 12.
Based on the results of ground subsidence susceptibility and vulnerability results, the results of ground subsidence risk grading in Nansha District are shown in (a), and the risk is graded into three grades, namely, high, medium, and low, and each grade is subdivided into high, medium, and low. The high-risk high-level zones contain a total of six typical zones (see orange boxed areas in (a)), and the optical remote sensing images (spatial resolution up to 0.28 m) and elevation raster information (spatial resolution up to 8.81 m) of each zone are shown in (b).
Figure 12a shows that the subsidence risk in Nansha District exhibits a diminishing trend from the central regions to the periphery and from the coastal areas to the inland. The high-risk zone is further categorized into high, medium, and low-risk segments, encompassing a total area of 133.16 km2. Specifically, the high-risk, high-level zones concentrate in strategic areas such as the Pearl Bay Starting Area, Nansha Hub Area, Wanqingsha Bonded Port Processing and Manufacturing Area, and Nansha Harbor Operation Area. These zones, characterized by soft-soil depths exceeding 25 m and vibrant human production activities, exhibit a pronounced propensity for subsidence. Notably, the subsidence velocity in this region ranges from −80 to −40 mm/a, with the Nansha Harbor Operation Area experiencing a maximum subsidence velocity surpassing −140 mm/a. High-risk high-level zones, such as HH1 to HH4 (as delineated in Figure 12b), showcase concentrated population and economic development. Conversely, HH5 and HH6 encompass extensive areas laden with materials such as large containers, playing a pivotal role in logistics and transportation (as depicted in Figure 12b). In terms of natural conditions, the ground elevations of HH1 to HH6 are consistently lower than those of Nansha District and even the PRD. This juxtaposition of low elevation with the high-risk subsidence zone renders the region vulnerable to natural disasters such as typhoons, storm surges, and floods. This susceptibility poses a threat to the safety of lives and property, exerting significant impacts on logistics, transportation, and the economic development of the Greater Bay Area (GBA). Moreover, the areas of the medium- and low-risk zones cover approximately 297.06 km2 and 146.73 km2, respectively.
Longxue Street, as a distinctive island within Nansha District, has undergone extensive land reclamation and shoreline relocation activities, as illustrated in Figure 13a. The sedimentation dynamics in this area warrant scrutiny. The bathymetric features near the shore are influenced by both islands and watercourses, resulting in variable bathymetry along the shore and locally dense bathymetric contours near watercourses (Figure 13d). The nearshore waters of Longxue Street exhibit predominantly fine surface sediments, with sandy mud being the most prevalent. Furthermore, the grain size of bottom-bed sediments in these waters displays a distinctive pattern of larger grains near the shore transitioning to smaller grains offshore. This long-term transport trend indicates an outward expansion, notably connecting with Wanqingsha Town, Zhujiang Street, and Nansha Street (Figure 13b,c). Longxue Street is particularly susceptible to ground subsidence due to a confluence of factors, including the enrichment of soft soil, low elevation, extensive land reclamation projects, and the handling and loading of large containers at the port.
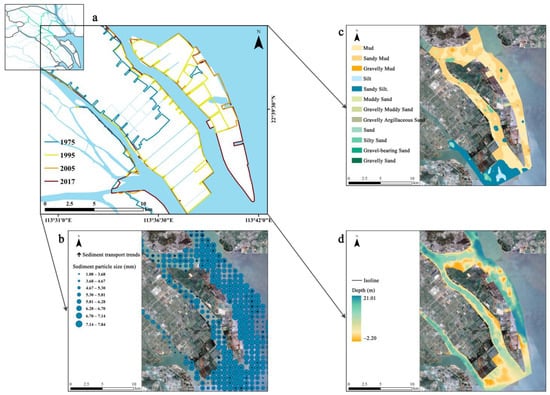
Figure 13.
The evolutionary line of land reclamation in Longxue Street, Nansha District, is shown in (a), where the green lines indicate the administrative boundaries of the towns and streets contained within Nansha District. The particle size of the sediments in the nearshore waters (blue circle size indicates the size of the particle size) and the sediment transport trend (black arrows of different lengths and directions) are shown in (b) (from the projects of “Marine Regional Geological Survey of the Inner Lingding Sea in the Pearl River Estuary” and “Integrated Geological Survey of Land and Sea in the Pearl River Estuary (Longdan Island)” conducted by the Guangzhou Marine Geological Survey). The distribution of sediment types in the nearshore waters is shown in (c) (from the particle size analysis data of surface sediment samples from 925 stations collected by the Guangzhou Marine Geological Survey in 2018 and 2019). The bathymetry of nearshore waters is shown in (d) (from the single-beam and multibeam bathymetric data measured by the Guangzhou Marine Geological Survey in 2018).
This study utilized Nansha District as a case study and conducted a comprehensive risk assessment based on the susceptibility and vulnerability to ground subsidence. To mitigate the potential disaster impact of ground subsidence, tailored measures should be implemented according to the categorized risk levels. Specifically, high-precision surface deformation monitoring equipment should be deployed in areas designated as HH1 to HH6. Given the primary influencing factors of ground subsidence in Nansha District, strategic measures aligned with policies, such as soft foundation treatment for engineering construction [54], groundwater restriction and recharge [55], and routine inspection and maintenance of subsidence-prone areas, should be adopted. Enhancing the monitoring and early warning infrastructure for ground subsidence across the entire region, bolstering the capacity to manage ground subsidence, and effectively slowing down the progression of ground subsidence are crucial steps. These endeavors will furnish a scientific foundation for optimizing the urban layout of Nansha District, fostering the sustainable development of Guangzhou.
4. Discussion
This study provided a systematic analysis of urban ground subsidence in Nansha District, focusing on three primary facets: spatial and temporal distribution, influencing factors, and risk evaluation. Notably, the study exhibits a higher level of research depth in terms of content and a more integrated approach in terms of technique and methodology compared to prior investigations. We enhanced the quantitative analysis of subsidence influencing factors and supplemented the subsidence risk evaluation based on the spatial and temporal characterization of subsidence.
To initiate our investigation, we employed the SBAS-InSAR technique to scrutinize the prolonged time series of ground subsidence in Nansha District spanning from 12 December 2015 to 18 June 2019. The spatial pattern of general subsidence across the entire area, coupled with distinct local subsidence in Nansha District, aligns with subsidence trends observed in several reclaimed urban regions in Asia, including Xiamen [56], Zhuhai [57], and Dalian [58] in China; Mokpo [59] in South Korea; Karachi [60] in Pakistan; and Penang [61] in Malaysia. Nevertheless, due to varying urban functions and development trajectories, each city exhibits unique temporal subsidence characteristics. Nansha District essentially concluded the large-scale construction of the land reclamation project in 2017 (Figure 13a). This study reveals that in the late stage of the project construction (post-2017), the temporal sequence of subsidence in Nansha District transitioned through three processes: slow lifting, sharp subsidence, and uneven lifting. This implies that coastal soft-soil subsidence is not a linear process; rather, it gradually saturates and stabilizes over time. Current studies on the temporal dynamic characteristics of coastal subsidence generally do not delineate distinct subsidence periods, and this study makes strides in addressing this aspect. This investigation extends the temporal scope of surface deformation monitoring in Nansha District and contributes to the understanding of ground subsidence monitoring in coastal soft-soil urban areas. Furthermore, by utilizing field borehole monitoring data to validate the accuracy of the InSAR experiments, we achieved excellent fitting results. SBAS-InSAR monitoring is frequently influenced by vegetation and atmospheric conditions, leading to a reduction in experimental monitoring accuracy. Borehole monitoring serves as an effective means to address this limitation through highly accurate single-point monitoring. The two methods, through fitting analysis, not only help determine the accuracy of InSAR monitoring but also extend the spatial range of borehole monitoring. Our experimental results further illustrate the suitability of the SBAS-InSAR technique for deformation monitoring in coastal soft-soil urban areas amidst extensive land reclamation activities.
Subsequently, we conducted GIS spatial analysis and correlation analysis to quantitatively assess the factors influencing subsidence progression, utilizing data from soft-soil boreholes, groundwater-extraction-related records, and ground load surveys. This analytical approach addresses the deficiency of preceding qualitative inquiries into the underlying causes of subsidence. In comparison with other prominent coastal cities in China, such as Shanghai [9] and Shenzhen [62], the observed subsidence in Nansha District predominantly stems from soil consolidation and engineering construction, aligning with similar subsidence mechanisms found in those cities. However, the groundwater extraction factor introduces a distinctive dimension to the subsidence dynamics in Nansha District.
Finally, employing the expert evaluation method, comprehensive index method, risk matrix, and GIS spatial analysis technique, this study systematically categorized the vulnerability, susceptibility, and risk zones associated with ground subsidence in Nansha District. This comprehensive zoning approach, a pioneering effort, establishes a foundational framework for strategically addressing and controlling ground subsidence in Nansha District. Furthermore, it contributes essential reference indicators and an evaluation system for the comprehensive assessment of ground subsidence in urban areas characterized by coastal reclamations and soft-soil conditions.
It is imperative to delineate effective strategies for the prevention and control of coastal soft-soil subsidence by addressing key influencing factors and risk evaluation indicators. This study directs attention to three primary dimensions: soft-soil thickness, groundwater extraction, and ground loading, with the aim of formulating comprehensive measures for mitigating and managing ground subsidence in Nansha District.
Tang et al. [63] and Cui et al. [64] have demonstrated that in regions characterized by soft soil, the subsidence observed in high-density clusters of buildings surpasses that in other areas. Furthermore, a discernible superposition effect of subsidence is evident, and this effect is notably magnified with increasing distances between buildings. As the sole subcenter of Guangzhou City and the geometric center of the Greater Bay Area (GBA), Nansha District, extensively engaged in the construction of building clusters atop substantial soft-soil deposits, is confronted with palpable engineering hazards and construction challenges.
Xue et al. [65] observed that the Yangtze River Delta Plain and the Yellow Huaihai Plain, representing distinct geological backgrounds for ground subsidence in eastern China, exhibited significant correlations with groundwater extraction. Yang et al.’s [66] study outlined the evolution of subsidence in typical cities within the North China Plain over the next two decades under uncontrolled and controlled groundwater extraction scenarios. The study emphasized that subsidence funnels resulting from groundwater extraction could induce “passive subsidence” in neighboring urban areas. While prior investigations have concentrated on the exacerbation of subsidence in the North China Plain and the Yangtze River Delta Plain, they have overlooked the unique characteristics of the Pearl River Delta Plain concerning geological context and the application of groundwater extraction. Nevertheless, pertinent research has indicated that curbing groundwater extraction and implementing governmental controls can have a mitigating impact on subsidence. These findings serve as valuable references for subsidence management in Nansha District within the PRD.
Dong et al. [67] demonstrated that the establishment of upper urban infrastructure in river-sea delta regions disrupts the pressure equilibrium of the overlying strata, leading to the compression of the silt layer and consolidation of soft sediments. Building upon this, Zhou et al. [68] provided further insights, indicating that the impact of dynamic and static loads from urban activities on ground subsidence constitutes a substantial proportion, reaching up to 39.10%. Since its designation as the China (Guangdong) Pilot Free Trade Zone in 2015, Nansha District has undergone frequent and intensive urban construction initiatives and land cover renewal. The resultant ground disturbances have directly instigated extensive and severe ground subsidence in the region.
This study has established a relatively comprehensive research framework for ground subsidence in coastal soft-soil urban areas, using Nansha District as an exemplar. Throughout our research, several reflections have emerged. Firstly, many related studies have overlooked the weighting analysis of subsidence influencing factors, posing a significant obstacle to targeted prevention and control efforts. While we attempted to analyze the weight of factors affecting subsidence, some cases faced constraints in data availability, impeding the achievement of desired experimental results. Nonetheless, based on prior research and scientific conjecture, it is inferred that coastal subsidence in Nansha District is primarily influenced by the enrichment and compaction of soft soils, with the disturbance caused by groundwater extraction and surface loading playing a supplementary role in subsidence. Secondly, integrating considerations of sea level rise and coastal urban subsidence within the context of global climate change and quantitatively exploring the impact of relative sea level rise on economic infrastructure will be a focal point in the research on coastal soft-soil subsidence and potential avenues for future research. For example, integrated hazard research could encompass ground subsidence prediction, sea level rise modeling, and meteorological hazards, using typhoons as an illustrative example.
5. Conclusions
This study systematically developed a research framework for coastal ground subsidence that integrates monitoring, cause analysis, and risk evaluation, utilizing Nansha District in Guangzhou City as a case study. The findings reveal temporal variations and spatial disparities in ground subsidence in Nansha District. The widespread presence of soft soil emerges as the primary contributor to coastal subsidence, accentuated by the influence of groundwater due to aquaculture and compaction of the ground surface from engineering and construction loads. Soft-soil enrichment areas, characterized by high population density and frequent engineering activities, exhibit sustained susceptibility and vulnerability to subsidence, posing an extremely high risk. Leveraging high-precision field measurements of subsidence and soft-soil data, this study employed large-area monitoring through SBAS-InSAR technology for a comprehensive analysis of ground subsidence in Nansha District. The formulated prevention and control proposals are grounded in a robust database and offer a more comprehensive analysis process compared to prior studies. This research establishes a theoretical foundation for mitigating urban geohazards in the Nansha area and presents a systematic approach for the sustainable development of global soft-soil coastal cities. Potential areas of our future research will focus on incorporating climate change and sea level rise into studies of continuous subsidence monitoring and subsidence forecasting, as well as enhancing research on ground subsidence evaluation of the risk of collapse of different types of buildings at different stages, with the aim of enhancing our understanding of coastal subsidence and mitigation strategies.
Author Contributions
Conceptualization, L.W.; methodology, M.Z.; software, S.W.; investigation, P.P.; data curation, Z.X. and X.J.; writing—original draft preparation, P.P. and S.W.; writing—review and editing, H.S. and S.W.; visualization, H.S.; supervision, Y.P.; project administration, M.Z. All authors have read and agreed to the published version of the manuscript.
Funding
This work was supported by the Monitoring and Evaluation of Resource and Environmental Carrying Capacity of Guangdong–Hong Kong–Macao Greater Bay Area (funder: Xinwen Zhao; funding number: DD20221729), the Zhuhai Urban Geological Survey (Including Information Technology) (funders: Xinwen Zhao and Mingtao Long; funding number: MZCD-2201-008), the Guangzhou Multi-Element Urban Geological Survey (funder: Xinwen Zhao; funding number: DD20190291), and the National Natural Science Foundation of China (funder: Hongxia Peng; funding number: Grant No. 41877297).
Data Availability Statement
The raw data supporting the conclusions of this article will be made available by the authors on request.
Acknowledgments
We would like to thank JAXA/EORC for providing the AW3D-DEM data and ESA for providing the Sentinel-1 SAR images used in this study. We are very grateful for the editors and all anonymous reviewers for their constructive and excellent reviews that helped to improve the paper.
Conflicts of Interest
The authors declare no conflict of interest.
References
- Mentaschi, L.; Vousdoukas, M.I.; Pekel, J.F.; Voukouvalas, E.; Feyen, L. Global long-term observations of coastal erosion and accretion. Sci. Rep. 2018, 8, 12876. [Google Scholar] [CrossRef]
- Cigna, F.; Tapete, D. Present-day land subsidence rates, surface faulting hazard and risk in Mexico City with 2014–2020 Sentinel-1 IW InSAR. Remote Sens. Environ. 2021, 253, 112161. [Google Scholar] [CrossRef]
- Vousdoukas, M.I.; Mentaschi, L.; Voukouvalas, E.; Verlaan, M.; Jevrejeva, S.; Jackson, L.P.; Feyen, L. Global probabilistic projections of extreme sea levels show intensification of coastal flood hazard. Nat. Commun. 2018, 9, 2360. [Google Scholar] [CrossRef]
- Shirzaei, M.; Freymueller, J.; Tornqvist, T.E.; Galloway, D.L.; Dura, T.; Minderhoud, P.S.J. Measuring, modelling and projecting coastal land subsidence. Nat. Rev. Earth Environ. 2021, 2, 40–58. [Google Scholar] [CrossRef]
- Zhao, C.Y.; Liu, C.J.; Zhang, Q.; Lu, Z.; Yang, C.S. Deformation of Linfen-Yuncheng Basin (China) and its mechanisms revealed by Π-RATE InSAR technique. Remote Sens. Environ. 2018, 218, 221–230. [Google Scholar] [CrossRef]
- Zhang, Y.; Huang, H.J.; Liu, Y.X.; Liu, Y.L. Self-weight consolidation and compaction of sediment in the Yellow River Delta, China. Phys. Geogr. 2018, 39, 84–98. [Google Scholar] [CrossRef]
- Pan, Y.J.; Ding, H.; Li, J.T.; Shum, C.K.; Mallick, R.; Jiao, J.S.; Li, M.K.; Zhang, Y. Transient hydrology-induced elastic deformation and land subsidence in Australia constrained by contemporary geodetic measurements. Earth Planet Sc. Lett. 2022, 588, 117556. [Google Scholar] [CrossRef]
- Liu, Y.; Huang, H.J. Characterization and mechanism of regional land subsidence in the Yellow River Delta, China. Nat. Hazards 2013, 68, 687–709. [Google Scholar] [CrossRef]
- Li, D.; Li, B.; Zhang, Y.X.; Fan, C.; Xu, H.; Hou, X.Y. Spatial and temporal characteristics analysis for land subsidence in Shanghai coastal reclamation area using PS-InSAR method. Front. Mar. Sci. 2022, 9, 1000523. [Google Scholar] [CrossRef]
- Wu, P.C.; Wei, M.; D’Hondt, S. Subsidence in Coastal Cities Throughout the World Observed by InSAR. Geophys. Res. Lett. 2022, 49, e2022GL098477. [Google Scholar] [CrossRef]
- Su, G.L.; Wu, Y.Q.; Zhan, W.; Zheng, Z.J.; Chang, L.; Wang, J.Q. Spatiotemporal evolution characteristics of land subsidence caused by groundwater depletion in the North China plain during the past six decades. J. Hydrol. 2021, 600, 126678. [Google Scholar] [CrossRef]
- Berardino, P.; Fornaro, G.; Lanari, R.; Sansosti, E. A new algorithm for surface deformation monitoring based on small baseline differential SAR interferograms. IEEE Trans. Geosci. Remote Sens. 2002, 40, 2375–2383. [Google Scholar] [CrossRef]
- Cwiakala, P.; Gruszczynski, W.; Stoch, T.; Puniach, E.; Mrochen, D.; Matwij, W.; Matwij, K.; Nedzka, M.; Sopata, P.; Wojcik, A. UAV Applications for Determination of Land Deformations Caused by Underground Mining. Remote Sens. 2020, 12, 1733. [Google Scholar] [CrossRef]
- Liu, Z.Y.; Ng, A.H.M.; Wang, H.; Chen, J.W.; Du, Z.Y.; Ge, L.L. Land subsidence modeling and assessment in the West Pearl River Delta from combined InSAR time series, land use and geological data. Int. J. Appl. Earth Obs. 2023, 118, 103228. [Google Scholar] [CrossRef]
- Li, Y.F.; Zuo, X.Q.; Yang, F.; Bu, J.W.; Wu, W.H.; Liu, X.Y. Effectiveness evaluation of DS-InSAR method fused PS points in surface deformation monitoring: A case study of Hongta District, Yuxi City, China. Geomat. Nat. Hazards Risk 2023, 14, 2176011. [Google Scholar] [CrossRef]
- Li, Y.X.; Yang, K.M.; Zhang, J.H.; Hou, Z.X.; Wang, S.; Ding, X.M. Research on time series InSAR monitoring method for multiple types of surface deformation in mining area. Nat. Hazards 2022, 114, 2479–2508. [Google Scholar] [CrossRef]
- Huang, L.Q.; Hajnsek, I. Polarimetric Behavior for the Derivation of Sea Ice Topographic Height from TanDEM-X Interferometric SAR Data. IEEE J-Stars. 2021, 14, 1095–1110. [Google Scholar] [CrossRef]
- Ng, A.H.M.; Liu, Z.Y.; Du, Z.Y.; Huang, H.W.; Wang, H.; Ge, L.L. A novel framework for combining polarimetric Sentinel-1 InSAR time series in subsidence monitoring-A case study of Sydney. Remote Sens. Environ. 2023, 295, 113694. [Google Scholar] [CrossRef]
- Cianflone, G.; Tolomei, C.; Brunori, C.A.; Dominici, R. InSAR Time Series Analysis of Natural and Anthropogenic Coastal Plain Subsidence: The Case of Sibari (Southern Italy). Remote Sens. 2015, 7, 16004–16023. [Google Scholar] [CrossRef]
- Du, Q.S.; Li, G.Y.; Chen, D.; Zhou, Y.; Qi, S.S.; Wu, G.; Chai, M.T.; Tang, L.Y.; Jia, H.L.; Peng, W.L. SBAS-InSAR-Based Analysis of Surface Deformation in the Eastern Tianshan Mountains, China. Front. Earth Sci. 2021, 9, 729454. [Google Scholar] [CrossRef]
- Galve, J.; Pérez-Peña, J.; Azañón, J.; Closson, D.; Caló, F.; Reyes-Carmona, C.; Jabaloy, A.; Ruano, P.; Mateos, R.; Notti, D.; et al. Evaluation of the SBAS InSAR Service of the European Space Agency’s Geohazard Exploitation Platform (GEP). Remote Sens. 2017, 9, 1291. [Google Scholar] [CrossRef]
- Nayak, K.; López-Urías, C.; Romero-Andrade, R.; Sharma, G.; Guzmán-Acevedo, G.M.; Trejo-Soto, M.E. Ionospheric Total Electron Content (TEC) Anomalies as Earthquake Precursors: Unveiling the Geophysical Connection Leading to the 2023 Moroccan 6.8 Mw Earthquake. Geosciences 2023, 13, 319. [Google Scholar] [CrossRef]
- Yi, L.X.; Jiang, Y.X.; Zheng, Y.J.; Dong, L.X.; Kang, J.; Yuan, J.; Yang, Y.P. Generating strategies for land subsidence control and remediation based on risk classification evaluation in Tianjin, China. Nat. Hazards 2022, 114, 733–749. [Google Scholar]
- Dai, K.R.; Chen, C.; Shi, X.L.; Wu, M.T.; Feng, W.K.; Xu, Q.; Liang, R.B.; Zhuo, G.C.; Li, Z.H. Dynamic landslides susceptibility evaluation in Baihetan Dam area during extensive impoundment by integrating geological model and InSAR observations. Int. J. Appl. Earth Obs. 2023, 116, 103157. [Google Scholar] [CrossRef]
- Zhao, F.M.; Meng, X.M.; Zhang, Y.; Chen, G.; Su, X.J.; Yue, D.X. Landslide Susceptibility Mapping of Karakorum Highway Combined with the Application of SBAS-InSAR Technology. Sensors 2019, 19, 2685. [Google Scholar] [CrossRef] [PubMed]
- Lin, G.K. Land subsidence monitoring and influencing factors analysis in Nansha district of Guangzhou based on time series InSAR. Master’s Thesis, Guangxi University, Nanning, China, 2021. [Google Scholar]
- Zhu, S.J.; Dai, X.Z. Problems and Paths of Constructing High-Quality Development Demonstration Zone of Marine Economy—A Case Study of Nansha District of Guangzhou City. Nat. Resour. Econ. China 2022, 35, 19–23+55. [Google Scholar]
- Fan, L.; Xun, Z.Z.; Peng, S.Q. A Comparative Case Study on Drainage Consolidation Improvement of Soft Soil under Vacuum Preloading and Surcharge Preloading. Appl. Sci. 2023, 13, 5782. [Google Scholar] [CrossRef]
- Lei, H.Y.; Wang, L.; Zhang, W.D.; Jiang, M.J.; Bo, Y.; Song, W.F.; Cao, Q.G. Geotechnical properties of the South China Sea soft soil: A comparative study with the soils from Bohai Sea and Yellow Sea. Bull. Eng. Geol. Environ. 2023, 82, 158. [Google Scholar] [CrossRef]
- Zhang, Y.; Geng, J.S.; Mao, L.; Liu, F.R. Compression and Shear Deformation Properties of Marine Soft Soil Deposits in the Pearl River Delta. China Earthq. Eng. J. 2018, 40, 745–751. [Google Scholar]
- Li, X.W.; Tan, Y.M.; Xue, D.S. From World Factory to Global City-Region: The Dynamics of Manufacturing in the Pearl River Delta and Its Spatial Pattern in the 21st Century. Land 2022, 11, 625. [Google Scholar] [CrossRef]
- Zhou, A.C. Progress of the Current Situation, Development Trend and Prevention and Control of Geologic Hazards in Nansha District, Guangzhou City, China. Ground Water 2022, 44, 180–183. [Google Scholar]
- Chen, Y.L.; Kuang, C.L.; Dai, W.J.; Xie, R.A.; Lu, C.L. Land Subsidence Monitoring Using GPS Network in Nansha, Guangzhou. J. Geod. Geodyn. 2015, 35, 849–852. [Google Scholar]
- Yu, G.M.; Li, D.Z.; Qu, S.X. Analysis of the land subsidence characteristics of soft soil in Guangzhou. Shanghai Land. Resour. 2017, 38, 22–25. [Google Scholar]
- Li, G.E.; Zhou, Y.H. Study on Fusion Methods of InSAR, Leveling and GPS Data. Bull. Surv. Mapp. 2017, 9, 78–82. [Google Scholar]
- Wu, L.F.; Chen, L.W.; Peng, W.P. Research of PSInSAR Technology in Land Subsidence Monitoring in Nansha of Guangzhou. Urban. Geotech. Investig. Surv. 2019, 3, 127–130. [Google Scholar]
- Zhang, Y.L.; Zeng, X.M.; Wang, C.W.; Du, Z.B.; Shi, X.C. Land Subsidence Monitoring of the West Bank of the Pearl River Estuary Based on QPS-InSAR. J. Geomat. 2022, 47, 110–114. [Google Scholar]
- Liu, Z.L.; Yu, Y.; Ke, X.B.; Luo, X.Y. Distribution characteristics and causes of land subsidence in Nansha District, Guangzhou. The Chin. J. Geol. Hazard. Control. 2023, 34, 49–57. [Google Scholar]
- Lin, G.K.; Wu, Z.F.; Cao, Z.; Guan, W.C. Land Subsidence Monitoring in Reclamation Area based on SBAS-InSAR Technique. Remote Sens. Technol. Appl. 2021, 36, 1358–1367. [Google Scholar]
- Wu, S.Z.; Xie, R.A.; Xie, W.Z.; Luo, S.R. Ground subsidence monitoring in Nansha district by using Sentinel 1A/B SAR images. Geotech. Investig. Surv. 2020, 48, 48–52. [Google Scholar]
- Shao, S.; Luo, X.Y.; Yao, J.R.; Jia, Y.; Ye, J.; Meng, X.P.; Ma, X.J. Land subsidence monitoring and inducing factor analysis based on InSAR technology for Nansha District of Guangzhou City. Guangxi Water Resour. Hydropower Eng. 2023, 2, 7–13. [Google Scholar]
- Zeng, M.; Pi, P.C.; Zhao, X.W.; Chen, S.; Peng, H.X.; Hou, Q.Q.; Sun, H.M.; Xue, Z.X. Spatial-temporal Characteristics of Land Subsidence in the Typical Reclamation area of Pearl River Estuary Based on PS-InSAR. S. China Geol. 2023, 39, 116–126. [Google Scholar]
- Chen, Y.K.; Gao, L.; Qu, S.X. Study on soft soil distribution and land subsidence features in Nansha District, Guangzhou. Resour. Inf. Eng. 2021, 36, 19–21. [Google Scholar]
- Tang, B.; Chen, Z.H.; Zhang, Y.Y.; Sun, H. A study on the evolution of economic patterns and urban network system in Guangdong-Hong Kong-Macao greater bay area. Front. Public. Health 2022, 10, 973843. [Google Scholar] [CrossRef] [PubMed]
- Tizzani, P.; Berardino, P.; Casu, F.; Euillades, P.; Manzo, M.; Ricciardi, G.P.; Zeni, G.; Lanari, R. Surface deformation of Long Valley Caldera and Mono Basin, California, investigated with the SBAS-InSAR approach. Remote Sens. Environ. 2007, 108, 277–289. [Google Scholar] [CrossRef]
- Zhao, C.Y.; Lu, Z.; Zhang, Q.; de la Fuente, J. Large-area landslide detection and monitoring with ALOS/PALSAR imagery data over Northern California and Southern Oregon, USA. Remote Sens. Environ. 2012, 124, 348–359. [Google Scholar] [CrossRef]
- Liu, P.; Li, Z.H.; Hoey, T.; Kincal, C.; Zhang, J.F.; Zeng, Q.M.; Muller, J.P. Using advanced InSAR time series techniques to monitor landslide movements in Badong of the Three Gorges region, China. Int. J. Appl. Earth Obs. 2013, 21, 253–264. [Google Scholar] [CrossRef]
- Chen, Y. Conceptual Framework for the Development of an Indicator System for the Assessment of Regional Land Subsidence Disaster Vulnerability. Sustainability 2016, 8, 757. [Google Scholar] [CrossRef]
- Hasan, M.F.; Smith, R.; Vajedian, S.; Pommerenke, R.; Majumdar, S. Global land subsidence mapping reveals widespread loss of aquifer storage capacity. Nat. Commun. 2023, 14, 6180. [Google Scholar] [CrossRef]
- Hu, B.B.; Zhou, J.; Wang, J.; Chen, Z.L.; Wang, D.Q.; Xu, S.Y. Risk assessment of land subsidence at Tianjin coastal area in China. Environ. Earth Sci. 2009, 59, 269–276. [Google Scholar] [CrossRef]
- Dong, H.G.; Huang, C.S.; Chen, W.; Zhang, H.X.; Zhi, B.F.; Zhao, X.W. The controlling factors of environment geology in the Pearl River Delta Economic Zone and an analysis of existing problems. Geol. China 2012, 39, 539–549. [Google Scholar]
- Yang, J.; Huang, X. The 30 m annual land cover dataset and its dynamics in China from 1990 to 2019. Earth Syst. Sci. Data 2021, 13, 3907–3925. [Google Scholar] [CrossRef]
- Fang, H.; He, Q.C.; Xv, B.; Wang, M.H.; Li, X. A study of risk assessment of the land subsidence in Cangzhou. Hydrogeol. Eng. Geol. 2016, 43, 159–164. [Google Scholar]
- Ao, M.S.; Wang, C.C.; Xie, R.A.; Zhang, X.Q.; Hu, J.; Du, Y.A.; Li, Z.W.; Zhu, J.J.; Dai, W.J.; Kuang, C.L. Monitoring the land subsidence with persistent scatterer interferometry in Nansha District, Guangdong, China. Nat. Hazards 2015, 75, 2947–2964. [Google Scholar] [CrossRef]
- Du, Z.Y.; Ge, L.L.; Ng, A.H.M.; Lian, X.G.; Zhu, Q.G.Z.; Horgan, F.G.; Zhang, Q. Analysis of the impact of the South-to-North water diversion project on water balance and land subsidence in Beijing, China between 2007 and 2020. J. Hydrol. 2021, 603, 126990. [Google Scholar] [CrossRef]
- Li, G.R.; Zhao, C.Y.; Wang, B.H.; Liu, X.J.; Chen, H.Y. Land Subsidence Monitoring and Dynamic Prediction of Reclaimed Islands with Multi-Temporal InSAR Techniques in Xiamen and Zhangzhou Cities, China. Remote Sens. 2022, 14, 2930. [Google Scholar] [CrossRef]
- Sun, H.M.; Peng, H.X.; Zeng, M.; Wang, S.M.; Pan, Y.J.; Pi, P.C.; Xue, Z.X.; Zhao, X.W.; Zhang, A.; Liu, F.M. Land Subsidence in a Coastal City Based on SBAS-InSAR Monitoring: A Case Study of Zhuhai, China. Remote Sens. 2023, 15, 2424. [Google Scholar] [CrossRef]
- Shi, X.L.; Chen, C.; Dai, K.R.; Deng, J.; Wen, N.L.; Yin, Y.; Dong, X.J. Monitoring and Predicting the Subsidence of Dalian Jinzhou Bay International Airport, China by Integrating InSAR Observation and Terzaghi Consolidation Theory. Remote Sens. 2022, 14, 2332. [Google Scholar] [CrossRef]
- Kim, S.W.; Wdowinski, S.; Dixon, T.H.; Amelung, F.; Won, J.S.; Kim, J.W. InSAR-based mapping of surface subsidence in Mokpo City, Korea, using JERS-1 and ENVISAT SAR data. Earth Planets Space 2008, 60, 453–461. [Google Scholar] [CrossRef]
- Amin, G.; Shahzad, M.I.; Jaweria, S.; Zia, I. Measuring land deformation in a mega city Karachi-Pakistan with sentinel SAR interferometry. Geocarto Int. 2022, 37, 4974–4993. [Google Scholar] [CrossRef]
- Gao, G.S.; San, L.H.; Zhu, Y.D. Flood Inundation Analysis in Penang Island (Malaysia) Based on InSAR Maps of Land Subsidence and Local Sea Level Scenarios. Water 2021, 13, 1518. [Google Scholar] [CrossRef]
- Liu, P.; Chen, X.F.; Li, Z.H.; Zhang, Z.G.; Xu, J.K.; Feng, W.P.; Wang, C.S.; Hu, Z.W.; Tu, W.; Li, H. Resolving Surface Displacements in Shenzhen of China from Time Series InSAR. Remote Sens. 2018, 10, 1162. [Google Scholar] [CrossRef]
- Tang, Y.Q.; Ren, X.W.; Chen, B.; Song, S.P.; Wang, J.X.; Yang, P. Study on land subsidence under different plot ratios through centrifuge model test in soft-soil territory. Environ. Earth Sci. 2012, 66, 1809–1816. [Google Scholar] [CrossRef]
- Cui, Z.D.; Yang, J.Q.; Yuan, L. Land subsidence caused by the interaction of high-rise buildings in soft soil areas. Nat. Hazards 2015, 79, 1199–1217. [Google Scholar] [CrossRef]
- Xue, Y.Q.; Zhang, Y.; Ye, S.J.; Wu, J.C.; Li, Q.F. Land subsidence in China. Environ. Geol. 2005, 48, 713–720. [Google Scholar] [CrossRef]
- Yang, P.; Dong, Y.; Zhang, Y.; Wu, G.; Yao, Y. Research on prevention and control methods of land subsidence induced by groundwater overexploitation based on three-dimensional fluid solid coupling model—A case study of Guangrao County. Front. Earth Sci. 2023, 10, 1010134. [Google Scholar] [CrossRef]
- Dong, S.C.; Samsonov, S.; Yin, H.W.; Ye, S.J.; Cao, Y.R. Time-series analysis of subsidence associated with rapid urbanization in Shanghai, China measured with SBAS InSAR method. Environ. Earth Sci. 2014, 72, 677–691. [Google Scholar] [CrossRef]
- Zhou, C.F.; Gong, H.L.; Chen, B.B.; Li, X.J.; Li, J.W.; Wang, X.; Gao, M.L.; Si, Y.; Guo, L.; Shi, M.; et al. Quantifying the contribution of multiple factors to land subsidence in the Beijing Plain, China with machine learning technology. Geomorphology 2019, 335, 48–61. [Google Scholar] [CrossRef]
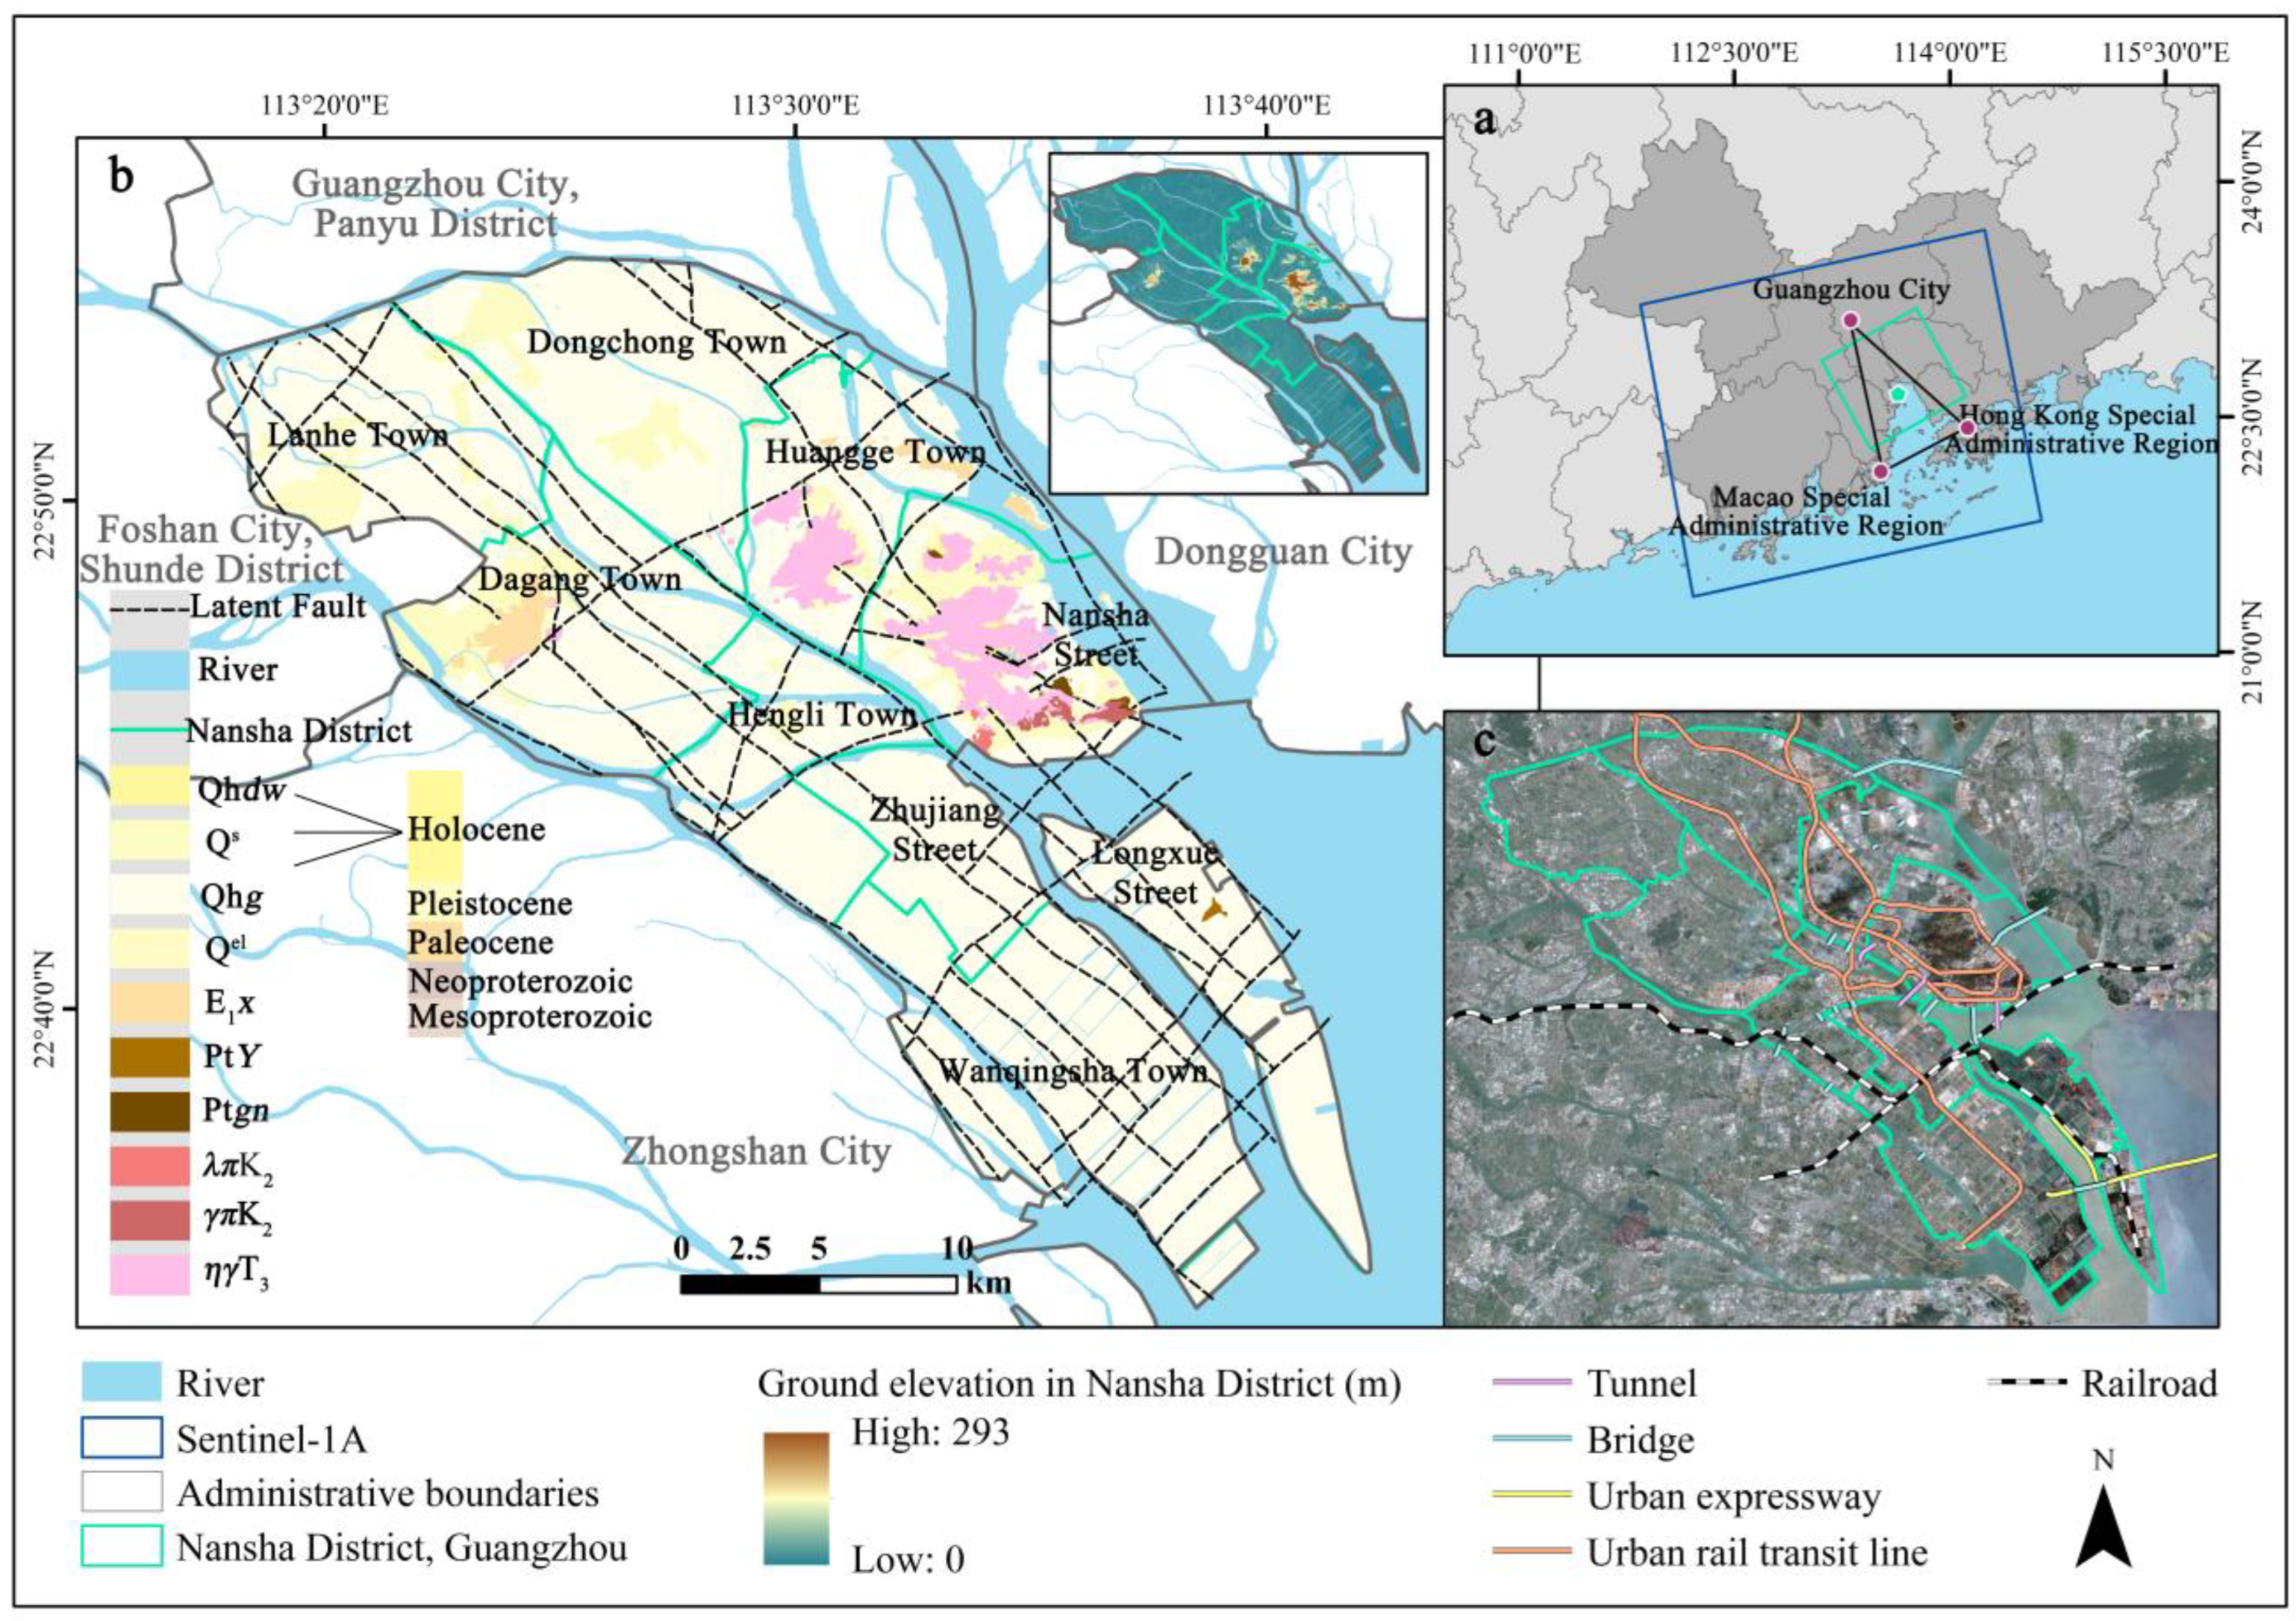
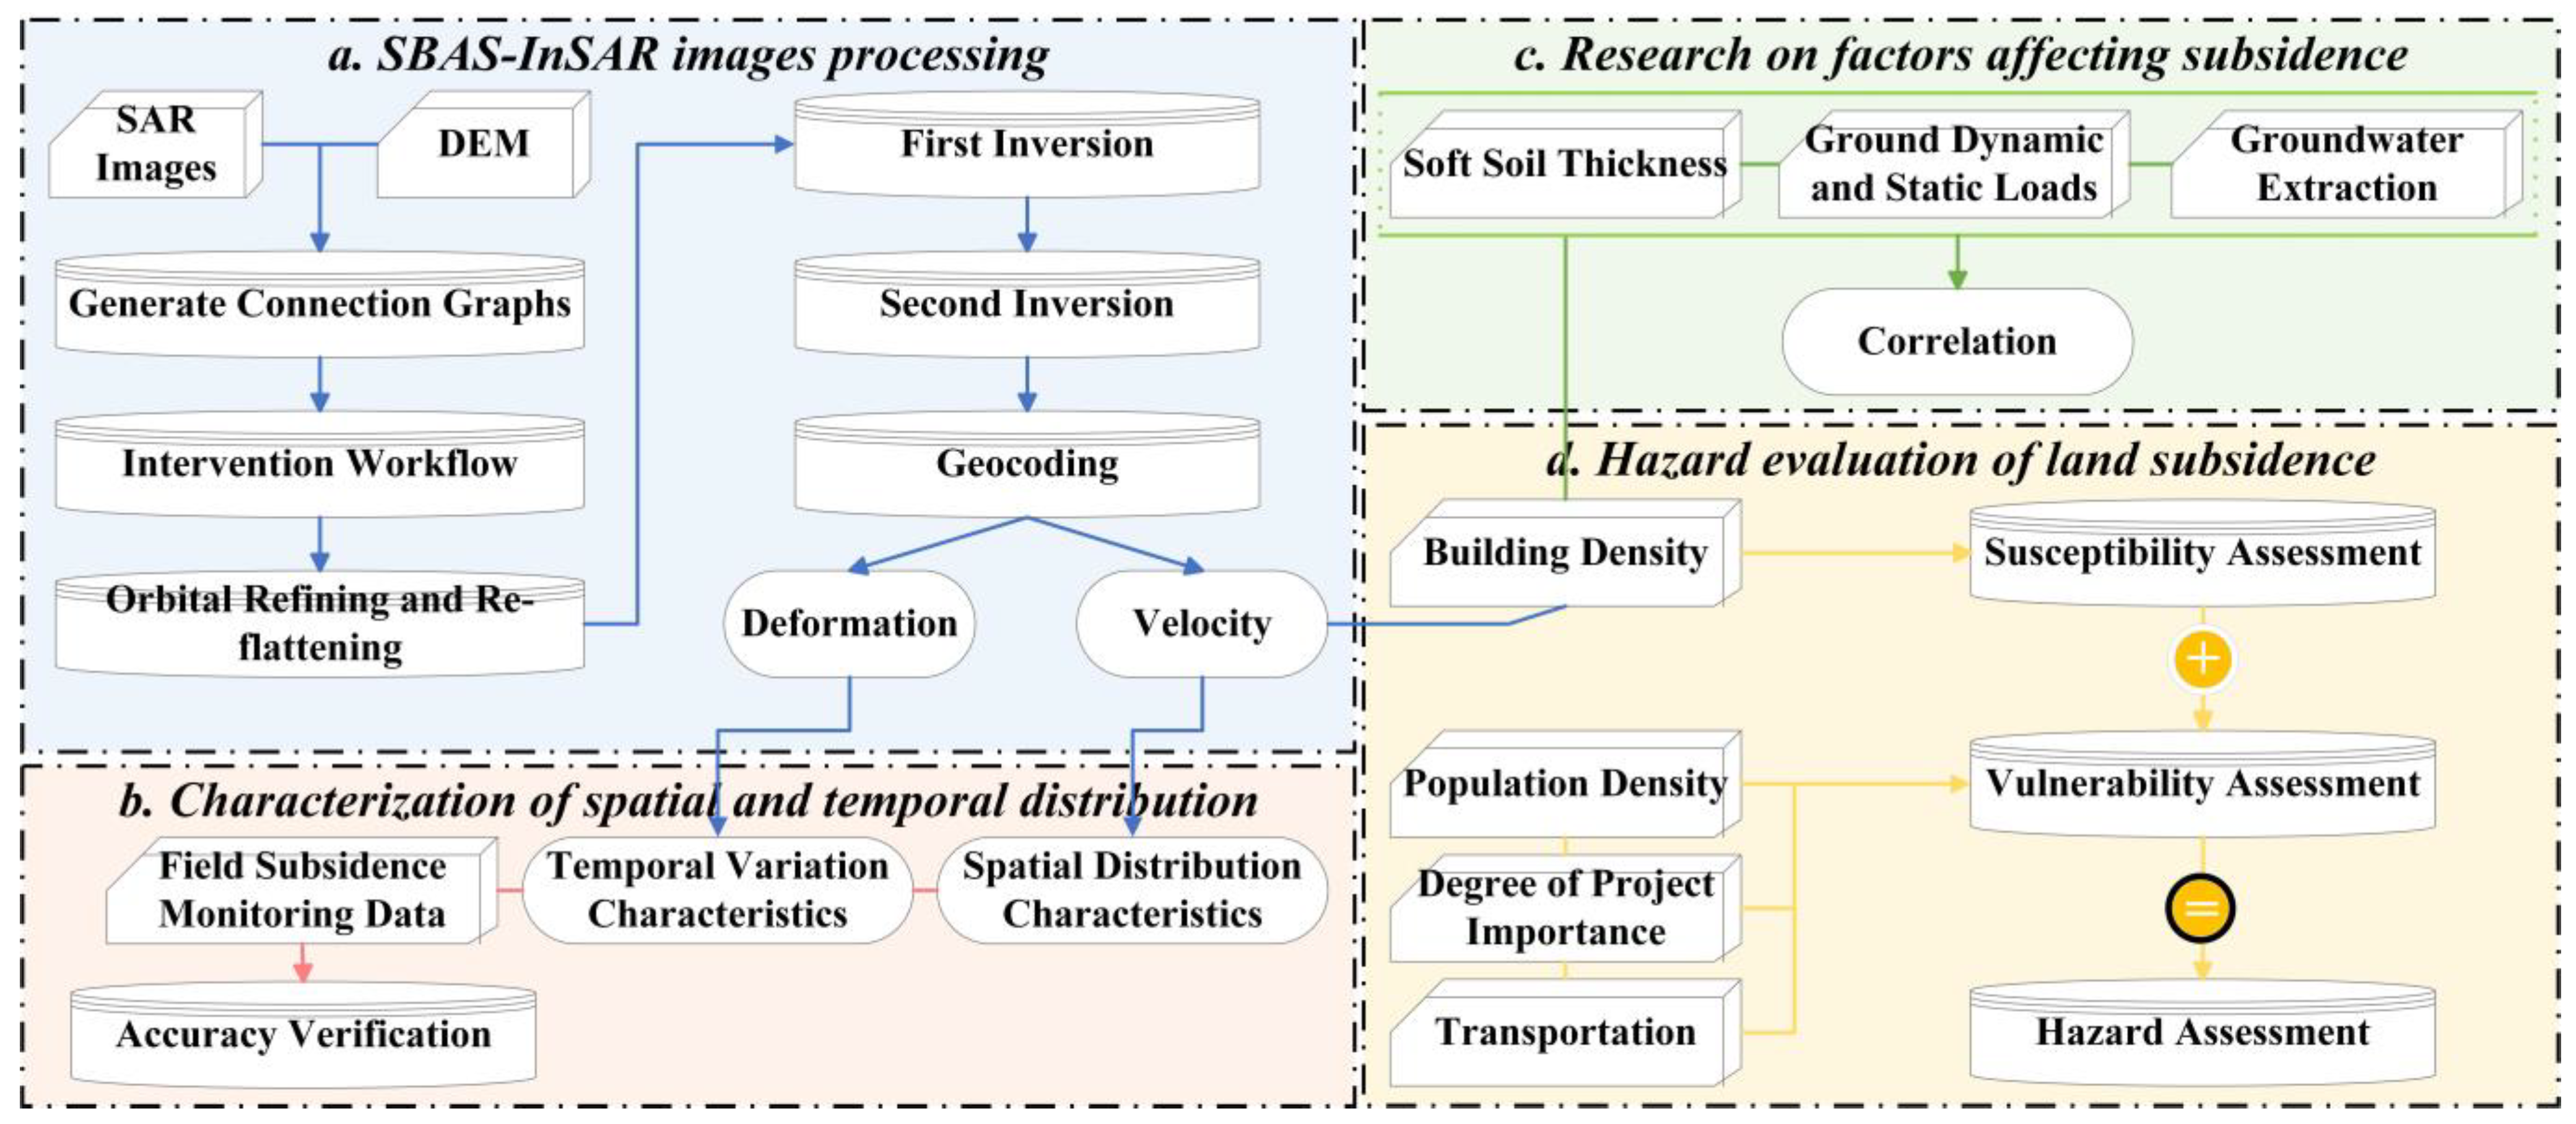

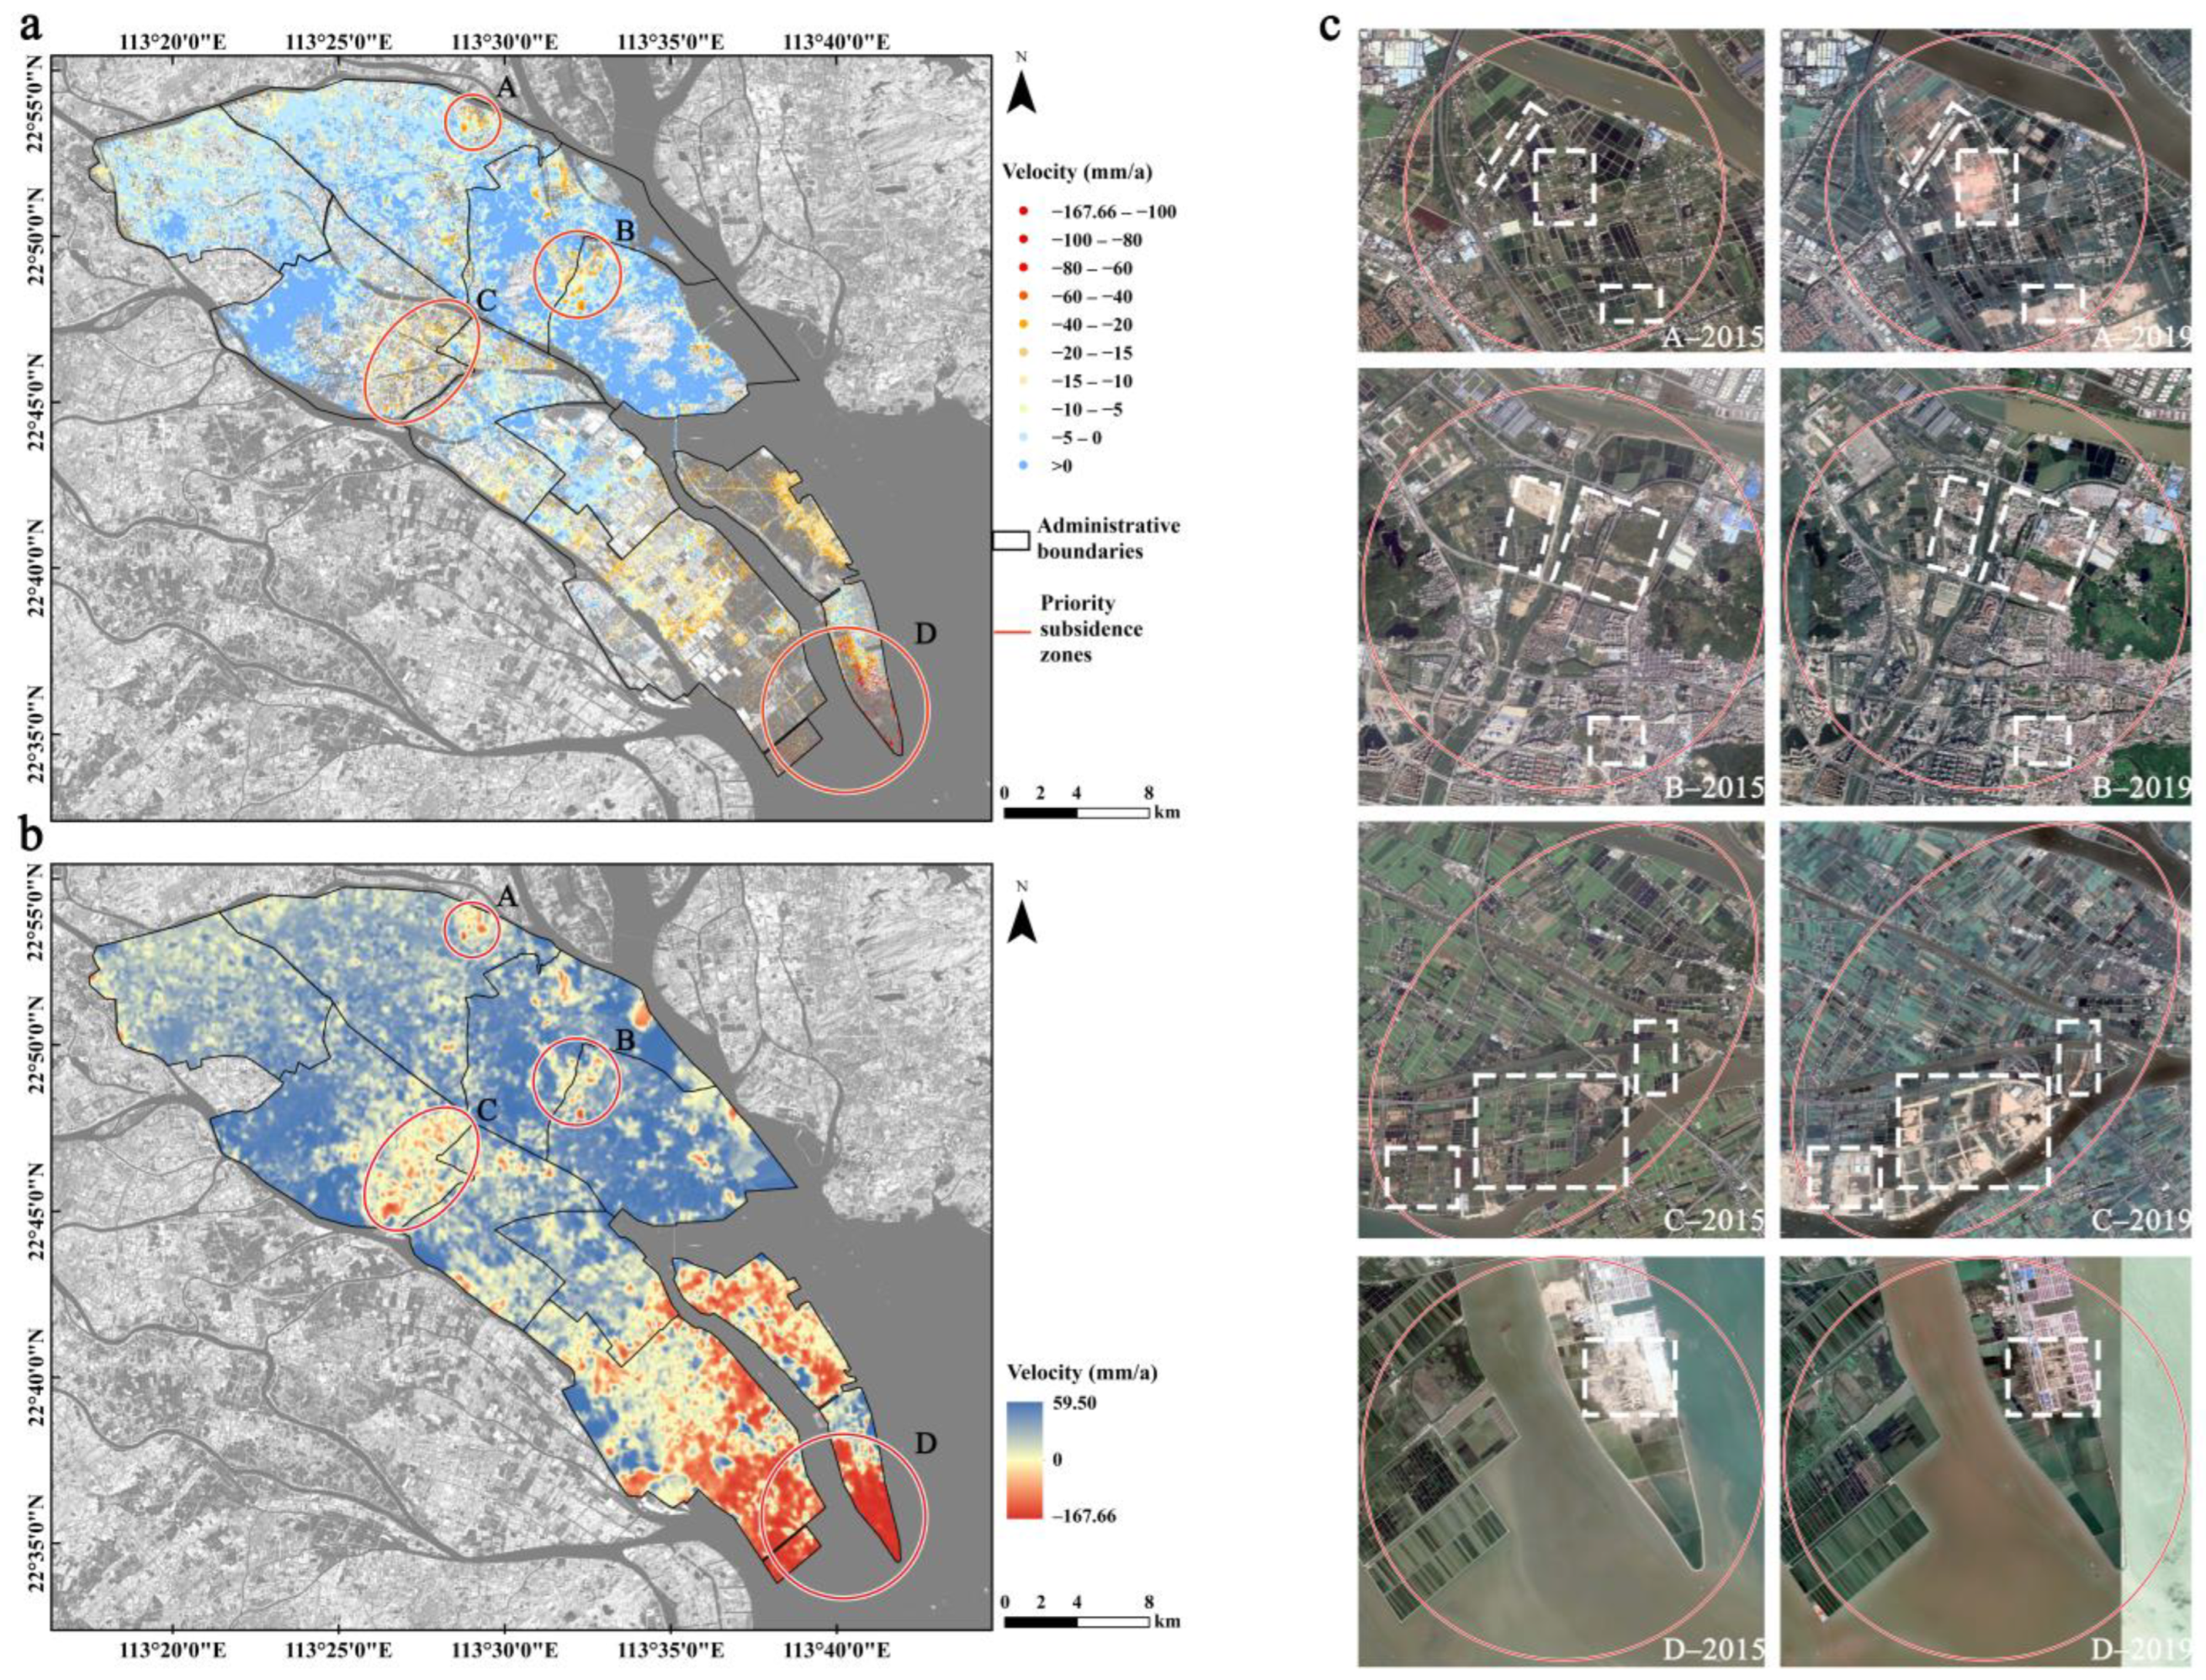
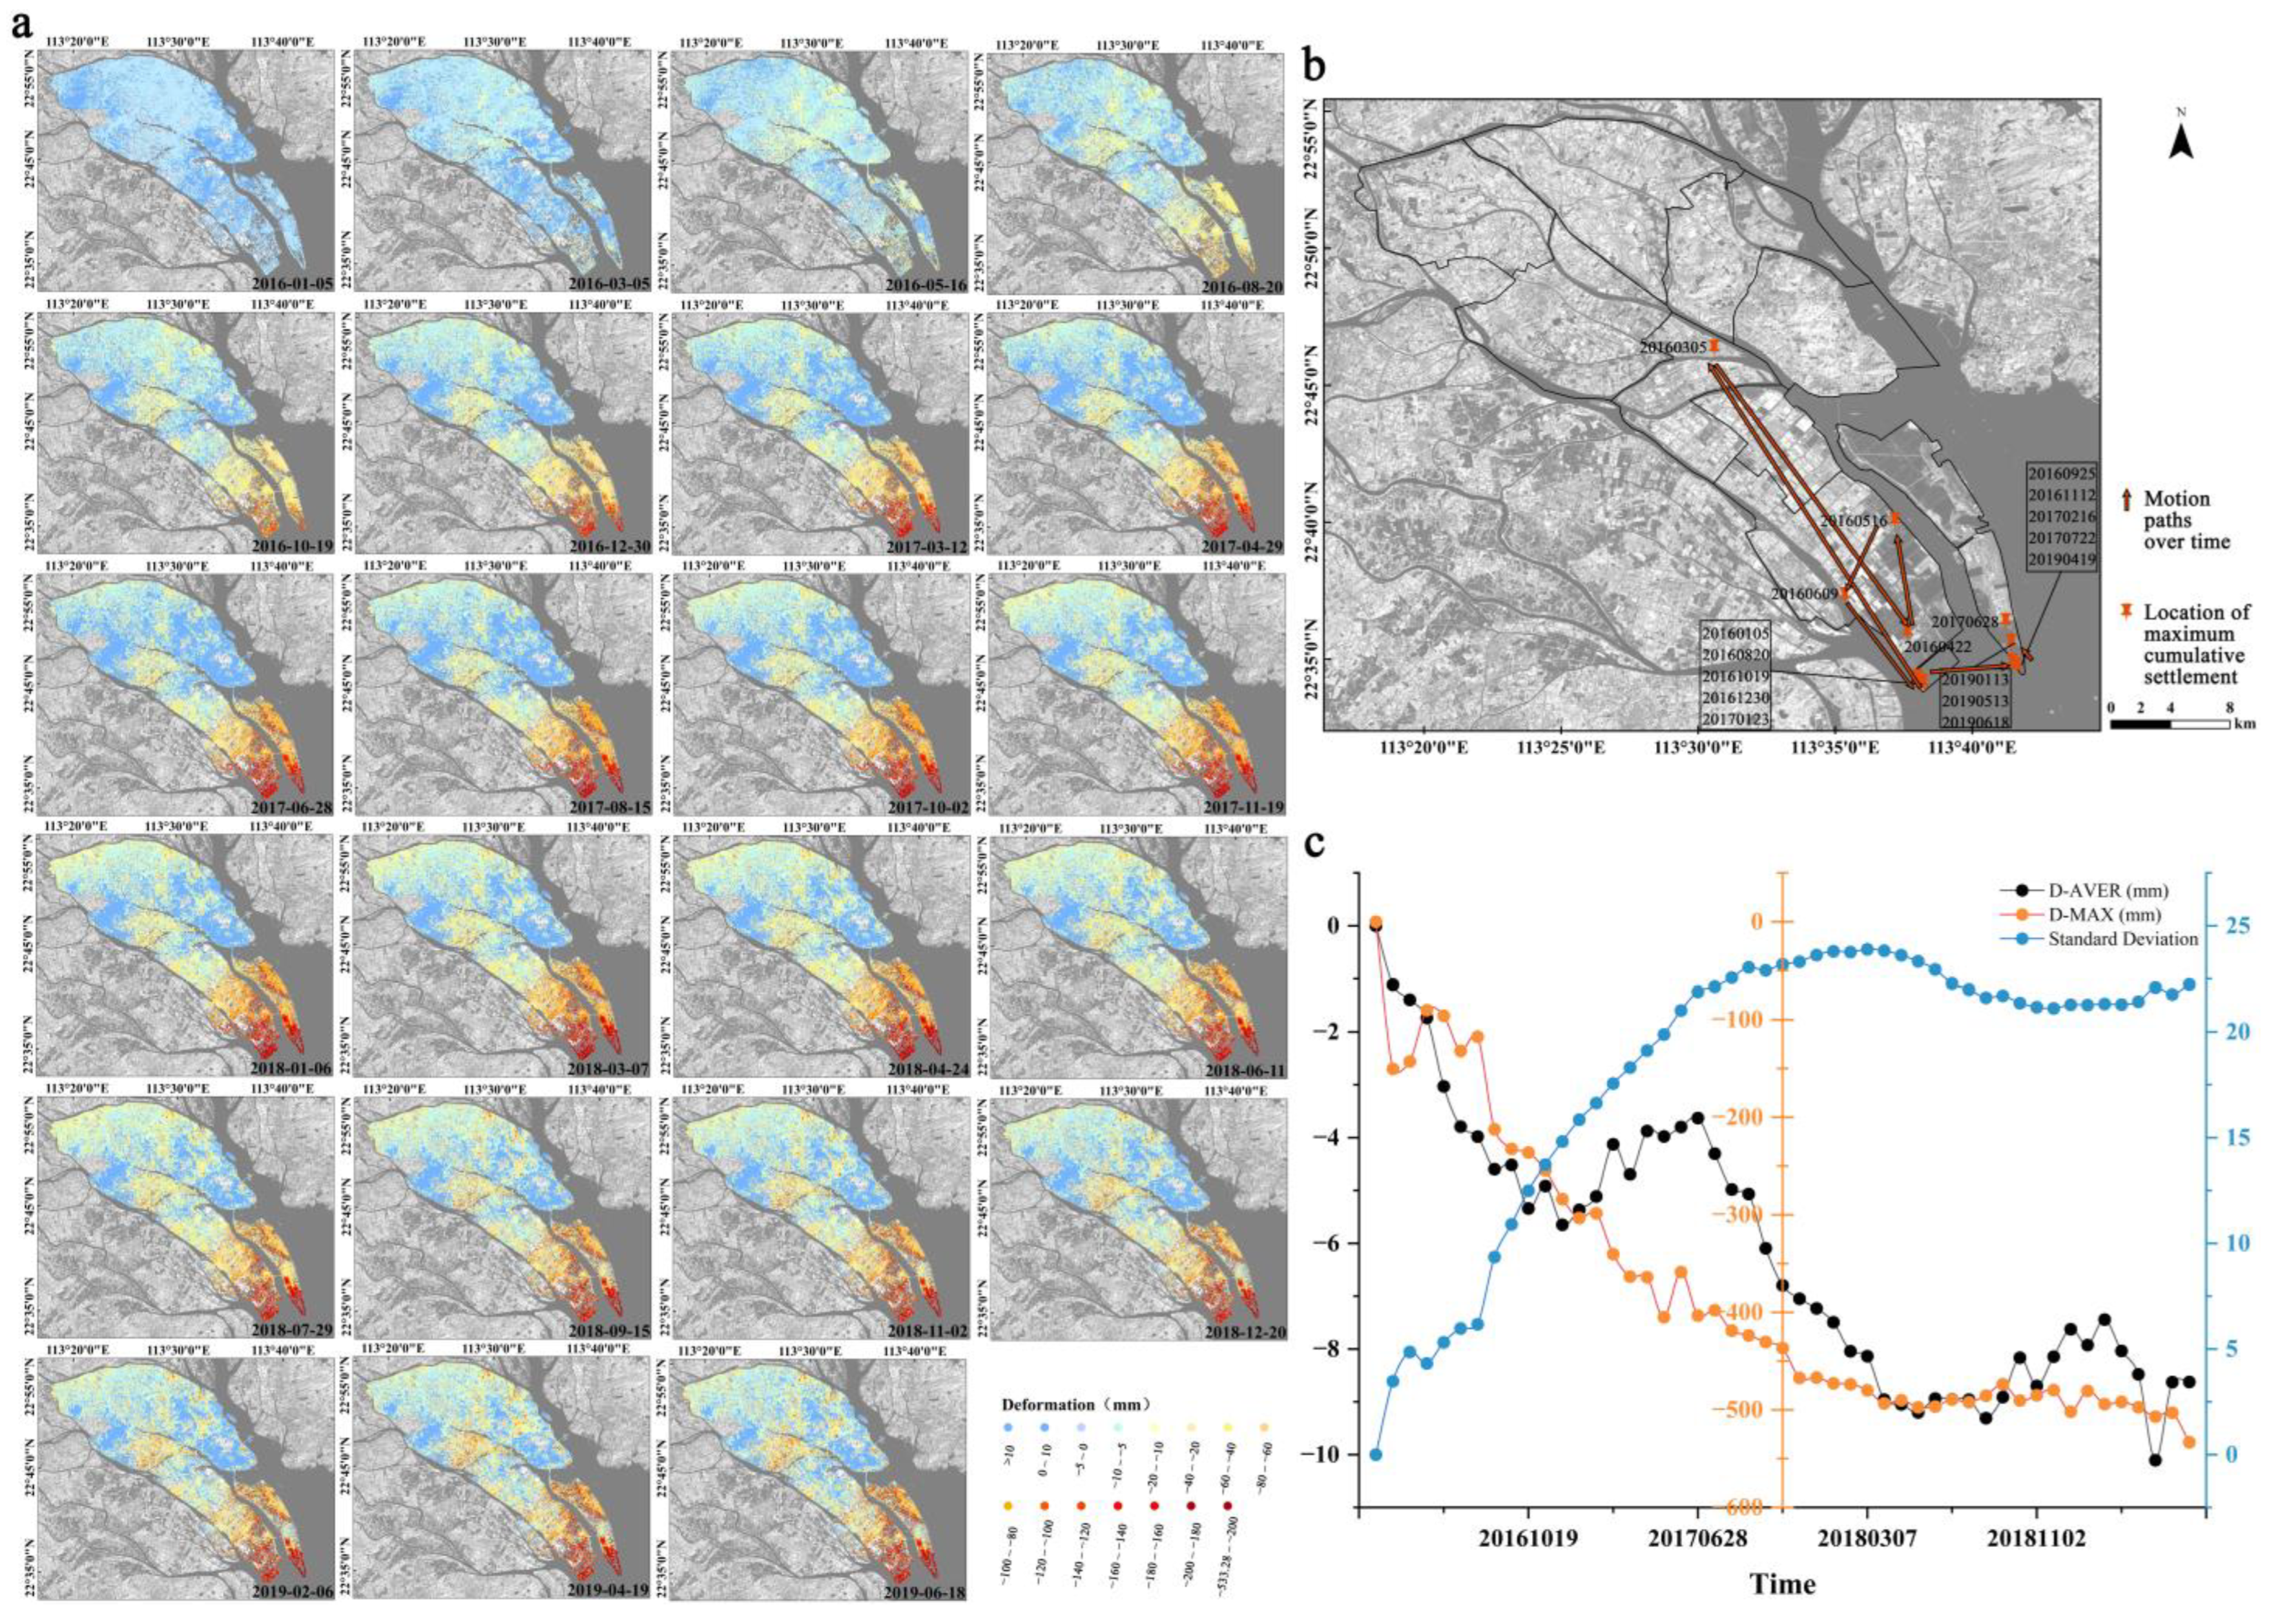
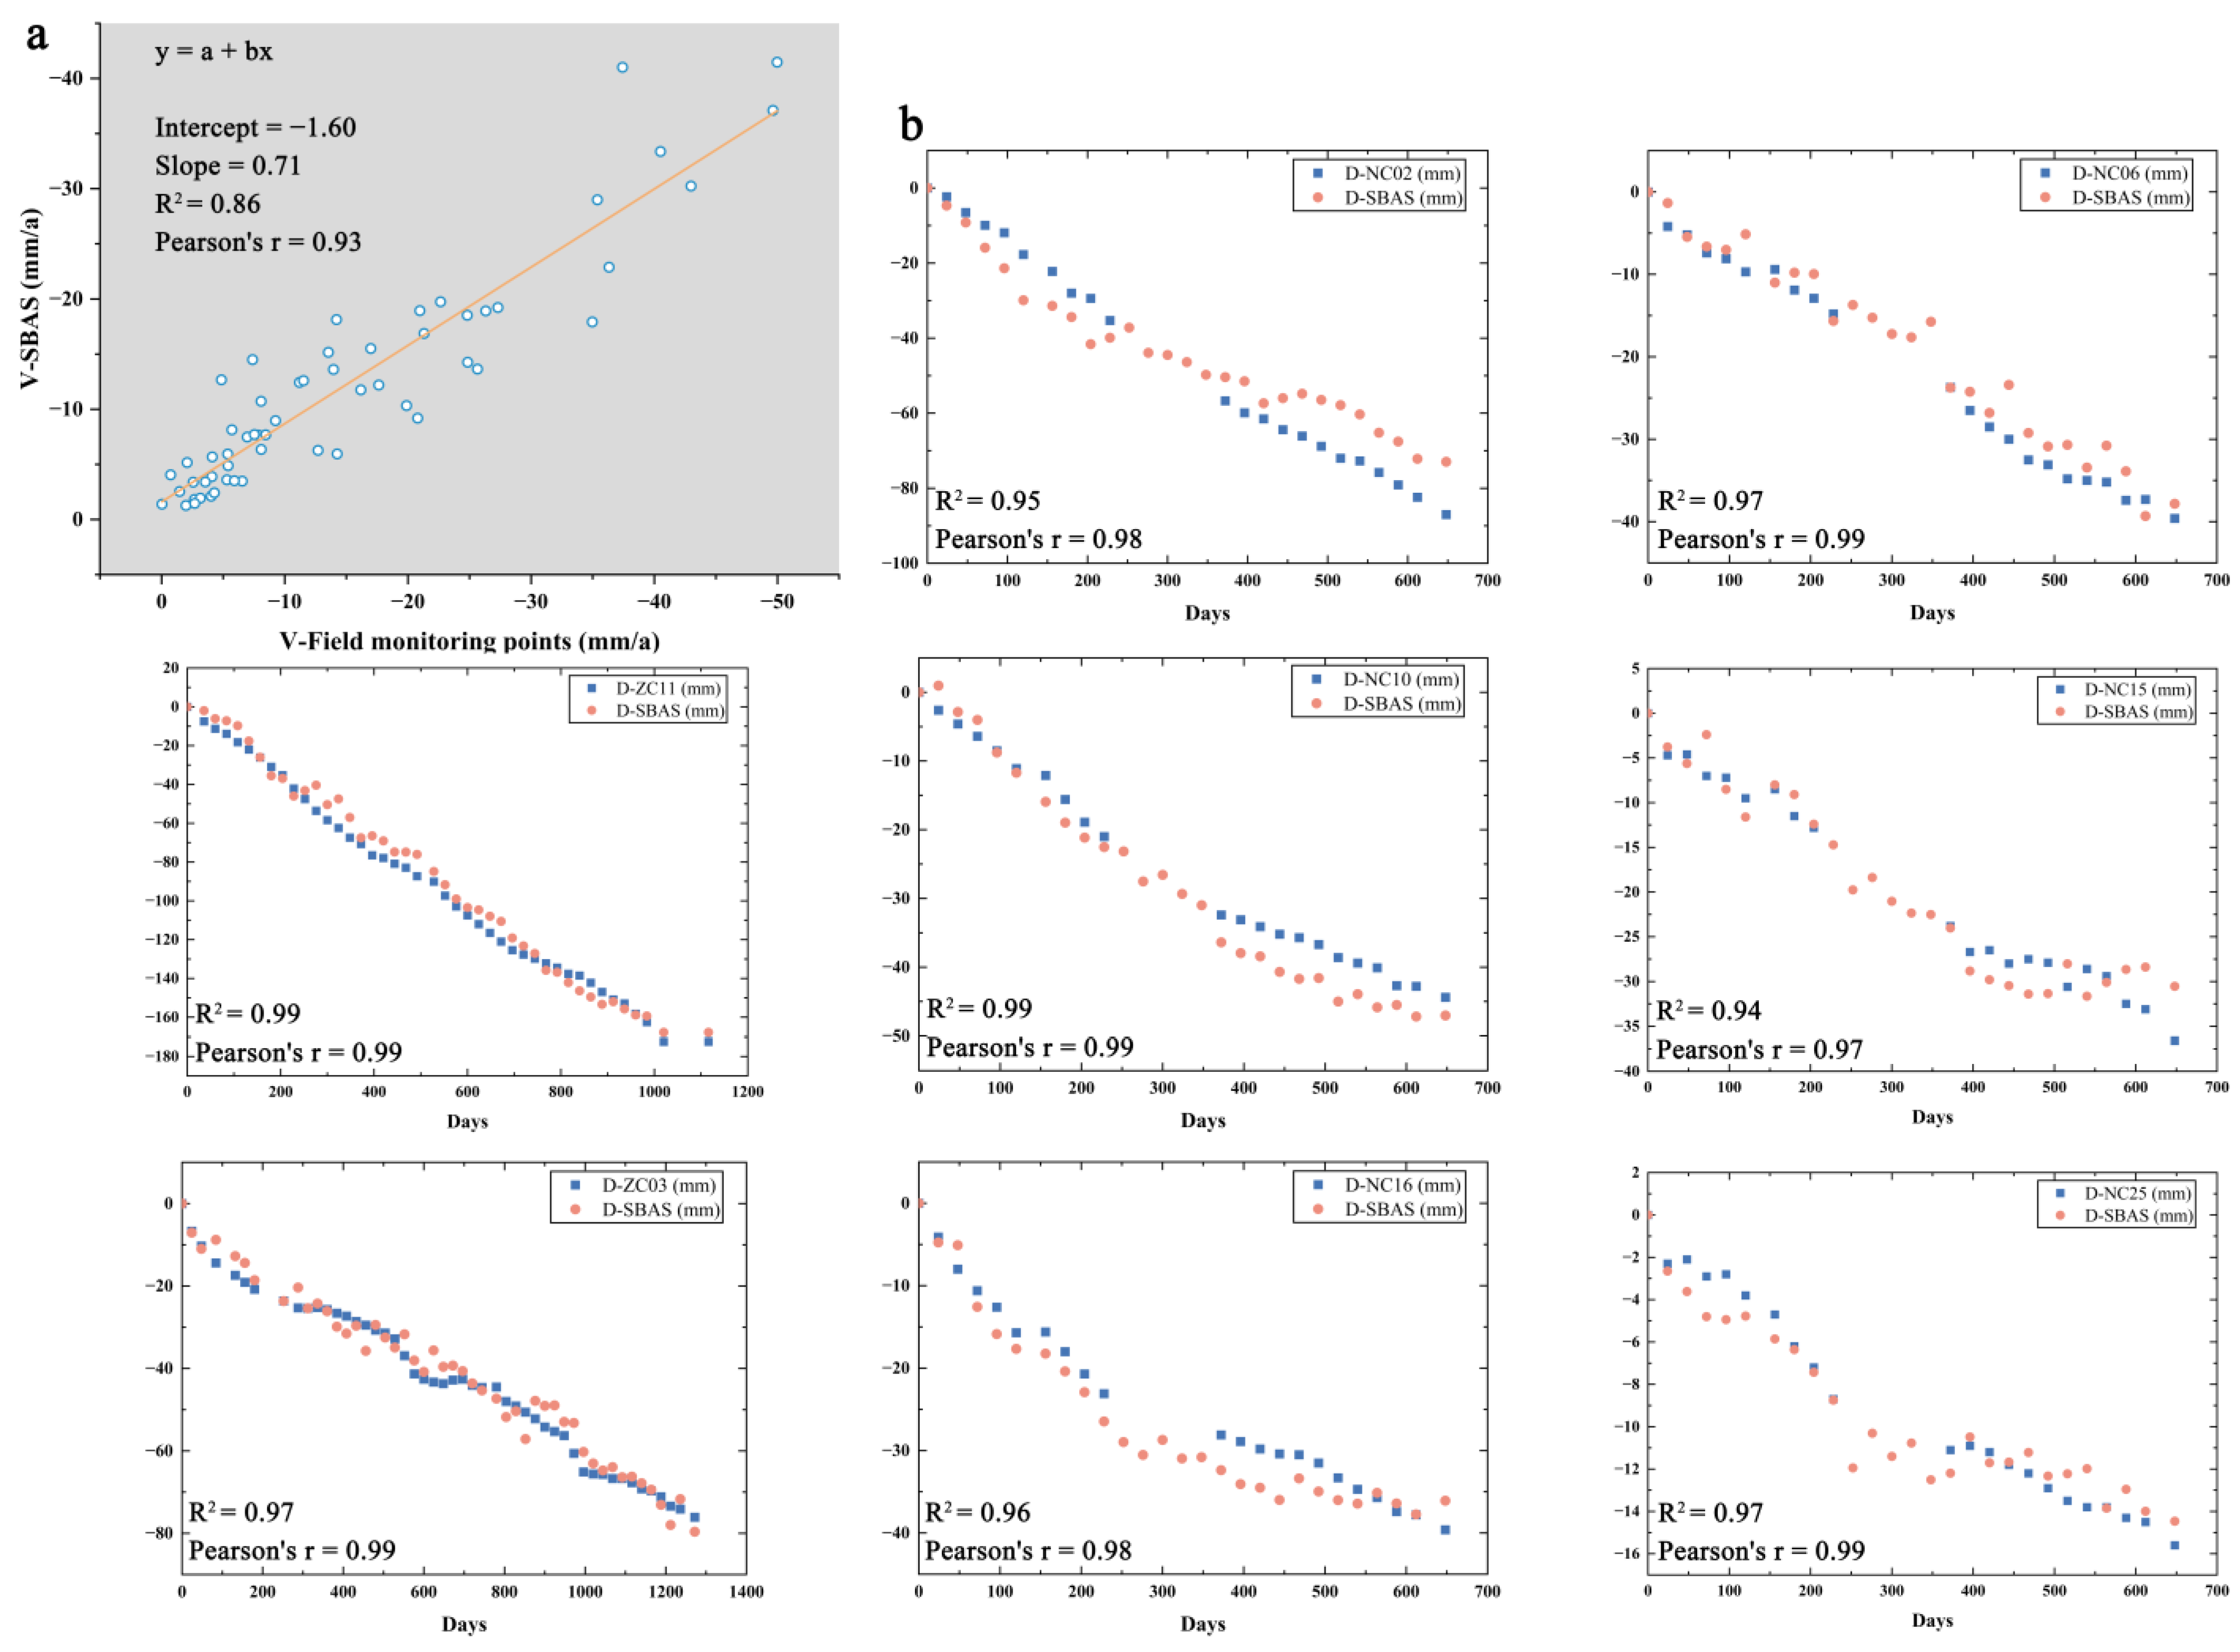
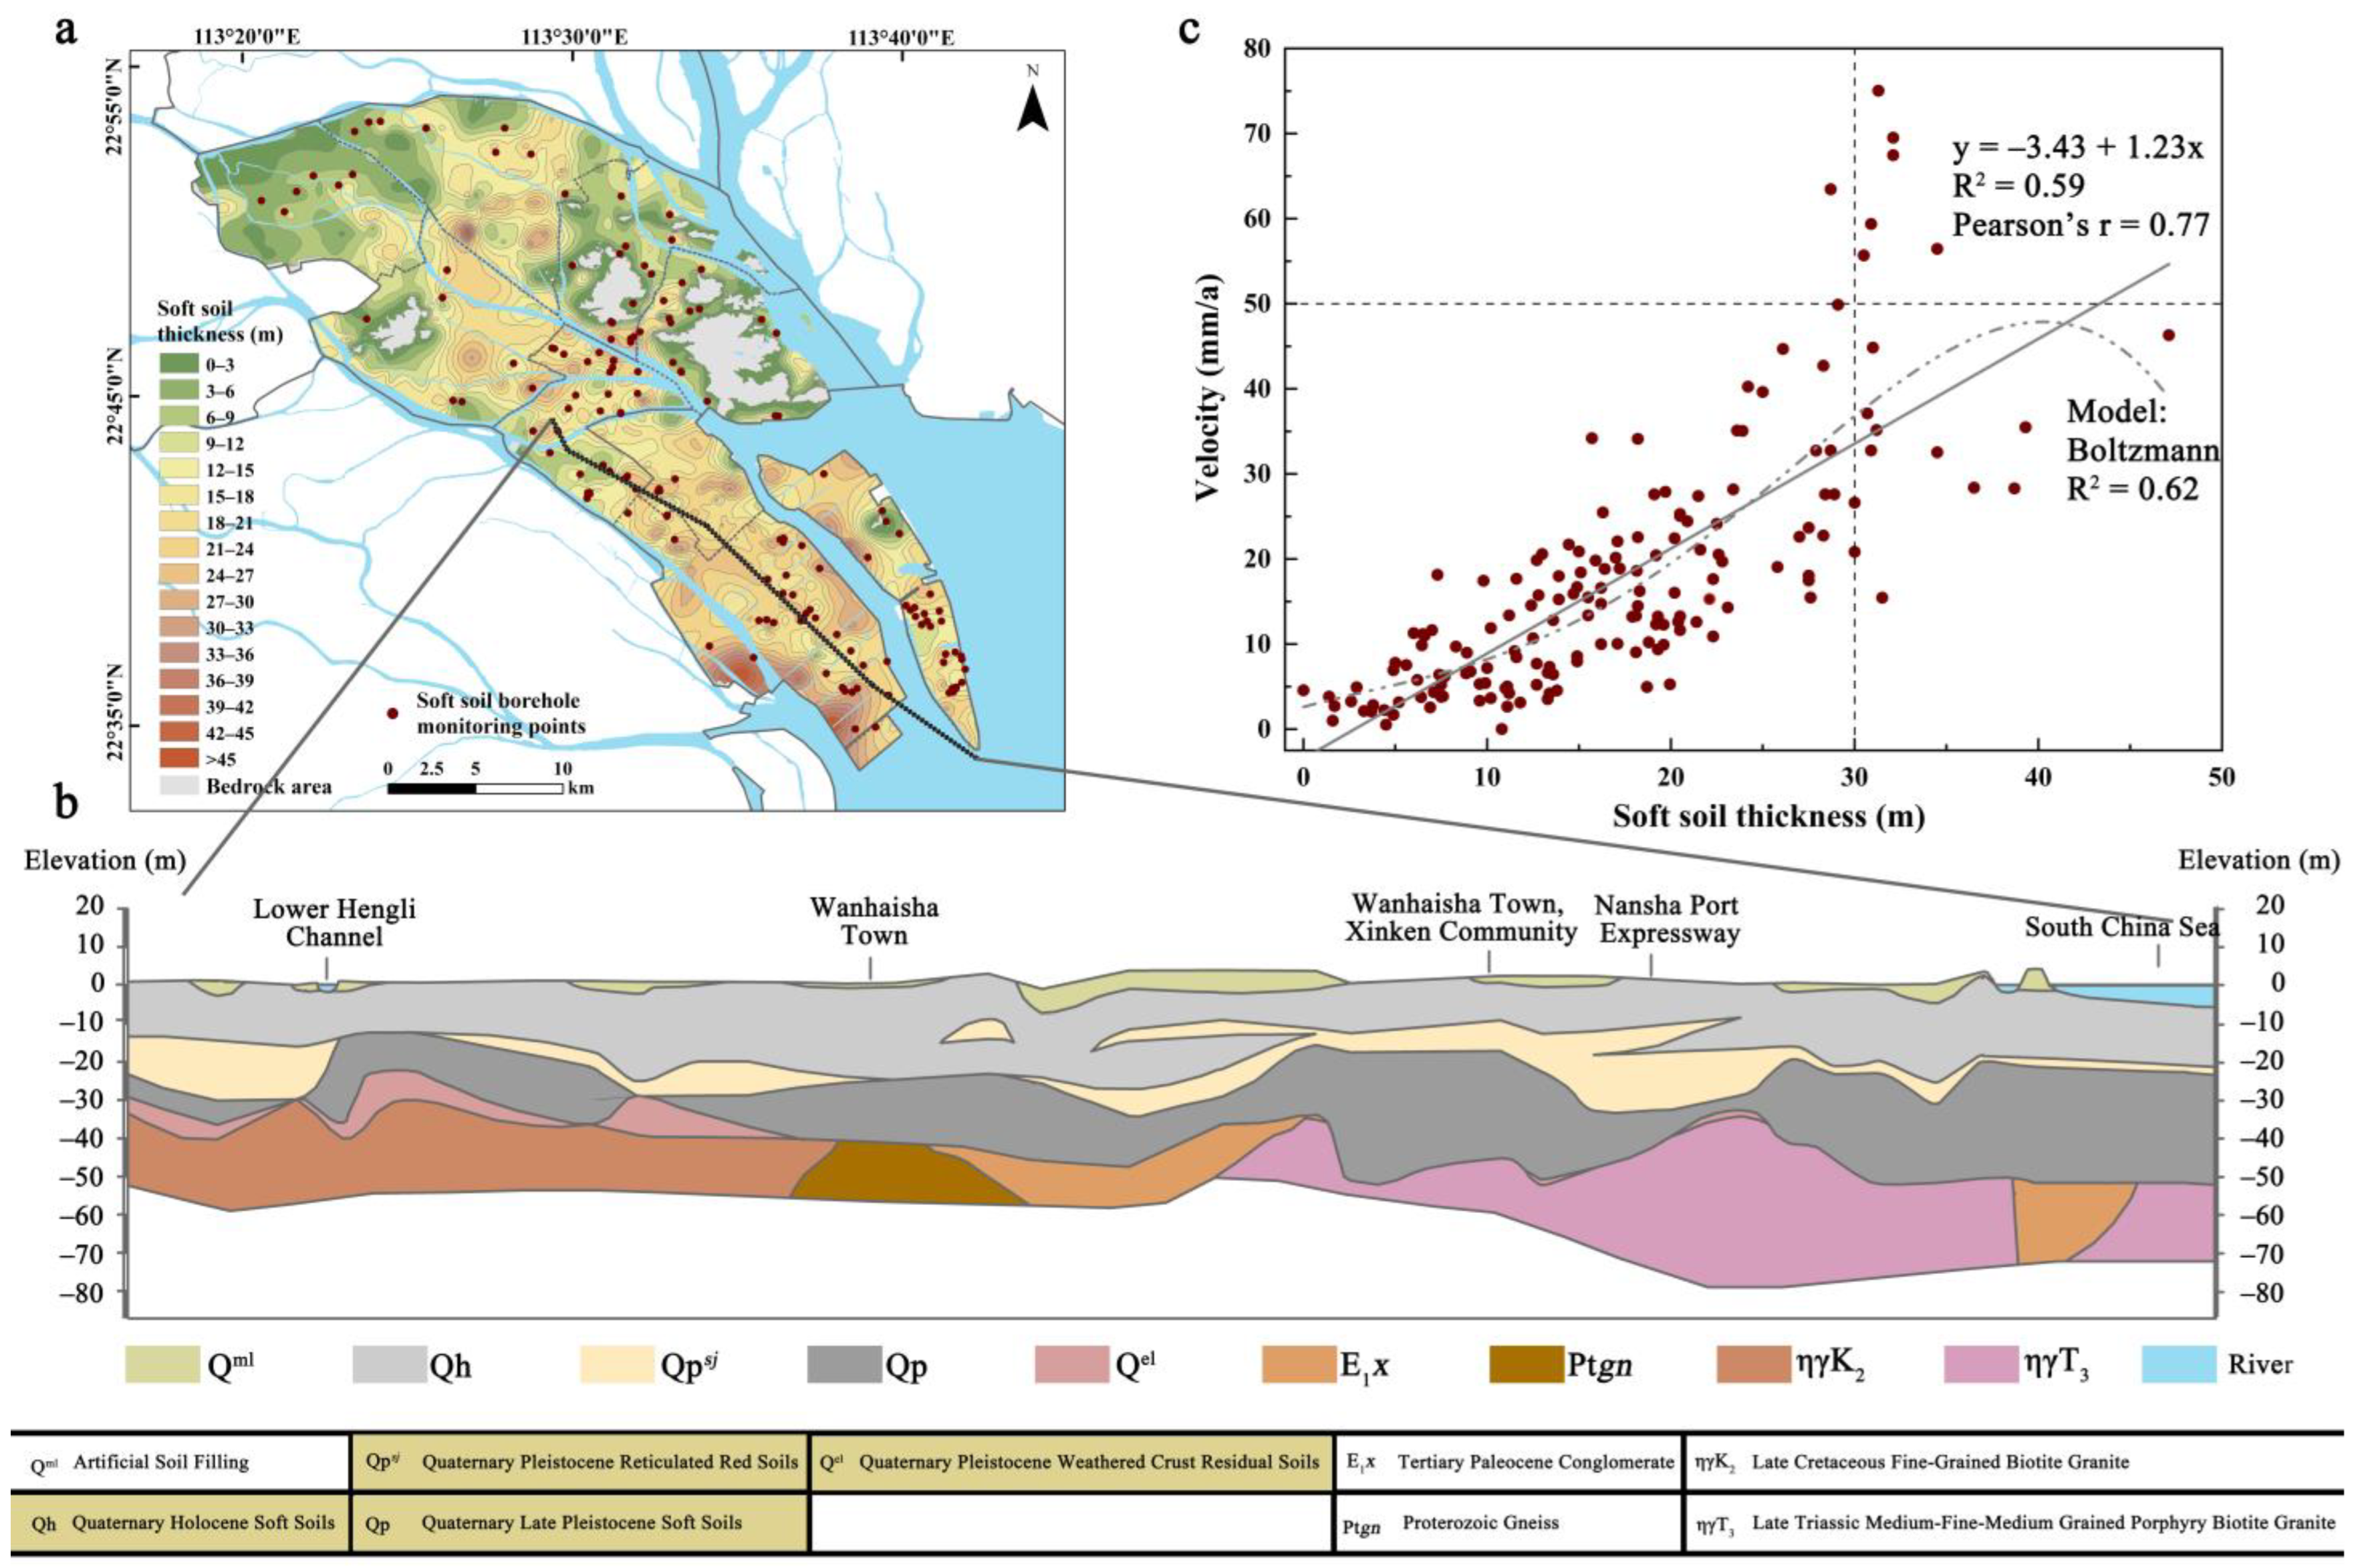


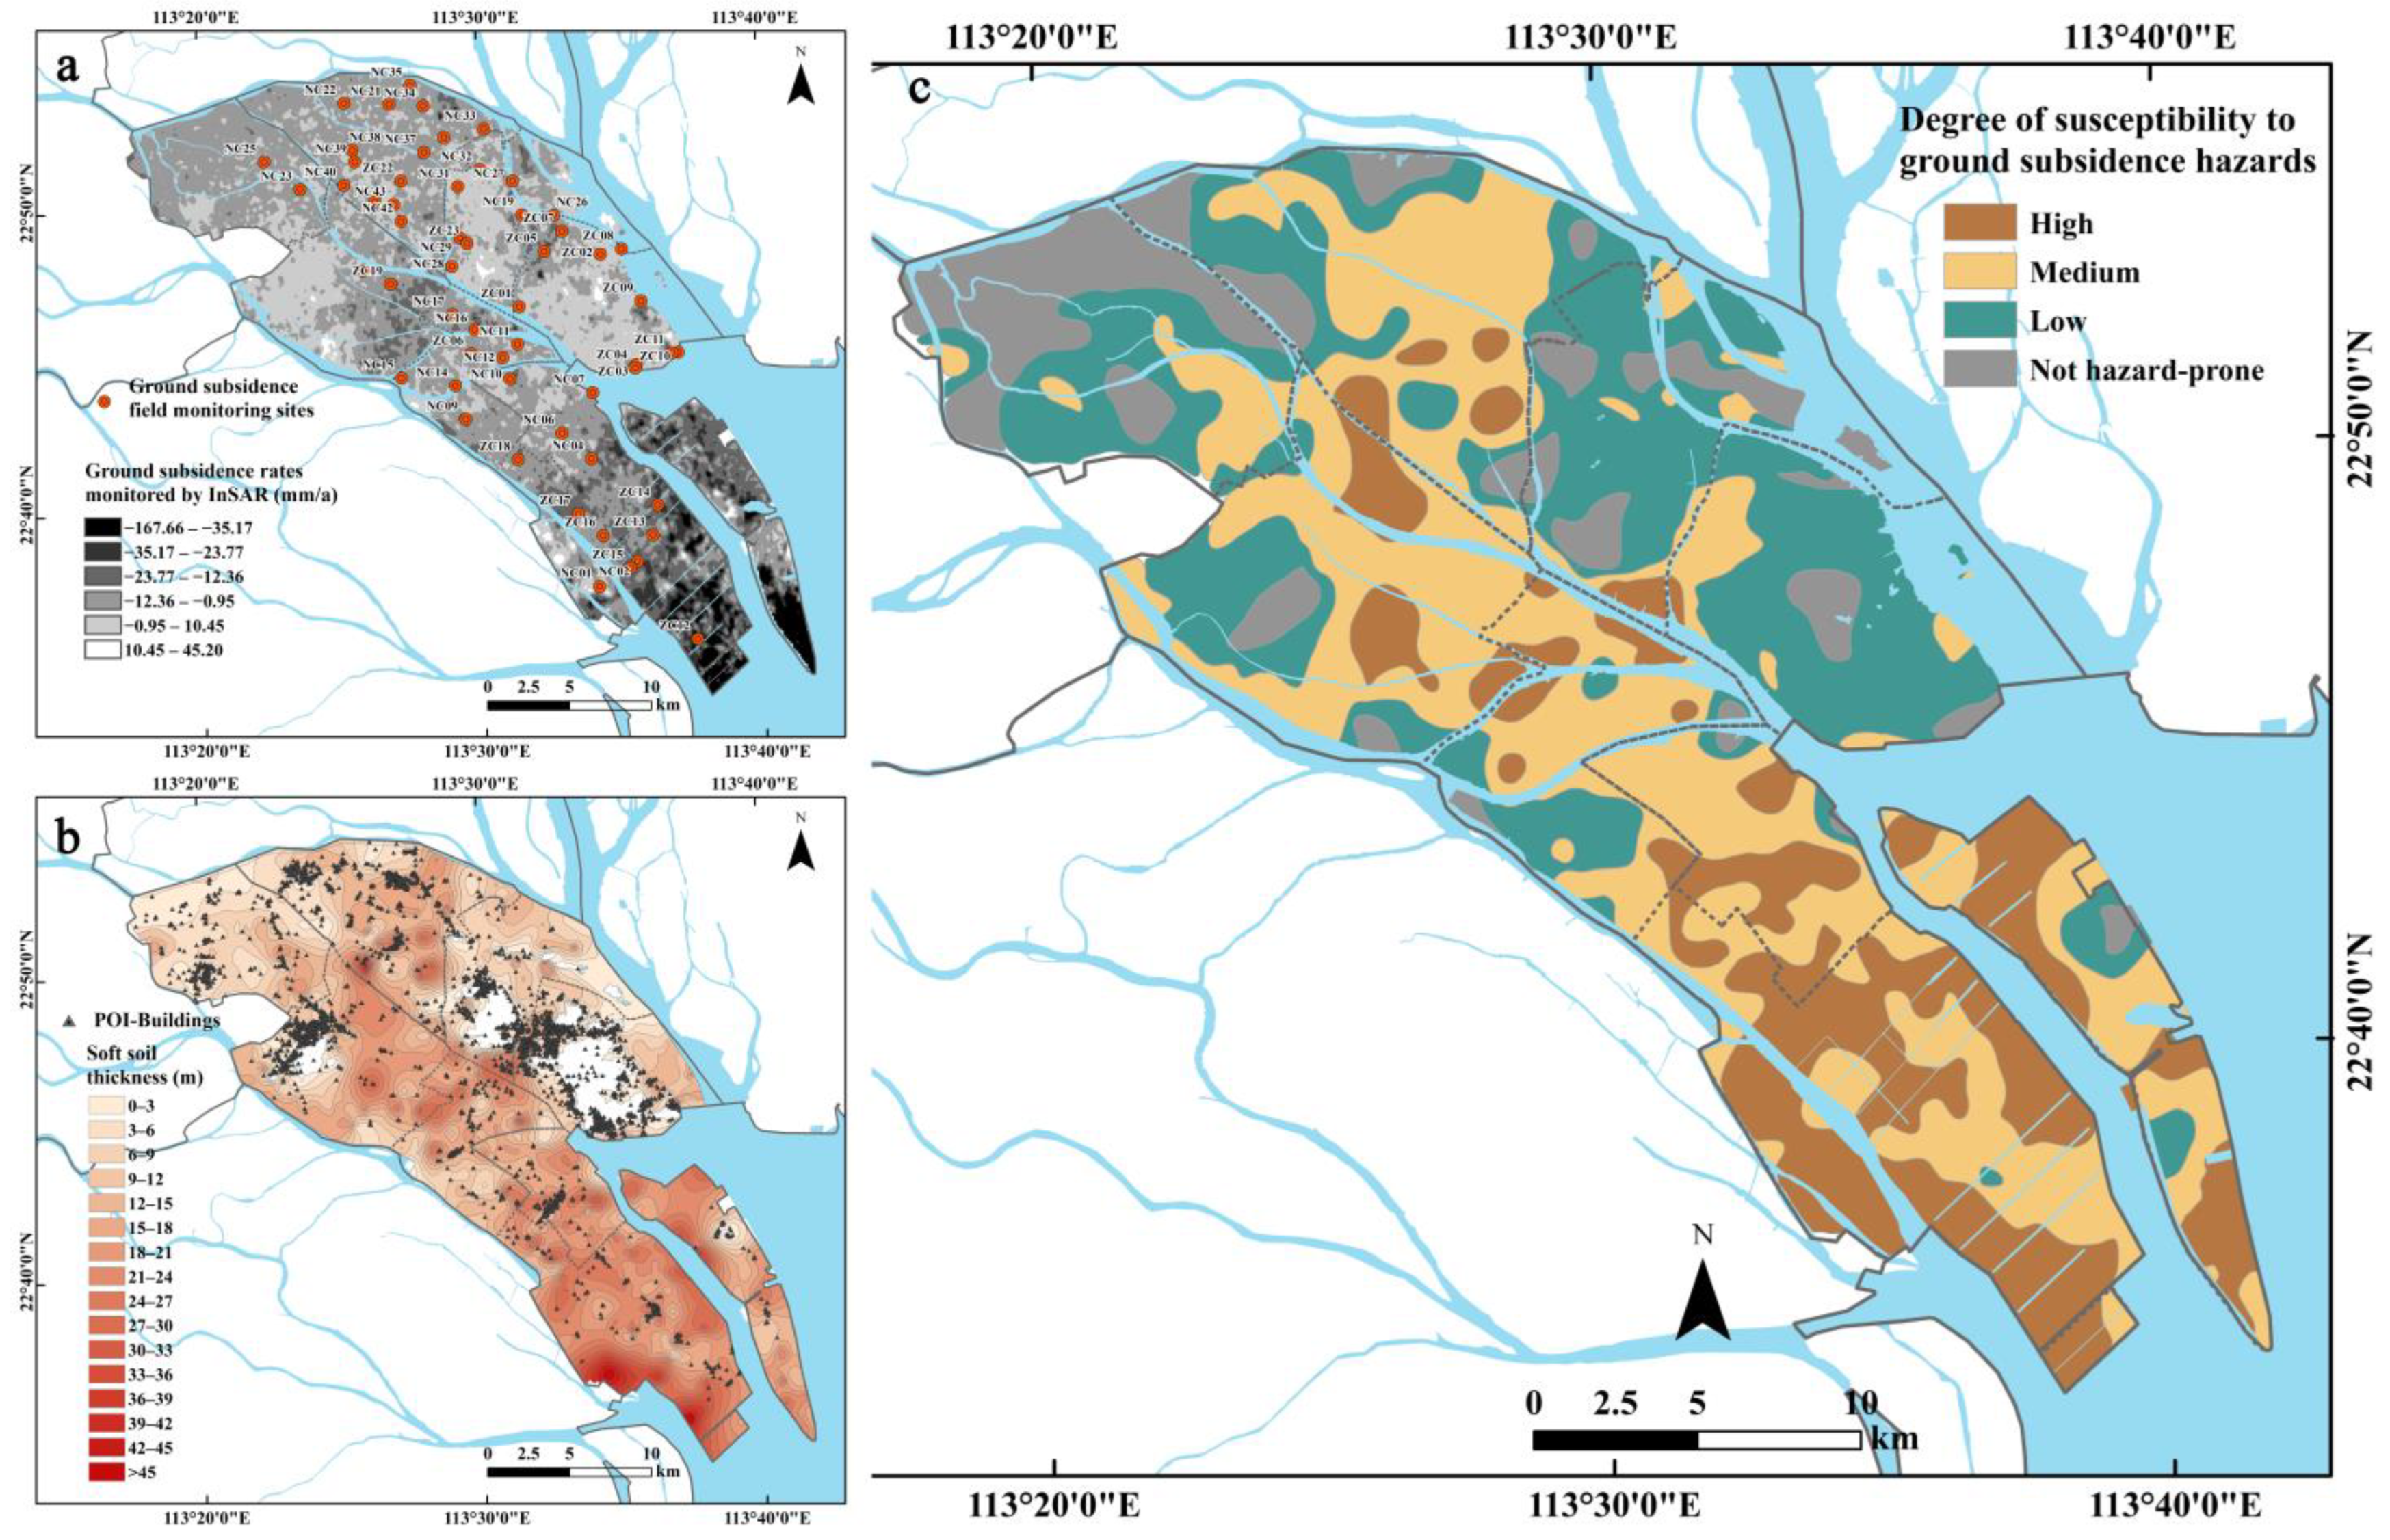
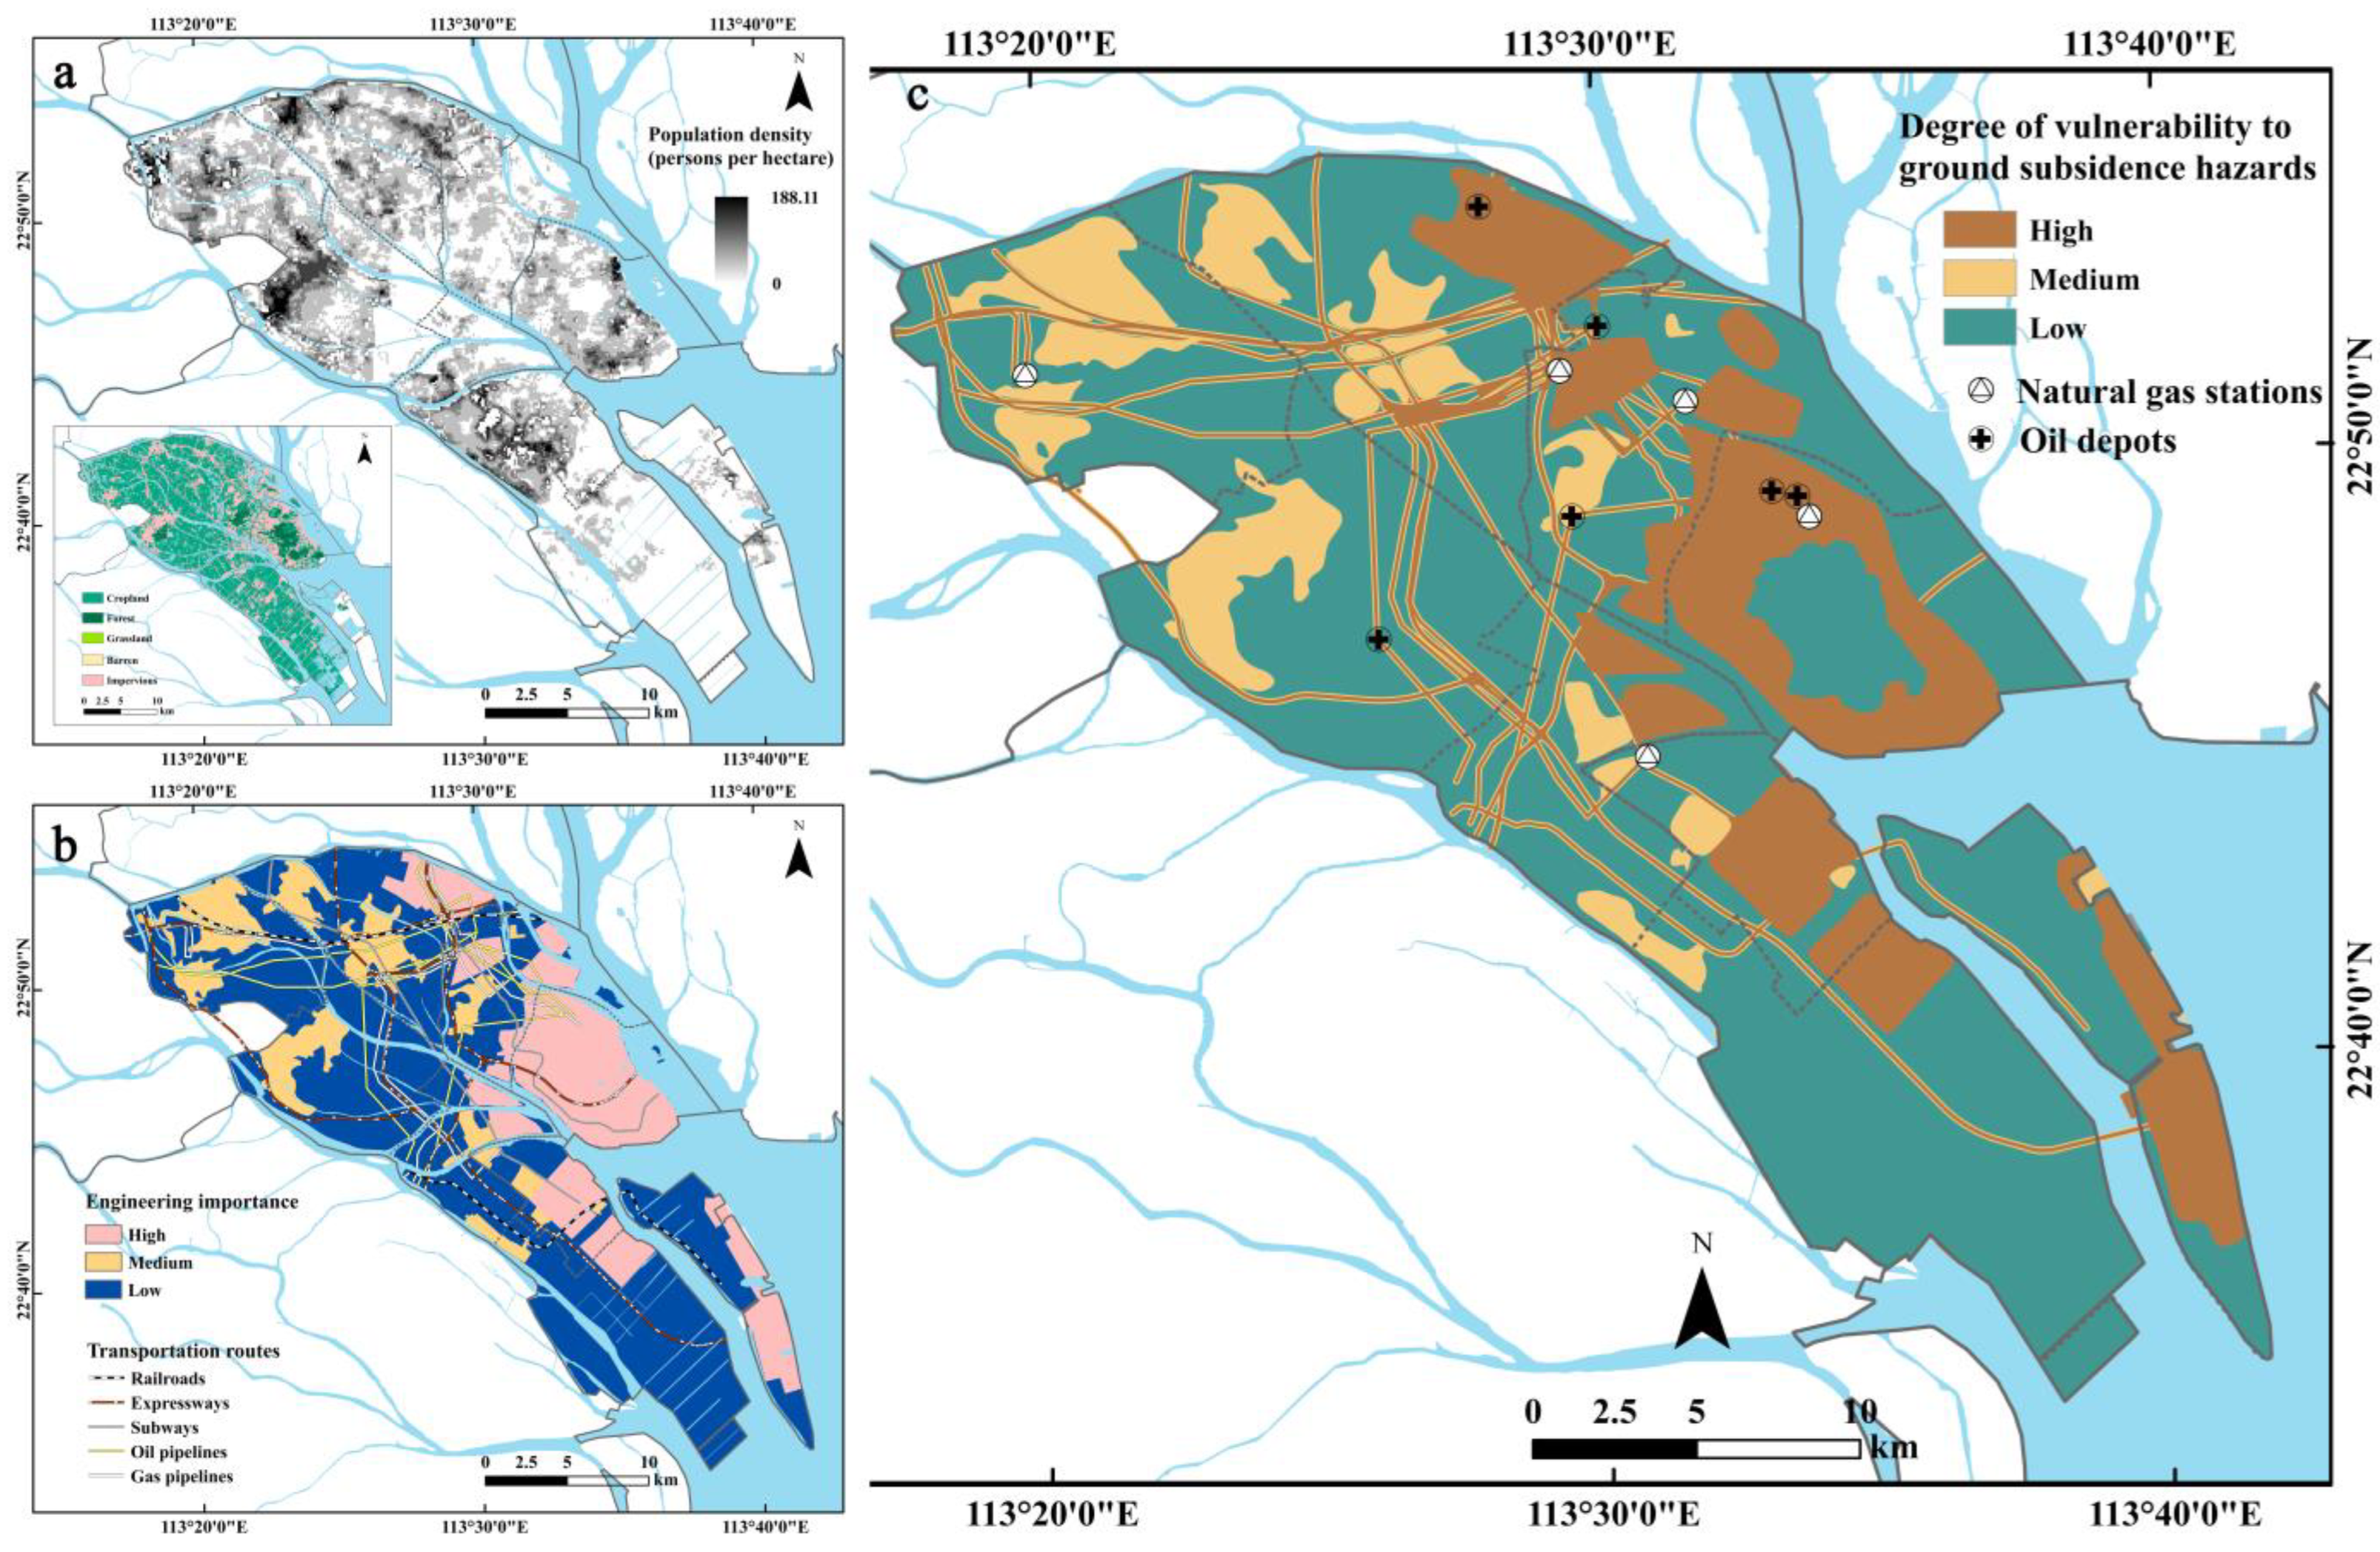
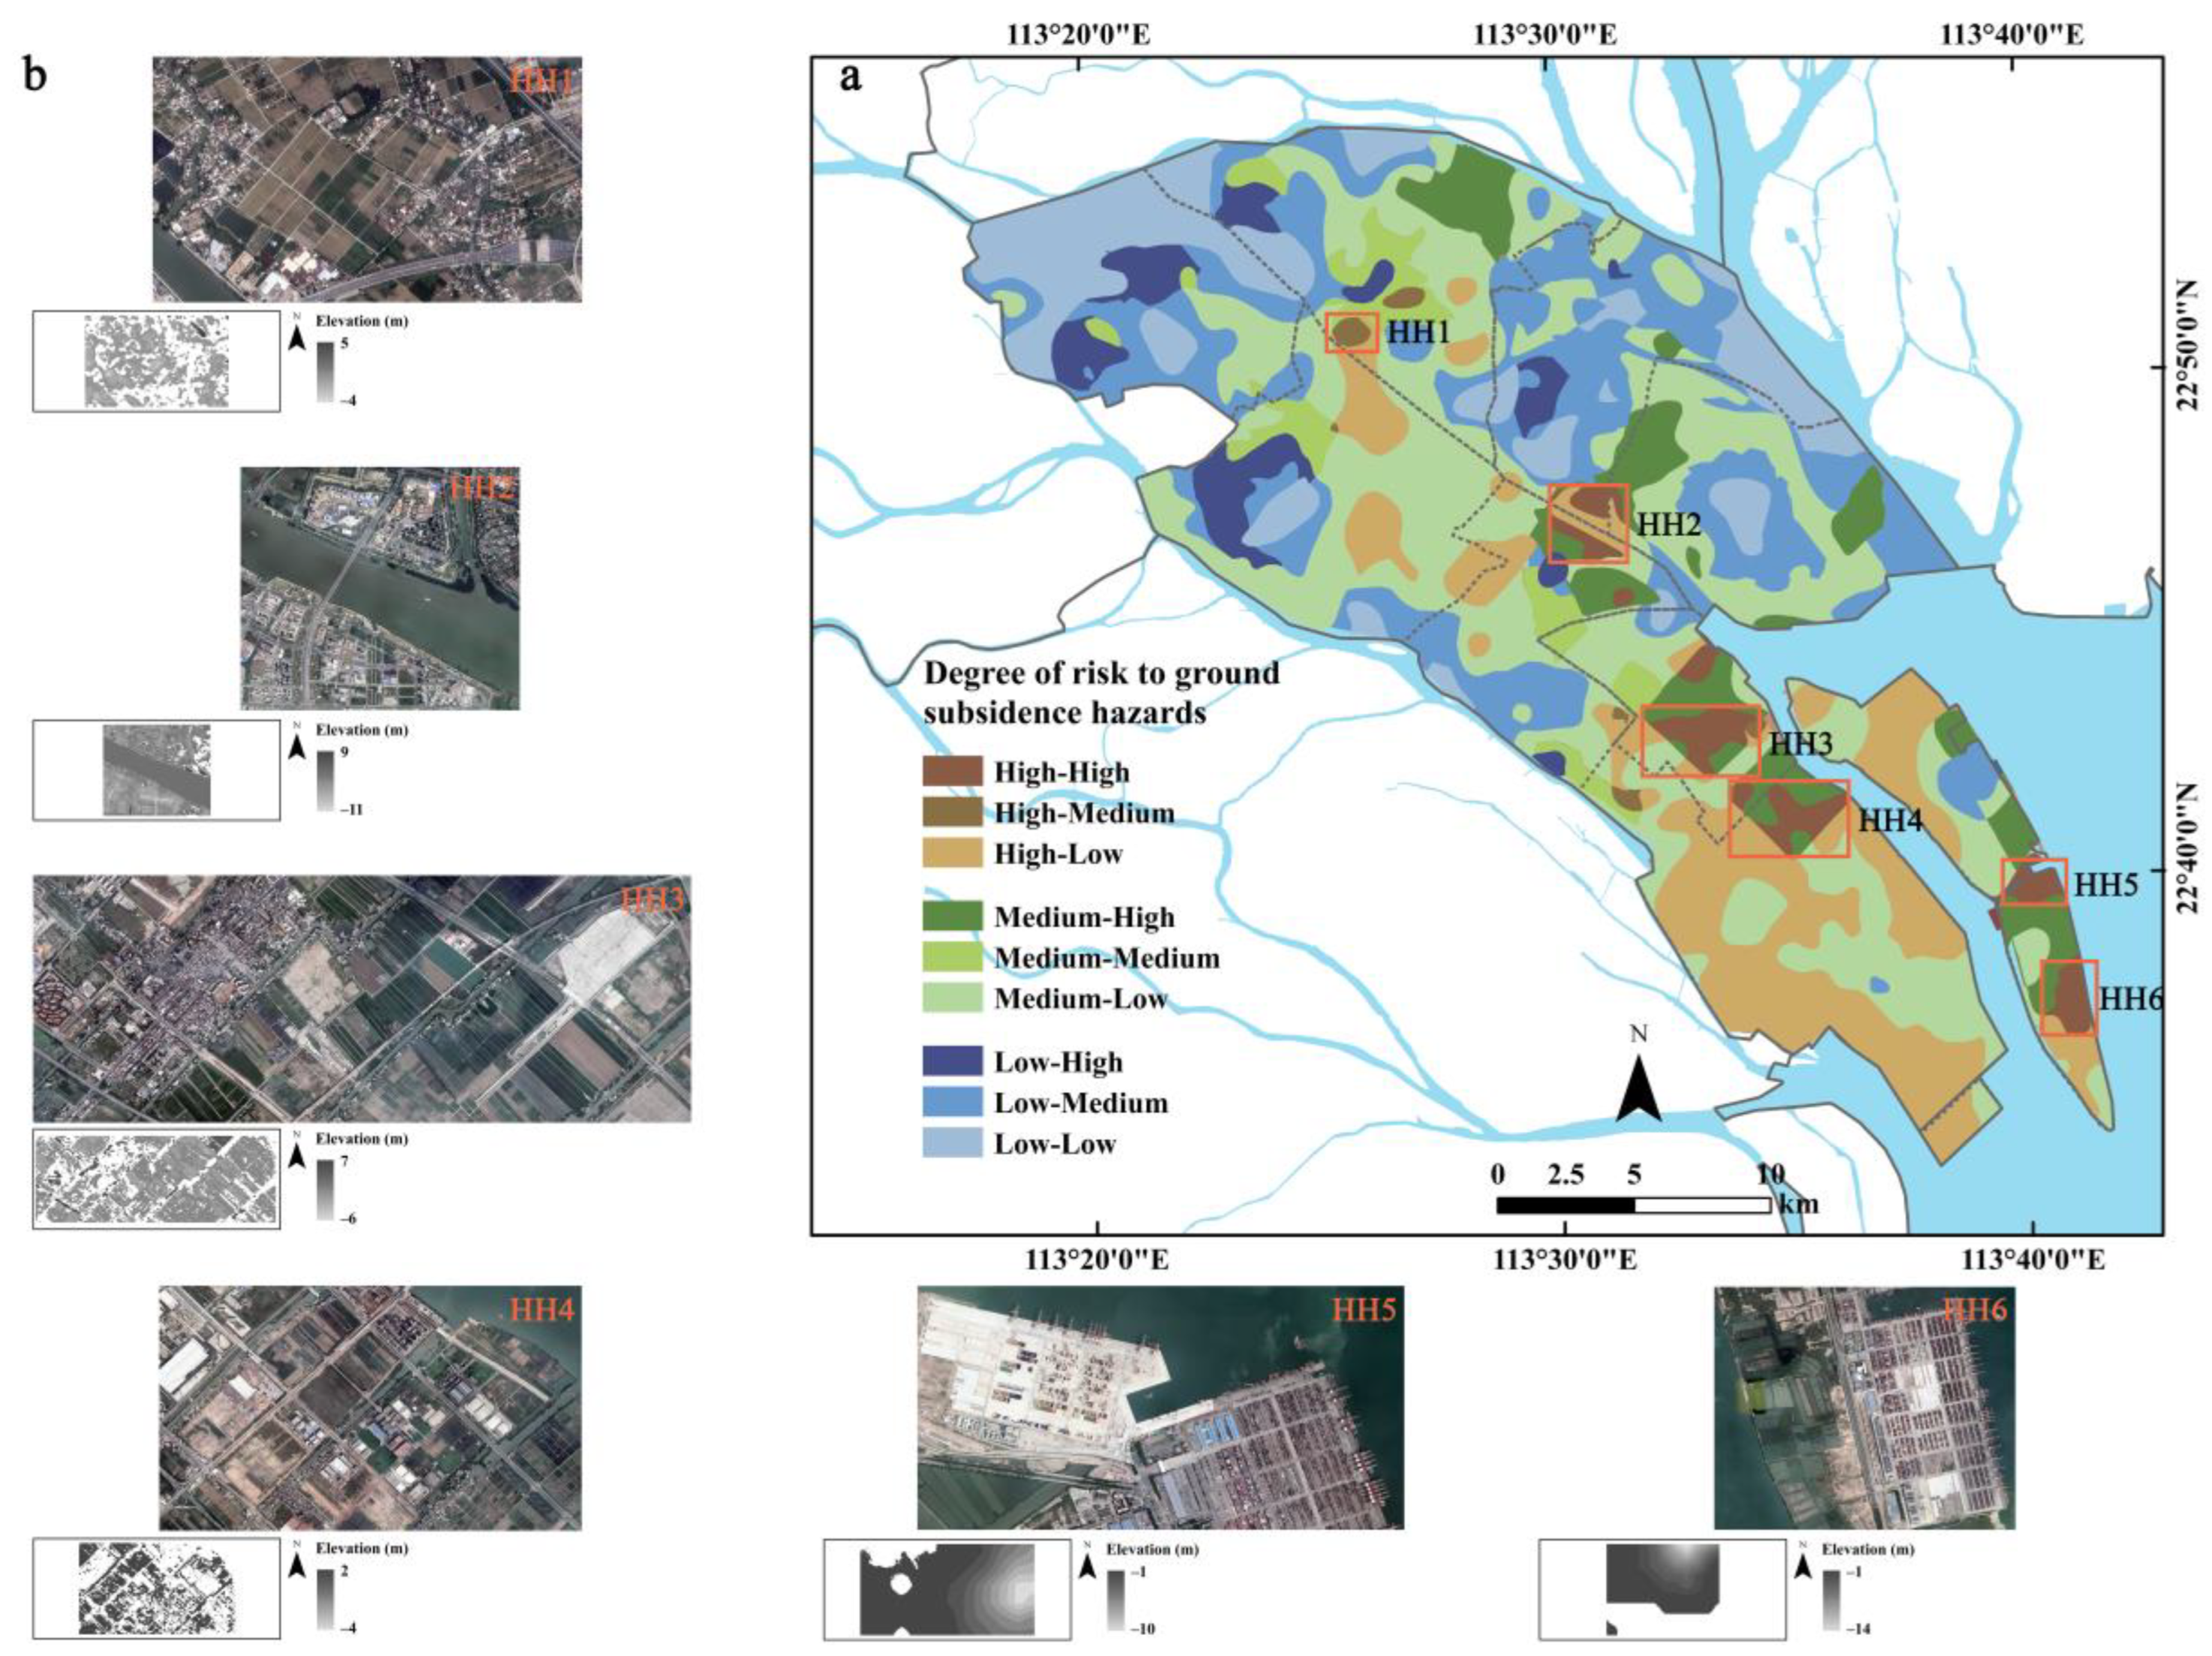
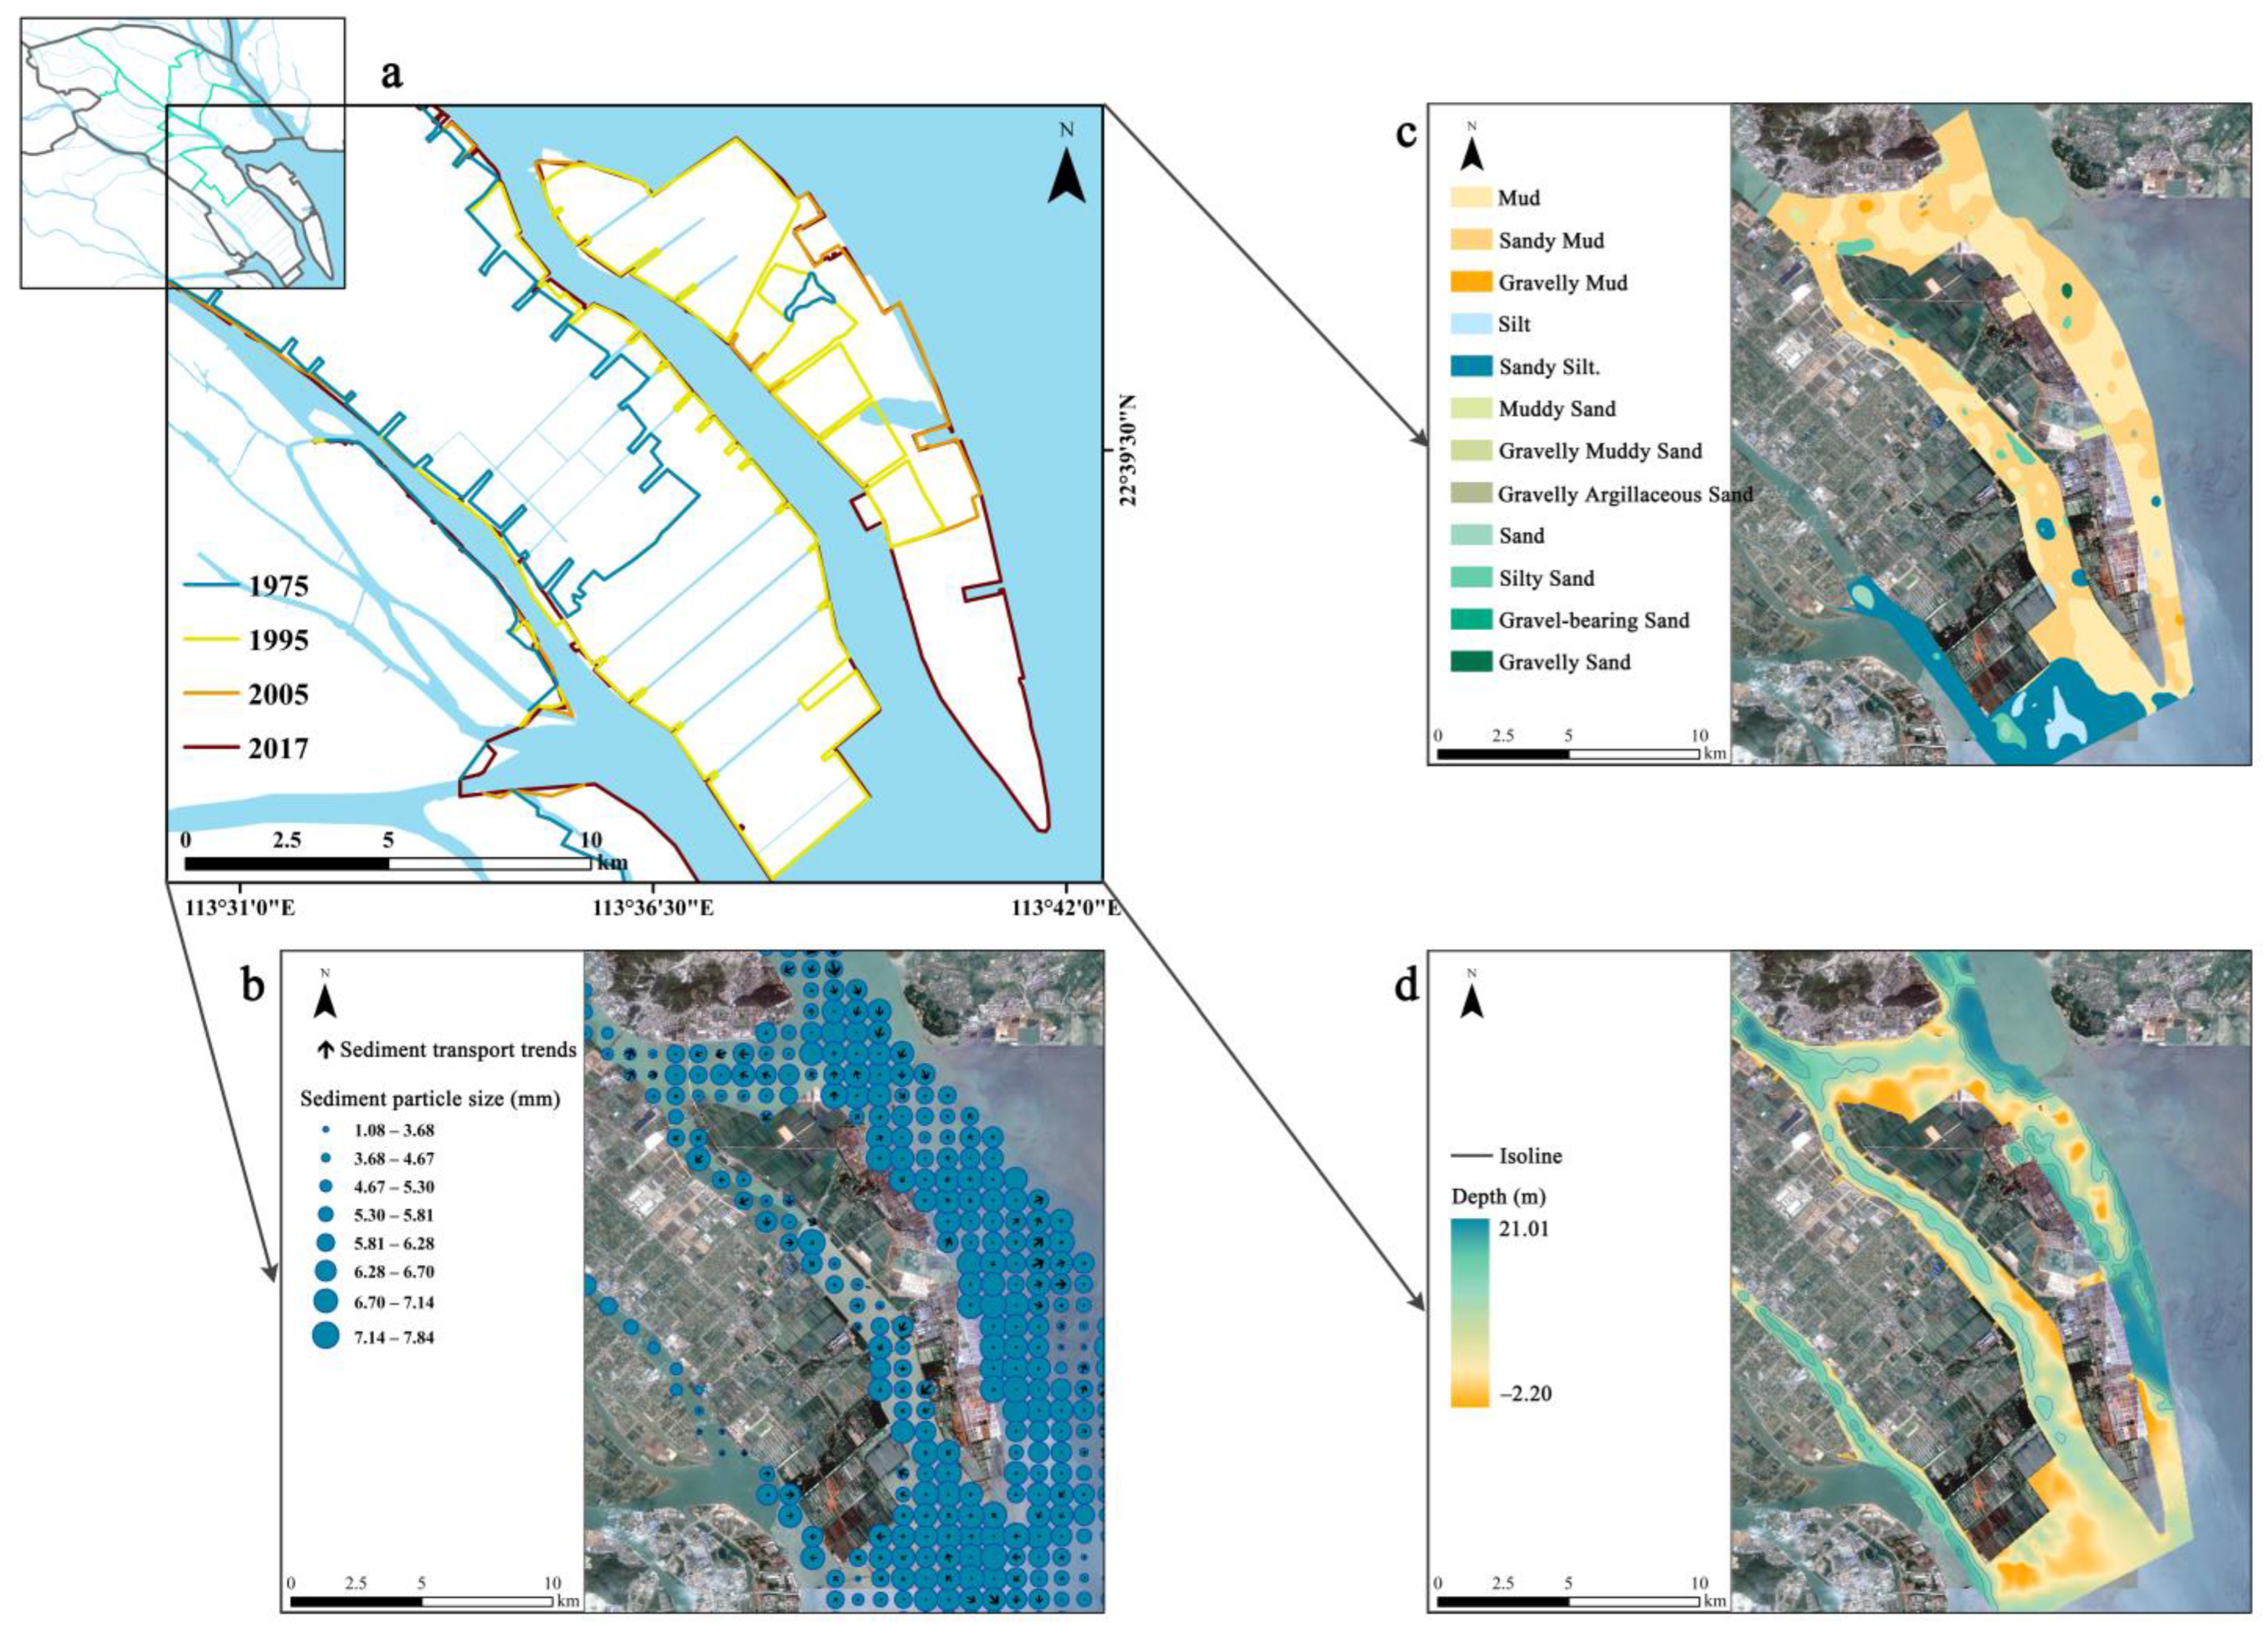
Disclaimer/Publisher’s Note: The statements, opinions and data contained in all publications are solely those of the individual author(s) and contributor(s) and not of MDPI and/or the editor(s). MDPI and/or the editor(s) disclaim responsibility for any injury to people or property resulting from any ideas, methods, instructions or products referred to in the content. |
© 2024 by the authors. Licensee MDPI, Basel, Switzerland. This article is an open access article distributed under the terms and conditions of the Creative Commons Attribution (CC BY) license (https://creativecommons.org/licenses/by/4.0/).