Article

Remotely Sensed Estimation of Daily Near-Surface Air Temperature: A Comparison of Metop and MODIS

1
School of Remote Sensing and Geomatics Engineering, Nanjing University of Information Science and Technology, Nanjing 210044, China
2
Technology Innovation Center for Integration Applications in Remote Sensing and Navigation, Ministry of Natural Resources, Nanjing 210044, China
3
Jiangsu Province Engineering Research Center of Collaborative Navigation/Positioning and Smart Application, Nanjing 210044, China
4
Innovation Academy for Precision Measurement Science and Technology, Chinese Academy of Sciences, Wuhan 430071, China
5
College of Computer Science and Engineering, Chongqing University of Technology, Chongqing 400054, China
*
Author to whom correspondence should be addressed.
Remote Sens. 2024, 16(20), 3754; https://doi.org/10.3390/rs16203754
Submission received: 20 August 2024 / Revised: 29 September 2024 / Accepted: 8 October 2024 / Published: 10 October 2024
(This article belongs to the Special Issue Advances in Thermal Infrared Remote Sensing II)

Abstract

:
The estimation of spatially resolved near-surface air temperature (NSAT) has been extensively performed in previous studies using satellite-derived land surface temperature (LST) from MODIS. However, there remains a need for estimating daily NSAT based on LST data from other satellites, which has important implications for integrating multi-source LST in estimating NSAT and ensuring the continuity of satellite-derived estimates of NSAT over long-term periods. In this study, we conducted a comprehensive comparison of LST derived from Metop with MODIS LST in the modeling and mapping of daily NSAT. The results show that Metop LST achieves consistent predictive performance with MODIS LST in estimating daily NSAT, and models based on Metop LST or MODIS LST have overall predictive performance of about 1.2–1.4 K, 1.5–2.0 K, and 1.8–1.9 K in RMSE for estimating Tavg, Tmax, and Tmin, respectively. Compared to models based on nighttime LST, daytime LST can improve the predictive performance of Tmax by about 0.26–0.28 K, while performance for estimating Tavg or Tmin using different schemes of LST is comparable. Models based on Metop LST also exhibit high consistency with models utilizing MODIS LST in terms of the variability in predictive performance across months, with RMSE of 1.03–1.82 K, 1.3–2.49 K, and 1.26–2.66 K for Tavg, Tmin, and Tmax, respectively. This temporal variability in performance is not due to sampling imbalance across months, which is confirmed by comparing models trained using bootstrapped samples in balance, and our results imply that sampling representativeness, complicated by retrieval gaps in LST, is an important issue when analyzing the variability in predictive performance for estimating NSAT. To fully assess the predictive capability of Metop LST in estimating daily NSAT, more studies need to be performed using different methods across areas with a range of scales and geographical environments.

1. Introduction

Near-surface air temperature (NSAT) denotes the atmospheric temperature at the height of about 1.5 m above the Earth’s surface, and is routinely measured by networks of surface meteorological stations with high temporal sampling frequency and high accuracy. However, meteorological stations are unevenly distributed and have very limited density of coverage, especially for large areas with diverse environments and geographical settings [1,2]. Therefore, in situ measurements of NSAT combined with interpolation techniques are inadequate to characterize spatially resolved NSAT with fine spatial structures [3,4,5], which provides the basis for environmental assessments [6], urban studies [7], and land surface models for eco-hydrological processes [8,9].
Some multi-spectral imaging instruments mounted on satellites have the capability to acquire spatially continuous thermal infrared observations of land surfaces, from which several operational datasets of land surface temperature (LST) have been derived [10,11]. Due to the relationship between LST and NSAT at different temporal scales [12,13,14], a growing body of research has been performed to estimate spatially continuous NSAT based on satellite-derived LST. Compared to gridded NSAT data from in situ measurement by spatial interpolation [15,16], pixel-level estimates of NSAT can be reconstructed from LST at high spatial resolutions; furthermore, the estimates are constrained by LST retrievals or satellite observations.
A relatively large number of studies have been performed to estimate daily and monthly NSAT based on MODIS LST using a variety of methods. In general, three types of methods are used, including the temperature vegetation index (TVX) approach [17,18,19], models that parameterize processes of energy balance with LST [20,21], and statistical learning algorithms [3,22]. In contrast to the other two types of methods, statistical methods or learning algorithms have great adaptability and high predictive performance for estimating NSAT based on satellite-derived LST [23,24,25]. Therefore, in the most recent years, nearly all studies for the estimation of NSAT employed different types of statistical learning algorithms, such as random forest [5,26,27], Cubist models [28,29], neural networks [30,31,32,33]. In addition, statistical regression methods such as linear regression models [34,35], mixed-effect regression models [36] and spatial regression models [37] have also been utilized for estimating NSAT using MODIS LST. Although various types of statistical methods have been applied and evaluated in the estimation of NSAT, it is worth noting that the selection of samples of input features used for fitting estimation models based on statistical methods is of great importance for the predictive performance of the models [5,24,38]. NSAT can only be estimated at daily or monthly scales using LST from sensors onboard polar-orbiting satellites, such as the MODIS sensors of NASA’s Terra and Aqua. To estimate NSAT at high temporal scales or high spatial resolutions, several studies have attempted to develop models for estimating hourly NSAT based on LST derived from geostationary satellites [23,25]. In addition, LST derived from the thermal infrared (TIR) observation of the Landsat satellites has been employed for estimating NSAT at fine spatial resolutions [39,40]. Due to the compromise between the temporal scales and spatial resolutions of satellite observations, NSAT has only been estimated at high spatial resolutions in small-scale urban regions using Landsat data. In addition to MODIS, there are various polar satellites configured with spectral imaging sensors capable of observing at thermal infrared channels, especially meteorological satellites in the missions of China’s FY-3, EUMETSAT Polar System (EPS), and NOAA’s JPSS. Thermal infrared observations from these satellites have been used to generate operational LST datasets [41,42], such as the EPS daily LST product (LSA-002) developed by LSA SAF using observations of the Metop satellites in EPS [43]. However, there are very limited studies focused on estimating daily NSAT using LST data from other polar satellites, except using the MODIS LST from Terra and Aqua. Although a relatively large number of studies have been performed for estimating NSAT from MODIS LST at daily scales, including daily average [44,45], daily minimum, and daily maximum temperatures [14,22,46,47,48], there remains a need to perform studies estimating daily NSAT based on LST data from other polar satellites, which has important implications for integrating LST from multiple satellites in NSAT estimation and ensuring the continuity of satellite-derived estimates of NSAT over long-term periods. Terra and Aqua have been in operation in orbits for more than 20 years, far exceeding the life expectancy of the satellites. Considering the degradation in payloads and decommission of the satellites, growing attention should be paid to the continuity of satellite-derived estimates of NSAT, which requires studies for estimating daily NSAT using the LST data from other satellites that are comparable to MODIS LST. Particularly, the predictive capability of the LST data in the estimation of different scales of daily NSAT needs to be fully assessed and compared with the estimation based on MODIS LST, which has not been explored in previous studies.
In this study, we developed models based on Metop LST to estimate spatially continuous NSAT at daily scales, including daily average, maximum, and minimum temperatures. the consistency between Metop LST and MODIS in estimating daily NSAT was comprehensively analyzed. The mapping capability of daytime LST and nighttime LST in estimating different types of daily NSAT was also analyzed for Metop and MODIS. All models developed in this work were specified with different schemes of LST from one satellite, and two sets of auxiliary variables were designed for the models to justify the importance of incorporating Julian day in the modeling of daily NSAT. The models were trained by a statical learning technique using samples extracted at surface stations. Cross-validation was used to evaluate the predictive performance of the models, and the temporal variability of the performance was explored. Due to retrieval gaps in LST data, the size of samples for the models is imbalanced across months. We designed experiments for model training with balanced samples across months by bootstrapping, and as such, we analyzed the influence of sample size and the imbalance of samples on the mapping accuracy of daily NSAT.

2. Materials and Methods

2.1. Study Area

The estimation of daily NSAT was conducted for Yangtze River Economic Belt (YREB) shown in Figure 1, which is the strategic region in the new era of high-quality development for the eco-environment and economy. The YREB region is part of the Yangtze River basin in the southern China, and consists of 11 provinces and municipalities in the vicinity of the river. YERB is characterized by high economic activities with an increasingly improved structure of industry. YERB plays an important role in facilitating regional connections between the east and the west in terms of synergistic developments. Under the development framework for YREB, developments in this region are carried out with the priority to protect and improve eco-environments. The YREB region spans longitudes from 96°15’E to 122°19’E and latitudes from 24°25’N to 36°40’N. The western parts of YREB have complicated topography with ragged mountains and the Sichuan basin, while the east primarily consists of plains and hills. Three main climate types, including alpine, sub-tropical monsoon and warm monsoon, prevail across the region from the west to the east.

2.2. Datasets

2.2.1. In Situ Observations

Ground-based observations of NSAT used in training models for estimating daily NSAT (Tmin, Tmax, and Tavg) were extracted from a daily dataset released by the National Meteorological Information Center (http://www.nmic.cn/data/, accessed on 5 July 2024) of China Meteorological Administration (CMA). The dataset was developed using synoptic observations collected at about 700 national ground meteorological stations in accordance with strict processing standards and measures of quality assurance. Specifically, we used daily temperature records from the 269 stations in YREB, as shown in Figure 1, for the year 2019. Compared to the eastern areas of YREB, daily observations from the stations are inadequate in spatial sampling in the western parts, which are characterized by complicated topography.

2.2.2. Land Surface Temperature

EPS daily LST (ELST) is developed by LSA SAF (https://lsa-saf.eumetsat.int, accessed on 8 July 2024), which is an application ground segment of EUMETSA. ELST is referred to as Metop LST in this study, and was retrieved from AVHRR observations acquired by the Metop satellites constituting the EUMETSAT Polar System (EPS). EPS consists of 3 meteorological satellites, including Metop-A, Metop-B, and Metop-C, which were designed with the same suite of instruments and scheduled for sequential operations to ensure continuous observations in a period of more than 15 years. Terra and Aqua, which are famous polar satellites in the NASA’s EOS mission, have been operationally in orbits since the early 2000s, and both satellites carry a MODIS instrument with identical configurations for acquiring multi-channel earth observations from the visible to the infrared spectrum range. In addition to Metop LST, we utilized daily MODIS LST datasets (https://ladsweb.modaps.eosdis.nasa.gov, accessed on 5 June 2024), including Terra LST (MOD11A1) and Aqua LST (MYD11A1). MODIS LST data have been extensively applied to estimate daily NSAT in previous studies, and were used in this study for comparing differences between Metop LST and MODIS LST in the predictive performance of daily NSAT. AVHRR sensors mounted on the Metop satellites are similar to MODIS in terms of general observing functionalities. Metop LST was operationally generated using a retrieval algorithm based on Generalized Split-Window (GSW) [49], which was first developed by Wan and Dozier [50] to retrieve LST from MODIS observations. The GSW algorithm and its variants utilize infrared observations from two thermal channels to reduce the effects of the atmosphere on the retrieval of LST.

2.2.3. Data for Auxiliary Inputs

In addition to LST, several variables, including NDVI, topographic elevation (ELEV), day of year (DOY), month (MON), longitude (LON), and latitude (LAT), were used as auxiliary inputs to develop models for estimating daily NSAT. NDVI was extracted from MOD13A2 (https://lpdaac.usgs.gov/products/mod13a2v061/, accessed on 21 June 2024), which is a 16-day composite product of remotely sensed vegetation indices developed from MODIS observations. The elevation data used in this study were obtained from SRTM30_PLUS, which is a global topography dataset with a resolution of about 1 km. SRTM30_PLUS was developed using multi-source DEM products, including SRTM30, GTOPO20, and topography data derived from ICESat observations [51].

2.3. Schemes of Modeling NSAT

The basic principle of estimating spatially continuously NSAT from satellite-derived LST using statistical methods is to construct a model that captures the relationship between ground truth NSAT and a set of input covariates with LST as the primary input. To improve the predictive performance of the model for NSAT, several auxiliary covariates should be included into the model. The auxiliary covariates used for estimating daily NSAT in this study (see Section 2.2.3) are readily available and validated in previous studies [31,52]. As such, the estimation model f is formally expressed as follows:
N S A T   ~   f L S T ,   N D V I ,   E L E V ,   L O N ,   L A T , M O N ,   D O Y
Samples of the input covariates were extracted at ground stations and matched with daily observations of NSAT from the stations. The model f can then be fitted by various statistical methods using the in situ samples. Random forest is an ensemble learning algorithm with high capability of modeling and insensitivity to tuning of hyper-parameters, and has been widely used in the previous studies for NSAT estimation [22,23,25] and other fields of remote sensing [53]. We utilized the random forest algorithm for fitting estimation models developed in this study. We defined a uniform grid with a resolution of 1 km covering the study area, and estimates of daily NSAT were produced for the cells of the grid. All LST retrievals and auxiliary variables used as inputs for the model were regridded onto a uniform grid with a 1 km resolution on a daily basis. Estimates of NSAT can be obtained for each grid cell by applying the fitted model with values of covariates at the cell.
Aiming at assessing the predictive performance of models based on Metop LST for estimating daily NSAT and comparing the models with models based on MODIS LST, groups of models for three types of daily NSAT, including the daily average (Tavg), daily minimum (Tmin), and daily maximum (Tmax), were designed using input covariates with different schemes of LST and auxiliary variables (Figure 2). There are daytime LST and nighttime LST retrievals from each satellite. To model each type of daily NSAT, 9 different schemes of LST variables and 2 schemes of auxiliary variables were designed as the input schemes for the NSAT estimation models, resulting in 18 models, each specified with different input variables. We designed two schemes of auxiliary inputs with the Aux2 scheme additionally incorporating the DOY (day of year) variable compared to Aux1, and we can thus assess the importance of incorporating daily temporal information into the modeling of daily NSAT, which was claimed to be trivial in a recent study for estimating daily NSAT [37]. The models established in this work utilized only LST from one satellite with the aim of comparing differences in predictive performance between Metop LST and MODIS LST in estimating daily NSAT. For models based on LST from one satellite, such as Metop, we specified two models using daytime LST (Metop Day) or nighttime LST (Metop Night), and a model utilizing both daytime and nighttime LST. The models were trained using random forest with the same setting of parameters, and assessed using the same CV procedures. A total of 54 models were specified and assessed in this study, and the models can be clearly categorized by three dimensions, including daily scales of NSAT, LST schemes, and schemes of auxiliary inputs.
The samples used for training the models can be bootstrapped to explore the effects of sample size and its temporal imbalance on the predictive performance of the models. We observed that the size of the samples is highly imbalanced across months. In addition to training the models using all available samples, the experiments were designed to train models based on Metop LST for daily NSAT using balanced samples across months by bootstrapping. Specifically, models based on Metop daytime LST were trained using balanced samples with 6 different sizes, and the models based on Metop nighttime LST were trained using balanced samples with 5 different sizes. The sizes for balanced samples are listed in Table 1. For a specific sample size, 5 repeats of balanced samples were first bootstrapped from all available samples, and a model based on one LST scheme was trained using each repeat of bootstrapped samples. As such, the model for one scale of daily NSAT based on Metop daytime LST was trained using 30 different sets of bootstrapped samples. In total, models for three scales of daily NSAT based on different Metop LST schemes were trained using 240 different sets of balanced samples by bootstrapping.

2.4. Assessment of Mapping Performance

We used 10-fold cross-validation (CV) to assess the predictive performance of the models specified in our study. For each model, the samples were first randomly partitioned into 10 folds of subsamples with roughly equal sizes, and each fold of subsamples was used as a validation set, with the remaining 9 folds of subsamples used as a training set in each round of model training. We performed 10 rounds of training for each model, resulting in 10 trained models with all samples validated once. Using values of observed and predicted daily NSAT in the validated samples, performance metrics such as root mean squared error (RMSE) and mean absolute error (MAE) were computed to measure the predictive performance of the models.

3. Results

3.1. Overall Assessments of the Models

The models based on the Metop LST for estimating NSAT at three daily scales were assessed using the cross-validation results. We observed that the models additionally incorporating the DOY variable (Aux2) performed consistently better compared to the models without DOY. Figure 3 presents an overall assessment of the models for daily NSAT using the Metop LST and Aux2. Both the Metop daytime LST and the nighttime LST performed better in estimating daily average NSAT (Tavg) than in estimating daily extremes of NSAT. Tavg was estimated with an overall RMSE of 1.35 K by models based on the Metop daytime LST or nighttime LST, and the predictive accuracy of Tavg was increased by roughly 0.1 K when simultaneously using daytime LST and nighttime LST from Metop. The Metop daytime LST has higher predictive capability than the nighttime LST for estimating the daily maximum NSAT (Tmax), with a decrease of 0.25 K in terms of RMSE in average. Compared to the model for Tmax using only daytime LST with an RMSE of 1.72 K, the model based on the Metop daytime LST and the nighttime LST achieved an average RMSE of 1.57 K, with a decrease of 0.15 K in estimating daily maximum NSAT. In contrast, there are no significant differences in predictive performance between the Metop daytime LST and the nighttime LST in estimating the daily minimum NSAT (Tmin). Estimating the Tmin by different schemes of the Metop LST results in relatively lower predictive accuracy, with an RMSE of about 1.8 K. In addition, the predictive accuracy of the Tmin is not improved by considering both the Metop daytime LST and the nighttime LST, compared to the case when one Metop LST is used for estimating the Tmin.
We evaluated the overall predictive performance of the models for three daily NSAT types using different schemes of LST from three satellites and auxiliary variables (Figure 4). In general, there are no significant differences in the predictive accuracy of daily NSAT across the models specified with MODIS LST (Terra or Aqua) and the models with Metop LST, revealing that the predictive capability of the Metop LST in estimating daily NSAT is approximately similar to that of the MODIS LST. Daily scales of NSAT are consistently estimated with reasonably better accuracy by models that incorporate DOY (Aux2) when using different schemes of LST from Metop or MODIS, highlighting the importance of incorporating Julian day (DOY) in modeling daily NSAT using satellite LST. The models based on different satellite LST, with the additional incorporation of DOY, achieve RMSE values of approximately 1.2–1.4 K, 1.5–2.0 K, and 1.8–1.9 K for estimating daily Tavg, Tmax, and Tmin, respectively. Owing to the addition of DOY, the errors in predictive performance are overall reduced by about 0.35 K for the models of Tavg and Tmax in terms of RMSE, and the errors are even decreased by about 0.45 K for the models of Tmin.
Despite the moderate differences in predictive performance (about 0.2 K) of Tavg and Tmin across the models using the daytime LST from MODIS or Metop and Aux1, the differences are substantially reduced when additionally incorporating DOY in the models. This suggests that LST variables corresponding to different times of the satellite’s overpasses can result in similar predictive performance for the models of Tavg and Tmin when using reasonably selected auxiliary variables in the models. Nevertheless, there are significant differences in the predictive performance of Tmax between the models with daytime LST and the models with nighttime LST, and the differences are about 0.26 K and 0.28 K when using Aux1 and Aux2, respectively. In addition, simultaneously considering daytime and nighttime LST in the models of daily NSAT with Aux1 can significantly improve the predictive performance of the models, and the improvements are 0.2 K, 0.37 K, and 0.21 K for Tavg, Tmax, and Tmin, respectively. We also found that the predictive capability across the models using different LST schemes and auxiliary variables for estimating Tmax and Tmin is lower than that for Tavg. Thus, the modeling of daily extreme NSAT (Tmax and Tmin) is more difficult than that of the daily average NSAT using either daytime or nighttime LST.

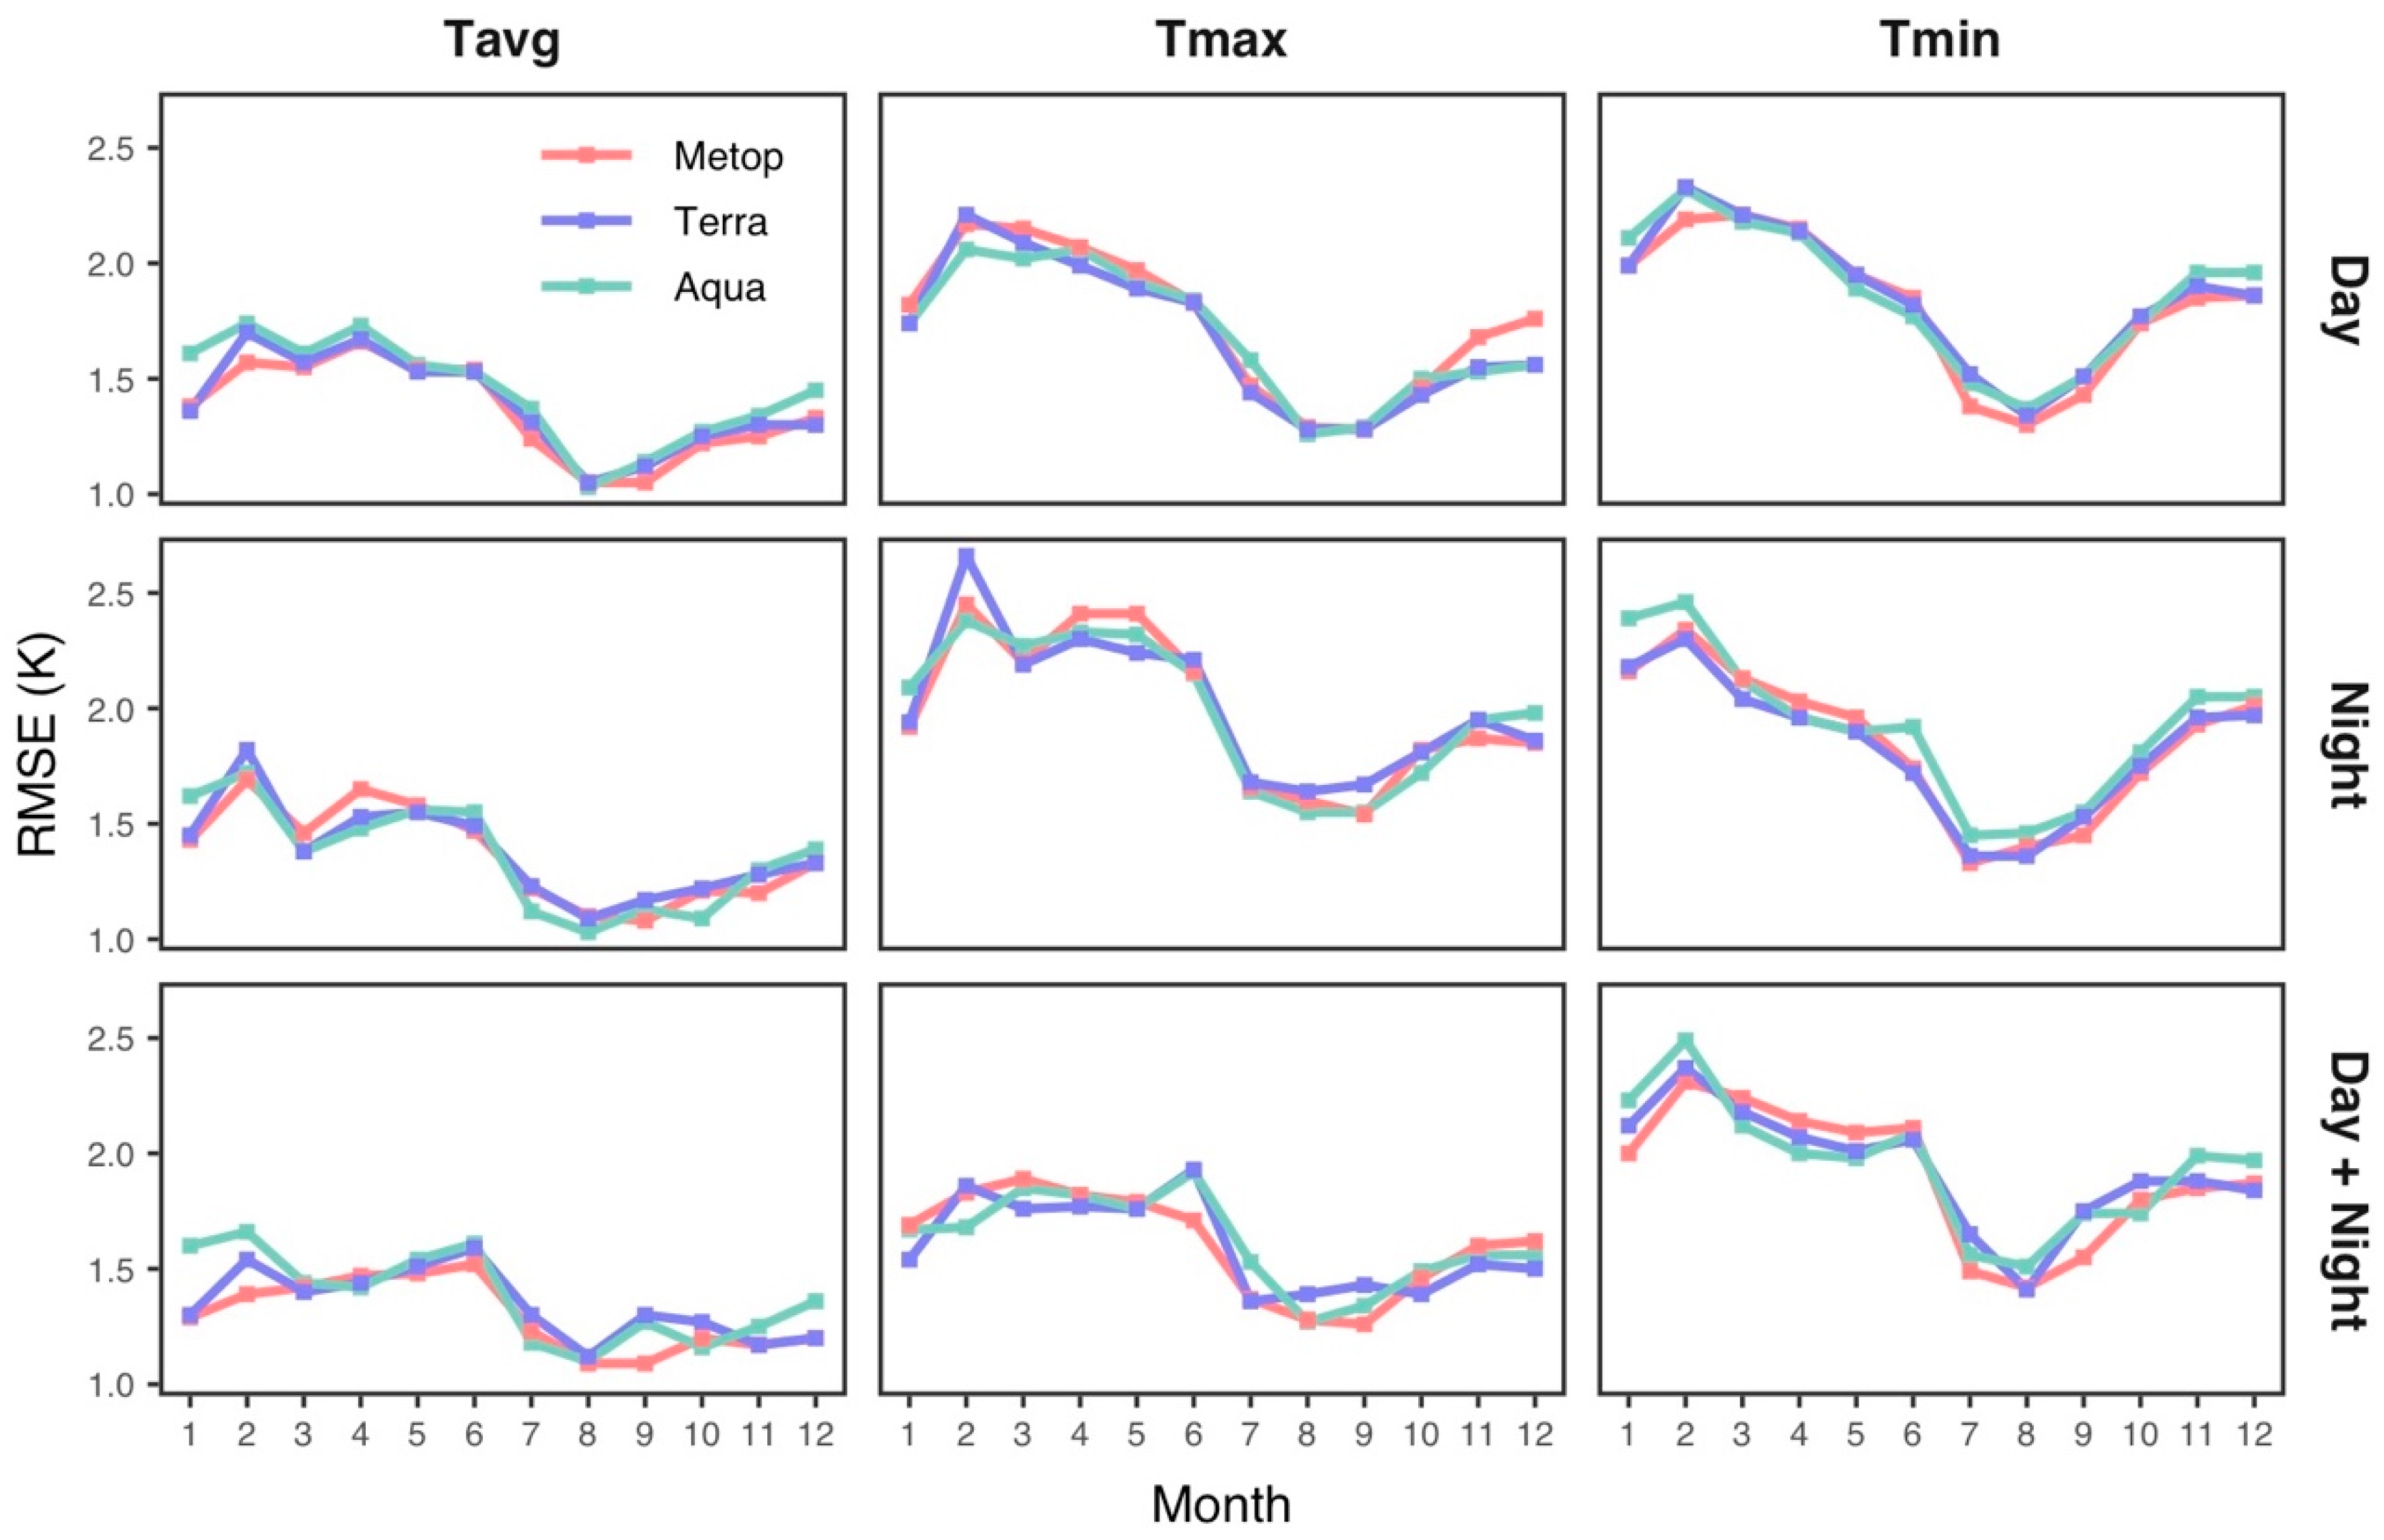
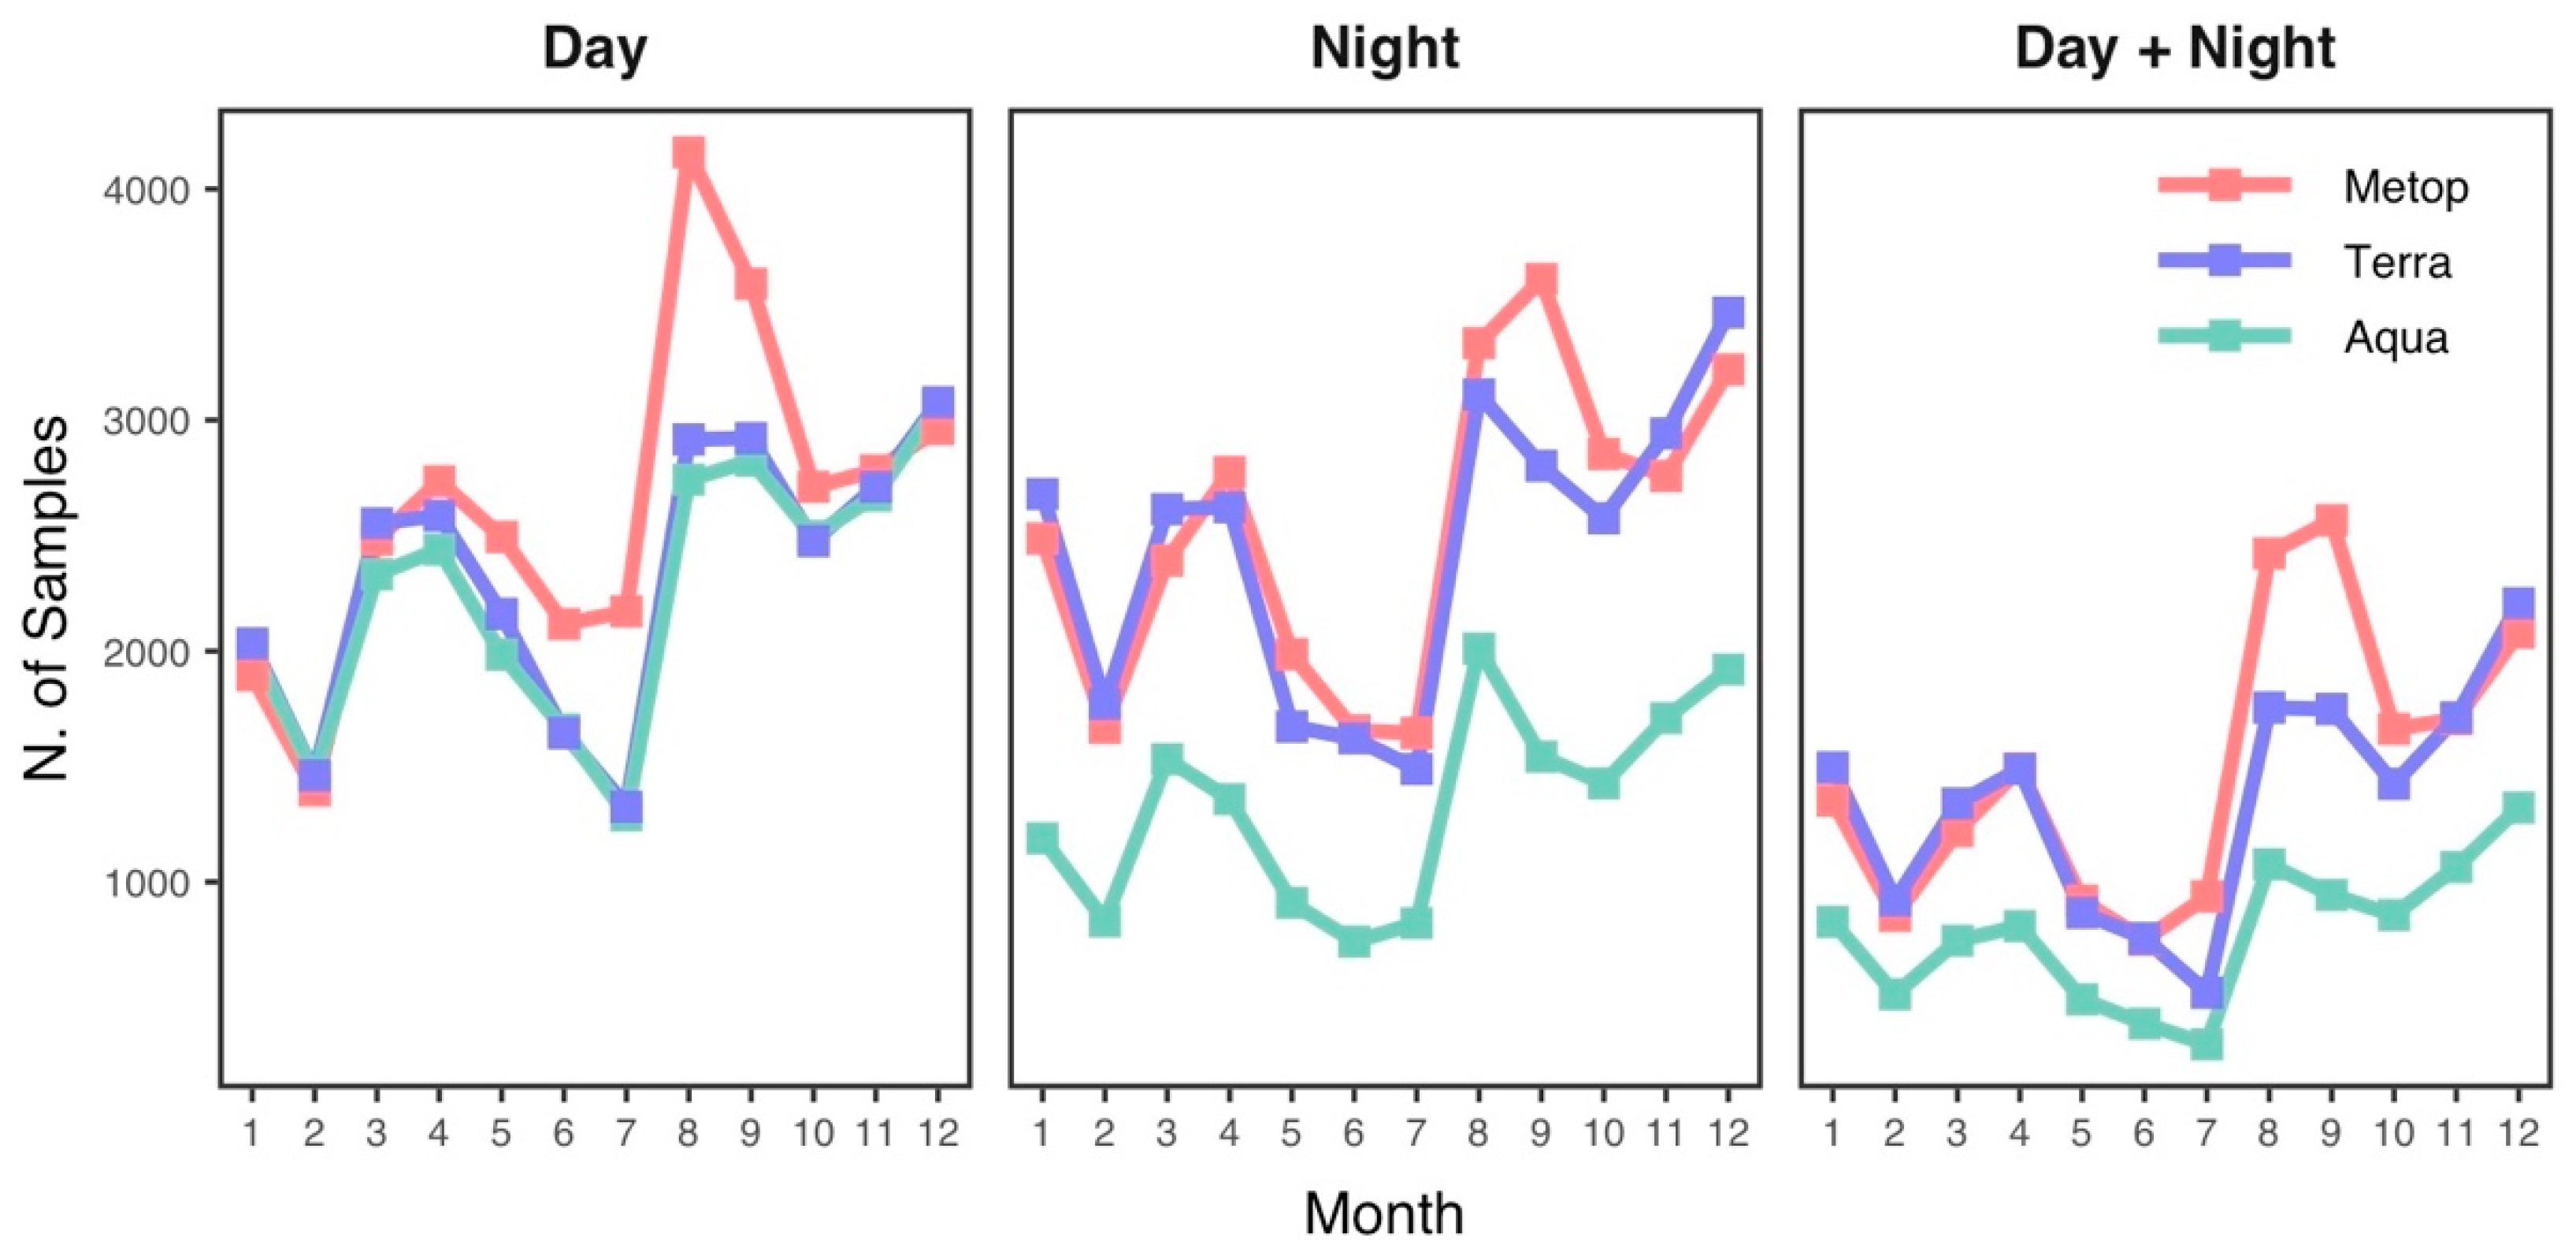
3.2. Assessment of the Models at Temporal Scales

As there is great variability in the number of samples and their distribution across sites due to data gaps in the satellite LST data, we analyzed the predictive performance of the models based on the Metop LST on a daily basis for days with valid samples for more than 70% ground sites (Figure 5). As indicated by Figure 4, there are apparent differences in overall predictive accuracy across models using different LST schemes of a satellite, which is confirmed in Figure 5, showing how the models perform at the daily scale. When modeling without DOY, the models based on daytime LST and nighttime LST have higher predictive capability for estimating the daily Tavg and Tmax, respectively. When considering DOY, there are slight differences in the predictive performance of the models using different LST schemes for estimating daily NSAT, especially for estimating Tavg.
To examine how the models for daily NSAT perform across different months, we used a validated sample for the models to compute the mean RMSE for each month (Figure 6). Because of the variability in the retrieval gaps in different LST schemes, there are great differences in the sizes of the samples used for training the models based on different LST schemes, as presented in Figure 7. The models based on LST from different satellites have similar variability in predictive performance across months, confirming the consistency between Metop LST and MODIS LST in estimating daily NSAT. The predictive accuracy of the models for Tavg exhibits variability across months, with RMSE of 1.03–1.82 K, while the models for the Tmin and Tmax have higher variability in predictive accuracy, with RMSE of 1.3–2.49 K and 1.26–2.66 K, respectively. These results show that models with higher overall predictive performance also perform better across months. The models for three daily NSAT scales using different LST schemes consistently reveal that daily NSAT can be estimated with higher predictive accuracy for the summer months and with relatively poor performance for the months around February.
As seen from Figure 7, there is a significant imbalance in the size of the samples across months for models based on different LST schemes, and the sample size for the models is generally higher for the months around August. Sample size for models based on the Aqua nighttime LST is substantially lower than that based on the nighttime LST from Metop and Terra. When modeling using both daytime and nighttime LST, the size of the available samples is significantly reduced compared to modeling NSAT using only one type of LST.
To assess how temporal imbalance and the size of the samples across months impact the predictive performance of estimation models for daily NSAT, the models based on the Metop LST were trained using balanced samples across months (Table 1), which were bootstrapped from the available samples extracted at sites. Figure 8 shows average RMSE across months for the models trained with balanced samples with different sizes, and the solid line represents the average RMSE across months for the models trained using all available samples.
As shown in Figure 8, we can see that there are consistent monthly variations in predictive performance across the models based on different LST schemes when trained with balanced samples, and these variations also align well with the monthly variabilities in predictive performance of the models trained using all samples. Thus, temporal variation of predictive performance across months with lower errors in the summer months and high errors in the spring months do not result from the temporal imbalance of the samples, and it may be due to varying complexities of atmospheric dynamics and the interaction between the lower atmosphere and ground surfaces across months. In addition, we found that, when training with balanced samples, the predictive performance across months is consistently improved with an increasing number of samples used in training across all models based on different LST schemes. Compared to training models with all samples, all models trained with balanced samples achieved lower RMSE errors across months. It is important to note, however, that models trained using balanced samples with limited size even perform better than the models trained using all samples. Figure 9 shows the overall performance of the models trained using balanced samples, which indicates that the performance of the models is improved when increasing the size of the samples in model training.

3.3. Mapping of Daily NSAT

Daily maps of Tavg, Tmax, and Tmin were spatially estimated for the study area with a resolution of 1 km using the models based on the MODIS LST and the Metop LST. The estimated NSAT is only available for the clear-sky areas where the retrieval of LST was performed. The coverage of estimated NSAT for the days of the year 2019 is determined by the data coverage of daytime or nighttime LST, which is presented in Figure 10. Temporal variability in the daily coverage across the LST of Metop and MODIS is similar during the year. The study area is adjacent to the Pacific Ocean and the Indian Ocean, and prevails a typical monsoon climate. The abundant water vapor transported by atmospheric circulation from the oceans to the air above the area during the summer months facilitates cloud development and precipitation. Therefore, the overall data coverage of estimated NSAT for the study area is fairly low, with averages between 23% and 35%. In particular, the LST from three satellites has extremely low coverage, with an average of 14% in the period between Julian day 167 and day 205, when monsoon rain dominates the Yangtze River basin. Because of massive data gaps in LST retrievals, estimating daily NSAT based on satellite LST with high-coverage and low errors remains a great challenge, especially for areas experiencing lengthy rainy seasons, such as areas of the Yangtze River basin.
Figure 11 and Figure 12 show estimated maps of daily NSAT at a resolution of 1 km using different estimation models for a day with high coverage of LST retrievals. As shown in Figure 11, similar spatial pattens of daily NSAT are reproduced by models using different schemes of Metop LST, and there are significant variabilities in the spatial distribution of gaps between daily NSAT estimated from the daytime LST and that from the nighttime LST. Estimated NSAT from the nighttime LST is subject to massive areas with data gaps in the northeastern and southwestern parts of the study area, while the daily NSAT in these parts is estimated with approximately full coverage when using the Metop daytime LST. In the eastern region, the gaps in estimated NSAT result from incomplete swath coverage of Metop AVHRR in consecutive orbits, and some parts of the gaps in the estimated NSAT using daytime LST are with values for the estimated NSAT using nighttime LST. Thus, the coverage of daily NSAT estimates can be increased by integrating the daytime and nighttime LST of one satellite in developing models for estimating daily NSAT. Differences between estimated NSAT from daytime LST and nighttime LST need to be reasonably resolved.
In addition, estimating daily NSAT using models simultaneously considering both daytime and nighttime LST generally results in higher predictive accuracy than models using only one type of LST, leading to significant decreases in data coverage for estimated NSAT. However, compared to these models, approximately equivalent predictive accuracy can be achieved for models using only one type of LST when the auxiliary variables for the models are reasonably selected, such as the models with Aux2 (Figure 4).
The estimates of daily NSAT can also be complemented by models using LST from different satellites, as exemplified in Figure 12, which shows maps of estimated daily NSAT using the daytime LST of three satellites. Eastern areas with data gaps due to swath coverage in the estimated NSAT from the Metop LST have valid values in the estimated NSAT from the Terra or Aqua LST. The estimates of NSAT from the Metop LST are nearly complete in the southwestern areas, while the estimated NSAT from the Aqua LST has massive gaps in the areas. To make full use of the available LST data from multiple satellites, a method that combines estimates of daily NSAT from LST of different satellites needs to be developed with the consideration of the variability in estimating daily NSAT using LST of different satellites.

4. Discussion

4.1. Overall Predictive Performance

There are numerous studies that estimate instantaneous, daily or monthly NSAT based on the MODIS LST for various scales of study areas [31,54,55], or areas with complex geographical environments, such as the Tibetan Plateau [9,56,57] or Antarctica [32,58]. In contrast, nearly no efforts have been made to estimate NSAT using LST data derived from Metop or other operational meteorological polar satellites. Our results suggest that the Metop LST is approximately equivalent to the MODIS LST in terms of predictive performance for estimating daily NSAT (Figure 4). Models for daily NSAT based on a scheme of MODIS LST achieve very similar mapping performance compared to models based on the same scheme of Metop LST, especially when using the Aux2 auxiliary variables. Metop LST and MODIS LST also demonstrate consistent variabilities in predictive performance for estimating the daily NSAT across months (Figure 6). Compared to studies for estimating the daily NSAT from the MODIS LST using different types of machine learning methods, such as gradient boosting [46] and Cubist [29], or statistical regression methods, such as GWR [59,60] and mixed effect models [55,61], similar predictive accuracy of daily NSAT may also be achieved by developing models based on Metop LST using these methods. To fully assess the predictive capability and applicability of Metop LST in estimating NSAT, more studies should be performed to estimate NSAT using different methods for various areas with diverse geographical environments, especially for comparing Metop LST with MODIS LST in estimating NSAT, which is very important for the estimation of NSAT through the integration of LST datasets from multiple satellites, as well as for the continuity of satellite-estimated NSAT.
There is diversity in choosing auxiliary variables for estimating daily NSAT in previous studies. Although several studies utilized Julian day (DOY) in models to estimate the daily NSAT [3,52,62,63], the comparative analysis of improvements in predictive accuracy of daily NSAT due to integrating DOY was not reported in these studies. One study by Zhang et al. [37] developed a spatially varying coefficient model for estimating daily Tmax and Tmin, and suggests that LST is adequate for characterizing the spatial variability of daily NSAT. However, incorporating temporal information into models based on satellite LST for estimating NSAT has important implications for improving the estimation models of NSAT, which is implied in previous studies [25,52,64,65]. Our study designed experiments for modeling daily Tavg, Tmax, and Tmin based on different schemes of LST from MODIS and Metop using two sets of auxiliary variables, including Aux1 and Aux2, to fully assess the significance of incorporating DOY into the modeling of daily NSAT. We observed that the predictive performance of the models using Aux2 is consistently higher than that of the models using Aux1 (Figure 4 and Figure 5), which confirms the importance of considering DOY in estimating daily NSAT based on satellite LST. In general, we expect that the results will have implications for future studies on modeling NSAT by incorporating temporal information, especially for estimating daily NSAT with the variable of Julian day.

4.2. LST Schemes for Mapping Daily NSAT

LST from multispectral imaging sensors onboard polar satellites, such as Terra, Aqua, and Metop, characterizes instantaneous thermal states of land surface at the local time of the satellite’s overpass, and observations for an area can be acquired twice by the sensors in the daytime and nighttime of one day. Few studies have been performed to estimate the instantaneous NSAT temporally matched with satellite’s overpasses using MODIS daytime or nighttime LST [24,66,67]. Although LST has the nature of instantaneity, it has been widely used to estimate NSAT at daily scales, such as daily maximum, minimum and average NSAT, which is of great significance for related studies. In general, daytime and nighttime LST have been used in estimating the daily Tmax and Tmin [68,69], respectively, because of the temporal closeness of the daily NSAT to the satellite’s overpasses. However, the temporal closeness can result in the suboptimal predictive accuracy of daily NSAT using daytime or nighttime LST. In this study, models based on daytime LST achieve higher mapping performance than that based on nighttime LST for estimating daily Tavg and Tmax, and daytime LST has comparable mapping performance with nighttime LST in estimating Tmin when modeling with DOY (Figure 4). In contrast, studies have reported that nighttime LST has higher predictive capability for estimating daily NSAT, and even shows greater agreement with the Tmax than daytime LST [14,70]. The discrepancies in the predictive capability of daytime LST and nighttime LST in estimating daily NSAT across different studies are probably due to variability in the samples extracted at stations for model training. Particularly, retrieval gaps of LST can seriously degrade sampling representativity of LST for characterizing NSAT at different daily scales.
Our study shows that the predictive accuracy of daily NSAT is improved by models considering both daytime LST and nighttime LST, compared with models using only one LST variable, which is also reported in previous studies [22,71]. In particular, significant improvements in predictive accuracy of daily Tavg and Tmax are still observed for models based on both daytime LST and nighttime LST when modeling with DOY (Figure 4 and Figure 6). However, estimating daily NSAT using both daytime LST and nighttime LST, which have variable distributions of retrieval gaps, will reduce the data coverage of the estimated NSAT, which can be roughly inferred from Figure 11 and Figure 12.

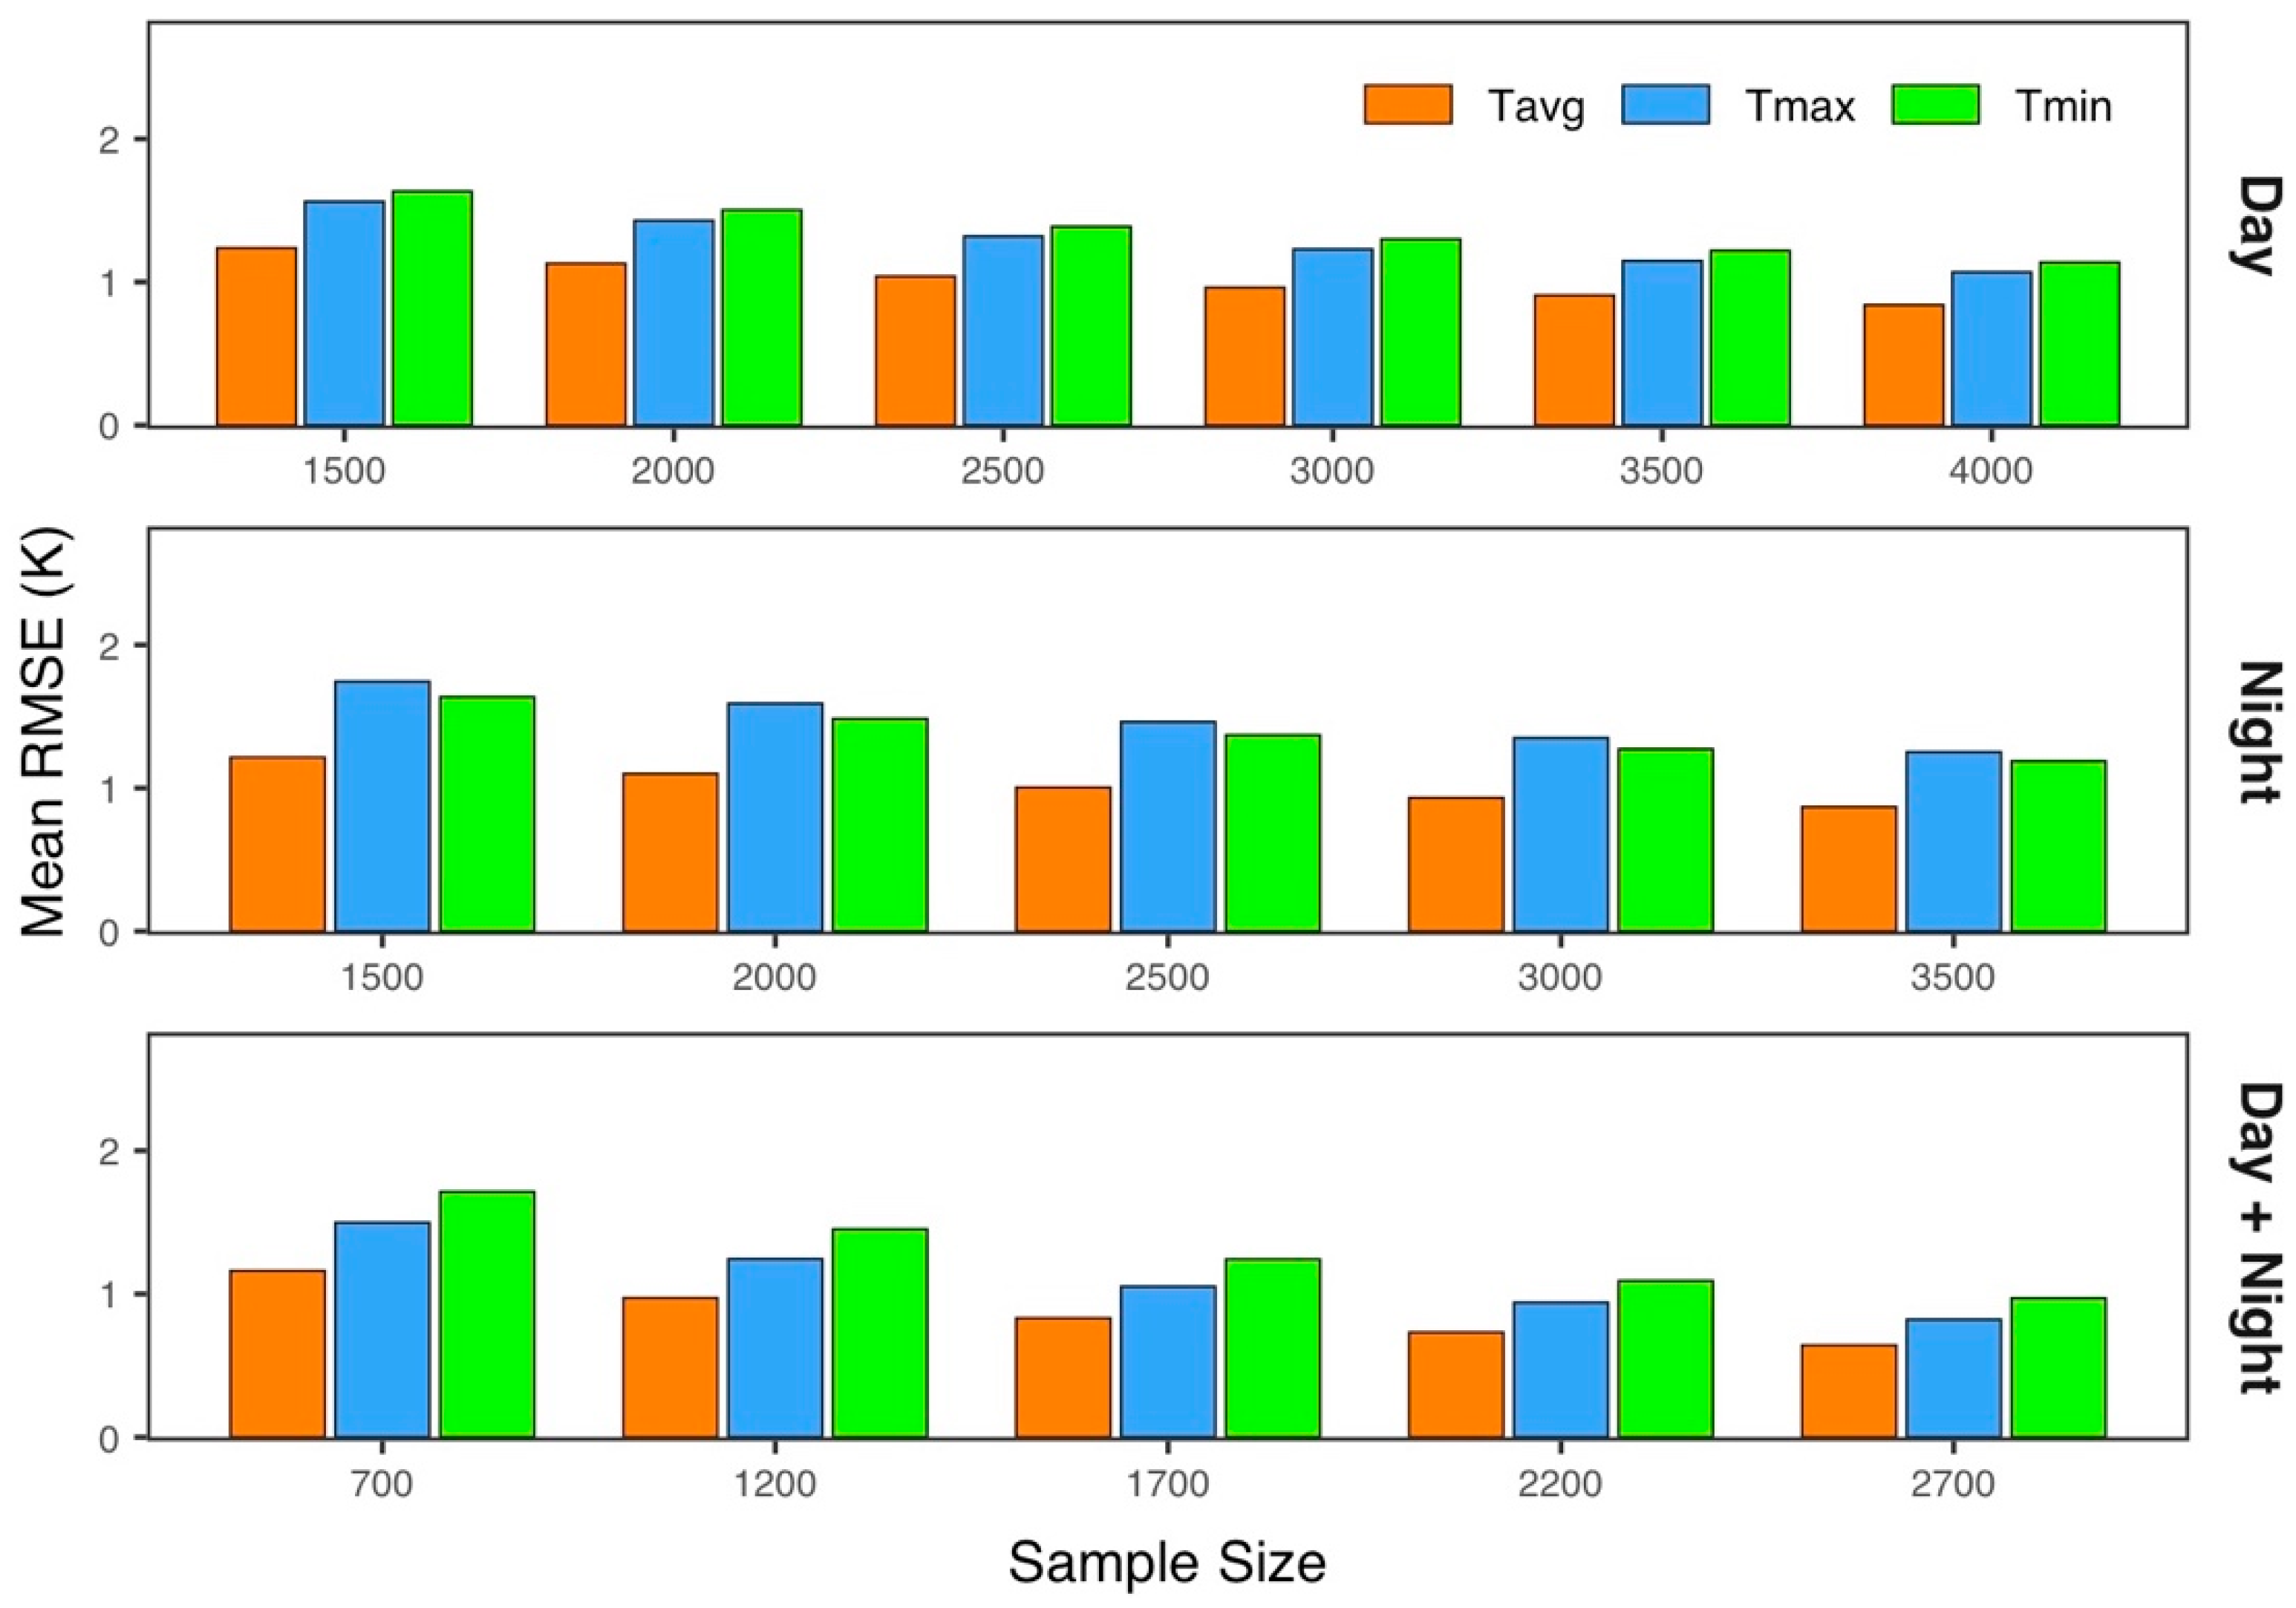
4.3. Imbalanced Samples for Modeling

Variability in predictive performance at temporal scales has been reported in studies for estimating daily [37,48,72] and monthly NSAT [28,73,74] based on the MODIS LST. In this study, all models based on different LST schemes demonstrate consistent variability in predictive performance across months with lower errors in the summer months, indicating the consistency of predictive capability between the Metop LST and the MODIS LST in estimating daily NSAT (Figure 6). Similar results about the temporal variabilities of predictive performance across months are also found in the studies [28,48]. LST retrievals contain massive data gaps primarily due to cloud contamination (Figure 10), and especially, rainy seasons result in large blocks of gaps in LST retrievals. Thus, samples extracted at ground stations are imbalanced across stations and days. We found that there is significant imbalance in data samples across months for the models based on different schemes of LST from Metop or MODIS (Figure 7). In general, the sample size for the summer months is lower than that for the other months across the modes with different LST. The effects of sampling imbalance or sample size on the predictive performance of the models for estimating NSAT were only explored in a few studies [24,25], which analyzed how samples extracted at stations with different densities affect the predictive performance of the models for estimating high-resolution NSAT in urban regions or hourly NSAT in large-scale areas.
We designed experiments for training models based on different schemes of the Metop LST using balanced samples across months with a range of sample sizes (Table 1 and Figure 8). The results show that monthly variabilities of predictive performance are not removed when training models using balanced samples. In addition, the models trained using balanced samples with a low sample size achieve comparable or even higher predictive accuracy than the models trained using all available samples. Thus, although samples are critical to models for estimating NSAT [25], we can infer that there is redundancy in the extracted samples in terms of characterizing the relationships between NSAT and input variables, and that sampling representativeness by the ground stations of study areas is of great significance to models for NSAT. However, representative sampling is hard to ensure due to retrieval gaps of LST across sites over the course of a year. Although we show that the models trained by balanced samples with increasing sample sizes generally have lower predictive errors across months and in average (Figure 8 and Figure 9), it is worth noting that bootstrapping from the available samples will not increase sampling representativeness, but can decrease validation errors by increasing the number of redundant samples. In addition to the retrieval gaps of LST, the distribution and density of the ground stations also seriously impact the representativeness of samples, as revealed by studies that reported higher predictive errors in areas with complex geographical contexts and low coverage of sites [29,44].

4.4. Limitations and Future Prospects

We developed models based on the Metop LST for estimating daily NSAT in the YREB region and assessed the consistency of predictive performance between the Metop LST and the MODIS LST in estimating daily NSAT. More work needs to be performed to comprehensively assess the predictive capability of Metop LST in estimating daily NSAT for regions of varying scales and different geographical environments, and a range of methods that have been applied in estimating NSAT based on MODIS LST should also be fully explored in developing models based on the Metop LST for NSAT. the models for estimating NSAT must be trained using samples extracted at ground stations, and sampling representativeness of stations is an important issue for characterizing the predictive performance of the models. Studies should be performed to analyze the impacts of sampling representativeness, which is influenced by retrieval gaps in the LST data and complicated by the spatial coverage of stations [24] and imbalanced samples at temporal scales, affecting the predictive capability of satellite LST in estimating NSAT. The mapping accuracy of estimated NSAT is overall represented by the performance of estimation models trained using samples extracted at ground stations. Inevitably, sampling errors exist due to the mismatch between point measurements from stations and pixel-level spatial raster data, influencing the spatial representativeness of the samples from stations. It is important to further explore the relationship between sampling representativeness and spatial resolutions at which NSAT is estimated. In addition, the accuracy analysis of estimated NSAT is only based on the cross-validation results of estimation models. Quantifying uncertainties or errors associated with pixel-level estimates is challenging and should be pursued in the future to enhance the value of estimated NSAT. Satellite-estimated NSAT from LST is only available for clear-sky areas, and reconstructing full-coverage NSAT with high accuracy from LST remains a difficult problem [5]. Integrating LST from multiple polar satellites for estimating daily NSAT provides the potential for estimating NSAT with high coverage [45], increasing the applicability of estimated NSAT for studies on environmental monitoring and assessments that require spatially continuous high-resolution NSAT. In addition, the estimation of NSAT by integrating LST from polar satellites and geostationary satellites can also be performed, and in particular, utilizing atmospheric products of CTT and CTH from satellite observations in reconstructing all-weather NSAT is a promising research direction [30,75].

5. Conclusions

Exploring the predictive capability of LST from various satellites in estimating NSAT has general implications for the continuity of satellite-estimated NSAT and the estimation of NSAT by integrating multi-source LST data. In this study, estimation models for daily NSAT (Tavg, Tmax, and Tmin) based on different schemes of the Metop LST were fully compared with models based on the MODIS LST. Our results show that the predictive performance of Metop LST for estimating daily NSAT is consistent with that of the MODIS LST. The models for estimating Tavg, Tmax, and Tmin achieve an overall predictive performance in terms of RMSE of about 1.2–1.4 K, 1.5–2.0 K, and 1.8–1.9 K, respectively. Differences in the predictive results for three daily scale NSAT due to schemes of LST are similar for estimation models based on the Metop LST and models based on the MODSI LST. In general, the differences are significant for estimating the Tmax, but trivial for estimating the Tavg and Tmin, especially when considering DOY in the models. The models based on Metop LST also exhibit high consistency with the models utilizing the MODIS LST in terms of the variability in predictive performance across the months with RMSE of 1.03–1.82 K, 1.3–2.49 K, and 1.26–2.66 K for Tavg, Tmin, and Tmax, respectively. By conducting experiments for training models of daily NSAT using bootstrapped samples in temporal balance with varying sample sizes, we confirmed that the temporal variabilities are not due to sampling imbalance across months, but the sizes of the samples used for training the estimation models have a great impact on the model’s predictive performance. Specifically, models trained with increasing sample sizes generally show lower mapping errors. These results indicate that sampling representativeness, complicated by retrieval gaps in LST, the spatial coverage of stations, and imbalanced sampling at temporal scales, is an important issue for modeling NSAT based on satellite LST. To fully assess the mapping capability of the Metop LST in estimating NSAT, more studies should be performed using different methods for areas with a range of scales and geographical environments.

Author Contributions

Conceptualization, Z.Z.; methodology, Z.Z. and P.L.; software, Z.Z.; validation, Z.Z., X.Z., and H.Z.; formal analysis, Z.Z. and P.L.; investigation, Z.Z.; resources, Z.Z.; data curation, Z.Z.; writing—original draft preparation, Z.Z.; writing—review and editing, Z.Z.; visualization, Z.Z. and P.L.; supervision, Z.Z.; project administration, Z.Z.; funding acquisition, Z.Z. All authors have read and agreed to the published version of the manuscript.

Funding

This research was funded by the Natural Science Research Program for Higher Education Institutions of Jiangsu (grant number 23KJB420004) and the Startup Foundation for Introducing Talent of NUIST (grant number 2022r040).

Data Availability Statement

The raw data supporting the conclusions of this article will be made available by the corresponding author (Z.Z.) on request.

Acknowledgments

We acknowledge the efforts by EUMETSAT and NASA in developing the publicly available satellite products used in this study. LST data from Metop satellites coded as LSA-002 are developed and archived by LSA SAF of EUMETSAT. MODIS LST datasets archived in LP DAAC are developed by the MODIS science team of NASA. We are also grateful to the National Meteorological Information Center of the China Meteorological Administration for providing daily measurements of NSAT from basic weather stations and reference climatological stations in the study area.

Conflicts of Interest

The authors declare no conflicts of interest.

References

  1. Cao, L.; Zhao, P.; Yan, Z.; Jones, P.; Zhu, Y.; Yu, Y.; Tang, G. Instrumental Temperature Series in Eastern and Central China Back to the Nineteenth Century. J. Geophys. Res. Atmos. 2013, 118, 8197–8207. [Google Scholar] [CrossRef]
  2. Smith, A.; Lott, N.; Vose, R. The Integrated Surface Database: Recent Developments and Partnerships. Bull. Am. Meteorol. Soc. 2011, 92, 704–708. [Google Scholar] [CrossRef]
  3. Benali, A.; Carvalho, A.C.; Nunes, J.P.; Carvalhais, N.; Santos, A. Estimating Air Surface Temperature in Portugal Using MODIS LST Data. Remote Sens. Environ. 2012, 124, 108–121. [Google Scholar] [CrossRef]
  4. Ho, H.C.; Knudby, A.; Sirovyak, P.; Xu, Y.; Hodul, M.; Henderson, S.B. Mapping Maximum Urban Air Temperature on Hot Summer Days. Remote Sens. Environ. 2014, 154, 38–45. [Google Scholar] [CrossRef]
  5. Zhang, Z.; Liang, Y.; Zhang, G.; Liang, C. Large-Scale Estimation of Hourly Surface Air Temperature Based on Observations from the FY-4A Geostationary Satellite. Remote Sens. 2023, 15, 1753. [Google Scholar] [CrossRef]
  6. Schuster, C.; Burkart, K.; Lakes, T. Heat Mortality in Berlin—Spatial Variability at the Neighborhood Scale. Urban Clim. 2014, 10, 134–147. [Google Scholar] [CrossRef]
  7. Pichierri, M.; Bonafoni, S.; Biondi, R. Satellite Air Temperature Estimation for Monitoring the Canopy Layer Heat Island of Milan. Remote Sens. Environ. 2012, 127, 130–138. [Google Scholar] [CrossRef]
  8. Mo, K.C.; Lettenmaier, D.P. Hydrologic Prediction over the Conterminous United States Using the National Multi-Model Ensemble. J. Hydrometeorol. 2014, 15, 1457–1472. [Google Scholar] [CrossRef]
  9. Zhang, H.; Zhang, F.; Zhang, G.; Ma, Y.; Yang, K.; Ye, M. Daily Air Temperature Estimation on Glacier Surfaces in the Tibetan Plateau Using MODIS LST Data. J. Glaciol. 2018, 64, 132–147. [Google Scholar] [CrossRef]
  10. Hulley, G.C.; Hook, S.J. Generating Consistent Land Surface Temperature and Emissivity Products Between ASTER and MODIS Data for Earth Science Research. IEEE Trans. Geosci. Remote Sens. 2011, 49, 1304–1315. [Google Scholar] [CrossRef]
  11. Malakar, N.K.; Hulley, G.C.; Hook, S.J.; Laraby, K.; Cook, M.; Schott, J.R. An Operational Land Surface Temperature Product for Landsat Thermal Data: Methodology and Validation. IEEE Trans. Geosci. Remote Sens. 2018, 56, 5717–5735. [Google Scholar] [CrossRef]
  12. Florio, E.N.; Lele, S.R.; Chi Chang, Y.; Sterner, R.; Glass, G.E. Integrating AVHRR Satellite Data and NOAA Ground Observations to Predict Surface Air Temperature: A Statistical Approach. Int. J. Remote Sens. 2004, 25, 2979–2994. [Google Scholar] [CrossRef]
  13. Good, E.J.; Ghent, D.J.; Bulgin, C.E.; Remedios, J.J. A Spatiotemporal Analysis of the Relationship between Near-surface Air Temperature and Satellite Land Surface Temperatures Using 17 Years of Data from the ATSR Series. J. Geophys. Res. Atmos. 2017, 122, 9185–9210. [Google Scholar] [CrossRef]
  14. Noi, P.T.; Kappas, M.; Nguyen, K.T.; Tran, T.P.; Tran, Q.V.; Emam, A.R. Evaluation of MODIS Land Surface Temperature Products for Daily Air Surface Temperature Estimation in Northwest Vietnam. Int. J. Remote Sens. 2019, 40, 5544–5562. [Google Scholar] [CrossRef]
  15. Hansen, J.; Sato, M.; Ruedy, R.; Lo, K.; Lea, D.W.; Medina-Elizade, M. Global Temperature Change. Proc. Natl. Acad. Sci. USA 2006, 103, 14288–14293. [Google Scholar] [CrossRef]
  16. Xu, Y.; Zhao, P.; Si, D.; Cao, L.; Wu, X.; Zhao, Y.; Liu, N. Development and Preliminary Application of a Gridded Surface Air Temperature Homogenized Dataset for China. Theor. Appl. Climatol. 2020, 139, 505–516. [Google Scholar] [CrossRef]
  17. Prihodko, L.; Goward, S.N. Estimation of Air Temperature from Remotely Sensed Surface Observations. Remote Sens. Environ. 1997, 60, 335–346. [Google Scholar] [CrossRef]
  18. Stisen, S.; Sandholt, I.; Nørgaard, A.; Fensholt, R.; Eklundh, L. Estimation of Diurnal Air Temperature Using MSG SEVIRI Data in West Africa. Remote Sens. Environ. 2007, 110, 262–274. [Google Scholar] [CrossRef]
  19. Vancutsem, C.; Ceccato, P.; Dinku, T.; Connor, S.J. Evaluation of MODIS Land Surface Temperature Data to Estimate Air Temperature in Different Ecosystems over Africa. Remote Sens. Environ. 2010, 114, 449–465. [Google Scholar] [CrossRef]
  20. Pepin, N.C.; Maeda, E.E.; Williams, R. Use of Remotely Sensed Land Surface Temperature as a Proxy for Air Temperatures at High Elevations: Findings from a 5000 m Elevational Transect across Kilimanjaro. J. Geophys. Res. Atmos. 2016, 121, 9998. [Google Scholar] [CrossRef]
  21. Zakšek, K.; Schroedter-Homscheidt, M. Parameterization of Air Temperature in High Temporal and Spatial Resolution from a Combination of the SEVIRI and MODIS Instruments. ISPRS J. Photogramm. Remote Sens. 2009, 64, 414–421. [Google Scholar] [CrossRef]
  22. Yoo, C.; Im, J.; Park, S.; Quackenbush, L.J. Estimation of Daily Maximum and Minimum Air Temperatures in Urban Landscapes Using MODIS Time Series Satellite Data. ISPRS J. Photogramm. Remote Sens. 2018, 137, 149–162. [Google Scholar] [CrossRef]
  23. Meyer, H.; Schmidt, J.; Detsch, F.; Nauss, T. Hourly Gridded Air Temperatures of South Africa Derived from MSG SEVIRI. Int. J. Appl. Earth Obs. Geoinf. 2019, 78, 261–267. [Google Scholar] [CrossRef]
  24. Venter, Z.S.; Brousse, O.; Esau, I.; Meier, F. Hyperlocal Mapping of Urban Air Temperature Using Remote Sensing and Crowdsourced Weather Data. Remote Sens. Environ. 2020, 242, 111791. [Google Scholar] [CrossRef]
  25. Zhang, Z.; Du, Q. Hourly Mapping of Surface Air Temperature by Blending Geostationary Datasets from the Two-Satellite System of GOES-R Series. ISPRS J. Photogramm. Remote Sens. 2022, 183, 111–128. [Google Scholar] [CrossRef]
  26. Guo, Y.; Unger, J.; Khabibolla, A.; Tian, G.; He, R.; Li, H.; Gál, T. Modeling Urban Air Temperature Using Satellite-Derived Surface Temperature, Meteorological Data, and Local Climate Zone Pattern—A Case Study in Szeged, Hungary. Theor. Appl. Climatol. 2024, 155, 3841–3859. [Google Scholar] [CrossRef]
  27. Qin, J.; Pan, W.; He, M.; Lu, N.; Yao, L.; Jiang, H.; Zhou, C. A Long-Term 1 Km Monthly near-Surface Air Temperature Dataset over the Tibetan Glaciers by Fusion of Station and Satellite Observations. Earth Syst. Sci. Data 2023, 15, 331–344. [Google Scholar] [CrossRef]
  28. Yao, R.; Wang, L.; Huang, X.; Cao, Q.; Peng, Y. A Method for Improving the Estimation of Extreme Air Temperature by Satellite. Sci. Total Environ. 2022, 837, 155887. [Google Scholar] [CrossRef]
  29. Rao, Y.; Liang, S.; Wang, D.; Yu, Y.; Song, Z.; Zhou, Y.; Shen, M.; Xu, B. Estimating Daily Average Surface Air Temperature Using Satellite Land Surface Temperature and Top-of-Atmosphere Radiation Products over the Tibetan Plateau. Remote Sens. Environ. 2019, 234, 111462. [Google Scholar] [CrossRef]
  30. Liu, H.; Chen, Y.; Han, Q.; Deng, X.; Fan, J.; Duan, M.; Huang, Q. Estimation of High Spatial Resolution All-Weather near-Surface Air Temperature Using FY-4A AGRI Observations. Atmos. Res. 2023, 285, 106642. [Google Scholar] [CrossRef]
  31. Zheng, M.; Zhang, J.; Wang, J.; Yang, S.; Han, J.; Hassan, T. Reconstruction of 0.05° All-Sky Daily Maximum Air Temperature across Eurasia for 2003–2018 with Multi-Source Satellite Data and Machine Learning Models. Atmos. Res. 2022, 279, 106398. [Google Scholar] [CrossRef]
  32. Zhang, X.; Dong, X.; Zeng, J.; Hou, S.; Smeets, P.C.J.P.; Reijmer, C.H.; Wang, Y. Spatiotemporal Reconstruction of Antarctic Near-Surface Air Temperature from MODIS Observations. J. Climate 2022, 35, 5537–5553. [Google Scholar] [CrossRef]
  33. Zhang, X.; Huang, T.; Gulakhmadov, A.; Song, Y.; Gu, X.; Zeng, J.; Huang, S.; Nam, W.-H.; Chen, N.; Niyogi, D. Deep Learning-Based 500 m Spatio-Temporally Continuous Air Temperature Generation by Fusing Multi-Source Data. Remote Sens. 2022, 14, 3536. [Google Scholar] [CrossRef]
  34. Wang, Y.; Liu, J.; Zhu, W. Estimation of Instantaneous Air Temperature under All-Weather Conditions Based on MODIS Products in North and Southwest China. Remote Sens. 2023, 15, 2701. [Google Scholar] [CrossRef]
  35. Corbea-Pérez, A.; Recondo, C.; Calleja, J.F. Improvements in the Estimation of Air Temperature with Empirical Models on Livingston and Deception Islands in Maritime Antarctica (2000–2016) Using C6 MODIS LST. Remote Sens. 2024, 16, 1084. [Google Scholar] [CrossRef]
  36. Nikolaou, N.; Dallavalle, M.; Stafoggia, M.; Bouwer, L.M.; Peters, A.; Chen, K.; Wolf, K.; Schneider, A. High-Resolution Spatiotemporal Modeling of Daily near-Surface Air Temperature in Germany over the Period 2000–2020. Environ. Res. 2023, 219, 115062. [Google Scholar] [CrossRef]
  37. Zhang, T.; Zhou, Y.; Wang, L.; Zhao, K.; Zhu, Z. Estimating 1 Km Gridded Daily Air Temperature Using a Spatially Varying Coefficient Model with Sign Preservation. Remote Sens. Environ. 2022, 277, 113072. [Google Scholar] [CrossRef]
  38. Hrisko, J.; Ramamurthy, P.; Yu, Y.; Yu, P.; Melecio-Vázquez, D. Urban Air Temperature Model Using GOES-16 LST and a Diurnal Regressive Neural Network Algorithm. Remote Sens. Environ. 2020, 237, 111495. [Google Scholar] [CrossRef]
  39. Zumwald, M.; Knüsel, B.; Bresch, D.N.; Knutti, R. Mapping Urban Temperature Using Crowd-Sensing Data and Machine Learning. Urban Clim. 2021, 35, 100739. [Google Scholar] [CrossRef]
  40. Webb, M.; Minasny, B. A Digital Mapping Application for Quantifying and Displaying Air Temperatures at High Spatiotemporal Resolutions in near Real-Time across Australia. PeerJ 2020, 8, e10106. [Google Scholar] [CrossRef]
  41. Liu, Y.; Yu, Y.; Yu, P.; Wang, H.; Rao, Y. Enterprise LST Algorithm Development and Its Evaluation with NOAA 20 Data. Remote Sens. 2019, 11, 2003. [Google Scholar] [CrossRef]
  42. Xian, D.; Zhang, P.; Gao, L.; Sun, R.; Zhang, H.; Jia, X. Fengyun Meteorological Satellite Products for Earth System Science Applications. Adv. Atmos. Sci. 2021, 38, 1267–1284. [Google Scholar] [CrossRef]
  43. LSA SAF Land Surface Temperature and Emissivity. Available online: https://lsa-saf.eumetsat.int/en/data/products/land-surface-temperature-and-emissivity/ (accessed on 2 August 2024).
  44. Sekulić, A.; Kilibarda, M.; Protić, D.; Tadić, M.P.; Bajat, B. Spatio-Temporal Regression Kriging Model of Mean Daily Temperature for Croatia. Theor. Appl. Climatol. 2020, 140, 101–114. [Google Scholar] [CrossRef]
  45. Zhang, Z.; Du, Q. Merging Framework for Estimating Daily Surface Air Temperature by Integrating Observations from Multiple Polar-Orbiting Satellites. Sci. Total Environ. 2022, 812, 152538. [Google Scholar] [CrossRef] [PubMed]
  46. dos Santos, R.S. Estimating Spatio-Temporal Air Temperature in London (UK) Using Machine Learning and Earth Observation Satellite Data. Int. J. Appl. Earth Obs. Geoinf. 2020, 88, 102066. [Google Scholar] [CrossRef]
  47. Serra, C.; Lana, X.; Martínez, M.D.; Roca, J.; Arellano, B.; Biere, R.; Moix, M.; Burgueño, A. Air Temperature in Barcelona Metropolitan Region from MODIS Satellite and GIS Data. Theor. Appl. Climatol. 2020, 139, 473–492. [Google Scholar] [CrossRef]
  48. Shen, H.; Jiang, Y.; Li, T.; Cheng, Q.; Zeng, C.; Zhang, L. Deep Learning-Based Air Temperature Mapping by Fusing Remote Sensing, Station, Simulation and Socioeconomic Data. Remote Sens. Environ. 2020, 240, 111692. [Google Scholar] [CrossRef]
  49. Trigo, I.F.; Peres, L.F.; DaCamara, C.C.; Freitas, S.C. Thermal Land Surface Emissivity Retrieved From SEVIRI/Meteosat. IEEE Trans. Geosci. Remote Sens. 2008, 46, 307–315. [Google Scholar] [CrossRef]
  50. Wan, Z.; Dozier, J. A Generalized Split-Window Algorithm for Retrieving Land-Surface Temperature from Space. IEEE Trans. Geosci. Remote Sens. 1996, 34, 892–905. [Google Scholar] [CrossRef]
  51. Becker, J.J.; Sandwell, D.T.; Smith, W.H.F.; Braud, J.; Binder, B.; Depner, J.; Fabre, D.; Factor, J.; Ingalls, S.; Kim, S.-H.; et al. Global Bathymetry and Elevation Data at 30 Arc Seconds Resolution: SRTM30_PLUS. Mar. Geod. 2009, 32, 355–371. [Google Scholar] [CrossRef]
  52. Janatian, N.; Sadeghi, M.; Sanaeinejad, S.H.; Bakhshian, E.; Farid, A.; Hasheminia, S.M.; Ghazanfari, S. A Statistical Framework for Estimating Air Temperature Using MODIS Land Surface Temperature Data. Int. J. Climatol. 2017, 37, 1181–1194. [Google Scholar] [CrossRef]
  53. Belgiu, M.; Drăguţ, L. Random Forest in Remote Sensing: A Review of Applications and Future Directions. ISPRS J. Photogramm. Remote Sens. 2016, 114, 24–31. [Google Scholar] [CrossRef]
  54. Kilibarda, M.; Hengl, T.; Heuvelink, G.B.M.; Gräler, B.; Pebesma, E.; Perčec Tadić, M.; Bajat, B. Spatio-temporal Interpolation of Daily Temperatures for Global Land Areas at 1 Km Resolution. J. Geophys. Res. Atmos. 2014, 119, 2294–2313. [Google Scholar] [CrossRef]
  55. Rosenfeld, A.; Dorman, M.; Schwartz, J.; Novack, V.; Just, A.C.; Kloog, I. Estimating Daily Minimum, Maximum, and Mean near Surface Air Temperature Using Hybrid Satellite Models across Israel. Environ. Res. 2017, 159, 297–312. [Google Scholar] [CrossRef]
  56. Xu, Y.; Knudby, A.; Shen, Y.; Liu, Y. Mapping Monthly Air Temperature in the Tibetan Plateau from MODIS Data Based on Machine Learning Methods. IEEE J. Sel. Topics Appl. Earth Observ. Remote Sens. 2018, 11, 345–354. [Google Scholar] [CrossRef]
  57. Zhang, H.; Zhang, F.; Ye, M.; Che, T.; Zhang, G. Estimating Daily Air Temperatures over the Tibetan Plateau by Dynamically Integrating MODIS LST Data. J. Geophys. Res. Atmos. 2016, 121, 11425–11441. [Google Scholar] [CrossRef]
  58. Meyer, H.; Katurji, M.; Appelhans, T.; Müller, M.; Nauss, T.; Roudier, P.; Zawar-Reza, P. Mapping Daily Air Temperature for Antarctica Based on MODIS LST. Remote Sens. 2016, 8, 732. [Google Scholar] [CrossRef]
  59. Li, X.; Zhou, Y.; Asrar, G.R.; Zhu, Z. Developing a 1 Km Resolution Daily Air Temperature Dataset for Urban and Surrounding Areas in the Conterminous United States. Remote Sens. Environ. 2018, 215, 74–84. [Google Scholar] [CrossRef]
  60. Wang, M.; He, G.; Zhang, Z.; Wang, G.; Zhang, Z.; Cao, X.; Wu, Z.; Liu, X. Comparison of Spatial Interpolation and Regression Analysis Models for an Estimation of Monthly Near Surface Air Temperature in China. Remote Sens. 2017, 9, 1278. [Google Scholar] [CrossRef]
  61. Kloog, I.; Nordio, F.; Coull, B.A.; Schwartz, J. Predicting Spatiotemporal Mean Air Temperature Using MODIS Satellite Surface Temperature Measurements across the Northeastern USA. Remote Sens. Environ. 2014, 150, 132–139. [Google Scholar] [CrossRef]
  62. Emamifar, S.; Rahimikhoob, A.; Noroozi, A.A. Daily Mean Air Temperature Estimation from MODIS Land Surface Temperature Products Based on M5 Model Tree. Int. J. Climatol. 2013, 33, 3174–3181. [Google Scholar] [CrossRef]
  63. Jang, J.; Viau, A.A.; Anctil, F. Neural Network Estimation of Air Temperatures from AVHRR Data. Int. J. Remote Sens. 2004, 25, 4541–4554. [Google Scholar] [CrossRef]
  64. Chen, Y.; Liang, S.; Ma, H.; Li, B.; He, T.; Wang, Q. An All-Sky 1 Km Daily Land Surface Air Temperature Product over Mainland China for 2003–2019 from MODIS and Ancillary Data. Earth Syst. Sci. Data 2021, 13, 4241–4261. [Google Scholar] [CrossRef]
  65. Qin, J.; He, M.; Yang, W.; Lu, N.; Yao, L.; Jiang, H.; Wu, J.; Yang, K.; Zhou, C. Temporally Extended Satellite-Derived Surface Air Temperatures Reveal a Complete Warming Picture on the Tibetan Plateau. Remote Sens. Environ. 2023, 285, 113410. [Google Scholar] [CrossRef]
  66. Colaninno, N.; Morello, E. Towards an Operational Model for Estimating Day and Night Instantaneous Near-Surface Air Temperature for Urban Heat Island Studies: Outline and Assessment. Urban Clim. 2022, 46, 101320. [Google Scholar] [CrossRef]
  67. Wang, C.; Bi, X.; Luan, Q.; Li, Z. Estimation of Daily and Instantaneous Near-Surface Air Temperature from MODIS Data Using Machine Learning Methods in the Jingjinji Area of China. Remote Sens. 2022, 14, 1916. [Google Scholar] [CrossRef]
  68. Shi, Y.; Jiang, Z.; Dong, L.; Shen, S. Statistical Estimation of High-Resolution Surface Air Temperature from MODIS over the Yangtze River Delta, China. J. Meteorol. Res. 2017, 31, 448–454. [Google Scholar] [CrossRef]
  69. Xu, Y.; Knudby, A.; Ho, H.C. Estimating Daily Maximum Air Temperature from MODIS in British Columbia, Canada. Int. J. Remote Sens. 2014, 35, 8108–8121. [Google Scholar] [CrossRef]
  70. Zhang, W.; Huang, Y.; Yu, Y.; Sun, W. Empirical Models for Estimating Daily Maximum, Minimum and Mean Air Temperatures with MODIS Land Surface Temperatures. Int. J. Remote Sens. 2011, 32, 9415–9440. [Google Scholar] [CrossRef]
  71. Noi, P.; Kappas, M.; Degener, J. Estimating Daily Maximum and Minimum Land Air Surface Temperature Using MODIS Land Surface Temperature Data and Ground Truth Data in Northern Vietnam. Remote Sens. 2016, 8, 1002. [Google Scholar] [CrossRef]
  72. Zhou, B.; Erell, E.; Hough, I.; Rosenblatt, J.; Just, A.C.; Novack, V.; Kloog, I. Estimating Near-surface Air Temperature across Israel Using a Machine Learning Based Hybrid Approach. Int. J. Climatol. 2020, 40, 6106–6121. [Google Scholar] [CrossRef]
  73. Gao, M.; Li, Z.; Tan, Z.; Li, H.; Peng, J. Use of Google Earth Engine to Generate a 20-Year 1 Km × 1 Km Monthly Air Temperature Product Over Yellow River Basin. IEEE J. Sel. Topics Appl. Earth Observ. Remote Sens. 2021, 14, 10079–10090. [Google Scholar] [CrossRef]
  74. Zhu, X.; Zhang, Q.; Xu, C.-Y.; Sun, P.; Hu, P. Reconstruction of High Spatial Resolution Surface Air Temperature Data across China: A New Geo-Intelligent Multisource Data-Based Machine Learning Technique. Sci. Total Environ. 2019, 665, 300–313. [Google Scholar] [CrossRef] [PubMed]
  75. Li, H.; Liu, H.; Duan, M.; Deng, X.; Zhang, S. Estimation of Air Temperature under Cloudy Conditions Using Satellite-Based Cloud Products. IEEE Geosci. Remote Sens. Lett. 2022, 19, 1001705. [Google Scholar] [CrossRef]
Figure 1. Topography of the Yangtze River Economic Belt (YREB) region with CMA ground meteorological stations.
Remotesensing 16 03754 g001
Figure 2. Schemes of estimation models for daily average, maximum, and minimum NSAT.
Remotesensing 16 03754 g002
Figure 3. Overall assessment of the models for estimating daily average (Tavg), maximum (Tmax), and minimum (Tmin) NSAT using different schemes of Metop LST.
Remotesensing 16 03754 g003
Figure 4. Overall comparison of the models for estimating daily NSAT using different schemes of LST from three satellites and auxiliary inputs.
Remotesensing 16 03754 g004
Figure 5. Evaluation of predictive performance on a daily basis for models based on Metop LST. Mean RSME is only shown for days with valid samples from more than 70% stations.
Remotesensing 16 03754 g005
Figure 6. Variability in predictive performance of daily average, maximum, and minimum NSAT across months for models based on different schemes of LST from three satellites.
Remotesensing 16 03754 g006
Figure 7. Sample size across months for models based on different LST schemes.
Remotesensing 16 03754 g007
Figure 8. Mapping performance of the models based on different schemes of Metop LST across months when trained with balanced samples with varying sizes.
Remotesensing 16 03754 g008
Figure 9. Comparison of overall predictive performance of the models based on Metop LST when trained using temporally balanced samples with varying sizes.
Remotesensing 16 03754 g009
Figure 10. Data coverage of daytime (top) and nighttime (bottom) LST from Metop and MODIS (Terra and Aqua) for the days of the year 2019.
Remotesensing 16 03754 g010
Figure 11. Estimated daily average (Tavg), maximum (Tmax), and minimum (Tmin) using models based on different schemes of Metop for 7 April 2019.
Remotesensing 16 03754 g011
Figure 12. Estimated daily average (Tavg), maximum (Tmax), and minimum (Tmin) using models based on daytime LST from Metop, Terra, and Aqua for 7 April 2019.
Remotesensing 16 03754 g012
Table 1. Size of the bootstrapped samples for models of daily NSAT based on Metop LST.
LST SchemeSample Size per Month
Day1500, 2000, 2500, 3000, 3500, 4000
Night1500, 2000, 2500, 3000, 3500
Day + Night700, 1200, 1700, 2200, 2700
Disclaimer/Publisher’s Note: The statements, opinions and data contained in all publications are solely those of the individual author(s) and contributor(s) and not of MDPI and/or the editor(s). MDPI and/or the editor(s) disclaim responsibility for any injury to people or property resulting from any ideas, methods, instructions or products referred to in the content.

