Article

Ozone Detector Based on Ultraviolet Observations on the Martian Surface

1
Centro de Astrobiología (CAB), CSIC-INTA, Torrejón de Ardoz, 28550 Madrid, Spain
2
Department of Atmospheric Chemistry and Climate, Institute of Physical Chemistry Blas Cabrera, CSIC, 28006 Madrid, Spain
3
NASA Goddard Spaceflight Center, Greenbelt, MD 20771, USA
4
Instituto Nacional de Técnica Aeroespacial (INTA), Torrejón de Ardoz, 28550 Madrid, Spain
5
Space Science Institute, Boulder, CO 80301, USA
*
Author to whom correspondence should be addressed.
Remote Sens. 2024, 16(20), 3914; https://doi.org/10.3390/rs16203914
Submission received: 12 September 2024 / Revised: 17 October 2024 / Accepted: 19 October 2024 / Published: 21 October 2024

Abstract

:
Ozone plays a key role in both atmospheric chemistry and UV absorption in planetary atmospheres. On Mars, upper-tropospheric ozone has been widely characterized by space-based instruments. However, surface ozone remains poorly characterized, hindered by the limited sensitivity of orbiters to the lowest scale height of the atmosphere and challenges in delivering payloads to the surface of Mars, which have prevented, to date, the measurement of ozone from the surface of Mars. Systematic measurements from the Martian surface could advance our knowledge of the atmospheric chemistry and habitability potential of this planet. NASA’s Mars 2020 mission includes the first ozone detector deployed on the Martian surface, which is based on discrete photometric observations in the ultraviolet band, a simple technology that could obtain the first insights into total ozone abundance in preparation for more sophisticated measurement techniques. This paper describes the Mars 2020 ozone detector and its retrieval algorithm, including its performance under different sources of uncertainty and the potential application of the retrieval algorithm on other missions, such as NASA’s Mars Science Laboratory. Pre-landing simulations using the UVISMART radiative transfer model suggest that the retrieval is robust and that it can deal with common issues affecting surface operations in Martian missions, although the expected low ozone abundance and instrument uncertainties could challenge its characterization in tropical latitudes of the planet. Other space missions will potentially include sensors of similar technology.

1. Introduction

Ozone is a key chemical species in the atmospheric chemistry of Mars. Among the interactions with other chemical species in the Martian atmosphere, it exhibits anticorrelation with HOx species (OH, HO2, H) produced from the photolysis of water vapor. These species are not directly measured in the atmosphere of Mars despite being involved in the unresolved question of the stability of the CO2 atmosphere. At the surface, ozone could play an important role in habitability and prebiotic chemistry, thus influencing both the level of spectral protection and the availability of chemical species and their interaction with the regolith.
Several telescopic and orbital remote sensing observations have been performed over half a century, characterizing the total column abundance and/or the vertical profile above the first scale height (above ~11 km) (e.g., [1,2,3,4,5,6,7,8,9,10,11,12,13,14,15,16,17,18]). No observations from the surface of Mars have been performed to date, however.
Ozone column observations from the Martian surface could be beneficial in several ways. First, they could complement ground-based telescope and orbiter observations, as is often carried out on Earth between orbiters and in situ measurements. Systematic high-frequency observations could characterize diurnal, sol-to-sol, and seasonal variations at a particular location, providing insights into timescales not covered by current observations and the physicochemical processes that lead to those variations. Thus, for example, in situ observations, that is to say, observations taken from the surface of Mars, including those acquired by remote sensing techniques, could unmask the diurnal variability of ozone as predicted by models (see, e.g., [19] and references therein) and the potential role of heterogeneous chemistry (e.g., [20,21]). Finally, advanced in situ instruments could also obtain information about the vertical distribution of ozone, including the lower layers of the atmosphere.
NASA’s Mars 2020 Perseverance rover, which successfully landed at Jezero Crater on Mars (18.38°N, 77.58°E) in February 2021, carries the first ozone detector sent to the Martian surface as part of the Radiation and Dust Sensor (RDS) included in the Mars Environment Dynamics Analyzer (MEDA) instrument on board the Perseverance rover [22,23]. The ozone detector is based on photometric observations in the ultraviolet (UV) band (200–400 nm), a simple technology that could obtain the first insights into ozone abundance in preparation for more sophisticated measurement techniques. This paper presents both the rationale and the retrieval that will be applied to infer, for the first time, the ozone abundance from measurements acquired on the Martian surface. The paper is structured as follows: Section 2 presents the ozone detector and its measurement technique, Section 3 focuses on the detector degradation on the Martian surface and on the in-flight calibration, Section 4 introduces the ozone retrieval algorithm, Section 5 presents the ozone detector performance under different scenarios, and Section 6 evaluates the possibility to infer ozone abundance based on the retrieval presented here using other in situ Martian UV sensors. Finally, Section 7 presents the conclusions.

2. Ozone Detector

2.1. Measurement Technique

The invention of the Dobson spectrometer [24] enabled the first systematic measurements of column ozone abundance in the Earth’s atmosphere. The principle of the Dobson spectrometer consists of measuring the irradiance in two or more adjacent UV wavelength bands presenting significant differences in the ozone absorption and then inferring the ozone column abundance from the relationship between the measured irradiance in those bands. Nowadays, many in situ instruments and orbiters measure ozone continuously, using more sophisticated techniques, providing a full picture of this relevant species in the Earth’s atmosphere.
However, delivering payloads to the Martian surface is currently very complex and strongly constrained (e.g., weight, volume, energy consumption, data volume). Taking into account such constraints, we use the same basic principle of the Dobson technique to measure ozone from the Martian surface for the first time. We have also simplified the required hardware to only two wavelength bands measuring global irradiances in zenith-sky viewing geometry in order to minimize the number of detectors needed for the ozone measurement in the MEDA instrument. As will described in the next section, this has the side effect of strongly increasing the complexity of the retrieval process by requiring the use of a radiative transfer model (RTM) as part of the ozone retrieval and the need to deal with other issues related to the Martian environment. In the last few decades, developments in RTMs and the search for low-cost instrumentation on Earth have allowed ground-based multifilter UV radiometers to be used to infer the total column abundance from global irradiances ([25,26,27,28] and references therein). Such global irradiance measurements include both direct and diffuse solar radiation after being scattered, e.g., by dust and clouds. On Mars, orbiters use the same operational principle to infer ozone in the UV band (e.g., [7]).
The ozone absorption cross-section as a function of wavelength in the UV-VIS is presented in Figure 1. The maximum ozone absorption is located in the center of the Hartley band, which spans from 200 nm to 300 nm. Thus, the highest absorption sensitivity of an instrument employing the Dobson technique should be centered at ~255 nm. In Earth’s atmosphere, ozone absorption in the UV band is so strong that UV-C radiation (100−280 nm) is mostly absorbed by this species in the stratosphere. In addition, the presence of other species in the Earth’s atmosphere can modify the relationship between the irradiances in those bands. Thus, in practice, Earth’s measurements make use of an observational range in longer wavelengths. On Mars, however, the atmosphere is much thinner than Earth’s (<1%), and the abundance of ozone is also much lower (e.g., [7,20,29] and references therein); therefore, extremely high levels of UV-C radiation reach the surface. These UV radiation levels enable the possibility of using the maximum sensitivity that this band offers in terms of ozone absorption and compensate, in part, for the low abundance of ozone present in the Martian atmosphere, which on average is ~3000 times lower than that on Earth as observed from space in tropical latitudes.
There are no further known chemical species in the present Mars atmosphere that can be significantly absorbed in the UV band except CO2 below 200 nm. SO2, not detected in the Martian atmosphere to date with an upper limit of 20 ppbv [30], could, if it exists, be weakly absorbed in the UVB band. Therefore, the radiation environment in the Hartley band can be considered as mostly dominated by aerosol scattering and absorption (e.g., [2,17,31,32,33,34]), mainly composed of dust and water ice aerosols, in addition to Rayleigh scattering and ozone. It should be noted, however, that aerosol characterization in the atmosphere of Mars is challenging. Each aerosol has its own wavelength-dependent properties, time-varying vertical profiles, and horizontal distribution. Although simultaneous retrievals of aerosol are expected to be performed as part of surface operations, the spectral variation in the optical properties of aerosol species and their temporal variation could be a source of relevant uncertainty in the ozone retrievals, and therefore, a narrow range in adjacent observational wavelength bands is needed to minimize such uncertainties in the ozone measurements while at the same time trying to maximize the differential absorption cross-section of ozone between the two channels. As will be presented in Section 5, aerosols are one of the main sources of uncertainty in the ozone retrievals on Mars.
Figure 1. Ozone absorption cross-section as a function of wavelength in the UV-VIS, for three different temperatures [35]. The temperature dependence in the absorption cross-section is mostly negligible in the middle of the Hartley band, where ozone presents the largest absorption. The two observational bands used in the retrieval are highlighted in dark grey regions: ξ H , centered in the middle of the Hartley band (255 ± 5 nm), and ξ L , centered in the edge of the Hartley band (295 ± 5 nm). In addition, ξ L s (250–400 nm) is also represented, which can be used as well as a reference signal, i.e., with a comparatively much smaller ozone contribution. The difference of more than an order of magnitude in the absorption cross-section, between the middle of the Hartley band ( ξ H ) and in the remaining channels, maximizes the sensitivity to ozone in the Martian atmosphere.
Remotesensing 16 03914 g001
At least two Mars missions can make use of this methodology to infer the ozone abundance. The first mission, Mars 2020, includes the Perseverance rover, which successfully landed at Jezero Crater on Mars (18.38°N, 77.58°E) in February 2021 and carries an ozone detector as part of the MEDA instrument. Also, the ExoMars rover, expected to land in Oxia Planum (18.26°N, 335.37°E) at the end of this decade, was going to include a similar detector manufactured in parallel to the one included on Perseverance [36]. In addition, the retrieval can also be applied to instrumentation not specifically designed to retrieve ozone, but UV irradiances, such as the UV sensor that is part of the Rover Environmental Monitoring Station (REMS) instrument [37] on board the Curiosity rover (although in that case, the uncertainties may be large enough to prevent the ozone retrieval, as will be discussed in the next sections).

2.2. The Ozone Detector and the Viewing Geometry

The measurement technique, taking into account the aforementioned constraints, infers the ozone column abundance by using the UV irradiance measured by two photodiodes, each one with a different wavelength filter within the UV band (Figure 1): one of them, ξ H , at the center of the Hartley band (~255 ± 5 nm), where ozone presents the highest absorption, and the other, ξ L (~295 ± 5 nm) or ξ L s (250–400 nm), where ozone is absorbed one or more orders of magnitude less. The second, reference band is chosen to be close enough in wavelength to minimize the uncertainties in the aerosol characterization that will be performed concomitantly with the ozone retrievals. Although ξ L spans a wide spectral range in the UV, in practice, most of the irradiance is received between 320 and 390 nm, given the shape of the solar spectrum. ξ L was established in the design phase of the instrument as the reference signal and ξ L s as a backup.
Each detector channel is composed of a photodiode with a filter in a particular spectral band, a field of view (FoV) mask, and a sapphire window, covered by a magnet [22]. Figure 2 shows the normalized spectral responsivity for the filter of the three MEDA RDS UV channels used in the ozone retrieval. The filters were designed to have a negligible temperature dependence (<1%) across the range of temperatures present on the Martian surface.
Figure 3 shows the detector positions on the rover deck. The details about the MEDA instrument hardware, including those of the ozone detector, are described in [22]. The two channels included in the Harley band, named the ozone channels, together with the remaining channel in the UV, were integrated in a wider set of channels in different spectral bands in the RDS [23] to characterize the radiation environment as well as aerosol optical depth and properties.
During the calibration tests, a particular focus was placed on characterizing the spectral transmittance of the filters outside the nominal pass band (Figure 2 bottom) and the potential straylight, that is, the light reaching the detector that lies outside the specified wavelength range, given the narrow bands used in the ozone channels and the shape of the solar spectrum, covering as far as the infrared. Both the ξ H /ch255 and the ξ L /ch295 channels presented straylight (Figure 2). A change in the last phase of the flight model (FM) manufacturing for the MEDA instrument involved the use of UV filters different from those previously considered during the design phase, a change that was discovered after landing. This change had three main consequences: (i) the filters finally included in the FM presented slightly different spectral transmittance than the previously considered ones (Figure 5 in [23]), which implied an update in the absolute calibration of the ozone detector channels (see Section 2.3); (ii) the straylight level observed in the assembled filters was higher than the straylight previously considered during the MEDA design phase, contributing to the UV irradiance signal by ~15% (instead <10%) using the solar spectrum as a baseline; and (iii) the new filter characterization included some uncertainty in the straylight effect (Figure 2), which in practice increased the detector uncertainty (see Section 5). The full spectral transmittance of the filter and its uncertainty is included in the ozone retrieval as a suitable characterization of the straylight effect for each channel.
As can be seen in Figure 3, the ozone detector was designed to have fixed zenithal viewing geometry in order to simplify the hardware, as illustrated in Figure 4. During surface operations, the ozone detector attitude deviates from a zenith-sky idealized geometry, mainly as a result of the slope of the terrain being explored by the rover, which is not usually larger than a few degrees. The FoV of the ozone channels is ±15 deg (Table 1). Hence, the ozone detector operates in scattered sunlight during most of the day, which is mainly the result of aerosol scattering, while also including a minor component of direct sunlight in the global irradiances measured by the ozone channels. When the Sun is inside the FoV, the direct component of sunlight usually dominates. Even in those cases, pre-landing radiative transfer model (RTM) simulations performed with UVISMART [34] suggested that scattered sunlight would be very significant, being greater than 10% of the signal under typical dust loadings expected at the landing site (see [38] for optical depth measurements until Perseverance sol 274), thus complicating the inference of the ozone abundance and requiring an RTM as part of the ozone retrieval process.

2.3. Sensor Calibration at INTA

The calibration of the ozone channels was performed during the RDS flight model (FM) unit calibration in 2018 in the Space Solar Cell Testing Laboratory (SPASOLAB) facilities at Instituto Nacional de Técnica Aerospacial (INTA). SPASOLAB is certified by the European Space Agency (ESA) to provide technical support in space applications.
The calibration process included the characterization of the absolute, thermal (TRF), and angular response (ARF) functions, for each channel, assuming that these response functions are independent of each other [39]. The RDS FM calibration was performed in a dark room, where the RDS unit was installed in a robotic platform, allowing azimuthal and zenithal rotations related to the incident light from a xenon lamp (Figure 5 left). The TRF calibration was performed in the LT/HT thermal chamber (Figure 5 right), covering the range of temperatures present on the Martian surface at tropical latitudes. Special attention was paid to the effect of straylight, which is particularly relevant in the ozone channels due to visible and infrared light not fully blocked by the filter (Section 2.2), and thus, specific tests were carried out to characterize the filter transmittance.
Two solar simulators were used to calibrate the ozone detector (SPASOLAB EP2 and EP7), with EP2 presenting a greater contribution in the UV band, which was necessary to improve the S/N on the detectors. Several irradiance measurements were tested, in each solar simulator, to obtain the mean responsivity for each channel under normal incidence, for different irradiance levels corrected both for AM0 and the spectral channel responsivity under the solar spectrum, R λ 1 λ 2 = 0 r λ E λ d λ λ 1 λ 2 E λ d λ , where λ 1 and λ 2 define the wavelength range (Table 1 and Table 2), r(λ) is the spectral responsivity of the channel, and E(λ) is the solar irradiance after the compensation of the deviation of the lamp spectrum shape from the solar spectrum.
Pre-landing RTM simulations suggested a required accuracy of <5% with a coverage of 95.45% (2σ) in the ozone detector to characterize ozone in tropical latitudes of Mars. However, difficulties in achieving this target led to the establishment of a requirement of <10% for 2σ, with a strong penalty in ozone sensitivity (see Section 5). The estimated accuracy in the channel ξ H /ch255 after the 2018 calibration in SPASOLAB was 12% (2σ), while the accuracy reached ~4–7% (2σ) in the remaining UV-to-IR channels of the RDS under normal incidence (Table 1 and Table 2). Such accuracy was limited by the spectroradiometer used in the calibration of the SPASOLAB solar simulators that were used in the sensor absolute calibration. The wavelength-dependent spectroradiometer uncertainties were obtained from its certificate of calibration and mainly came from the lamp used in its calibration.
Both the mean absolute responsivities and the RDS UV channel uncertainties were revised as part of further recalibrations performed in the ozone detector and improvements in the retrieval pipeline that generates the raw UV measurements to the NASA Planetary Data System (PDS). This analysis was extended to every RDS channel and included as part of the calibration procedure. The revised responsivities led to correction factors in the UV data currently published in the PDS after including the effect of channel spectra responsivities considering the updated filter spectral transmittance (Figure 2) and the wavelength ranges of Table 1. These correction factors are 0.946, 0.557, and 0.988 for ξ H , ξ L , and ξ L s respectively.
The revised uncertainties are shown in Table 1 and Table 2. The reduction in some channels resulted from considering a spectral weighting in the light reaching the detector (taking into account the spectral response of the detector) instead of using a reference wavelength for each channel independently of the light actually reaching the detector. The analysis revealed that the ch255/ ξ H channel also presents another relevant source of uncertainty related to inaccuracies in the characterization of the spectral transmittance in the blocking area (>300 nm) of the filter that was finally included in the FM (Figure 2), increasing its total uncertainty but treated independently of the absolute calibration presented in Table 1, affecting the absolute responsivity obtained in the calibration by 5% (2σ). Other uncertainties, such as those related to the in-flight characterization of the ARF and the effect of dust deposition, are also present in each channel signal; see the details in the next sections.
The ARFs for each channel were fully characterized in SPASOLAB (Figure 5) under clean conditions, although dust deposition once on the surface of Mars significantly changed the ARF shapes, particularly outside the FoV for the channels, thus requiring in-flight calibration, which is presented in Section 3.

3. In-Flight Calibration and Degradation on the Martian Surface

As in previous in situ sensors sent to Mars, such as those as part of the MSL REMS, photodiode windows are exposed to dust deposition [33,40], modifying the photodiode signal and causing it to deviate from the values calibrated on Earth. In order to reduce these effects, each ozone channel incorporates a magnet that minimizes the dust deposition on the photodiode window. Despite that, dust deposition still takes place on the photodiodes, both during landing and throughout the mission, resulting in a significant amount of dust particles covering the window (see, e.g., Figure 1 in [41] showing the REMS sensor covered by dust during a dust storm). Thus, a recalibration is needed once the sensor is operating on Mars.
The ozone detector channels, as well as the rest of the RDS channels, presented signal degradation on Mars. The degree of signal degradation during landing, both from dust deposition and other potential sources, was first obtained using observational data from the first sols of the mission using MastCamZ and SkyCam aerosol opacities [38,42] to derive two products: (i) a degradation factor at landing at zero zenith angle, and (ii) an empirical angular response function, both for each channel. The revised angular response function was necessary given the pernicious effect of dust on the detector photodiodes, which not only attenuates the signal but also modifies the incidence angle of direct and scattered sunlight reaching the detector, hence modifying the effective angular response function (ARF) of the detector. This effect of dust deposition on the sapphire windows/ARFs was successfully reproduced in laboratory measurements at INTA (the INTA tests will be presented in detail in a further study).

3.1. Detector Degradation at Landing

The RDS channels showed signs of significant degradation during the landing on Mars, partly attributable to dust deposited. This dust was lifted by the Skycrane retro-rockets during the final landing stage, while the Perseverance rover was slowly descending very close to the regolith. This degradation resulted in some signal attenuation in all RDS channels, which was produced by (i) the dust deposited on the RDS channels, blocking part of the sapphire window, and (ii) the effect of the dust deposited, producing scattering in the incident light. This second effect is dependent on the FoV of the channel mask, with significant differences observed between the ch190–1100/ ξ d channel (±90° of FoV) and the other ones (±15° of FoV). Thus, the large change in the ARF for those channels with narrow FoV (Figure 6) contributed to a larger attenuation/degradation in the signal at normal incidence due to the dust deposited on the detector.
In-flight calibration, which was performed using MCAM-Z aerosol optical depth data [38], showed similar degradation in all channels with a similar FoV (Table 3). Since aerosol scattering and absorption are wavelength-dependent, differences in degradation were expected for each channel due to this mechanism, as confirmed by the data (Table 3), thus presenting larger attenuation in shorter wavelengths. Also, differences in the dust deposited on each channel might be different, although the values presented in Table 3 suggest that this component, if it exists, was minor at the beginning of the mission. This could be a consequence of all channels being close to each other and subjected to a similar magnetic field protecting them from dust deposition, and the Perseverance rover continuously having different azimuthal attitudes during surface operations, minimizing prevailing wind directions depositing dust on the sensors. The degradation in ch255/ ξ H was assumed to be the same as that in ch295/ ξ L and ch250–400/ ξ L s , which is a reasonable assumption given the aforementioned considerations, together with the proximity in wavelength range with the contiguous channel and the similarity observed among all channels from the UV to the IR (Table 3). Such channel degradation is taken into account in the retrieval algorithm of aerosol and ozone by using UVISMART (Section 4).

3.2. In-Flight Angular Calibration (ARF) Using In Situ Data

An in-flight angular calibration was required for the ozone detector, given the pernicious effect of dust on the sensor photodiodes (not only in attenuating the signal at normal incidence but also in modifying the incidence angle of direct and scattered sunlight reaching the detector, hence modifying the effective angular response function of the detector). Differences of orders of magnitude were observed between the pre-landing ground calibration and the post-landing calibration at high SZA. This means that direct sunlight is affecting the signal at medium-to-high zenith angles, contradicting the theoretical FoV that mostly neglected zenith incidence angles greater than 45°. Laboratory tests demonstrated that dust deposition was responsible for that situation (dashed line in Figure 6), although with less effect than that observed in data acquired on the Martian surface. Figure 6 shows the resulting azimuth-averaged ARF for the UV channels, both for the post-landing laboratory ARF considering dust deposited on the detector and for the ARF recalibrated using data from the first sols of the mission, based on the method described in [33]. As can be seen, outside the FoV (zenith angle > 15°), differences due to variable dust deposition are very significant and dependent on the channel. At low zenith angles (<5°), the difference is, however, low (<5%). Also, it is expected that the ARF will change throughout the mission as dust is redistributed on the detector windows, thus needing periodic recalibrations of the ARF.

4. Ozone and Aerosol Retrieval Algorithm

4.1. The Radiative Transfer Model (RTM) and the Multidimensional Look-Up Table (LUT)

As described in Section 2, it is assumed here that there are no other absorptive opacity sources within the Hartley band due to other chemical species on Mars. However, the presence of aerosols (primarily dust) is common in the Martian atmosphere even outside the dust storm season (e.g., [31,32]) and must be taken into account in the retrieval algorithm (e.g., [32,43,44]). Rayleigh scattering, although having a lower contribution to scattered sunlight than on Earth’s atmosphere, must also be considered. Therefore, a procedure for decoupling such effects from the measured irradiance is required to obtain the column ozone abundance. Advanced techniques/sensors widely used to date on Earth at other UV wavelengths, such as differential optical absorption spectroscopy (DOAS), are able to perform spectral deconvolution, that is, to decouple aerosol and other influences in the signal by a polynomial that is fit for the measured spectra. This approach requires, for the separation of rapidly and slowly varying spectral structures, that the absorption cross-section of the retrieved species contains a component quickly varying with wavelength, whereas the variation in the component to be decoupled is smooth. However, this method of decoupling is not possible here given that the photodiodes observe in a few discrete bands without enough spectral resolution and that the aerosol extinction in the Hartley band, and in the UV in general, follows a similar variation to ozone in terms of its slowly varying spectral structure. Thus, an RTM is necessary to decouple those effects.
Here, we use the UVISMART model as a forward model to compute the irradiances associated with the spectral channels. This model, which is detailed in [34], has been designed to efficiently compute modeled spectra and irradiances as measured by photodiode detectors, both on the Martian surface and in other more complex geometries such as cave entrances. In short, UVISMART uses the discrete ordinates method (DISORT) to treat multiple scattering (e.g., [45,46]). Pseudo-spherical correction is applied to increase the accuracy for low solar elevation angles [47]. Water ice clouds can be included in the model as well with a prescribed vertical profile. As in previous work (e.g., [19,34]), we use the vertical profiles of pressure, temperature, and aerosol simulated by the Mars Climate Database [48]. Dust aerosol optical properties can be computed in the model as a function of wavelength using Mie theory or the T-matrix [49]. In this study, we use the T-matrix results for our aerosol model, with cylindrical particles of a diameter-to-length ratio (D/L) equal to 1, effective radius of 1.5 μm, effective variance of 0.2 μm, and dust aerosol refractive index in accordance with [44,50]. The irradiance is computed from the previously derived spectral radiance for each channel, considering the angular response function of the channel mask (Figure 6) and then integrating based on the spectral transmittance of the detector (Figure 2). The UVISMART RTM was successfully validated using the available irradiance measurements taken by NASA’s Mars Science Laboratory (MSL) [34].
A large amount of data is expected from surface missions, which typically measure continuously at high frequencies (1 Hz) for several minutes every hour, during mission operations that can last for years. In order to minimize the computational effort in the retrieval algorithm, a multidimensional look-up table (LUT) with the resulting irradiances computed by UVISMART for each channel was generated as a function of SZA, dust and water ice aerosol opacities, aerosol properties and vertical distributions, surface pressure, total ozone column abundance, and vertical partitioning between surface ozone (lower troposphere—LT layer) and upper-tropospheric (upper troposphere—UT layer) ozone. This partitioning is based on the vertical profile obtained by the JPL/Caltech KINETICS photochemical model as presented in [19]. It results, in the current version, in an LUT with on the order of 106 elements in the database spread out in the aforementioned axes for each channel used in the retrieval in the UV ( c h 255 / ξ H , c h 295 / ξ L , ch250–400/ ξ L s ), including the total column abundance axes, and 105 elements for the remaining channels (ch950/ ξ a and ch190–1100/ ξ d ), with the last ones being independent of the ozone quantities. The multivariable interpolation of the LUT is performed by splines. The error in the derived synthetic irradiance signals due to interpolation is less than 1% in most cases, not exceeding 2% in the remaining cases, which usually occur at high SZAs, which is well below the measurement uncertainty.

4.2. Aerosol Retrieval and Photodiode Degradation

The retrieval algorithm first derives the total aerosol optical depth by using the ch950/ ξ a upward-looking channel. The aerosol optical depth is retrieved by minimizing the least-squares difference between the observations and the synthetic signal computed by UVISMART, using the Levenberg–Marquardt algorithm and selecting the best-fit aerosol optical depth. The partitioning between dust and water ice aerosols can also affect the ozone retrievals. Several tests, which are summarized in Section 5, were performed in order to assess the sensitivity of ozone retrievals to different contributions of dust and water ice aerosols to the total opacity, and it was concluded that, for low-SZA retrievals under low/moderate aerosol loading, ozone retrievals were mostly independent of the partitioning included in the retrieval (see Section 5), thus simplifying this step of the retrieval process to only deriving the total aerosol optical depth. In any case, other sensors both on board Perseverance and orbiters [51] will constrain the aerosol partitioning, thus minimizing this potential source of uncertainty, particularly in retrievals inferred in other diurnal timeslots.
As described in Section 3, the ozone detector has seen signal degradation on Mars. The signal degradation mainly comes from dust deposition and does not change linearly with time, with significant variations being associated with periods of cleaning by strong winds, gusts, turbulence, wave activity, and/or dust devils. Hence, the measured irradiance signals need to be corrected to obtain absolute irradiances. We use the ch190–1100/ ξ d channel for this purpose, by fitting the synthetic response of this channel taking the MastCamZ and SkyCam opacities [42] and deriving a multiplicative dust attenuation factor for the photodiode signal (Section 3). On the REMS UV sensor photodiodes, the UV signals were attenuated ~10% after half an Earth year compared to the beginning of surface operations, reaching ~30% of attenuation after 1 Earth year, while also experiencing cleaning events during the dust storm season; the authors of [33] were able to restore the signals to values close to those observed soon after the landing. The retrieval assumes, initially, that the dust is deposited similarly between all upward-looking channels, correcting signals in a channel-specific manner if necessary. The results shown in Table 3 suggest that any potential variability in dust deposition, if it exists, is minor at the beginning of the mission.

4.3. Ozone Retrieval

Once the ozone channel signals are corrected for the effects of degradation, and aerosol optical depth is obtained for a particular time as part of the retrieval process, the retrieval algorithm then derives the total ozone column abundance based on the best knowledge of the atmosphere using concomitant measurements acquired by MEDA and the aforementioned aerosol retrievals, considering several individual measurements to properly minimize potential random uncertainties. This part of the retrieval can be performed by two methods: (i) the LMA method, which infers the ozone abundance similarly to the aerosol optical depth retrieval, that is to say, by minimizing the least-squares difference between the observations and the synthetic signal computed by UVISMART and stored in the LUT, by using the Levenberg–Marquardt algorithm and selecting the best-fit total column abundance of ozone, and (ii) the SCD method, which first derives the slant column density (SCD) of ozone and air mass factors (AMFs) and then computes the vertical column density (VCD) of ozone. The SCD method, described below, reduces the computational effort and involves a mathematical formulation that is appropriate for low/moderate dust loading, as is present in Jezero Crater outside of dust events [42]. Both methods provide similar performance under these conditions (Section 5). For higher dust loadings, the retrievals are obtained by the LMA method.
In order to compute the SCDs, the spectral irradiance at the surface, E , can be defined at a given wavelength λ, and for a particular time instant k, based on an extended version of the Beer–Lambert law to deal with aerosol and Rayleigh scattering, and separating between the absorber that is being retrieved and the remaining extinction processes in the atmosphere:
E k = E 0 k e ( τ s k + τ a k ) ,
where E 0 k is the spectral irradiance at λ in the top of the atmosphere, τ a k describes the effect of aerosols, other absorbers, and Rayleigh scattering, and τ s k is the associated slant optical depth for the absorber that is being retrieved, defined by
τ s k = σ k · n k   d l k ,
where σ k is the absorber cross-section at λ, n k is its number density, and l k is the photon path throughout the atmosphere to the sensor. Rearranging Equation (1), substituting Equation (2) in Equation (1), and assuming a uniform σ k l , we obtain
ln I k = σ k · S k τ a k ,
where I k is the normalized spectral irradiance to the top of the atmosphere at λ and S k = n k d l k is the absorber column density. This equation is widely used on Earth for retrieving chemical species in the atmosphere, both under direct sunlight and scattered light, even with a non-negligible contribution from multiple scattering (e.g., [52] and references therein). In the second step, the conversion from S k to vertical column densities V k can be performed by V k = S k / A k , where, in scattered sunlight conditions, the air mass factor A k is computed by an RTM. In the case of strong absorbers or high aerosol opacities, however, the conversion to vertical column densities is not straightforward as the wavelength dependence on S k is neglected [52]. In those cases, the use of the LMA method (a direct match between the observations and the synthetic irradiances included in the LUT) is preferred.
It should be noted that we have assumed uniform absorption cross-sections throughout the atmosphere. This is not the usual case in other spectral bands, given the usual dependence of the cross-sections on temperature; however, ozone presents, in the Hartley band, a negligible dependence on temperature (Figure 1), in addition to a negligible dependence on pressure, which validates this assumption and also allows the consideration of σ k as a constant, thus simplifying it to σ .
The main issue associated with a retrieval algorithm for the slant column density S based on Equation (3) is that τ a k is unknown. As stated above, it is not possible to consider a differential slant column density, and therefore the effect of the aerosol must be retrieved by an RTM [34] using the best knowledge of the atmospheric state and aerosol loading and properties, based on contemporaneous measurements, as described in Section 4.2. Potential uncertainties associated with the presence of aerosols and Rayleigh scattering can be strongly minimized taking the ratio between two close wavelengths in which the aerosol properties are similar, resulting in the retrieval being mostly insensitive to uncertainties in the aerosol loading under low SZAs (see Section 5). Considering the instrument spectral bands ( ξ H and ξ L / ξ L s ) instead of wavelengths leads to the governing equation of the SCD retrieval for ozone:
ln ψ = ( σ H σ L ) · S k + ln ψ s ,
where ψ is the observed ratio between I k ( ξ H ) and I k ( ξ L / ξ L s ) , both measured for a particular time instant k, σ H and σ L are the channel absorption cross-sections, integrated for ξ H and ξ L / ξ L s , respectively, ψ s is the ratio between the same bands but without an absorber, simulated by the RTM, and S k is the SCD for a particular instant k. SCDs can then be obtained from Equation (4). Note that the governing equation can be used interchangeably with ξ L or ξ L s , since the temperature effect on the ozone cross-sections in the ξ L s band is negligible in the term ( σ H σ L ) given the strong difference in the ozone cross-section within the ξ H band.
The retrieval algorithm can split the atmosphere into M different layers with partial vertical column densities V i , V = i = 1 M ( V i ) , where V i = S i / A i and A i is the air mass factor derived by UVISMART. This allows the extraction of atmospheric vertical information from the irradiance measurements. In order to simplify the algorithm, we only consider the ozone column density retrieval over one layer in the atmosphere, that is to say, we retrieve the total ozone column abundance V = V i , A = A i , and S = S i . Thus, once the SCDs are computed, the second step consists of converting S to vertical column density, V , making use of the RTM. V can be retrieved for instantaneous measurements, or in a timeslot t in order to minimize potential biases. Considering a group of N measurements at time t, and assuming that the ozone abundance is constant in t, the vertical column density in such an interval can be straightforwardly computed by
V t = 1 N k = 1 N F k ( S k / A k ) ,
where A k is the air mass factor for an instant k and F k is a factor dependent on the S k uncertainty, which simplifies to unity if S k   k ,   1 k   N , has similar uncertainty.
The use of the SCD method for the retrieval of ozone was verified in a simulation under Mars conditions and different ozone abundances using synthetic irradiances obtained by the RTM, deriving very accurate results under several scenarios representing the range of atmospheric conditions typically present at Jezero (see Section 5), similar to the results from the LMA method. The retrieval algorithm was also tested in a simulation under different conditions, including potential biases and uncertainties in the retrieved aerosol optical depths, aerosol partitioning, and vertical profiles, showing very good performance (Section 5).

5. Ozone Detector Performance and Uncertainties

5.1. Sources of Uncertainty in the Observed Ratio ψ

Uncertainties in the retrieval of ozone column abundance are mainly attributed to detector calibration uncertainties and to errors in the definition of the atmospheric state in the retrieval algorithm. Other minor contributions to the total column uncertainty could be due to the interpolation of the LUT (<2%, see Section 4) and the degradation of the detectors. Precision and other non-linearities could also have a significant effect at high SZAs when the signal is low (Table 1). Therefore, the retrieval algorithm only works with irradiances above these levels, neglecting the data below these thresholds. Sources of uncertainty that affect the ξ H and ξ L / ξ L s channels similarly, such as dust deposition on the detectors, would be strongly reduced by the retrieval algorithm given the use of ψ (in both the LMA and SCD methods); that is, such effects should be canceled or strongly minimized by applying the ratio between the channels. We estimate this contribution to the uncertainty in the ratio as 1–2%.
The uncertainty in the first source group (detector calibration uncertainties) is mostly dominated by systematic errors in the absolute calibration of each channel (9.5% (2σ) in ξ H ; see Table 1). Given that all channels were calibrated in the same way, it is expected that the uncertainty in ψ is strongly reduced, ideally being zero if the uncertainties of the standard instrument (the SPASOLAB spectroradiometer) used in the solar simulator calibration were correlated, uniform throughout the wavelength, and no other minor sources of non-correlated uncertainties were present in each channel. The standard instrument presented similar uncertainties at all wavelengths from UV to IR as reported in its certificate of calibration, and these uncertainties were larger at the shortest (<270 nm) and longest wavelengths (>2 µm). However, in order to consider the worst-case scenario in the propagation of uncertainty, we assume that the absolute calibration uncertainties cannot be canceled by applying the ratio between close spectral channels, establishing a conservative 12% uncertainty (2σ) for ψ , thus including the uncertainties of each channel (9.5% and 5.4–5.5%), added in quadrature, and the uncertainty in the characterization of the filter transmittance (Section 2.2). Another relevant source of uncertainty relates to the ARF of the detector. However, the use of measurements acquired at low zenith angles and the use of a timeslot t with different SZAs and azimuths will strongly reduce such uncertainties; therefore, the absolute calibration is the dominant source of uncertainty in any case.
The second source group (errors in the definition of the atmospheric state in the retrieval algorithm) is dominated by uncertainties in the aerosol loading and properties. Although aerosol opacity will be simultaneously retrieved, high uncertainty was expected a priori about the contribution of dust and ice cloud aerosols in the retrieved opacity, as well as in their vertical profiles and optical properties. Given that weather parameters such as pressure will be accurately measured as part of the mission instrumentation, no significant uncertainties are expected from this source. Variations in the atmospheric density profiles over those obtained from the MCD have little effect on the ozone retrievals.
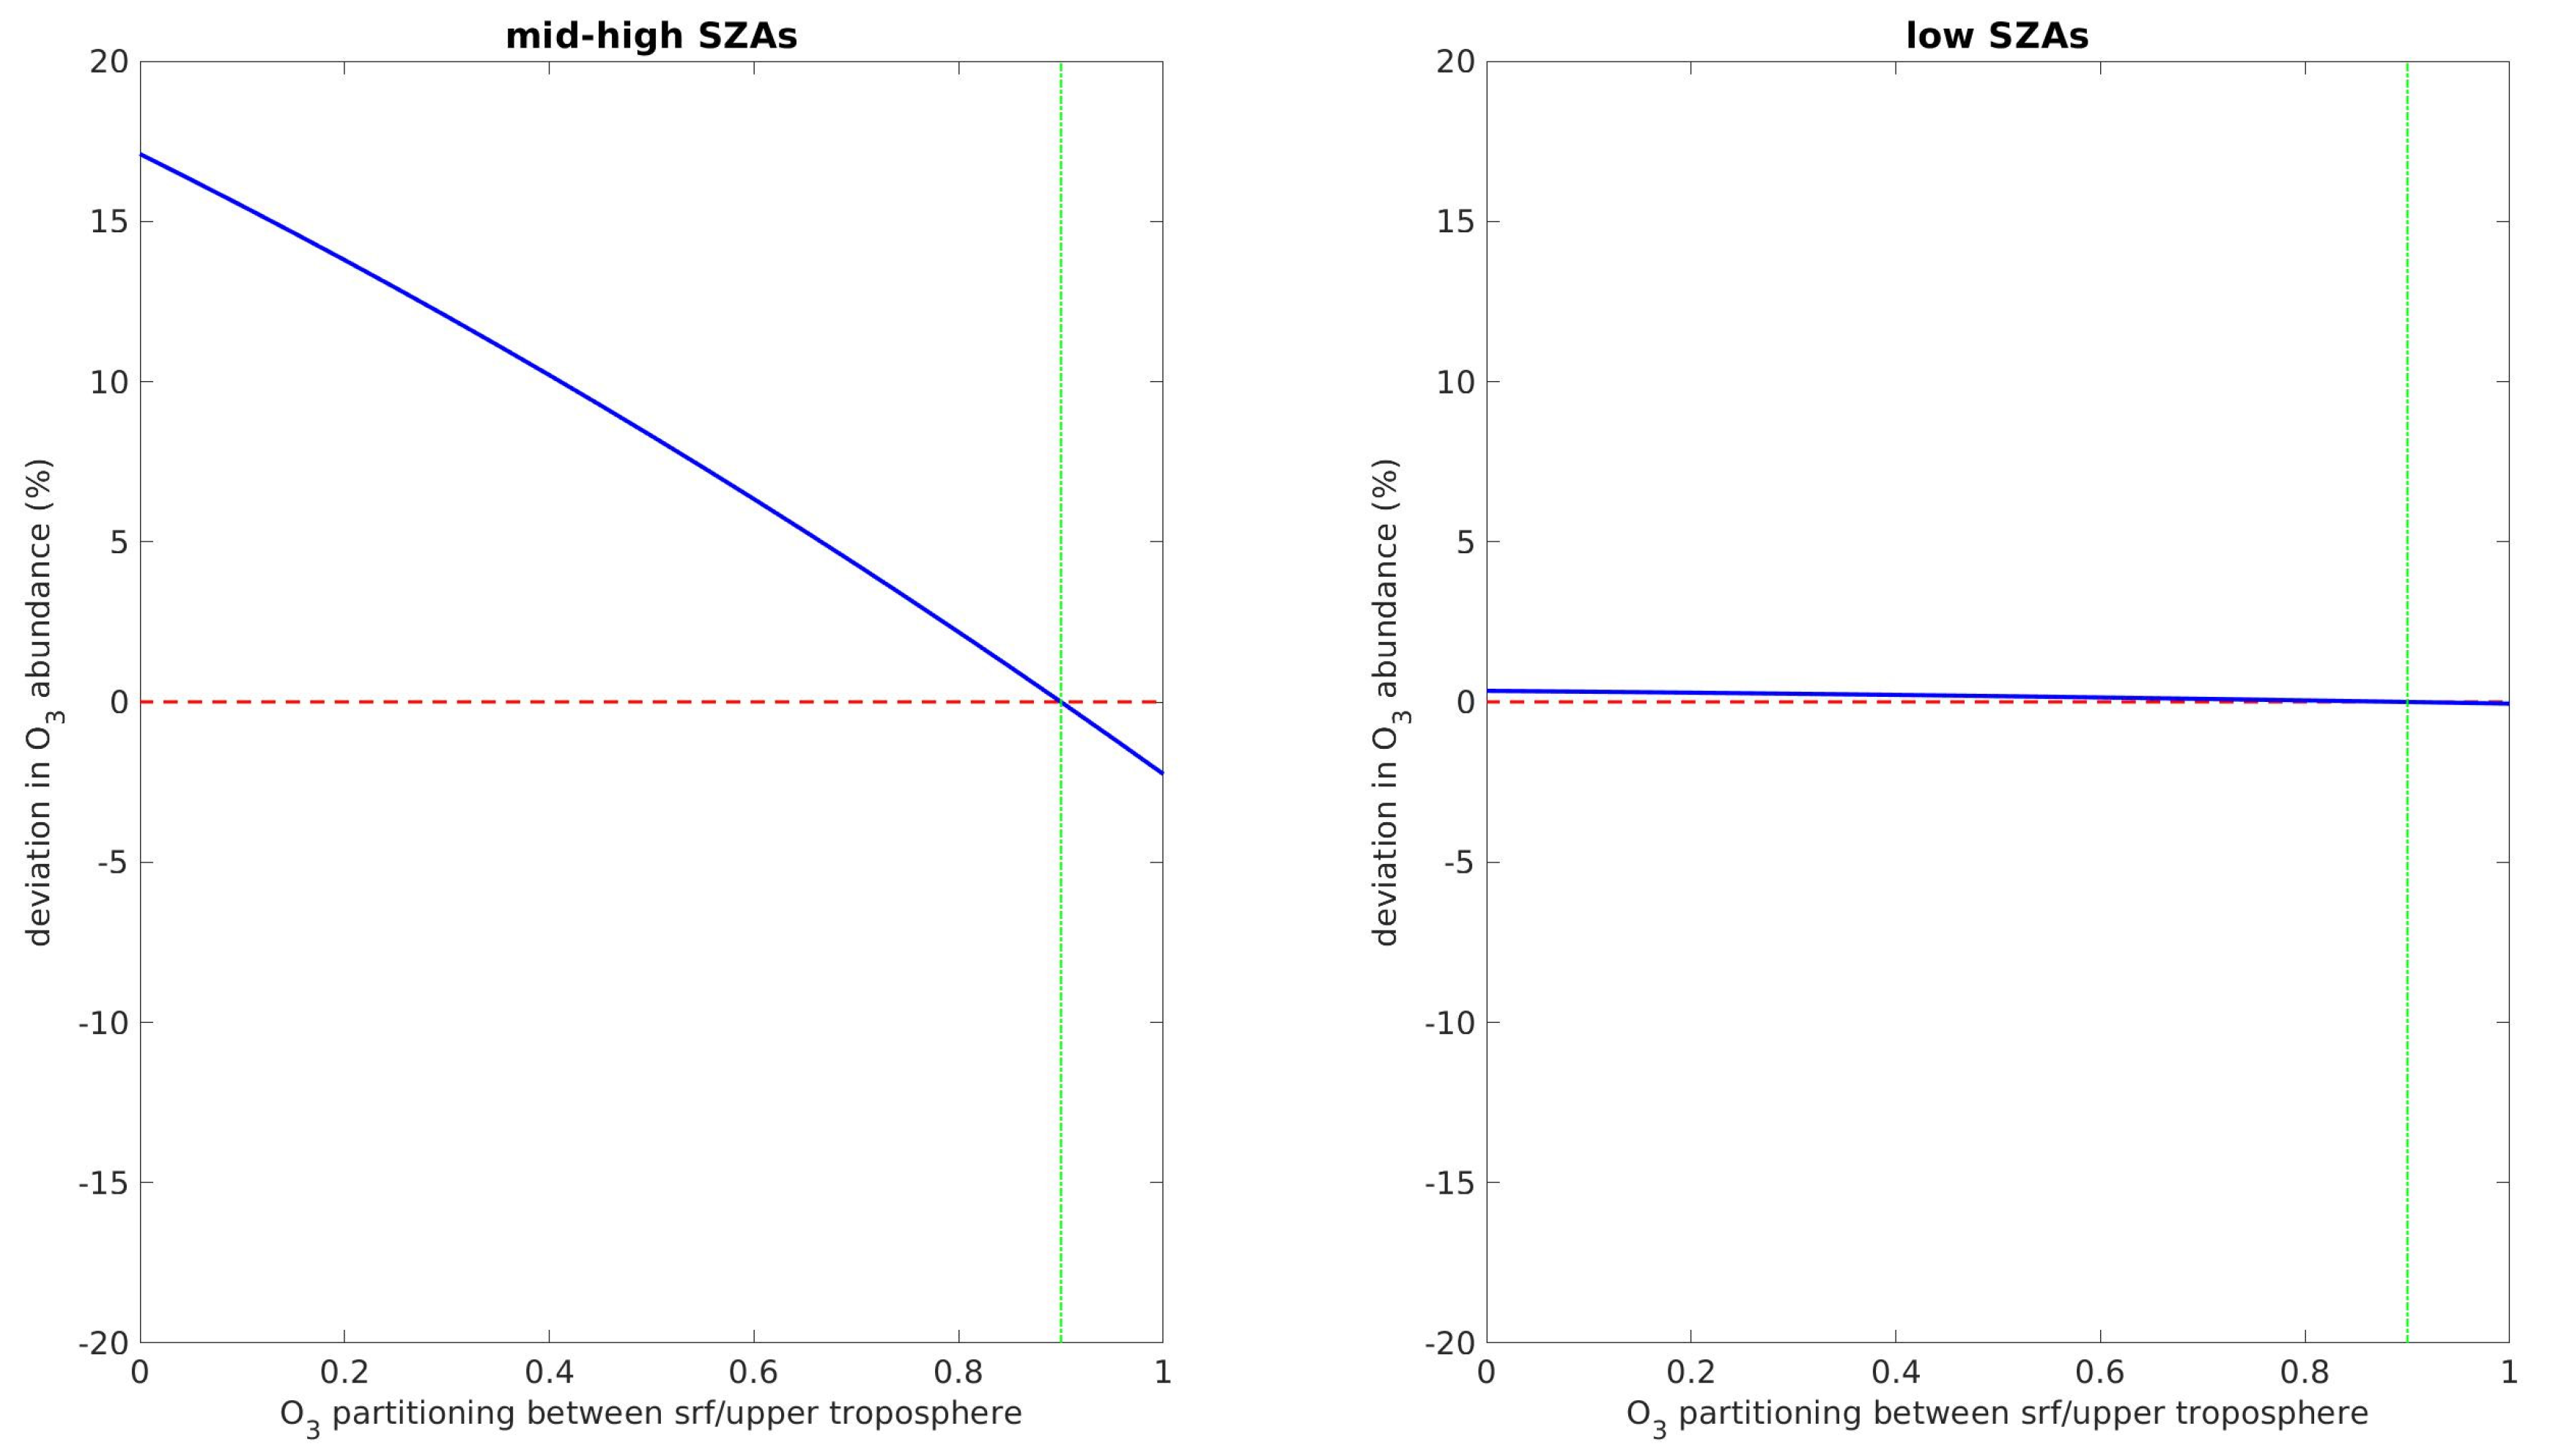
The potential uncertainty in the retrieval of VCD by the prescribed vertical profile of ozone in the retrieval algorithm was also verified. Additional tests showed that the ozone retrieval is mostly insensitive to the vertical partitioning of ozone in the atmosphere under low SZAs and low/moderate aerosol loading (Figure 7); therefore, no uncertainties associated with the prescribed vertical profile of ozone are expected using measurements at low SZAs.

5.2. Effect of Uncertainties on the Ozone Retrieval

We focus on the two major uncertainty sources that are expected in the retrieval of ozone column abundance: (i) uncertainties in the absolute irradiances measured by the detector and (ii) uncertainties in the aerosol definition in the retrieval algorithm.
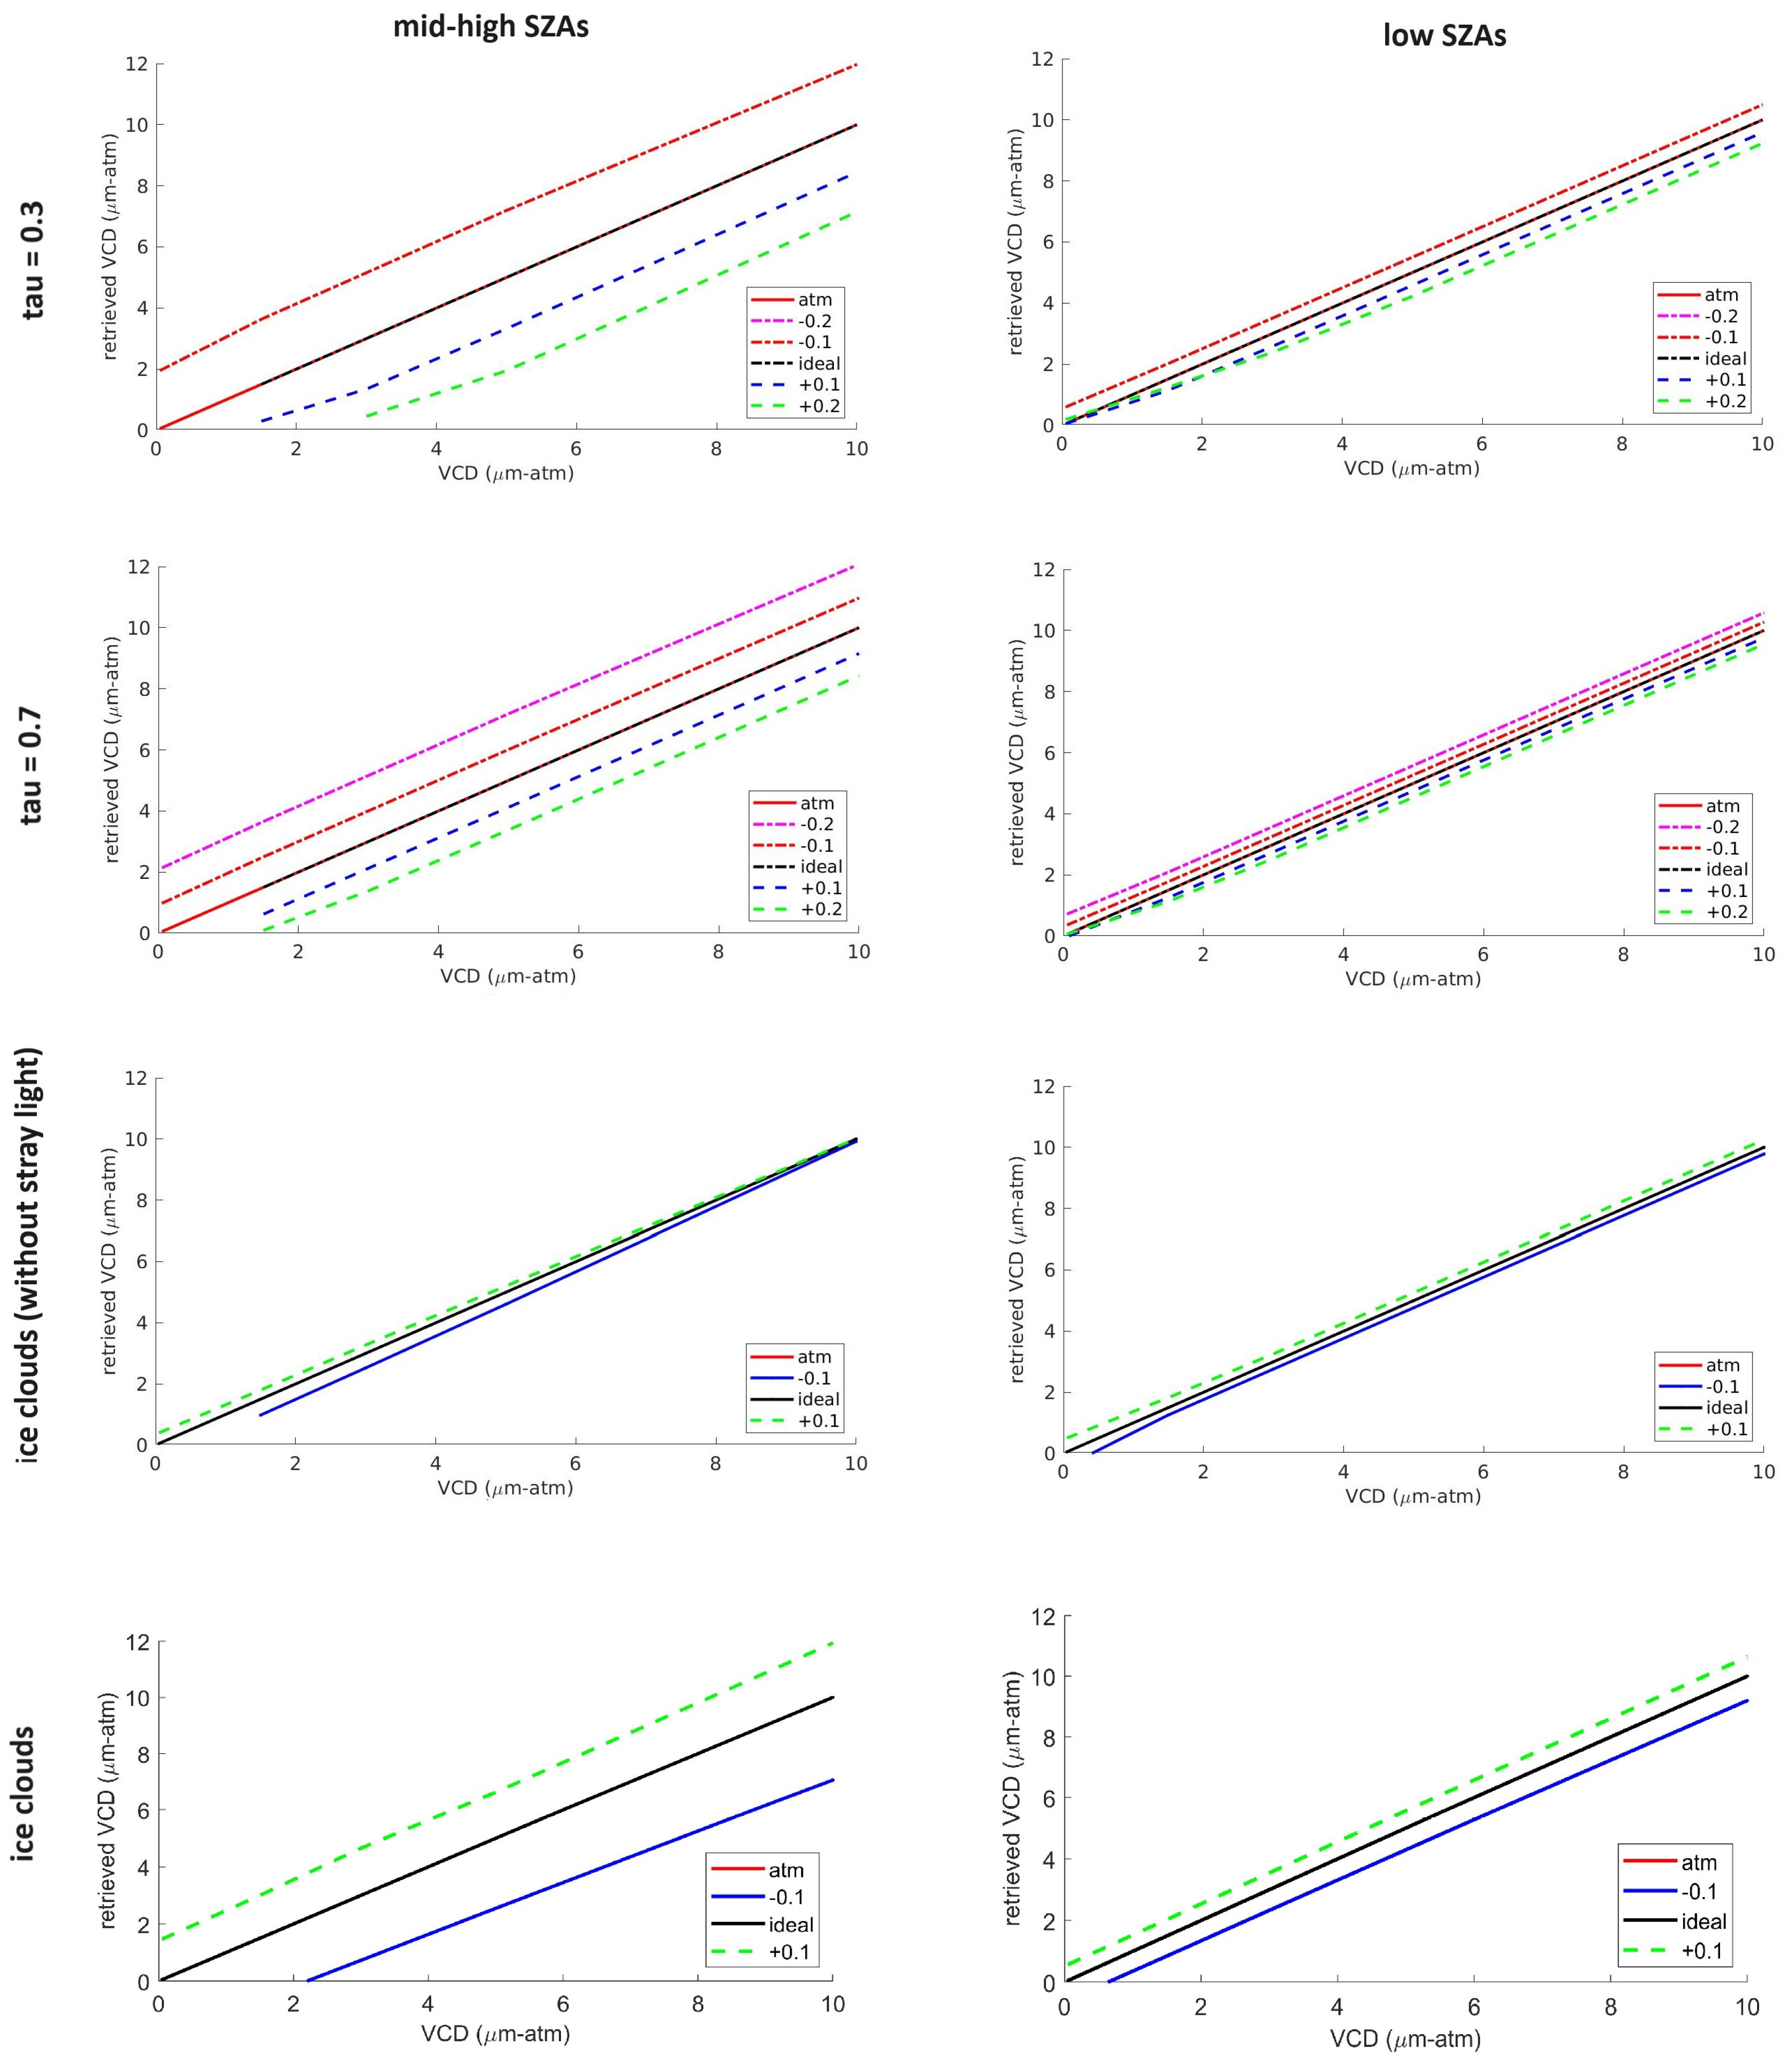
In order to quantify such effects, simulations under different scenarios were performed for several ozone column abundances. Synthetic irradiance measurements obtained by UVISMART throughout the diurnal cycle were converted to SCDs (Section 4.2) and then split into three time periods with a duration of 4 h: (i) t1: 6–10 h LTST (30° < SZA < 80°), (ii) t2: 10–14 h LTST (0 < SZA < 30°), and (iii) t3: 14–18 h LTST (30° < SZA < 80°), each including measurements spread out in each interval. For each time period, the vertical column density of ozone was retrieved. Two dust loadings were simulated, τ a = 0.3 and τ a = 0.7 at 880 nm, which are representative of the nominal aerosol present in tropical latitudes on Mars outside of high-dust-loading events such as dust storms, as observed in current and previous missions, e.g., [32,33,38,43]. The vertical partitioning of ozone in the retrieval algorithm was fixed to 90% of surface ozone (LT layer) ( V s r f = 0.90 · V ).
Figure 8 shows illustrative simulations for τ a = 0.3 ( τ a = 0.7 presented similar results), both for t1 and t2 (t3 showed similar results to t1). The ozone retrieval was constrained in this first set of simulations with the prescribed aerosol loading and properties. A first set of simulations in an ideal scenario considered no errors in the irradiances input to the retrieval in order to verify the method. The retrieved column abundances of ozone (black lines in Figure 8) showed an excellent agreement with the ozone abundance used to generate the synthetic irradiances (red lines in Figure 8) under Martian conditions, even under the assumptions used in the retrieval algorithm described in Section 4.3, allowing an accurate retrieval of ozone column abundance without assumptions on its vertical profile.
Next, errors in the irradiances input to the retrieval were added to the original simulations computed by UVISMART. Figure 8 shows ±5% and ±10% errors in the measured ratio ψ for each dust scenario. Assuming the worst-case scenario described above, meaning that calibration uncertainties cannot be compensated for by taking the ratio between the ozone channels, the 1σ uncertainty of ψ should be ~6%, implying uncertainties from this source of ~1 µm-atm (Figure 8 left) at mid-to-high SZAs and ~2 µm-atm at low SZAs (Figure 8 right), where the air mass factor (AMF) is close to unity.
When scattered sunlight is a relevant component of the signal, the RTM strongly relies on the aerosol model and on the vertical distribution and partitioning (dust vs. ice) of aerosols. Additional simulations were carried out to verify the retrieval performance under degraded conditions, where significant discrepancies existed in the aerosol loading and properties used in the retrieval algorithm with respect to those of the actual (in this case simulated) atmospheric conditions.
A subset of those simulations is presented in Figure 9, including variations in the aerosol loading, properties (refractive index, reff, and veff), and vertical profiles. Figure 10 shows the same cases described above but using ξ L s in the ratio ψ instead of ξ L . The use of that channel introduces additional errors in the retrieved ozone, which was expected given the discrepancies in the radiance field as a function of wavelength as a result of variations in the aerosol properties as wavelength departs from ξ H .
The results strongly suggested that the ozone detector can deal with significant differences in the aerosol definition, retrieving reliable ozone column abundances even with discrepancies in the aerosol loading, composition, vertical profile, and properties. The most pernicious effect was the presence of straylight in the ozone channels, introducing a significant amount of light from visible and infrared wavelengths. Thus, errors in the contribution of ice aerosols such as those included in the simulations implied a significant bias in the retrieved ozone abundance at medium-to-high SZAs (an underestimation of water ice aerosols resulted in an overestimation of ozone). The uncertainties derived from discrepancies in the aerosol definition were minor for low SZAs (<1 µm-atm), even when ξ L s was used in the ratio ψ instead of ξ L , which validates the use of this channel in the ozone retrieval.
The aforementioned simulations for discrete deviations in the measured ratio ψ and discrepancies in aerosol loading were complemented with a comprehensive set of Monte Carlo simulations to search for potential correlated errors. Thus, Monte Carlo simulations with the aforementioned effects in the retrieved ozone column abundance showed that uncertainties in the total column retrieved were ~2.3 µm-atm at low SZAs and increased at medium-to-high SZAs due to the presence of straylight in the ozone detectors (straylight effects dominated the increase in ozone uncertainty at those zenith angles). In both cases, the total uncertainty in the ozone column abundance is governed by calibration uncertainties of the instrument, particularly in ξ H /ch255, by the absolute calibration and straylight effects.

5.3. Retrieval Uncertainties and Surface Operations on Mars

Measurements acquired by the MEDA instrument, including those related to the ozone detector, are obtained at 1 Hz during even or odd Martian hours, alternatively, from sol to sol, in Martian local mean solar time (LMST). In addition to these background hourly measurements, additional blocks may be included in each daily plan considering the operational constraints of the Perseverance rover. Although not usually applied during the first mission sols to simplify the complex surface operations, the background measurements may be moved in time and lengthened or shortened if necessary.
At low SZAs under low/moderate dust loading, the simulations presented in Section 5.2 showed that moderate errors in the aerosol loading and partitioning between dust and ice clouds (implying differences in both optical properties and vertical profiles) presented a minor influence in the retrieved ozone column abundance. Also, the retrieval at those angles was mostly insensitive to the vertical profile of ozone prescribed in the algorithm, allowing the retrieval of vertical ozone column densities without the influence of the ozone vertical profile prescribed in the retrieval algorithm. Although the effect of calibration uncertainties is minimal for measurements acquired at medium-to-high SZAs, other instrumental issues such as potential shadows cast by the rover/platform deck (not previously contemplated during the design phase due to the theoretical lack of irradiance signal at those incidence angles), ARF uncertainties in the in-flight calibration, instrument precision/non-linearities at low electrical intensities observed after landing (out of scope of this paper), side effects from dust deposition on the detectors, and the uncertainties in the aerosol partitioning and its vertical profile in the atmosphere, strongly enlarged by straylight effects, would make the retrieval of ozone difficult under those conditions in practice.
Photochemical models have been extensively used to predict the vertical profile of ozone in the Martian atmosphere, thereby offering a bulk estimation of the vertical distribution of ozone in the lowest layers. Models strongly suggest that the vertical profile of ozone at tropical latitudes presents two local maxima, one well above the first scale height (upper troposphere, UT) at 30–60 km of altitude (where orbiters are sensitive in limb geometry), and another at the surface (e.g., [20]), each showing Ox production and loss mechanisms strongly depending on the atmospheric layer and time of the day (e.g., [19]). Each layer thus contributes in a complex way to the column abundance observed from space. Observations from space also indicate that Martian ozone exhibits high spatial and temporal variability, which makes precise characterization within the atmosphere challenging. Maximum abundances of O3 were observed at polar latitudes, with column abundances of 30–40 μm-atm in local winter (e.g., [29]). The observed ozone column abundance from orbiters has resulted in much lower values in the tropical region, usually ranging between 0 and 3 μm-atm during daytime, close to their detection limits and with seasonal and spatial variations and an apparent anticorrelation with water vapor (e.g., [7] and references therein). Ground-based telescopic observations in the thermal infrared retrieved greater abundances around the aphelion, reaching ~7.2 ±1.5 (1σ) μm-atm [16].
Therefore, the ozone detector is expected to enable the detection of ozone on the Martian surface, even considering the final uncertainties. It is important to note that most of the retrieval uncertainties, particularly at low SZAs, are systematic uncertainties derived from the absolute calibration of the instrument. Thus, the ozone detector will also be able to obtain valuable insights into the temporal variability of ozone at Jezero Crater, Mars, including its seasonal and diurnal variability.

6. Other Potential Ozone Detectors on Mars

The retrieval algorithm presented in this study is generic and can be applied to other Martian instruments. In particular, the ESA’s ExoMars platform was planned to carry an ozone detector similar to the one included in the Mars 2020 Perseverance rover, developed at INTA with the same features, spectral bands, and calibration procedures as those previously included on Perseverance. On the other hand, UV sensors with wavelength bands not specifically designed to measure ozone, but rather irradiances, could also have the potential to detect ozone.
The MSL Curiosity rover landed in Gale Crater (4.5°S, 137.4°E) in 2012. The REMS instrument, on board Curiosity, includes a UV sensor that has successfully been measuring UV radiation in discrete UV spectral bands, including the UVC band (200–280 nm). The main objective of the UV sensor was to provide in situ measurements of UV radiation for the first time, although the measurement of ozone was originally proposed as well [37]. However, the use of broadband spectral bands in the UV sensor (with lower sensitivity to ozone), calibration issues, and a lack of adequate ozone abundance have hindered a reliable retrieval of ozone using this instrument. The potential application of the ozone retrieval algorithm to this sensor is discussed below.
The performance of the ozone retrieval under the same scenarios presented in Figure 8, but applied to the MSL REMS UV sensor, is presented in Figure 11. As can be seen, ozone uncertainties are larger for the MSL considering the same measurement uncertainty than those for Perseverance, due to the use of wide spectral bands in the ratio ψ (UVC and UVB bands) instead of narrow spectral bands such as those included on Perseverance. The results shown in Figure 11 suggest that the potential detection of ozone in Gale Crater using the REMS instrument is possible under particular circumstances and will depend on the results of a detailed uncertainty analysis that will be published as a further work.

7. Conclusions

Systematic measurements of chemical species from the planetary surface could advance our knowledge of the atmospheric chemistry and habitability potential of Mars. We present a measurement technique, detailing the detector, the retrieval algorithm, and the associated uncertainties to infer, for the first time, ozone abundance from remote sensing observations on the Martian surface using irradiance measurements in discrete UV spectral bands.
Delivering payloads to the Martian surface is currently very complex and strongly constrained. Taking into account such constraints, we use the same basic principle of the Dobson technique to retrieve the column abundance of ozone from the Martian surface. We have also simplified the hardware to require only two wavelength bands measuring global irradiances in a zenith-sky viewing geometry. Thus, the ozone detector that is part of the Perseverance rover mission is based on a two-filter UV radiometer that measures global (direct + diffuse) irradiances in the UV band, with additional channels in other spectral bands used to retrieve the aerosol loading and the detector degradation as part of the ozone retrieval. Aerosol loading and ozone abundance are inferred using a parametric version of the radiative transfer model UVISMART.
The ozone detector is expected to enable the detection of ozone on the Martian surface, as well as to obtain valuable data on the temporal variability of ozone from the surface of Mars, including seasonal and diurnal variability. The ozone retrieval is robust under different sources of uncertainty and does not need accurate measurements of aerosol loading, optical properties, and vertical profiles at low SZAs, where measurements are more reliable. Uncertainties in the retrieval of total column abundance increase at medium–high SZAs due to the presence of straylight and other issues in the ozone detectors of Perseverance. In both cases, the uncertainties are dominated by the effect of the absolute calibration in the measured ratio ψ .
This ozone retrieval methodology can also be applied to other Martian instruments, such as the REMS instrument on board the MSL Curiosity rover, which has been collecting data on the surface of Mars since 2012. Other instruments, such as those originally planned on board the ESA’s ExoMars platform, will also include discrete photometric UV sensors that can be used to infer ozone abundance from measured irradiances using the ozone retrieval presented here, with minimal cost in surface operations on Mars.

Author Contributions

Conceptualization, D.V.-M., A.S.-L., M.D.S., V.A., I.A. and J.A.R.-M.; methodology, D.V.-M., A.S.-L., M.D.S., V.A., I.A., E.G., J.J.J., J.A.R.-M., D.T., M.W. and M.-P.Z.; formal analysis, D.V.-M., E.G. and J.J.J.; investigation, D.V.-M.; resources, D.V.-M., A.S.-L. and V.A.; writing—original draft preparation, D.V.-M.; writing—review and editing, D.V.-M., A.S.-L., M.D.S., V.A., I.A., E.G., J.J.J., J.A.R.-M., D.T., M.W. and M.-P.Z.; supervision, D.V.-M. and A.S.-L. All authors have read and agreed to the published version of the manuscript.

Funding

This work was partially funded by Spanish Ministry of Science and Innovation, under projects SOLAUT_00046032 and PID2021-126719OB-C41. The APC was funded by PID2021-126719OB-C41. V.A., I.A., E.G., J.J.J and D.T are supported by projects ESP2014-54256-C4-3-R, ESP2016-80320-C2-1-R and RTI2018-099825-B-C31.

Data Availability Statement

The Perseverance rover data are publicly available in NASA’s Planetary Data System (PDS) (https://pds.nasa.gov/). The MEDA data are stored in the PDS atmospheres node (https://atmos.nmsu.edu/data_and_services/atmospheres_data/PERSEVERANCE/meda.html) (accessed on 18 October 2024).

Acknowledgments

The authors acknowledge and thank the Mars 2020 engineering team that has collaborated in the manufacturing, qualification and calibration of the MEDA instrument.

Conflicts of Interest

The authors declare no conflicts of interest.

References

  1. Barth, C.A.; Hord, C.W.; Stewart, A.I.; Lane, A.L. Mariner 9 ultraviolet spectrometer experiment: Initial Results. Science 1972, 175, 309–312. [Google Scholar] [CrossRef] [PubMed]
  2. Barth, C.A.; Hord, C.W.; Stewart, A.I.; Lane, A.L.; Dick, M.L.; Anderson, G.P. Mariner 9 ultraviolet spectrometer experiment: Seasonal variation of ozone on Mars. Science 1973, 179, 795–796. [Google Scholar] [CrossRef] [PubMed]
  3. Lane, A.L.; Barth, C.A.; Hord, C.W.; Stewart, A.I. Mariner 9 ultraviolet spectrometer experiment: Observations of ozone on Mars. Icarus 1973, 18, 102–108. [Google Scholar] [CrossRef]
  4. Wehrbein, W.M.; Hord, C.W.; Barth, C.A. Mariner 9 ultraviolet spectrometer experiment: Vertical distribution of ozone on Mars. Icarus 1979, 38, 188–199. [Google Scholar] [CrossRef]
  5. Krasnopolsky, V.A.; Krysko, A.A.; Rogachev, V.N. Measurement of ozone in a planetary atmosphere by space probe Mars-5. Cosm. Res. 1975, 13, 37–41. [Google Scholar]
  6. Krasnopolsky, V.A.; Parshev, V.A. Ozone and photochemistry of the Martian lower atmosphere. Planet. Space Sci. 1979, 27, 113–120. [Google Scholar] [CrossRef]
  7. Clancy, R.T.; Wolff, M.J.; Lefevre, F.; Cantor, B.A.; Malin, M.C.; Smith, M.D. Daily global mapping of Mars ozone column abundances with MARCI UV band imaging. Icarus 2016, 266, 112–133. [Google Scholar] [CrossRef]
  8. Lebonnois, S.; Quemerais EMontmessin, F.; Lefevre, F.; Perrier, S.; Bertaux, J.L.; Forget, F. Vertical distribution of ozone on Mars as measured by SPICAM/Mars express using stellar occultations. J. Geophys. Res. Planets 2006, 111, E09S05. [Google Scholar] [CrossRef]
  9. Perrier, S.; Bertaux, J.L.; Lefèvre, F.; Lebonnois, S.; Korablev, O.; Fedorova, A.; Montmessin, F. Global distribution of total ozone on Mars from SPICAM/ MEX UV measurements. J. Geophys. Res. Planets 2006, 111, E09S06. [Google Scholar] [CrossRef]
  10. Montmessin, F.; Lefèvre, F. Transport-driven formation of a polar ozone layer on Mars. Nat. Geosci. 2013, 6, 930–933. [Google Scholar] [CrossRef]
  11. Willame, Y.; Vandaele, A.C.; Depiesse, C.; Lefevre, F.; Letocart, V.; Gillotay, D.; Montmessin, F. Retrieving cloud, dust and ozone abundances in the Martian atmosphere using SPICAM/UV nadir spectra. Planet. Space Sci. 2017, 142, 9–25. [Google Scholar] [CrossRef]
  12. Patel, M.R.; Sellers, G.; Mason, J.P.; Holmes, J.A.; Brown, M.A.J.; Lewis, S.R.; Rajendran, K.; Streeter, P.M.; Marriner, C.; Hathi, B.G.; et al. ExoMars TGO/NOMAD-UVIS vertical profiles of ozone: 1. Seasonal variation and comparison to water. J. Geophys. Res. Planets 2021, 126, e2021JE006837. [Google Scholar] [CrossRef]
  13. Khayat, A.S.; Smith, M.D.; Wolff, M.; Daerden, F.; Neary, L.; Patel, M.R.; Piccialli, A.; Vandaele, A.C.; Thomas, I.; Ristic, B.; et al. ExoMars TGO/NOMADUVIS vertical profiles of ozone: 2. The high-altitude layers of atmospheric ozone. J. Geophys. Res. Planets 2021, 126, e2021JE006834. [Google Scholar] [CrossRef]
  14. Olsen, K.S.; Lefèvre, F.; Montmessin, F.; Trokhimovskiy, A.; Baggio, L.; Fedorova, A.; Alday, J.; Lomakin, A.; Belyaev, D.A.; Patrakeev, A.; et al. First detection of ozone in the mid-infrarred at Mars: Implications for methane detection. Astron. Astrophys. 2020, 639, A141. [Google Scholar] [CrossRef]
  15. Espenak, F.; Mumma, M.J.; Kostiuk, T.; Zipoy, D. Ground-based infrared measurements of the global distribution of ozone in the atmosphere of Mars. Icarus 1991, 92, 252–262. [Google Scholar] [CrossRef]
  16. Fast, K.; Kostiuk, T.; Espenak, F.; Annen, J.; Buhl, D.; Hewagama, T.; A’Hearn, M.F.; Zipoy, D.; Livengood, T.A.; Sonnabend, G.; et al. Ozone abundance on Mars from infrared heterodyne spectra I. Acquisition, retrieval, and anticorrelation with water vapor. Icarus 2006, 181, 419–431. [Google Scholar] [CrossRef]
  17. Clancy, R.T.; Wolff MJ James, P.B.; Smith, E.; Billawala, Y.N.; Lee, S.W.; Callan, M. Mars ozone measurements near the 1995 aphelion: Hubble space telescope ultraviolet spectroscopy with the faint object spectrograph. J. Geophys. Res. Planets 1996, 101, 12777–12783. [Google Scholar] [CrossRef]
  18. Clancy, R.T.; Wolff, M.J.; James, P.B. Minimal aerosol loading and global increases in atmospheric ozone during the 1996–1997 Martian northern spring season. Icarus 1999, 138, 49–63. [Google Scholar] [CrossRef]
  19. Viúdez-Moreiras, D.; Saiz-Lopez, A.; Blaszczak-Boxe, C.; Rodriguez-Manfredi, J.A.; Yung, Y. Diurnal Variation in Mars Equatorial Odd Oxygen Species: Chemical Production and Loss Mechanisms. Icarus 2020, 336, 113458. [Google Scholar] [CrossRef]
  20. Nair, H.; Allen, M.; Anbar, A.D.; Yung, Y.L.; Clancy, T. A photochemical model of the Martian atmosphere. Icarus 1994, 111, 124–150. [Google Scholar] [CrossRef]
  21. Lindner, B.L. In Situ Mars Ozone Detector. Acta Astronaut. 1995, 35, 137–144. [Google Scholar] [CrossRef]
  22. Rodriguez-Manfredi, J.A.; De la Torre Juárez, M.; Alonso, A.; Apéstigue, V.; Arruego, I.; Atienza, T.; Banfield, D.; Boland, J.; Carrera, M.A.; Castañer, L.; et al. The Mars Environmental Dynamics Analyzer, MEDA. A Suite of Environmental Sensors for the Mars 2020 Mission. Space Sci. Rev. 2021, 217, 48. [Google Scholar] [CrossRef] [PubMed]
  23. Apestigue, V.; Gonzalo, A.; Jiménez, J.J.; Boland, J.; Lemmon, M.; de Mingo, J.R.; García-Menendez, E.; Rivas, J.; Azcue, J.; Bastide, L.; et al. Radiation and Dust Sensor for Mars Environmental Dynamic Analyzer Onboard M2020 Rover. Sensors 2022, 22, 2907. [Google Scholar] [CrossRef] [PubMed]
  24. Dobson, G.M.B.; Harrison, D.N. Measurements of the Amount of Ozone in the Earth’s Atmosphere and its Relation to the Other Geophysical Conditions. Proc. R. Soc. Lond. A 1926, 110, 660–693. [Google Scholar] [CrossRef]
  25. Stamnes, K.; Slusser, J.; Bowen, M. Derivation of total ozone abundance and cloud effects from spectral irradiance measurements. Appl. Opt. 1991, 30, 4418–4426. [Google Scholar] [CrossRef] [PubMed]
  26. Høiskar, B.A.K.; Haugen, R.; Danielsen, T.; Kylling, A.; Edvardsen, K.; Dahlback, A.; Johnsen, B.; Blumthaler, M.; Schreder, J. Multichannel moderate-bandwidth filter instrument for measurement of the ozone-column amount, cloud transmittance, and ultraviolet dose rates. Appl. Opt. 2003, 42, 3472–3479. [Google Scholar] [CrossRef]
  27. Bernhard, G.; Rockwell, C.; Ehramjian, J. Real-time ultraviolet and column ozone from multichannel ultraviolet radiometers deployed in the National Science Foundation’s ultraviolet monitoring network. Opt. Eng. 2005, 44, 041011. [Google Scholar] [CrossRef]
  28. Raptis, P.I.; Kazadzis, S.; Eleftheratos, K.; Kosmopoulos, P.; Amiridis, V.; Helmis, C.; Zerefos, C. Total ozone column measurements using an ultraviolet multi-filter radiometer. Int. J. Remote Sens. 2015, 36, 4469–4482. [Google Scholar] [CrossRef]
  29. Lefèvre, F.; Lebonnois, S.; Montmessin, F.; Forget, F. Three-dimensional modeling of ozone on Mars. J. Geophys. Res. Planets 2004, 109, E07004. [Google Scholar] [CrossRef]
  30. Braude, A.S.; Montmessin, F.; Olsen, K.S.; Trokhimovskiy, A.; Korablev, O.I.; Lefèvre, F.; Fedorova, A.A.; Alday, J.; Baggio, L.; Irbah, A.; et al. No detection of SO2, H2S, or OCS in the atmosphere of Mars from the first two Martian years of observations from TGO/ACS. Astron. Astrophys. 2021, 658, A86. [Google Scholar] [CrossRef]
  31. Ryan, J.A.; Sharman, R.D. Two Major Dust Storms, One Mars Year Apart: Comparison from Viking Data. J. Geophys. Res. Planets 1981, 86, 3247–3254. [Google Scholar] [CrossRef]
  32. Lemmon, M.T.; Wolff, M.J.; Bell, J.F., III; Smith, M.D.; Cantor, B.A.; Smith, P.H. Dust aerosols, clouds, and the atmospheric optical depth record over 5 Mars years of the Mars Exploration Rover mission. Icarus 2015, 251, 96–111. [Google Scholar] [CrossRef]
  33. Smith, M.D.; Zorzano, M.P.; Lemmon, M.; Martín-Torres, J.; Mendaza de Cal, T. Aerosol optical depth as observed by the Mars Science Laboratory REMS UV photodiodes. Icarus 2016, 280, 234–248. [Google Scholar] [CrossRef]
  34. Viúdez-Moreiras, D. The Ultraviolet Radiation Environment and Shielding in Pit Craters and Cave Skylights on Mars. Icarus 2021, 370, 114658. [Google Scholar] [CrossRef]
  35. Serdyuchenko, A.; Gorshelev, V.; Weber, M.; Chehade, W.; Burrows, J.P. High spectral resolution ozone absorption cross-sections—Part 2: Temperature dependence. Atmos. Meas. Tech. 2014, 7, 625–636. [Google Scholar] [CrossRef]
  36. Arruego, I.; Apéstigue, V.; Jiménez-Martín, J.; Martínez-Oter, J.; Álvarez-Ríos, F.J.; González-Guerrero, M.; Rivas, J.; Azcue, J.; Martín, I.; Toledo, D.; et al. DREAM-SIS: The solar irradiance sensor on-board the ExoMars 2016 lander. Adv. Space Res. 2017, 60, 103–120. [Google Scholar] [CrossRef]
  37. Gómez-Elvira, J.; Armiens, C.; Castañer, L.; Domínguez, M.; Genzer, M.; Gómez, F.; Haberle, R.; Harri, A.M.; Jiménez, V.; Kahanpää, H.; et al. REMS: The environmental sensor suite for the Mars Science Laboratory rover. Space Sci. Rev. 2012, 170, 583–640. [Google Scholar] [CrossRef]
  38. Bell, J.F., III; Maki, J.N.; Alwmark, S.; Ehlmann, B.L.; Fagents, S.A.; Grotzinger, J.P.; Gupta, S.; Hayes, A.; Herkenhoff, K.E.; Horgan, B.H.; et al. Geological and Meteorological Imaging Results from the Mars 2020 Perseverance Rover in Jezero Crater. Sci. Adv. 2022, 8, eabo4856. [Google Scholar] [CrossRef]
  39. Jiménez, J.J.; Álvarez, F.J.; Gonzalez-Guerrero, M.; Apestigue, V.; Martín, I.; Fernandez, J.M.; Fernán, A.A.; Arruego, I. Calibration OGSEs for multichannel radiometers for Mars atmospheric studies. CEAS Space J. 2018, 10, 127–145. [Google Scholar] [CrossRef]
  40. Vicente-Retortillo, A.; Lemmon, M.T.; Martinez, G.M.; Toledo, D.; Apéstigue, V.; Arruego, I.; Bertrand, T.; Lorenz, R.; Sebastián, E.; Hueso, R.; et al. Dust accumulation and lifting at the landing site of the M2020 mission, jezero crater, as observed by MEDA. Geophys. Res. Lett. 2024, 51, e2023GL107975. [Google Scholar] [CrossRef]
  41. Viúdez-Moreiras, D.; Newman, C.E.; De la Torre, M.; Martínez, G.; Guzewich, S.; Lemmon, M.; Pla-García, J.; Smith, M.D.; Harri, A.M.; Genzer, M.; et al. Effects of the MY34/2018 Global Dust Storm as Measured by MSL REMS in Gale Crater. J. Geophys. Res. Planets 2019, 124, 1899–1912. [Google Scholar] [CrossRef] [PubMed]
  42. Lemmon, M.T.; Smith, M.D.; Viudez-Moreiras, D.; de la Torre-Juarez, M.; Vicente-Retortillo, A.; Munguira, A.; Sanchez-Lavega, A.; Hueso, R.; Martinez, G.; Chide, B.; et al. Dust, sand, and winds within an active Martian storm in Jezero crater. Geophys. Res. Lett. 2022, 49, e2022GL100126. [Google Scholar] [CrossRef] [PubMed]
  43. Smith, M.D.; Wolff, M.J.; Lemmon, M.T.; Spanovich, N.; Banfield, D.; Budney, C.J.; Clancy, R.T.; Ghosh, A.; Landis, G.A.; Smith, P.; et al. First atmospheric science results from the Mars Exploration Rovers Mini-TES. Science 2004, 306, 1750–1753. [Google Scholar] [CrossRef]
  44. Wolff, M.J.; Clancy, R.T.; Goguen, J.D.; Malin, M.C.; Cantor, B.A. Ultraviolet dust aerosol properties as observed by MARCI. Icarus 2010, 208, 143–155. [Google Scholar] [CrossRef]
  45. Stamnes, K.; Tsay, S.-C.; Wiscombe, W.; Jayaweera, K. Numerically stable algorithm for discrete-ordinate-method radiative transfer in multiple scattering and emitting layered media. Appl. Opt. 1988, 27, 2502–2509. [Google Scholar] [CrossRef]
  46. Goody, R.M.; Yung, Y.L. Atmospheric Radiation: Theoretical Basis; Oxford University Press: New York, NY, USA, 1989. [Google Scholar]
  47. Spurr, R.J. Simultaneous derivation of intensities and weighting functions in a general pseudo-spherical discrete ordinate radiative transfer treatment. J. Quant. Spectrosc. Radiat. Transf. 2002, 75, 129–175. [Google Scholar] [CrossRef]
  48. Forget, F.; Hourdin, F.; Fournier, R.; Hourdin, C.; Talagrand, O.; Collins, M.; Lewis, S.R.; Read, P.L.; Huot, J.P. Improved general circulation models of the Martian atmosphere from the surface to above 80 km. J. Geophys. Res. Planets 1999, 104, 24155–24175. [Google Scholar] [CrossRef]
  49. Mishchenko, M.I.; Travis, L.D.; Kahn, R.A.; West, R.A. Modeling phase functions for dust-like tropospheric aerosols using a shape mixture of randomly oriented polydisperse spheroids. J. Geophys. Res. Planets 1997, 102, 16831–16847. [Google Scholar] [CrossRef]
  50. Wolff, M.J.; Smith, M.D.; Clancy, R.T.; Arvidson, R.; Kahre, M.; Seelos, F.; Murchie, S.; Savijärvi, H. Wavelength dependence of dust aerosol single scattering albedo as observed by the Compact Reconnaissance Imaging Spectrometer. J. Geophys. Res. Planets 2009, 114, E00D04. [Google Scholar] [CrossRef]
  51. Smith, M.D.; Martínez, G.M.; Sebastián, E.; Lemmon, M.T.; Wolff, M.J.; Apéstigue, V.; Arruego, I.; Toledo, D.; Viúdez-Moreiras, D.; Rodriguez-Manfredi, J.A.; et al. Diurnal and seasonal variations of aerosol optical depth observed by MEDA/TIRS at Jezero crater, Mars. J. Geophys. Res. Planets 2023, 128, e2022JE007560. [Google Scholar] [CrossRef]
  52. Platt, U.; Stutz, J. Differential Optical Absorption Spectroscopy: Principles and Applications. Physics of Earth and Space Environments; Springer: Berlin/Heidelberg, Germany, 2008. [Google Scholar]
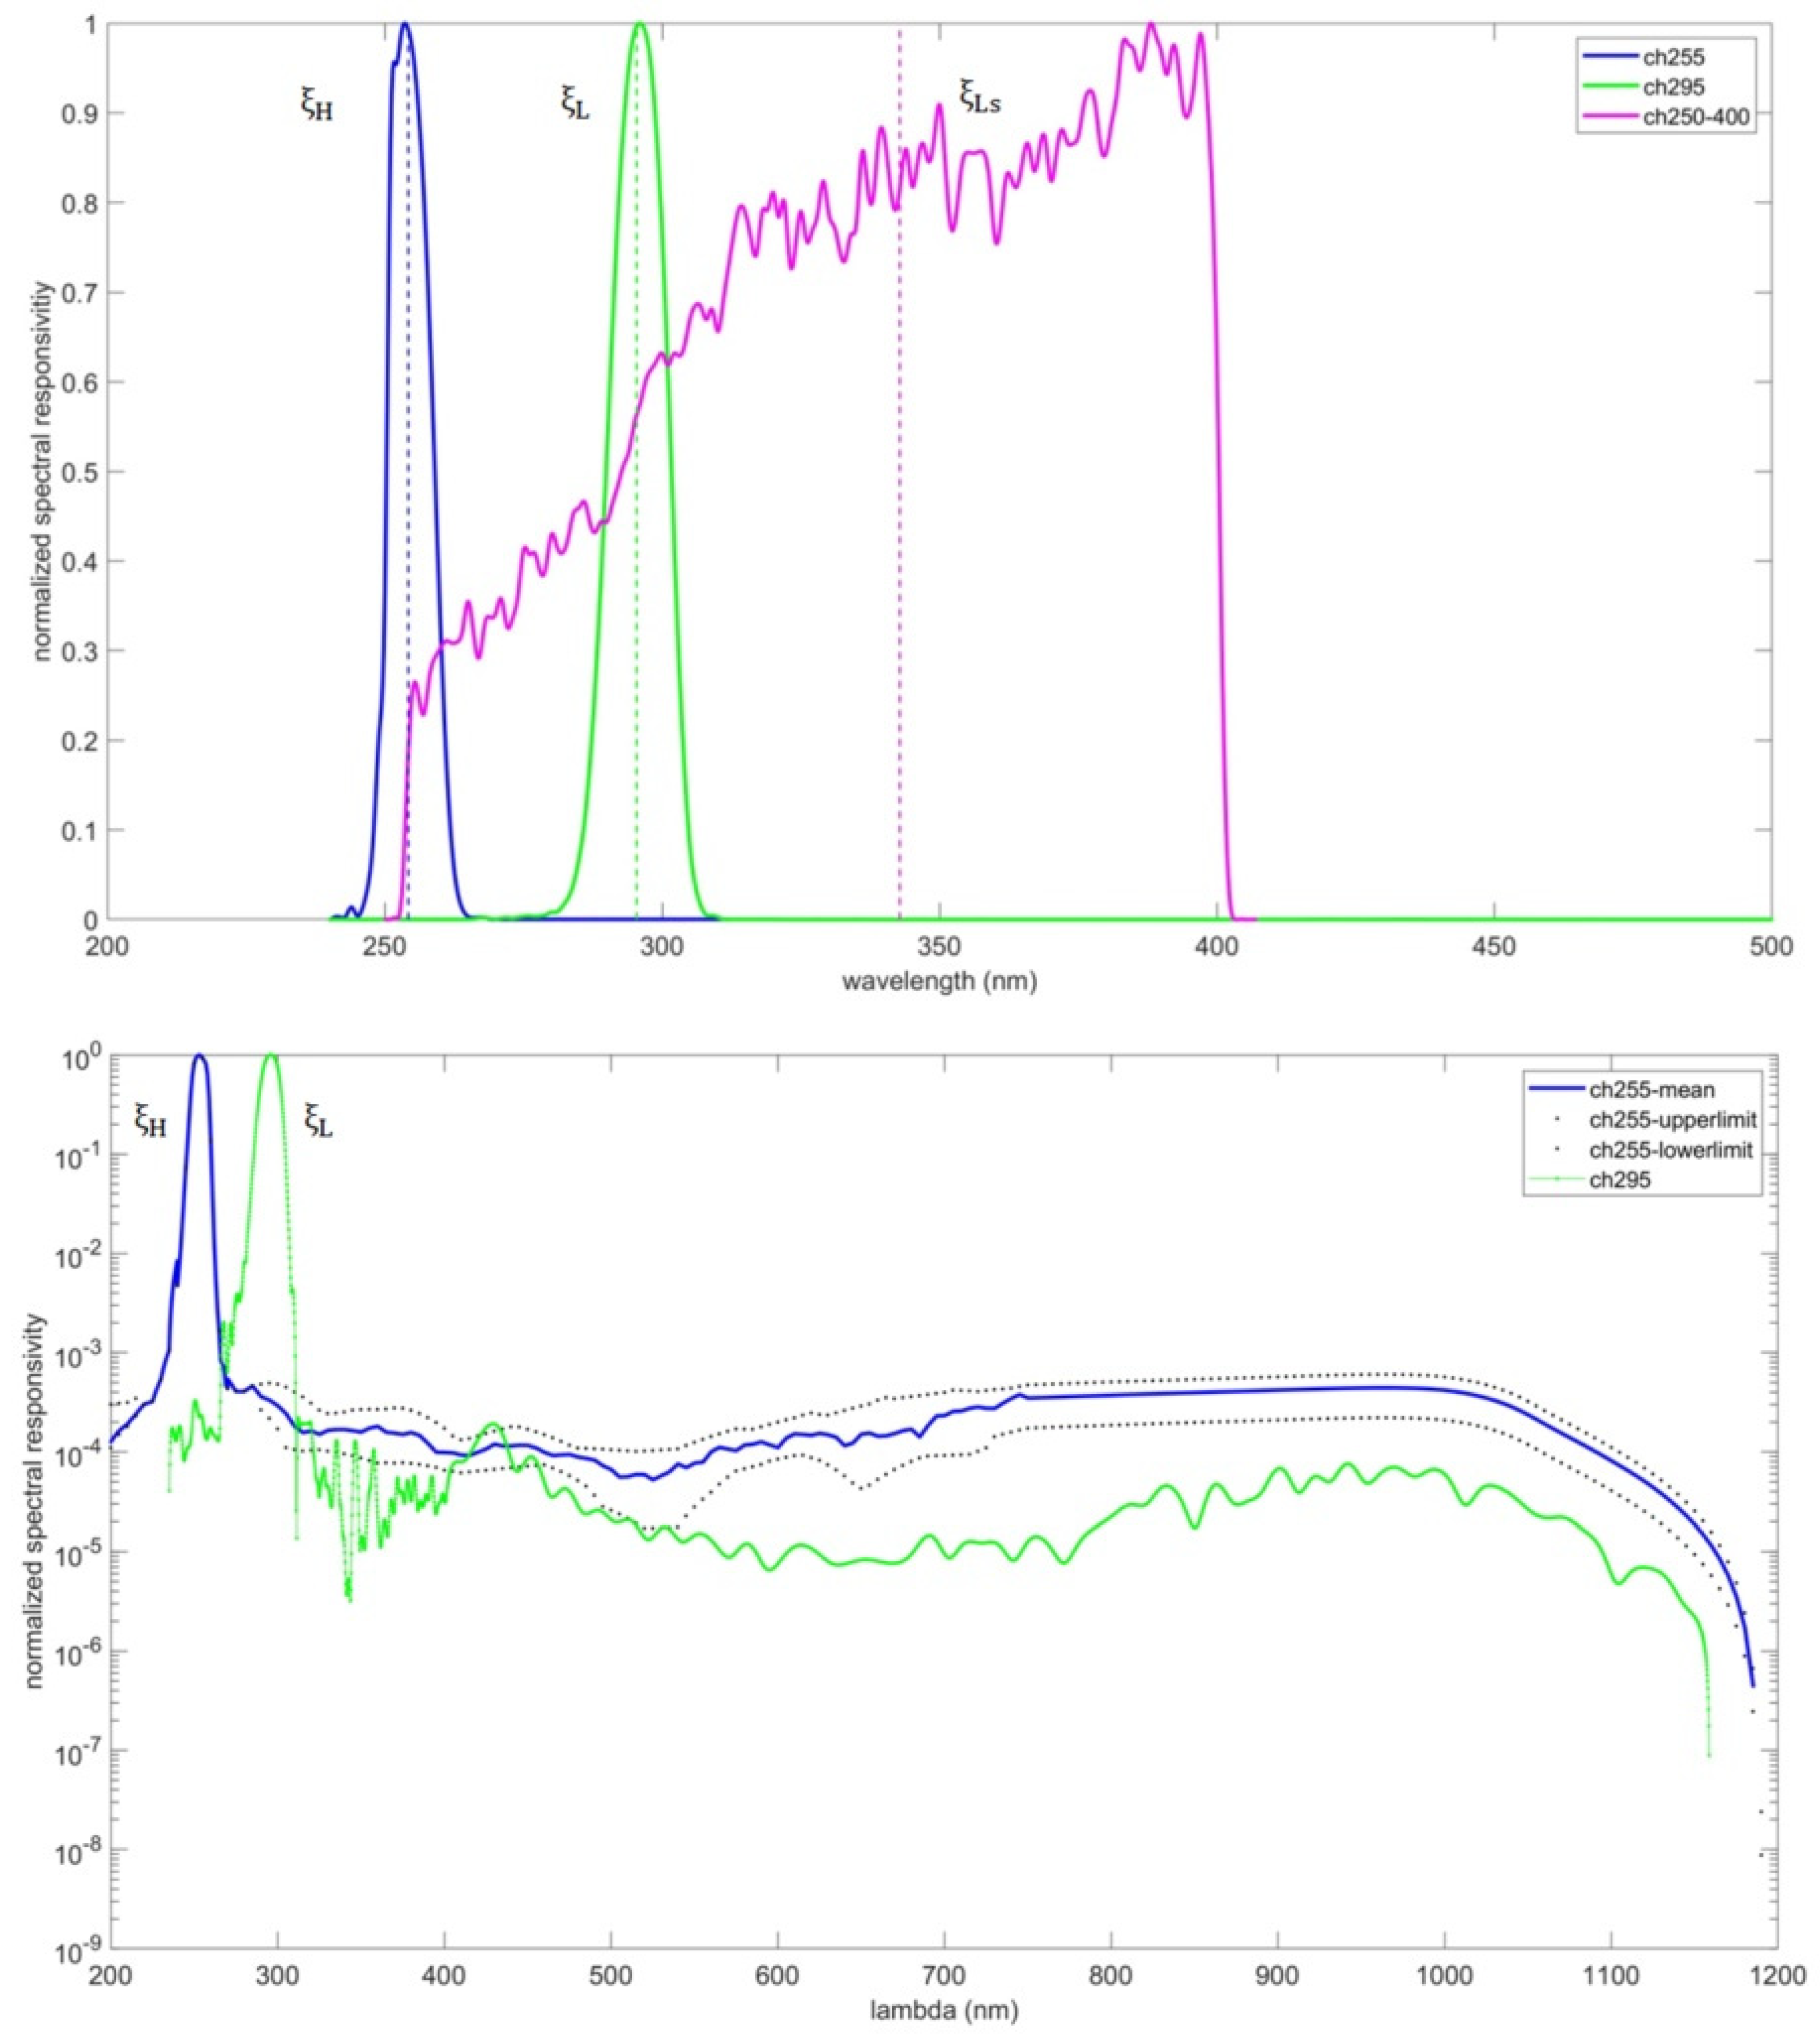
Figure 2. (top) Normalized spectral responsivity for the three MEDA RDS UV channels used in the ozone retrieval ( ξ H /ch255, ξ L /ch295, and ξ L s /ch250–400). (bottom) Spectral responsivity, on a logarithmic scale, for ξ H /ch255 and ξ L /ch295, showing the straylight at visible/infrared wavelengths. The level of straylight is low but significantly affects the ξ H /ch255 and ξ L /ch295 irradiance signals, given both the narrow pass bands in the UV in both channels and the solar spectrum shape. The spectral broadband used in ξ L s /ch250–400 implies a mostly negligible effect of straylight in that channel and is not shown. The ξ H /ch255 filter characterization implied some uncertainty in the straylight levels (represented as upper and lower limits in dotted lines). Elevated noise was measured from 800 nm, showing the mean value convolved with the silicon responsivity.
Remotesensing 16 03914 g002
Figure 3. (A) NASA’s Mars 2020 Perseverance during the Entry, Descent, and Landing (EDL) phase. The ozone detector is located on the rover deck. (B) Image acquired by the rover’s camera once deployed on Mars. The ozone detector (blue circle) is integrated in the RDS, as part of the MEDA instrument. The ξ H , ξ L , and ξ L s bands are highlighted in the figure, along with the auxiliary channels ξ d and ξ a (Section 2.3), used to compensate for the dust deposition on the ozone channels and to infer the aerosol loading in the atmosphere, respectively; these quantities are necessary for the ozone retrieval algorithm. Image Credit: NASA/JPL-Caltech/ASU.
Remotesensing 16 03914 g003
Figure 4. Zenith-sky viewing geometry for atmospheric observations from the Martian surface.
Remotesensing 16 03914 g004
Figure 5. Calibration of the flight model (FM) at SPASOLAB (INTA). (left) ARF calibration in a dark room, where the RDS was installed in a robotic platform allowing azimuthal and zenithal rotations related to the incident light from a xenon lamp located at 4.5 m above the RDS FM unit; (right) TRF calibration, where the RDS was located in the LT/HT thermal chamber.
Remotesensing 16 03914 g005
Figure 6. Retrieved (azimuthally averaged) angular response function (ARF) of the UV channels obtained post-landing (the laboratory ARF considering dust in black line and the adjusted with empirical data acquired on Mars in color lines), showing an increase of orders of magnitude in the responsivity related to the pre-landing calibrations at high zenith angles. The remaining channels of the RDS with the same FoV (Table 1 and Table 2) present a similar performance.
Remotesensing 16 03914 g006
Figure 7. Deviation in the retrieved ozone column abundance from the actual values present in the simulated atmosphere, as a function of the prescribed partitioning in the ozone vertical profile. The entire range of possible ozone vertical distributions was tested, even including extreme cases (0: all ozone was located in the upper troposphere, 1: ozone was fully located in the lower troposphere). The prescribed partitioning (0.90, green line) was based on the vertical profile obtained by the JPL/Caltech KINETICS photochemical model as presented in [19]. Under low SZAs (right panel), the effect is negligible with a deviation less than 1% of the true VCD in the atmosphere. (left panel) Under medium-to-high SZAs, the retrieval is somewhat sensitive to the vertical profile, and the effect increases, producing a bias in the ozone VCD as far as 16%, in the extreme and improbable case of ozone being fully located in the upper troposphere of Mars.
Remotesensing 16 03914 g007
Figure 8. Ozone retrievals for mid–high SZAs (t1 interval, left column) and for low SZAs (t2 interval, right column), considering ±5% and ±10% errors in measured ratio ψ , roughly related to 1σ and 2σ uncertainties of ψ (mainly derived by the absolute calibration of the detector), respectively.
Remotesensing 16 03914 g008
Figure 9. As in Figure 8, but retrieving ozone abundances considering discrepancies in the aerosol loading and properties used in the retrieval algorithm with respect to those used to simulate the channel measurements. The first two rows consider pure dust aerosol simulations. Two dust loadings were simulated, τ a = 0.3 (top row) and τ a = 0.7 (mid row), which are representative of the nominal aerosol present in tropical latitudes on Mars outside dust storms. τ a ± 0.0 (ideal case), ±0.1, and ±0.2 have been used in the retrieval for each dust loading. (bottom rows) Simulations with aerosol opacity equal to 0.3 (dust opacity = 0.2), also including 0.0 of water ice (dust opacity = 0.3, blue color) and 0.2 of water ice (dust opacity = 0.1, green color), where the retrieval algorithm has a fixed τ a = 0.3 of aerosol (0.1 of ice clouds), i.e., without knowledge of ±0.1 ice clouds present in the simulated atmosphere. Two scenarios with and without straylight in the ozone channels were considered (see text).
Remotesensing 16 03914 g009
Figure 10. As in Figure 9, but using ξ L s in the ratio ψ instead of ξ L .
Remotesensing 16 03914 g010
Figure 11. As in Figure 8, but applying the ozone retrieval algorithm to the REMS UV sensor. Ozone uncertainties are larger in the MSL for detector uncertainties similar to the ones in Mars 2020 due to the sensitivity of the REMS UV spectral broadbands in the ratio ψ (UVC and UVB).
Remotesensing 16 03914 g011
Table 1. Mars 2020 MEDA RDS UV channels encompassing the ozone detector. ch255/ ξ H and ch295/ ξ L are the ozone channels, and ch250–400/ ξ L s is also used in the ozone retrieval process as a reference signal without significant ozone absorption. Elevation of each top channel is 90° in all cases.
ChannelWavelength Range (nm)FoV (deg)Dynamic Range (W/m2)Precision (W/m2)Previous Accuracy (%, 2σ)Revised Accuracy (%, 2σ)
ch255/ ξ H 255 ± 5 nm±150.1846.30·10−5 (1)±12±9.5 (2)
ch295/ ξ L 295 ± 5 nm±151.1952.25·10−4 (1)±5.5±5.5
ch250–400/ ξ L s 250–400 nm±1590.15.66·10−3±6.7±5.4
(1) These channels present non-linearities when the signal is of the order of 10−3 and below (generally corresponding to high SZAs) due to higher signal amplification; (2) The ch255/ ξ H channel presents another significant source of uncertainty related to inaccuracies in the characterization of the spectral transmittance in the blocking of the filter, increasing its uncertainty but treated independently of the absolute calibration.
Table 2. Mars 2020 MEDA RDS channels related to the aerosol retrieval algorithm and to the estimation of the ozone detector degradation. ξ d and ξ a are used to compensate for the dust deposition on the ozone detector and to infer the aerosol loading in the atmosphere, necessary for the ozone retrieval algorithm. Elevation of each top channel is 90° in all cases.
ChannelWavelength Range (nm)FoV (deg)Dynamic Range (W/m2)Precision (W/m2)Previous Accuracy (%, 2σ)Revised Accuracy (%, 2σ)
ch450450 ± 40 nm±151248.25·10−3±4.4±4.5
ch650650 ± 25 nm±15594.58·10−3±4.4±4.5
ch750750 ± 10 nm±15181.69·10−3±4.5±4.5
ch950/ ξ a 950 ± 50 nm±15642.21·10−2±6.5±6.5
ch190–1100/ ξ d 190–1100 nm±903586.13·10−3±5.6±5.3
Table 3. Detector degradation in the top channels (upward-viewing geometry) at landing, at zero zenith angle (normal incidence of the direct solar beam), normalized to ch750. The degradation in ch255/ ξ H was assumed to be similar to that in ch295/ ξ H (see text).
ChannelWavelength Range (nm) D A F c h   n o r m t = 0
ch255/ ξ H 255 ± 5 nm0.95
ch295/ ξ L 295 ± 5 nm0.95
ch250–400/ ξ L s 250–400 nm0.95
ch450450 ± 40 nm0.96
ch650650 ± 25 nm0.99
ch750750 ± 10 nm1.00
ch950/ ξ a 950 ± 50 nm0.99
Disclaimer/Publisher’s Note: The statements, opinions and data contained in all publications are solely those of the individual author(s) and contributor(s) and not of MDPI and/or the editor(s). MDPI and/or the editor(s) disclaim responsibility for any injury to people or property resulting from any ideas, methods, instructions or products referred to in the content.