
Using Adjoint-Based Forecast Sensitivity to Observation to Evaluate a Wind Profiler Data Assimilation Strategy and the Impact of Data on Short-Term Forecasts


Abstract
1. Introduction
2. Materials and Methods
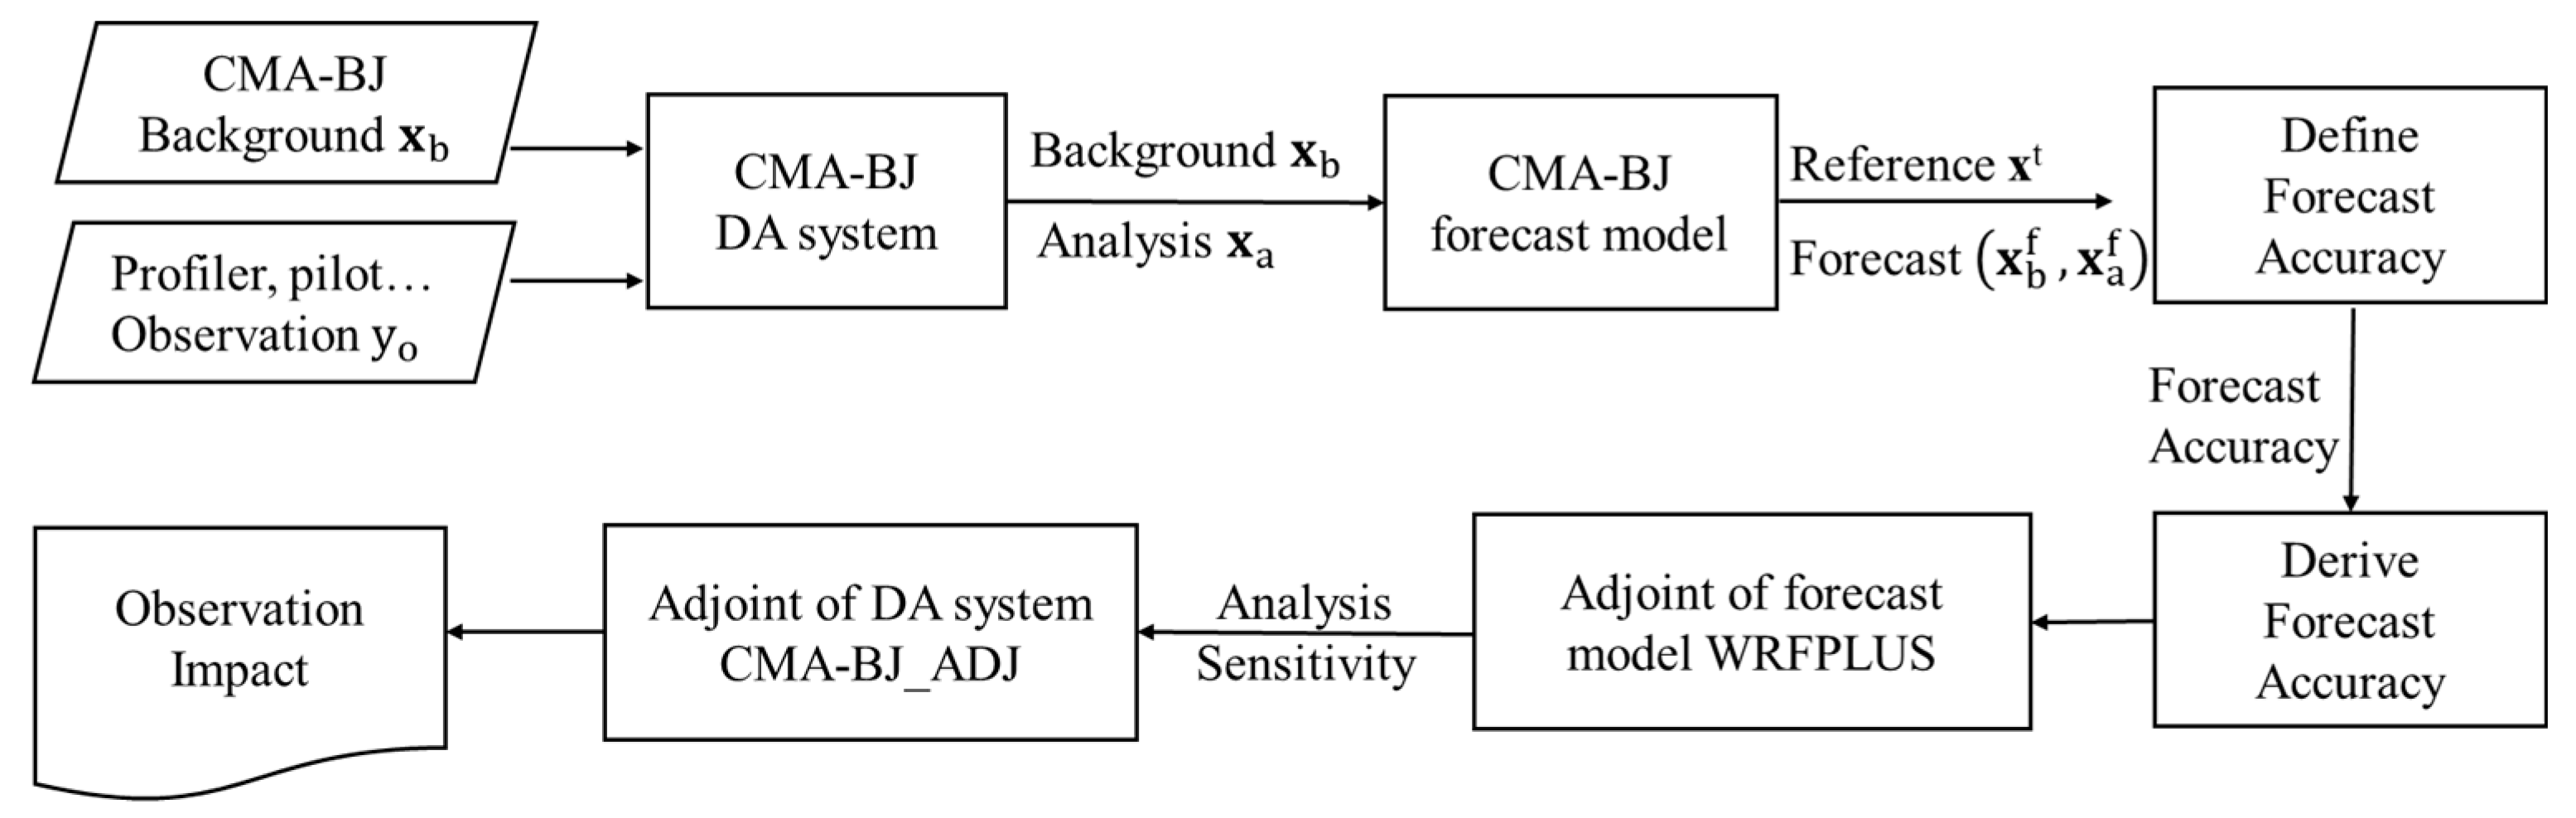
2.1. Adjoint-Based Forecast Sensitivity to Observation (FSO)
2.2. Wind Profiler Radar Data Assimilation Strategy
- (1)
- Momentum control variable
- (2)
- Wind observation operator
- (3)
- Profiler observation errors
3. Experimental Frameworks
3.1. Model
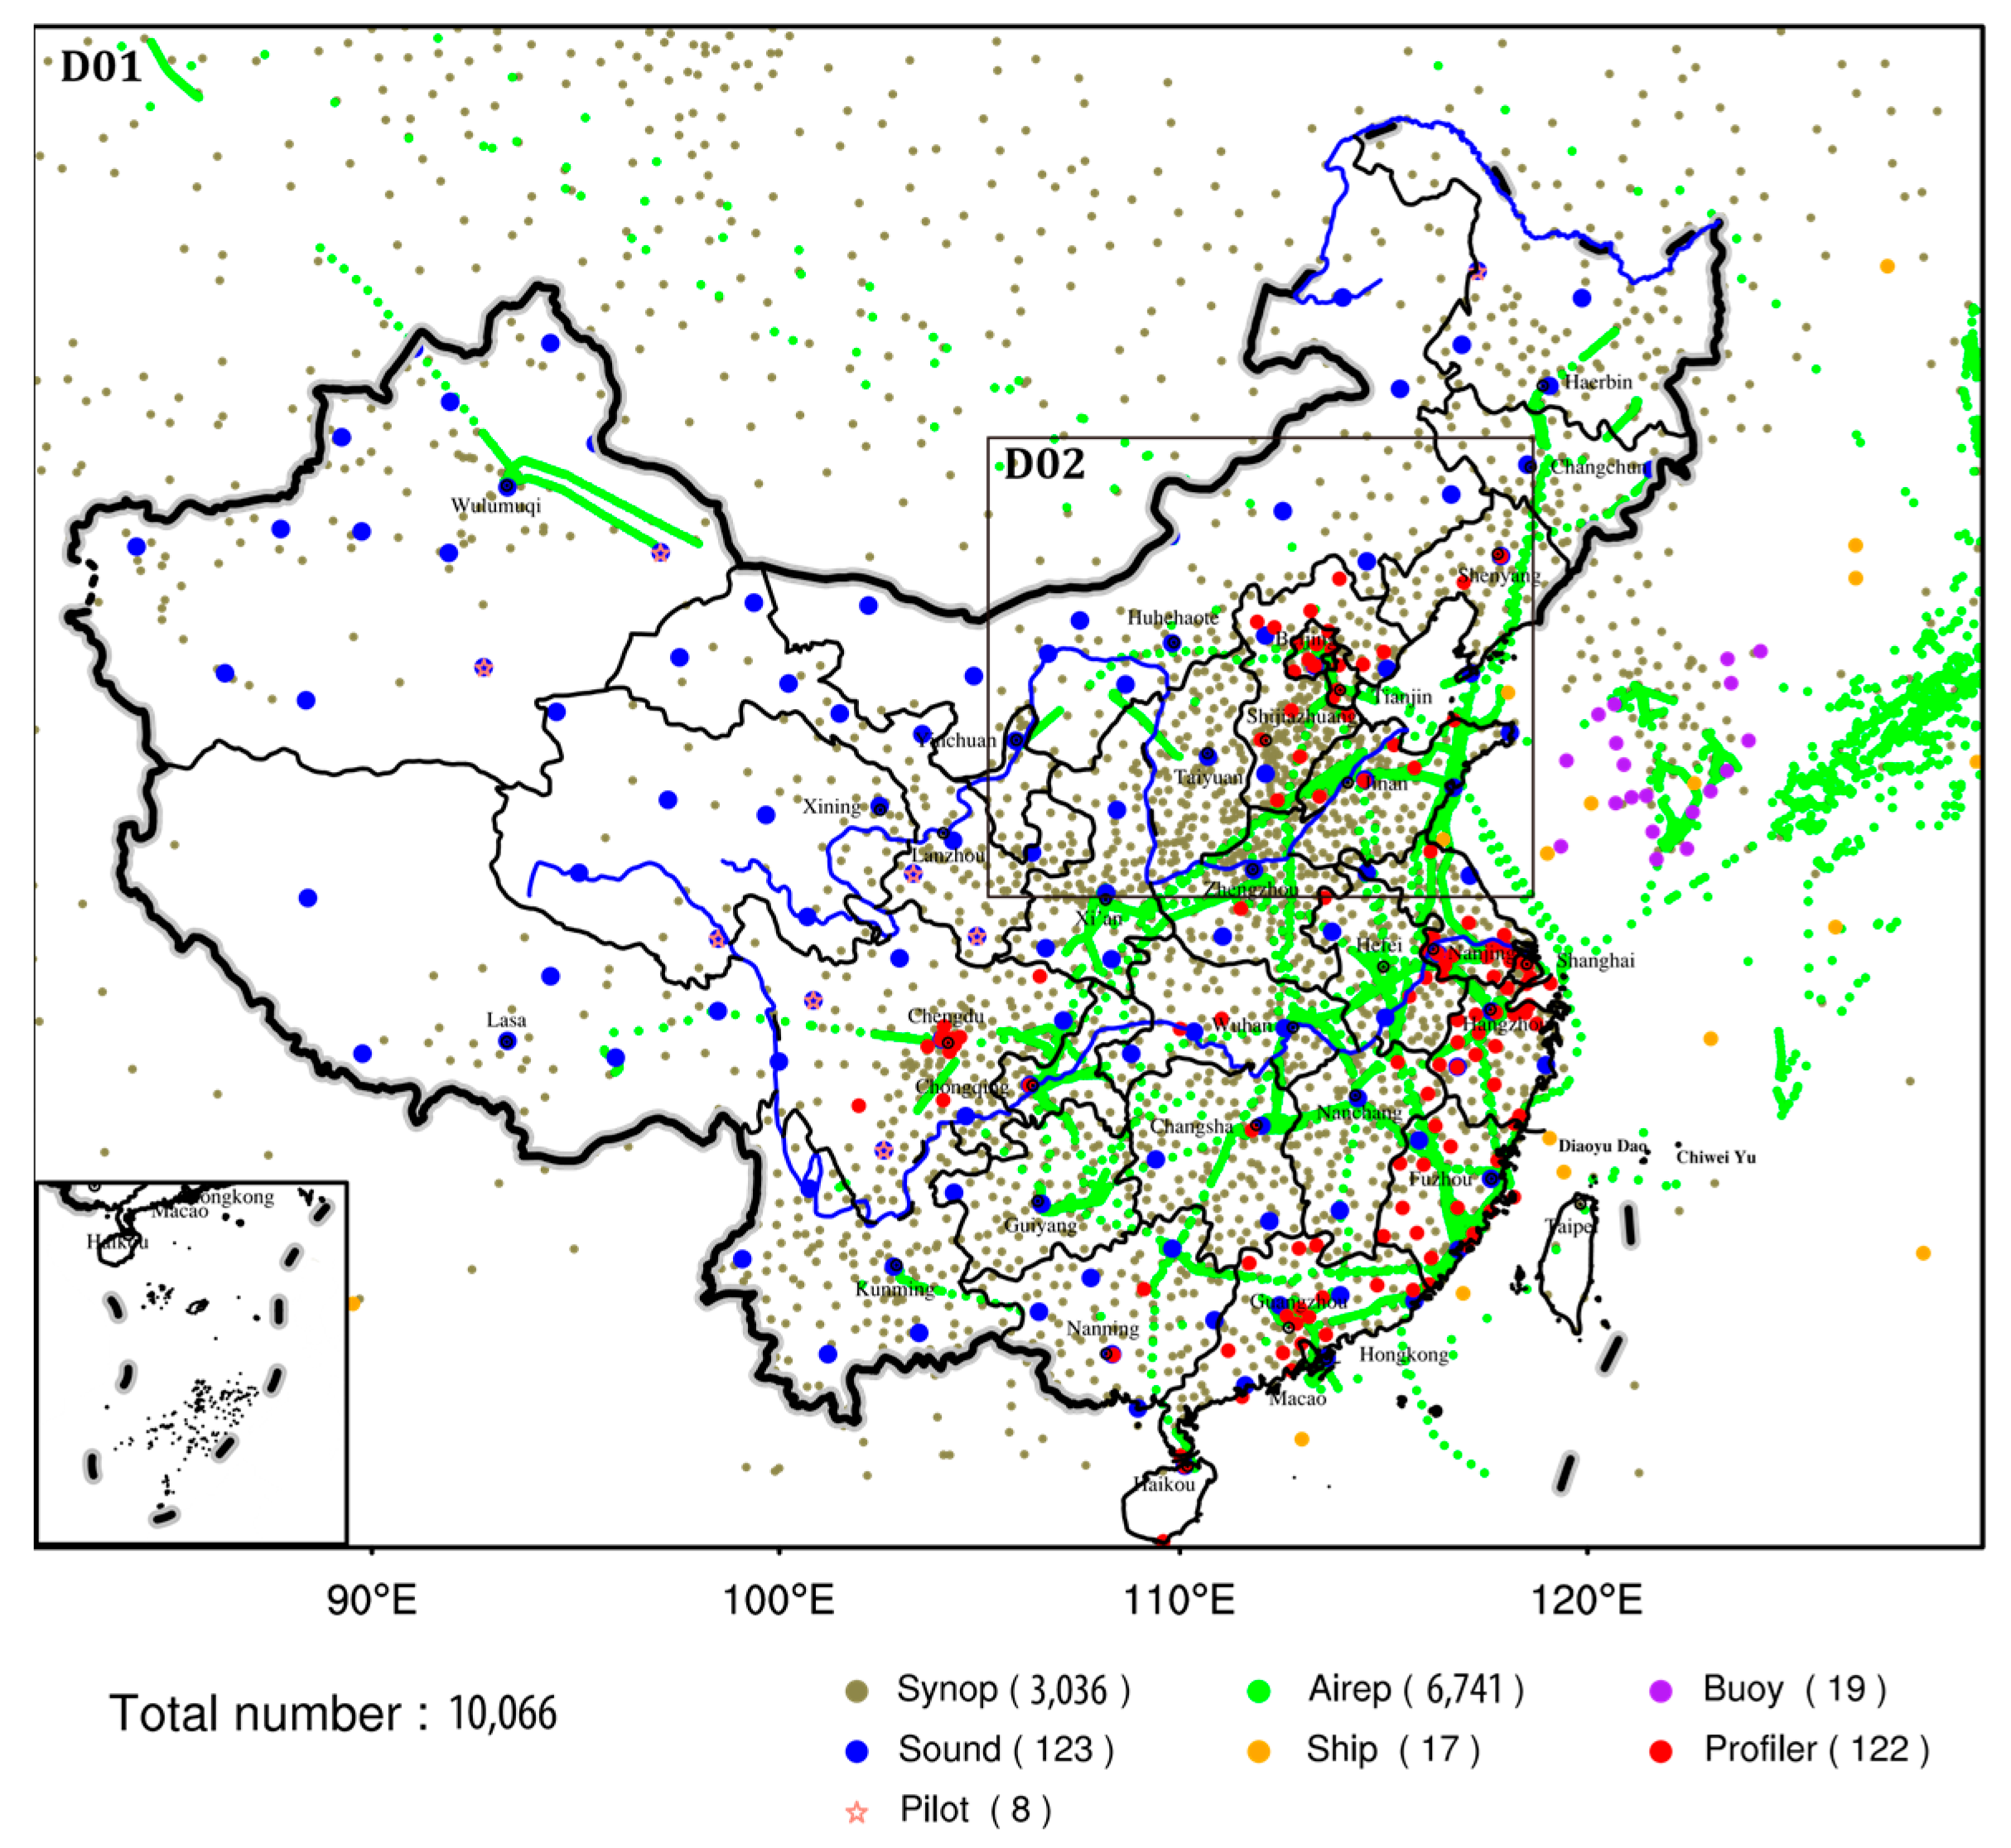
3.2. Observation
4. Forecast Sensitivity to Wind Profiler Assimilation Strategies
4.1. Experimental Setup
4.2. Observation Impact of Winds and Profiler Observations
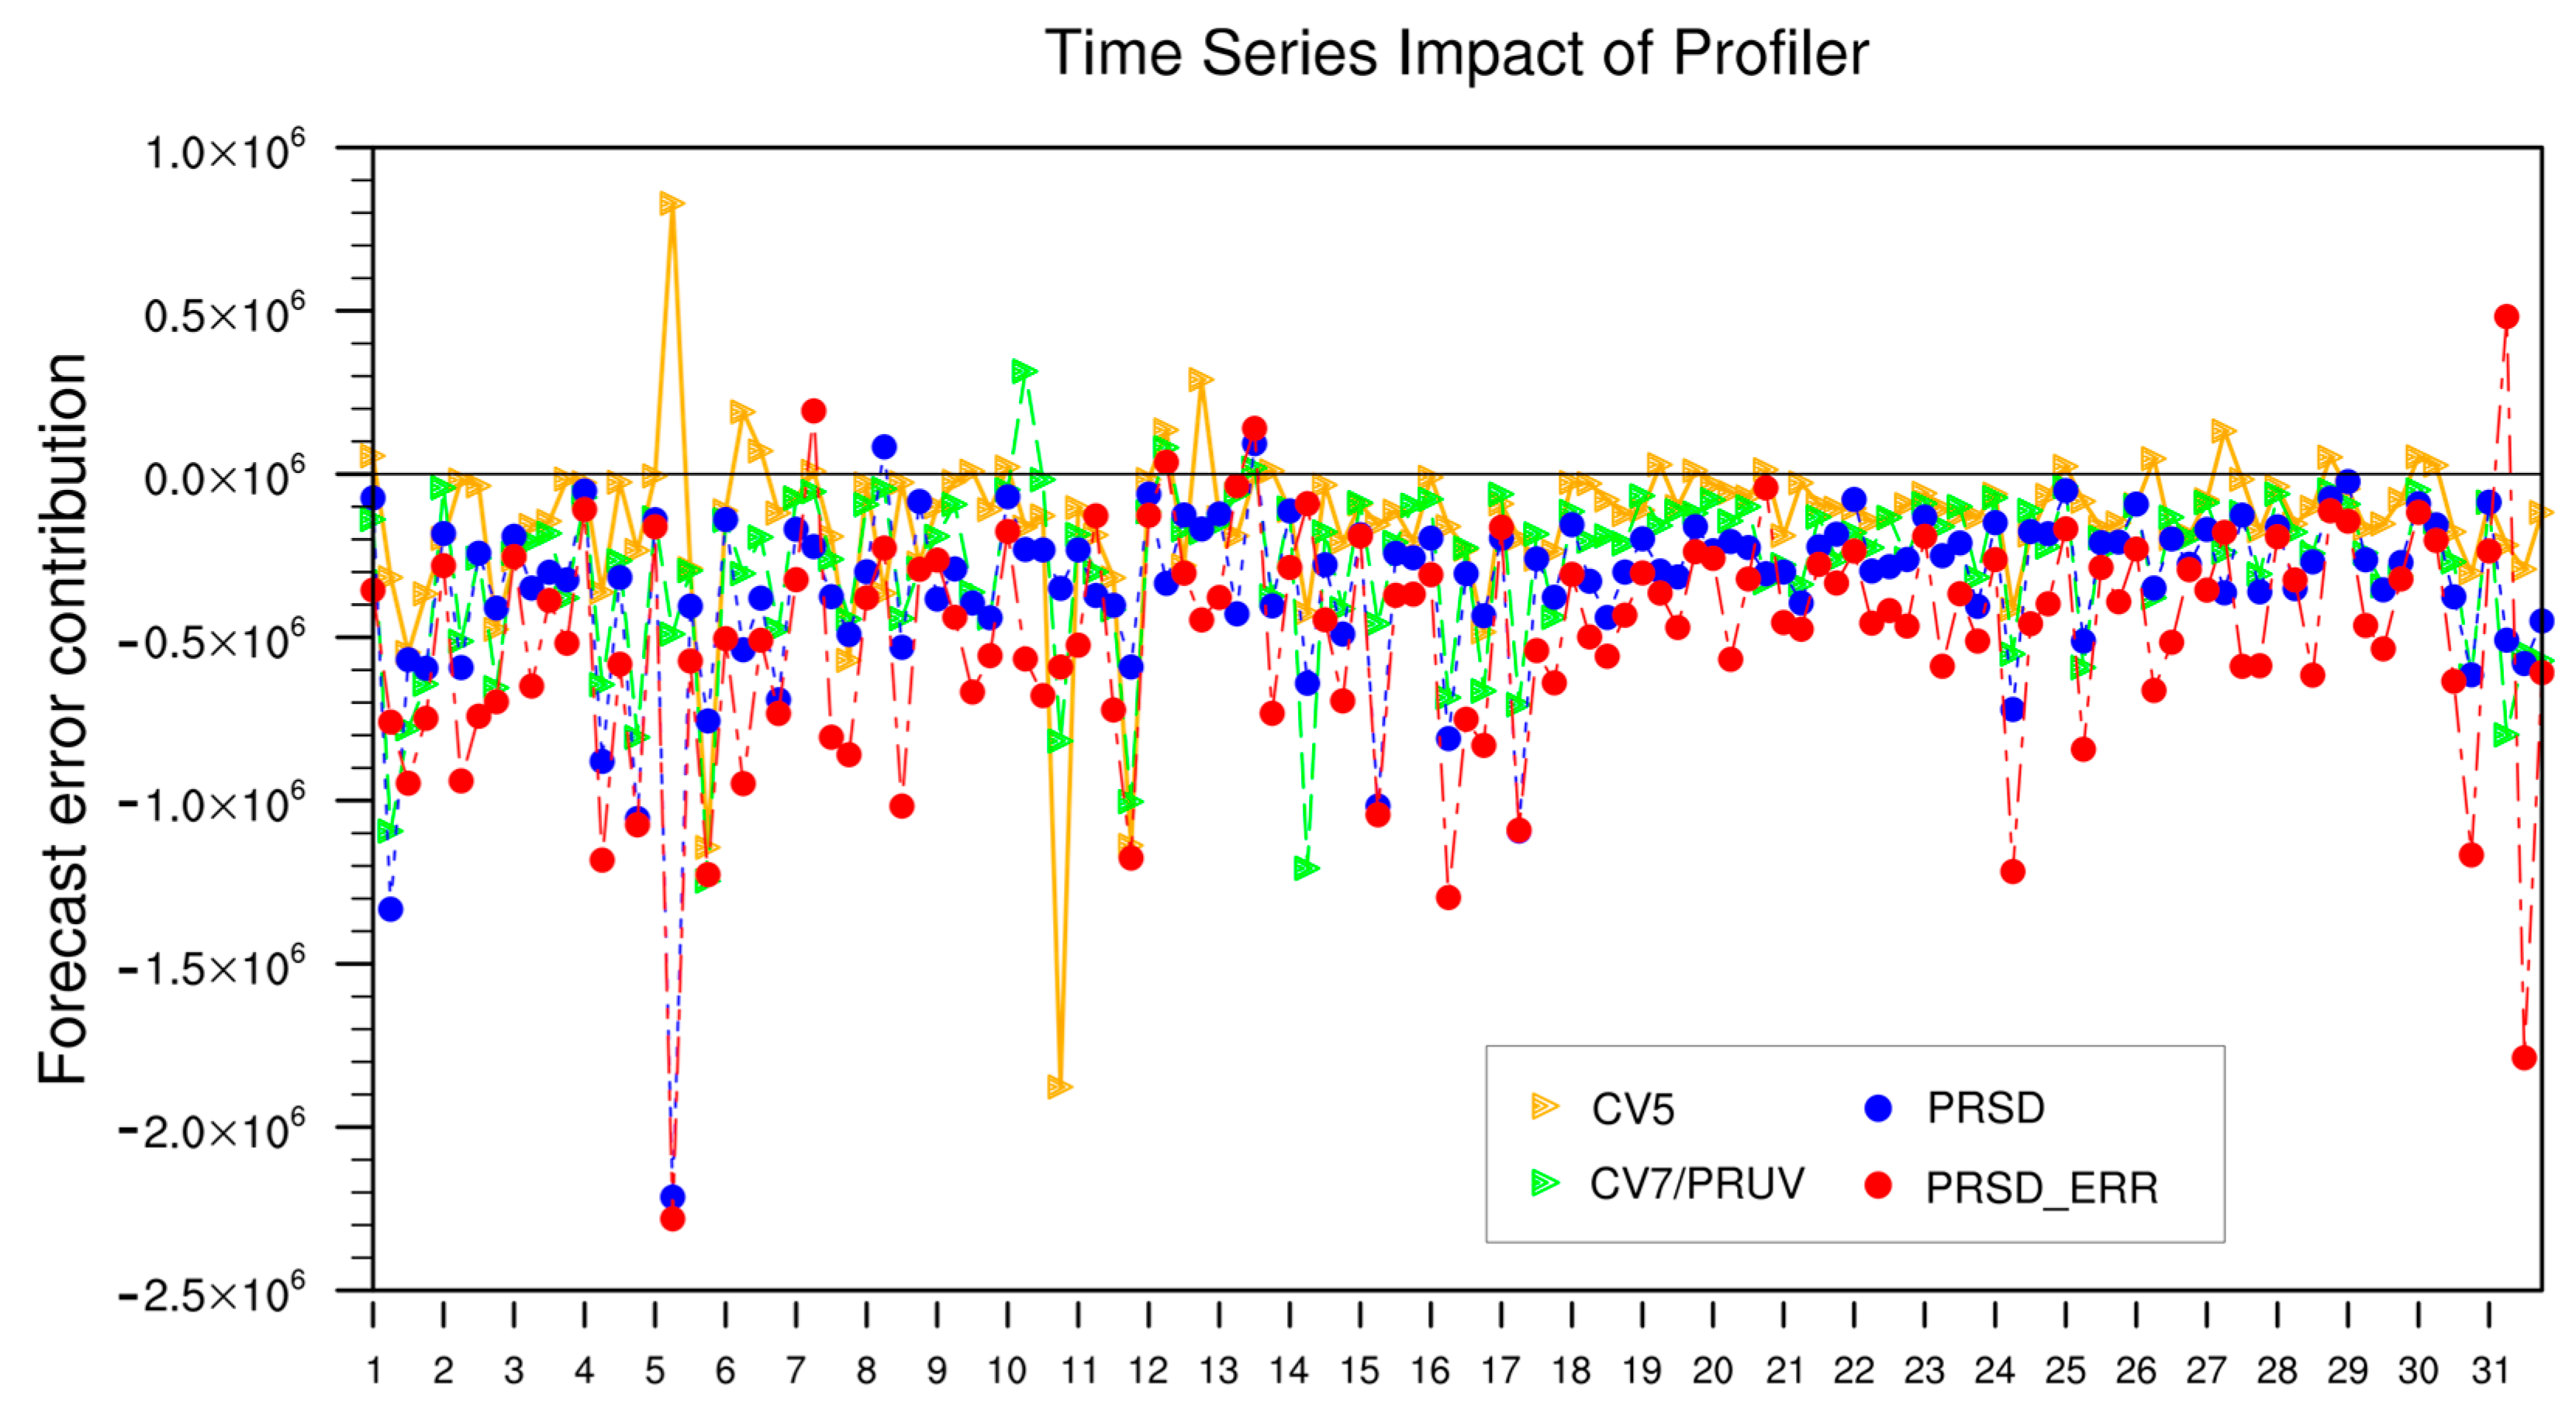
4.3. Time Series of Profiler Observation Impact
4.4. Diurnally Varying Observation Impact of Profiler Data
5. Sensitivity Analysis of Forecasts to Joint Assimilation of Multisource Observations
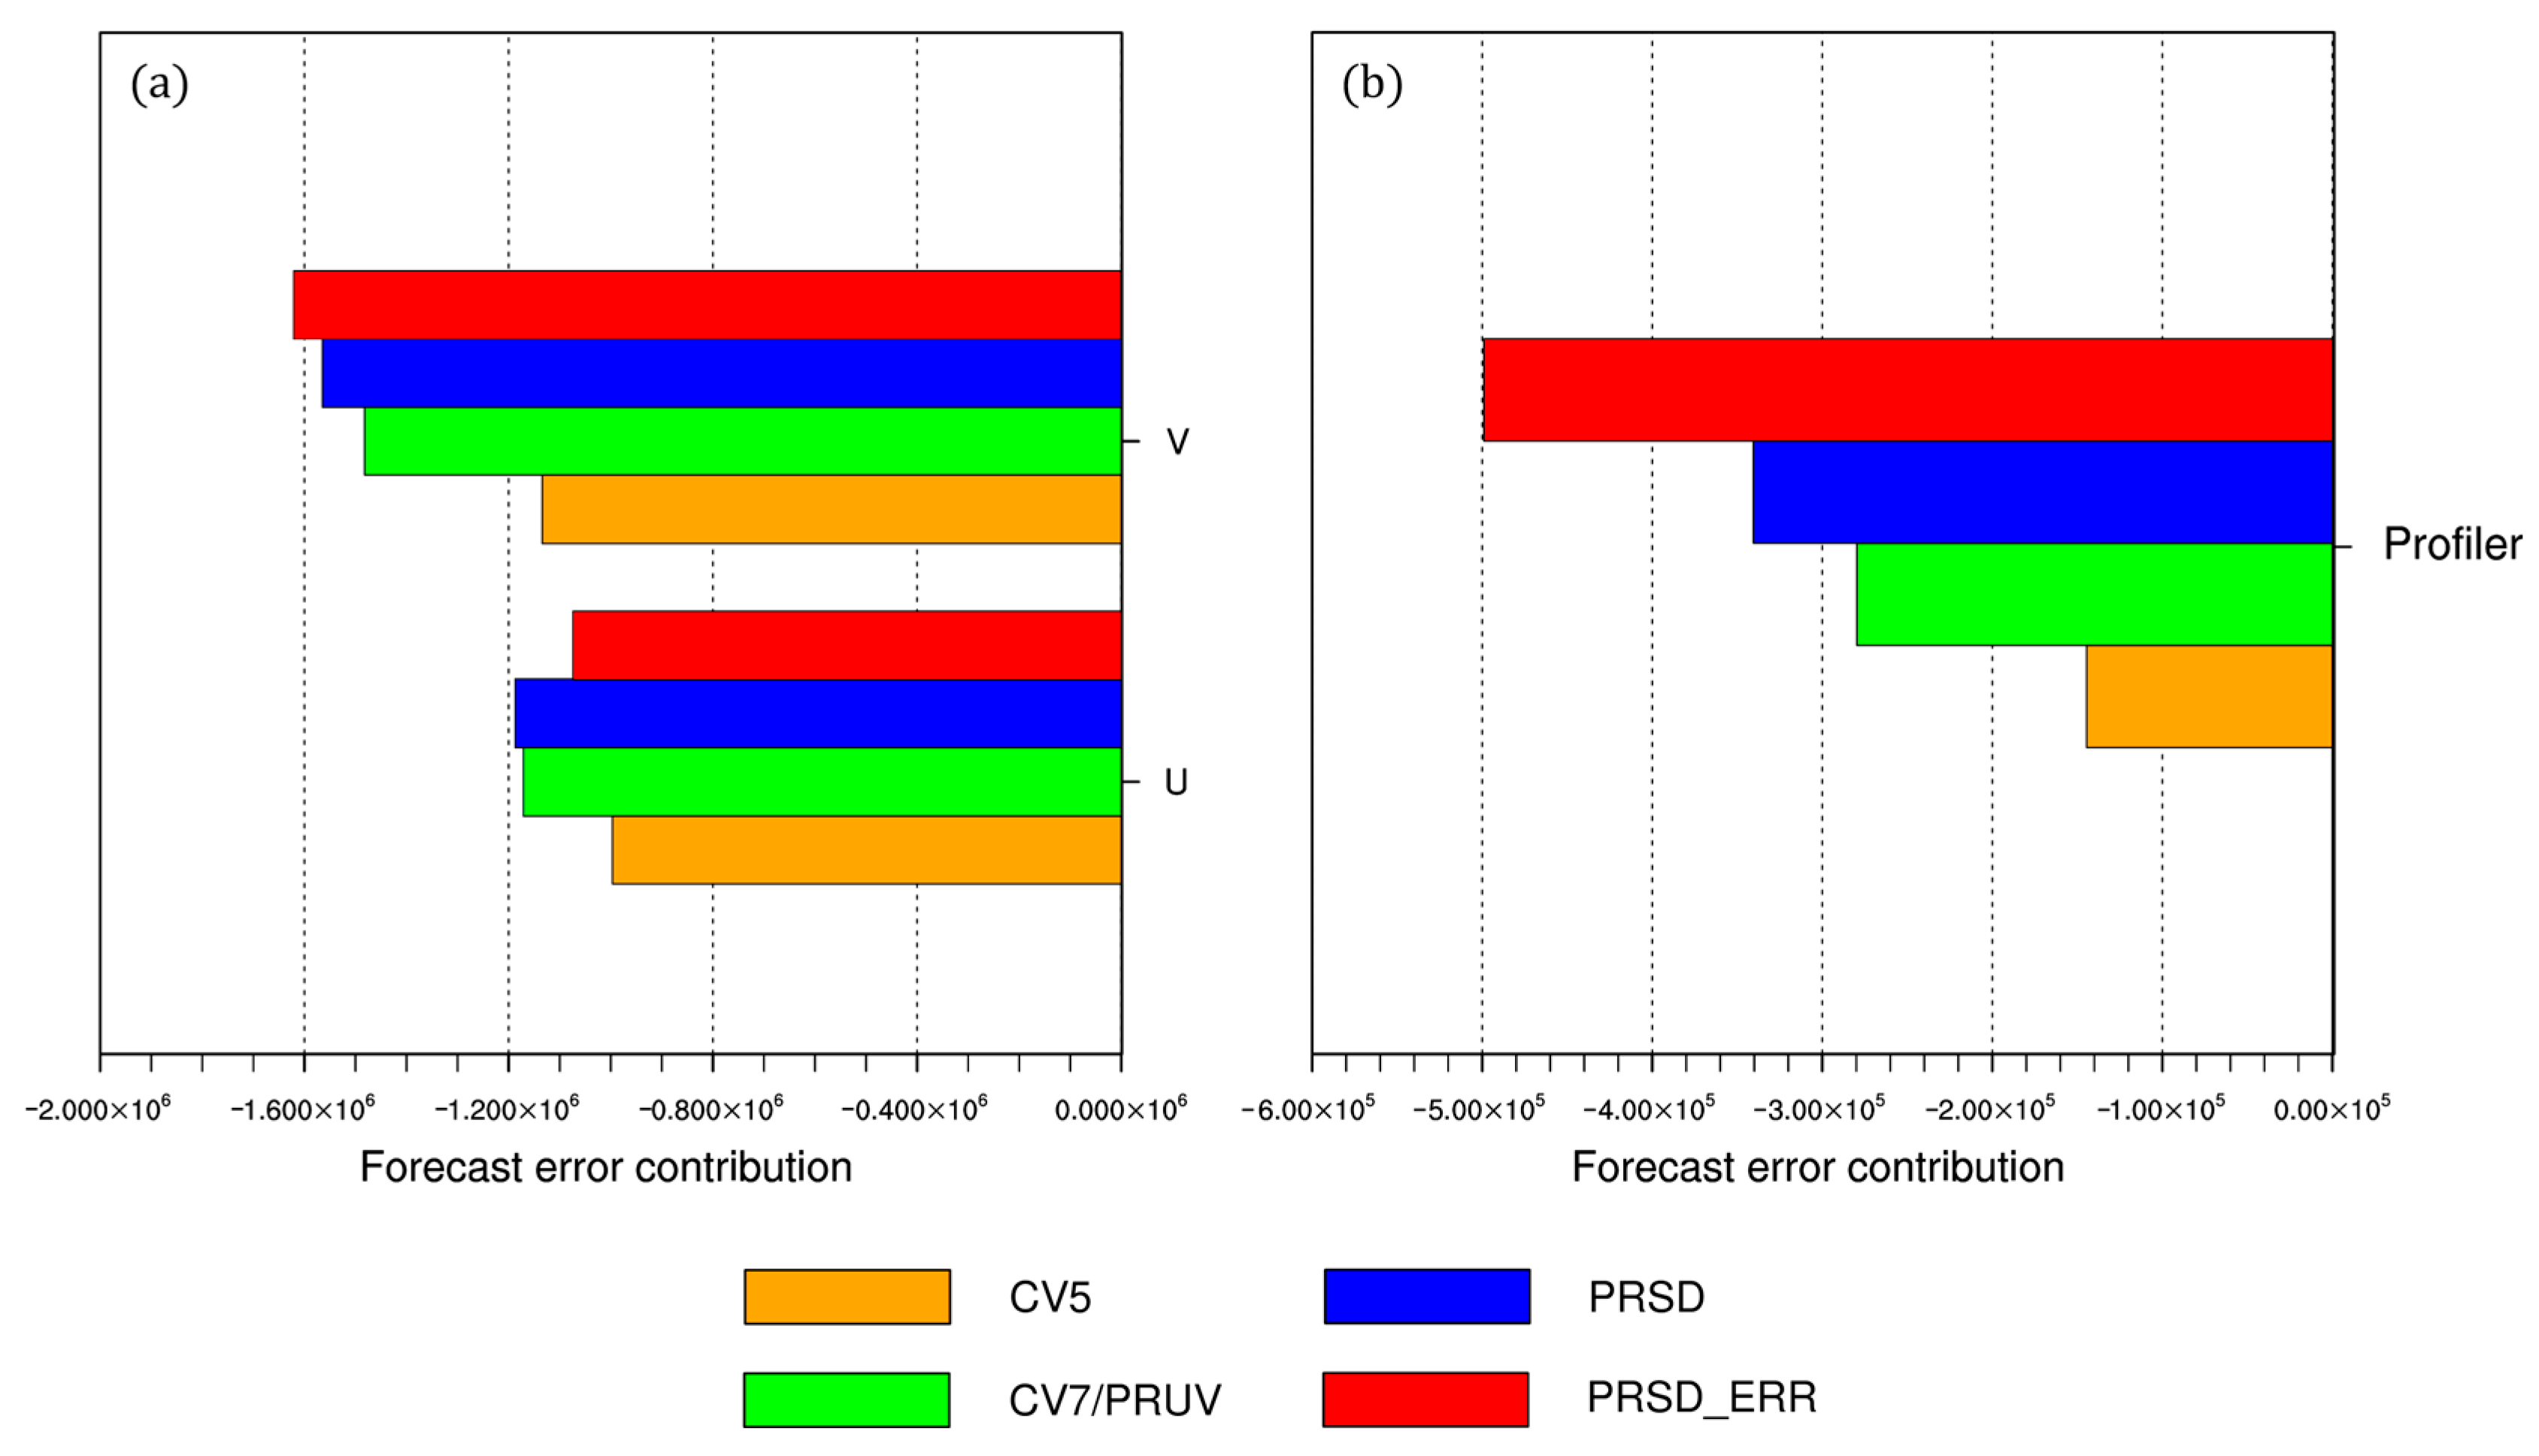
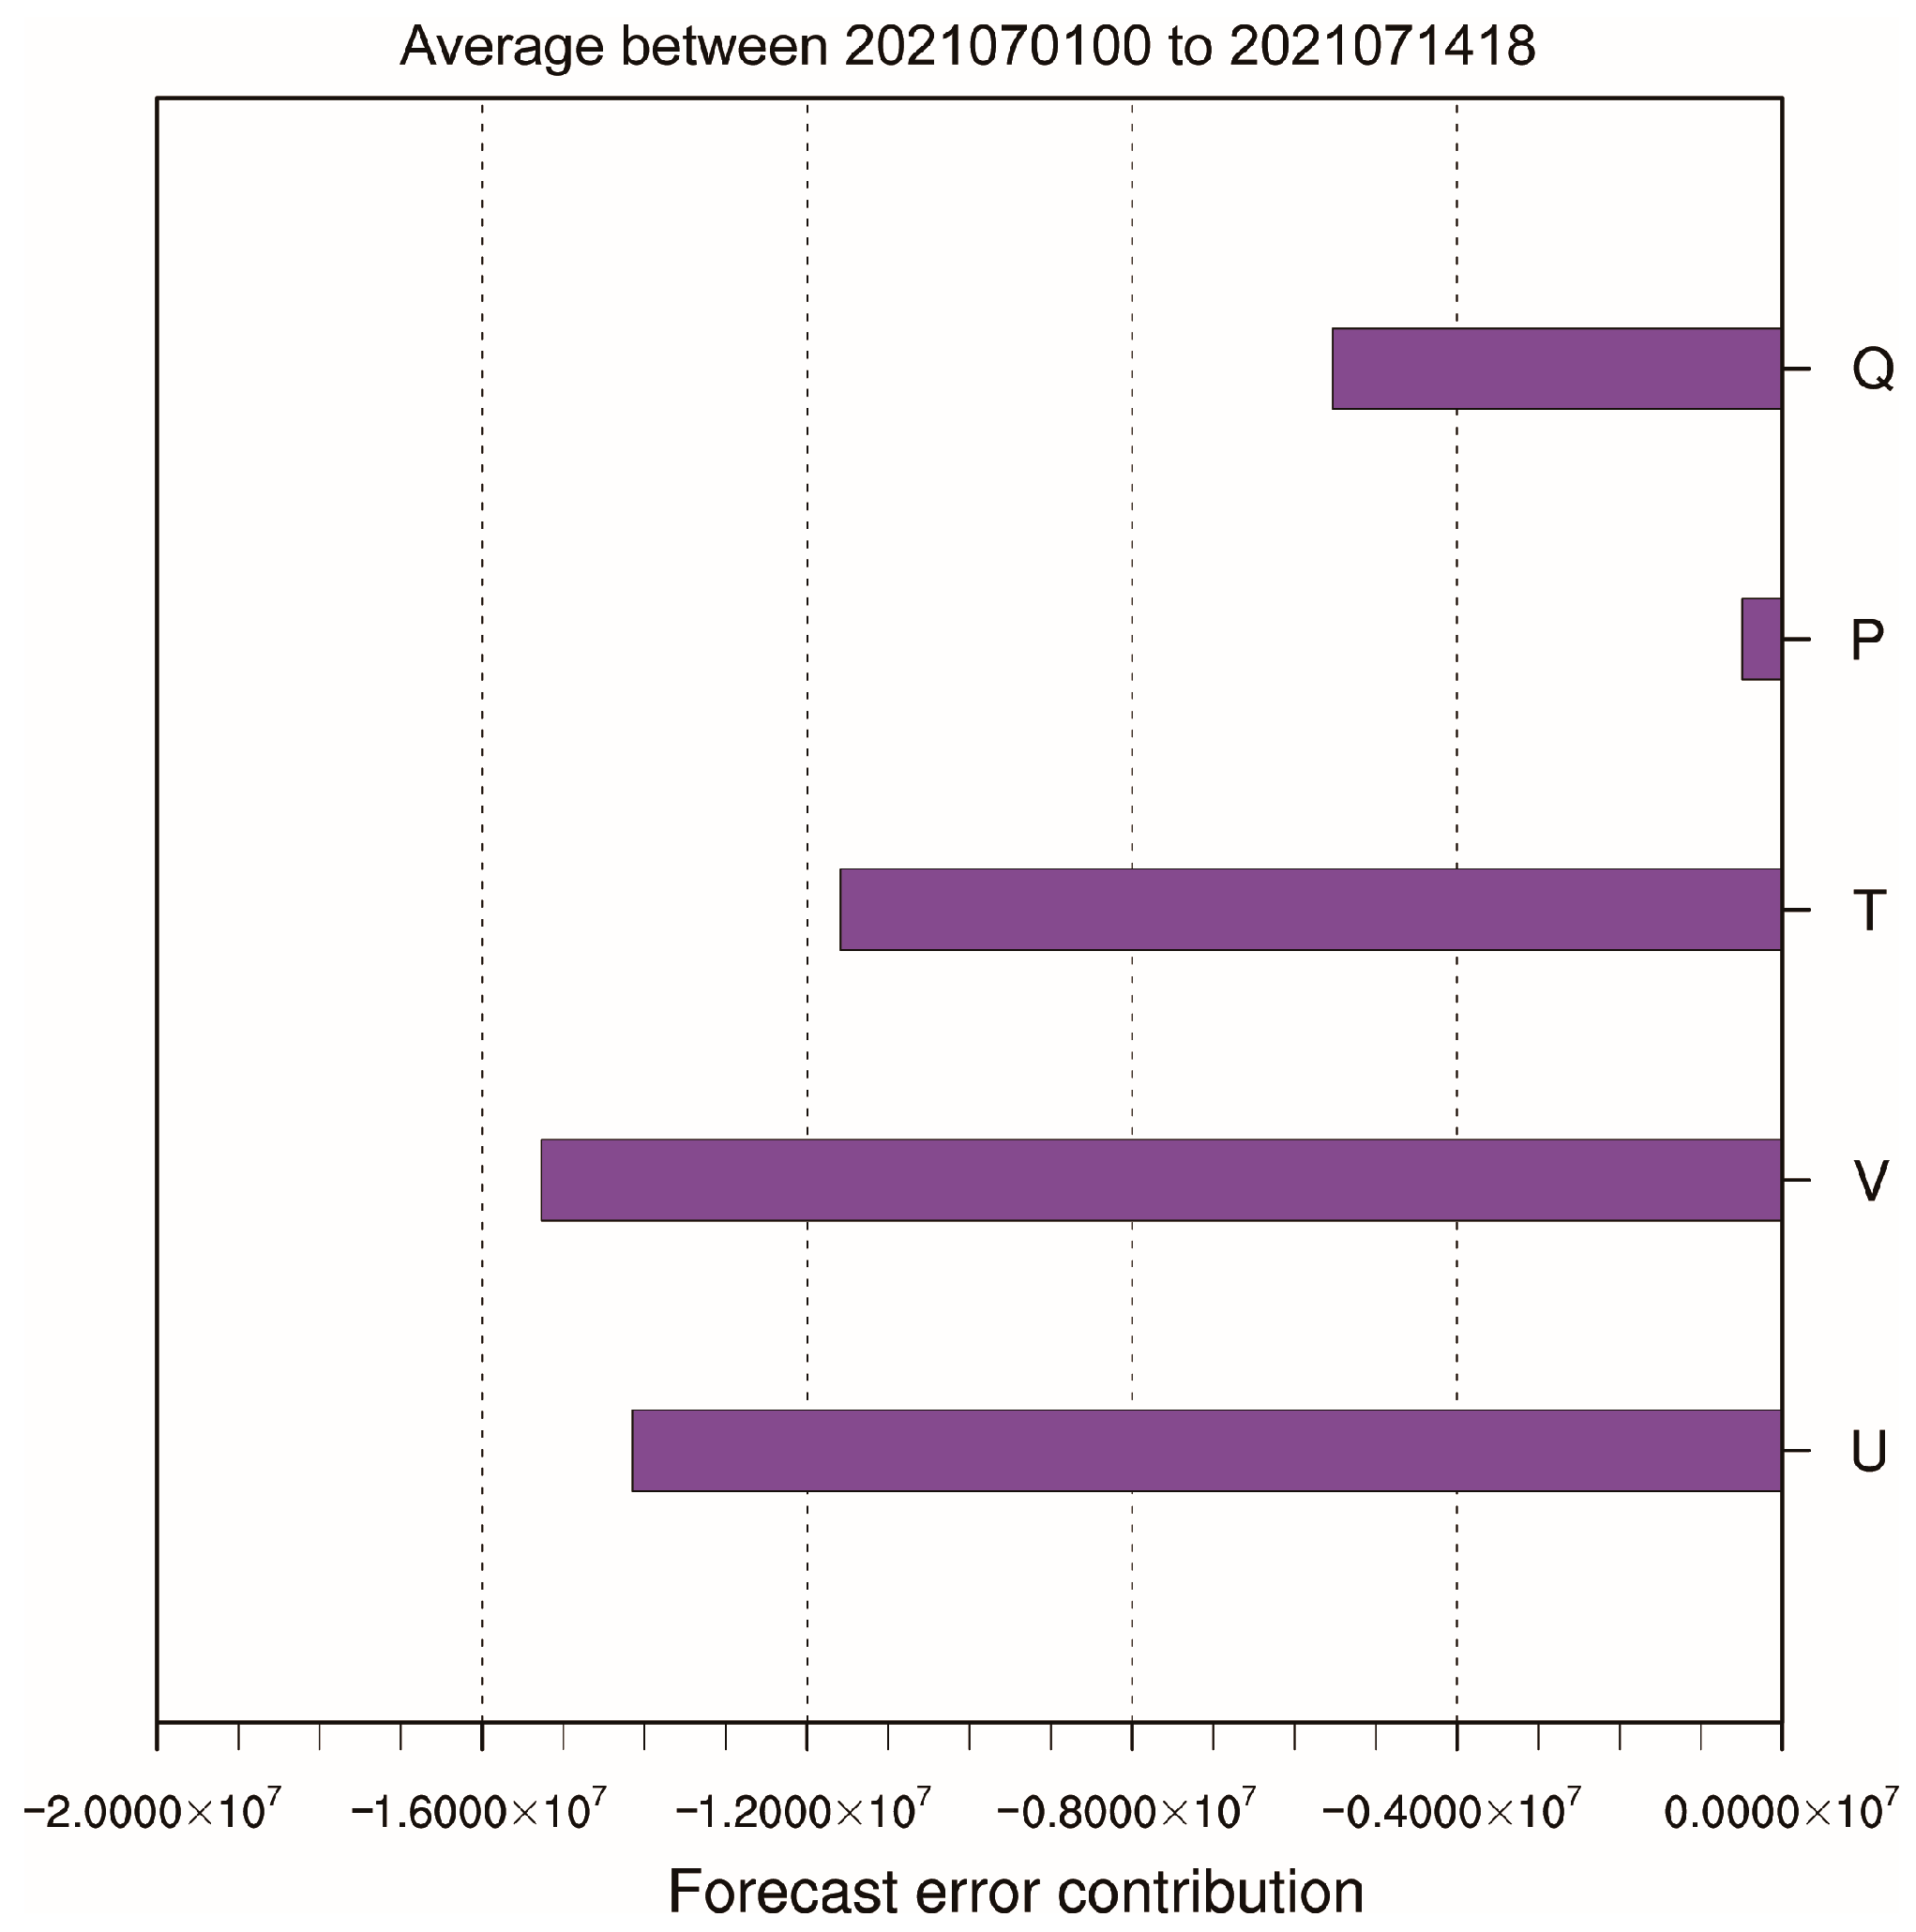
5.1. Observation Impact by Observed Variables
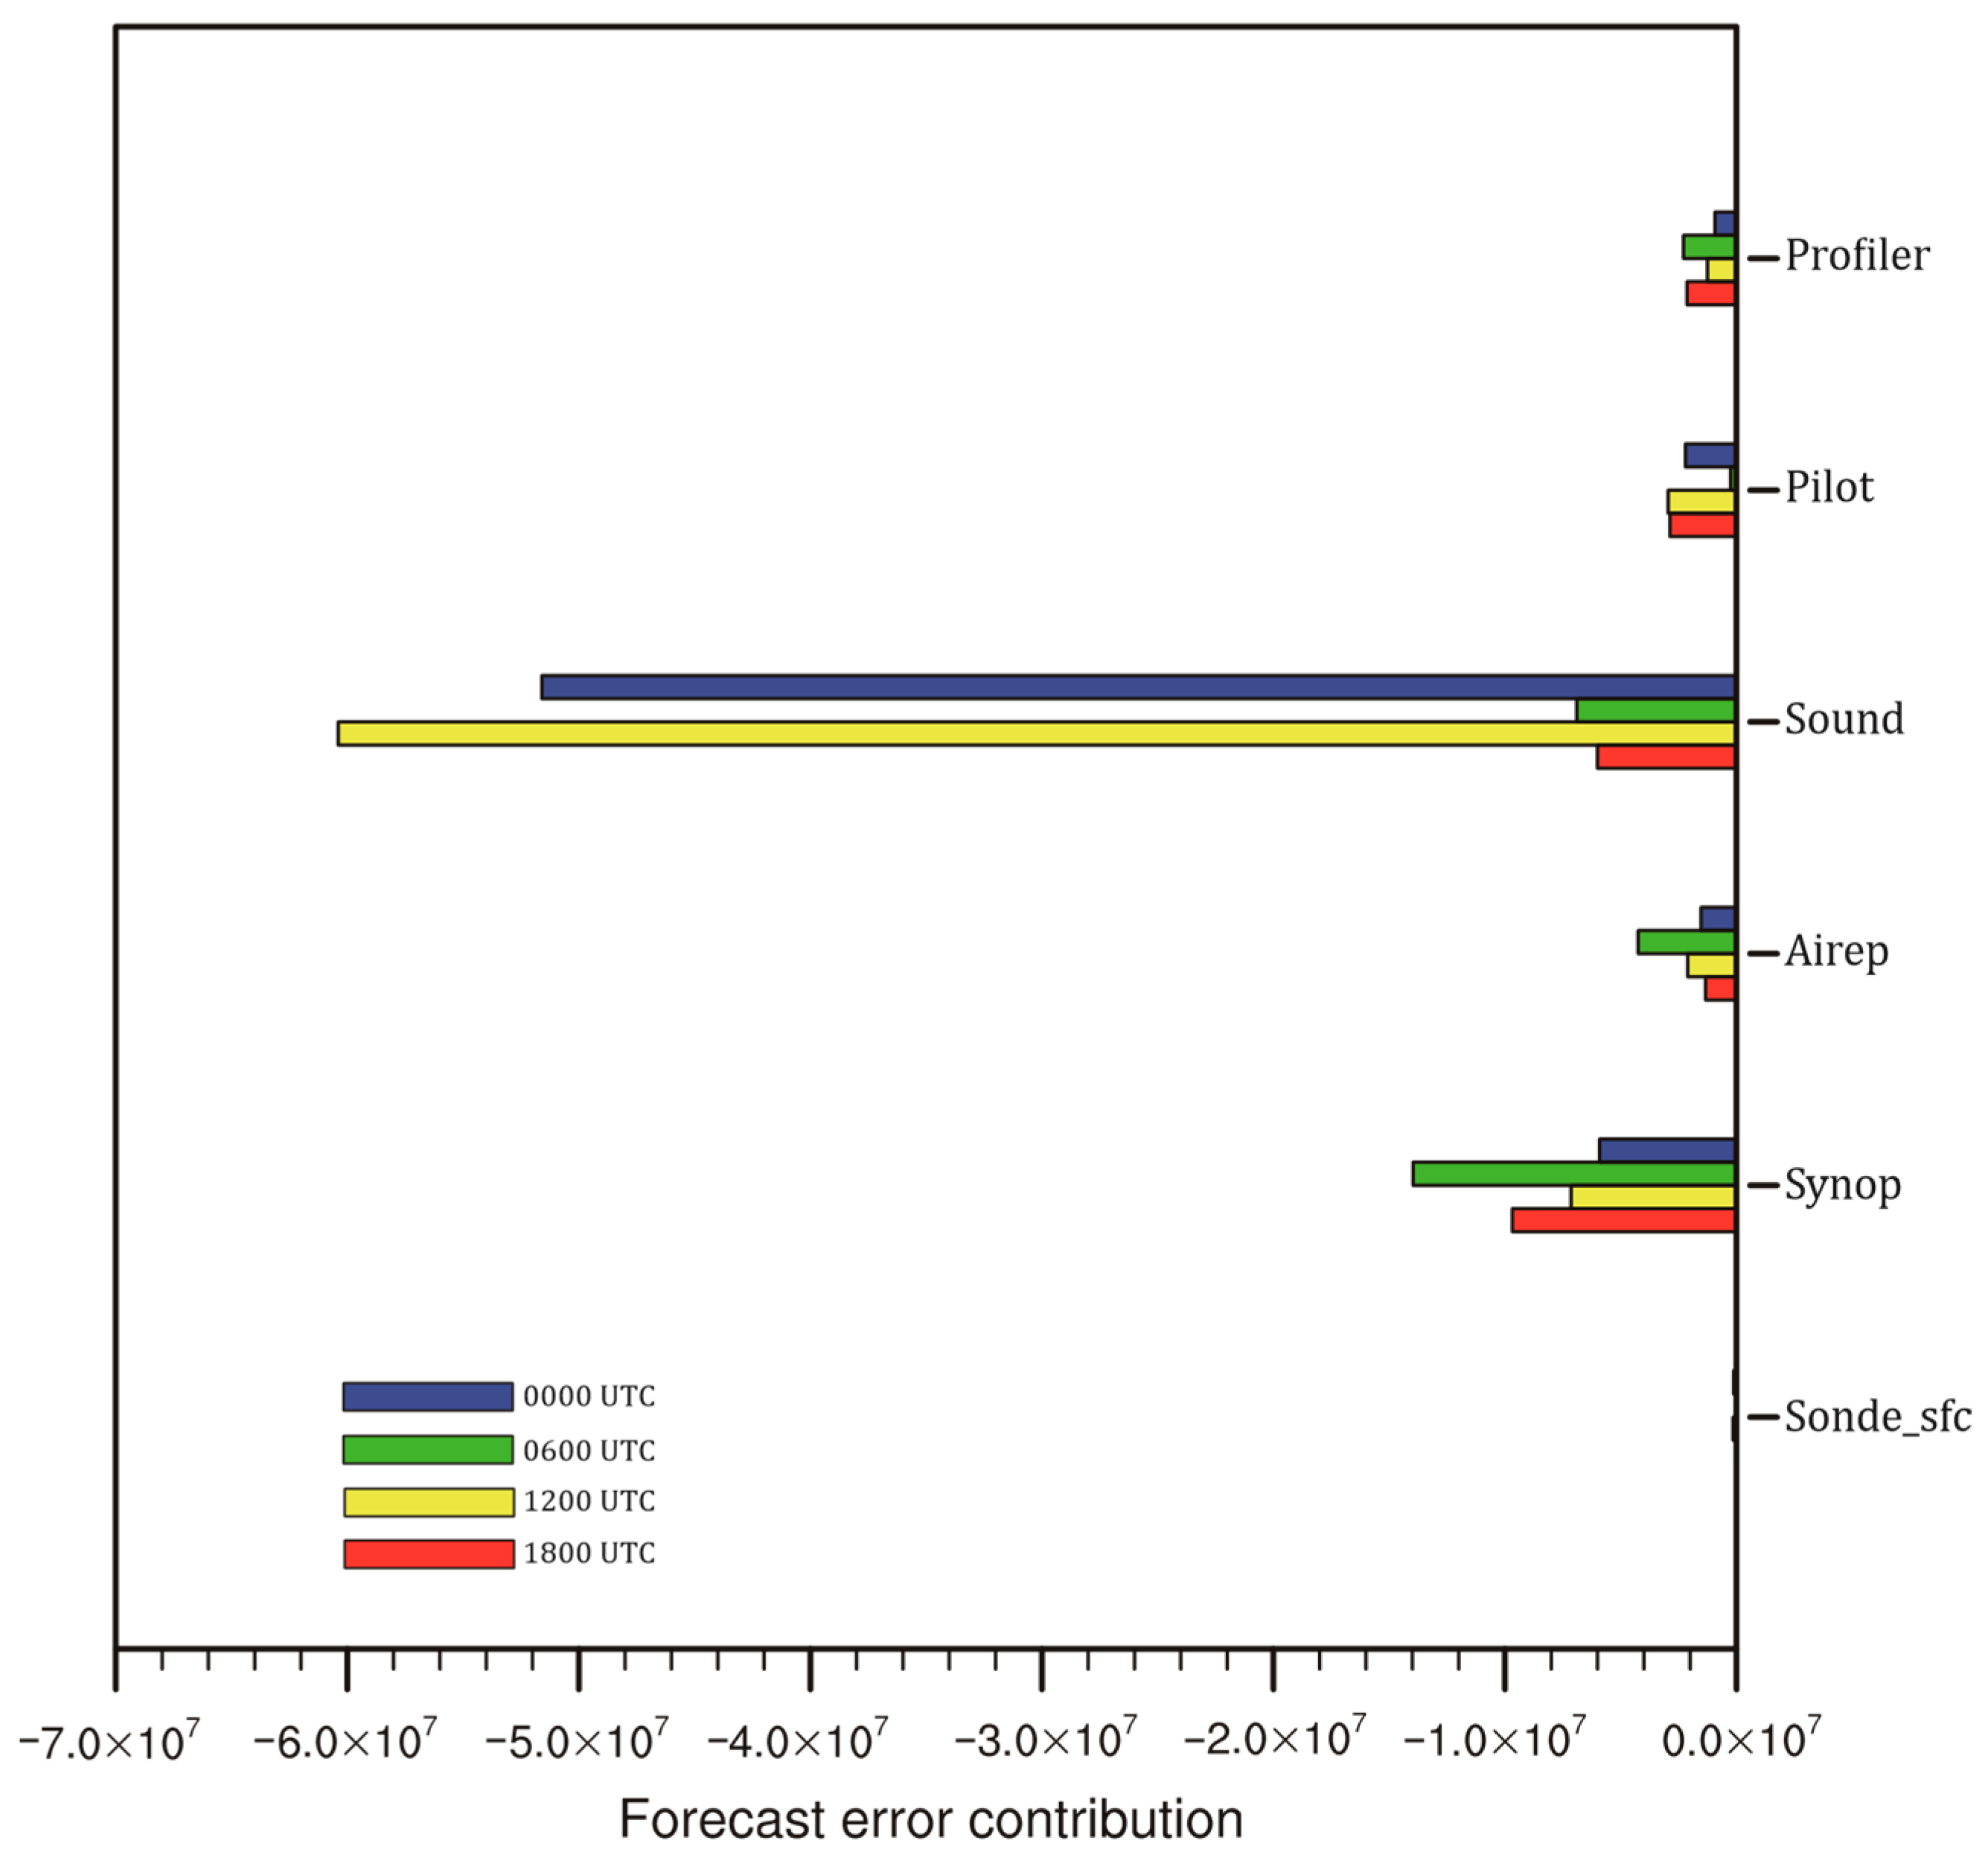
5.2. Observation Impact by Platform
5.3. Spatial Variations in Observation Impact
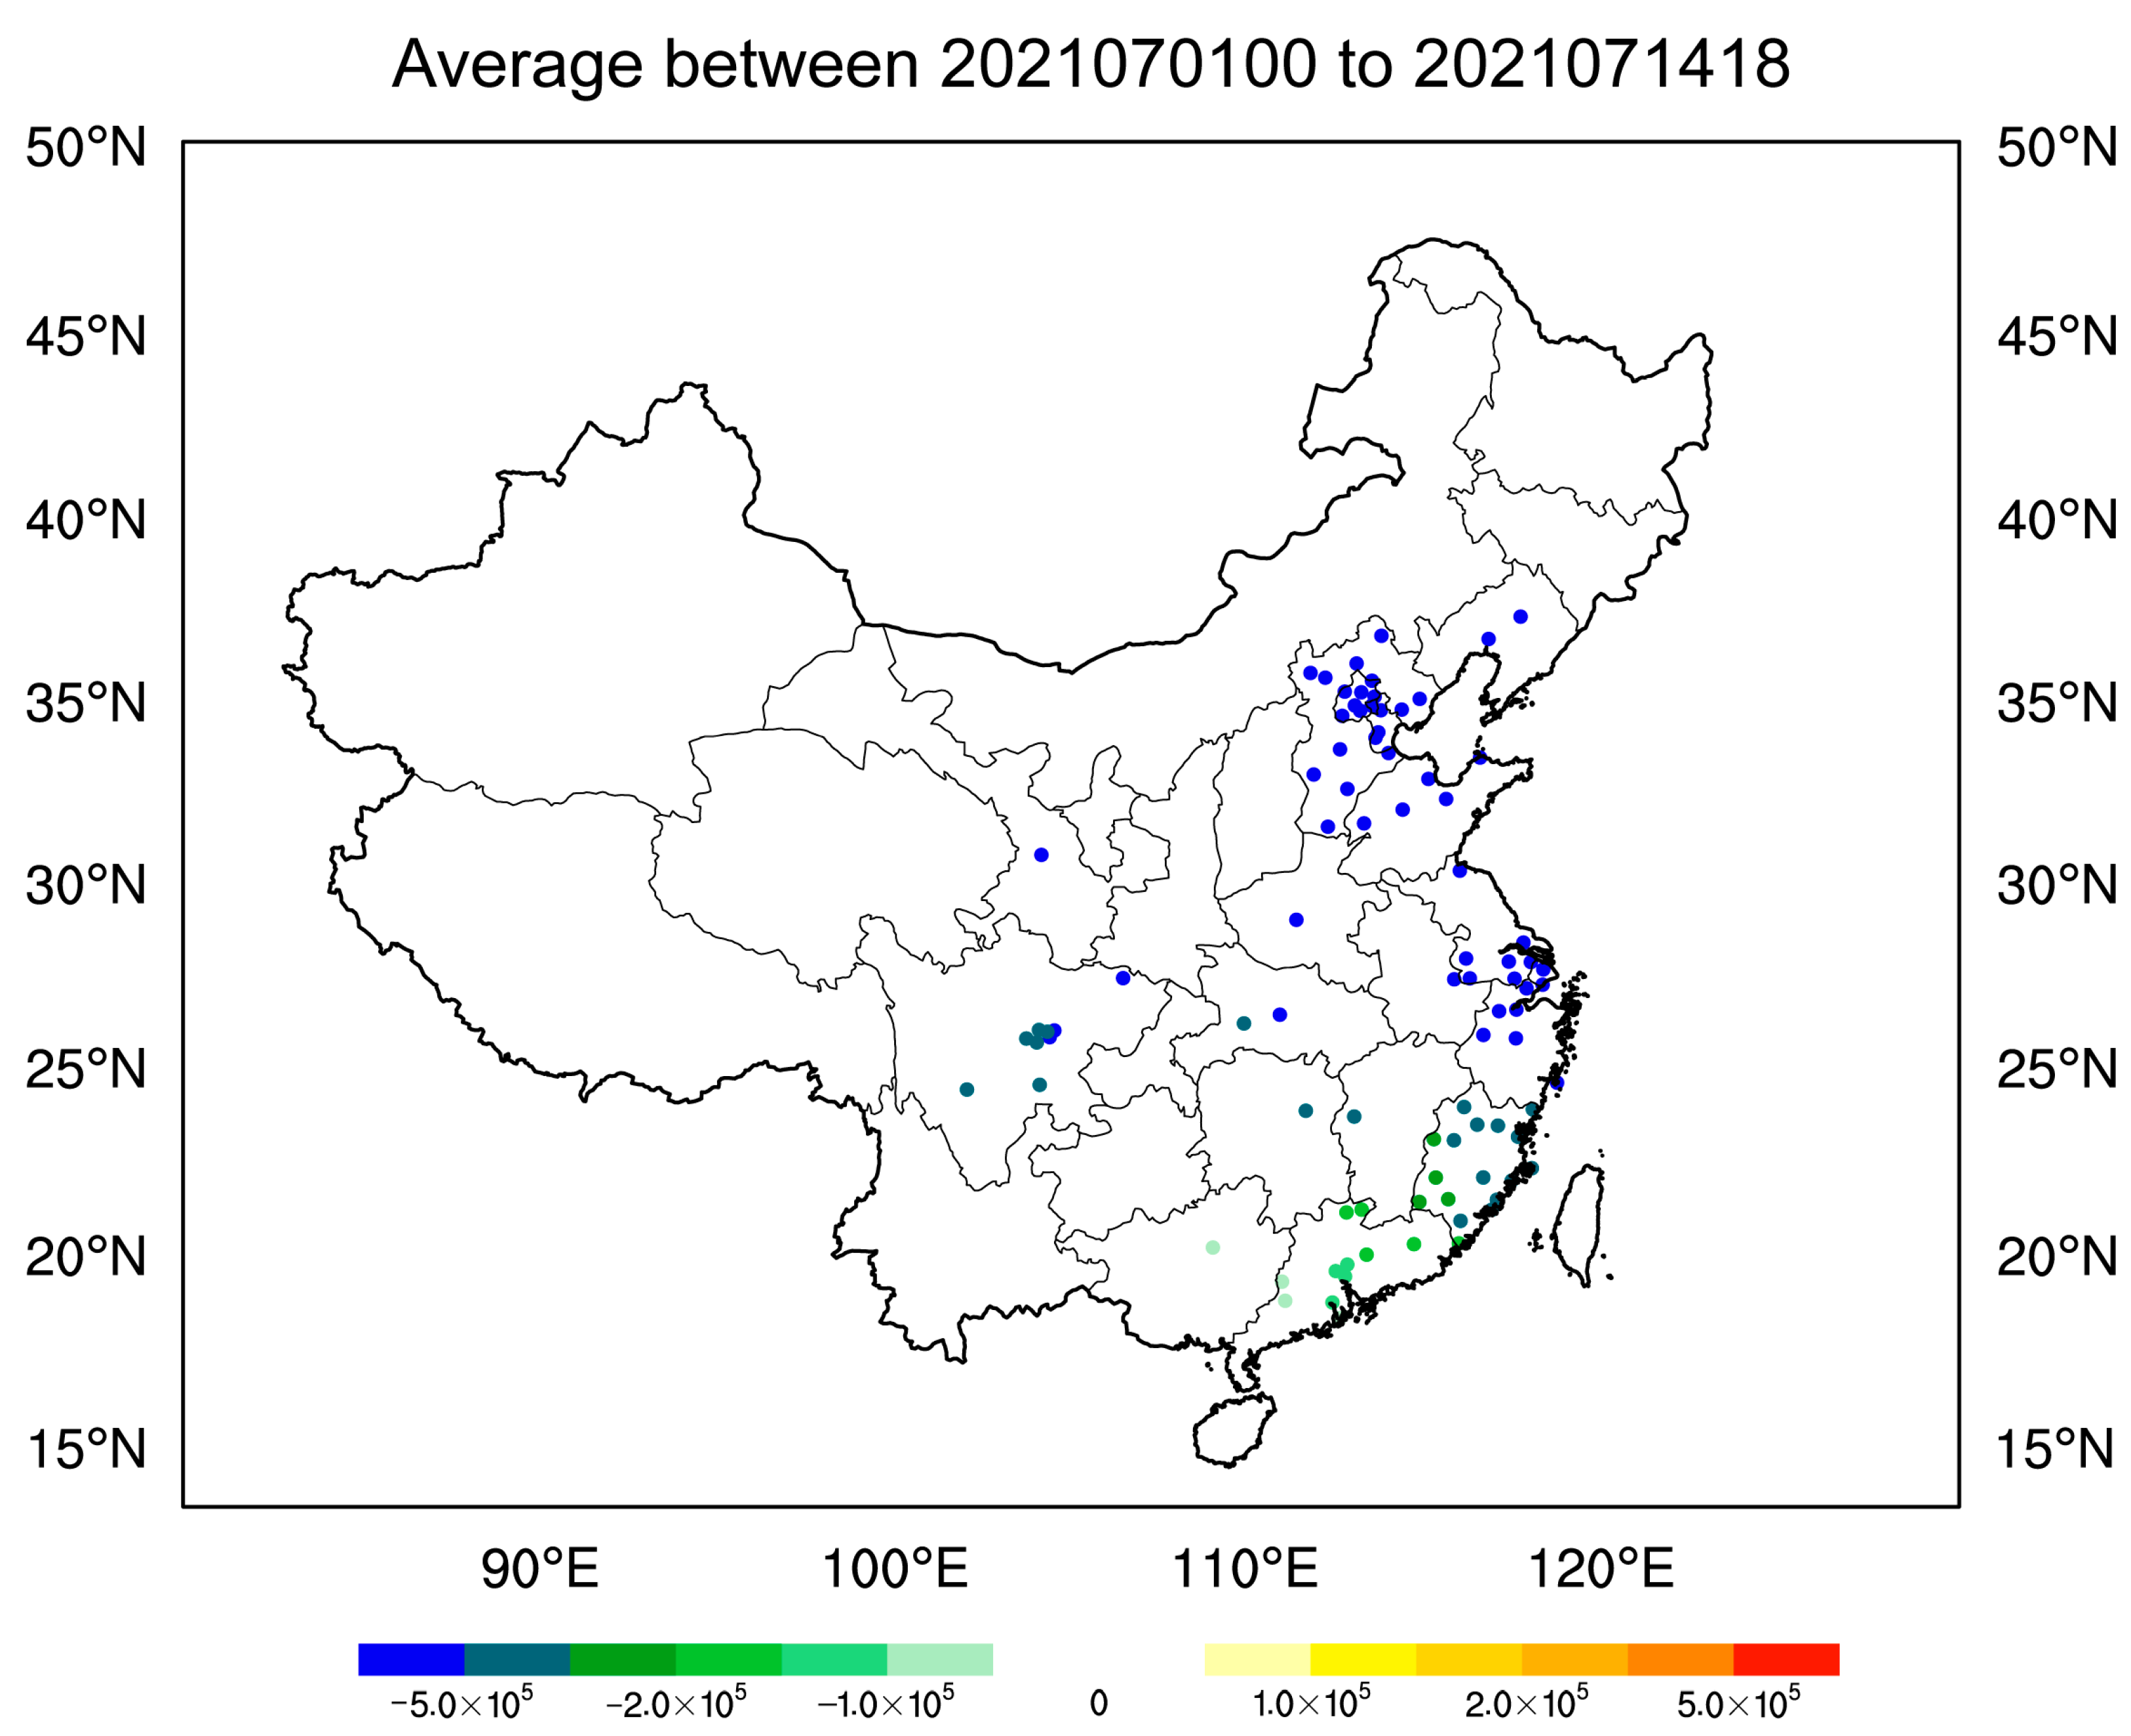
5.3.1. Horizontal Distribution of Profiler Impact
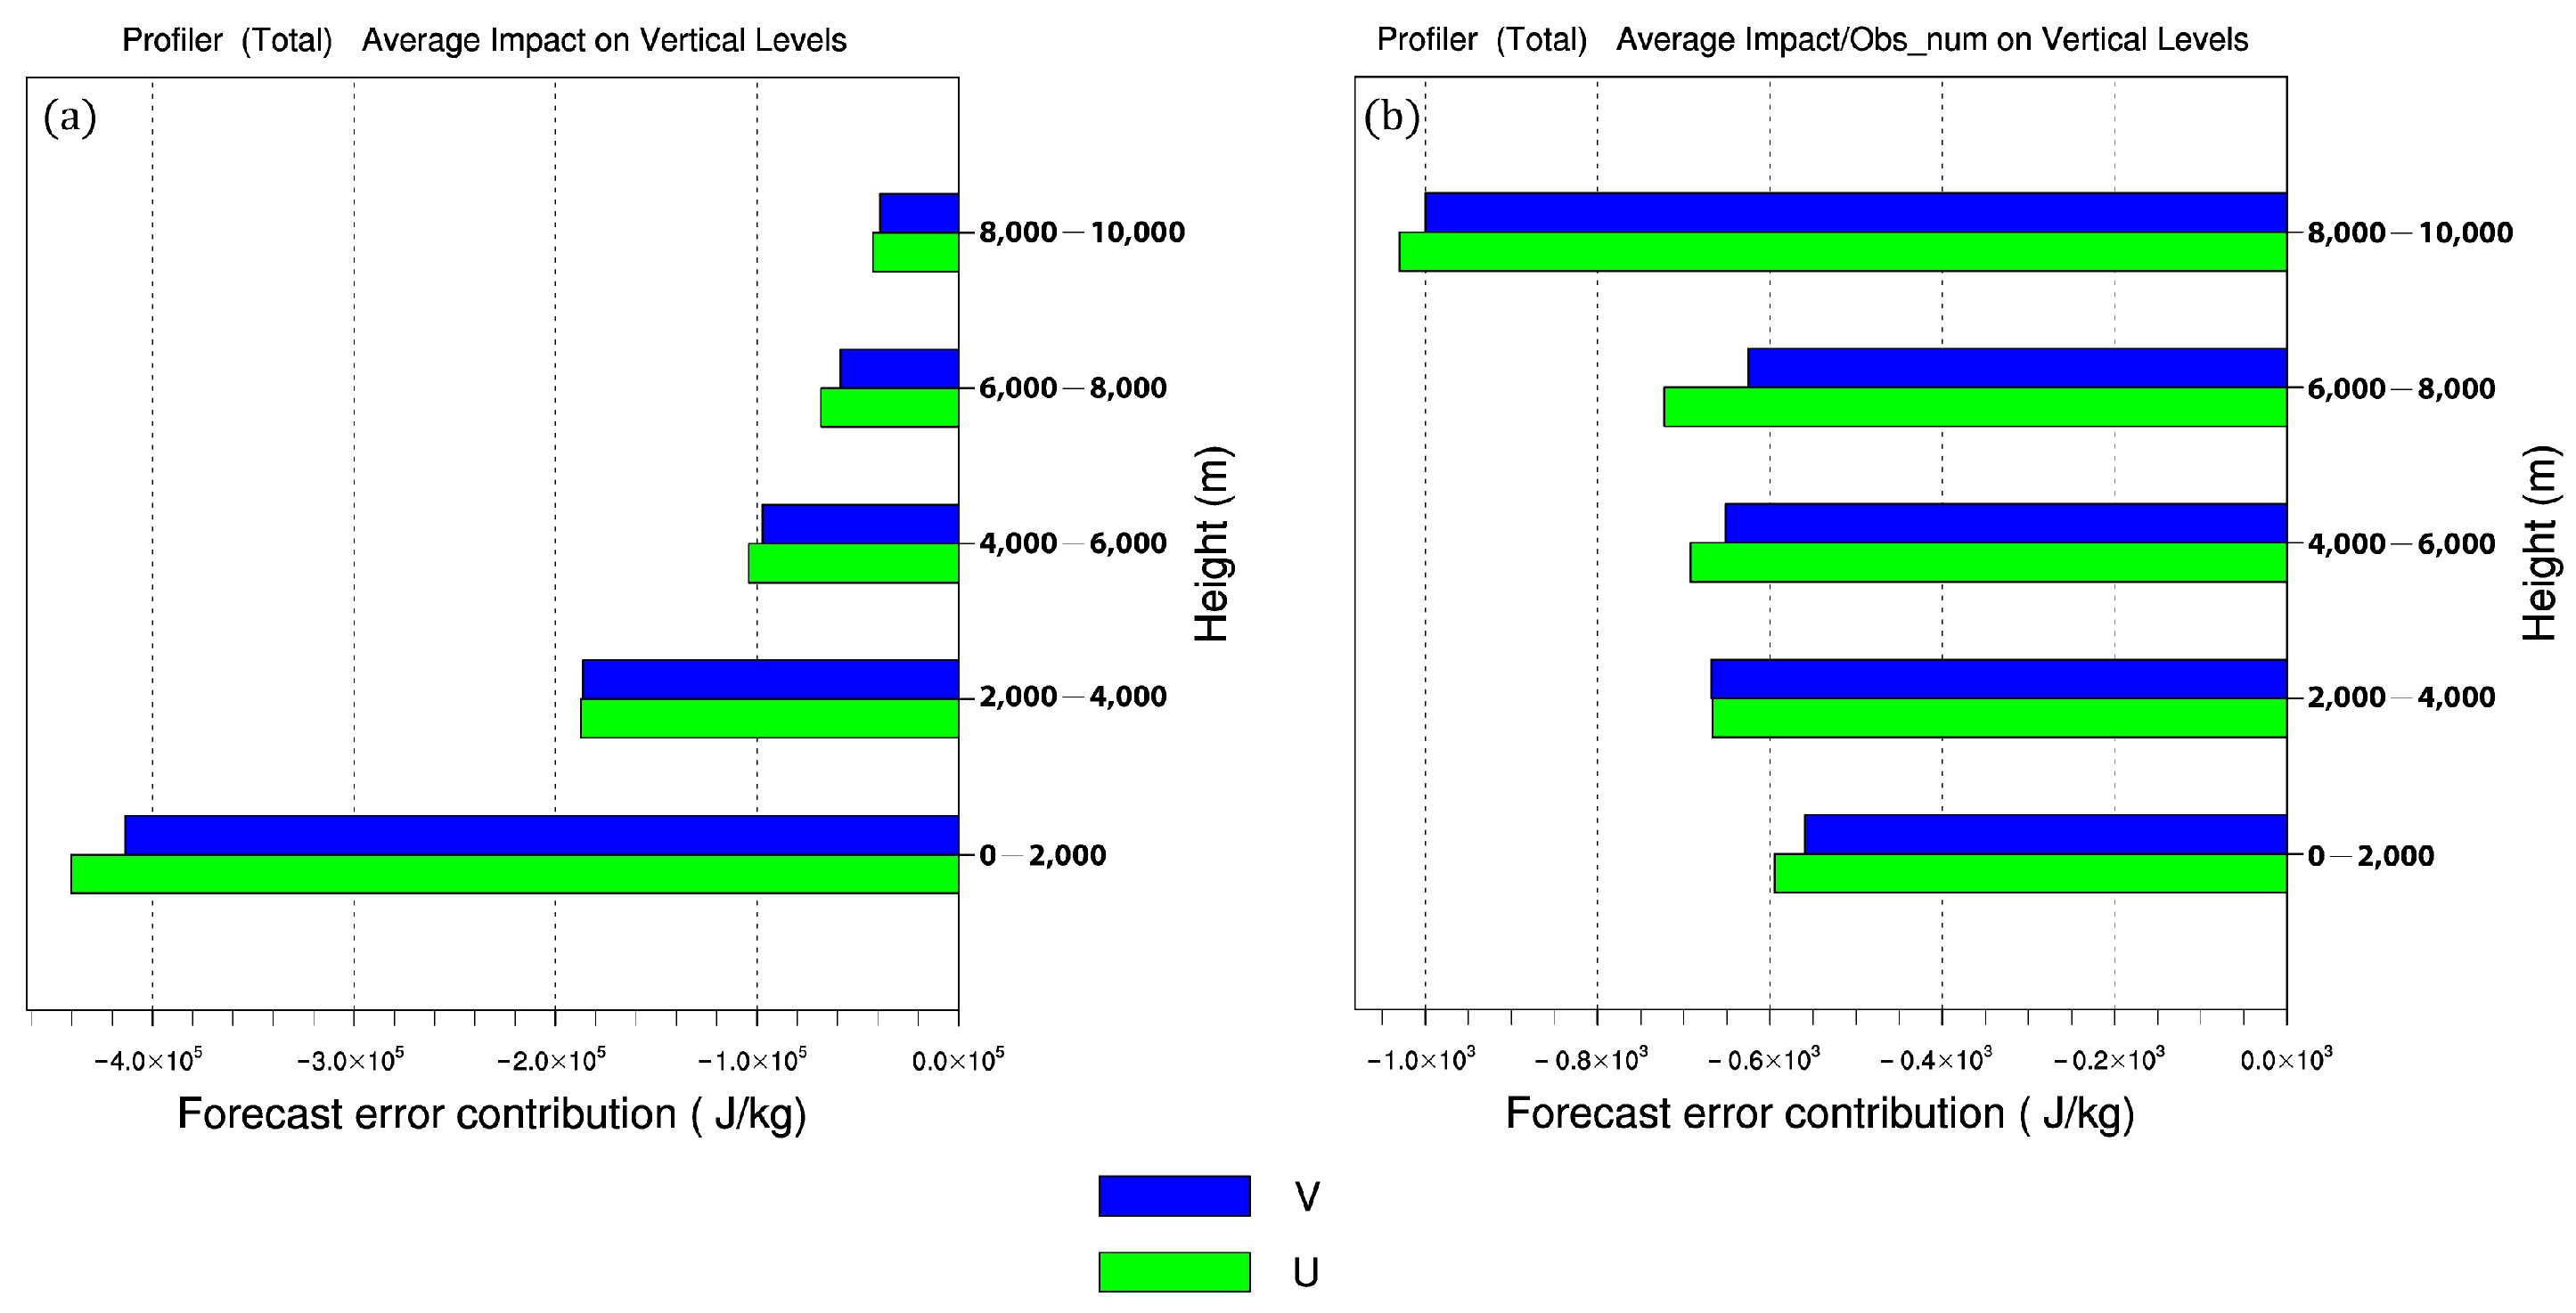
5.3.2. Vertical Distribution of Profiler Impact
6. Summary and Discussion
Author Contributions
Funding
Data Availability Statement
Acknowledgments
Conflicts of Interest
References
- Bauer, P.; Thorpe, A.; Brunet, G. The quiet revolution of numerical weather prediction. Nature 2015, 525, 47–55. [Google Scholar] [CrossRef]
- Benjamin, S.G.; Schwartz, B.E.; Szoke, E.J.; Koch, S.E. The Value of Wind Profiler Data in U.S. Weather Forecasting. Bull. Am. Meteorol. Soc. 2004, 85, 1871–1886. [Google Scholar] [CrossRef]
- Ge, G.; Gao, J.; Xue, M. Impacts of Assimilating Measurements of Different State Variables with a Simulated Supercell Storm and Three-Dimensional Variational Method. Mon. Weather Rev. 2013, 141, 2759–2777. [Google Scholar] [CrossRef]
- Bannister, R.N. A Review of Operational Methods of Variational and Ensemble-variational Data Assimilation. J. R. Meteorol. Soc. 2017, 143, 607–633. [Google Scholar] [CrossRef]
- Gustafsson, N.; Janjic, T.; Schraff, C.; Leuenberger, D.; Weissmann, M.; Reich, H.; Brousseau, P.; Montmerle, T.; Wattrelot, E.; Bučánek, A.; et al. Survey of Data Assimilation Methods for Convective-scale Numerical Weather Prediction at Operational Centres. J. R. Meteorol. Soc. 2018, 144, 1218–1256. [Google Scholar] [CrossRef]
- Nash, J. Development of COST 76 Wind Profiler Network in Europe. Phys. Chem. Earth Part B Hydrol. Ocean. Atmos. 2006, 26, 193–199. [Google Scholar] [CrossRef]
- Ackley, M.H.; Gage, K.S. NOAA Profiler Network and Other Emerging Global Profiler Networks. In Microwave Remote Sensing of the Atmosphere and Environment III; SPIE: St Bellingham, WA, USA, 2003; Volume 4894. [Google Scholar] [CrossRef]
- Lambert, W.C.; Merceret, F.J.; Taylor, G.E.; Ward, J.G. Performance of Five 915-MHz Wind Profilers and an Associated Automated Quality Control Algorithm in an Operational Environment. J. Atmos. Ocean. Technol. 2003, 20, 8. [Google Scholar] [CrossRef]
- Adachi, A.; Kobayashi, T.; Gage, K.S.; Carter, D.A.; Hartten, L.M.; Clark, W.L.; Fukuda, M. Evaluation of Three-Beam and Four-Beam Profiler Wind Measurement Techniques Using a Five-Beam Wind Profiler and Collocated Meteorological Tower. J. Atmos. Ocean. Technol. 2005, 22, 1167–1180. [Google Scholar] [CrossRef]
- Schafer, R.; Avery, S.K.; Gage, K.S.; Kiladis, G.N. Wind Profiler Observations over the Central Equatorial Pacific: Optimizing Processing to Improve Quality and Height Coverage. J. Atmos. Ocean. Technol. 2007, 24, 1710–1725. [Google Scholar] [CrossRef]
- Pan, C.J.; Lai, H.C.; Yang, S.S.; Reddy, K.K.; Chang, S.-C. Wind Profiler Radar Investigation on Typhoon-Orography Interaction. Geophys. Res. Lett. 2008, 35, L24812. [Google Scholar] [CrossRef]
- St-James, J.S.; Laroche, S. Assimilation of Wind Profiler Data in the Canadian Meteorological Centre’s Analysis Systems. J. Atmos. Ocean. Technol. 2005, 22, 1181–1194. [Google Scholar] [CrossRef]
- Ishihara, M.; Kato, Y.; Abo, T.; Kobayashi, K.; Izumikawa, Y. Characteristics and Performance of the Operational Wind Profiler Network of the Japan Meteorological Agency. J. Meteorol. Soc. Jpn. 2006, 84, 1085–1096. [Google Scholar] [CrossRef]
- Hu, H.; Sun, J.; Zhang, Q. Assessing the Impact of Surface and Wind Profiler Data on Fog Forecasting Using WRF 3DVAR: An OSSE Study on a Dense Fog Event over North China. J. Appl. Meteorol. Climatol. 2017, 56, 1059–1081. [Google Scholar] [CrossRef]
- Wang, C.; Chen, M.; Chen, Y. Impact of Combined Assimilation of Wind Profiler and Doppler Radar Data on a Convective-Scale Cycling Forecasting System. Mon. Weather Rev. 2005, 150, 431–450. [Google Scholar] [CrossRef]
- Desroziers, G.; Berre, L.; Chapnik, B.; Poli, P. Diagnosis of Observation, Background and Analysis-error Statistics in Observation Space. J. R. Meteorol. Soc. 2005, 131, 3385–3396. [Google Scholar] [CrossRef]
- Huang, X.-Y.; Gao, F.; Jacobs, N.A.; Wang, H. Assimilation of Wind Speed and Direction Observations: A New Formulation and Results from Idealised Experiments. Tellus A Dyn. Meteorol. Oceanogr. 2013, 65, 19936. [Google Scholar] [CrossRef]
- Gao, F.; Huang, X.-Y.; Jacobs, N.A.; Wang, H. Assimilation of Wind Speed and Direction Observations: Results from Real Observation Experiments. Tellus A Dyn. Meteorol. Oceanogr. 2015, 67, 27132. [Google Scholar] [CrossRef]
- Wang, C.; Chen, Y.; Chen, M.; Shen, J. Data Assimilation of a Dense Wind Profiler Network and Its Impact on Convective Forecasting. Atmos. Res. 2020, 238, 104880. [Google Scholar] [CrossRef]
- Wang, C.; Chen, Y.; Chen, M.; Huang, X.-Y. Evaluation of Two Observation Operator Schemes for Wind Profiler Radar Data Assimilation and Its Impacts on Short-Term Forecasting. Atmos. Res. 2023, 283, 106549. [Google Scholar] [CrossRef]
- Atlas, R.; Hoffman, R.N.; Ma, Z.; Emmitt, G.D.; Wood, S.A.; Greco, S.; Tucker, S.; Bucci, L.; Annane, B.; Hardesty, R.M.; et al. Observing System Simulation Experiments (OSSEs) to Evaluate the Potential Impact of an Optical Autocovariance Wind Lidar (OAWL) on Numerical Weather Prediction. J. Atmos. Ocean. Technol. 2015, 32, 1593–1613. [Google Scholar] [CrossRef]
- Lupu, C.; Gauthier, P.; Laroche, S. Assessment of the Impact of Observations on Analyses Derived from Observing System Experiments. Mon. Weather Rev. 2012, 140, 245–257. [Google Scholar] [CrossRef]
- Bouttier, F.; Kelly, G. Observing-System Experiments in the ECMWF 4D-Var Data Assimilation System. Q. J. R. Meteorol. Soc. 2001, 127, 1469–1488. [Google Scholar] [CrossRef]
- McNally, T.; Bonavita, M.; Thépaut, J.-N. The Role of Satellite Data in the Forecasting of Hurricane Sandy. Mon. Weather Rev. 2014, 142, 634–646. [Google Scholar] [CrossRef]
- Kelly, G.; Thépaut, J.-N.; Buizza, R.; Cardinali, C. The Value of Observations. I: Data Denial Experiments for the Atlantic and the Pacific. Q. J. R. Meteorol. Soc. 2007, 133, 1803–1815. [Google Scholar] [CrossRef]
- Zapotocny, T.H.; Jung, J.A.; Marshall, J.F.L.; Treadon, R.E. A Two-Season Impact Study of Four Satellite Data Types and Rawinsonde Data in the NCEP Global Data Assimilation System. Weather Forecast. 2008, 23, 80–100. [Google Scholar] [CrossRef]
- Yamaguchi, M.; Iriguchi, T.; Nakazawa, T.; Wu, C.-C. An Observing System Experiment for Typhoon Conson (2004) Using a Singular Vector Method and DOTSTAR Data. Mon. Weather Rev. 2009, 137, 2801–2816. [Google Scholar] [CrossRef]
- James, E.P.; Benjamin, S.G. Observation System Experiments with the Hourly Updating Rapid Refresh Model Using GSI Hybrid Ensemble–Variational Data Assimilation. Mon. Weather Rev. 2017, 145, 2897–2918. [Google Scholar] [CrossRef]
- Joo, S.; Eyre, J.; Marriott, R. The Impact of MetOp and Other Satellite Data within the Met Office Global NWP System Using an Adjoint-Based Sensitivity Method. Mon. Weather Rev. 2013, 141, 3331–3342. [Google Scholar] [CrossRef]
- Baker, N.L.; Daley, R. Observation and Background Adjoint Sensitivity in the Adaptive Observation-Targeting Problem. Q. J. R. Meteorol. Soc. 2000, 126, 1431–1454. [Google Scholar] [CrossRef]
- Langland, R.H.; Baker, N.L. Estimation of Observation Impact Using the NRL Atmospheric Variational Data Assimilation Adjoint System. Tellus A Dyn. Meteorol. Oceanogr. 2004, 56, 189. [Google Scholar] [CrossRef]
- Lorenc, A.C.; Marriott, R.T. Forecast Sensitivity to Observations in the Met Office Global Numerical Weather Prediction System: Forecast Sensitivity to Observations. Q. J. R. Meteorol. Soc. 2014, 140, 209–224. [Google Scholar] [CrossRef]
- Liu, J.; Kalnay, E. Estimating Observation Impact without Adjoint Model in an Ensemble Kalman Filter. Q. J. R. Meteorol. Soc. 2008, 134, 1327–1335. [Google Scholar] [CrossRef]
- Cardinali, C. Monitoring the Observation Impact on the Short-Range Forecast. Q. J. R. Meteorol. Soc. 2009, 135, 239–250. [Google Scholar] [CrossRef]
- Gelaro, R.; Langland, R.H.; Pellerin, S.; Todling, R. The THORPEX Observation Impact Intercomparison Experiment. Mon. Weather Rev. 2010, 138, 4009–4025. [Google Scholar] [CrossRef]
- Kalnay, E.; Ota, Y.; Miyoshi, T.; Liu, J. A Simpler Formulation of Forecast Sensitivity to Observations: Application to Ensemble Kalman Filters. Tellus A Dyn. Meteorol. Oceanogr. 2012, 64, 18462. [Google Scholar] [CrossRef]
- Todling, R. Comparing Two Approaches for Assessing Observation Impact. Mon. Weather Rev. 2013, 141, 1484–1505. [Google Scholar] [CrossRef]
- Ota, Y.; Derber, J.C.; Kalnay, E.; Miyoshi, T. Ensemble-Based Observation Impact Estimates Using the NCEP GFS. Tellus A Dyn. Meteorol. Oceanogr. 2013, 65, 20038. [Google Scholar] [CrossRef]
- Ishibashi, T. Adjoint-Based Observation Impact Estimation with Direct Verification Using Forward Calculation. Mon. Weather Rev. 2018, 146, 2837–2858. [Google Scholar] [CrossRef]
- Kim, S.-M.; Kim, H.M. Forecast Sensitivity Observation Impact in the 4DVAR and Hybrid-4DVAR Data Assimilation Systems. J. Atmos. Ocean. Technol. 2019, 36, 1563–1575. [Google Scholar] [CrossRef]
- Cardinali, C. Forecast Sensitivity Observation Impact with an Observation-Only Based Objective Function. Q. J. R. Meteorol. Soc. 2018, 144, 2089–2098. [Google Scholar] [CrossRef]
- Daescu, D.N.; Todling, R. Adjoint Sensitivity of the Model Forecast to Data Assimilation System Error Covariance Parameters. Q. J. R. Meteorol. Soc. 2010, 136, 2000–2012. [Google Scholar] [CrossRef]
- Cucurull, L.; Anthes, R.A. Impact of Infrared, Microwave, and Radio Occultation Satellite Observations on Operational Numerical Weather Prediction. Mon. Weather Rev. 2014, 142, 4164–4186. [Google Scholar] [CrossRef]
- Jung, B.-J.; Kim, H.M.; Auligné, T.; Zhang, X.; Zhang, X.; Huang, X.-Y. Adjoint-Derived Observation Impact Using WRF in the Western North Pacific. Mon. Weather Rev. 2013, 141, 4080–4097. [Google Scholar] [CrossRef]
- Zhang, L.; Gong, J.; Wang, R. Diagnostic Analysis of Various Observation Impacts in the 3DVAR Assimilation System of Global GRAPES. Mon. Weather Rev. 2018, 146, 3125–3142. [Google Scholar] [CrossRef]
- Gelaro, R.; Zhu, Y. Examination of Observation Impacts Derived from Observing System Experiments (OSEs) and Adjoint Models. Tellus A 2009, 61, 179–193. [Google Scholar] [CrossRef]
- Zhang, X.; Wang, H.; Huang, X.-Y.; Gao, F.; Jacobs, N. Using Adjoint-Based Forecast Sensitivity Method to Evaluate TAMDAR Data Impacts on Regional Forecasts. Adv. Meteorol. 2015, 427616. [Google Scholar] [CrossRef]
- Daescu, D.N.; Todling, R. Adjoint Estimation of the Variation in Model Functional Output Due to the Assimilation of Data. Mon. Weather Rev. 2009, 137, 1705–1716. [Google Scholar] [CrossRef]
- Gelaro, R.; Zhu, Y.; Errico, R.M. Examination of Various-Order Adjoint-Based Approximations of Observation Impact. Meteorol. Z. 2007, 16, 685–692. [Google Scholar] [CrossRef]
- Barker, D.M.; Huang, W.; Guo, Y.-R.; Bourgeois, A.J.; Xiao, Q.N. A Three-Dimensional Variational Data Assimilation System for MM5: Implementation and Initial Results. Mon. Weather Rev. 2004, 132, 897–914. [Google Scholar] [CrossRef]
- Chen, M.; Fan, S.; Zhong, J.; Huang, X.; Guo, Y.-R.; Wang, W.; Wang, Y.; Kuo, B. A WRF-Based Rapid Updating Cycling Forecast System of BMB and Its Performance during the Summer and Olympic Games in WMO Symposium on Nowcasting; WMO: Whistler, BC, Canada, 2008; Volume 30. [Google Scholar]
- Chen, M.; Huang, X.-Y.; Wang, W. The WRF-Based Incremental Analysis Updates and Its Implementation in an Hourly Cycling Data Assimilation System. Weather Forecast. 2023, 38, 1063–1078. [Google Scholar] [CrossRef]
- Skamarock, W.C.; Klemp, J.B.; Dudhia, J.O.G.D.; Gill, D.O.; Barker, D.M.; Duda, M.G.; Huang, X.Y.; Wang, W.; Powers, J.G. A Description of the Advanced Research WRF Version 3 (No. NCAR/TN-475+STR); University Corporation for Atmospheric Research: Boulder, CO, USA, 2008. [Google Scholar] [CrossRef]
- Hong, S.-Y.; Noh, Y.; Dudhia, J. A New Vertical Diffusion Package with an Explicit Treatment of Entrainment Processes. Mon. Weather Rev. 2006, 134, 2318–2341. [Google Scholar] [CrossRef]
- Iacono, M.J.; Delamere, J.S.; Mlawer, E.J.; Shephard, M.W.; Clough, S.A.; Collins, W.D. Radiative Forcing by Long-lived Greenhouse Gases: Calculations with the AER Radiative Transfer Models. J. Geophys. Res. Atmos. 2008, 113, D13103. [Google Scholar] [CrossRef]
- Chen, F.; Dudhia, J. Coupling an Advanced Land Surface–Hydrology Model with the Penn State–NCAR MM5 Modeling System. Part I: Model Implementation and Sensitivity. Mon. Weather Rev. 2001, 129, 569–585. [Google Scholar] [CrossRef]
- Thompson, G.; Field, P.R.; Rasmussen, R.M.; Hall, W.D. Explicit Forecasts of Winter Precipitation Using an Improved Bulk Microphysics Scheme. Part II: Implementation of a New Snow Parameterization. Mon. Weather Rev. 2008, 136, 5095–5115. [Google Scholar] [CrossRef]


| Variable | u (unit: m s−1) | v (unit: m s−1) | spd (unit: m s−1) | dir (unit: °) | |
|---|---|---|---|---|---|
| Altitude (unit: m) | <1500 | 1.69 | 2.11 | 2.39 | 14.65 |
| 1500–3000 | 1.50 | 1.60 | 1.92 | 13.05 | |
| 3000–4500 | 1.63 | 1.57 | 1.91 | 11.76 | |
| 4500–6000 | 1.67 | 1.70 | 2.04 | 11.96 | |
| 6000~7500 | 1.84 | 1.95 | 2.25 | 12.48 | |
| 7500–9000 | 2.12 | 2.23 | 2.69 | 10.65 | |
| 9000~10,500 | 2.35 | 2.36 | 2.90 | 10.20 | |
| >10,500 | 3.15 | 2.41 | 4.01 | 14.06 |
| Type | Acronyms | Observational Variables | Description |
|---|---|---|---|
| Surface | Synop | u, v, T, q, Ps | Surface synoptic observation from a land station |
| Ships | u, v, T, q, Ps | Surface synoptic observation from a ship | |
| Buoy | u, v, T, q, Ps | Surface synoptic observation from a buoy | |
| Sound | u, v, T, q | Upper-level observations from a radiosonde | |
| Upper air | Profiler | u, v | Upper-air wind profile from profiler |
| Pilot | u, v | Upper-air wind profile from a pilot balloon or radiosonde | |
| Aircraft | Airep | u, v, T | Upper-air wind and temperature from aircraft |
| Experiments | Control Variables | Observation Operator | Observation Errors |
|---|---|---|---|
| CV5 | scheme | uv_scheme | Default observation errors for WRFDA |
| CV7/PRUV | scheme | uv_scheme | Default observation errors for WRFDA |
| PRSD | scheme | sd_scheme | Default observation errors for WRFDA |
| PRSD_ERR | scheme | sd_scheme | Altitude-dependent observation errors |
Disclaimer/Publisher’s Note: The statements, opinions and data contained in all publications are solely those of the individual author(s) and contributor(s) and not of MDPI and/or the editor(s). MDPI and/or the editor(s) disclaim responsibility for any injury to people or property resulting from any ideas, methods, instructions or products referred to in the content. |
© 2024 by the authors. Licensee MDPI, Basel, Switzerland. This article is an open access article distributed under the terms and conditions of the Creative Commons Attribution (CC BY) license (https://creativecommons.org/licenses/by/4.0/).
Share and Cite
Wang, C.; Huang, X.-Y.; Chen, M.; Chen, Y.; Zhong, J.; Yin, J. Using Adjoint-Based Forecast Sensitivity to Observation to Evaluate a Wind Profiler Data Assimilation Strategy and the Impact of Data on Short-Term Forecasts. Remote Sens. 2024, 16, 3964. https://doi.org/10.3390/rs16213964
Wang C, Huang X-Y, Chen M, Chen Y, Zhong J, Yin J. Using Adjoint-Based Forecast Sensitivity to Observation to Evaluate a Wind Profiler Data Assimilation Strategy and the Impact of Data on Short-Term Forecasts. Remote Sensing. 2024; 16(21):3964. https://doi.org/10.3390/rs16213964
Chicago/Turabian StyleWang, Cheng, Xiang-Yu Huang, Min Chen, Yaodeng Chen, Jiqin Zhong, and Jian Yin. 2024. "Using Adjoint-Based Forecast Sensitivity to Observation to Evaluate a Wind Profiler Data Assimilation Strategy and the Impact of Data on Short-Term Forecasts" Remote Sensing 16, no. 21: 3964. https://doi.org/10.3390/rs16213964
APA StyleWang, C., Huang, X.-Y., Chen, M., Chen, Y., Zhong, J., & Yin, J. (2024). Using Adjoint-Based Forecast Sensitivity to Observation to Evaluate a Wind Profiler Data Assimilation Strategy and the Impact of Data on Short-Term Forecasts. Remote Sensing, 16(21), 3964. https://doi.org/10.3390/rs16213964