Abstract
Anomaly detection in hyperspectral imaging is crucial for remote sensing, driving the development of numerous algorithms. However, systematic studies reveal a dichotomy where algorithms generally excel at either detecting anomalies in specific datasets or generalizing across heterogeneous datasets (i.e., lack adaptability). A key source of this dichotomy may center on the singular and like biases frequently employed by existing algorithms. Current research lacks experimentation into how integrating insights from diverse biases might counteract problems in singularly biased approaches. Addressing this gap, we propose stacking-based ensemble learning for hyperspectral anomaly detection (SELHAD). SELHAD introduces the integration of hyperspectral anomaly detection algorithms with diverse biases (e.g., Gaussian, density, partition) into a singular ensemble learning model and learns the factor to which each bias should contribute so anomaly detection performance is optimized. Additionally, it introduces bootstrapping strategies into hyperspectral anomaly detection algorithms to further increase robustness. We focused on five representative algorithms embodying common biases in hyperspectral anomaly detection and demonstrated how they result in the previously highlighted dichotomy. Subsequently, we demonstrated how SELHAD learns the interplay between these biases, enabling their collaborative utilization. In doing so, SELHAD transcends the limitations inherent in individual biases, thereby alleviating the dichotomy and advancing toward more adaptable solutions.
1. Introduction
Hyperspectral anomaly detection (HAD) is a key area of research in remote sensing with a history spanning multiple decades [1]. Over this time span, many algorithms have emerged, each designed to address challenges inherent in identifying anomalies within hyperspectral images. This undertaking is far from simple, given the dynamic nature of the datasets, which profoundly influence the optimal modeling of hyperspectral data. Factors such as the quantity, range in size, and spatial distribution of targets wield significant influence over complexity. Furthermore, nuances like spatial resolution, spectral band count, number of anomalous spectral signatures, and external factors such as time of day or instrument calibration exert additional influence on both target and background complexity. The multifaceted nature of hyperspectral data underscores the array of challenges encountered, driving the continued prolificacy of HAD algorithms.
While many algorithms have been developed to address the unique challenges posed by different datasets, there is a growing recognition of the need for algorithms that exhibit consistent performance across a wide range of instances, i.e., adaptable algorithms [2]. Impartial studies, which have evaluated large numbers of algorithms across diverse sets of hyperspectral data, reveal that no single algorithm typically outperforms others consistently in identifying anomalies across a significant number of datasets. For instance, in a comprehensive study [3], none of the 12 assessed diverse HAD algorithms demonstrated superior anomaly detection performance across multiple datasets. Moreover, in all cases except one, the optimal performance varied depending on the metric used. Similarly, Ref. [4] compared 22 HAD algorithms and found that while one algorithm showed superior performance on six out of 17 datasets, double that of the next best-performing algorithm, a different algorithm exhibited the best mean and median performance across the datasets, highlighting a dichotomy between performance and generalizability in HAD algorithms. These findings underscore the persistent challenge of accurately modeling the diverse distributions present in hyperspectral data, where algorithms tend to excel on specific datasets or demonstrate good generalization across multiple datasets but not both.
The approaches from which the above-mentioned algorithms originate provide some context into this problem. Surveys for HAD algorithms consistently highlight that most of the algorithms stem from what can be collectively identified as statistical, machine learning, linear algebra, clustering, or reconstruction-based methods [2,3,5,6]. As such, many of these algorithms share biases (e.g., Gaussian, linear, hyperspherical) about the nature of the data. However, due to the complex nature of hyperspectral data, biases that define one dataset well are unlikely to equally define another dataset, and biases that would work well on either image are likely to compromise performance on both, hence identifying a potential root of the dichotomous performance between algorithms. This implies that the complexity of the biases needs to align with the complexity of the data to prevent underfitting or overfitting. Hence, any one bias is unlikely to perform well universally across a sufficiently diverse set of datasets.
A potential research direction to address the aforementioned issues is evaluating the impact of different biases on HAD performance, which is ensemble learning. Ensemble learning provides a means by which to employ multiple biases at once to enhance the benefits and attenuate the limitations of each. Despite the development of some forms of ensemble learning for HAD, only one study [7] incorporates more than a singular type of bias. Notably absent from existing research are examinations of prominent ensemble learning techniques like stacking and soft voting-based methods within the context of HAD. Consequently, a systematic evaluation of major ensemble learning methods applicable to HAD remains absent in the current literature. Given the potential implications of biases on the adaptability of algorithms for HAD, this represents an important area warranting further investigation.
To this end, we propose stacking-based ensemble learning for hyperspectral anomaly detection (SELHAD). SELHAD introduces the integration of HAD algorithms with diverse biases (e.g., Gaussian, density, partition) into a singular ensemble learning model and learns the factor to which each bias should contribute so anomaly detection performance is optimized. In this paper, this methodology is rigorously assessed across 14 distinct datasets, contrasting its efficacy against alternative ensemble learning approaches such as soft voting, hard voting, joint probability, and bagging-based [7,8] methods in the context of HAD. Furnished through this comprehensive evaluation is a systematic comparison of SELHAD’s performance against both individual HAD algorithms and other prominent ensemble learning techniques applicable to HAD scenarios.
The primary contribution of this work is the integration of algorithmic adaptability into HAD. The proposed algorithm, SELHAD, learns the unique magnitude of contribution each base learning should optimally apply toward scoring spectral signatures in each dataset. This adaptability allows for the dynamic utilization of multiple diverse algorithms simultaneously, which is novel among existing HAD algorithms. SELHAD amplifies the strengths and mitigates the weaknesses of existing HAD algorithms. This solves the problem of the dichotomy between performance and generalizability in existing algorithms as SELHAD enhances both through the integration strategies it dynamically learns.
The rest of this paper is organized as follows. Section 2 introduces background information and related works. Section 3 lays out the architecture for the methods utilized in this paper. Section 4 provides details for the experimental design. Section 5 presents the results obtained from the experiments. Section 6 provides analyses and explanations of the results obtained by the experiments. Section 7 closes the paper with a summary and concluding remarks about the study.
2. Background and Related Works
2.1. Biases in Hyperspectral Anomaly Detection Algorithms
Gaussian, hyperspherical, partition, density, and reconstruction are among the predominant biases implemented in statistical, machine learning, clustering, and reconstruction-based HAD algorithms, as discussed in Section 1. Each bias represents a trade-off between how complex the data are assumed to be and variations in models produced from different subsets of the data. Consequently, even in instances where a singular bias dominates, existing bagging-based ensemble algorithms for HAD have demonstrated efficacy. However, the selection of biases requires careful consideration. As biases inherently shape the algorithm’s perception of the data, their careful selection must be managed to ensure a balanced representation of the underlying data complexity and to avoid potential model distortions.
All five biases originate from well-known algorithms for HAD. The Gaussian-based bias originates from the RX algorithm [1]. Subsequent adaptations of the RX algorithm include the projection of the data into different subspaces [9,10,11] or latent representation [12] using autoencoder-based frameworks. Hypersphere-based biases originate from methods to encapsulate as many spectral signatures as possible from a hyperspectral dataset within as tight of boundaries as possible [13,14,15] while projected into different kernel spaces. Recent implementations also use autoencoders to first produce latent representation-based projections [16]. Partition-biased methods generate multiple models that each perform multiple recursive divisions of the data. Spectral signatures divided from the dataset earlier in the recursive process in each model are considered anomalies. The results are aggregated across all models to produce the final results [17,18,19]. Density-based biases cluster spectral signatures based on where they are most densely populated in their original space or projected spaces. Projections include the use of kernel and latent representation subspaces like the other biases mentioned previously. Anomalies are the spectral signatures that deviate most from their assigned cluster(s) [17,18,19]. Reconstructive-based biases employ autoencoder [20,21] and generative adversarial network-based [22,23] approaches to attempt to reconstruct the original spectral signatures. Spectral signatures that are poorly reconstructed are considered anomalies.
2.2. Ensemble Learning in Hyperspectral Anomaly Detection
The current landscape of ensemble learning-based algorithms for HAD can be categorized into three primary approaches: random forest, bagging, and hard voting-based methods. Random forest-based approaches predominantly employ isolation forests for ensembling. An isolation forest is an ensemble of isolation trees. Therefore, work that utilizes this method builds an ensemble of isolation trees and amalgamates their outputs to assess the likelihood of spectral signatures within the dataset being anomalous [18,24].
In bagging-based ensemble learning approaches, multiple models are generated by utilizing bootstrapped or randomly subsampled segments of the data. Each bootstrap or subsample serves as the basis for creating a new model, which can stem from either identical or diverse learning methodologies. The final assessment of the likelihood of each spectral signature being anomalous is determined by passing the original dataset through all the generated models and aggregating their outputs. The existing literature solely employs random subsampled segments of the data and relies on singular learning methodologies for the base learners [8,15,25,26].
Hard voting-based ensemble learning approaches stand apart from other ensemble learning methods for HAD in several respects. Firstly, they render binary predictions, indicating whether each spectral signature constitutes an anomaly rather than offering a likelihood estimation. Additionally, hard voting is currently the only ensemble learning method for HAD, where a non-uniform set of base learners has been utilized. Within this ensemble learning framework, predictions for each spectral signature’s anomaly status are collected from each base learner, and the mode of these predictions is computed to determine the final anomaly prediction for each signature [7,27].
3. Methods
3.1. SELHAD Overview
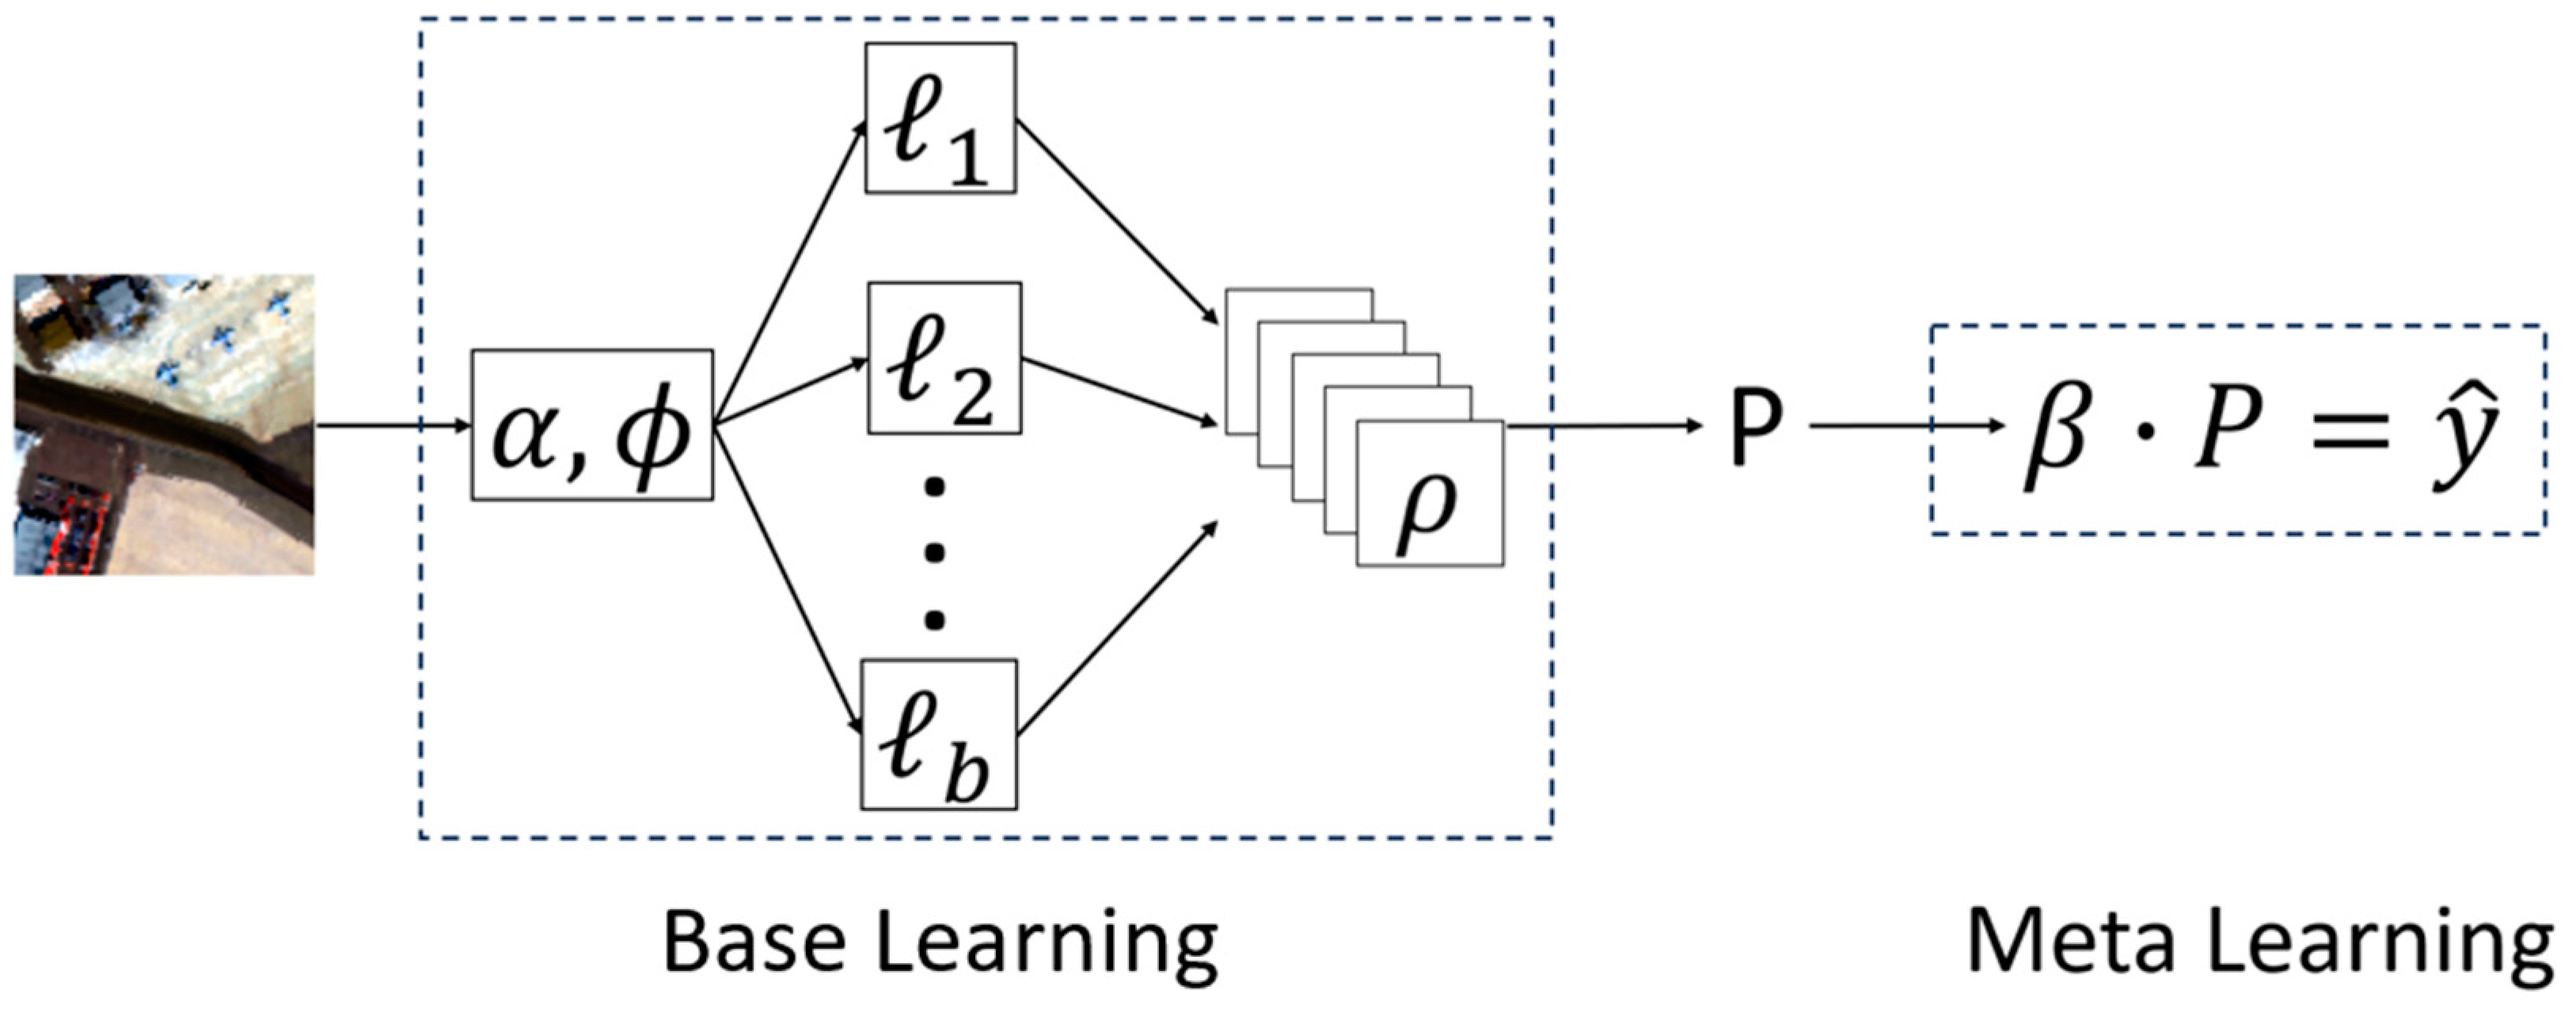
SELHAD is composed of two phases, a base-learning phase and a meta-learning phase (Figure 1). The objective of the base learning phase is to collect the predictions from each of the different HAD algorithms for input into the meta-learning phase. The objective of the meta-learning phase is to adaptively learn the level of contribution each of the collected results should make toward the final predictions produced by SELHAD. As noted in the introduction, this is novel as no existing HAD algorithms have considered dynamically learning the application of multiple diverse HAD algorithms simultaneously. This dynamic integration enhances performance and generalizability, solving the problem of the dichotomy between performance and generalizability between existing HAD algorithms. The base learning phase is composed of a set of b base learners from ℓ1 to ℓb. A dataset is passed into the base learners multiple times, each time with slightly different augmentations α applied to the dataset and hyperparameters φ supplied to the base learners. Like bootstrapping, this produces multiple slightly perturbed representations of the data. Each pass of the dataset into the base learners produces a set of anomaly probability matrices ρ, where each matrix in ρ corresponds to the anomaly probabilities produced by one of the base learners. P contains all the generated ρ outcomes. Then, in the meta-learning phase, a vector β, which contains the factor of contribution each base learner should optimally have toward the final anomaly probability predictions for a given dataset, is learned through a gradient descent-based process. To compute the anomaly probability predictions, the learned β is broadcasted onto P.
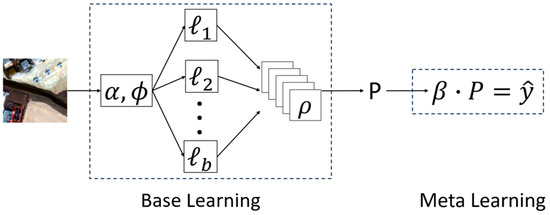
Figure 1.
SELHAD architecture.
The complete SELHAD process can additionally be observed in Algorithm 1. This process begins with nested loops to collect all the base learner predictions ρ and place them in a set P by iterating over all α augmentations in the set A and all φ parameters in the set G to produce and passing them through the set of base learners ℓ in L. Once this is complete, the meta-learning phase is performed over E epochs of learning. In this phase, the learning vector β is broadcast onto P to produce the final spectral signature predictions ŷ. These predictions are evaluated using a mean squared error loss. Then, the loss with respect to β, tempered by a tuning parameter λ, is computed and used to update β. Learning is continued until convergence or the number of epochs is exceeded. Further details about the operations are provided in Section 3.2 and Section 3.3, with equations to explicitly define the operations.
| Algorithm 1: SELHAD pseudo code |
| Input: x ← dataset with hyperspectral image A ← hyperspectral image augmentations G ← parameters for base learners L ← set of base learners to produce each ρ E ← number of epochs L ← loss function Β ← adaptive learner for α in A for φ in G P[ϕα] ← L(x,ϕ,α) end end for e in E ŷ ← β∙P loss ← L(y,ŷ) β = β − λ δL/δβ end |
3.2. Base Learning
The objective of the base learning phase is to produce a set P of multiple slightly perturbed (bootstrapped) anomaly probability matrices ρ for each base learner ℓ for a given dataset. The base learners are defined by the set L (Equation (1)). For each iteration in the base learning phase, a set of augmentations α from A (Equation (2)) is applied to the dataset. Augmentations include random rotation and flipping operations on the original datasets. Additionally, a set of parameters φ from G (Equation (3)) is utilized for the hyperparameters of the base learners where φi corresponds to the ith set of parameters, and ℓj corresponds to the jth base learner as each base learner has different hyperparameters. This ensures that slightly different parameters are used for the base learners toward producing each bootstrapped sampling of the data, e.g., the parameters for the second base learner on the third augmentation of the data φ3ℓ2 will be slightly different than those used on the second base learner on the fourth augmentation φ4ℓ2. Each base learner has unique parameters that include learning rates, the number of centroids, and subspace projection dimensionality, to name a few. This enables us to produce a ρ for a given α and φ pairing by passing α and φ into the set of base learners with the targeted dataset x (Equation (4)). This creates a third-order tensor ραφ that is the bootstrapped samplings for each base learner given a specific α and φ pairing, containing L matrices of height m and length n, which correspond to the height and length of the dataset. P is, therefore, the outcome of passing all permutations of A and G into the set of base learners L to produce a fourth-order tensor of G*A total ρ outcomes (Equation (5)). P, therefore, contains the bootstrapped samplings for all augmentation/parameter parings (G*A) for all base learners (L) for all spectral signatures (m*n).
3.3. Meta-Learning
The objective of the meta-learning phase is to learn a vector β that contains the factor of contribution each base learner should have toward optimizing predictions to match the outcomes y that correspond to each bootstrapped sampling. Each outcome in y is produced by applying the augmentations that were applied to each corresponding bootstrapped sampling to the original outcome. β is first initialized with random noise and is then broadcasted onto P (Equation (6)). This operation is accomplished for each ρ in P by multiplying each matrix in ρ with its corresponding element in β and summing the products together (Equation (7)). For a given ρ, this produces an m by n matrix that is the ensemble of the bootstrapped samplings of the base learners for a given α and φ. This provides the ensembled anomaly probability prediction for each spectral signature that can be compared to its corresponding outcome in y to measure performance. This definition of broadcasting enables us to expand the original broadcasting operation (Equation (6)) to define how broadcasting is performed for all A augmentation and G parameter sets within the problem space (Equation (8)). This operation produces anomaly probability predictions for all augmentation/parameter pairings that can be compared against all corresponding y outcomes. Once broadcasting is performed across all augmentation/parameter pairings, we can evaluate the performance of the ensembled anomaly probabilities for each bootstrapped sampling as the average of the squared differences between the computed anomaly probabilities and their corresponding y outcomes (Equation (9)). This is performed on a spectral signature by spectral signature (m*n) basis across all augmentation/parameter (GA) pairings. This enables the algorithm to adjust the factors in β by taking the difference between β and the product of the gradient of Equation (9) with respect to β and an update factor λ (Equation (10)). This defines the process required to complete one round of training within the meta-learning phase, and the process is repeated until the loss from Equation (9) converges or training exceeds a predefined number of iterations. Once this process is complete, the learned β vector can be used on the outcomes of the base learners with the original data and default parameters to test the performance of the ensembling approach.
4. Experiments
4.1. Datasets
The experiments in this study use datasets comprised of hyperspectral images that encompass a wide array of characteristics aimed at thoroughly assessing algorithmic performance and generalizability of SELHAD [Table 1]. These datasets exhibit considerable diversity, both in terms of image content and attributes, ensuring the introduction of multiple sources of heterogeneity. Such diversity is important in evaluating the generalizability of models, mitigating the risk of any single algorithm gaining undue advantage through the exploitation of incidental correlations that align with any one model’s biases. Uniformity across dataset contents or characteristics could inadvertently favor certain algorithms, rendering evaluations skewed.

Table 1.
Characteristics of the datasets used in the experiments.
The deliberate variation in dataset characteristics—including spatial resolutions, spectral band counts, target numbers, the mean and standard deviation of target pixels, and the percentage of anomalous pixels—plays an important role in shaping algorithmic robustness. Anomalies themselves present in varying sizes, shapes, locations, and quantities across datasets. Some datasets feature moderately sized singular anomalies, while others host as many as 60 targets with sizes between 1 and 50 pixels. Fluctuations in spatial resolutions and spectral bands additionally introduce disparities in the representation of similar objects and impact pixel counts and spectral signature lengths. These disparities present unique challenges for anomaly detection algorithms, as they must contend with distinct characteristics and quantities of anomalous pixels in each hyperspectral image, posing obstacles to achieving consistent performance across all datasets.
The content of the datasets—encompassing diverse scenes, backgrounds, and anomalies—further influences algorithmic robustness. The datasets include urban, beach, and airport-based scenes that are drawn from the HYDICE Urban, ABU-Airport, ABU-Beach, and ABU-Urban dataset repositories [28,29]. Therefore, backgrounds include airport terminals, airport runways, large bodies of water, coastlines, residential areas, and industrial areas, to name a few. Target objects span planes, cars, boats, and buildings, contingent upon the specific scene and background of a given dataset. These inherent disparities induce shifts in spectral signature distributions, rendering each dataset unique in its spectral characteristics.
4.2. Experimental Settings
The experiments have two crucial components: the sets of augmentations, denoted as A (Equation (2)), and the base learner hyperparameters, denoted as G (Equation (3)). These elements are foundational as they yield multiple similarly performing yet subtly perturbed ρ outcomes for each base learner, thereby facilitating the implementation of common image and parameter augmentation practices prevalent in computer vision. The image augmentation strategies encompass both rotation-based and flipping-based operations. Rotation operations involve rotating the dataset by 0, 90, 180, or 270 degrees around its center, while flipping-based operations entail flipping the dataset about its vertical axis. Collectively, these operations generate eight distinct sets of augmentations to be applied across the datasets. For hyperparameters, the approach varies based on the underlying base model. Principal Component Analysis (PCA) is employed in Gaussian, hypersphere, and density-biased base learners, wherein 15 to 20, 6 to 11, and 16 to 21 principal components are, respectively, selected from the original data. In contrast, for partition and reconstruction-biased base learners, algorithmic stochasticity induces slight variations in outcomes. This occurs through random variable selection in the partition-biased algorithm and random initialization of model weights in the reconstruction-biased algorithm. The combined application of augmentation techniques and hyperparameters yields multiple subtly perturbed ρ outcomes (Equation (5)) for each dataset simulating bootstrapping strategies.
For the proposed ensemble learning algorithm (SELHAD), there are two important components to establish: the threshold for loss convergence (Equation (9)) and the update factor λ (Equation (10)). Given that all inputs and outcomes for the algorithm fall within the zero to one range, it follows that a small loss convergence threshold is needed. In this study, a threshold of 1 × 10⁻¹⁰ was employed to ensure peak loss convergence was reached, aligning with the demands of precision inherent in HAD. Concurrently, an update factor λ = 0.1 was applied in this work. This proves the optimal influence of the gradient of the loss upon β (Equation (10)) to facilitate model adaptation and stability. Larger and smaller values of λ were evaluated but were consistently found to diverge or reach convergence too slowly across all datasets. Together, the loss convergence and update factors provide the key criteria needed to maximize performance and generalizability.
4.3. Comparative Ensemble Learners
To evaluate the proposed algorithm, its performance is compared against the performances of four prominent ensemble learning methods. The bagging [8] and hard voting [7] algorithms from Section 2.2 are included for comparison. Soft voting and joint probability algorithms are also implemented to cover major ensemble learning frameworks that can be used in HAD. The soft voting algorithm computes the average of the standardized predictions the base learners assign to each spectral signature. The joint probability algorithm computes the product of the standardized predictions the base learners assign to each spectral signature. This comprehensive approach allows us to ascertain the optimal performance of various ensemble learning techniques and to gauge the frequency with which ensemble methods enhance anomaly detection beyond individual HAD algorithms. Like our proposed algorithm, these additional ensemble methods leverage HAD algorithms as their base learners and derive their results from the anomaly probabilities generated by these base learners.
4.4. Base Learners
In this work, all ensemble learning methods operate by utilizing the predictive power of multiple HAD algorithms in concert. These HAD algorithms constitute the base learners for the ensemble learning methods. By amalgamating the outputs of diverse models, ensemble learning can enhance the strengths and mitigate the limitations of individual algorithms. This approach effectively addresses the varying degrees of bias complexity that can afflict standalone models, thereby bolstering overall performance and generalizability. The selection of a heterogeneous set of HAD algorithms that cover a spectrum of biases is critical to ensure that we extract as meaningful and broad of representation of the data as possible. This is the mechanism through which, ultimately, the performance and generalizability of individual HAD algorithms are improved.
To this end, we assembled a collection of HAD algorithms, each embodying one of the five bias types delineated in the background section and employing a unique implementation strategy. Algorithms were included to represent the reconstructive [30], density [31], partitioning [18], hypersphere [32], and Gaussian [10] biases. The selected base algorithms will be referred to by their bias type throughout this work to reinforce the importance of their bias diversity within the SELHAD algorithm. Each algorithm assigns a score to each spectral signature within a dataset to indicate the degree to which each spectral signature deviates from the norm compared with the other spectral signatures. A higher score indicates a greater degree of deviation and a higher likelihood of being anomalous. Once all scores for a given algorithm applied to a given dataset are calculated, those scores are standardized to each other within a range between zero and one. This is accomplished by computing the difference between each score and the minimal score in the set and then dividing the output by the difference between the maximal and minimal score in the set. The outcomes of this calculation provide an anomaly probability, i.e., a probability of each spectral signature in a given dataset being anomalous.
5. Results
Table 2 presents the AUROC scores for all the base algorithms and ensemble learning algorithms across all datasets. Base algorithms are listed on the left, while ensemble learning algorithms are listed on the right. These results highlight multiple important points regarding the performances of the base, ensemble, and SELHAD algorithms.

Table 2.
AUROC scores for all base learner and ensemble learning algorithms for all datasets.
If the base learning scores are analyzed in isolation from the ensemble learning scores, a few considerations about their performances come into focus. The base learner with the reconstruction bias performed best on more datasets than any of the other base learners, with four top performances. However, it also claimed the lowest performance among the base learners on 7 of the 14 datasets. The hypersphere-biased base learner encountered similar issues. It had top performances on 3 of the datasets and claimed the highest AUROC scores of any of the algorithms in this study (including the ensemble learning algorithms). It additionally had the lowest performance more often than any of the other base learners except the hypersphere-biased base learner. Conversely, while the Gaussian and partition-biased base learners had 3 and 1 top performances, respectively, their top scores were lower overall compared to the top scores of the reconstruction and hypersphere-biased base learners. However, neither the Gaussian nor partition-based biases had any cases where they were the lowest-performing algorithms. These differences in the quantity of highest and lowest performances provide evidence supporting the dichotomy between the base algorithms.
When the ensemble learning algorithms are included in the analysis, their impact on the dichotomy becomes evident. The ensemble algorithms assume all the top performances except for the instances where the hypersphere-biased base learner was a top performer, hence demonstrating the importance of the hypersphere-biased base learner’s top scores among all the base learning algorithms. The SELHAD algorithm was the top performer on 8 of the 14 datasets across all algorithms, double the quantity of top performance for any of the base learners. More importantly, the SELHAD, joint probability, bagging, and soft vote ensemble algorithms outperformed all the base learning algorithms 9, 5, 3, and 3 times, respectively. The ensemble algorithms (with the exception of the hard voting algorithm) additionally never had the lowest scores on any of the datasets among all the algorithms. Hence, using ensemble learning, specifically the SELHAD algorithm, improved the quantity of top performance while never making performance worse in any case. This provides empirical evidence that ensembling helps alleviate the dichotomy.
Table 3 displays the mean, standard deviation, minimum, median, and maximum of the AUROC scores attained by each algorithm across all datasets. This multifaceted analysis facilitates a thorough evaluation of the algorithms’ generalizability. Algorithms that have a higher mean or median AUROC, or lower standard deviation in AUROC scores, are better generalizers. Their performance is better across a broader range of inputs. Positioned at the top are the base learners, with the ensemble learners at the bottom.

Table 3.
AUROC statistics for each algorithm across all datasets.
Like the results in Table 2, it is important to consider the results in Table 3 both without and with the ensemble learning algorithms. When the base learners are evaluated in isolation, it is noteworthy that the partition-biased base learner assumes the best mean and standard deviation in AUROC scores, and the Gaussian-biased base leaner assumes the best median AUROC score. Comparatively, the hyperspherical and reconstruction-biased base learners had the worst mean, median, and standard deviation in AUROC scores. Therefore, the dichotomy is highlighted in Table 2 and Table 3, which directly measure performance and generalizability.
When the ensembling learning algorithms are included in the analysis, Table 3 provides further support for how ensemble learning can help mitigate the dichotomy between performance and generalizability. The SELHAD, joint probability, and bagging ensemble learning algorithms all achieve higher mean and median AUROC scores than any of the base learners. Most notably, the SELHAD algorithm had the best mean, median, and standard deviation in AUROC scores across all the algorithms. This, in addition to the top performances SELHAD achieved on eight of the 14 datasets in Table 2, provides strong empirical evidence of how SELHAD can alleviate the dichotomy between performance and generalizability over the performance of the base learners in isolation.
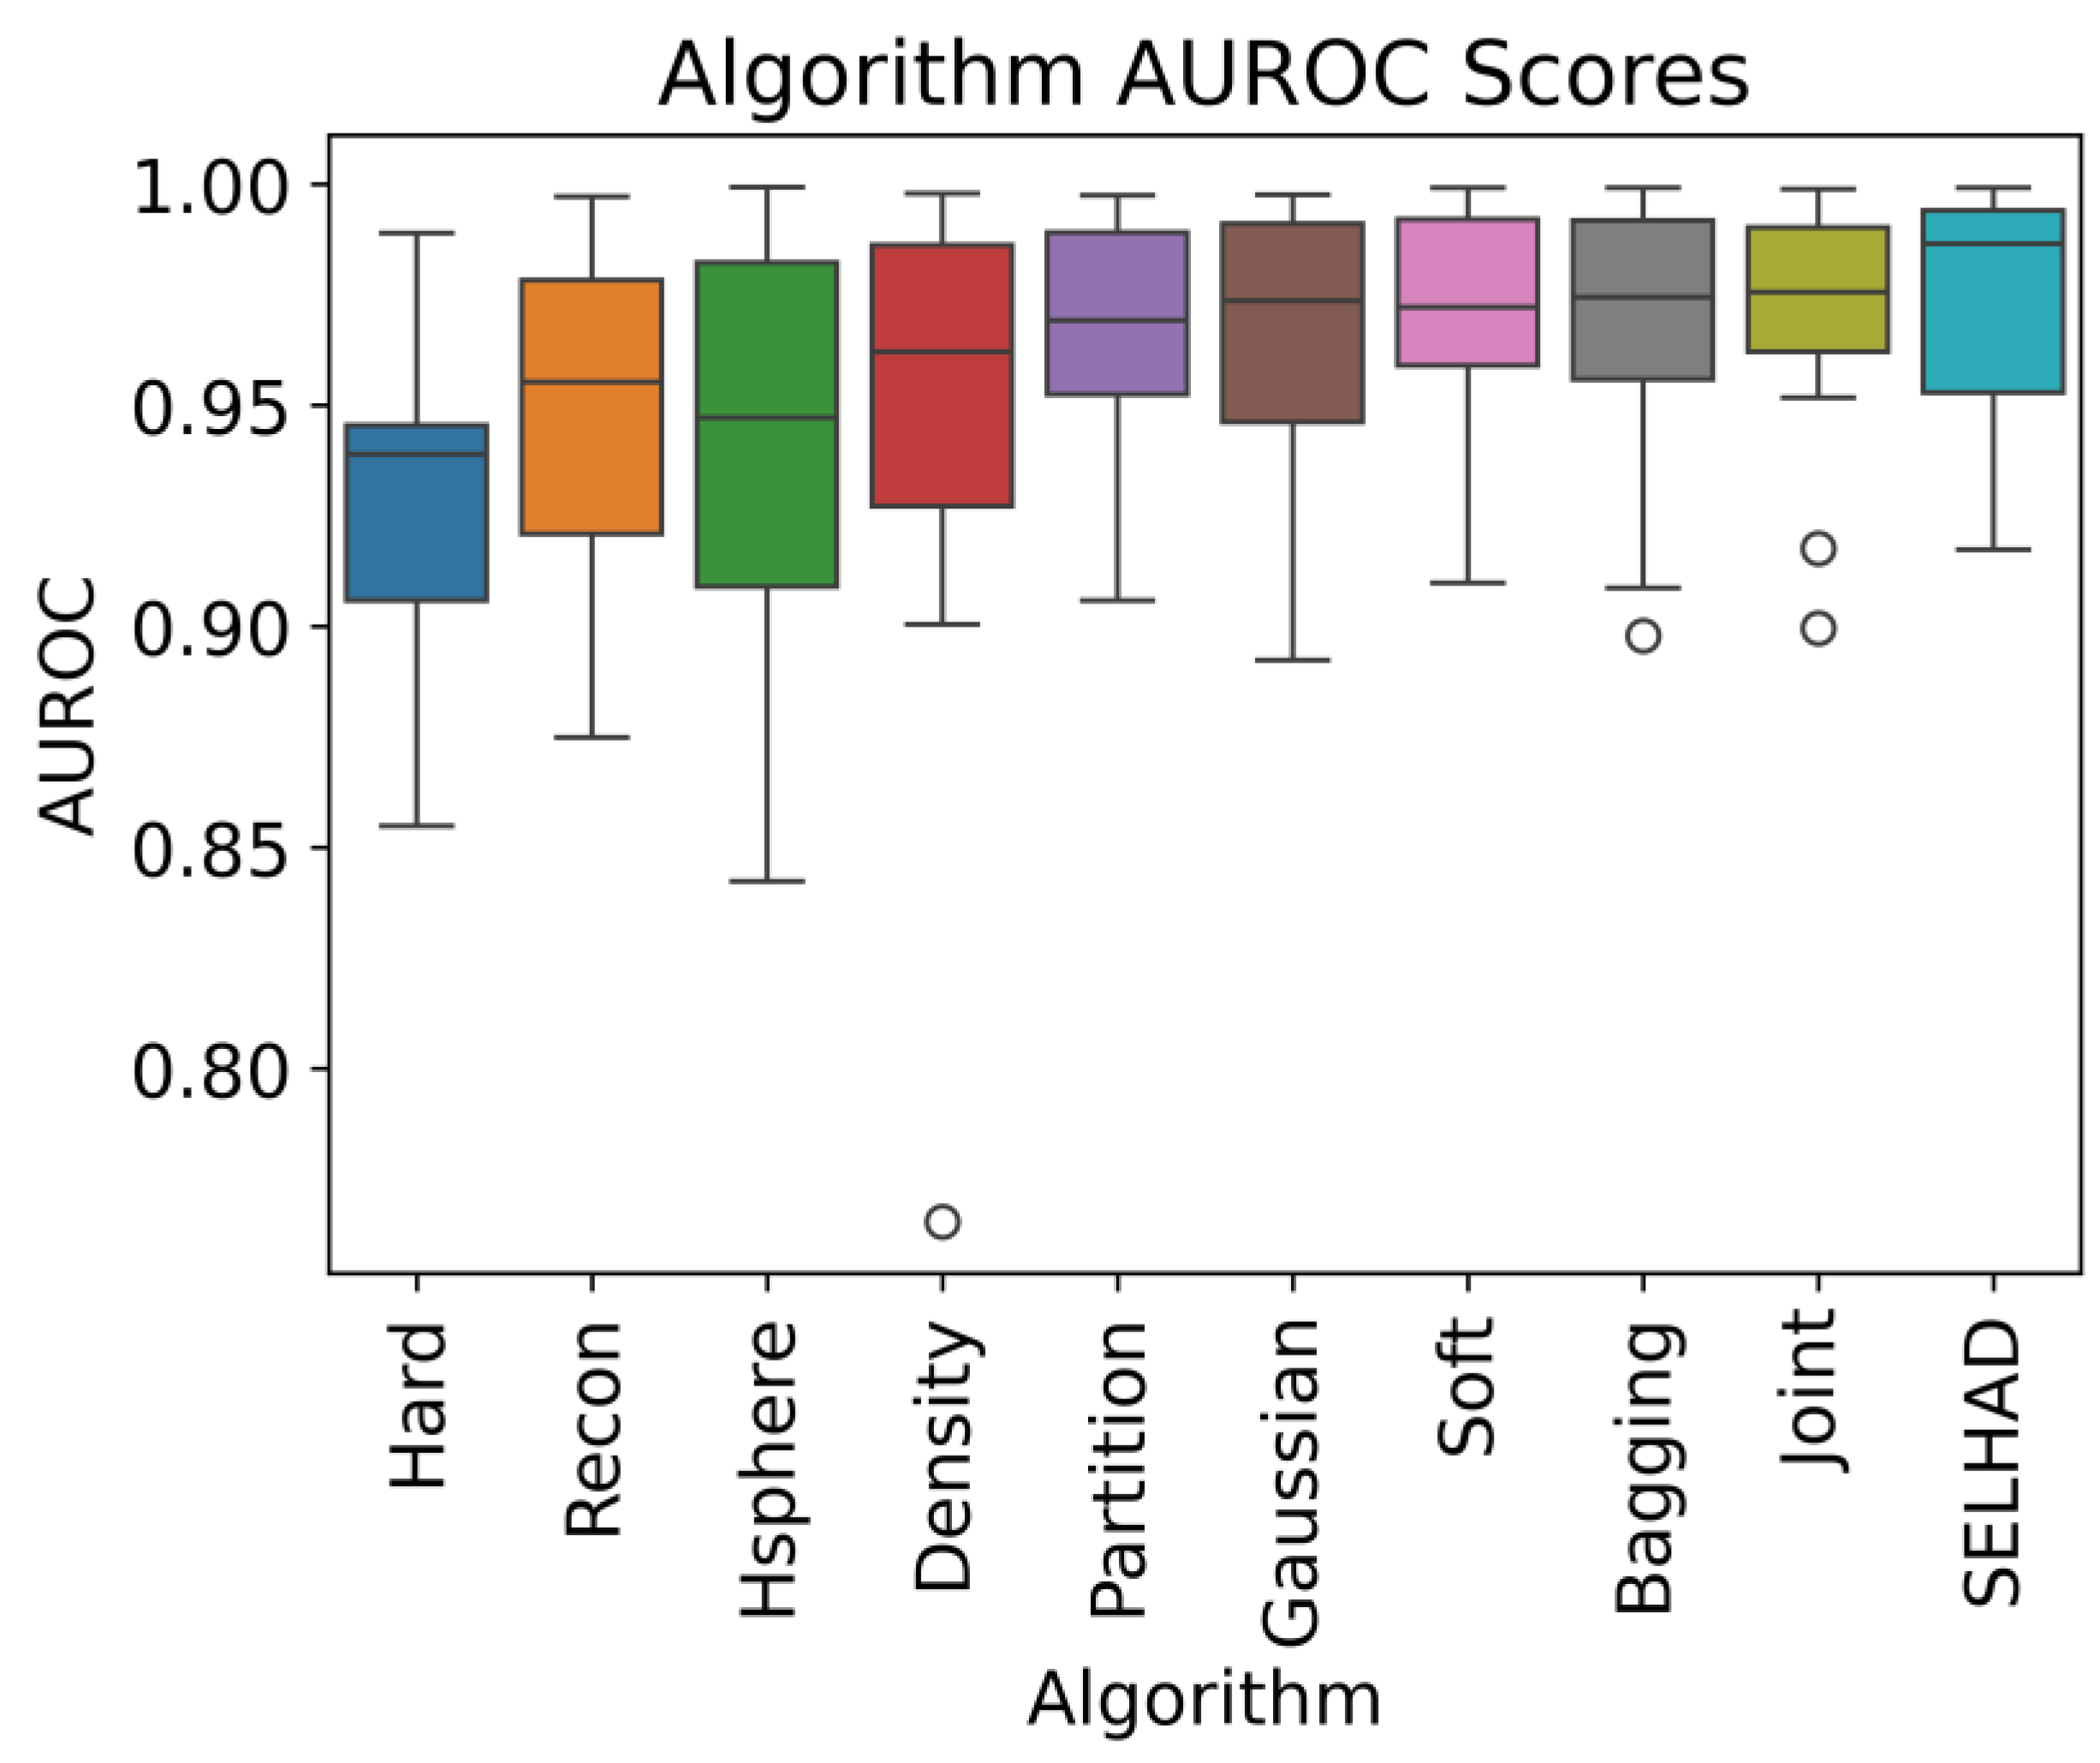
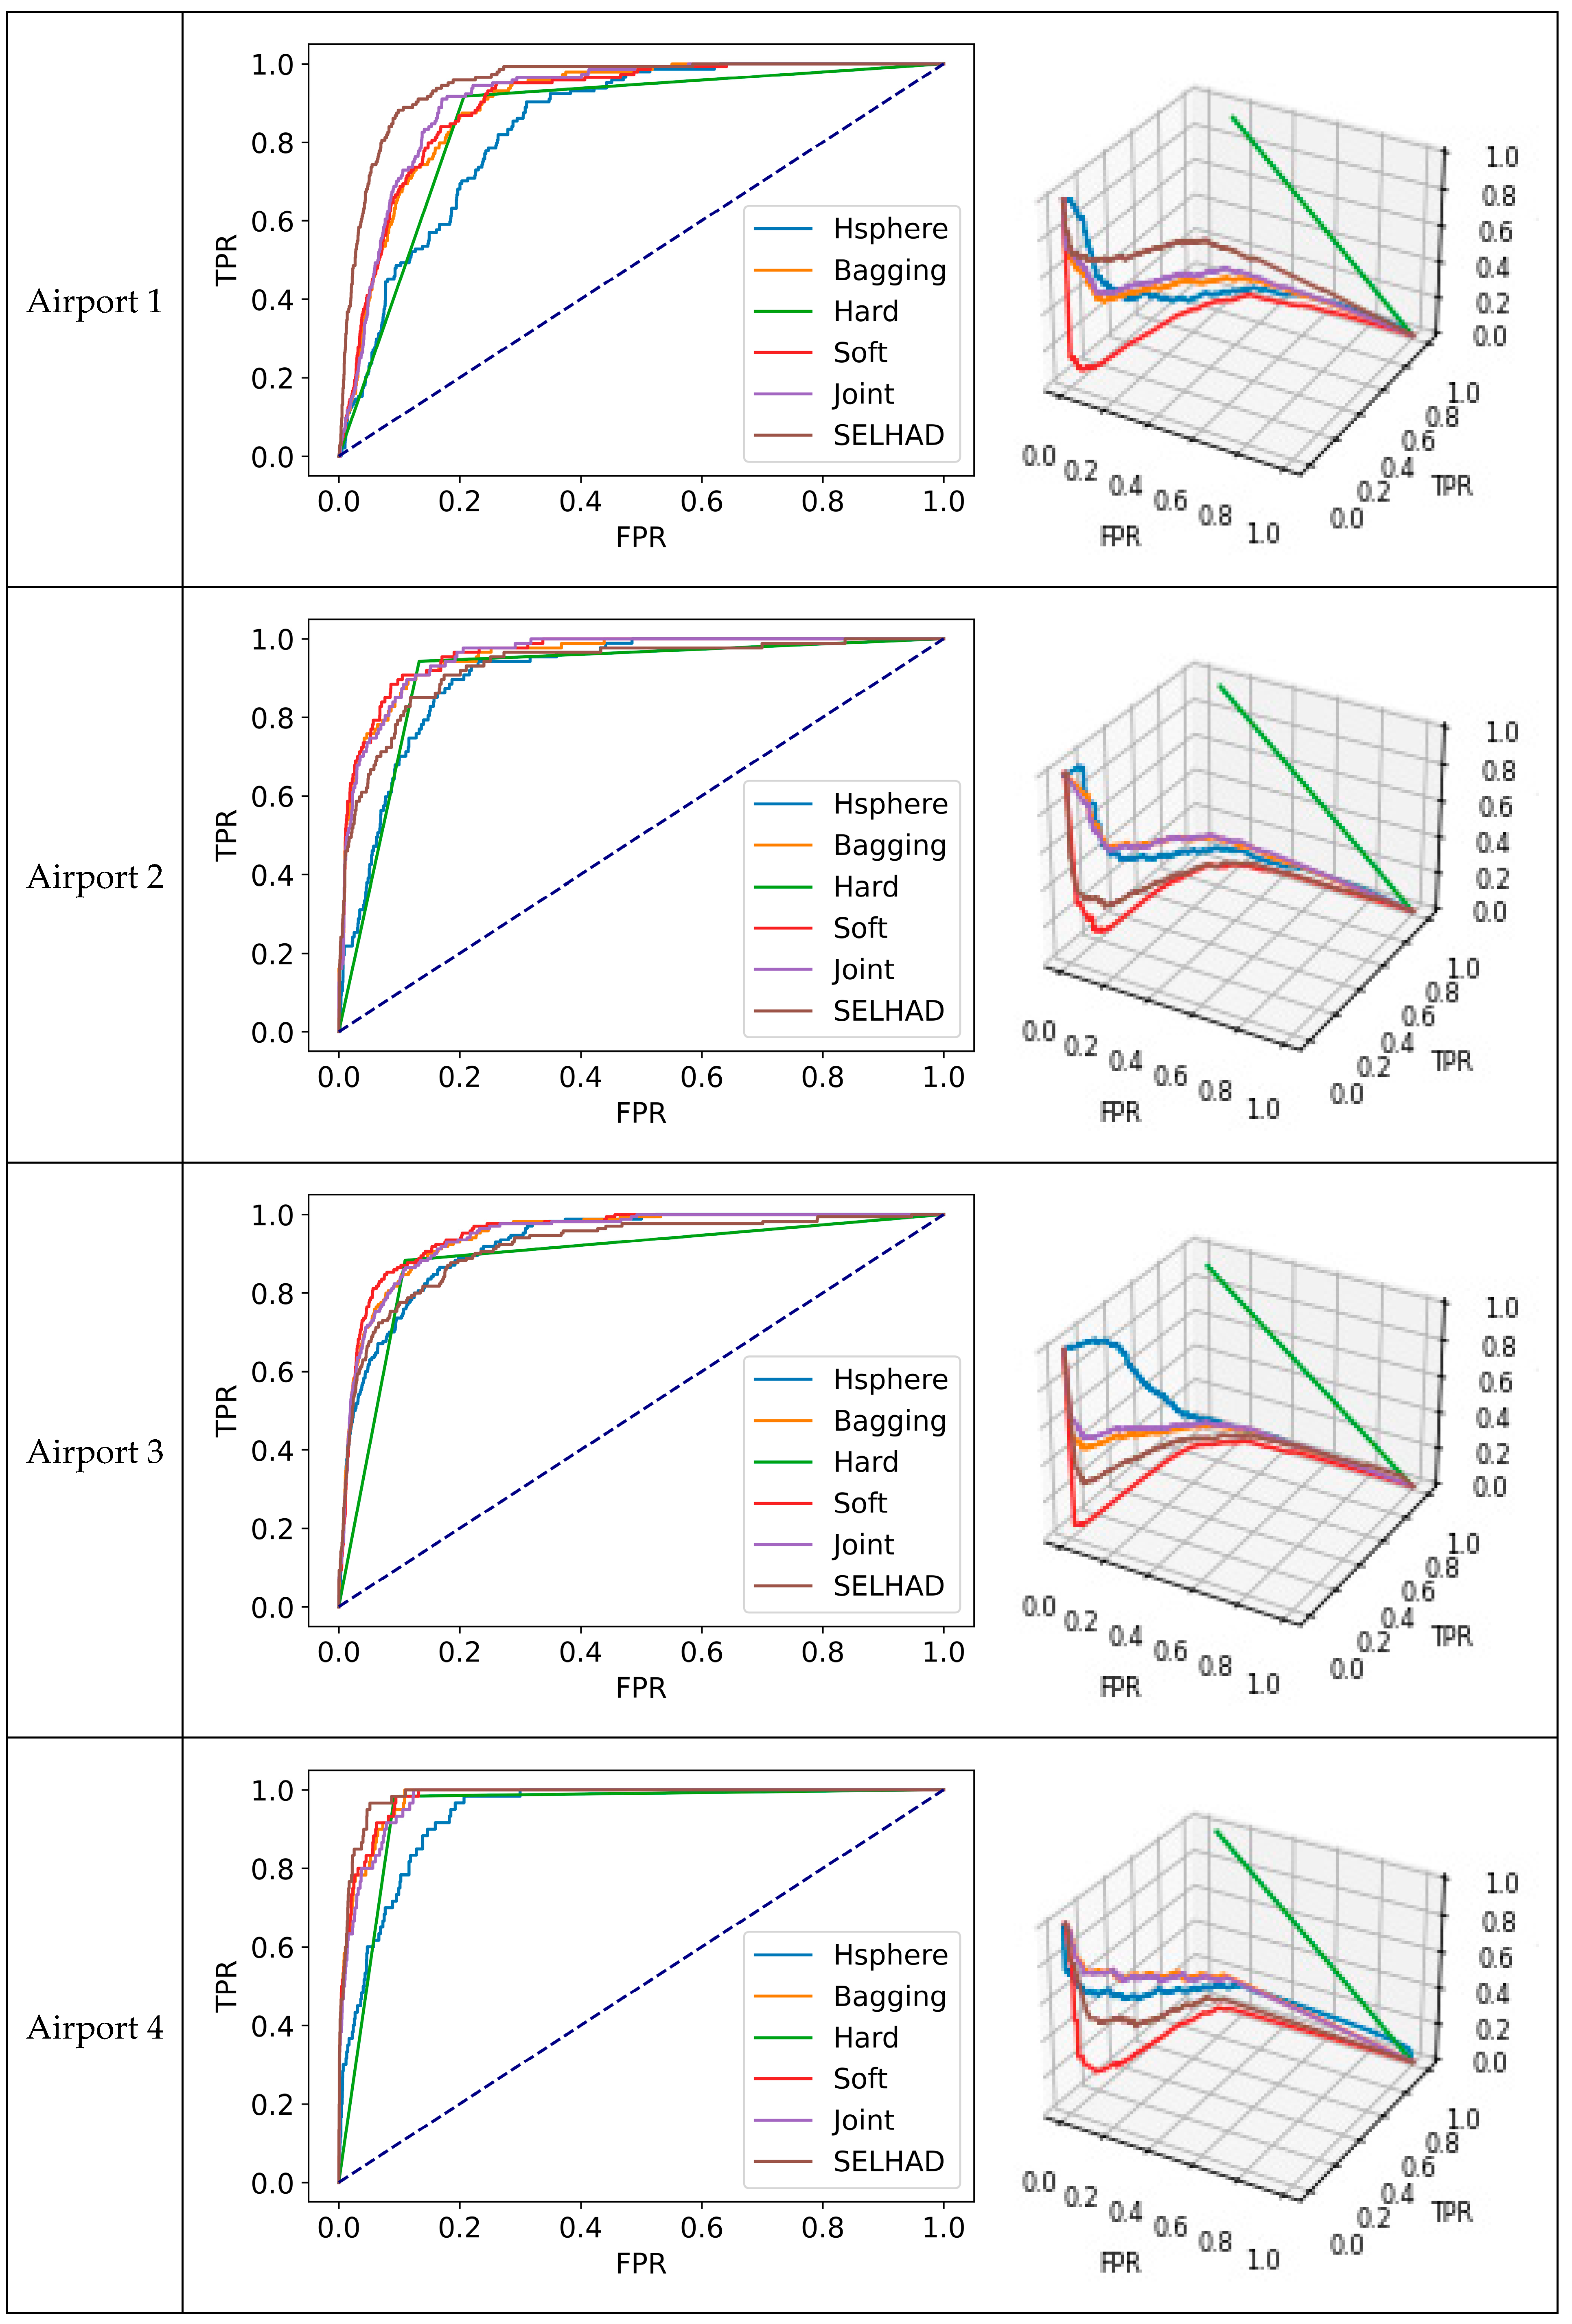
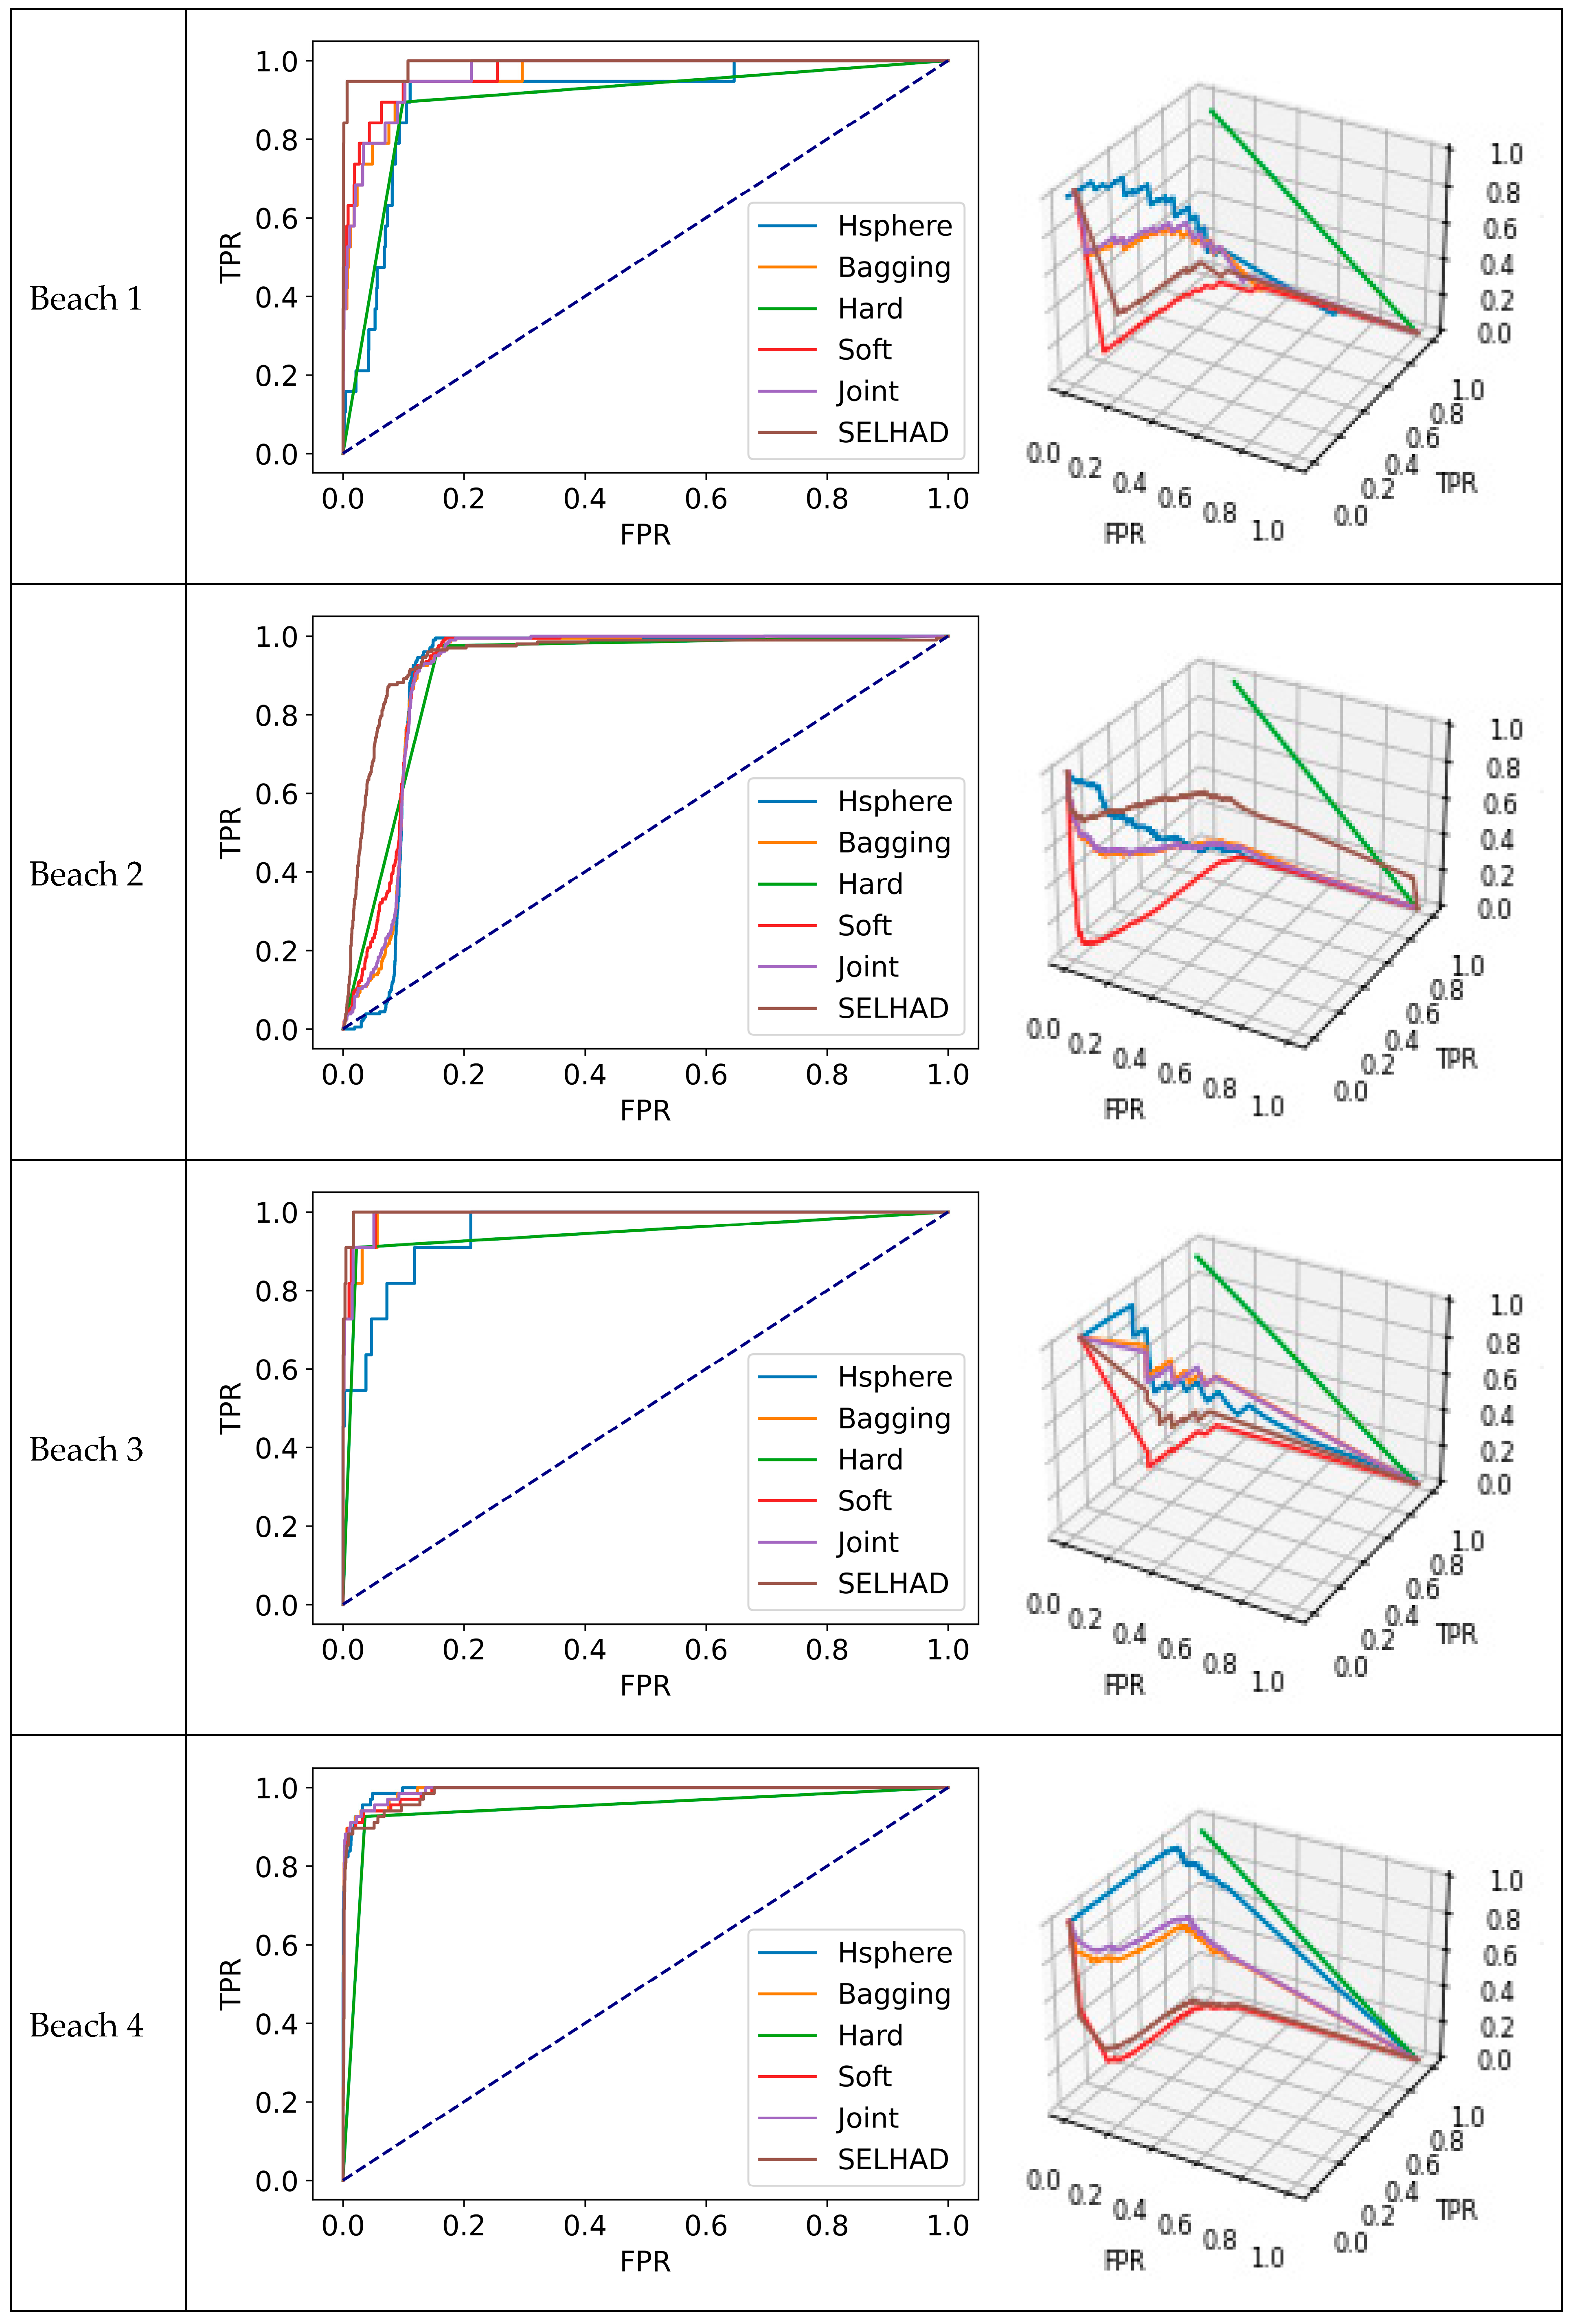
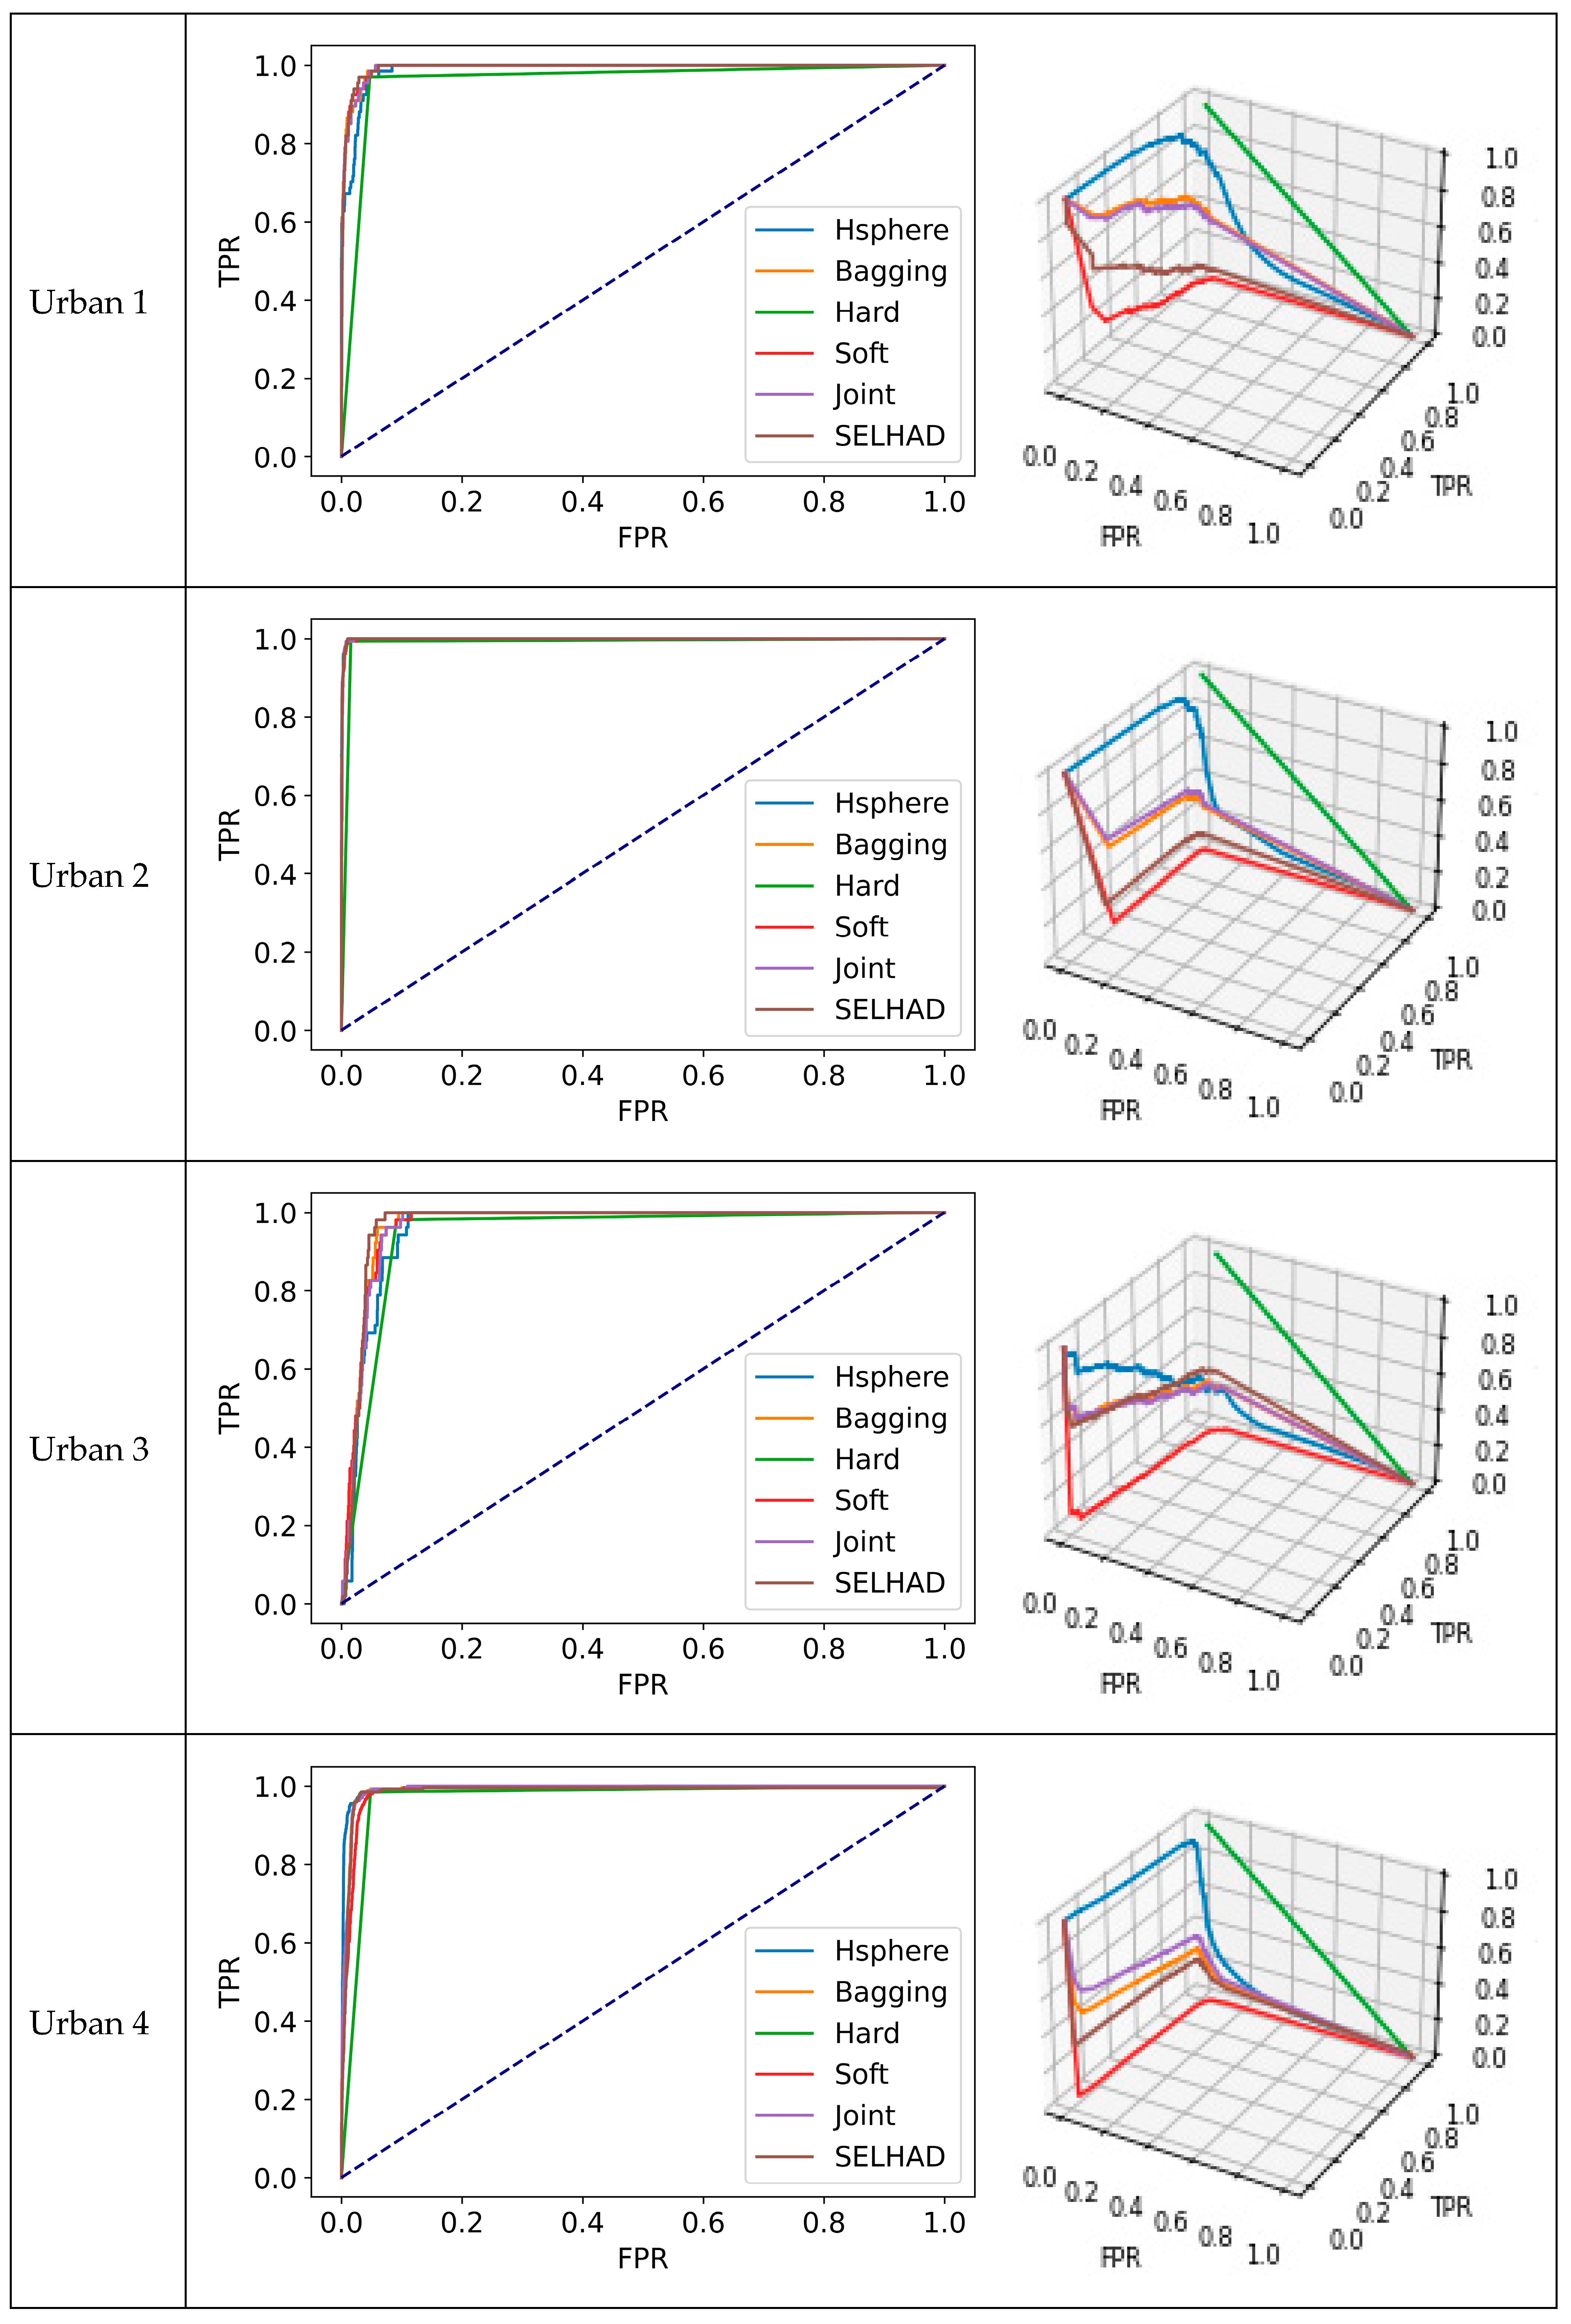
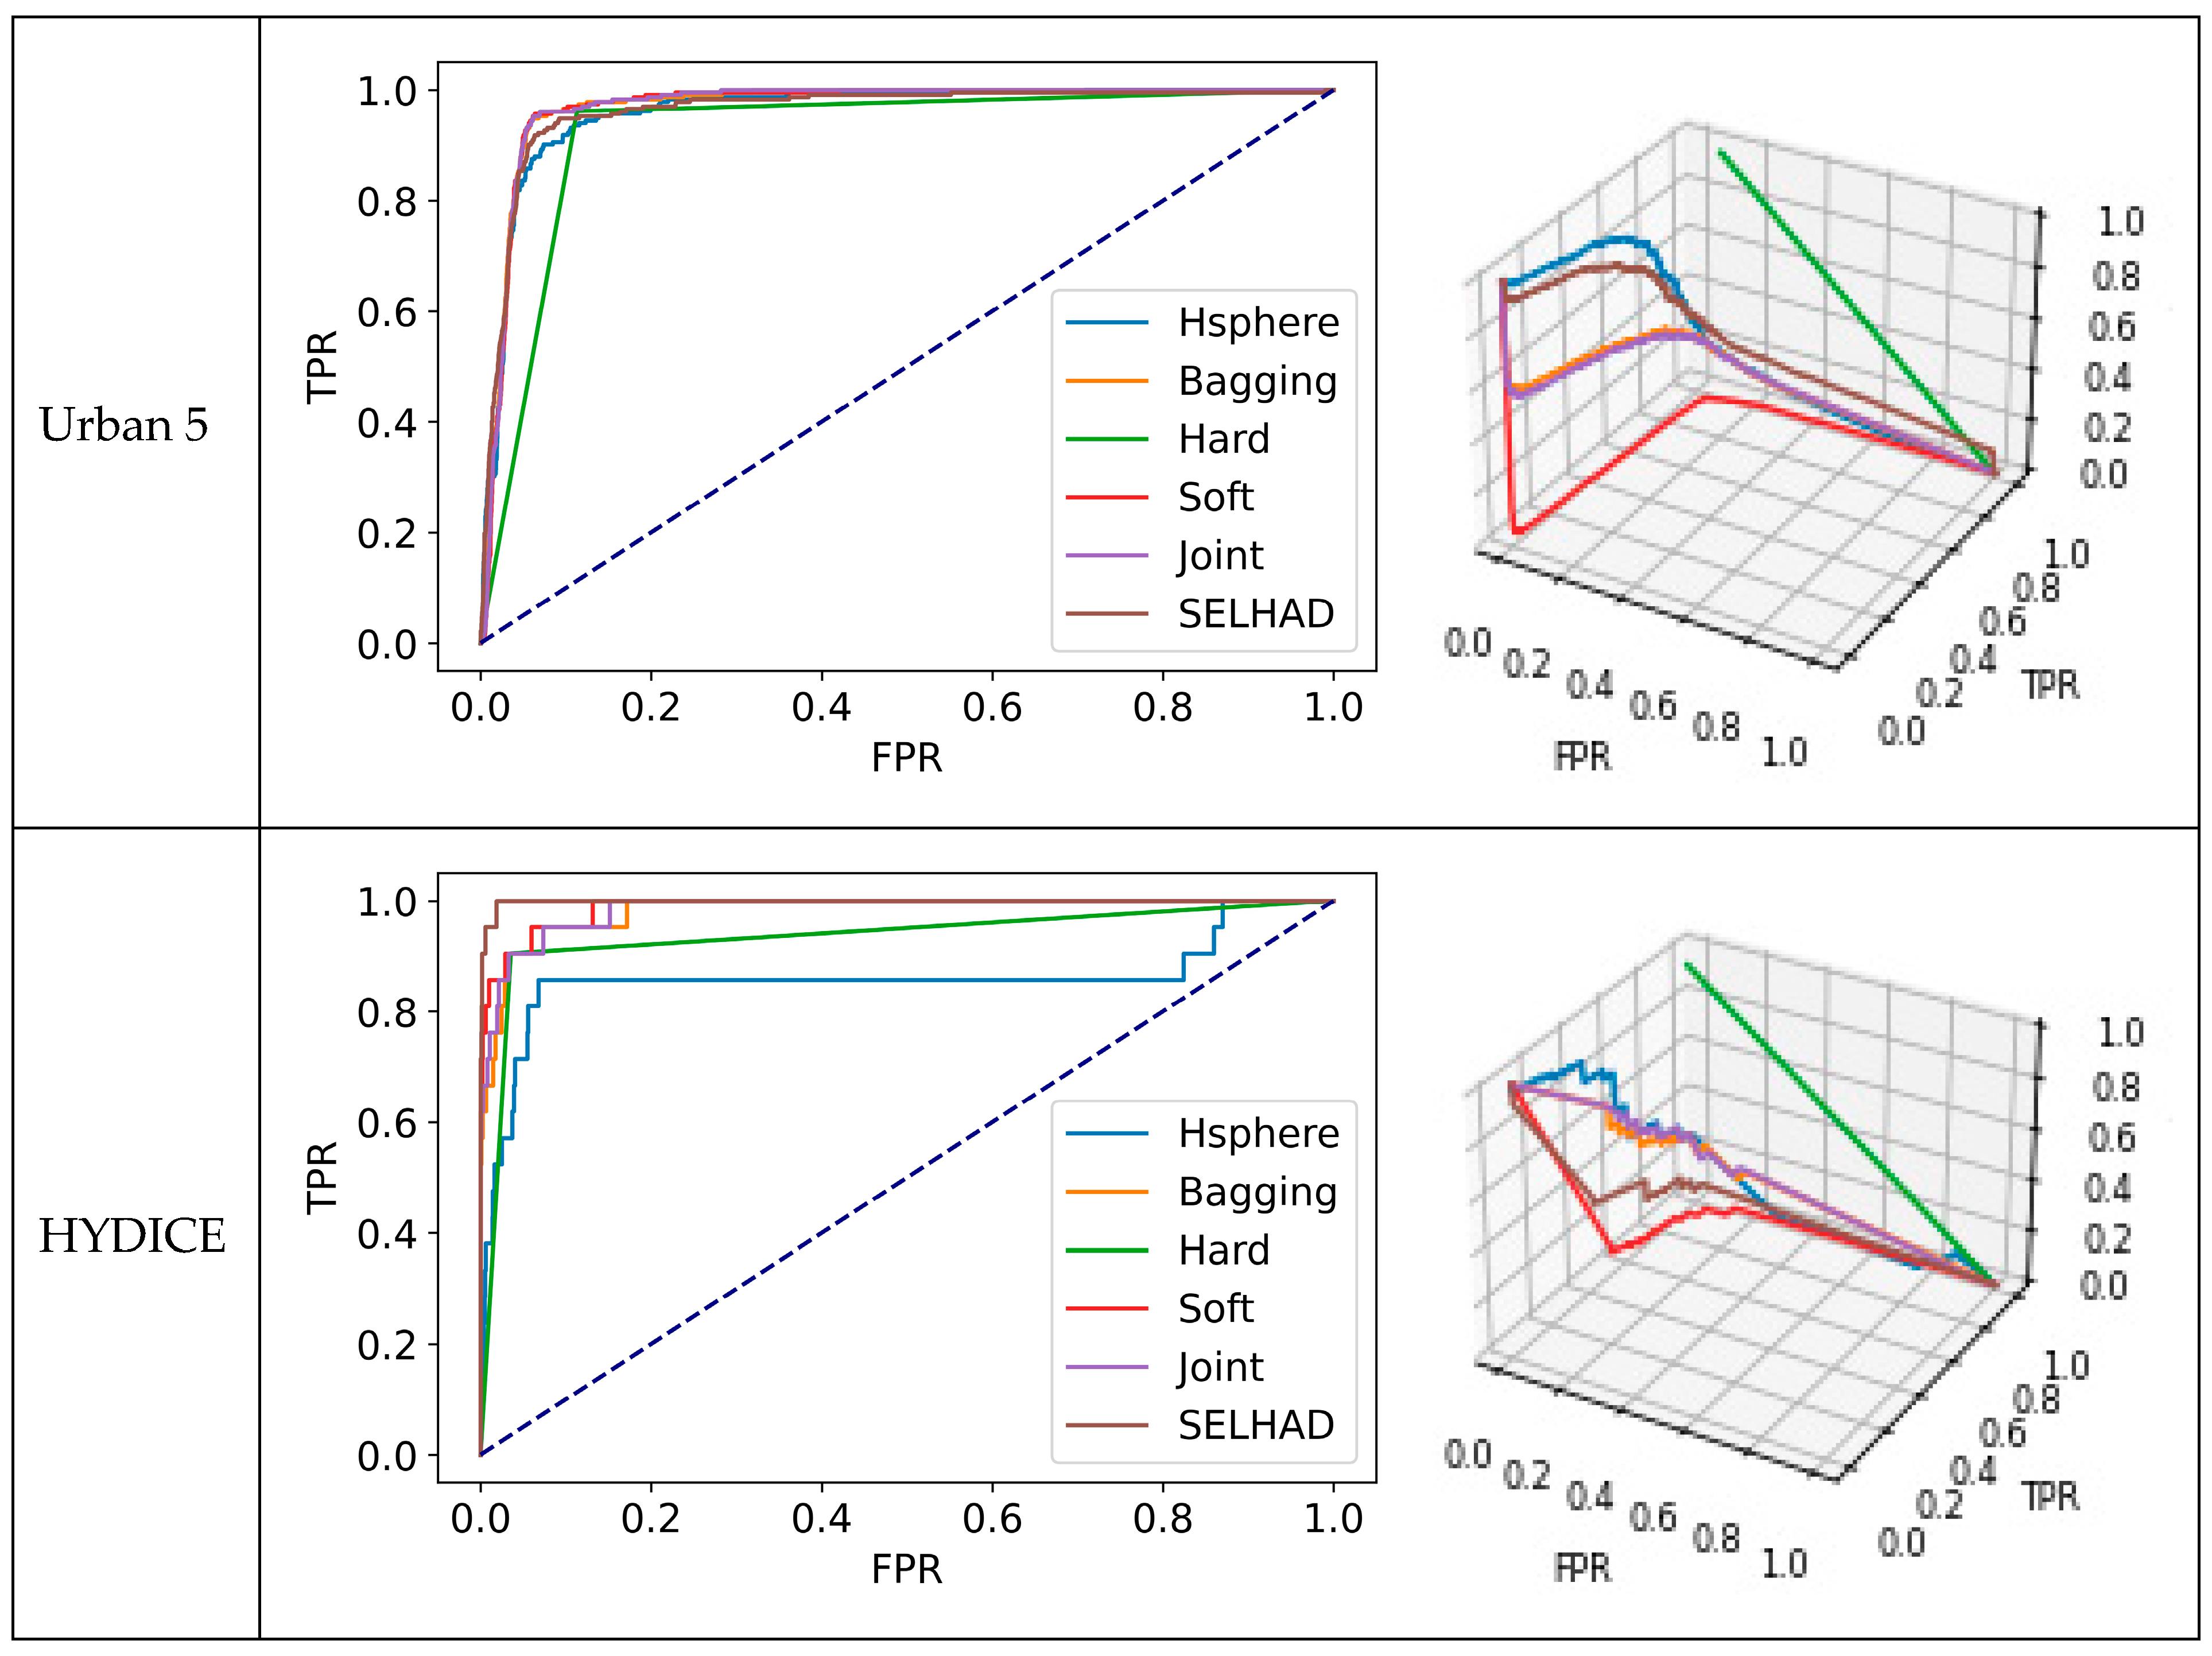
Figure 2 and Figure 3 visualize AUROC performance on a generalized and individual dataset level, respectively. Figure 2 presents the distribution of AUROC scores each algorithm achieved across all datasets. Algorithms are listed across the X axis approximately in order of increasing generalizability as determined by their median and third quartile AUROC scores. Figure 3 displays the receiver operator characteristics of the top-performing algorithms exclusively (to provide better visibility). Figure 2 further demonstrates how ensemble learning approaches strengthen generalizability. The medians and inner quartile ranges of the ensemble learning algorithms (except for the hard voting algorithm) are visually higher than the base learning algorithms, which agrees with the observations in Table 2 and Table 3. The results from the hard voting algorithm were expected as they agree with the results obtained in prior studies [7]. The medians and inner quartile ranges of the Gaussian and partition-biased base learners are also greater than all the other base learners, which also agree with Table 2 and Table 3, showcasing their enhanced generalizability over the other base learners. The ROC curves in Figure 3 demonstrate multiple instances where the top performance of SELHAD is visually evident in addition to the quantifiable differences evident in Table 2. The airport 1, airport 4, beach 1, beach 2, beach 3, and HYDICE datasets all display ROC curves for SELHAD with noticeably higher true positive rates and lower false positive rates at lower thresholds. Similar distinctions, albeit to a lesser extent, can be observed for the soft voting algorithm for the airport 2 and airport 3 datasets and for the hypersphere-biased base learner for the beach 4 and urban 4 datasets. All other datasets demonstrate closer performance between algorithms, as shown by the higher degree of overlap in ROC curves, which does not make any one algorithm visually distinguishable. Note that this does not mean that one algorithm is not discernably better than the others; it simply means that it cannot be observed in the ROC plots. As anomalies are rare, most of the scores produced by the algorithms were high. The median top AUROC score among the base learners in Table 2 was 0.9803, so small changes in performance that cannot be observed in an ROC plot may still be substantial given the overall small margin available for improvement.
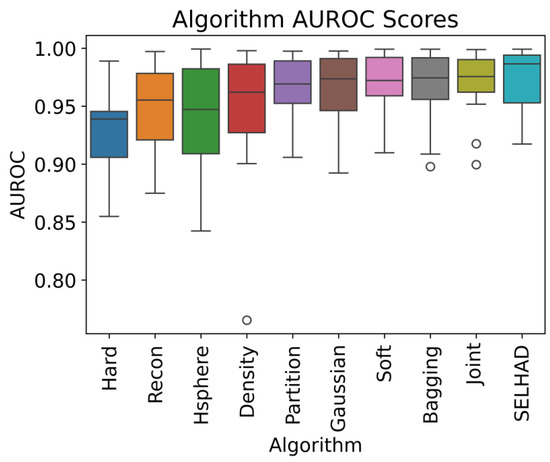
Figure 2.
Distribution of AUROC scores for each algorithm across all datasets.
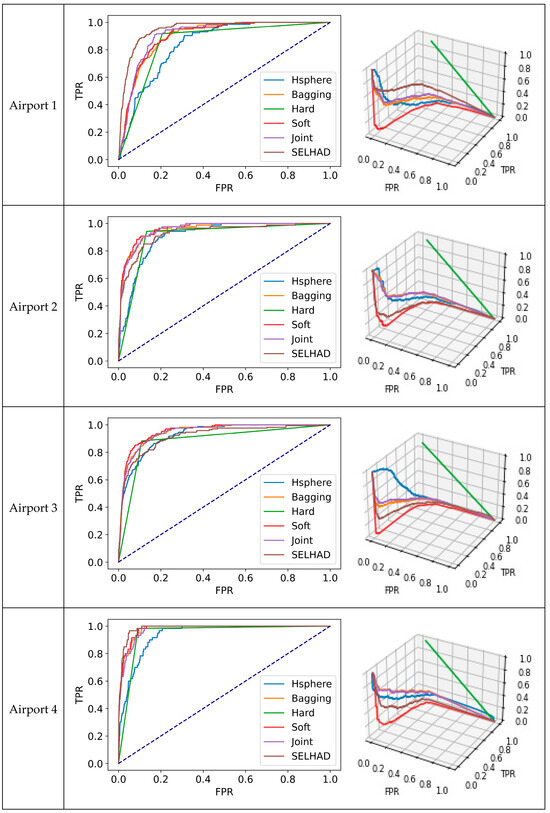
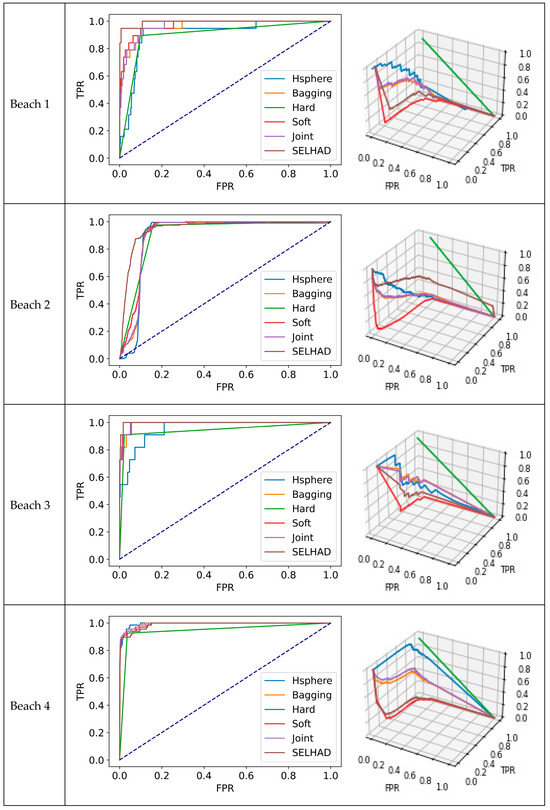
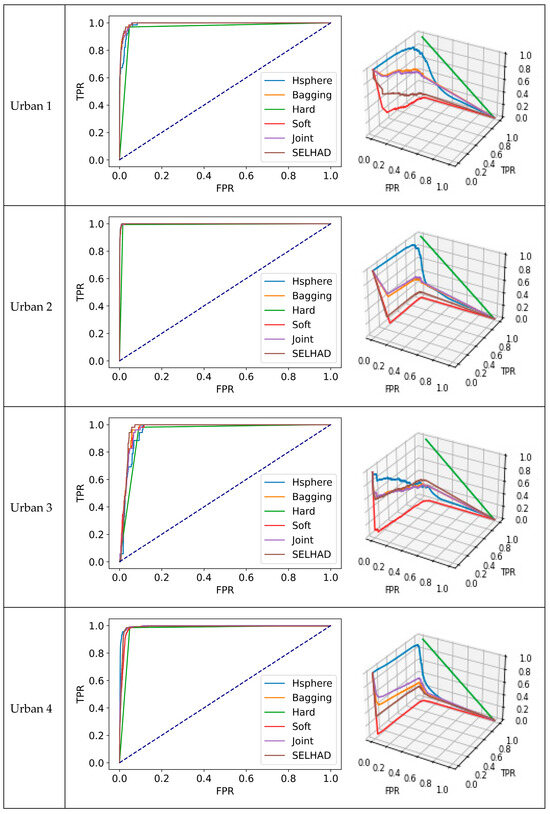
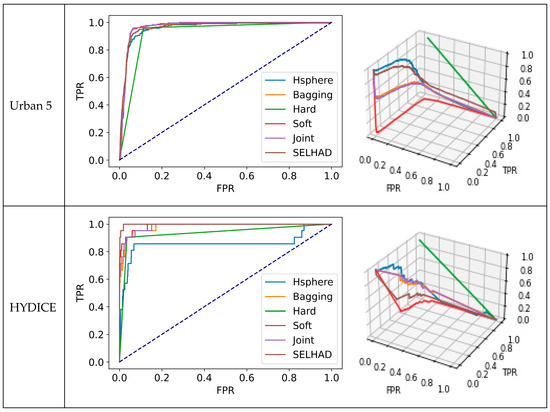
Figure 3.
ROC curves and 3D ROC curves for top-performing algorithms.
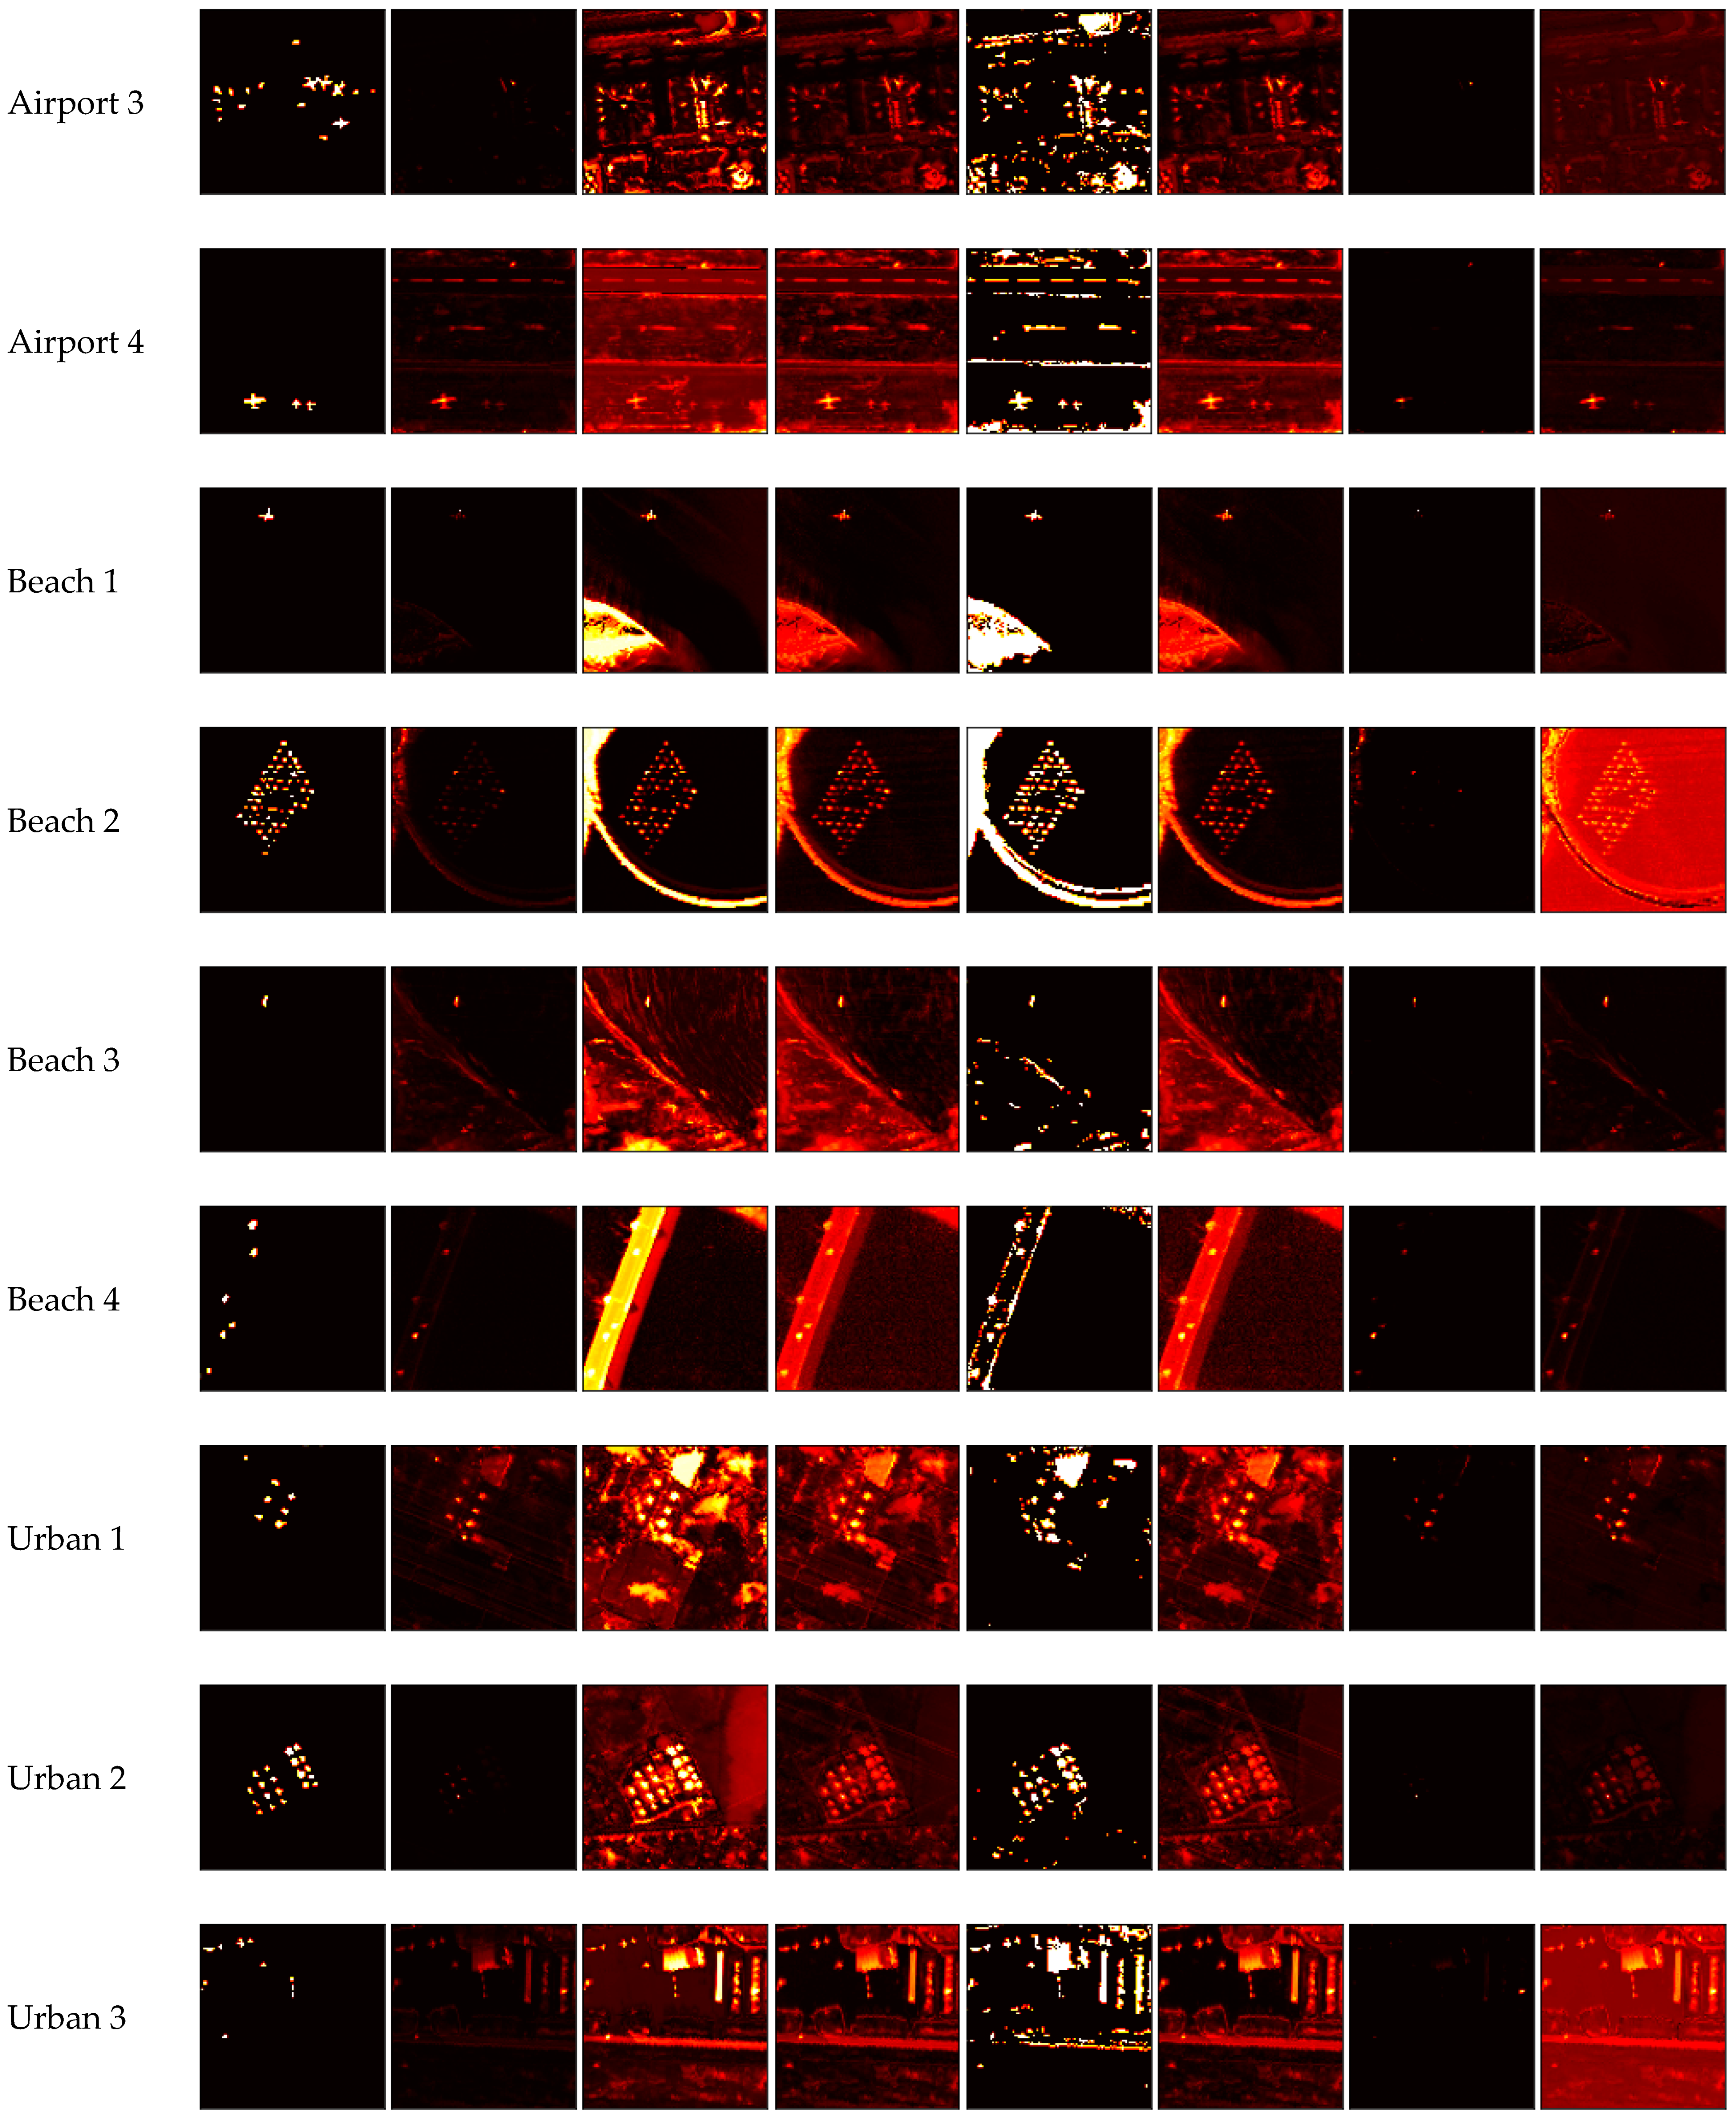
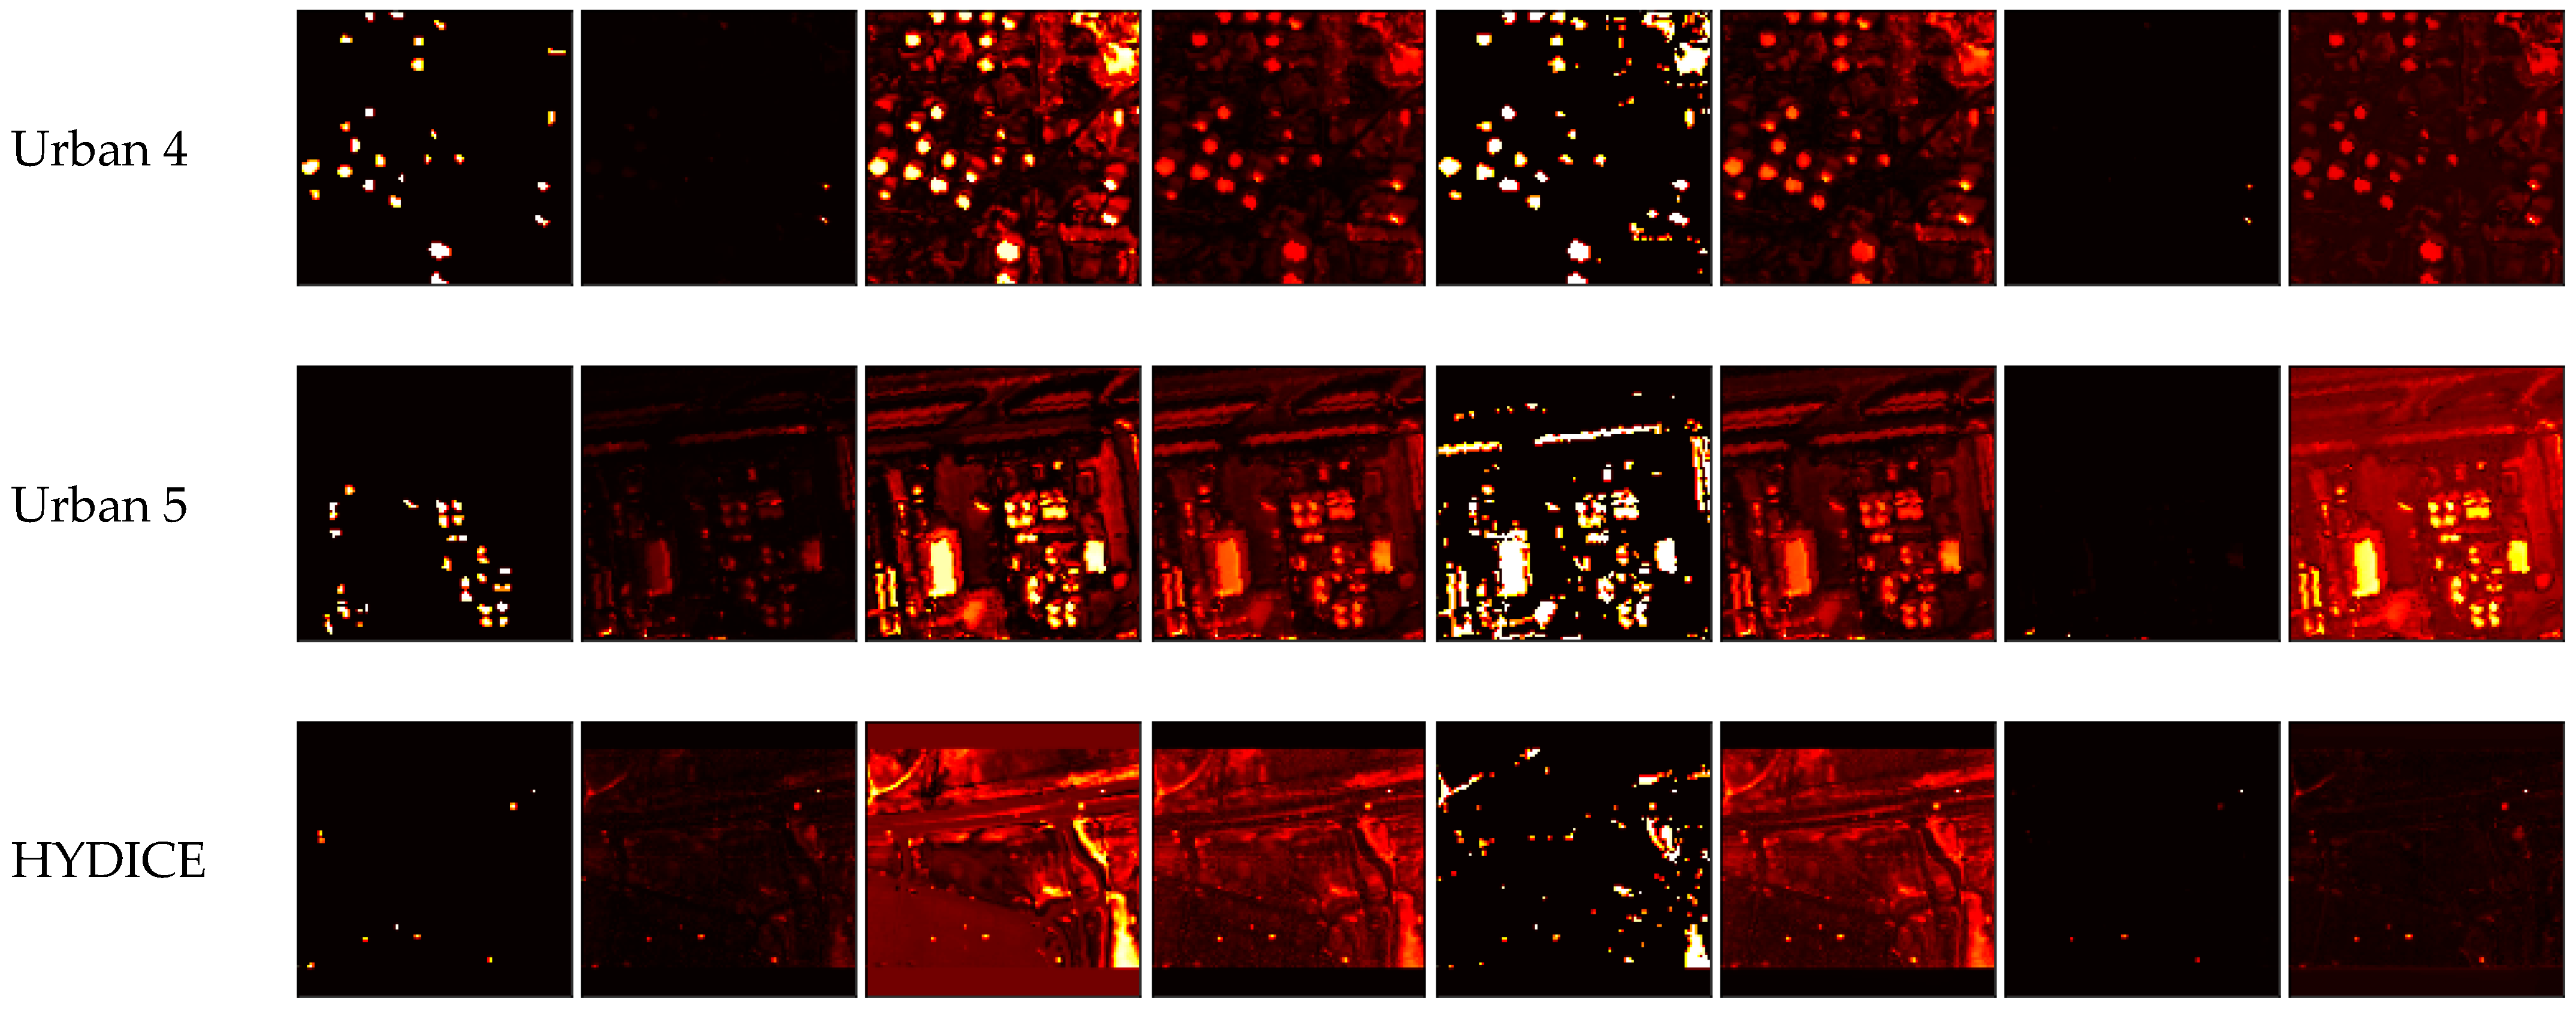
Figure 4 provides ground truth information for each dataset in the study alongside the anomaly probabilities produced by algorithms in this study. The ground truth for each dataset takes the form of a mask where white pixels indicate locations of anomalous pixels in the dataset and black pixels indicate locations of background pixels in the dataset. The heatmaps following the ground truth masks indicate the likelihood of each algorithm being assigned to each spectral signature for each dataset. Brighter colors indicate a higher predicted likelihood of a spectral signature being anomalous. Heatmaps include the hypersphere-biased and Gaussian-biased base learns alongside all the ensemble learning algorithms. The hypersphere-biased base learner is included, as it is the only base learner to outperform any of the ensemble learners. The Gaussian-biased base learner is included, as it is the best generalizer among all the base learners.

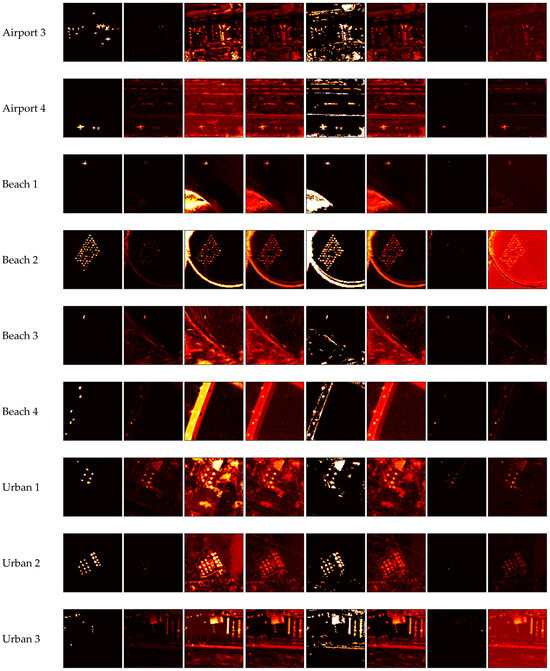
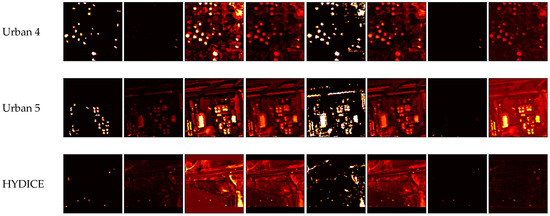
Figure 4.
Ground truth masks and anomaly probability heatmaps.
Distinctions for the algorithms can be observed across the heatmaps they produced. The hyperspherical-biased base learner employs what may be considered an “all or nothing” approach compared with the other algorithms. It has the hottest and most frequent hot spots of all the algorithms. Therefore, when these predictions are correct, it excels in performance, hence its ability to outperform the ensemble learning algorithms on 3 of the datasets. However, when those predictions are incorrect, its performance suffers, which is why it had the second lowest quantity of lowest AUROC scores. Comparatively, the Gaussian-biased base learner heatmaps are defined by their low amount of noise and low quantity of background spectral signatures assigned to any heat compared with the other algorithms. The Gaussian-biased base learner additionally assigns lower heats compared with the other algorithms in general and is more selective in doing so. This results in the Gaussian-biased base learner having more conservative predictions that provide good broad delineation between target and background spectral signatures but miss some of the nuances that would enable it to excel on any one dataset. This provides further visual evidence as to what behaviors delineate top-performing and highly generalizing HAD algorithms.
The characteristics of the heatmaps for the comparative ensemble learning algorithms differ from the base algorithms as they are composed of information aggregated across the base learners. Both the soft vote and bagging ensemble learning algorithms produce similar results. This is expected as they represent the central tendency of the base learners and the central tendency of multiple bootstraps of the base learners, respectively. They maintain the stronger predictions made by the top-performing base learner, but these predictions are tempered by the top generalizing algorithms, mitigating the “all or nothing” pitfalls. Small nuances of higher heat and less noise can be observed in the bagging algorithm as a result of the robustness that bootstrapping provides that algorithm. As the hard vote algorithm relies on the majority prediction, and all the algorithms produce some noise, this carries over into the results for the hard vote algorithm and is detrimental except in the cases where all the algorithms tend to perform equally well on the datasets. The heatmaps for the joint probability algorithm are the sparsest as they reflect the products of multiple fractional values; remember, all the outputs of the base learners are standardized between zero and one in this work. This makes the predictions for cases of disagreement between base learners much lower than for any other ensemble learning method, eliminating much of the noise visible in heatmaps from the base learners. This noise removal helps in many cases but causes the joint probably algorithm to assign too low of scores to some anomalies when disagreements between base learners arise, hence hindering performance instead. Therefore, while these algorithms show improvement over the base algorithms, allowing all the base algorithms to increase or diminish results equally has limitations. Larger discrepancies between base algorithms or poor performance of a base algorithm on a specific dataset can cause some base learners to have an outsized impact on the aggregated results in cases where the base learners’ results may not ultimately be as informative.
To alleviate the outsized impact of specific base learners, the β vectors learned by SELHAD can be employed. Table 4 provides the factors learned by the β vector in Equation 10 of the SELHAD algorithm. Table 4 demonstrates how SELHAD adapts to each dataset by applying the base learners in varying degrees to derive the anomaly probability predictions, thereby alleviating the issues with equal base learner contribution. The impact of these adaptations can be visualized in the heatmaps SELHAD produces. For most datasets (11 of 14), the Gaussian-biased learner had the highest factor and consequently had the most influence on the anomaly probability predictions produced by SELHAD. Therefore, a top-generalizing algorithm proved the most beneficial in most cases. The primary contribution of the Gaussian-biased base learner is evident in the lower degree of noise in the SELHAD heatmaps in comparison to the soft vote and bagging algorithms. The secondary contributions of the other base algorithms then act to boost the predictions of anomalous pixels above the predictions provided by the Gaussian-biased base learner, creating greater delineation between probability predictions and improving performance. This creates hotter hot spots in the heatmaps for the SELHAD algorithm than the Gaussian-biased base learner, but not so hot that it falls into the “all or nothing” pitfall, hence balancing performance and generalizability.

Table 4.
Factors assigned to base learners by SELHAD.
The remaining three datasets from Table 4, where the Gaussian-biased base learner was not the top contributor for SELHAD, are unique. In the airport 1 dataset, a slightly inverse contribution of the Gaussian-biased base learner was used. The heatmap of the airport 1 dataset for the Gaussian-biased base learner shows that the Gaussian-biased base learner assigned higher probabilities predominantly to background spectral signatures. Therefore, by assigning an inverse contribution to the Gaussian-biased base learner in this case, the probabilities produced by the SELHAD algorithm for these background spectral signatures could be attenuated. A stronger example of this exists in the beach 2 dataset, whereby applying an inverse contribution, a roadway identified with high probabilities of being anomalous could be completely removed in the resulting SELHAD probability predictions. Lastly, in the urban 5 dataset, the primary contributor was the hypersphere-biased base learner, and the Gaussian-biased base learner was employed closely behind. As the hypersphere-biased base learner performed better on this dataset, the Gaussian-biased base learner probability predictions could instead be used to attenuate some of the more aggressive scores observed in the hypersphere-biased base learner and improve performance in a similar fashion to the soft vote and bagging ensemble algorithms.
6. Discussion
The results discussed in the previous section can be used cumulatively to provide empirical evidence of the dichotomy in performance introduced in this study between HAD algorithm biases. While some biases produced more top results [Table 2] and top results that outperformed even the ensemble learning algorithms, they were not without their limitations. These top individual performances came at the cost of an even greater number of bottom performances [Table 2]. They produced probability predictions that were higher more often than the other algorithms, enabling them to excel when they were correct but struggle when they were not, creating “all or nothing” scenarios. The over-arching implications of this instability could additionally be seen in how this impacted the generalizability [Table 3] of these top-performing algorithms. They had lower mean and median AUROCs and greater variance in AUROCs, showcasing their overall volatility. The volatility and “all or nothing” trends were visually apparent in the exceptionally high heats the algorithms produced in their heatmaps [Figure 4], especially in the high heats assigned to background spectral signatures.
Conversely, the other biases produced results that enabled them to perform in a more stable fashion, generalizing well across a diverse range of datasets [Table 3] [Figure 2]. A hallmark of this was the lower degree of noise and lower heat generally observed in their heatmaps [Figure 4]. However, this stability came at the cost of these biases having lower and fewer top performances and never achieving any top performances when the ensemble learning algorithms were included [Table 1]. As such, these differences present in the results between performance and generalizability support the concept of a dichotomy between HAD algorithm biases.
While these different biases demonstrate a pressing issue with HAD algorithms, they also provide the catalyst for alleviating it. By utilizing the diverse biases in concert, this study was able to mitigate the dichotomous nature of their individual results. The dataset-specific trends modeled in the top-performing algorithms could be balanced with the more abstract trends modeled in the top-generalizing algorithms. This relaxed the high heat predictions of the top-performing algorithms while simultaneously increasing selectivity over the top generalizing algorithms, all while reducing background noise [Figure 4]. More succinctly, utilizing the biases in concert increased the separation between background and target spectral signature probability predictions, which resulted in higher AUROC scores. By employing bagging, soft vote, and joint probability ensemble algorithms to aggregate the information of the base learners, the number of top performances was able to be matched or exceeded over the top performing base learners while suffering no lowest performances [Table 2]. The ensemble algorithms had the additional effect of increasing the mean performance across all datasets, outperforming the generalizing ability of top generalizing base learners [Table 3]. By employing ensemble algorithms that could model the central or joint tendencies of multiple HAD algorithms in concert, the advantages of the base learners could be enhanced while their weaknesses were attenuated, hence easing the dichotomy between the performances of the base learners in isolation.
The results in this study indicate that while central and joint tendencies of diverse HAD biases can improve performance and generalizability [Table 2 and Table 3], not all biases are equally informative for every dataset [Table 4] and, as such, should not be utilized equally. In this study, the factor of the contribution of each bias was learned [Equation (10)] using the SELHAD algorithm for each dataset [Table 4] so that more informative biases could have a greater influence on central tendency modeling. This provided greater fidelity to retain high heats (instead of attenuating them) when they were informative [Figure 4]. It additionally enabled a finer balance in noise removal that was more inclusive than the bagging and soft voting algorithms while not being as aggressive as the joint probability algorithm [Figure 4]. Inverse contributions could be applied to make the effects even more pronounced. This enabled an even better separation of probability predictions from SELHAD that even further mitigated the dichotomy between performance and generalizability.
A key component for the enhanced performance observed by SELHAD is the selection of base learners that originate from a diverse set of HAD algorithm biases. Each base learner models the data differently and consequently assigns different probability predictions to each spectral signature. These variations enable SELHAD to increase probabilities for anomalous pixels and decrease probabilities for background pixels accordingly. More diverse biases provide more information to SELHAD and result in more robust models of the data. The same level of diversity would not occur with base learners that employ similar biases, and the probability predictions they would produce would be more uniform. Less information would be available for improvement. The aid provided by this diversity is evidenced by the factors assigned to the base learners by SELHAD [Table 4] and the heatmaps that resulted from them [Figure 4]. Optimal performance was achieved on most datasets using information from multiple biases, and those optimal performances reflected the central tendencies from the biases SELHAD learned to incorporate into its probability predictions.
While SELHAD demonstrated marked enhancements in performance and generalizability, these advancements were not unanimously observed. Datasets exhibiting similarly high levels of performance and agreement across all base learners [Figure 3] posed challenges for SELHAD in learning appropriate factors. For instance, the airport 3, beach 4, urban 2, and urban 4 datasets ranked among the five datasets with the lowest standard deviation in AUROC scores [Figure 2] across all base learners (Table 2). Consequently, all base learners for these datasets generally performed well and exhibited substantial agreement, making it more difficult for SELHAD to discern appropriate factors. We hypothesize that by introducing trivial or zero factors for some base learners, performance could potentially be enhanced. However, a current limitation of SELHAD is its inability to learn such factors. Hence, a future direction for this work could involve incorporating L1 and L2 regularization terms into the loss function (Equation (9)) to encourage the convergence of select factors to trivial or zero values. Such regularization could promote sparsity across the β vector. This, in turn, could enhance not only metric-based performance but runtime-based performance as well by eliminating the need to compute anomaly probabilities for some base learners for a given dataset.
An important consideration for SELHAD, like most ensemble learning methods, is its computational runtime. Since ensemble methods aggregate the outputs of multiple base learners, their runtime reflects both the cumulative execution time of each learner and the time required for result integration. While parallel computing can mitigate runtime by allowing independent learners to run concurrently, this does not eliminate the increased demand for computational resources. In practical applications, the trade-off between the additional computational cost and the potential gains in performance and generalizability must be carefully weighed to determine if SELHAD is the optimal approach.
7. Conclusions
This study introduced SELHAD, an algorithm designed to learn the factor in which to employ predictions from diverse hyperspectral anomaly detection algorithm biases in concert to mitigate the dichotomy between performance and generalizability in their individual use. SELHAD employs a two-part stacking-based ensemble learning approach comprising a base-learning phase and a meta-learning phase. In the base-learning phase, the algorithm produces multiple slightly perturbed permutations of the data through a set of HAD algorithms (i.e., the base learners), generating anomaly probability matrices. This integrates bootstrapping-based strategies into HAD, thereby bolstering the robustness of the subsequent meta-learning phase. In the meta-learning phase, the factor to which the anomaly probability matrices from each base learner contribute to the outcome is learned by SELHAD. The learned factors can then be used to regulate the influence each base learner has on the outcome via a broadcasting operation, yielding the final probability of each spectral signature’s anomaly status within the dataset. This defines a method of using the biases of multiple hyperspectral anomaly detection algorithms in concert to mitigate the dichotomy between performance and generalizability in their individual use.
To assess the effectiveness of the proposed algorithm, a systematic set of experiments was conducted, comparing SELHAD against the base learners and four ensemble learning algorithms: bagging, soft voting, hard voting, and joint probability. Evaluation encompassed a diverse set of 14 hyperspectral datasets. The datasets were assessed to ensure heterogeneity in spatial resolution, spectral band count, and the characteristics of anomalous targets, including their quantity, average size, and variance. Perturbation of the anomaly probability matrices generated by the base learners was achieved through rotational and flipping-based operations applied to the datasets, along with minute hyperparameter adjustments to the base learners. Subsequently, the AUROC was computed for all ten algorithms using the original data. The frequency with which each algorithm attained the best AUROC across the 14 datasets was tabulated to identify the top-performing algorithm. Furthermore, statistical metrics, including mean, standard deviation, minimum, median, and maximum AUROCs, were calculated for each algorithm across all datasets to assess their generalizability. Aggregating these metrics provided a comprehensive evaluation of algorithms’ performances.
The findings from the experiments demonstrate that SELHAD successfully learned the contributing factors for using multiple HAD algorithms in concert, which largely mitigated the dichotomy between performance and generalizability over their individual use. By regulating each base learner’s influence on the final outcome, SELHAD capitalized on the strengths of each bias while tempering their inherent limitations. This resulted in nearly doubling the number of datasets for which top performance was achieved compared with the other nine algorithms and in claiming four of the five statistical measures for generalizability. Consequently, SELHAD represents a departure from the conventional inverse trend between performance and generalizability observed in traditional HAD algorithms, where enhancing one aspect often compromises the other and makes advances toward adaptability. However, there remains room for improvement. Future work could explore the integration of regularization terms into the loss function to induce sparsity across learned factors, thereby further attenuating or eliminating the influence of non-informative base learners. Such refinement not only holds promise for enhancing performance-based metrics but also offers potential gains in runtime efficiency by eliminating the need to compute anomaly probability matrices for some base learners.
Author Contributions
Conceptualization, B.J.W.; methodology, B.J.W.; validation, B.J.W.; formal analysis, B.J.W.; investigation, B.J.W.; writing—original draft preparation, B.J.W.; writing—review and editing, B.J.W. and H.A.K.; visualization, B.J.W.; supervision, H.A.K. All authors have read and agreed to the published version of the manuscript.
Funding
This research received no external funding.
Data Availability Statement
The data for this study can be downloaded from https://xudongkang.weebly.com/data-sets.html (accessed on 25 October 2024).
Conflicts of Interest
The authors declare no conflicts of interest.
References
- Reed, I.S.; Yu, X. Adaptive Multiple-Band CFAR Detection of an Optical Pattern with Unknown Spectral Distribution. IEEE Trans. Acoust. Speech Signal Process. 1990, 38, 1760–1770. [Google Scholar] [CrossRef]
- Su, H.; Wu, Z.; Zhang, H.; Du, Q. Hyperspectral Anomaly Detection: A Survey. IEEE Geosci. Remote Sens. Mag. 2022, 10, 64–90. [Google Scholar] [CrossRef]
- Xu, Y.; Zhang, L.; Du, B.; Zhang, L. Hyperspectral Anomaly Detection Based on Machine Learning: An Overview. IEEE J. Sel. Top. Appl. 2022, 15, 3351–3364. [Google Scholar] [CrossRef]
- Shah, N.R.; Maud, A.R.M.; Bhatti, F.A.; Ali, M.K.; Khurshid, K.; Maqsood, M.; Amin, M. Hyperspectral Anomaly Detection: A Performance Comparison of Existing Techniques. Int. J. Digit. Earth 2022, 15, 2078–2125. [Google Scholar] [CrossRef]
- Hu, X.; Xie, C.; Fan, Z.; Duan, Q.; Zhang, D.; Jiang, L.; Wei, X.; Hong, D.; Li, G.; Zeng, X.; et al. Hyperspectral Anomaly Detection Using Deep Learning: A Review. Remote Sens. 2022, 14, 1973. [Google Scholar] [CrossRef]
- Racetin, I.; Krtalić, A. Systematic Review of Anomaly Detection in Hyperspectral Remote Sensing Applications. Appl. Sci. 2021, 11, 4878. [Google Scholar] [CrossRef]
- Younis, M.; Hossain, M.; Robinson, A.; Wang, L.; Preza, C. Hyperspectral Unmixing-Based Anomaly Detection. Comput. Imaging VII 2023, 12523, 1252302. [Google Scholar] [CrossRef]
- Wang, S.; Hu, X.; Sun, J.; Liu, J. Hyperspectral Anomaly Detection Using Ensemble and Robust Collaborative Representation. Inf. Sci. 2023, 624, 748–760. [Google Scholar] [CrossRef]
- Taitano, Y.P.; Geier, B.A.; Bauer, K.W. A Locally Adaptable Iterative RX Detector. EURASIP J. Adv. Signal Process. 2010, 2010, 341908. [Google Scholar] [CrossRef]
- Kwon, H.; Nasrabadi, N.M. Kernel Rx-Algorithm: A Nonlinear Anomaly Detector for Hyperspectral Imagery. IEEE Trans. Geosci. Remote Sens. 2005, 43, 388–397. [Google Scholar] [CrossRef]
- Kwon, H.; Der, S.Z.; Nasrabadi, N.M. Adaptive Anomaly Detection Using Subspace Separation for Hyperspectral Imagery. Opt. Eng. 2003, 42, 3342–3351. [Google Scholar] [CrossRef]
- Song, Y.; Shi, S.; Chen, J. Deep-RX for Hyperspectral Anomaly Detection. In Proceedings of the IGARSS 2023—2023 International Geoscience and Remote Sensing Symposium, Pasadena, CA, USA, 16–21 July 2023; pp. 7348–7351. [Google Scholar] [CrossRef]
- Ma, L.; Crawford, M.M.; Tian, J. Anomaly Detection for Hyperspectral Images Based on Robust Locally Linear Embedding. J. Infrared Millim. Terahertz Waves 2010, 31, 753–762. [Google Scholar] [CrossRef]
- Gurram, P.; Kwon, H. Support-Vector-Based Hyperspectral Anomaly Detection Using Optimized Kernel Parameters. IEEE Geosci. Remote Sens. Lett. 2011, 8, 1060–1064. [Google Scholar] [CrossRef]
- Gurram, P.; Kwon, H.; Han, T. Sparse Kernel-Based Hyperspectral Anomaly Detection. IEEE Geosci. Remote Sens. Lett. 2012, 9, 943–947. [Google Scholar] [CrossRef]
- Ma, P.; Yao, C.; Li, Y.; Ma, J. Anomaly Detection in Hyperspectral Image Based on SVDD Combined with Features Compression. In Proceedings of the 2021 5th International Conference on Innovation in Artificial Intelligence, Xiamen, China, 5–8 March 2021; pp. 103–107. [Google Scholar] [CrossRef]
- Chang, S.; Du, B.; Zhang, L. A Subspace Selection-Based Discriminative Forest Method for Hyperspectral Anomaly Detection. IEEE Trans. Geosci. Remote Sens. 2020, 58, 4033–4046. [Google Scholar] [CrossRef]
- Li, S.; Zhang, K.; Duan, P.; Kang, X. Hyperspectral Anomaly Detection with Kernel Isolation Forest. IEEE Trans. Geosci. Remote Sens. 2020, 58, 319–329. [Google Scholar] [CrossRef]
- Zhang, K.; Kang, X.; Li, S. Isolation Forest for Anomaly Detection in Hyperspectral Images. In Proceedings of the IGARSS 2019—2019 IEEE 2023 International Geoscience and Remote Sensing Symposium, Yokohama, Japan, 28 July–2 August 2019; pp. 437–440. [Google Scholar] [CrossRef]
- Jiang, H. A Manifold Constrained Multi-Head Self-Attention Variational Autoencoder Method for Hyperspectral Anomaly Detection. In Proceedings of the 2021 International Conference on Electronic Information Technology and Smart Agriculture (ICEITSA), Huaihua, China, 10–12 December 2021. [Google Scholar]
- Zhang, J.; Xu, Y.; Zhan, T.; Wu, Z.; Wei, Z. Anomaly Detection in Hyperspectral Image Using 3D-Convolutional Variational Autoencoder. In Proceedings of the 2021 IEEE International Geoscience and Remote Sensing Symposium IGARSS, Brussels, Belgium, 11–16 July 2021; pp. 2512–2515. [Google Scholar] [CrossRef]
- Jiang, T.; Li, Y.; Xie, W.; Du, Q. Discriminative Reconstruction Constrained Generative Adversarial Network for Hyperspectral Anomaly Detection. IEEE Trans. Geosci. Remote Sens. 2020, 58, 4666–4679. [Google Scholar] [CrossRef]
- Jiang, K.; Xie, W.; Li, Y.; Lei, J.; He, G.; Du, Q. Semisupervised Spectral Learning with Generative Adversarial Network for Hyperspectral Anomaly Detection. IEEE Trans. Geosci. Remote Sens. 2020, 58, 5224–5236. [Google Scholar] [CrossRef]
- Song, X.; Aryal, S.; Ting, K.M.; Liu, Z.; He, B. Spectral–Spatial Anomaly Detection of Hyperspectral Data Based on Improved Isolation Forest. IEEE Trans. Geosci. Remote Sens. 2022, 60, 1–16. [Google Scholar] [CrossRef]
- Lu, Y.; Zheng, X.; Xin, H.; Tang, H.; Wang, R.; Nie, F. Ensemble and Random Collaborative Representation-Based Anomaly Detector for Hyperspectral Imagery. Signal Process. 2023, 204, 108835. [Google Scholar] [CrossRef]
- Hu, H.; Shen, D.; Yan, S.; He, F.; Dong, J. Ensemble Graph Laplacian-Based Anomaly Detector for Hyperspectral Imagery. Vis. Comput. 2024, 40, 201–209. [Google Scholar] [CrossRef]
- Liu, Z.; Gu, Y.; Wang, C.; Han, J.; Zhang, Y. A Feature-Clustering-Based Subspace Ensemble Method for Anomaly Detection in Hyperspectral Imagety. In Proceedings of the 2011 6th IEEE Conference on Industrial Electronics and Applications, Beijing, China, 21–23 June 2011; pp. 2274–2277. [Google Scholar] [CrossRef]
- Kalman, L.S.; Bassett, E.M., III. Classification and Material Identification in an Urban Environment Using HYDICE Hyperspectral Data. In Proceedings of the Imaging Spectrometry III, San Diego, CA, USA, 31 October 1997. [Google Scholar]
- Kang, X.; Zhang, X.; Li, S.; Li, K.; Li, J.; Benediktsson, J.A. Hyperspectral Anomaly Detection with Attribute and Edge-Preserving Filters. IEEE Trans. Geosci. Remote Sens. 2017, 55, 5600–5611. [Google Scholar] [CrossRef]
- Wang, S.; Wang, X.; Zhang, L.; Zhong, Y. Auto-AD: Autonomous Hyperspectral Anomaly Detection Network Based on Fully Convolutional Autoencoder. IEEE Trans. Geosci. Remote Sens. 2022, 60, 1–14. [Google Scholar] [CrossRef]
- Qu, J.; Du, Q.; Li, Y.; Tian, L.; Xia, H. Anomaly Detection in Hyperspectral Imagery Based on Gaussian Mixture Model. IEEE Trans. Geosci. Remote Sens. 2021, 59, 9504–9517. [Google Scholar] [CrossRef]
- Banerjee, A.; Burlina, P.; Diehl, C. A Support Vector Method for Anomaly Detection in Hyperspectral Imagery. IEEE Trans. Geosci. Remote Sens. 2006, 44, 2282–2291. [Google Scholar] [CrossRef]
Disclaimer/Publisher’s Note: The statements, opinions and data contained in all publications are solely those of the individual author(s) and contributor(s) and not of MDPI and/or the editor(s). MDPI and/or the editor(s) disclaim responsibility for any injury to people or property resulting from any ideas, methods, instructions or products referred to in the content. |
© 2024 by the authors. Licensee MDPI, Basel, Switzerland. This article is an open access article distributed under the terms and conditions of the Creative Commons Attribution (CC BY) license (https://creativecommons.org/licenses/by/4.0/).

