Article

Efficiency of Optimized Approaches for Gravity Operator Modeling

1
Géosciences Environnement Toulouse (GET), Observatoire Midi-Pyrénées (OMP), 31400 Toulouse, France
2
Centre National de la Recherche Scientifique (CNRS), 75016 Paris, France
3
Géosciences Environment Toulouse, Université Toulouse III-Paul Sabatier, UMR 5563, 31062 Toulouse, France
4
Service Hydrographique et Océanographique de la Marine (Shom), 29200 Brest, France
*
Author to whom correspondence should be addressed.
Remote Sens. 2024, 16(21), 4031; https://doi.org/10.3390/rs16214031
Submission received: 1 August 2024 / Revised: 18 October 2024 / Accepted: 23 October 2024 / Published: 30 October 2024

Abstract

:
Numerical tesseroid and radial-type approaches are presented and compared in terms of their efficiency for deriving the regional geoid height, vertical gravity, and gradiometric anomalies from sea floor topography grids. The vertical gradient function is particularly suitable for representing shorter wavelengths of gravity, typically less than 10 km. These two modeling methods were applied to the Great Meteor guyot in the Atlantic Ocean using its bathymetry. To optimize the computation of high-resolution gravity anomalies, the Armadillo, GSL, and OpenMP libraries were used to provide an environment for fast vector implementation, numerical integration for tesseroid calculation, and parallelization for loop iterations, resulting in a computation speed increase. The tesseroid and radial methods remain equivalent up to a resolution of about 1 min, with the radial method being faster when dealing with a large number of model points for the geoid. Aside from optimization enabling high-resolution gravity simulations, these fast modeling data can be used as the main operators in gravimetric inversion or to reduce the terrain effects in gravity observations, revealing gravity and sedimentary layers.

1. Introduction

The accurate estimation of the seafloor topography is crucial for various applications, including physical oceanography, marine geology, geophysics, biology, and marine resource management [1]. The traditional methods for mapping seafloor bathymetry involve the use of single- and multi-beam echo sounders operated along ship tracks. However, achieving complete coverage of the oceans using this technique is challenging, especially in vast unexplored regions outside shipping lines or those with known scientific observations. This is because conducting a comprehensive depth mapping of the entire ocean using sounders would take centuries and cost billions of USD [2].
Another option is to consider the systematic and global observations of marine geoid height, which refers to the static component of the gravity field that aligns with the static mean sea surface.
Satellite altimetry uses radar pulses to measure, with very high precision, the altitude of the satellite above the nearest point on the sea surface. On the other hand, precise orbit tracking coupled with dynamic calculations provides an independent measurement of the satellite’s height above the ellipsoid. The difference between these two measurements equals the instantaneous height of the sea surface (geoid height) minus any radar echo propagation delay caused by the ionosphere and troposphere. Indeed, observations of ocean surface topography through altimetry are, in a first approximation, a measurement of the geoid height or gravitational potential. It is thus possible to obtain gravity anomalies from a dense network of geoid height profiles [3]. These anomalies are the vertical derivative of the potential. It is also possible to obtain the vertical gravity gradient (VGG) from altimetric observations. The VGG highlights short-wavelength variations that are more suitable for mapping seafloor structures on a relatively fine scale of around 16 km [4]. In practice, the VGG corresponds to the curvature of the ocean surface as measured by satellite altimetry [4]. Unfortunately, in the estimation of the VGG, short-wavelength noise primarily originating from waves is also amplified. The improvement in the accuracy and spatial resolution of the VGG has been possible due to the inclusion of observations from new altimeters over the past few years. This has enabled the revelation of small-scale tectonic structures, notably abyssal hills or small seamounts [5].
These observations are conducted by multiple satellite-borne radar altimeters and are used to derive bathymetric signals through inversion. This is typically conducted within a spatial bandwidth of less than 160 km, where there is a strong correlation between sea floor topography and gravity. In the past, spectral methods based on Parker’s formula [6] and Fast Fourier decomposition have been developed to filter out altimetric signals [7,8]. However, these spectral approaches require grids that are fully regular and do not accommodate sparse observations or non-planar domains.
On the other hand, non-linear strategies based on discrete inverse theory [9] take into account the curvature of Earth and enable the combination of different types and distributions of data, such as geoid height, free-air anomaly (FAA), and vertical gravity gradient (VGG), in large oceanic areas. Unfortunately, these approaches come with the drawback of longer computation times due to the calculation of non-linear operators and large-dimension matrix products and inversions. The non-linear least-square methods [10] and Kalman filtering [11] provide an optimal estimate of the bathymetry based on the gravity observations and physical modeling. These methods include the forward problem and iteratively build an optimal topographic solution. Therefore, the precision of the direct gravity operator is crucial in guaranteeing the final estimate to be the most realistic. Previous studies were devoted to the calculation of the gravity operators and especially to the integral over the radial part, with different methods including the use of a spherical cap, Taylor series, or analytic primitives [10,11,12,13,14,15,16].
Moreover, tesseroid approximation offers the best precision but requires the numerical evaluation of a 3D integral [17,18]. On the other hand, the decomposition of radial rock columns of constant density remains faster for a large number of starting topographic heights [10,11,13,15,19].
In this article, both approaches are compared in order to determine which one offers the best compromise between high spatial resolution and low computing time when applying gravity operators. The radial approximation method always offers the fastest calculation time, but the spatial resolution thresholds at which the radial and tesseroid approaches are nearly equivalent should be determined. In addition, the threshold is dependent on the considered gravity operator (geoid, gravity anomaly, vertical gravity, or gradient).
The Great Meteor (GM) guyot has been used as a test area in order to compare the performances of these modeling approximations on various gravity functionals, such as geoid height anomaly, FAA, and VGG.
The article is structured as follows: The first part presents an introduction to the geophysical dataset available in the GM area that is used in the present study. The second part develops the approximations used in the modeling of the gravity functionals, followed by the strategy of numerical optimization. The Results section includes the gridded models for the three functionals and a comparison of the computation times before and after optimization. The Discussion section examines the estimates obtained using different strategies to determine the most precise one. Finally, the article ends with a Conclusion that synthesizes the important findings of the study and proposes new perspectives.

2. Data and Methodology

2.1. Bathymetric Data

The simulations are calculated from the GEBCO topography (GEBCO2020 version) computed with a spatial resolution of 15″ (450 m by 450 m at the equator) using bathymetric grids and surveys from many data contributors around the world [2,20].
We focus our study on the Great Meteor (GM) guyot [27°00′W–30°00′W; 28°30′N–31°30′N] in the mid-Atlantic Ocean [21,22], which has been extensively studied [23,24]. This seamount is particularly interesting because of its irregular shape, its flat summit close to the ocean surface (250 m depth), and its large size ( 24,000 km 3 ), making it a good test case for gravity modeling. On a finer scale, two additional seamounts, Little Meteor and Closs Seamount, increase the interest in this region because of their complex shape contrasting the detection capacity of each gravity operator. Moreover, this area is well covered with multi-beam ship tracks in order combined with gravity anomaly inversion for topography recovery [25] (Figure 1).
Figure 2 shows a segment of the Mid-Atlantic Ridge (54°W, 26°W, 20°N, 37°N) from the global GEBCO grid, which includes the region of the Great Meteor Seamount. This bathymetry will be used to determine the 1 min FAA grid and the complete Bouguer anomalies by comparison with satellite altimetry data to examine sediment contribution, compensation, and deep varying density structure on a much larger area than the Great Meteor Seamount region.

2.2. Gravity Operators Approaches

2.2.1. Tesseroids

Mass elements to model gravity operators are best approximated using a tesseroid shape (Figure 3 [17]). The expression of each operator is provided in [18], and their evaluation consists of performing a triple integral for geoid anomalies as follows:
N ( r , θ , λ ) = G Δ ρ γ r 2 c o s θ ( r 2 + r 2 2 r r c o s ψ ) 1 2 d r d θ d λ
for free-air anomalies (FAAs) as follows:
Δ g z ( r , θ , λ ) = G Δ ρ r 2 c o s θ ( r c o s ψ r ) ( r 2 + r 2 2 r r c o s ψ ) 3 2 d r d θ d λ
for vertical gravity gradient (VGG) anomalies as follows:
Δ g z z ( r , θ , λ ) = G Δ ρ r 2 c o s θ 3 ( r c o s ψ r ) 2 ( r 2 + r 2 2 r r c o s ψ ) 5 2 1 ( r 2 + r 2 2 r r c o s ψ ) 3 2 d r d θ d λ
where G in m 3 · kg 1 · s−2 is the gravitational constant, Δ ρ in kg·m−3 is the density contrast between the rocks composing the superficial layers of the seafloor and water, θ and λ are the latitude and longitude of the observation point P, θ and λ are the latitude and longitude of the mass element M, γ is the acceleration of gravity in m· s−2, and cos ψ = sin θ sin θ + cos θ cos θ cos ( λ λ ) , where id ψ is the spherical distance between the points M and P.
Integrals (1) (geoid), (2) (FAA), and (3) (VGG) have no analytical solution because of the elliptical integral over θ and λ .

2.2.2. Radial Approximation

The radial approximation consists of using the analytical primitive in r and in approximating the elementary surface to
Δ Ω = θ Δ θ 2 θ + Δ θ 2 λ Δ λ 2 λ + Δ λ 2 cos θ d θ d λ cos θ Δ θ Δ λ
This approximation drastically reduces the calculation time by avoiding the computation of the numerical integrals over the angles θ and λ . The radial integral over d r has an analytical primitive [11]. In this work, we address the question of the validity of the radial approximation Equation (4) and compare it with our tesseroid method in order to quantify the errors with respect to the resolution of the data. We also suggest an improved method using a spherical cap [11,12] in order to improve the radial approximation at the plumb of the element of mass. The radial approach is inaccurate at this position, where there is singularity when ψ tends to 0. However, we can divide the total gravitational effect at P into two parts, the gravitational spherical cap attraction of thickness for the height of the seafloor at the plumb and its difference with respect to the bathymetry around (Figure 4).
In the radial approximation, the gravity effect of a complete rock column of height h for the geoid is calculated using [11]
N ( r , θ , λ ) = G Δ ρ Δ θ Δ λ cos θ [ ξ G e o i d ( r + h , r , ψ ) ξ G e o i d ( r , r , ψ ) ]
with the analytic primitive
ξ G e o i d ( r , r , 0 ) = 1 2 r 2 r r r 2 ln ( r r )
at ψ = 0 , and
ξ G e o i d ( r , r , cos ψ ) = 1 2 r 2 ( 3 cos 2 ψ 1 ) ln ( r 2 + r 2 2 r r cos ψ r cos ψ + r ) + ( 3 r cos ψ + r ) r 2 + r 2 2 r r cos ψ
for ψ 0 . The gravity effect of a rock column for the FAA is determined with
Δ g z = G Δ ρ Δ θ Δ λ cos θ ( ξ F A A ( r + h , r , cos ψ ) ξ F A A ( r , r , cos ψ ) )
with the primitive
ξ F A A ( r , r , 0 ) = r 2 r r + 2 r ln ( r r ) ( r r )
at ψ = 0 , and
ξ F A A ( r , r , cos ψ ) = ( 6 cos 2 ψ 1 ) r r c o s ψ ( r 2 + 3 r 2 ) r + r 2 2 r r cos ψ + r ( 1 3 cos 2 ψ ) ln ( r + r 2 2 r r cos ψ r cos ψ + r )
for ψ 0 .
Using a spherical cap [11,12], Equation (8) is separated in two parts as follows:
Δ g z = 2 π G Δ ρ ( ξ F A A ( r p , r , 0 ) ξ F A A ( r , r , 0 ) )
at ψ = 0 , and
Δ g z = G Δ ρ Δ θ Δ λ cos θ ( ξ F A A ( r + h , r , cos ψ ) ξ F A A ( r p , r , cos ψ ) )
for ψ 0 . At ψ = 0 , the primitive (Equation (9)) becomes
ξ F A A ( r , r , 0 ) = 1 r 2 1 3 r 2 + r 2 2 r r cos ψ c ( r 2 ( 3 cos 2 ψ c 2 ) + r r cos ψ c + r 2 ) + r 3 cos ψ c ( cos 2 ψ c 1 ) ln ( r + r 2 2 r r cos ψ r cos ψ c + r ) + r 3 3
where ψ c = 1 . 5 (∼167 km) is the truncation angle [11,12].
r p is chosen such that r p = r + h at ψ = 0 and is the radius taken to determine the spherical cap (Equation (11)). At ψ 0 , the actual topography is added or removed from the spherical cap as presented in Figure 4 (Equation (12)).
The vertical gradient primitive can be written as follows:
ξ V G G = 8 G ρ π 3 r p 3 r 3 r 3
for ψ = 0 [14] and
ξ V G G = 1 r 2 ( r 3 2 r 2 + r 2 r r cos ψ + r r 2 + r 2 r r cos ψ + r 3 ( r 2 r 2 ) 2 ( r 2 + r 2 r r cos ψ ) 3 2 + 3 r c o s ψ r 2 + r 2 r r cos ψ + r 2 ( 3 cos 2 ψ 1 ) ln ( r 2 + r 2 r r cos ψ + r r cos ψ ) )
for ψ 0 . Results are in agreement with [13] for ψ 0 . Equation (14) determines the spherical cap. The gravity effect of a complete rock column for the VGG is
Δ g z z = 2 π G Δ ρ ( ξ V G G ( r p , r , 0 ) ξ V G G ( r , r , 0 )
at ψ = 0 , and
Δ g z z = G Δ ρ Δ θ Δ λ cos θ ( ξ V G G ( r + h , r , cos ψ ) ξ V G G ( r p , r , cos ψ ) )
for ψ 0 .
To summarize, this section recalls that the tesseroid approximation is the reference to determine the gravity effect of a single rock column and requires to evaluate a 3D numerical integration. The radial approximation consists of determining the approximation in Equation (4) on the angular 2D integral in order to have only the radial integral to perform. This integral has an analytical solution for each gravity operator. The method of the spherical cap reduces the error regarding the radial approximation by performing an exact integration of the angular part at ψ = 0 such that only the ψ 0 part of the angular integration contributes to the error compared to the tesseroid approximation.

2.3. Computational Optimization

In the previous section, the equations derived describe the gravity effect of a single rock column at a particular point. To obtain the total gravity effect, the results of the gravity effect of every single rock column of the grid at this particular point must be summed. In addition, this scheme is repeated on every point of the grid, making it necessary for a computational optimization to have reasonable calculation time.
The code is optimized using the C++ Armadillo library for vector environment [26,27].
The gravity operators are calculated by discretizing Earth into rock columns i with a size that depends on the resolution or grid sampling considered. The anomaly at each point is the sum of the anomalies generated by all the rock columns of the area considered. For simplicity, only two layers of density, rock and water, will be considered in this work. The OpenMP library is used for loop multithreading parallelization of the sum over the rock columns.
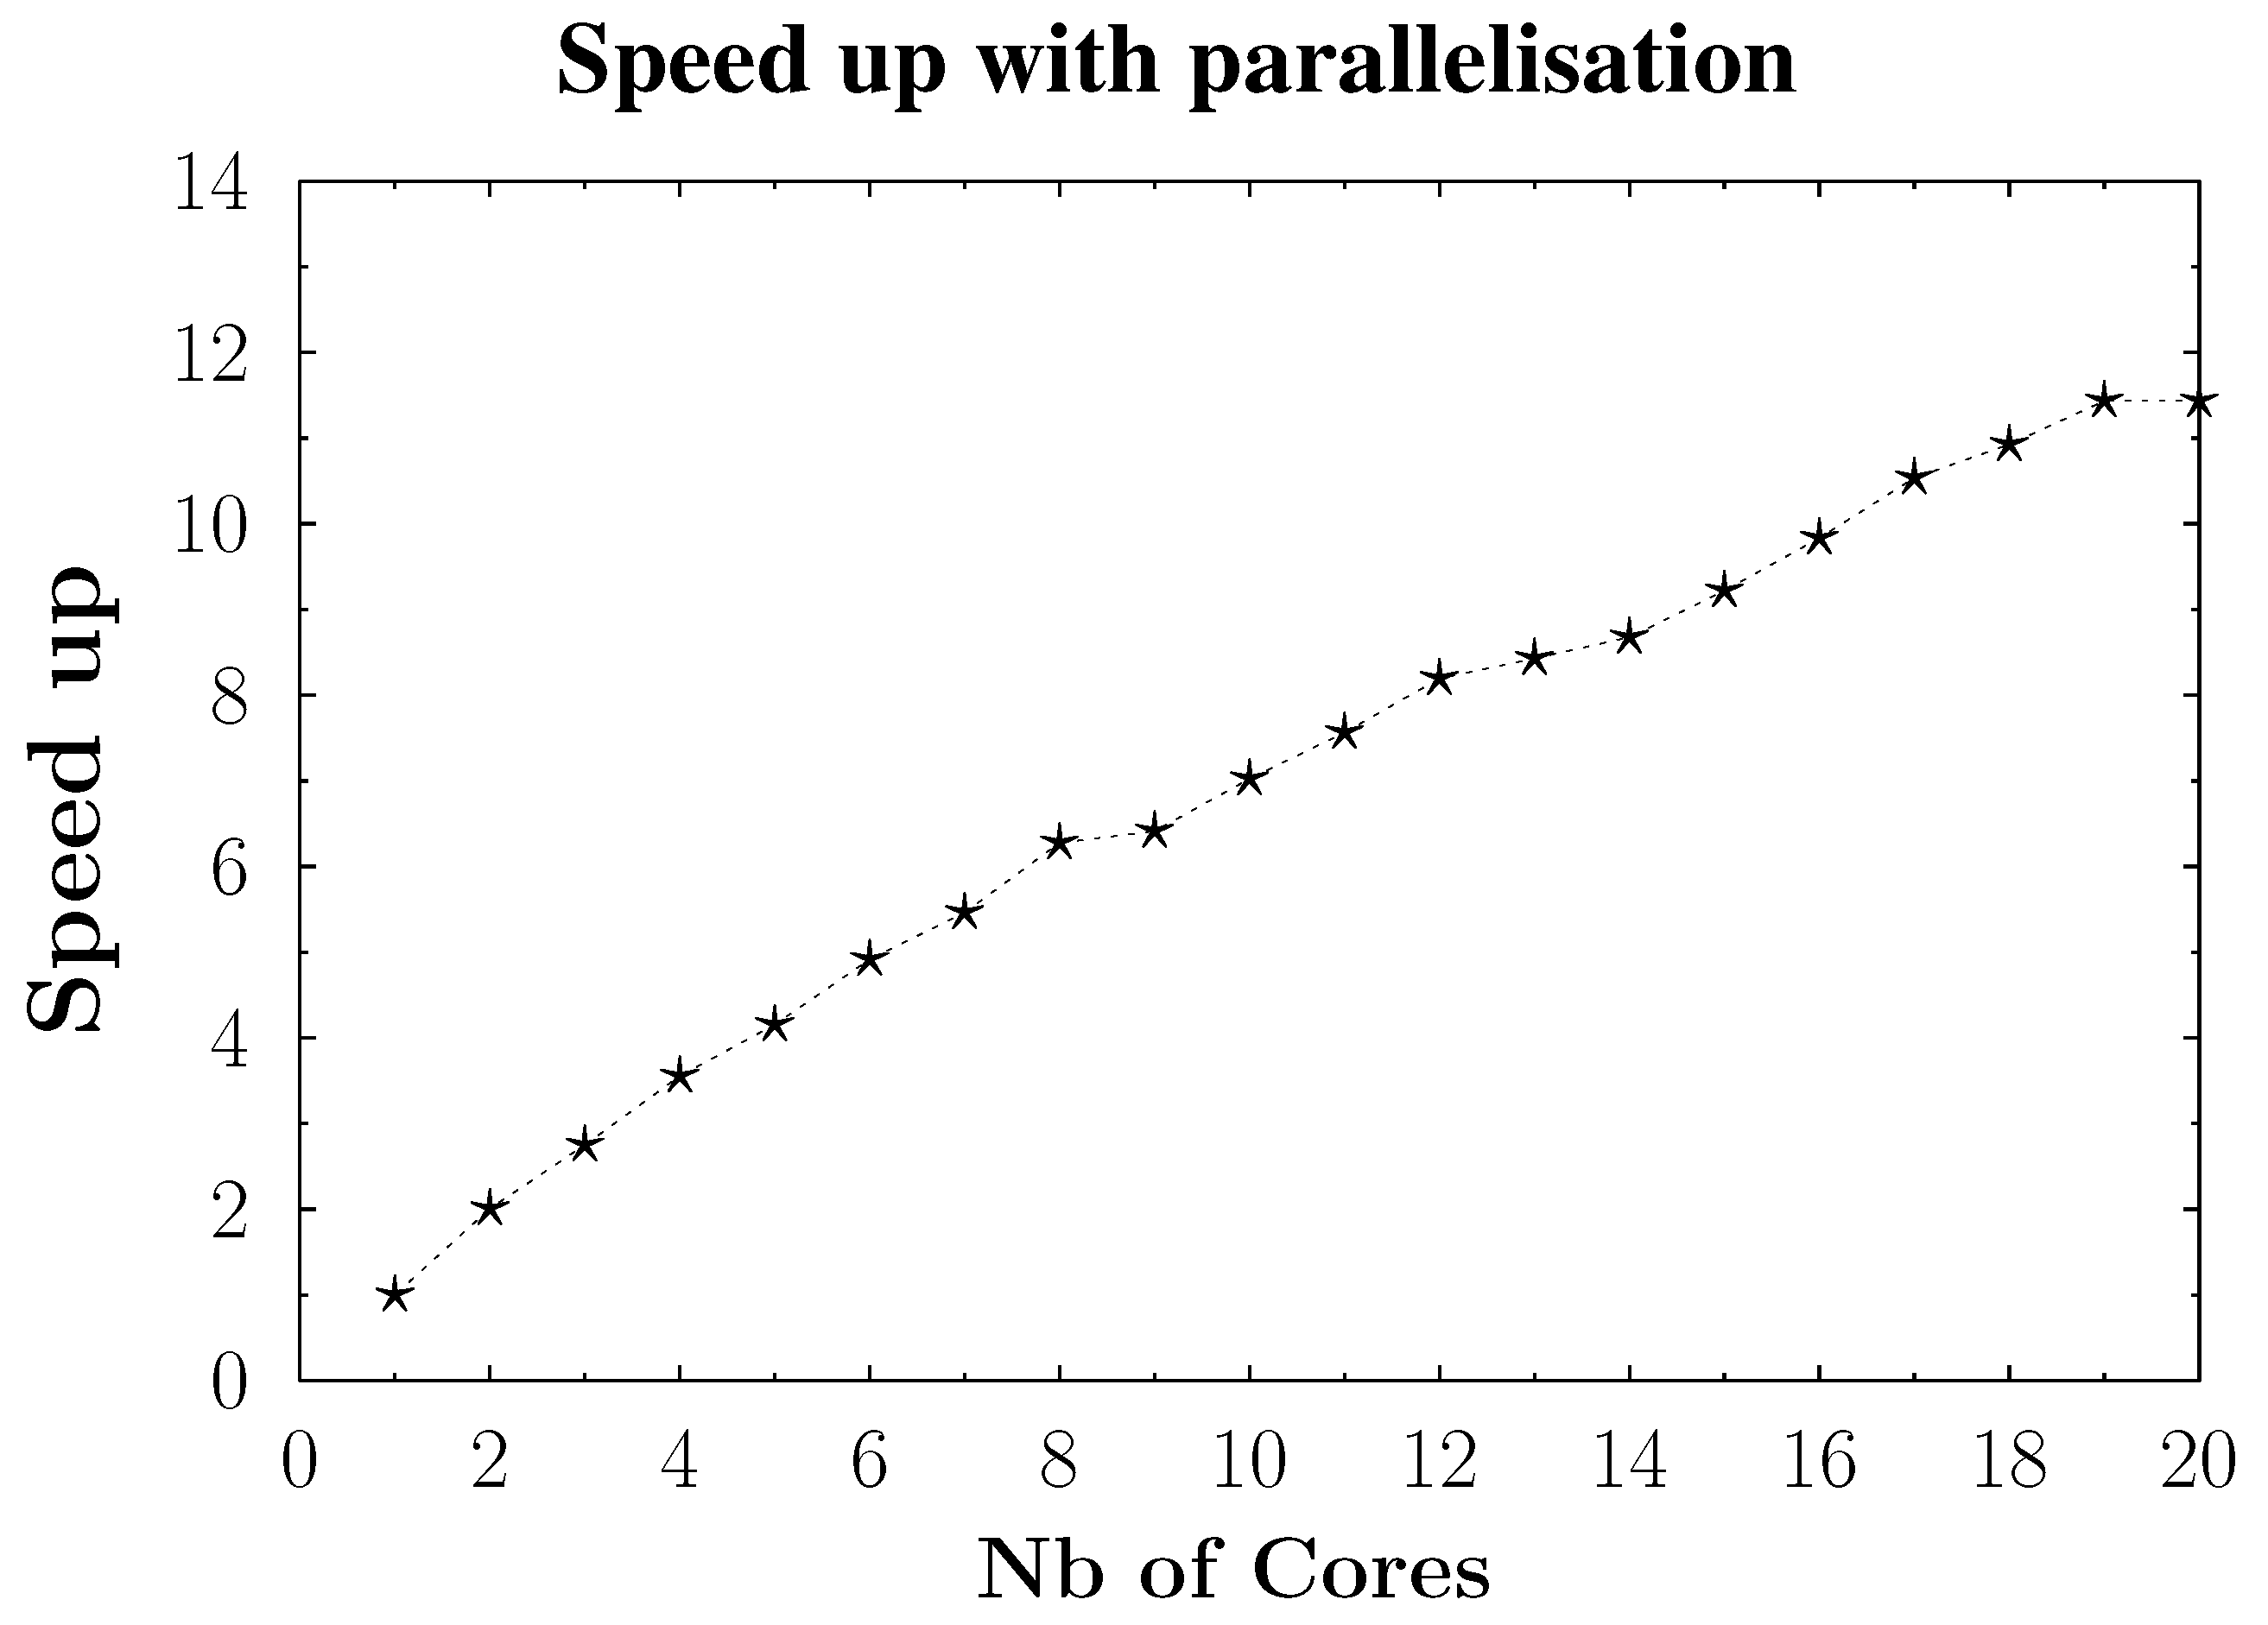
Figure 5 shows the speed up on the total execution of the program to determine the FAA (with radial approximation and spherical cap):
Speed up = t 0 t
where t 0 is the computing time with one core. Efficiency increases parabollically and saturates at 20 cores, the limit from which calculation of the FAA operator using the radial approximation with spherical cap at 1’ resolution is 12 times faster than with one core. The gain time increases linearly from one to six cores. The parallelized part, the calculation of the gravity functional, is the most time consuming. The sequential parts become non-negligible compared to the parallel task from six cores, which is the longest operation from 19 cores.
To evaluate the forward problem on large areas, we have created a bash script that divides the map into 5 by 5 cells. This script contains several stages:
  • The first stage cuts the map into strips of 1 width and aggregates them such that each strip is surrounded by a 2 overlap before and after.
  • The second stage involves inverse x and y columns for each 5 strip.
  • In the third stage, the strips are cut into square of 5 by 5 .
In the end, we obtain 5 by 5 cells, with 1 by 1 center elements calculated, and each cell of the center has at least 2 of overlapping cells that ensure that no discontinuity occurs (see Figure 6).
After calculating the forward problem, another script gathers all the 1 by 1 center cells into a single file from which the map can be drawn.
Calculations are performed on the Observatoire Midi-Pyrénées (Toulouse, France) cluster using a bi-sockets CPU Intel Xeon Silver 4210 (Santa Clara, CA, USA) with 20 cores of base frequency 2.20 GHz, RAM memory of 96 GB, and hyperthreading deactivated. Materiel was bought from HPE, France.
Our numerical evaluation of tesseroids differs from [18] as we use the analytical primitives of the radial component and numerically integrate the solution over θ and λ in °, while [18] performs a 3D numerical integration with a Gauss quadrature.
Here, the GSL library [28] is used for numerical integration of the tesseroids with the CQUAD algorithm. The CQUAD integration relies on the Clenshaw–Curtis quadrature rules, which can handle most types of singularities [29]. This quadrature is rather equivalent to the Gauss quadrature in the literature but faster to implement [30] and provides an error estimate on the integration.
The 2D integration is rather quick but remains longer than evaluating an analytical expression. The fact that, to determine the total gravity effect at a particular point, the operator also has to be determined for every rock column around that point still implies a considerable computation time when applied over large areas or high-frequency maps.
We validate our method to calculate tesseroids by comparing it with the method in [18] in Table 1.
Results show that the RMS values between the tesseroid approaches in this study and [18] are 5 mm, 0.05 mGal, and 0.048 E for each gravity operator. These slight mismatches arise from the different numerical approaches used for integrating tesseroid decomposition.
Our tesseroid modelization can then be compared with our radial approximation. The resolution threshold from which the radial approximation can be used, as equivalent to the tesseroid approximation, will be evaluated in order to secure a high-quality simulation.

3. Results

In this section, we will present through residual maps and descriptive statistics the differences between the tesseroid and radial approximations computed over the test area described above.
Our calculations are conducted with the following set of parameter values: G = 6.667 × 10 11   m 3 · kg 1 · s−2, ρ w a t e r = 1030 kg· m−3, ρ l o a d = 2700 kg· m−3, and R e a r t h = 6378 km. The mean depth calculated on the seafloor of the GM region is −4150 m [11]. In this study, we consider only the water–rock density contrast and do not introduce sediments, as previously discussed in [31]. Compensation by elastic flexion is not taken into account as the topographic contribution of the GM guyot is largely dominant. The gravity operators are calculated at the sea surface.
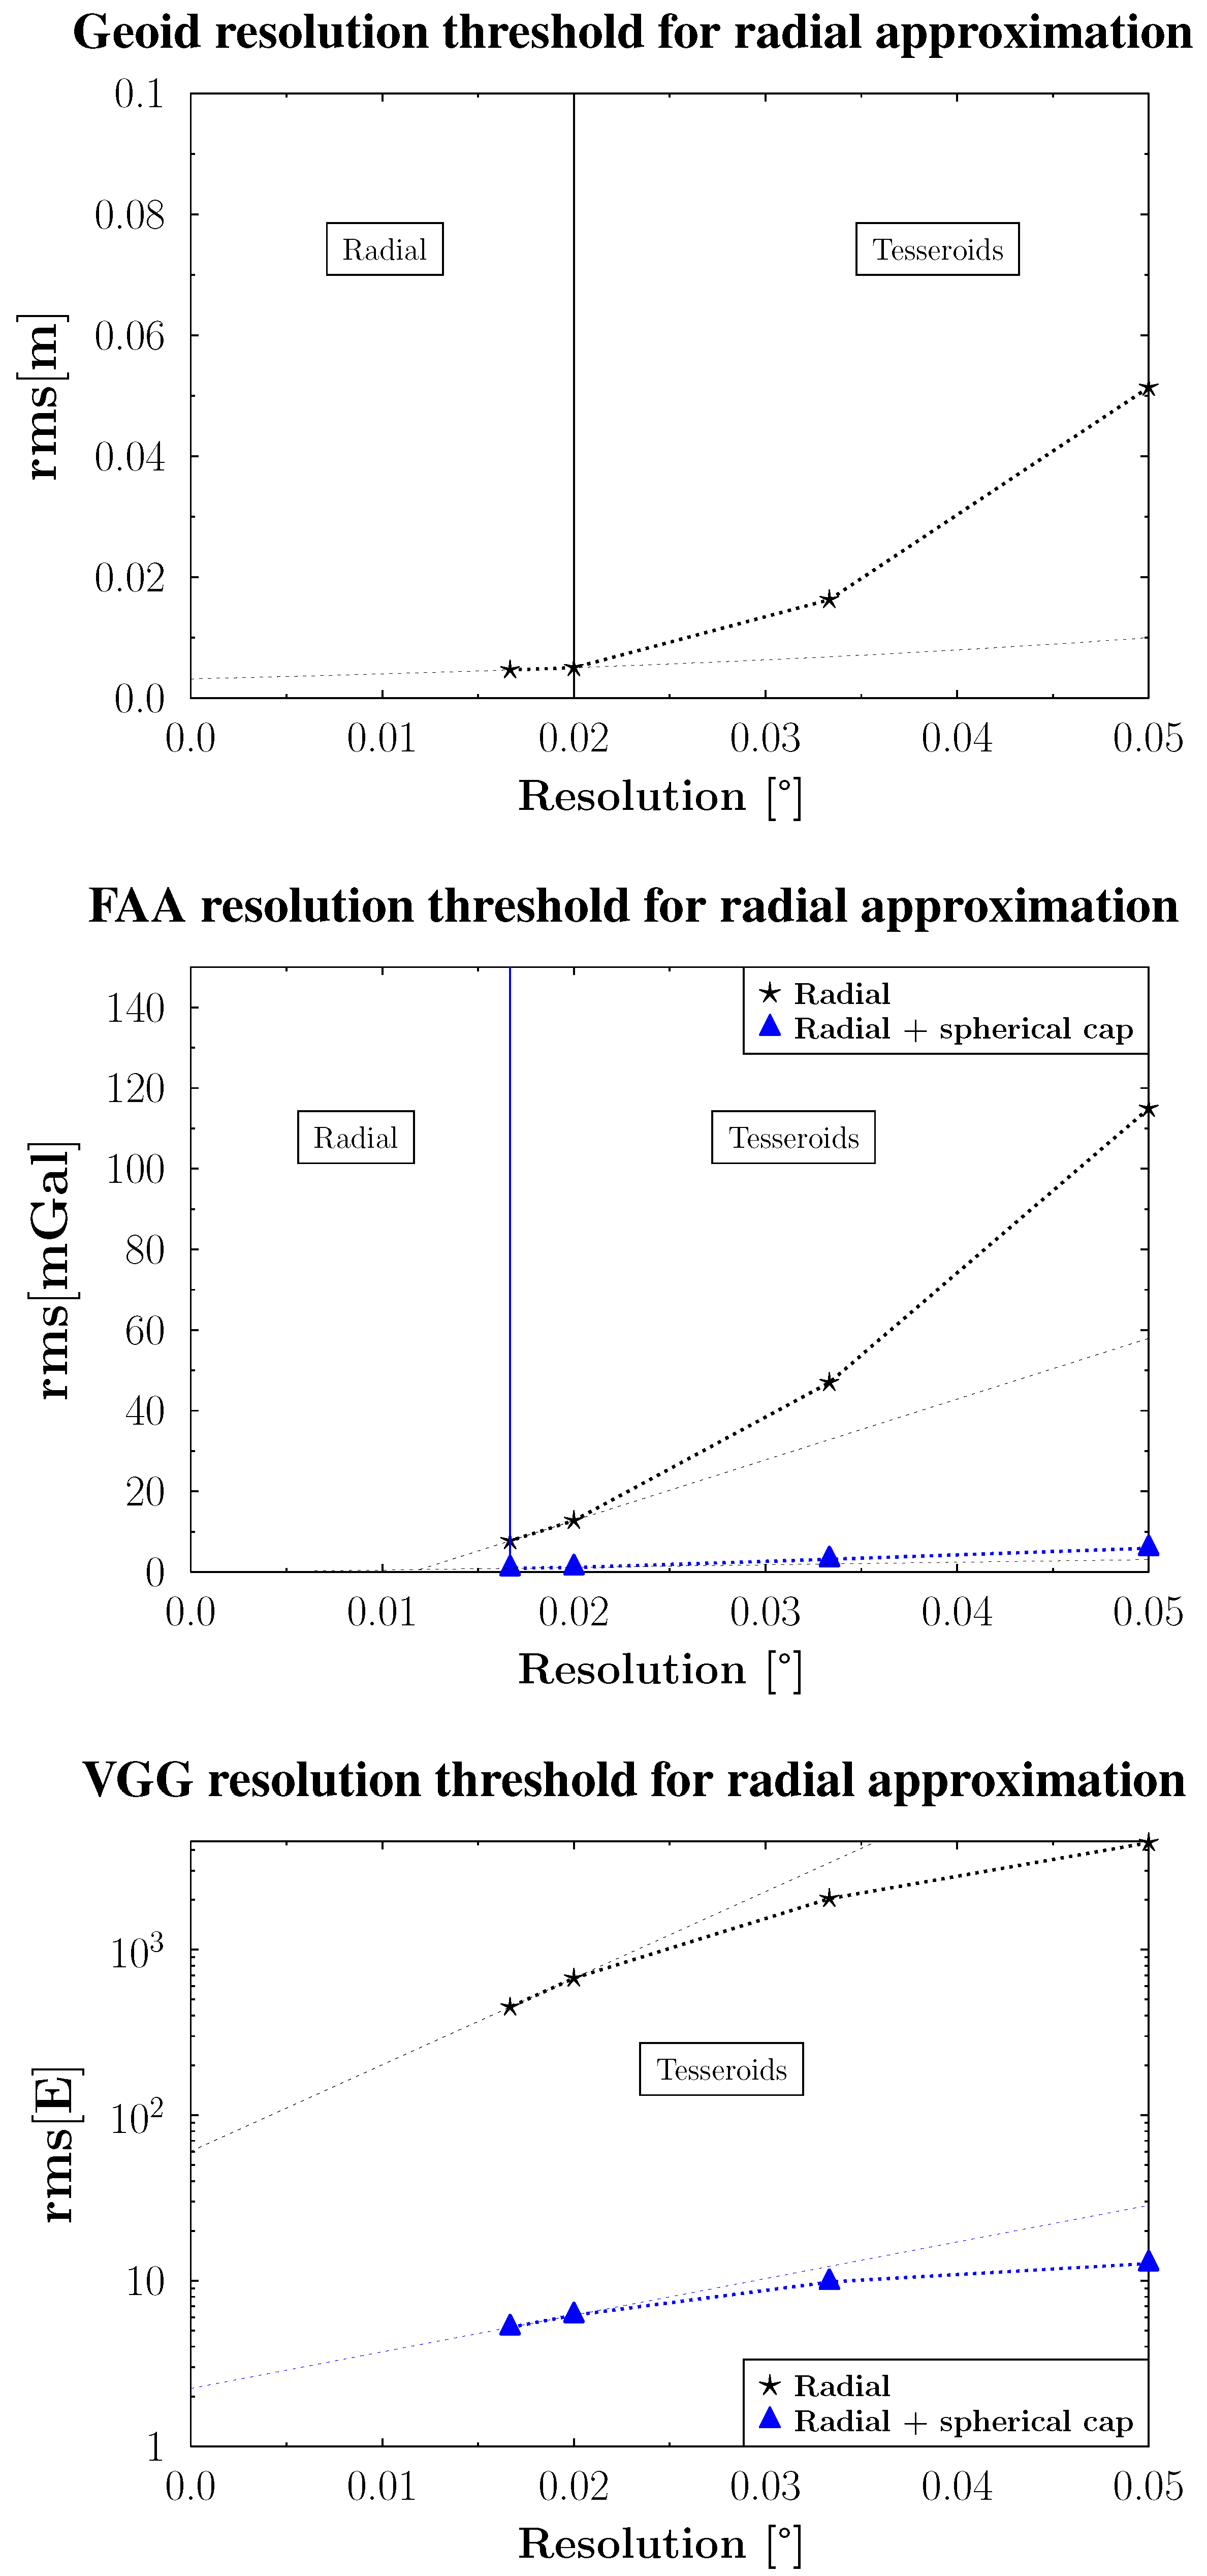
The variations in the RMS values for the tesseroid and radial approximations as a function of the resolution are presented for each gravity operator in Figure 7. Computing at higher resolutions is limited to the accuracy of the altimetry measurement (1’).
Figure 7 is complemented by
  • Table 2, which shows the extreme difference values between the tesseroid and radial approximations for each given resolution and for the three gravity operators.
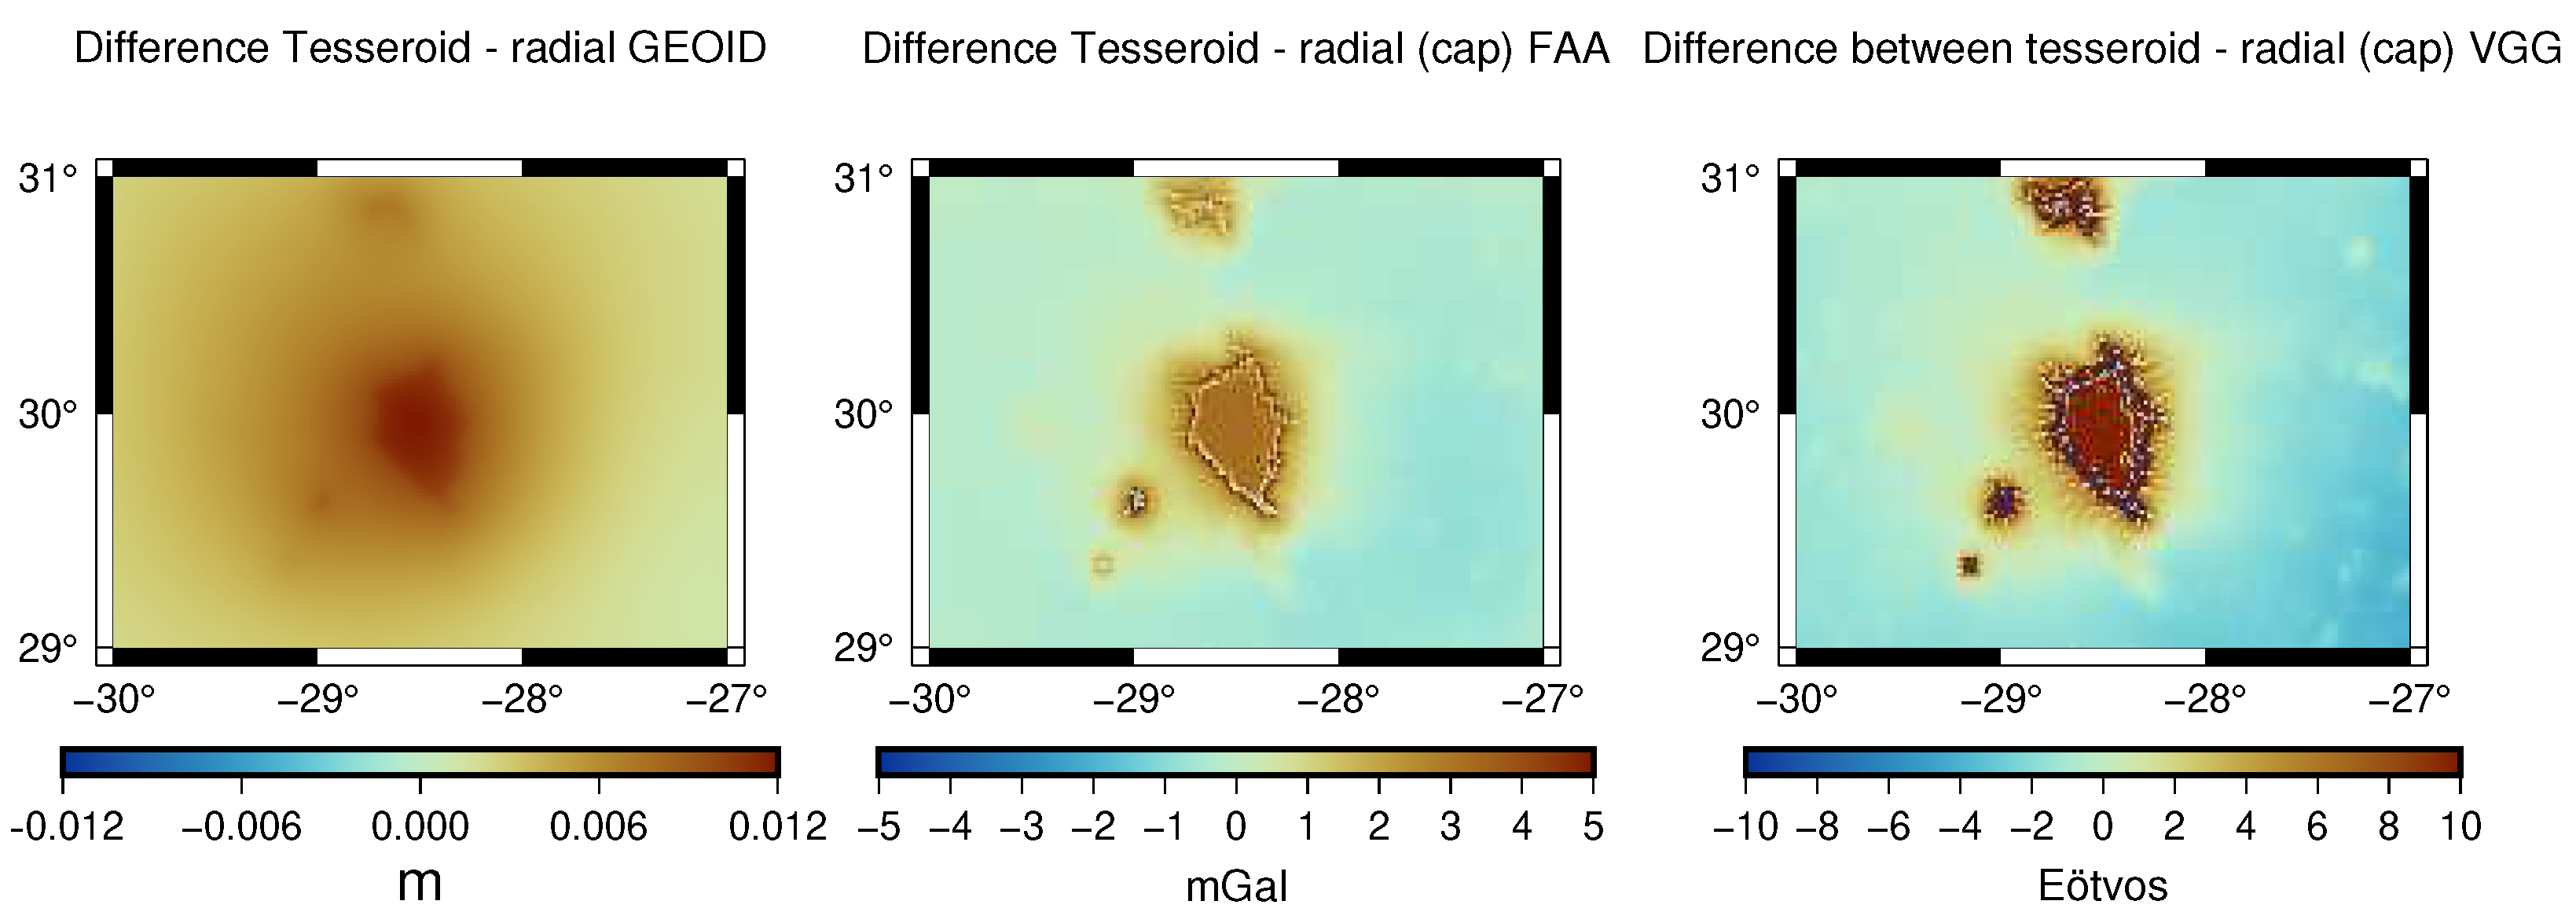
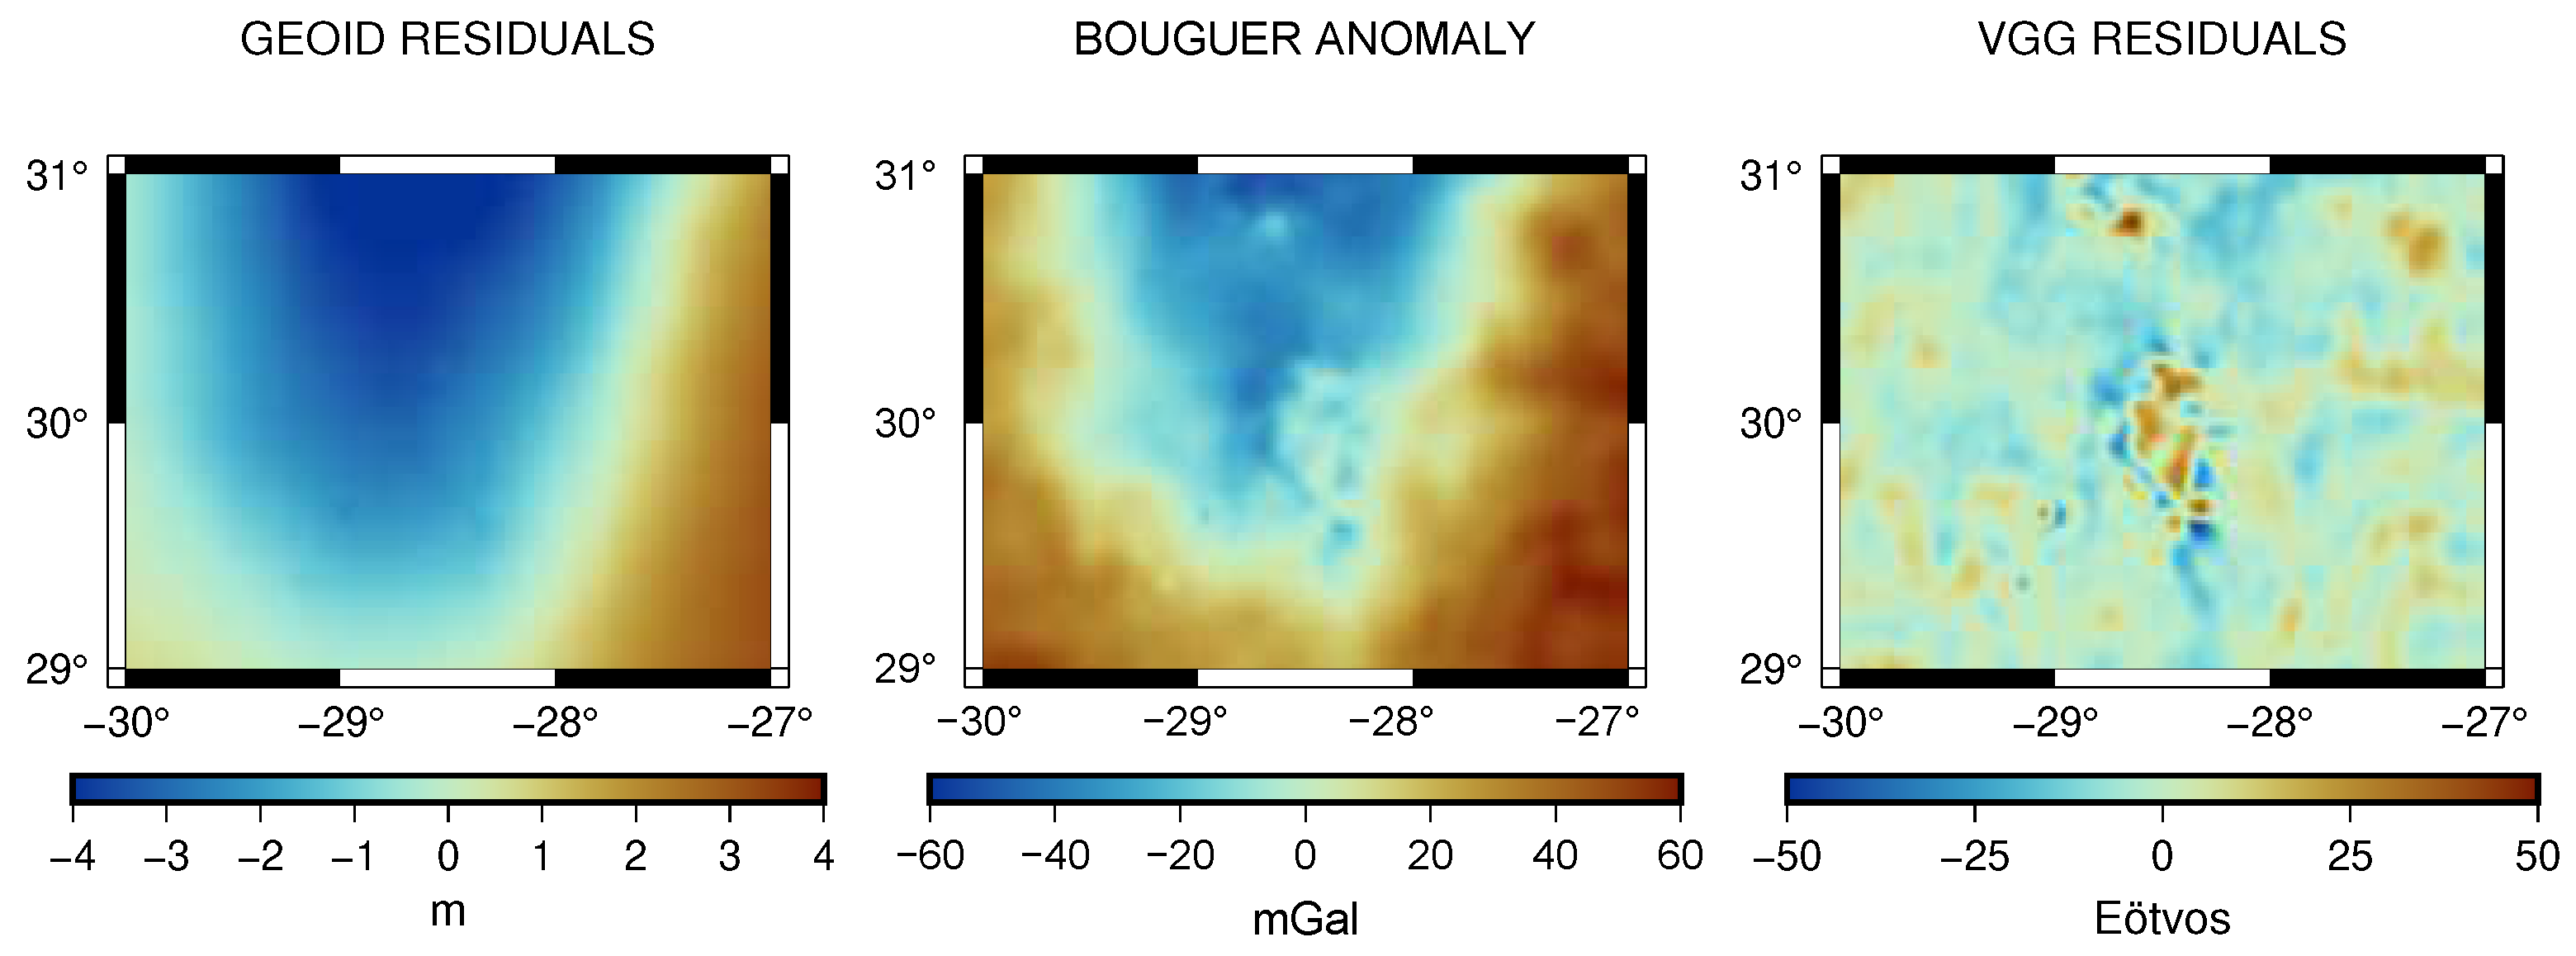
  • Figure 8, which represents a 1’ resolution map of the differences between the simulations obtained with the tesseroid and radial approximations for the geoid, tesseroid, and radial approximations with a spherical cap for the FAA and VGG. The results obtained show the location of the differences between the approximations.
Figure 8, Table 2, and Figure 7 are used to qualitatively determine the resolution thresholds where the radial approximations can be used.
The radial approximations for the VGGs in Figure 7 and Table 2 are calculated with the expression in [13] (Equations (16) and (17)).
Figure 7 shows that the difference between the radial approximation with and without including a spherical cap is large when the grid sampling is large and decreases when the grid sampling becomes smaller. Both methods are equivalent when the resolution tends to zero.
The results show that, for the geoid, the radial approximation is equivalent to the tesseroid for small resolutions (≤ 0.02 ° ), with an RMS of 0.0047 m at 1′ and Max and Min difference values of 0.0106 m and 0.0103 m, respectively.
Regarding the FAA, the radial approximation is not equivalent to the tesseroid even for a 1′ resolution because of a too-large Max difference of 64.6 mGal and an RMS of 7.95 mGal. Using a spherical cap to determine the FAA reduces the Min and Max error values drastically to 7.6 and 8.1 mGal and the RMS to 0.92 mGal. The RMS becomes small, and the maximum and minimum values are located on small seamounts or on the border of the large seamount, as shown in Figure 8. We estimate the resolution threshold at 1′ depending on the accuracy wanted and the area studied when using the radial approximation with the spherical cap method and do not recommend using radial approximation alone to determine the FAA.
The errors in the calculation of the vertical gravity gradient using the radial approximation are not negligible even for a resolution of 1′. The Max value of the difference is much larger than the measurement errors (3972 Eötvös). The utilization of the spherical cap method decreases the error for the Min and Max differences (96.5 Eötvös and 135.1 Eötvös, respectively), which remain too large despite a low RMS of 5.2 Eötvös.
Figure 8 shows that the differences are located around the seamount reconstruction, especially regarding the FAA, for which the Min and Max difference values are clearly identified on the Little Meteor Seamount.
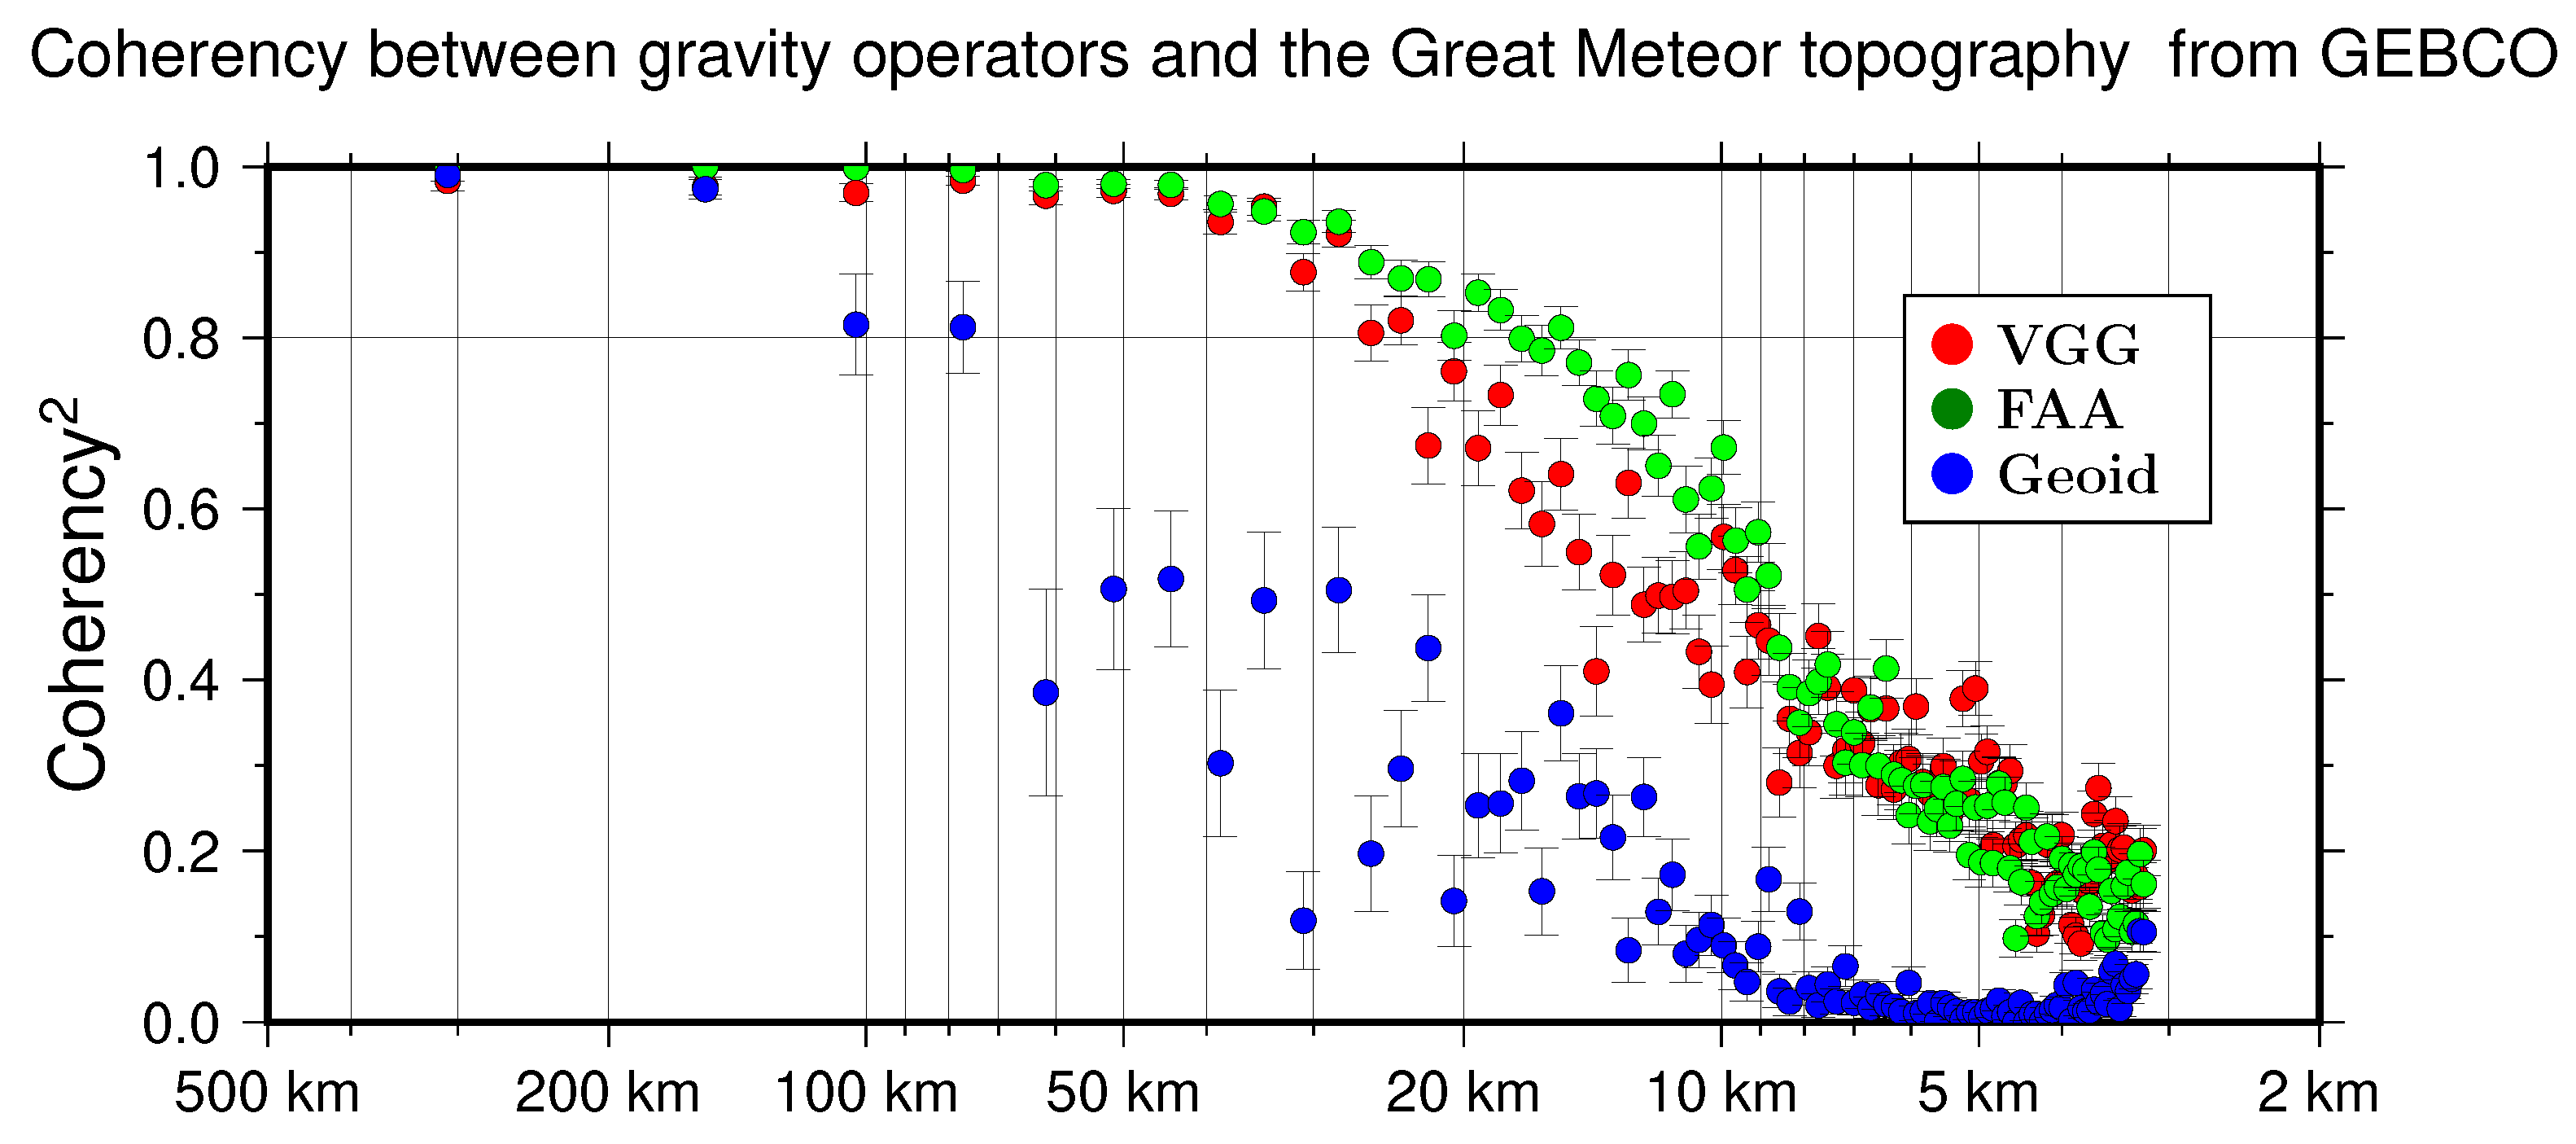
Figure 9 shows the coherency between the GEBCO topography over the Great Meteor area chosen and each gravity operator calculated with the tesseroid approximation. The geoid does not recover small wavelengths as the coherency reaches 0.8 at 80 km but describes the large wavelengths of the topography well. The FAA and VGG both provide good descriptions of the small wavelengths compared to the geoid, but noise from the resampling to a 1′ resolution limits the viability of the results below 16km for the FAA and 20 km for the VGG.
Eventually, we proceed to a comparison with real data from [5] and compute the differences between the data and simulation, as presented in Figure 10 and Figure 11. We filter the simulation at 10 km in order to remove the small wavelengths of the bathymetry contribution not present in the data measurement to perform the Bouguer reduction. The VGG acts as a high-pass filter that removes most of the large wavelengths coming from internal earth signals. The FAA and geoid also contain large wavelengths that are not related to the topography, demonstrating that the gravity signal in the data is lower than expected around the Great Meteor Seamount and at the north of it (in the direction of the rest of the Seewarte Seamounts) and higher than expected everywhere else on the grid. The amplitudes are similar between the simulations and real measurements. Small wavelengths from the ship tracks included in the topography used to compute the simulations are clearly visible when comparing the FAA and VGG simulations to the data measurements.
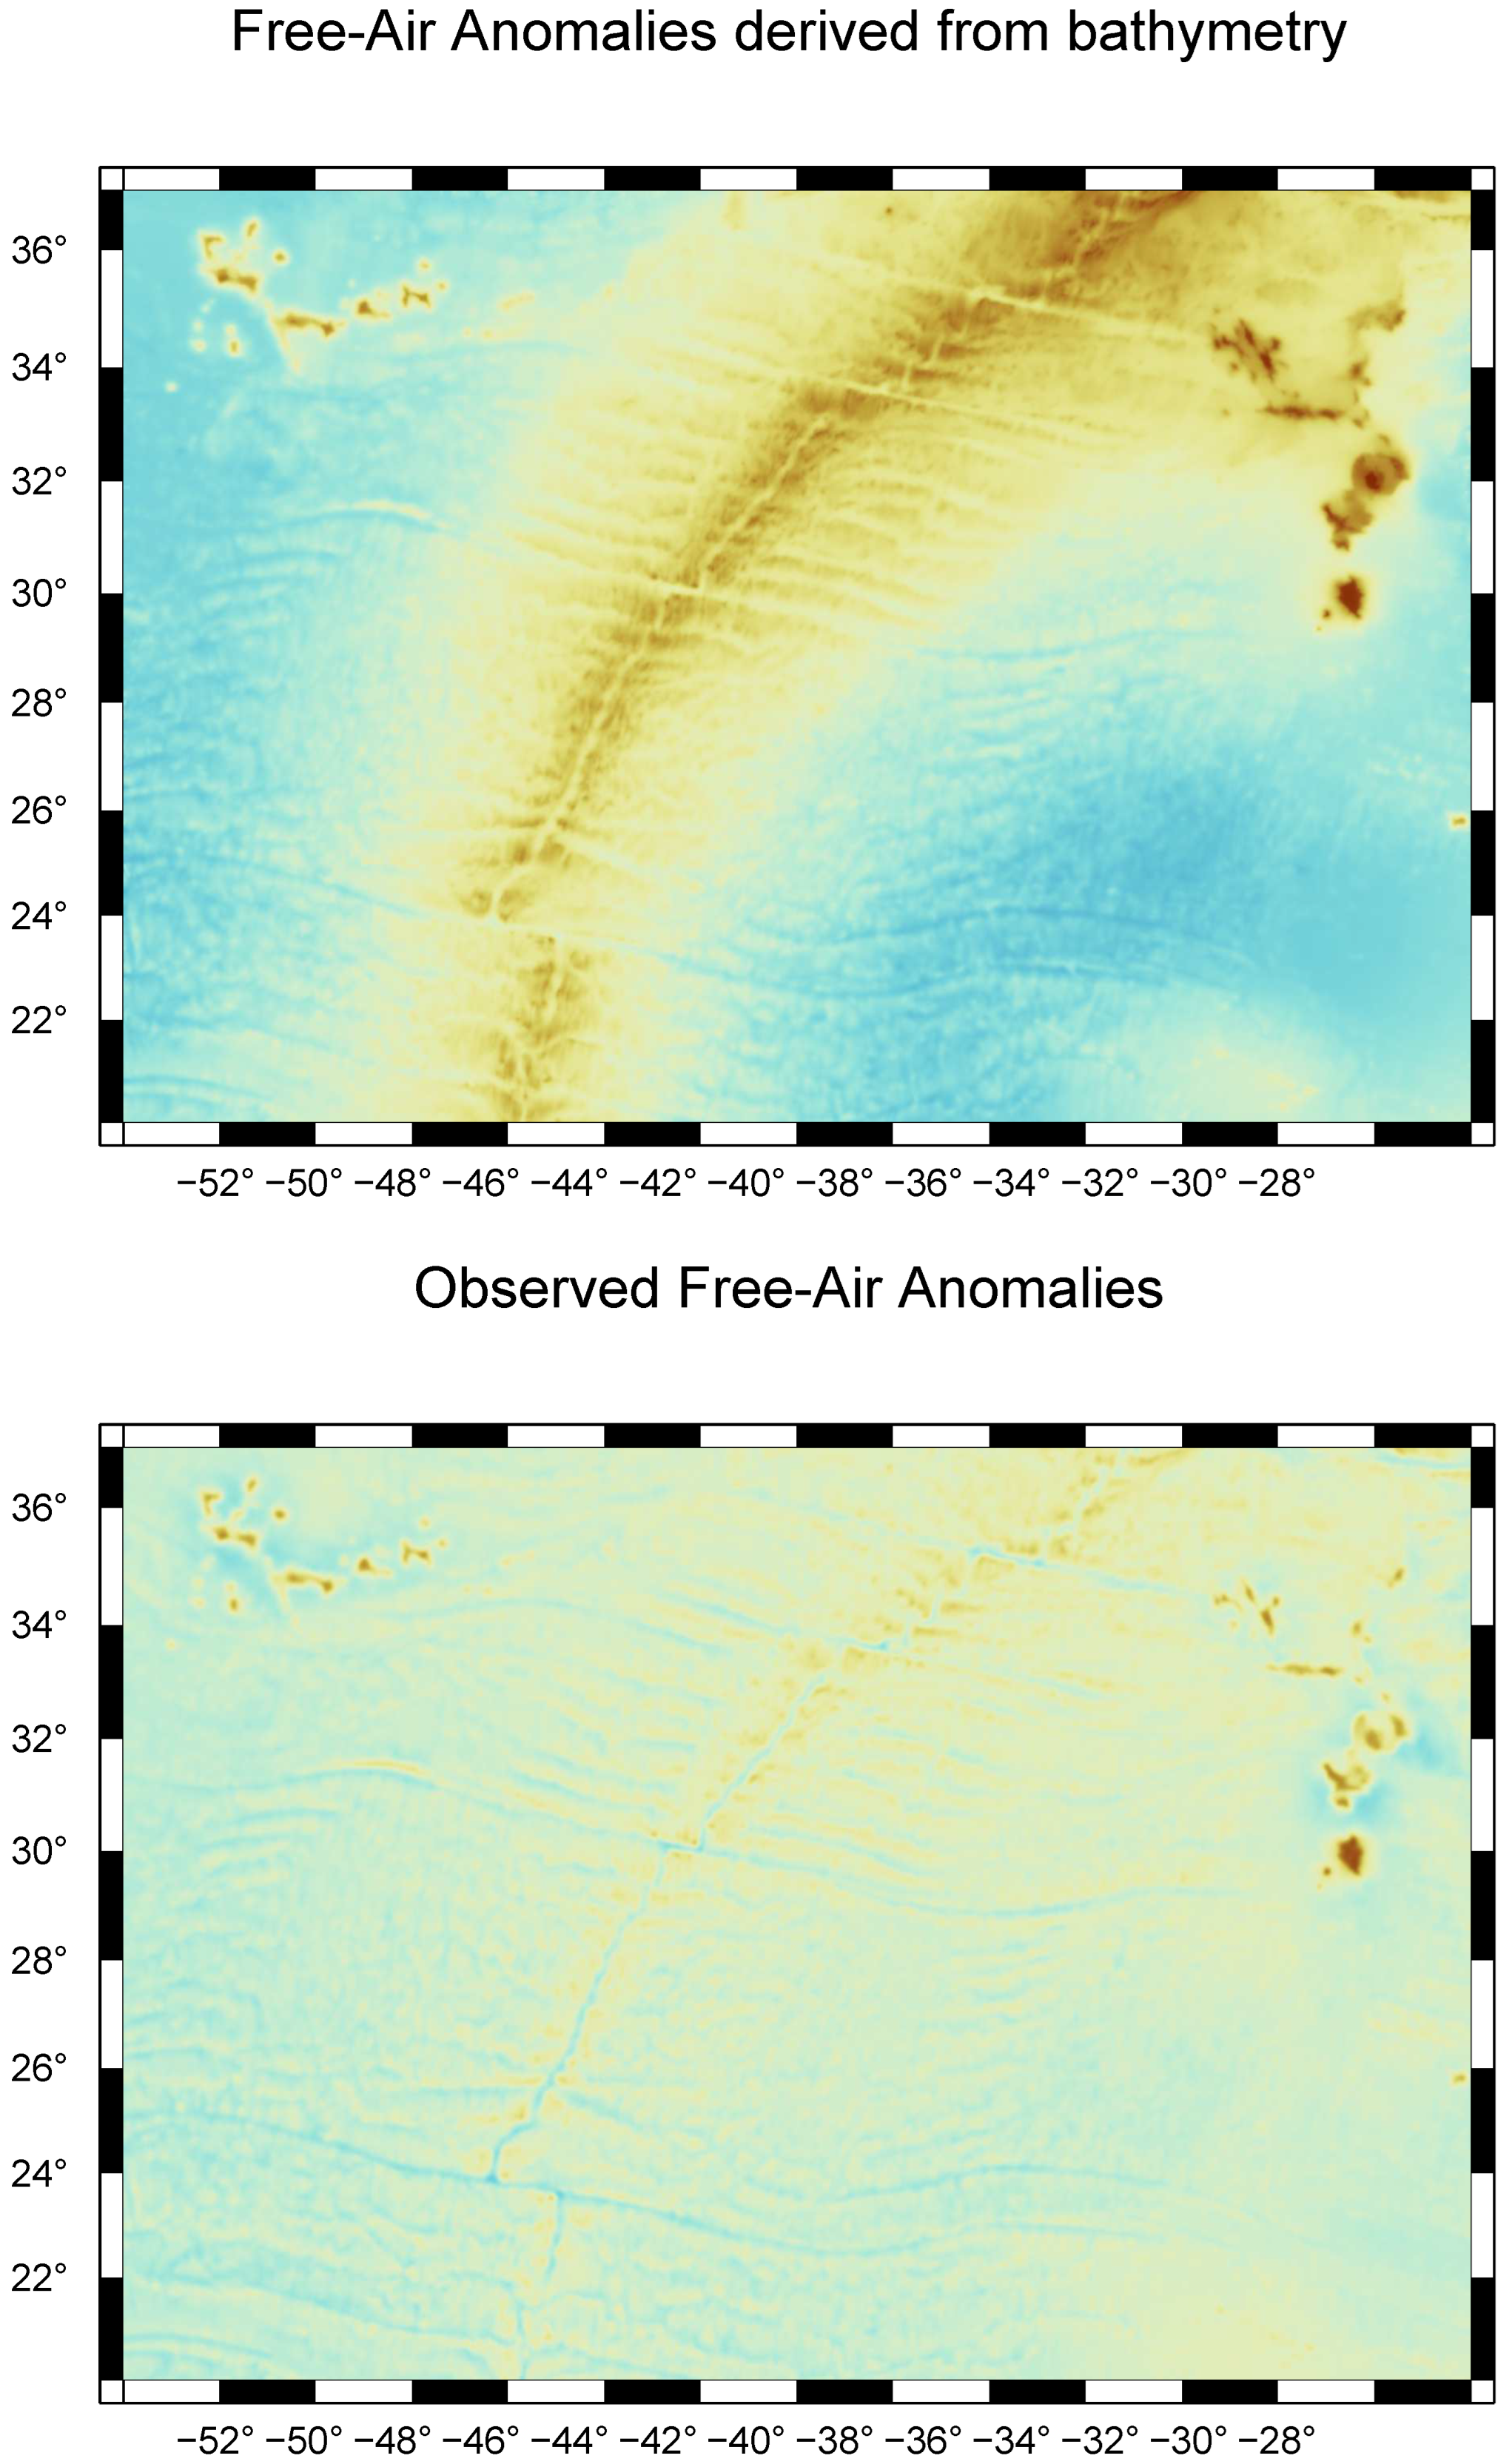
Figure 12 (top) illustrates the 1-min FAA grid derived from the bathymetric data using Equations (11) and (12), employing an optimized radial approximation around a segment of the Mid-Atlantic Ridge (54°W, 26°W, 20°N, 37°N). The computation is conducted using a mosaic of 415 overlapping 5°-by-5° geographical cells. FAA is commonly used in geophysical and geological interpretations. Similar calculations can be processed for geoid heights and vertical gravity gradients. The gravity anomalies deduced by [5] by radar altimetry are also shown in Figure 12 (bottom) for comparison.
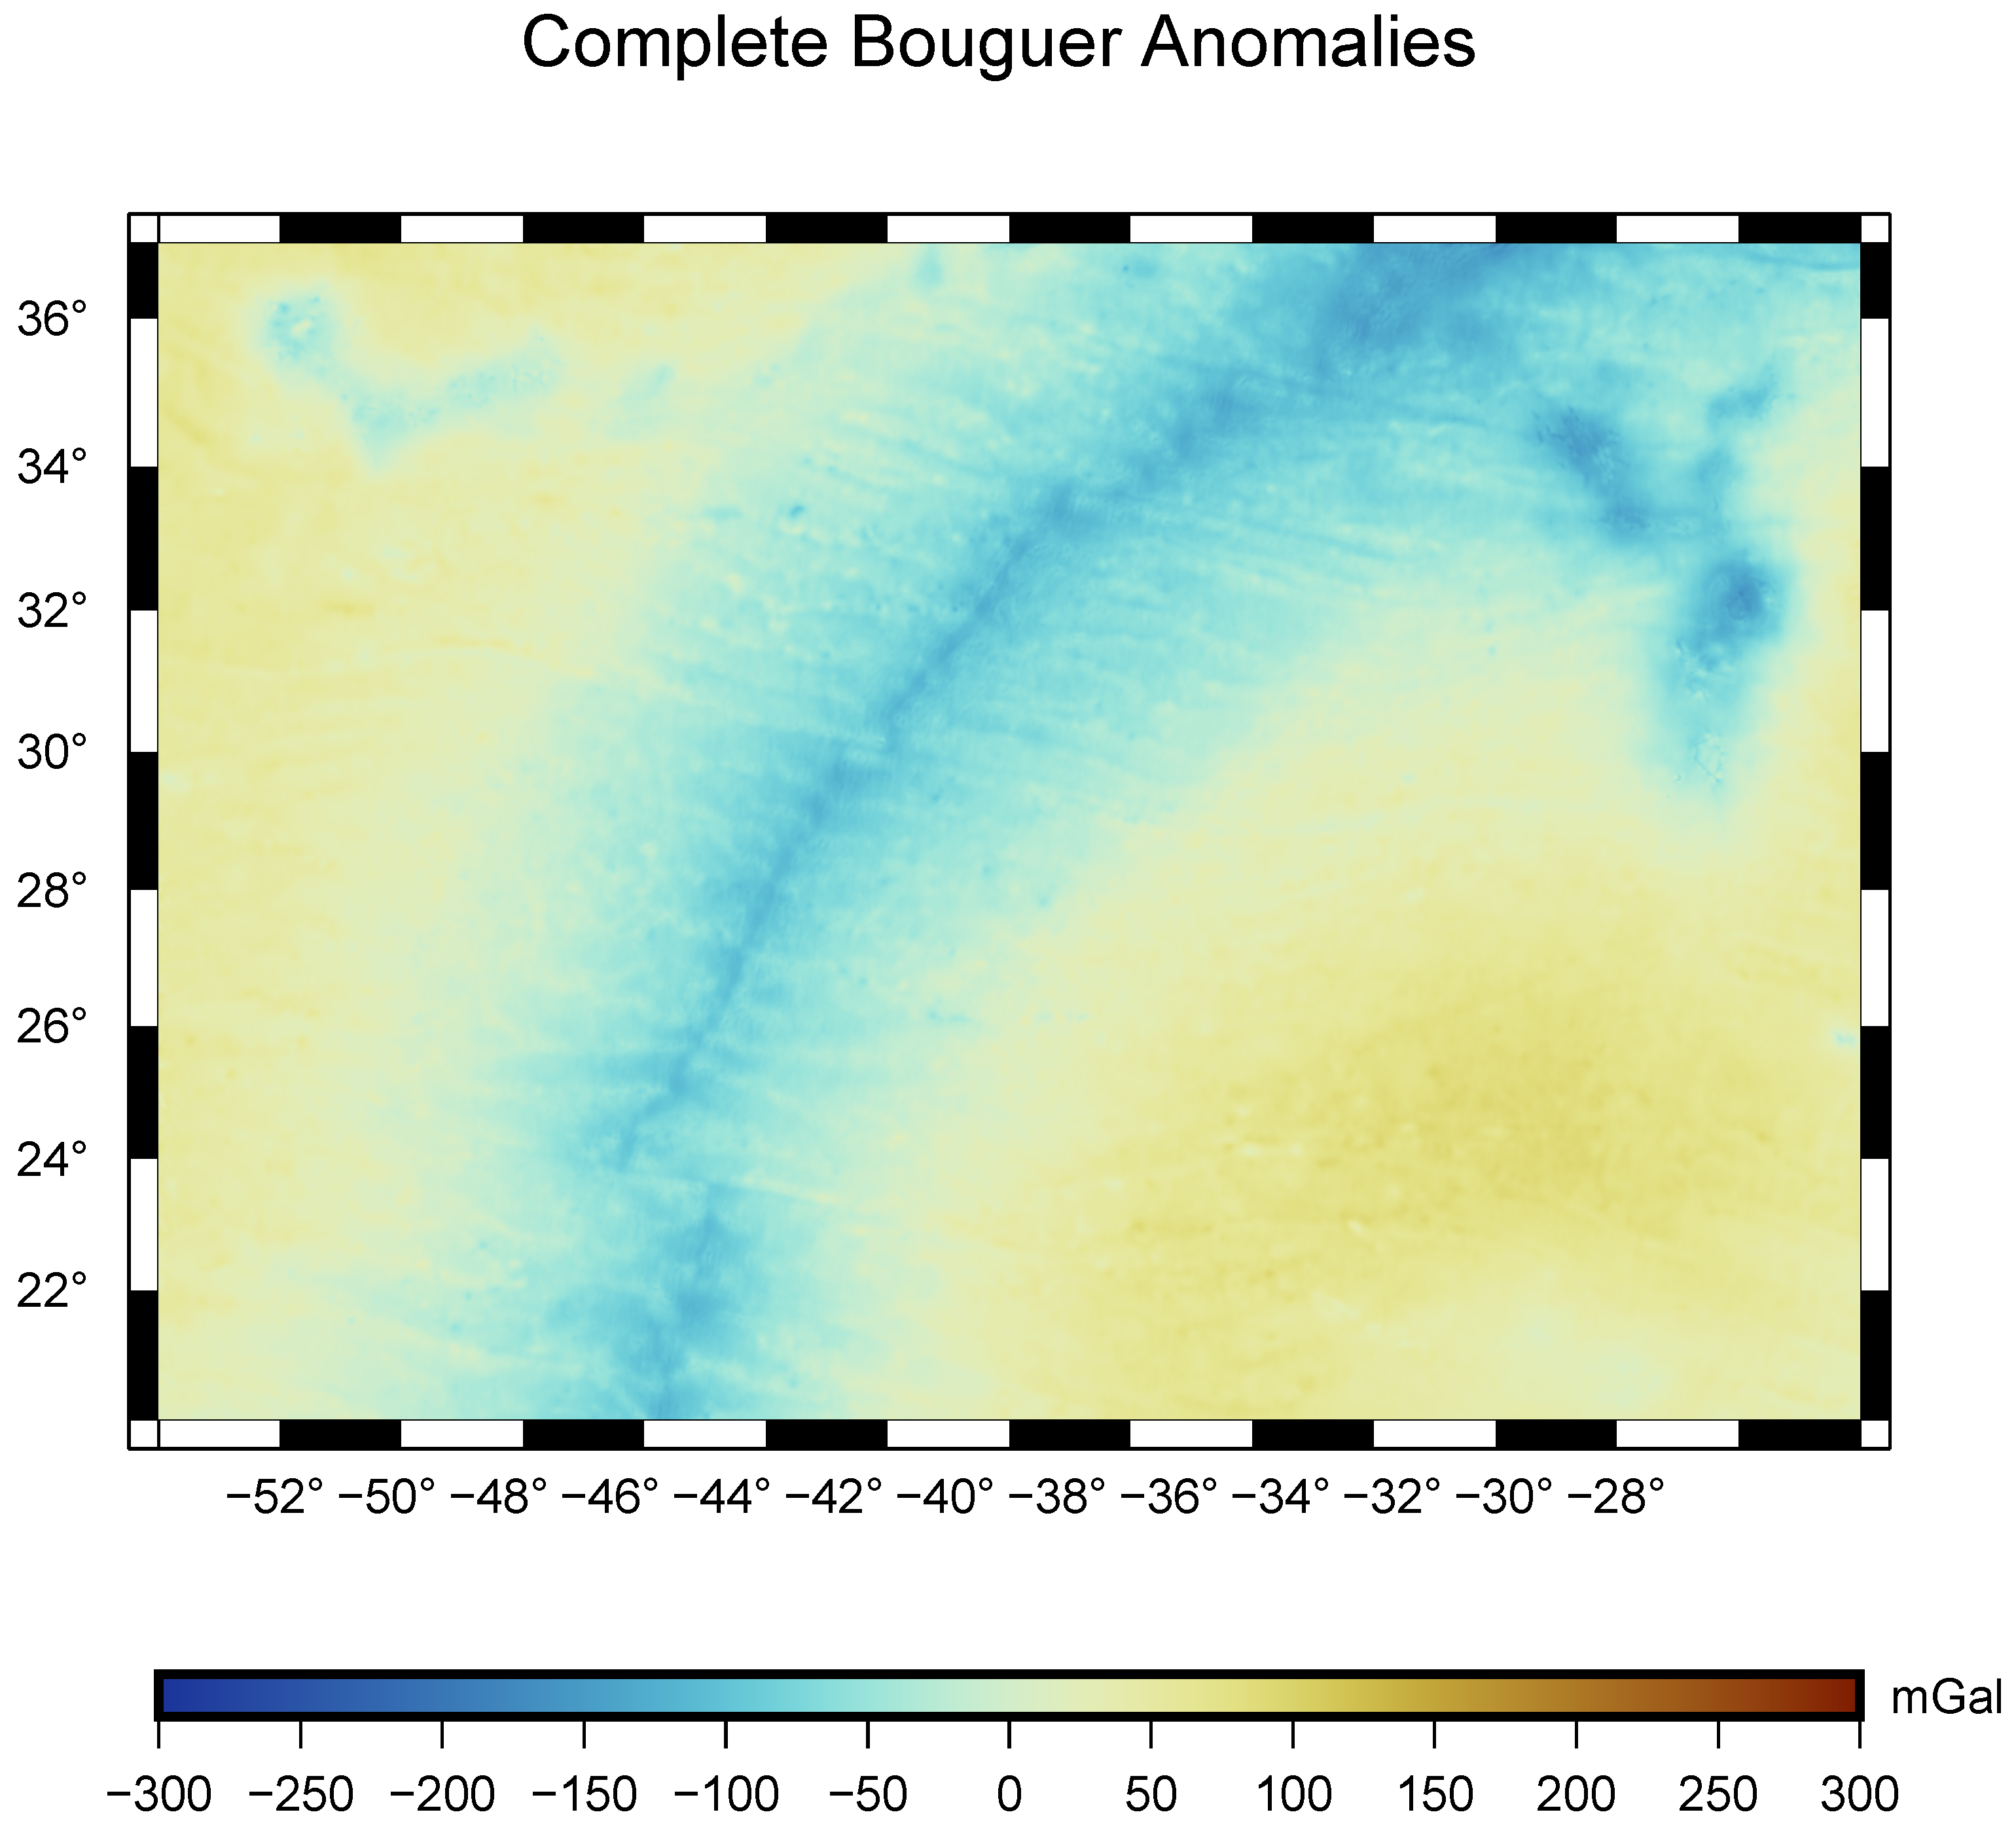
Figure 13 shows the differences between the estimated and observed free-air anomalies resulting in the complete Bouguer anomalies. These anomalies range in amplitude from −174 to 93 mGal, with a mean value of 0.3 mGal and a Root Mean Square (RMS) of 49.5 mGal regarding the effects of the unmodeled contributions of the sediments, compensation, and deep varying density structures at such a large scale of a complete oceanic basin. Alongside other types of measurement, such as seismic data, Bouguer anomalies are essential for deriving lithospheric parameters, including the characteristics of poorly understood sedimentary layers, elastic thickness, crustal thickness, and density variations.

4. Discussion

The classical tesseroids calculated from [18] have been implemented so that their results on the GM seamount can be compared to ours for validation. Our tesseroid calculation of the VGG and that from [18] are in good agreement. The method from [18] is very close to the present study corresponding to a map of very high-frequency low residuals, meaning that both tesseroid methods provide equivalent estimates.
The comparison between the tesseroid and radial approximation strategies has been addressed, the latter always remaining the fastest. However, the radial approximation is not valid at the lowest resolution since, mathematically, it does not take the shape of the rock columns into account.
The differences between the two approaches vary depending on the chosen resolution (or grid sampling) and on the specificity of each gravity operator (see Figure 7). At a resolution of 1′, these differences are on the order of 0.005 m, 0.9 mGal, and 5.22 E, the geoid height providing the lowest difference. The radial approximation is almost equivalent at a 1′ resolution to the tesseroid approximation for the geoid, presenting the advantage of being much faster, which makes it the perfect method for geoid anomaly inversion.
For the FAA, the spherical cap makes a significant contribution by drastically reducing the error regarding the angular approximation in Equation (4). The 3D integration has an exact primitive at ψ = 0 compared to the standard radial approximation consisting of a 1D analytic primitive of the radial component. For values of ψ 0 , the radial primitive is used. The error while computing the difference with the tesseroid approximation comes now only from the ψ 0 part of the angular integral. The improvement in the error, while comparing FAA and FAA(cap) in Table 2 and Figure 7, comes from the exact integration of the angular part at ψ = 0 .
The RMS, Min, and Max difference values (see Table 2) become of the order of the error measurement for the FAA in [5], but [32] shows that those measurement errors are optimistic and can be locally larger.
However, the radial approximation applied to the VGG, even using the spherical cap method, results in important errors compared with the tesseroid approximation. The results show that, by considering higher derivatives of the gravity potential and consequently including higher frequencies, the simulations are sensible to details that make it necessary to consider the real shape of the rock column in our modelization. Therefore, the use of this approximation should be undertaken carefully in gravity data simulation and inversion and especially for a second derivative like the VGG. Yet, inversion of real data is a challenging aim that has already been largely addressed. Despite the non-negligible difference with tesseroids, standard radial approximation has been yielding satisfying results [13].
The spectral analysis presented in Figure 9 shows that the sensitivity of the VGG to noise induces a coherency lower than the FAA, even if the VGG is supposed to better describe a low-wavelength signal. Tests have shown that the spectral analysis for coherency depends upon the size and nature of the considered oceanic province. The coherency is global over the test area, and the region of the Great Meteor presents low rugosity with a large flat seamount and two small seamounts only, which do not favor high gradients.
Those results are obtained from the synthetic case of a topography from which a gravity anomaly is calculated and do not include many features that affect real data, like density distribution, deep earth signals, or earth measurement. The reduction in real data using our gravity simulations shows that the compensation appears around the Great Meteor Seamount. The geoid and FAA simulated from the topography do not take compensation into account.
Eventually, the presence of sediments is not considered in the simulation, but they surely exist around the Great Meteor Seamount at around 400 m of thickness [33] and up to 200–900 m at the top of the seamount [34]. Consequently, sediments of various density can also contribute to the differences observed.
To have access to more details of the underwater topography or extend the simulation of the gravity functionals to larger oceanic areas, increasing the spatial resolution of the gravity grids remains challenging as the number of data points increases. As demonstrated in this study, this can be optimized by dispatching the computational work on more threads for tesseroids, or fast radial approximation when the spatial resolution is high enough.

5. Conclusions

Theoretical tesseroids and radial-based operators for gravity modeling have been successfully derived to accurately estimate the realistic geoid height, vertical gravity, and gradient anomaly grids from the regional seafloor topography data around the Great Meteor Seamount. Vertical gravity gradient modeling is particularly suitable for the smaller scales of the undersea region as geoid measurements are better adapted to the larger spatial components of the gravity field. In order to reduce the computation time, numerical optimization is necessary, especially when the spatial resolution becomes finer, such as a couple of kilometers. Parallelization improves the computation time by a factor of 12 for a 2 by 3 grid at a 1′ resolution. When both the tesseroid and radial modeling methods provide very similar numerical estimates, the radial method is faster and preferred when the resolution (or spatial sampling of the gravity grid) is less than 1′ for geoids. Radial approximation combined with the use of a spherical cap can also be used to determine the FAA, but this strategy is not recommended to calculate the VGG as the difference with the tesseroid approximation is considerable. Those results are summarized in Table 3.
These optimized modeling strategies enable the terrain reduction or inversion of gravity observations in larger oceanic areas, but they need to include more information on rock density difference, sediment layers, as well as the effects of the seamount load compensation.

Author Contributions

Conceptualization, D.F. and L.S.; methodology, D.F., L.S. and G.R.; software, D.F. and B.P.; validation, D.F. and L.S.; formal analysis, D.F. and L.S.; investigation, D.F. and L.S.; resources, D.F. and L.S.; data curation, D.R., T.S. and C.S.; writing—original draft preparation, D.F., L.S. and G.R.; writing—review and editing, D.F., L.S., G.R., J.D., B.P., D.R., T.S. and C.S.; visualization, D.F. and L.S.; supervision, L.S. and G.R.; project administration, D.R. and L.S.; funding acquisition, D.R. and L.S. All authors have read and agreed to the published version of the manuscript.

Funding

This study, led by Shom, was carried out as part of the APOGE Defense Technology Project funded by the French Ministry of Defense/DGA. Convention 22CP07, binding together the participants of this project, was co-financed by CNRS/Université Toulouse 3 GET JRU5563. This work was also supported by Centre Nationale d’Études Spatiales (CNES) through the TOSCA program.

Data Availability Statement

The raw data supporting the conclusions of this article will be made available by the authors on request.

Acknowledgments

The authors wish to thank D. Gazen of Laboratoire d’Aérologie for his advice and the access to the NUWA cluster in Toulouse, Anne-Marie Cousin of the GET laboratory for the graphical processing, and the anonymous reviewers for their fruitful comments.

Conflicts of Interest

The authors declare no conflicts of interest.

Abbreviations

The following abbreviations are used in this manuscript:
FAAFree-Air Anomaly
VGGVertical Gravity Gradient
GMGreat Meteor guyot

References

  1. Hell, B.; Broman, B.; Jakobsson, L.; Jakobsson, M.; Magnusson, A.; Wiberg, P. The Use of Bathymetric Data in Society and Science: A Review from the Baltic Sea. AMBIO 2012, 41, 138–150. [Google Scholar] [CrossRef] [PubMed]
  2. Mayer, L.; Jakobsson, M.; Allen, G.; Dorschel, B.; Falconer, R.; Ferrini, V.; Lamarche, G.; Snaith, H.; Weatherall, P. The Nippon Foundation—GEBCO Seabed 2030 Project: The Quest to See the World’s Oceans Completely Mapped by 2030. Geosciences 2018, 8, 63. [Google Scholar] [CrossRef]
  3. Sandwell, D.; Garcia, E.; Soofi, K.; Wessel, P.; Chandler, M.; Smith, W.H.F. Toward 1-mGal accuracy in global marine gravity from CryoSat-2, Envisat, and Jason-1. Lead. Edge 2013, 32, 892–899. [Google Scholar] [CrossRef]
  4. Harper, H.; Tozer, B.; Sandwell, D.T.; Hey, R.N. Marine Vertical Gravity Gradients Reveal the Global Distribution and Tectonic Significance of “Seesaw” Ridge Propagation. J. Geophys. Res. Solid Earth 2021, 126, e2020JB020017. [Google Scholar] [CrossRef]
  5. Sandwell, D.; Müller, D.; Smith, W.; Garcia, E.; Francis, R. New global marine gravity from CryoSat-2 and Jason-1 reveals buried tectonic structure. Science 2014, 346, 65–67. [Google Scholar] [CrossRef]
  6. Parker, R. The rapid calculation of potential anomalies. Geophys. J. Int. 1973, 31, 447–455. [Google Scholar] [CrossRef]
  7. Sandwell, D.T.; Smith, W.H. Chapter 12 Bathymetric Estimation. In Satellite Altimetry and Earth Sciences; Fu, L.L., Cazenave, A., Eds.; Academic Press: Cambridge, MA, USA, 2001; Volume 69, pp. 441–xxxiv. [Google Scholar] [CrossRef]
  8. Tozer, B.; Sandwell, D.T.; Smith, W.H.F.; Olson, C.; Beale, J.R.; Wessel, P. Global Bathymetry and Topography at 15 Arc Sec: SRTM15+. Earth Space Sci. 2019, 6, 1847–1864. [Google Scholar] [CrossRef]
  9. Tarantola, A. Inverse Problem Theory: Methods for Data Fitting and Model Parameter Estimation; Elsevier: New York, NY, USA, 1987. [Google Scholar]
  10. Calmant, S. Seamount topography by least-squares inversion of altimetric geoid heights and shipborne profiles of bathymetry and/or gravity anomalies. Geophys. J. Int. 1994, 119, 428–452. [Google Scholar] [CrossRef]
  11. Seoane, L.; Ramillien, G.; Beirens, B.; Darrozes, J.; Rouxel, D.; Schmitt, T.; Salaün, C.; Frappart, F. Regional Seafloor Topography by Extended Kalman Filtering of Marine Gravity Data without Ship-Track Information. Remote Sens. 2022, 14, 169. [Google Scholar] [CrossRef]
  12. Nozaki, K. The generalized Bouguer anomaly. Earth Planets Space 2006, 58, 287–303. [Google Scholar] [CrossRef]
  13. Fan, D.; Li, S.; Li, X.; Yang, J.; Wan, X. Seafloor Topography Estimation from Gravity Anomaly and Vertical Gravity Gradient Using Nonlinear Iterative Least Square Method. Remote Sens. 2021, 13, 64. [Google Scholar] [CrossRef]
  14. Makhloof, A.A.; Ilk, K.H. Effects of topographic-isostatic masses on gravitational functionals at the Earth’s surface and at airborne and satellite altitudes. J. Geod. 2008, 82, 93–111. [Google Scholar] [CrossRef]
  15. Ramillien, G.L. Density interface topography recovered by inversion of satellite gravity gradiometry observations. J. Geod. 2017, 91, 881–895. [Google Scholar] [CrossRef]
  16. Grombein, T.; Seitz, K.; Heck, B. Optimized formulas for the gravitational field of a tesseroid. J. Geod. 2013, 87, 645–660. [Google Scholar] [CrossRef]
  17. Wild-Pfeiffer, F. A comparison of different mass elements for use in gravity gradiometry. J. Geod. 2008, 82, 637–653. [Google Scholar] [CrossRef]
  18. Uieda, L.; Barbosa, V.; Braitenberg, C. Tesseroids: Forward-modeling gravitational fields in spherical coordinates. Geophysics 2016, 81, F41–F48. [Google Scholar] [CrossRef]
  19. Ramillien, G.; Wright, I.C. Predicted seafloor topography of the New Zealand region: A nonlinear least squares inversion of satellite altimetry data. J. Geophys. Res. Solid Earth 2000, 105, 16577–16590. [Google Scholar] [CrossRef]
  20. International Hydrographic Organization; Intergovernmental Oceanographic Commission. The IHO-IOC GEBCO Cook Book; IHO: Monaco City, Monaco, 2018; 416p. [Google Scholar]
  21. Mohn, C.; Beckmann, A. Structure and retention potential of the flow at Great Meteor Seamount. In Proceedings of the EGS-AGU-EUG Joint Assembly, Nice, France, 6–11 April 2003; p. 5688. [Google Scholar]
  22. Verhoef, J. A Geophysical Study of the Atlantis-Meteor Seamount Complex. Ph.D. Thesis, Instituut voor Aardwetenschappen der Rijksuniversiteit te Utrecht, Utrecht, The Netherlands, 1984. [Google Scholar]
  23. Watts, A.B.; Cochran, J.R.; Selzer, G. Gravity anomalies and flexure of the lithosphere: A three-dimensional study of the Great Meteor Seamount, northeast Atlantic. J. Geophys. Res. (1896–1977) 1975, 80, 1391–1398. [Google Scholar] [CrossRef]
  24. Mohn, C. Spotlight: Great Meteor Seamount. Oceanography 2010, 23, 106–107. [Google Scholar] [CrossRef]
  25. Weatherall, P.; Marks, K.M.; Jakobsson, M.; Schmitt, T.; Tani, S.; Arndt, J.E.; Rovere, M.; Chayes, D.; Ferrini, V.; Wigley, R. A new digital bathymetric model of the world’s oceans. Earth Space Sci. 2015, 2, 331–345. [Google Scholar] [CrossRef]
  26. Sanderson, C.; Curtin, R. Armadillo: A template-based C++ library for linear algebra. J. Open Source Softw. 2016, 1, 26. [Google Scholar] [CrossRef]
  27. Sanderson, C.; Curtin, R. Practical Sparse Matrices in C++ with Hybrid Storage and Template-Based Expression Optimisation. Math. Comput. Appl. 2019, 24, 70. [Google Scholar] [CrossRef]
  28. Gough, B. GNU Scientific Library Reference Manual; Network Theory Ltd.: Godalming, UK, 2009. [Google Scholar]
  29. Gonnet, P. Increasing the Reliability of Adaptive Quadrature Using Explicit Interpolants. ACM Trans. Math. Softw. 2010, 37, 1–32. [Google Scholar] [CrossRef]
  30. Trefethen, L.N. Is Gauss Quadrature Better than Clenshaw-Curtis? SIAM Rev. 2008, 50, 67–87. [Google Scholar] [CrossRef]
  31. Ramillien, G.; Wright, I. Seamount gravity anomaly modelling with variably thick sediment cover. Mar. Geophys. Res. 2002, 23, 13–23. [Google Scholar] [CrossRef]
  32. Rouxel, D.; Sarzeaud, O.; Lequentrec-lalancette, M.F. Using Marine Data to Estimate the Accuracy of Free Air Gravity Anomaly Models Derived From Satellite Altimetry. Earth Space Sci. 2023, 10, e2022EA002672. [Google Scholar] [CrossRef]
  33. Hinz, K. The Great Meteor Seamount: Results of seismic reflection measurements with a pneumatic sound sorce, and their geological interpretation. METEOR Forschungsergebnisse Reihe C Geol. Und Geophys. 1969, 2, 63–77. [Google Scholar]
  34. Weigel, W.; Grevemeyer, I. The Great Meteor seamount: Seismic structure of a submerged intraplate volcano. J. Geodyn. 1999, 28, 27–40. [Google Scholar] [CrossRef]
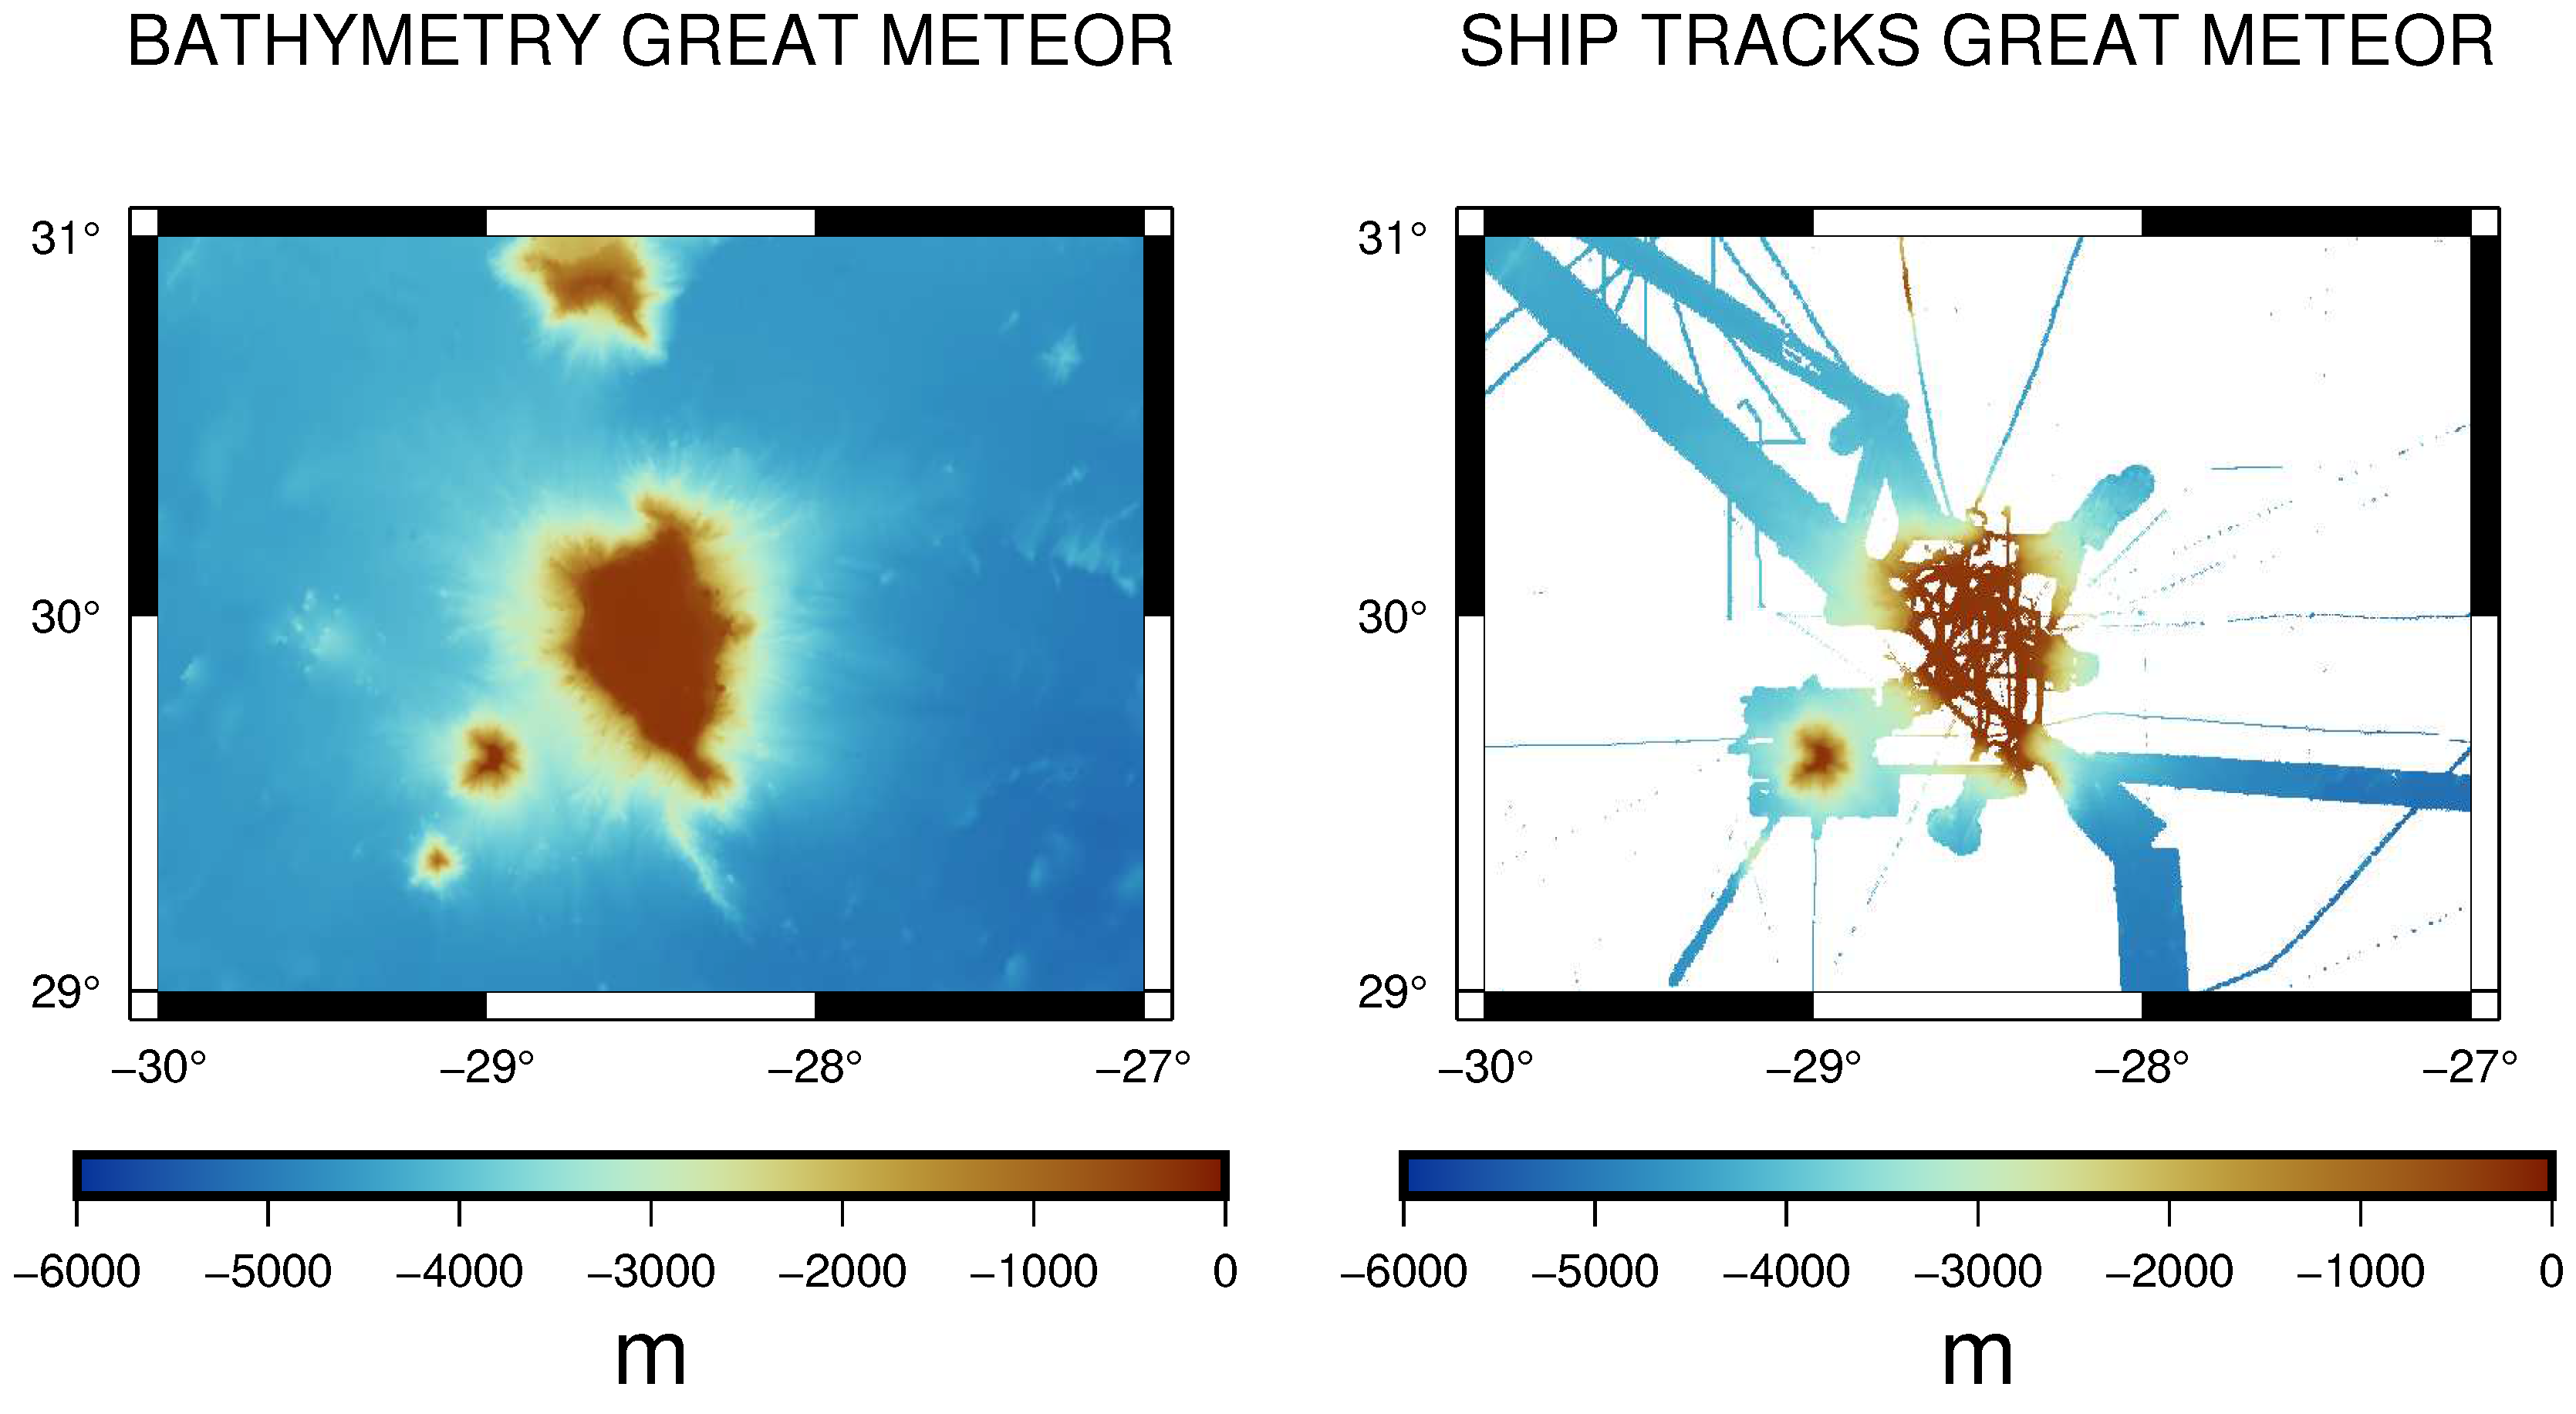
Figure 1. Bathymetry available in the region of the Great Meteor Seamount from the global GEBCO grid (left) and sparse depth ship tracks of GEBCO (altimetry data excluded), gmrt, MNT terrestrial Copernicus, and the SHOM free access database.
Remotesensing 16 04031 g001
Figure 2. Bathymetry available in the region of a segment of the Mid-Atlantic Ridge (54°W, 26°W, 20°N, 37°N) from the global GEBCO grid, including the Great Meteor Seamount area.
Remotesensing 16 04031 g002
Figure 3. Schematic view of the volume element Δ Ω to be integrated for computing gravity operators, and notations used in the study. P is the observation point and M is the material mass element.
Remotesensing 16 04031 g003
Figure 4. Schematic view of the spherical cap. At ψ = 0 , the integral over the entire spherical cap is calculated. At ψ 0 , the integral over the orange area is added, and the integral over the blue area is subtracted. At the end, we recover the total integral over the topography and reduce the error on the radial approximation by performing an exact integral on the plateau and completing with the radial approximation, only locally considering the difference with the topography.
Remotesensing 16 04031 g004
Figure 5. Speed up for the Great Meteor grid at a resolution of 1′ (∼1.8 km) with respect to the number of cores using OpenMP 4.5 parallelization.
Remotesensing 16 04031 g005
Figure 6. 5 by 5 cell (blue square) with the effective calculated 1 by 1 cell in orange and the overlap cells in blue 2 around the calculated cell. The next adjacent cells are shown by the 5 by 5 white square delimited by black lines. Only the 1 by 5 beside the cell of interest is visible in white.
Remotesensing 16 04031 g006
Figure 7. Modeled gravity operators’ RMS values between our tesseroid and radial-based estimations for (top) geoid, (middle) FAA, and (bottom) VGG for standard radial approximation (black) and radial approximation + spherical cap (blue). Threshold resolution is indicated with a vertical line. The dotted lines indicate a linear extrapolation at higher resolutions.
Remotesensing 16 04031 g007
Figure 8. Modeled gravity operators and differences between our tesseroid and radial-based estimations for geoid (left), FAA (center), and VGG (right) at 1′ resolution.
Remotesensing 16 04031 g008
Figure 9. Spectrum analysis of the three gravity functionals in the specific Great Meteor region; long-wavelength content is described by the geoid height (blue), while vertical gradient (green) is well-adapted to sense short wavelengths of the seafloor topography.
Remotesensing 16 04031 g009
Figure 10. Comparison of our estimates with independent gravity datasets over the Great Meteor Seamount for each gravity operator.
Remotesensing 16 04031 g010
Figure 11. Comparison of our estimates with independent gravity datasets. RMS = 2.125 m, 28.71 mGal, and 6.971 Eötvös and the difference (or Bouguer reduction) between the two regional grids over the Great Meteor Seamount for each gravity operator. Both data and simulation are filtered below 10 km to ensure that the spectral content is the same at short wavelengths.
Remotesensing 16 04031 g011
Figure 12. Comparison of our FAA estimates with independent gravity datasets on a larger area, around a segment of the Mid-Atlantic Ridge (54°W, 26°W, 20°N, 37°N). The top figure shows the FAA derived from the bathymetry using the radial approximation with the spherical cap. The bottom figure displays the gravity data derived from satellite altimetry from [5].
Remotesensing 16 04031 g012
Figure 13. Comparison of our FAA estimates with independent gravity datasets on a larger area, around a segment of the Mid-Atlantic Ridge (54°W, 26°W, 20°N, 37°N). The Bouguer anomalies range in amplitude from −98 to 186 mGal, with a mean value of 0.2 mGal and a Root Mean Square (RMS) of 52 mGal.
Remotesensing 16 04031 g013
Table 1. Min and Max difference values and RMS values of our tesseroid modelization compared to the modelization from [18] for each gravity operator at 1’ resolution.
Geoid (m)FAA (mGal)VGG (E)
Min0.0010.0240.277
Max0.0120.2580.886
RMS0.0050.0520.049
Table 2. Min and Max difference values of the differences between the tesseroid and radial approaches for each resolution and gravity operator.
ResolutionStatsGeoid (m)FAA (mGal)FAA(cap) (mGal)VGG (E)VGG(cap) (E)
0.05°Min0.011.84820135.9
Max0.3438832.353.935,122.3170.6
2′Min0.01121.729.44.8115.5
Max0.1252360.230.317,118.6177.5
0.02°Min0.01092.713.66.87120.8
Max0.0224100.814.65553.1154.2
1′Min0.01032.27.64.596.5
Max0.010664.68.13972135.1
Table 3. Summary of the resolution thresholds, indicating if the radial approximation can be safely used or if the tesseroid approximation should be considered.
Geoid (m)FAA (mGal)VGG (E)
Resolution threshold 0.02 ° 1 -
ApproximationRadialRadial + spherical capTesseroids
Disclaimer/Publisher’s Note: The statements, opinions and data contained in all publications are solely those of the individual author(s) and contributor(s) and not of MDPI and/or the editor(s). MDPI and/or the editor(s) disclaim responsibility for any injury to people or property resulting from any ideas, methods, instructions or products referred to in the content.