Article

Vegetation Greening Promoted the Precipitation Recycling Process in Xinjiang

1
State Key Laboratory of Desert and Oasis Ecology, Key Laboratory of Ecological Safety and Sustainable Development in Arid Lands, Xinjiang Institute of Ecology and Geography, Chinese Academy of Sciences, Urumqi 830011, China
2
Aksu National Oasis Agroecosystem Observation and Research Station, Aksu 843017, China
3
University of Chinese Academy of Sciences, Beijing 100049, China
4
International Institute of Earth System Science, Nanjing University, Nanjing 210023, China
*
Author to whom correspondence should be addressed.
Remote Sens. 2024, 16(22), 4156; https://doi.org/10.3390/rs16224156
Submission received: 29 September 2024 / Revised: 31 October 2024 / Accepted: 5 November 2024 / Published: 7 November 2024
(This article belongs to the Section Ecological Remote Sensing)

Abstract

:
Under the combined influences of climate and vegetation change, land–atmosphere interactions have enhanced, and precipitation recycling is an important part of this. Previous studies of the precipitation recycling process have focused on calculating the precipitation recycling rate (PRR) and analyzing the influencing factors. However, the climate-driven and vegetation-induced precipitation recycling process variations were not quantified. This study has systematically examined the precipitation recycling process in a typical arid region using the Eltahir and Bras model, random forest algorithm, and partial least-squares structural equation modeling. During 1982–2018, the leaf area index (LAI) and evapotranspiration (ET) rate both increased significantly, with growth rates of 0.06 m2m−2/decade and 13.99 mm/decade, respectively. At the same time, the average PRR in Xinjiang was 13.92% and experienced significant growth at a rate of 1.28%/decade. The climate-driven and vegetation-induced PRR variations were quantified, which contributed 79.12% and 20.88%, respectively. In addition, the positive effects of both of these on PRR variations through ET did not increase with the increase in ET, but rather decreased sharply and then stabilized. This study can provide favorable theoretical support for mitigating the contradiction in water use and balancing economic development and ecological security by quantifying the regulation of precipitation by vegetation.

1. Introduction

More than 40% of the global land area is made up of arid regions, which are home to 38% of the global population [1]. Owing to their special physical and geographical environments, arid regions have become especially vulnerable to climate change [2]. Compared to the global average (0.19 °C/decade), arid regions presented a higher warming rate (0.32 °C/decade) since 1980s [3,4,5]. Meanwhile, vegetation in these regions has shown a greening trend [6,7,8]. Evapotranspiration (ET) has experienced a notable increase in arid regions (5.22 mm/decade) under the strong influences of warming and greening processes [6], which has posed a challenge to the status of regional terrestrial water resources [9,10,11]. However, part of the local water vapor formed by ET can return to the ground in the form of precipitation through the precipitation recycling process [12], which is of great significance for arid regions. The interaction between the recycling precipitation (RP) formed by localized ET through precipitation recycling process and regional water supply has been analyzed in earlier studies, and the contribution of RP to the total precipitation has been defined as the precipitation recycling rate (PRR) [13,14,15,16,17,18]. Compared to humid regions, arid regions have a higher PRR [16,19,20]. Therefore, for arid regions characterized by low precipitation and high ET, the PRR is a crucial parameter for the rationalization of water resource management [19,21,22,23,24].
There are three main methods for quantifying the PRR, including stable isotope methods, numerical water vapor tracing methods, and bulk methods. Stable isotope methods can exhibit spatially detailed features of the PRR. However, it is difficult to study large-scale, long time series, and the calculation results of the PRR are sensitive to whether or not a correction for secondary evaporation under clouds is performed [25,26]. Water vapor evolution and physical processes in numerical water vapor tracing models are more realistic. However, the results are affected by climate models and are computationally intensive [27,28]. In contrast, bulk models are relatively easy to compute and can be flexibly applied at various spatial and temporal scales [29]. Therefore, bulk models have become the most widely used model [30,31]. Bulk models were first proposed by Budyko and Drozdov, who developed a one-dimensional model algorithm in 1974 [31]. Subsequently, Brubaker extended Budyko’s one-dimensional model to a two-dimensional model [12]. Since then, bulk models have been further developed.
Xinjiang, a typical arid region, is experiencing rapid warming [32] and significant vegetation greening [33,34,35,36]. Due to the influences of climate change and vegetation greening, ET in Xinjiang has experienced a growth rate of 14.00 mm/decade, significantly exceeding the global average in arid regions, which is 5.22 mm/decade [6]. From the perspective of the precipitation recycling process, the significant increase in ET is very likely to promote the formation of RP, thereby increasing precipitation, which will help to suppress the development of drought and water scarcity.
To date, some studies have been conducted on the precipitation recycling process in Xinjiang [13,37]. Some studies showed a significant increasing trend by using different models of the PRR in Xinjiang [38,39]. Additionally, the increased RP, which is formed through the precipitation recycling process, contributed more than half of the increasing trend in total precipitation from May to August [40]. The PRR was mainly controlled by moisture factors rather than thermal factors [39]. Some studies using stable isotope method found that the PRR in an oasis was much higher than that in a desert, which was due to the fact that the oasis could provide more water vapor formed by ET [17,41]. Furthermore, the above studies demonstrated that the precipitation due to transpiration was greater than the surface-evaporation-induced precipitation, which quantitatively revealed the extent to which vegetation transpiration contributed to the localized areas of Xinjiang [17,18]. According to the increase in the PRR mechanism proposed by a previous study, the increase in ET could promote the increase in PRR [39]. The increase in ET in Xinjiang was the result of the combination effects of climate change and vegetation greening, which promoted the increase in PRR. Previous studies focused on calculating the PRR and analyzing the influencing factors in Xinjiang, but paid little attention to quantifying climate-driven and vegetation-induced PRR variations.
In this study, the typical arid region of Xinjiang is taken as an example, and its overall objectives were to (1) identify the spatiotemporal variations of the leaf area index (LAI), ET, and PRR during 1982–2018; (2) quantify the climate-driven and vegetation-induced PRR variations; and (3) compare the effects of climate change and vegetation greening on the PRR variations through ET in different periods. This study is expected to provide a theoretical basis for water resource management in Xinjiang under the combined influences of climate change and vegetation greening.

2. Materials and Methods
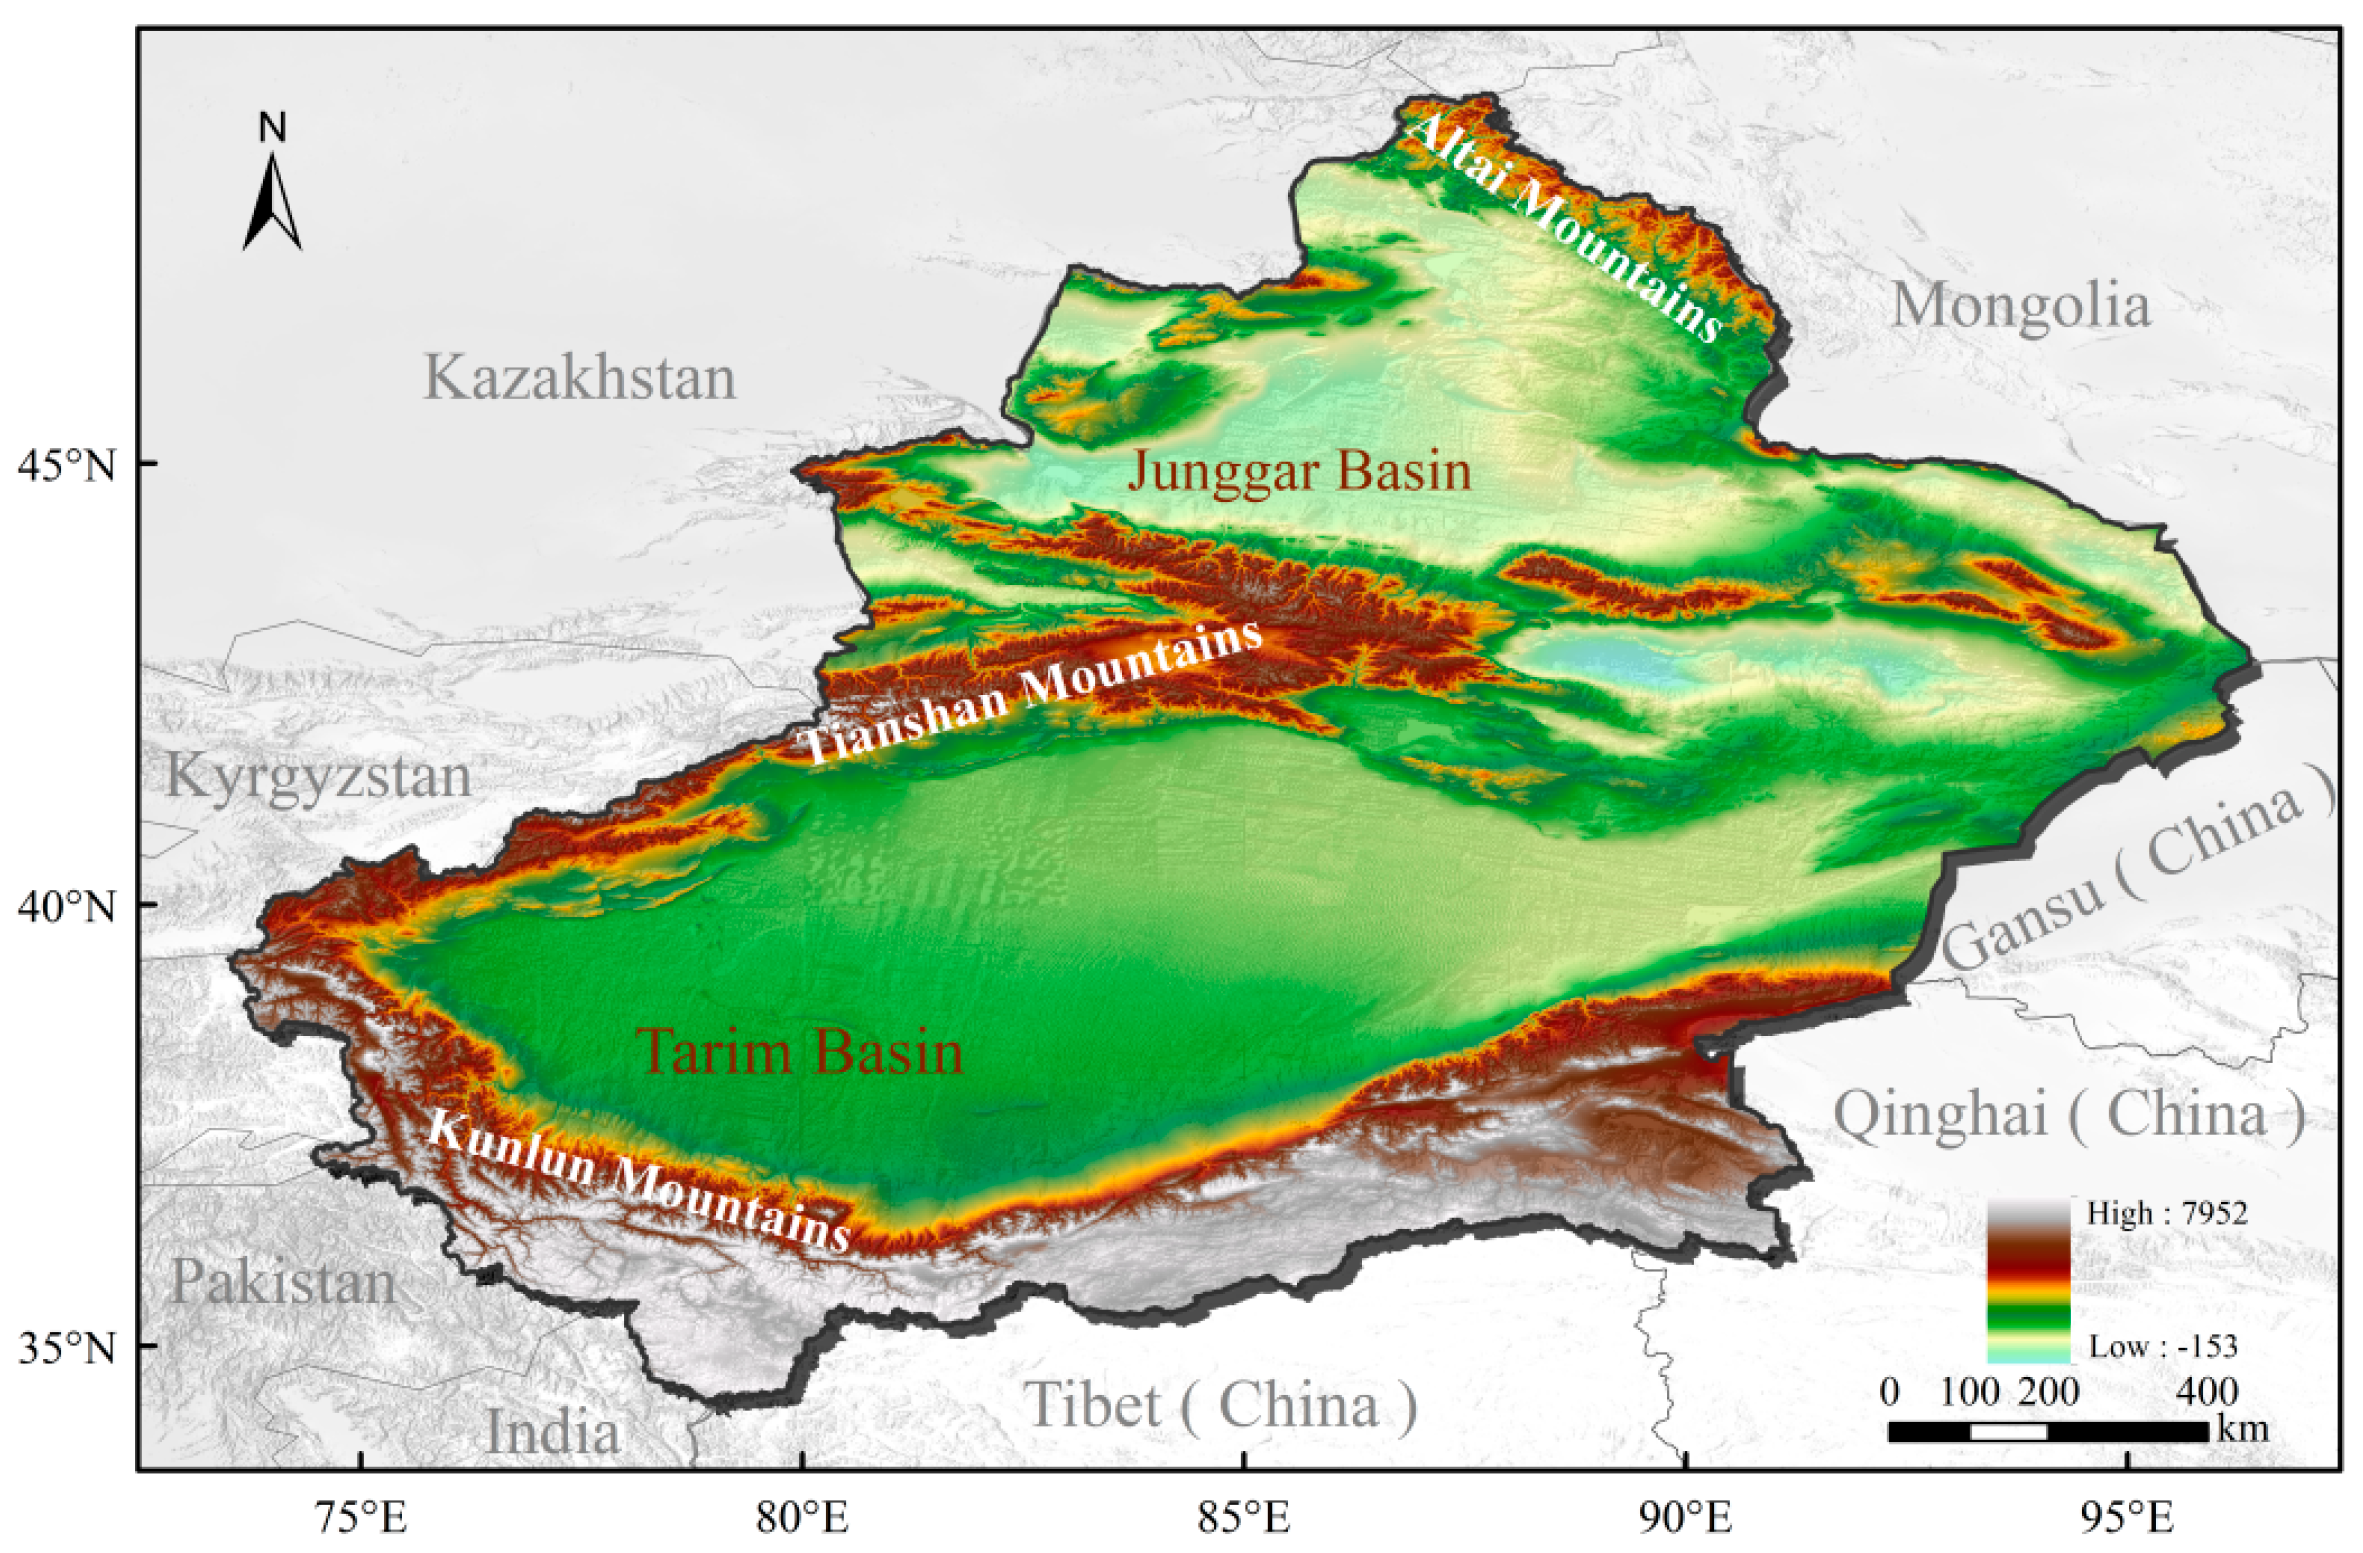
In this study, the Eltahir and Bras model was used to calculate PRR. This model has previously shown better results than numerical water vapor tracing methods [42]. The data to be entered here include longitudinal wind speed, latitudinal wind speed, specific humidity, and ET. Then, the random forest algorithm was used to quantify climate-driven and vegetation-induced PRR variations. Here, we first divide the region based on LAI, and then input the Theil–Sen slope for precipitation, temperature (TEMP), wind speed, and the multi-year averages for the first two variables (which serve as the five predictor variables). Additionally, we input the Theil–Sen slope for the target variable, PRR. Finally, partial least-squares structural equation modeling (PLS-SEM) was used to compare the effects of both on the PRR variations through ET in different periods. Here, we need to input TEMP, wind speed, precipitation, soil moisture (SM), LAI, ET, and PRR data.
It should be emphasized that vegetation greening was considered as a result of climate change in this study. This is because previous studies have shown that vegetation greening in study area is dominated by climate change [43,44,45,46], and this assumption was made to facilitate the separation of climate-driven and vegetation-induced PRR changes in vegetation greening regions. In the Discussion section, this study estimated the contributions of human activities to PRR variations by influencing vegetation.
This study selected the LAI as an indicator to represent the vegetation status instead of the Normalized Difference Vegetation Index (NDVI). The reason is that the NDVI tends to become saturated when its value exceeds 0.6, which prevents it from accurately reflecting the status of vegetation growth [47].

2.1. Study Area

Xinjiang is located in Eurasia and is a typical arid region. Xinjiang consists mainly of three mountains (Altai Mountains, Tianshan Mountains (TS), and Kunlun Mountains (KL)) and two basins (Tarim Basin and Junggar Basin), with the mountain ranges and basins alternating, and the terrain has a wide range of elevations, with the lowest elevation being only −154 m and the highest elevation being up to 8611 m (Figure 1). It is difficult for water vapor to reach Xinjiang because it is so far from the ocean, and its annual precipitation is about 100 mm. The distribution of precipitation is more in the north and less in the south, with more mountains and less plains. The precipitation is mainly controlled by westerly circulation, and water vapor input is dominated by the western boundary [48]. Since the 1980s, a greening phenomenon has been observed in the vegetation of Xinjiang, mainly concentrated in the northwest [34,49].
According to statistics, in 2018, 60.79% of Xinjiang was covered by bare areas, 21.08% by grassland, about 7.9% by cropland, 4.37% by sparse vegetation, 2.81% by forest land, 2.19% by waterbodies, 0.71% by shrubland, and 0.15% by urban areas (Table S1). Compared to those of 1992, the percentage of bare areas decreased by 2.33%, and the percentage of cropland increased by 1.56% in 2018. These land use types experienced the most significant decreases and increases, respectively.

2.2. Data

Table 1 shows the data used in this study. The longitudinal wind speed, latitudinal wind speed, specific humidity, TEMP, and surface air pressure were obtained from the ERA5 and ERA5-Land datasets. Both have been widely used in arid regions of China [50,51,52,53]. The precipitation dataset used was a daily gridded dataset, provided by the National Tibetan Plateau Data Center [54]. The dataset fully considers the topographic effect of the daily climate field [55] and has good overall performance; moreover, the 0.25° × 0.25° resolution dataset was used in this study. For soil moisture values, we used surface soil moisture (0–10 cm) from GLEAM v3.7a. The GLEAM v3 dataset showed better soil moisture quality compared to the measurements than the previous GLEAM v2 dataset [56]. Xu et al. (2023) verified the performance of GLEAM SM data and found that the reliability is high for the arid regions of China [57]. The ET data of GLEAM were calculated based on the Priestley and Taylor model, and the validation of the daily time series showed a good performance [58]. The data from GLEAM have been widely used in the arid regions of China [57,59,60]. The LAI data were obtained from the GLASS LAI dataset, developed based on the Advanced Very-High-Resolution Radiometer surface reflectance [61]. The dataset has been widely used in previous studies in the arid regions of China [57,62]. All LAI values used in this study were the annual maximum LAI on an annual scale and monthly maximum LAI on a monthly scale. The vegetation cover data were derived from ESA-CCI.
In order to facilitate calculation with raster data that possess different spatial resolutions, the above data except for vegetation cover were resampled to a resolution of 0.25° × 0.25° using the bilinear method.

2.3. Methods

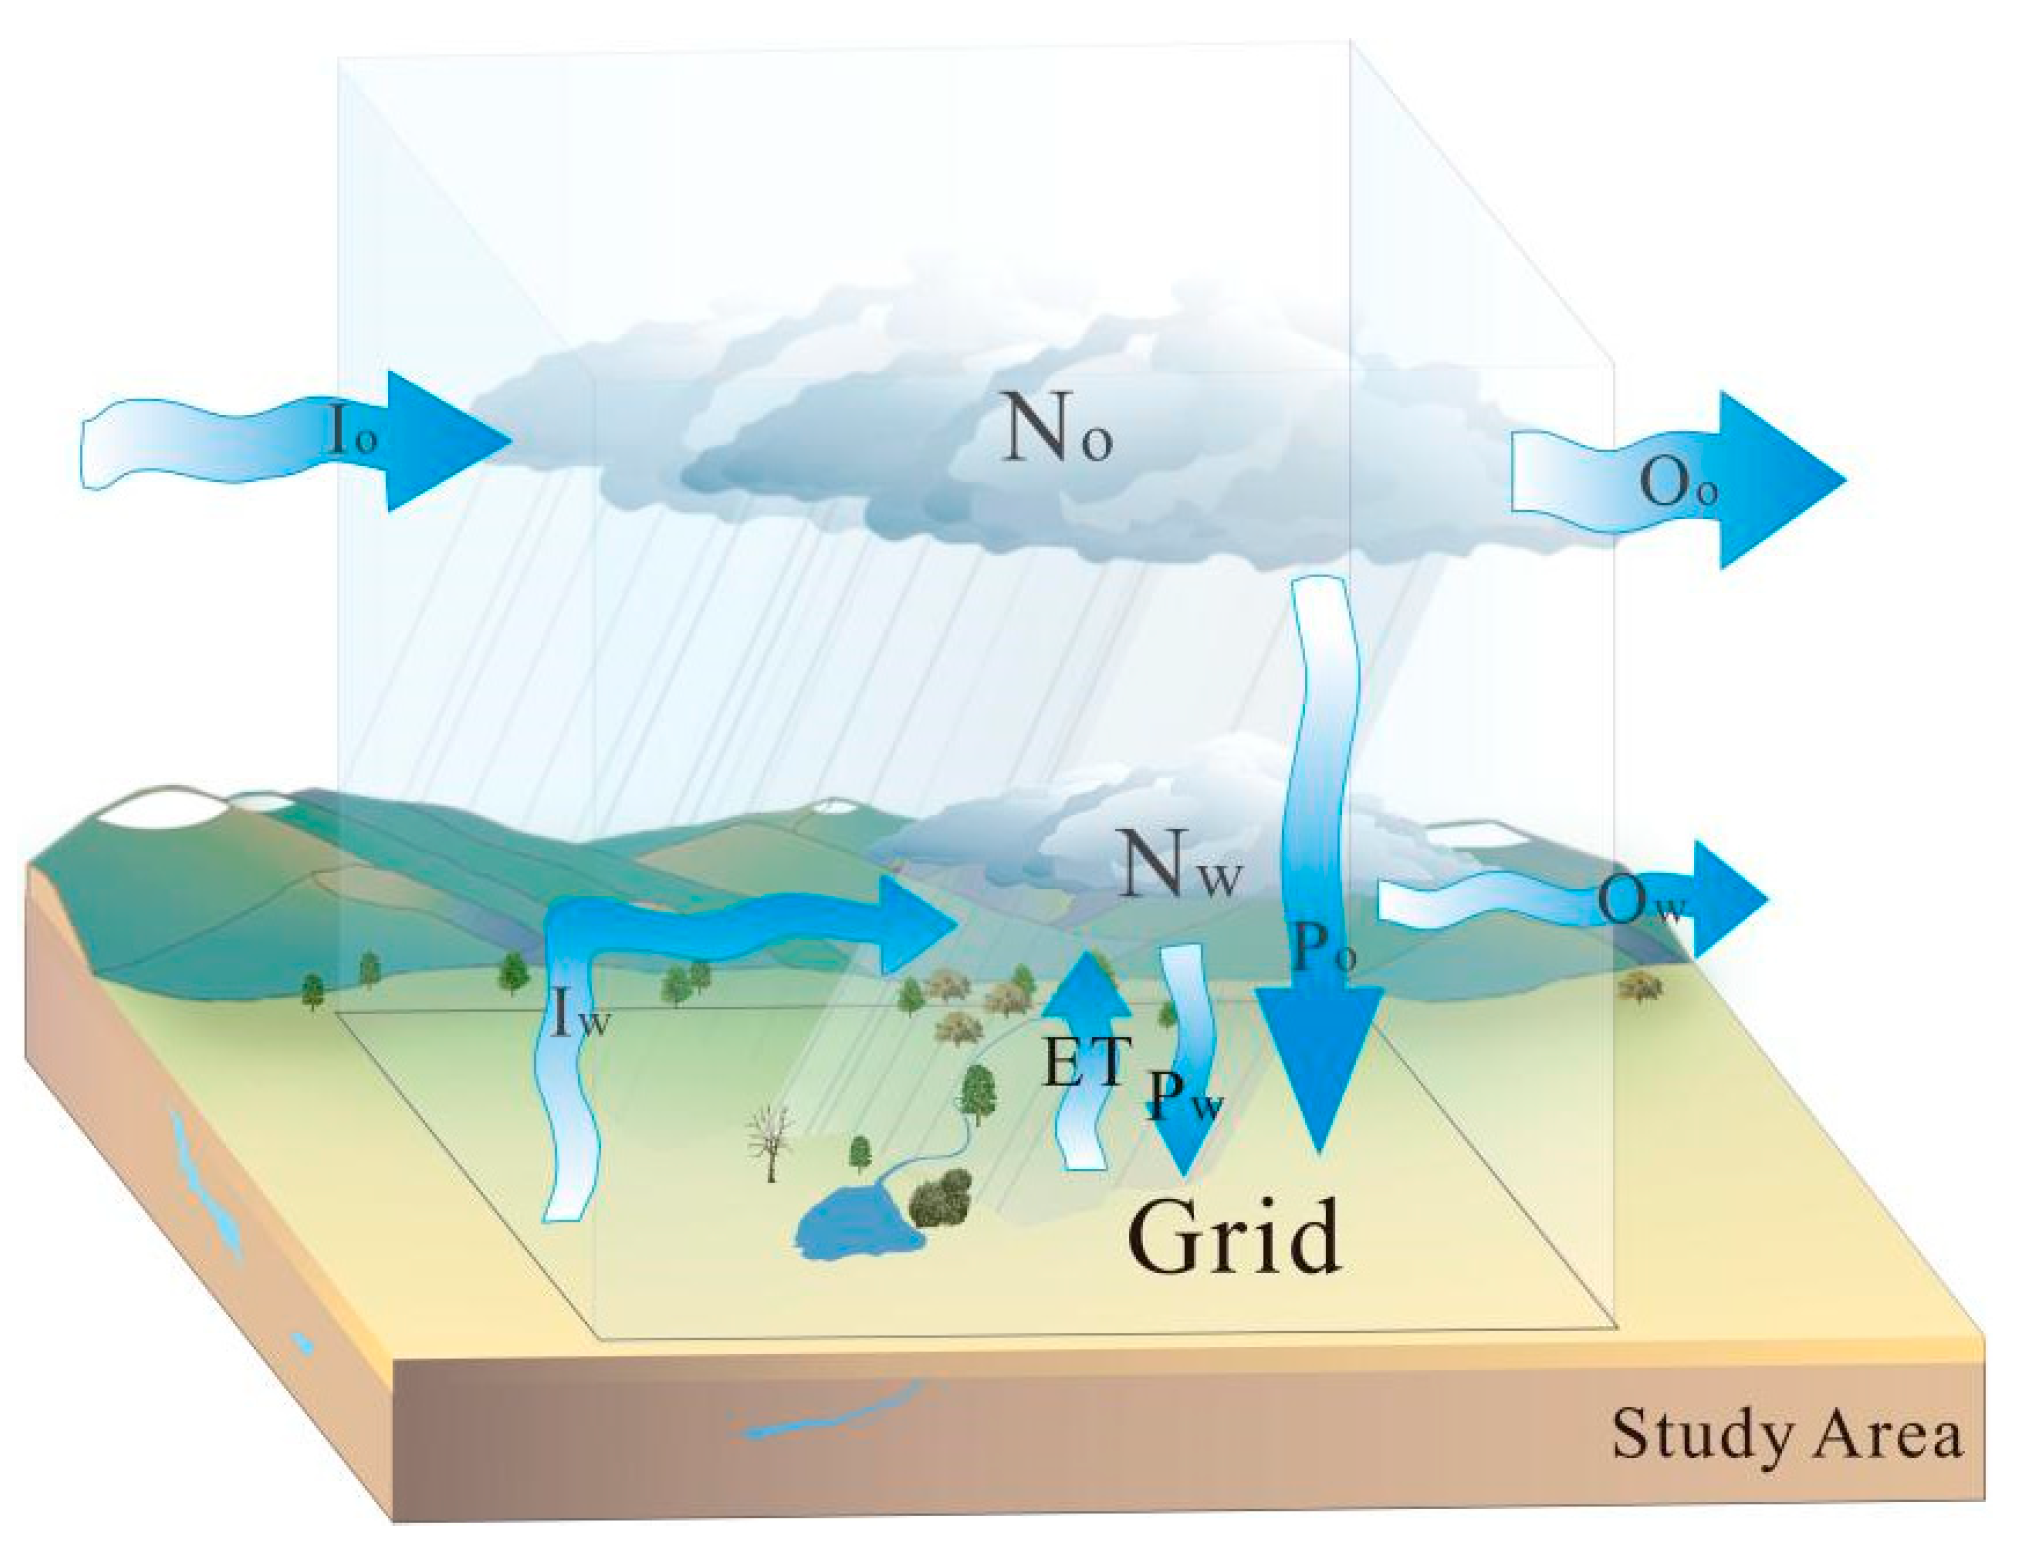
2.3.1. Precipitation Recycling Model

The PRR was calculated using the Eltahir and Bras model, a classic bulk model that is not only easy to calculate but is able to show the spatial distributions of PRR. A detailed introduction to the Eltahir and Bras model can be discovered in the Supporting Information (Text S1).
The PRR can be expressed using the following equation [63,64]:
PRR = P w P = P w P w + P o = O o O w + O o
where P and O represent precipitation and water vapor outflow; and subscripts w and o represent the molecules that evaporate within and outside of the region, respectively (Figure 2).
The RP can be calculated from the product of the PRR and precipitation. It should be noted that the calculation of the overall PRR for the study area for a given time period should be weighted using precipitation rather than by simply calculating an average. The formula for calculating the precipitation recycling rate in any month is as follows:
P R R ( y , m ) = i , j [ P ( i , j , y , m ) × A ( i , j ) i , j P ( i , j , y , m ) × A ( i , j ) × PRR ( i , j , y , m ) ]
where A represents area; i, j represents the coordinates of the grid; and y and m represent the year and month, respectively.

2.3.2. Random Forest Algorithm

A random forest algorithm was applied to separate climate-driven and vegetation-induced PRR variations. It should be noted that this study was only an attempt to understand trends in PRR, not to obtain a specific PRR. The parameters of the random forest algorithm were set by default, and the training sets and test sets were divided according to a ratio of 8:2. Firstly, the LAI trend was used as an indicator of whether greening of vegetation was occurring or not, and areas with negligible changes in vegetation cover (−0.001 < LAI trend < 0.001 m2m−2/year) were considered to be areas where climate change dominates PRR variations [57]. The other regions were regarded as areas where climatic and vegetation greening factors acted together. Secondly, five predictors were selected and trained in the “climate-dominated region” to obtain the annual trend of PRR by random forest algorithm. These five predictors include the annual Theil–Sen slope of three variables, including TEMP, precipitation, and wind speed, and the annual mean value of the first two. The training efficiency of the random forest algorithm is detailed in the Supporting Information (Figure S1). Then, the trained random forest algorithm was then applied to areas in which vegetation greening and climate change coexisted. Finally, the difference between the actual PRR trends and the trends predicted by the random forest algorithm was the trend in the PRR due to vegetation greening. In this study, the vegetation-induced PRR variations isolated by the random forest method include the contributions of climate–vegetation interaction [57].

2.3.3. PLS-SEM Analysis

PLS-SEM is an approach to quantify interrelations and path coefficients (PC) between different variables based on a known process or hypothetical structure [65,66]. According to the PC, the indirect and total effects between the variables can be obtained. A detailed introduction to the calculation of the total and indirect impacts can be discovered in the Supporting Information (Text S2). Compared with traditional covariance-based SEM, the PLS-SEM imposes fewer restrictions on data volume and data normality [67,68,69], and it has been widely applied in ecology and climatology to analyze effects between different variables [70,71,72]; therefore, we selected this method to compare the effects of climate and vegetation change on the PRR variations through ET in different periods. The implementation of PLS-SEM in this study was performed in the SmartPLS software 3.2.9.
Due to the complex interaction between the various factors (climate, SM, LAI, ET, and PRR), this study made the following assumptions: (1) climate has direct effects on vegetation, ET, and SM variations; (2) SM also has direct effects on vegetation and ET variations; (3) vegetation has direct effects on ET variations; and (4) the PRR variations is only directly affected by ET, and climate can only affect PRR variations through ET.
To ensure that the model is acceptable, four criteria were used to assess the model, including Cronbach’s Alpha (CA), Composite Reliability (CR), Average Variance Extracted (AVE), and Goodness of Fit (GoF) [73,74]. Detailed results of CA, CR, AVE, and GoF can be discovered in the Supporting Information (Table S2). The CA, CR, AVE, and GoF of the model in different periods were greater than 0.6, 0.7, 0.5, and 0.5, respectively, and the models were all acceptable [73,75].

3. Results

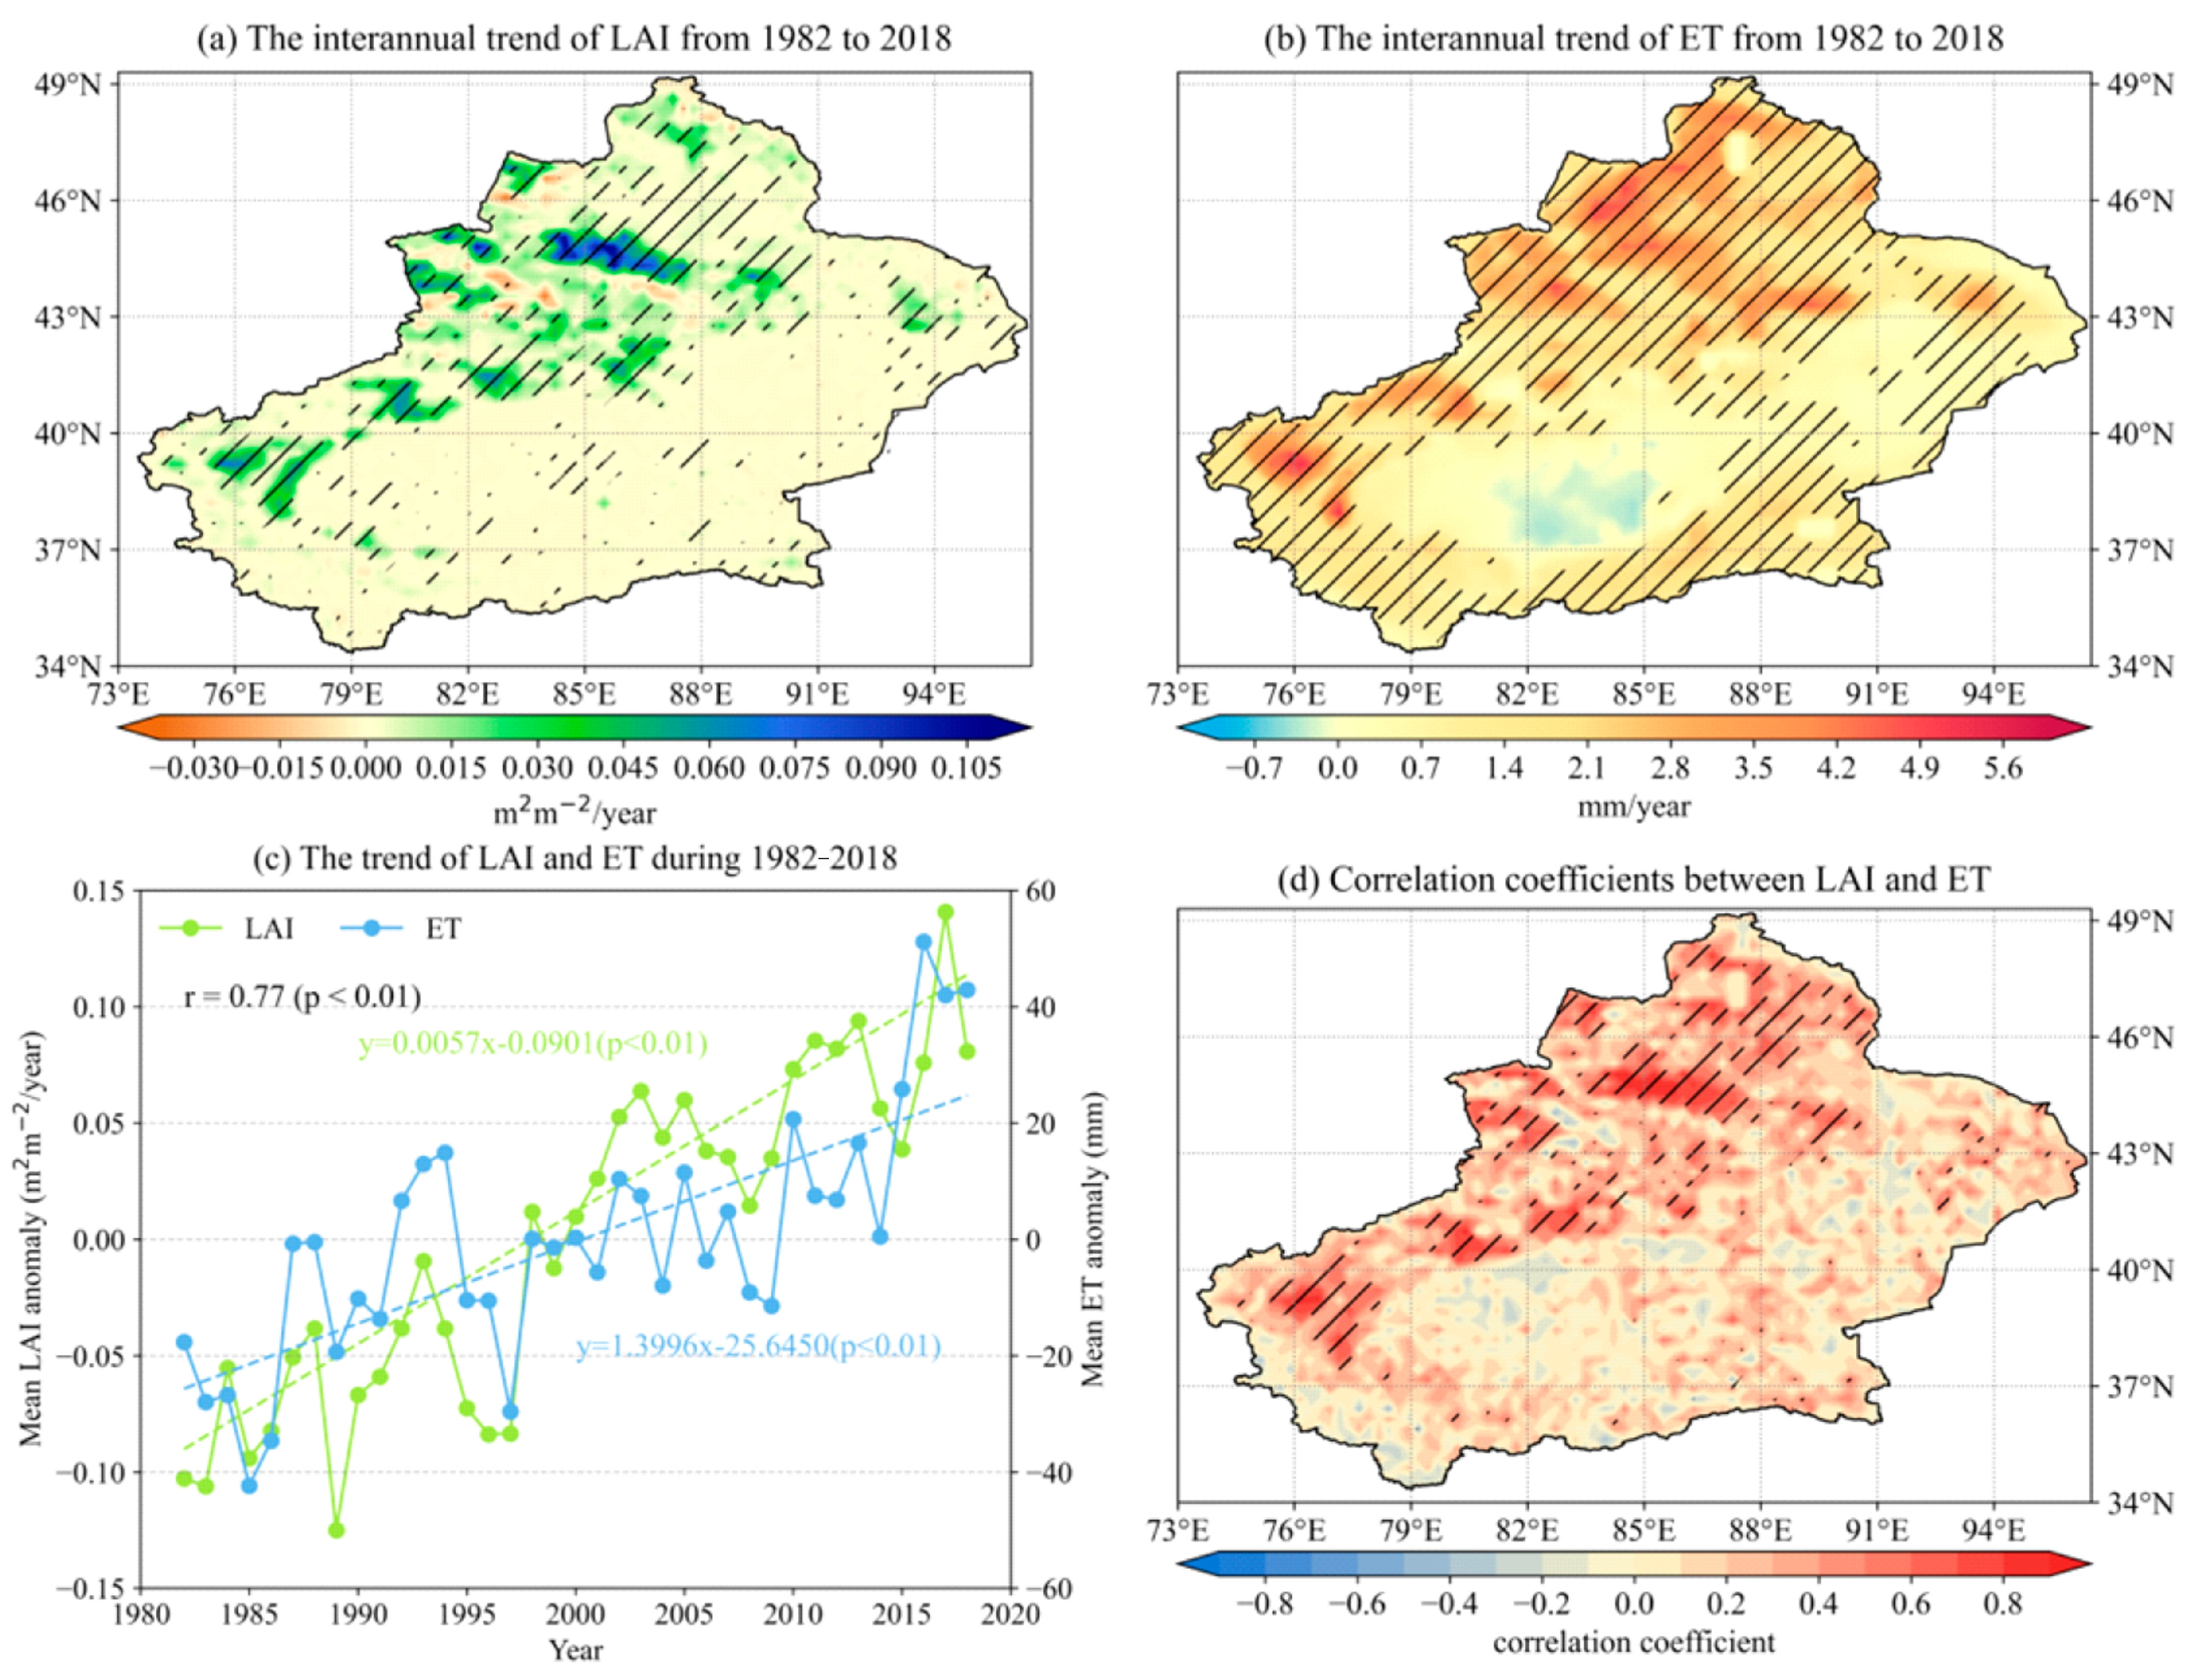
3.1. Spatiotemporal Variations of LAI and ET

The LAI and ET both showed increasing trends from 1982 to 2018. The LAI increased significantly, with a growth rate of 0.06 m2m−2/decade (Figure 3c). For the spatial variations of LAI, the pixels with significant changing trends were primarily found in northwestern Xinjiang, while most of the pixels in southeastern Xinjiang were close to 0 m2m−2/year (Figure 3a). About 46.51% of the pixels in LAI showed increasing trends, and 33.77% of the pixels in LAI presented significant increasing trends (LAI trend > 0.001 m2m−2/year) (Figure 3a). The pixels showing increasing trends were mainly distributed in the west margin of the Tarim Basin and northern Xinjiang. About 45.80% of the pixels in LAI were basically unchanged (−0.001 < LAI trend < 0.001 m2m−2/year). About 7.69% of the pixels in LAI showed decreasing trends, and 2.61% of the pixels in LAI exhibited significant decreasing trends (LAI trend < −0.001 m2m−2/year). The pixels showing decreasing trends were intermittently distributed in the mountainous region.
The ET also increased significantly, with a growth rate of 13.99 mm/decade (Figure 3c). About 70.15% of the pixels in ET increased significantly (Figure 3b). For the spatial variations of ET, the pixels showing increasing trends were generally distributed in regions other than the southern and central Tarim Basin, while the pixels that increased significantly were only distributed in most regions of northern Xinjiang and the outer edge of the Tarim Basin (Figure 3b). In addition, the spatial distribution of pixels with ET growth rates greater than 2.5 mm/year were essentially the same as the range of pixels with LAI growth rates greater than 0.15 m2m−2/year (Figure 3a,b). The pixels showing decreasing trends were primarily found in the southern and central Tarim Basin, but most of the pixels failed to pass the significance test. Overall, LAI and ET in northern Xinjiang showed higher growth rates compared with those of southern Xinjiang.
To further examine the impact of LAI on ET, a correlation analysis was applied (Figure 3c,d). The correlation coefficient between LAI and ET was 0.77, indicating that LAI had a significant positive effect on ET (Figure 3c). In addition, the correlation coefficients of northern Xinjiang were generally higher than those of southern Xinjiang (Figure 3d). The result showed that about 74.81% of the pixels showed a positive correlation, and about 27.02% of the pixels exhibited a significant positive correlation (Figure 3d). These pixels showing a significant positive correlation were mainly distributed in regions where the growth rates of LAI were greater than 0.15 m2m−2/decade (Figure 3a,d). About 25.19% of the pixels showed a negative correlation, and only 0.73% of the pixels displayed a significant negative correlation. The pixels showing a negative correlation were mainly intermittently distributed in southeastern Xinjiang and the TS regions, but most of these pixels failed to pass the significance test.

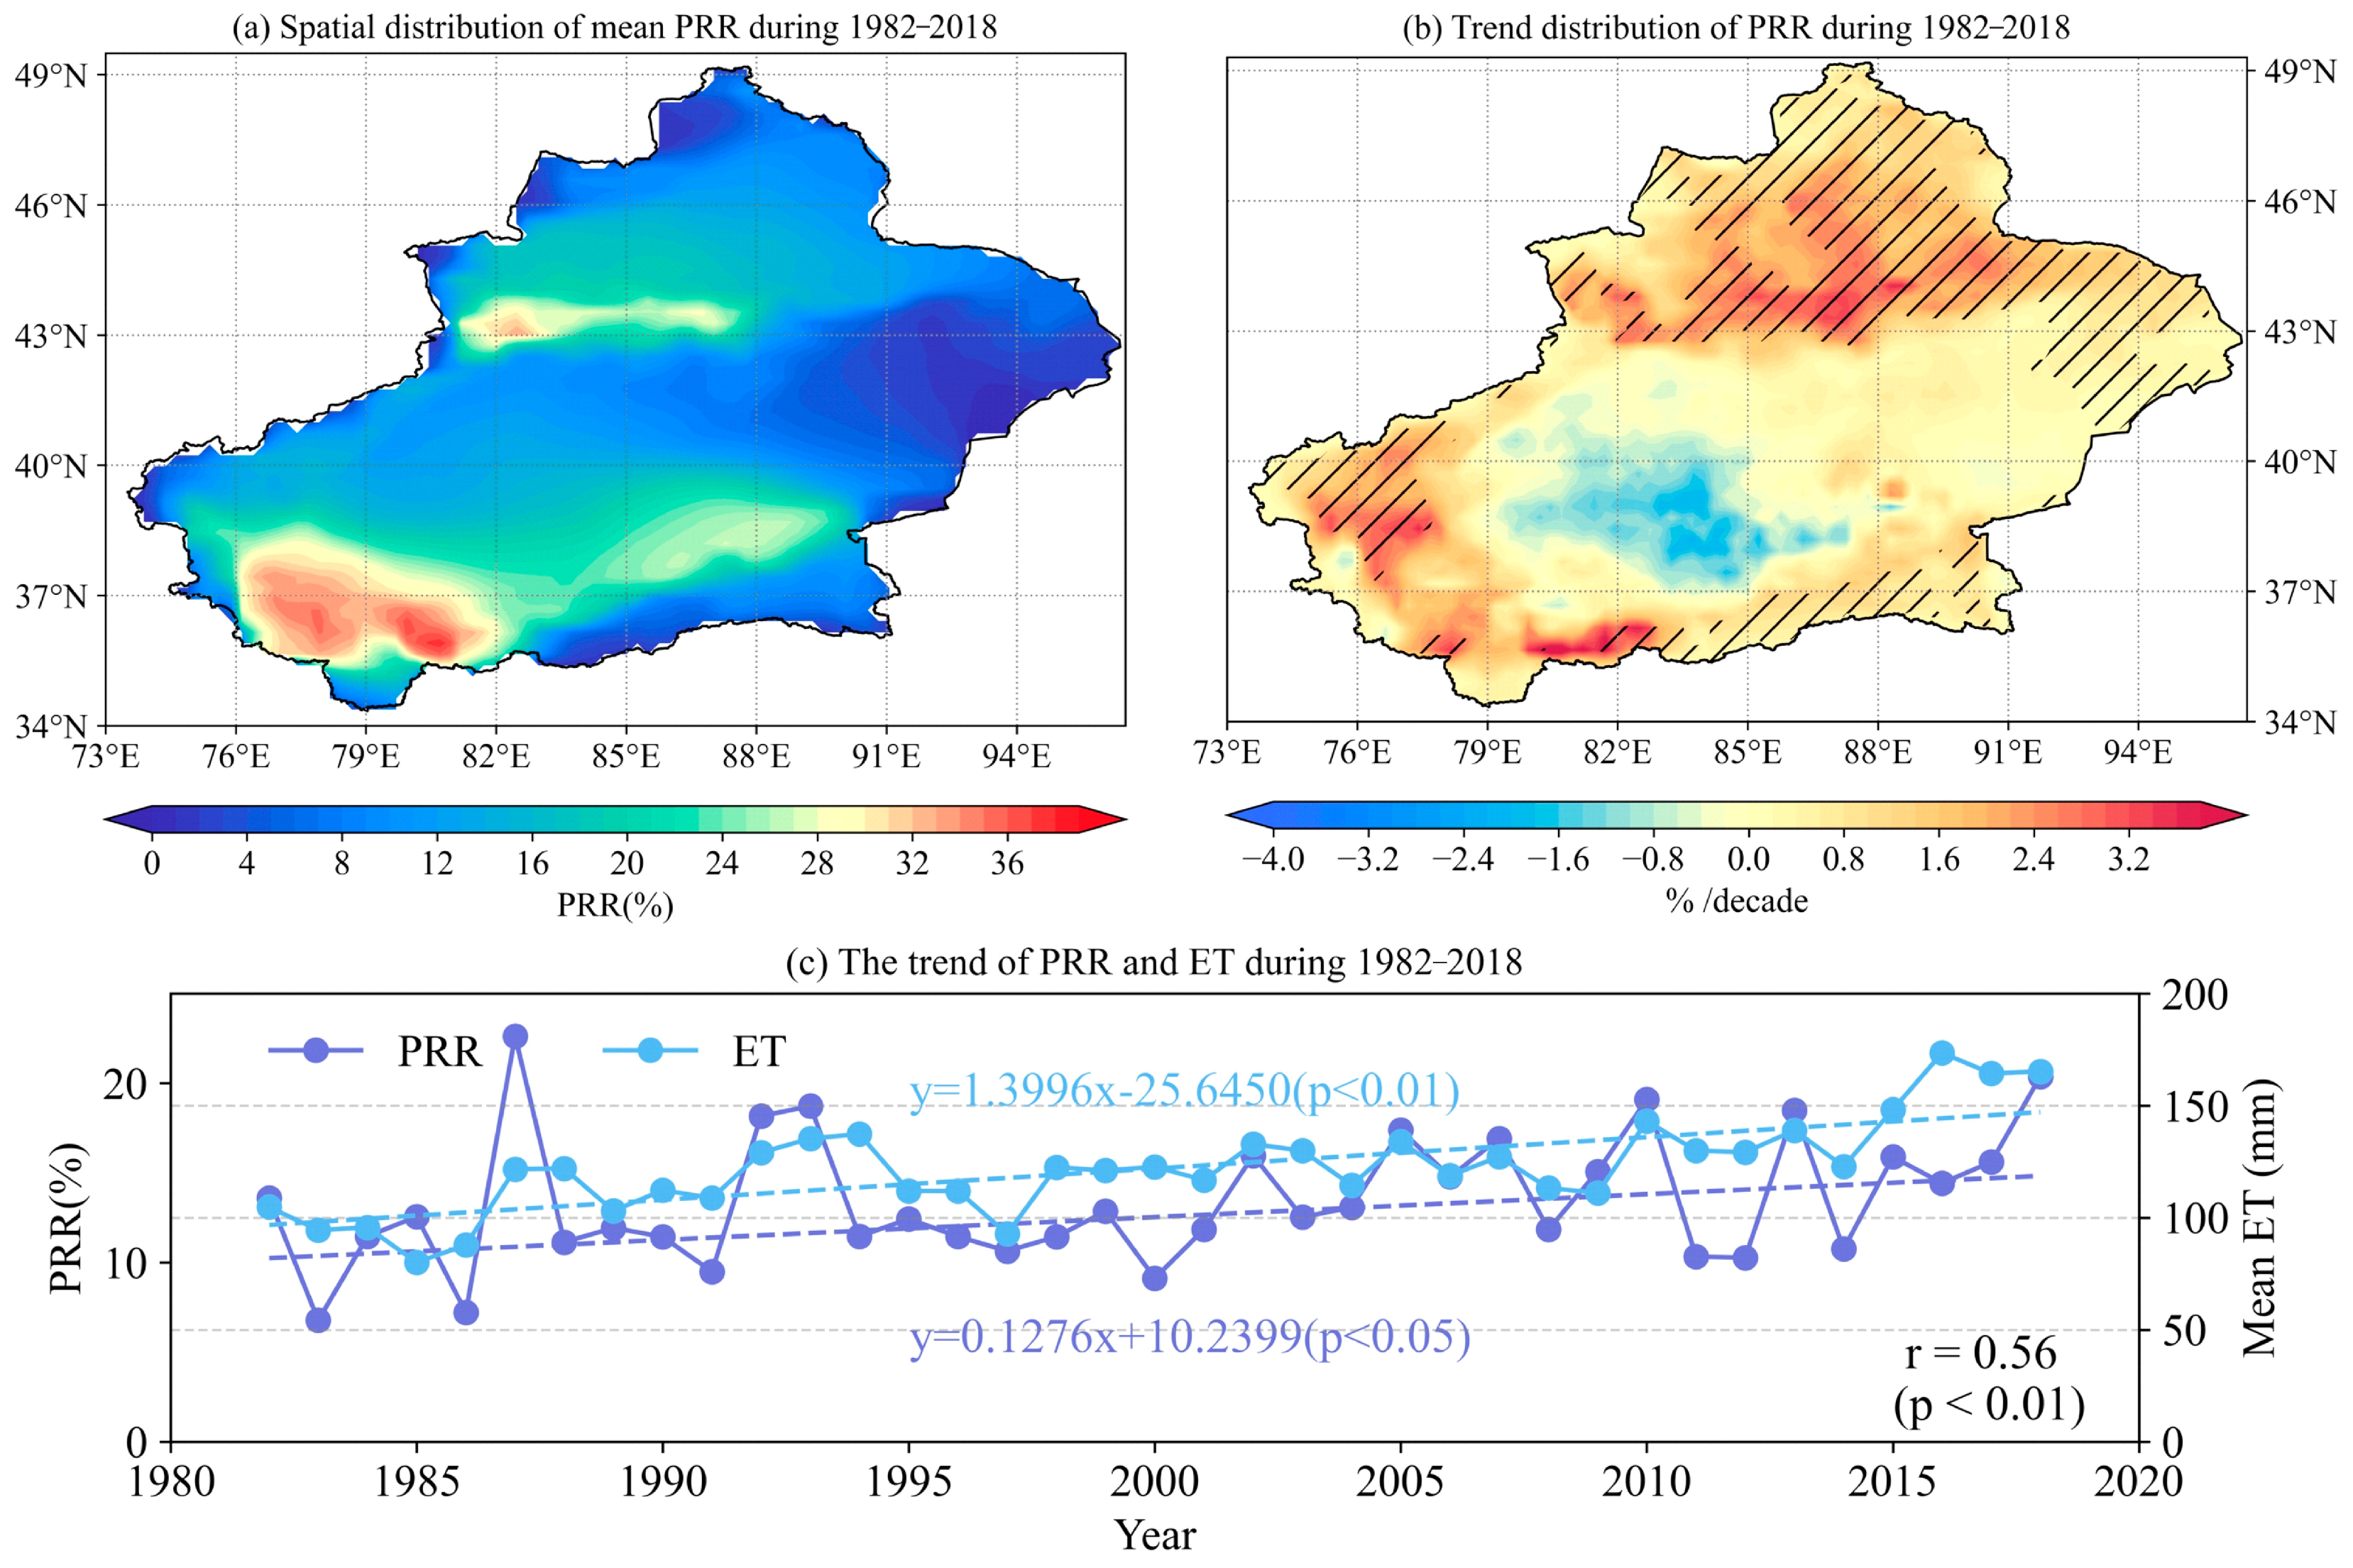
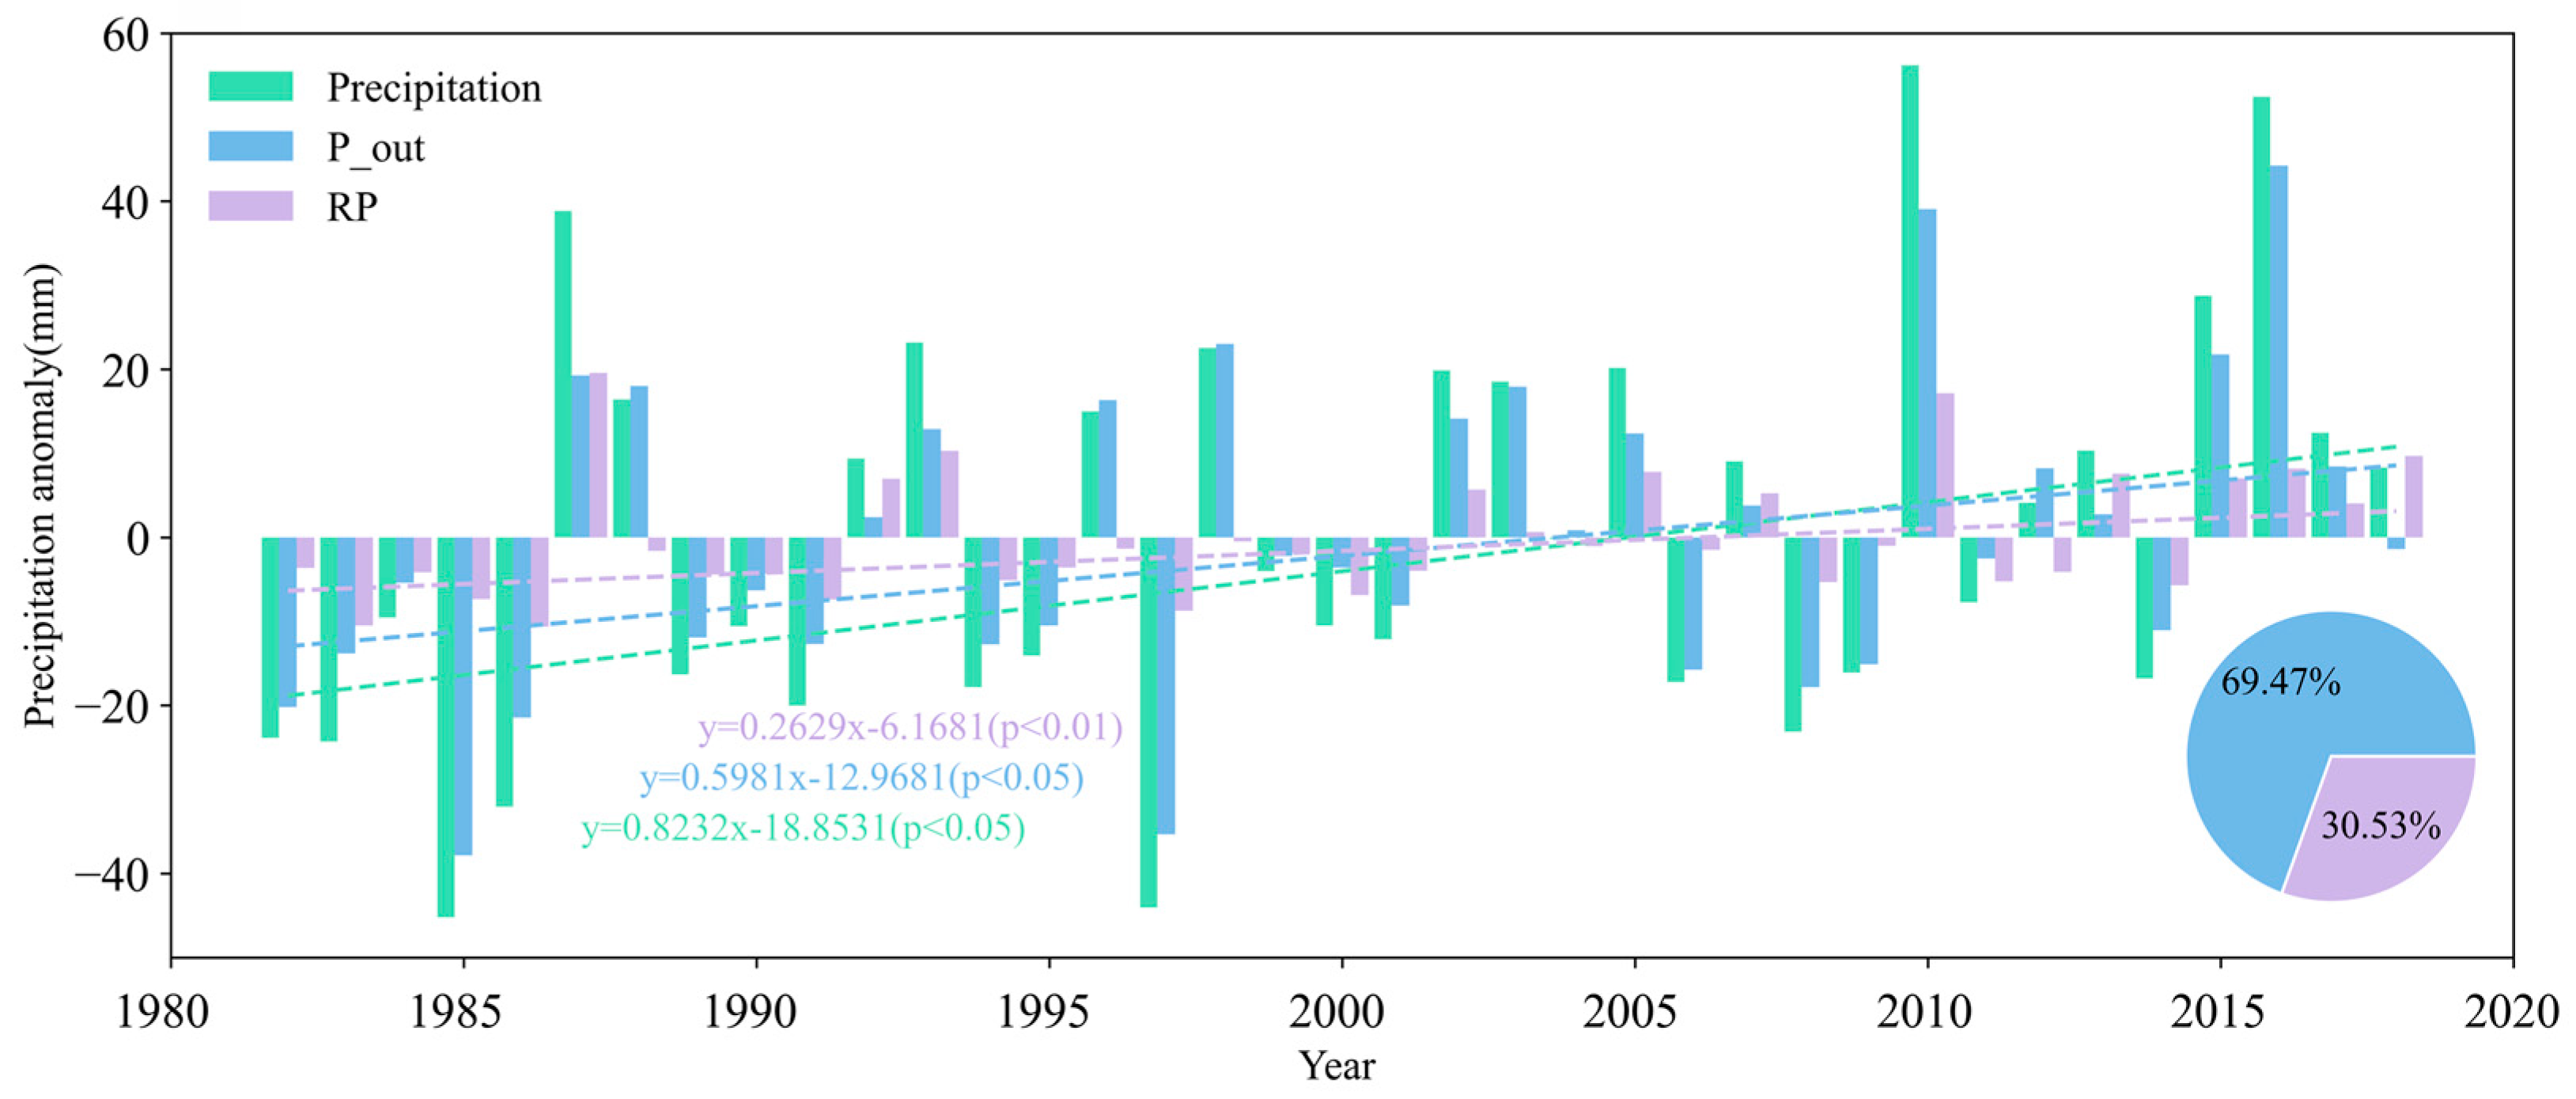
3.2. Spatiotemporal Variations of PRR

From 1982 to 2018, the average multiyear PRR in Xinjiang was 13.92%. The high-value pixels of the multiyear average PRR in Xinjiang were mainly concentrated in the TS and KL regions, with PRR up to 37% or more. In contrast, the low-value pixels were primarily distributed in the basins, with the PRR being close to 0 in some regions (Figure 4a).
The PRR showed an overall significant increasing trend of 1.28%/decade and was significantly affected by ET (Figure 4c). From the perspective of spatial variations in the PRR, the PRR in northern Xinjiang exhibited generally higher growth than that of southern Xinjiang (Figure 4b). About 88.89% of the pixels in the PRR showed increasing trends, and 33.54% of the pixels in the PRR exhibited significant increasing trends (Figure 4b). The pixels showing increasing trends were generally distributed in regions other than the southern margin and central Tarim Basin, while the pixels that increased significantly were distributed in most regions of northern Xinjiang and the western and southern Tarim Basin. In detail, the PRR growth in the central and western TS and the KL was significantly higher than that in other regions; moreover, the maximum growth rate occurred in the central KL regions, with a growth rate of up to 4.56%/decade. Only about 11.11% of the pixels in the PRR presented decreasing trends, but these pixels failed to pass the significance test and were distributed in the southern margin and central Tarim Basin.

3.3. Contributions of Climate Change and Vegetation Greening to PRR Trends

The climate-driven and vegetation-induced PRR variations were effectively distinguished by the random forest algorithm (R2 = 0.81, RMSE = 0.45%/decade). According to the random forest separation results, climate-driven change in the PRR showed an increasing trend in the vast majority of pixels (79.87% of the pixels), and a very small portion of Xinjiang showed a decreasing trend (20.13% of the pixels). From the perspective of the spatial distributions of climate-driven PRR change, the general spatial distribution exhibited higher values in the northern and western regions, while the eastern and southern regions had comparatively lower values, with low-value pixels primarily concentrated at the central Tarim Basin (Figure 5a). In addition, the PRR variations caused by vegetation greening had a positive effect on most of the pixels (53.76%) and a negative effect on a slightly smaller portion of the pixels (46.24%), showing the characteristics of being high in the north and low in the south (Figure 5b). In detail, the growth of the PRR driven by vegetation greening in the TS and the western KL was significantly higher than that observed in other regions. Furthermore, most of the pixel values of climate-driven PRR variations ranged between 0.04 and 1.54%/decade, and most of the pixel values of the vegetation-induced PRR were approximately 0%/decade. Compared with the climate-driven PRR trend variation, the vegetation-induced PRR negative change trend had a larger area and a greater negative rate (Figure 5a,b). Overall, the rate of PRR change in Xinjiang was 1.28%/decade. Climate change dominated the PRR variations (contributing up to 79.12%), and the contributions of vegetation greening to the PRR variations in Xinjiang was 20.88%.

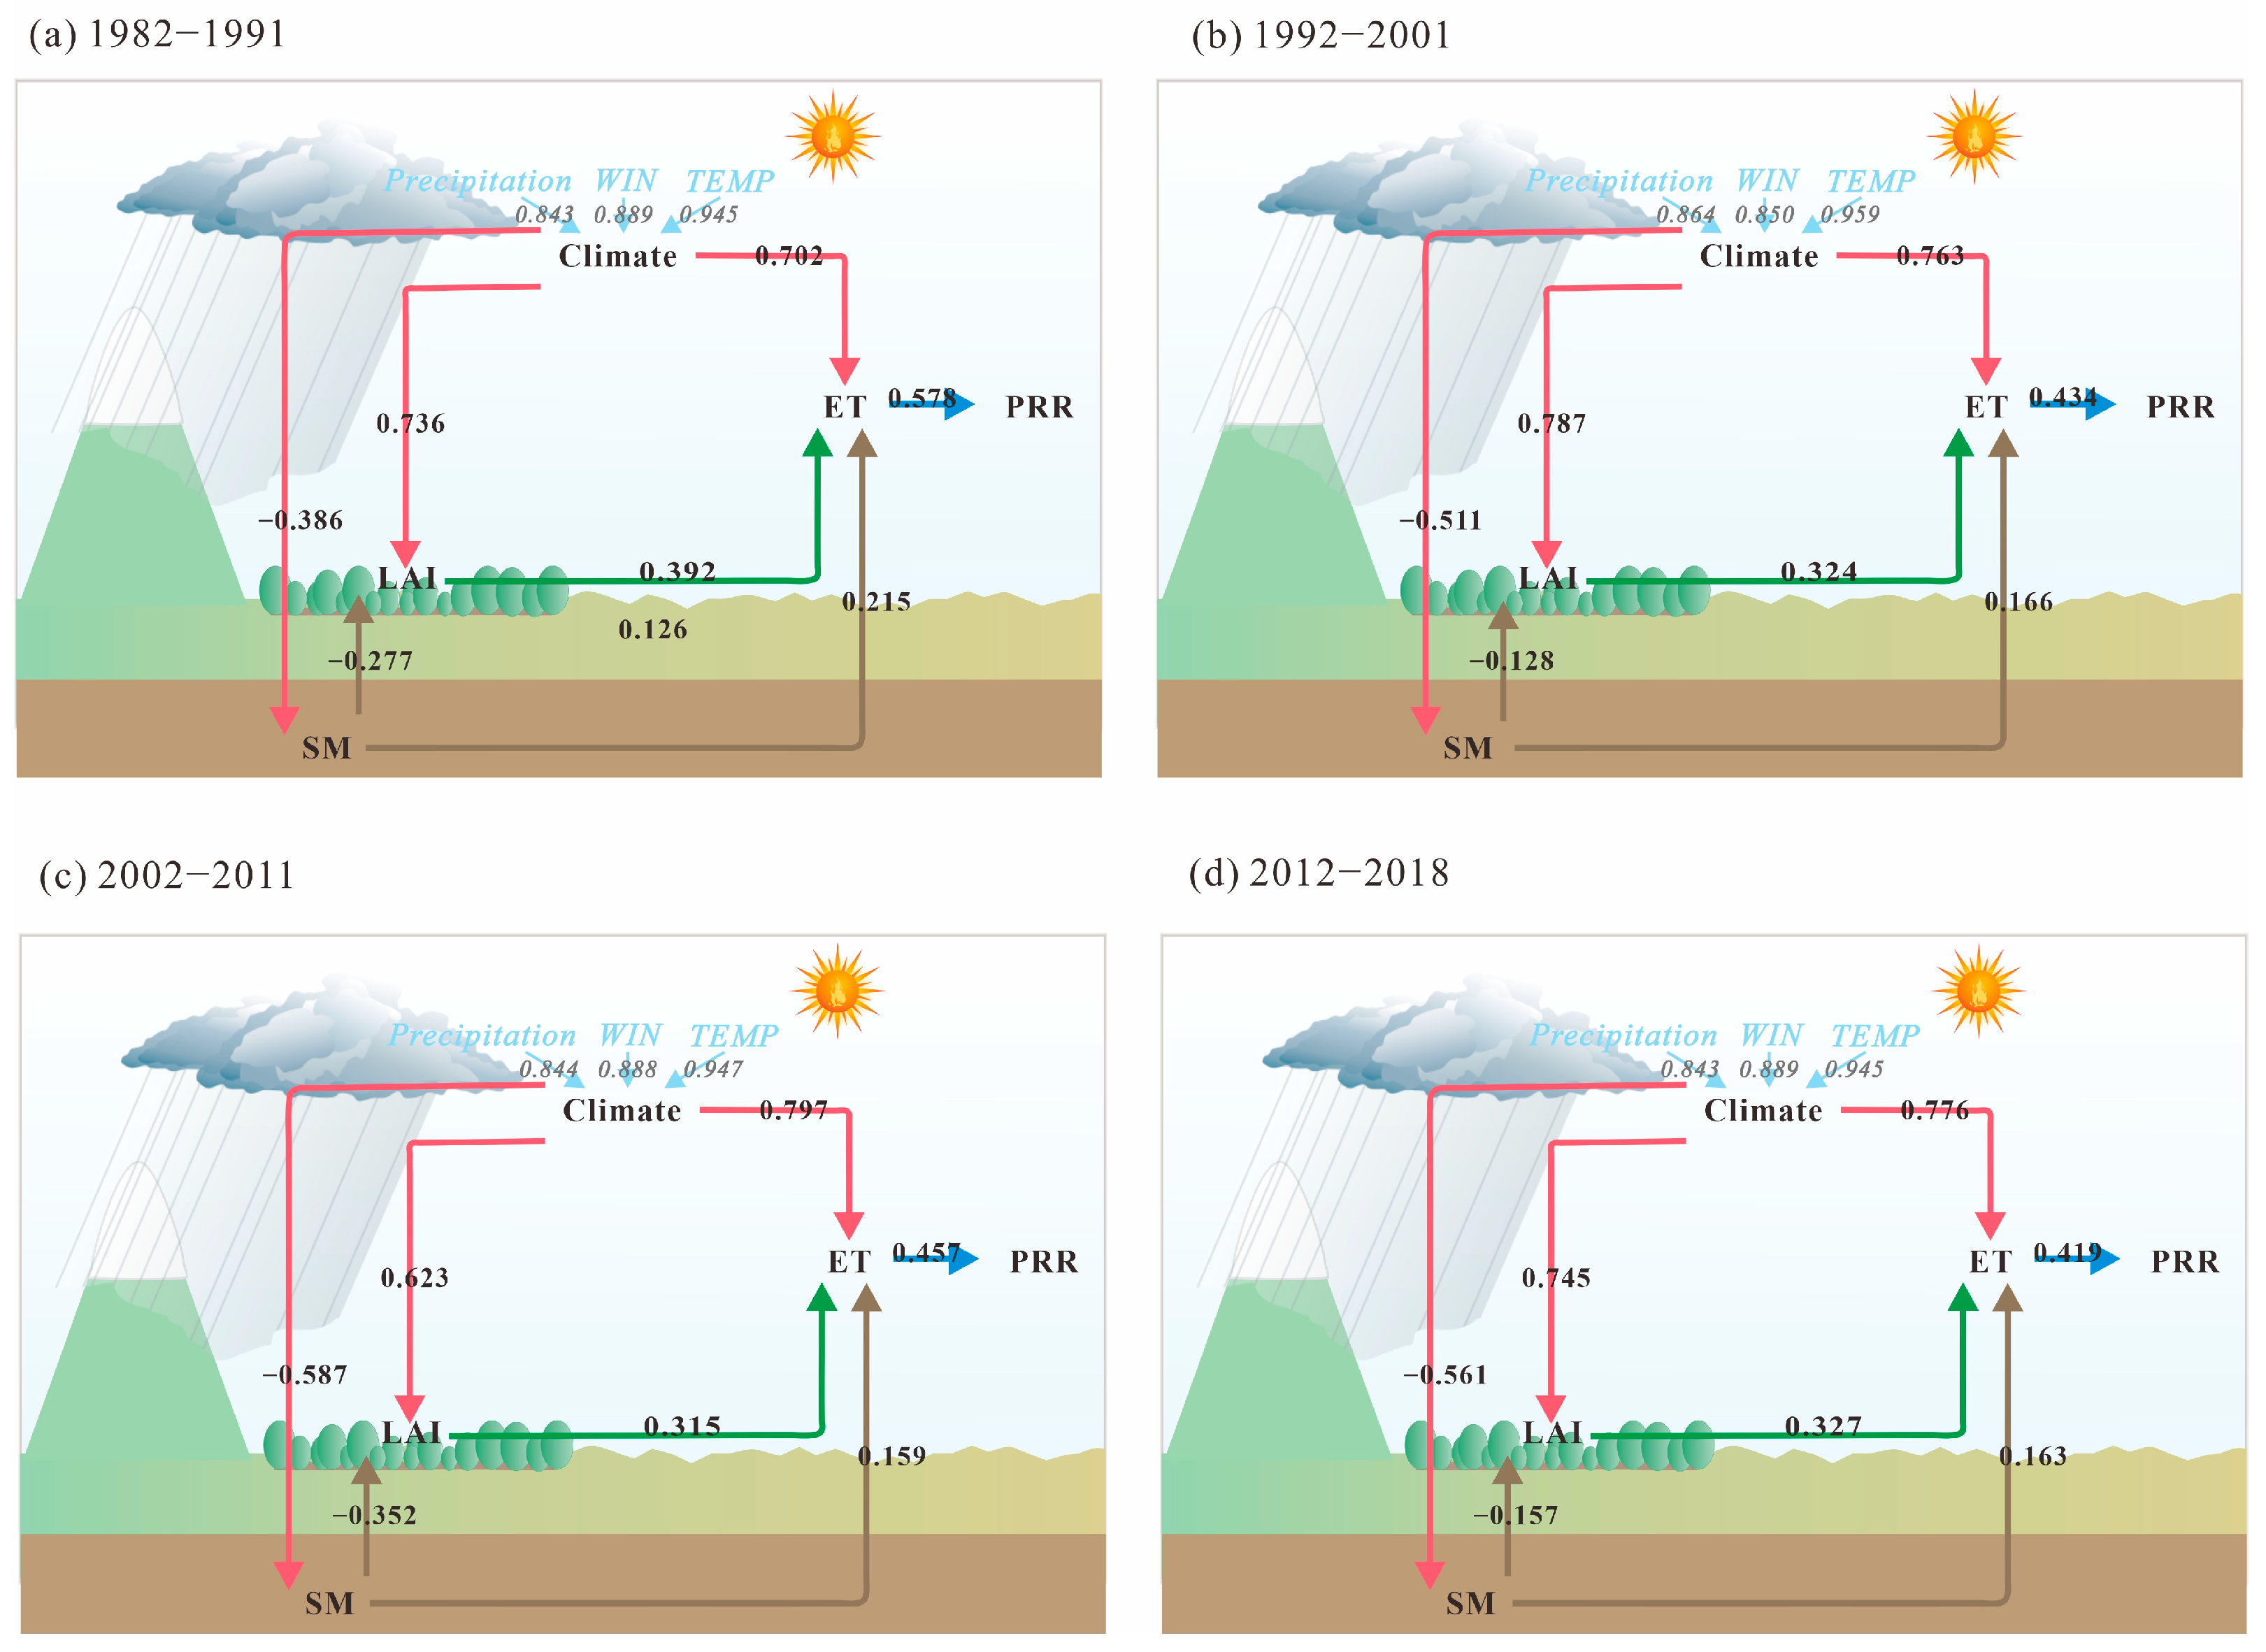
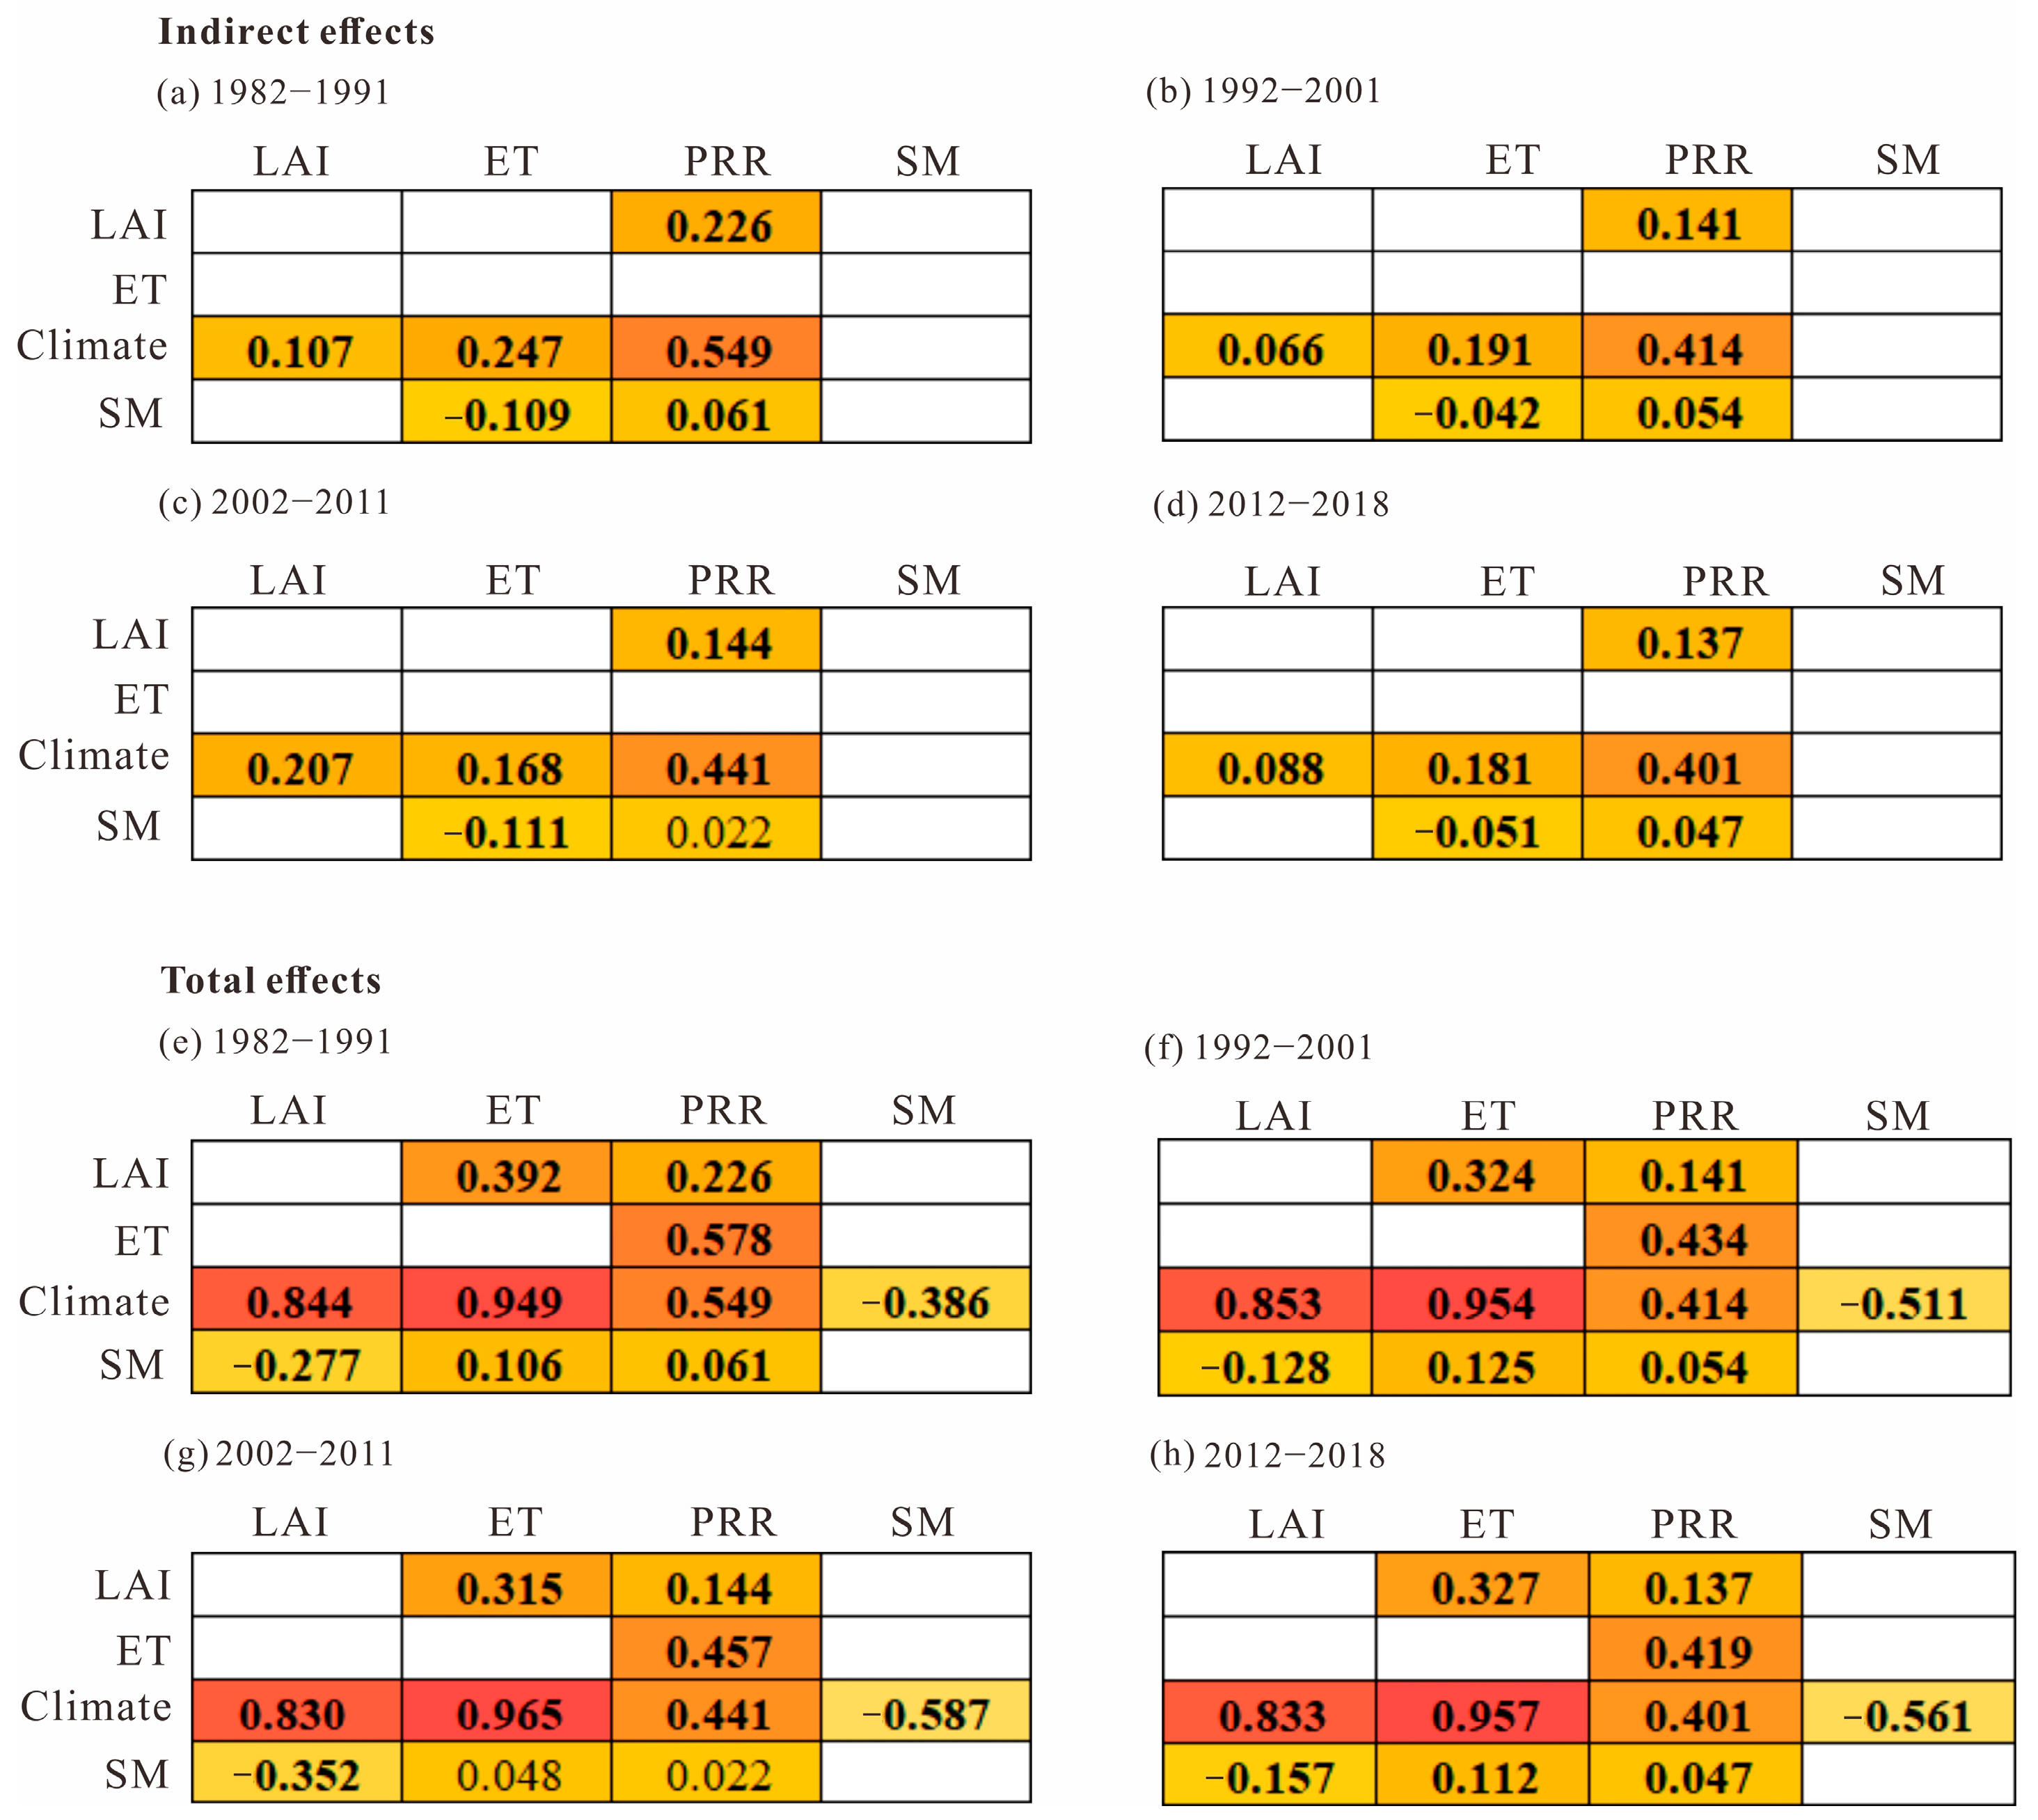
3.4. The Influence Pathways of Climate Change and Vegetation Greening on PRR Variations Through ET in Xinjiang

The period from 1982 to 2018 was divided into four periods (i.e., 1982–1991, 1992–2001, 2002–2011, and 2012–2018). The PLS-SEM was applied to explore the pathways through which climate and vegetation change affect PRR variations on a monthly scale (Figure 6). It should be noted that this study paid attention to the effects of both on PRR variations through influencing ET in Xinjiang, so the effects of climate change on PRR through external water vapor transport and other pathways were not considered in the model.
Comparing the PC of ET on PRR in different periods, the PC were 0.578, 0.434, 0.457, and 0.419, which were all positive, but exhibited a decreasing trend. Similarly, the PC of LAI on ET were also positive and presented a decreasing trend. In contrast, the PC of climate on ET were positive and showed an increasing trend. The positive effect on ET gradually decreased (Figure 7). The PC of climate on LAI were positive and presented an increasing trend, with the PC reaching the maximum during 1992–2001. The PC of SM on LAI in different periods were negative, and the negative effect on LAI decreased, with the weakest negative effect of −0.128 being during 1992–2001 and the strongest negative effect of −0.352 being during 2002–2011. The PC of climate on SM were negative and the negative effect showed an increasing trend.
The PLS-SEM also calculated the indirect and total effects (Figure 6). Comparing the total effects of climate and vegetation on the PRR in different periods, the PRR was mainly controlled by climate. The total effects of climate on PRR in different periods were 0.549, 0.414, 0.441, and 0.401, respectively. In contrast, the total effects of vegetation on PRR were much smaller, being only 0.226, 0.141, 0.144, and 0.137, respectively. The effects of both of these on PRR were positive. Compared to the period from 1982 to 1991, the positive effects significantly decreased in the years 1992 to 2001, with relatively smaller variations being observed afterward. The total effects of climate and vegetation on the PRR were indirect effects by affecting ET. Comparing the total effects of climate and vegetation on ET, the total effects of climate were much larger than the total effects of vegetation, though both of them had positive effects. The total effects of vegetation on ET were direct effects, while the total effects of climate on ET included both indirect and direct effects. The indirect and total effects of climate on ET showed decreasing and slight increasing trends, respectively, which implied that the increase in the direct effects of climate on ET offset the decrease in its indirect effects. The decrease in the indirect effects of climate on ET was due to the decrease in the positive effect of the climate -> LAI -> ET and climate -> SM -> LAI -> ET pathways and a slight increase in the negative effect of the climate -> SM -> ET pathway (Table S3).

4. Discussion

4.1. Drivers of Vegetation Variation

In this study, LAI increased significantly, at 0.06 m2m−2/decade in Xinjiang, which suggested that the vegetation in Xinjiang is significantly greening (Figure 3c). The phenomenon of vegetation greening in Xinjiang was mentioned in previous studies through different vegetation indexes [33,34,35,36,76]. This phenomenon could be attributed to the influences of climate change and human activities.
On the one hand, moisture conditions were the main limiting factor for vegetation growth in arid regions compared to thermal conditions, and Xinjiang has become warmer and wetter since the 1980s, which has effectively improved the moisture conditions to promote vegetation growth [36,62,77]. On the other hand, vegetation restoration programs, irrigation, cultivation, and other human activities have also affected vegetation [33,35]. Ecological restoration programs, such as the Three North Shelter Forest Program, have accelerated the vegetation greening in Xinjiang effectively, particularly before the year 2000 [78]. These projects established a farmland-protective forest network in Xinjiang, which has contributed to greening along with the protected farmland [78]. Irrigation and cultivation were also factors that maintained vegetation greening, especially in the extremely arid southern Xinjiang [76,79]. Owing to the scarcity of precipitation in the arid regions, irrigation farming was prevalent in the region, and irrigated cropland developed rapidly over the past century [80]. Previous studies showed that vegetation greening in this region was concentrated in the areas dominated by human activities, with cropland showing the fastest rate of greening and contributing the most to overall greening [35,76]. According to previous quantitative studies across Xinjiang, climate change was dominant compared to human activities [43,46].

4.2. Atmospheric Water Cycle Changes

The average PRR in Xinjiang, as calculated using the Eltahir and Bras model, was 13.92% and increased significantly (1.28%/decade). The results were close to those of previous studies (Table 2), while minor differences may be due to variations in the models, data, and time span, as well as the size and shape of the study area.
This study divided the PRR variations from 1982 to 2018 into climate-driven and vegetation-induced, but we did not consider human activity. This is because previous studies have found that human activities play a relatively small role in vegetation change compared to climate change in this whole region (Table 3). While human activities played a more vital role in the regional areas, for example cropland, the cropland included in this study only accounts for about 8% (Table S1). Thus, this study ignored the effect of human activities on vegetation changes in the whole region. Consequently, the vegetation-induced PRR variations obtained in this study using the random forest algorithm included the following three parts: climate–vegetation interactions, vegetation growth, and human-influenced vegetation. To estimate the effects of these three components, this study was based on the relative contributions of climate change and human activities to vegetation greening (Table 3) and the ratio of the effects of climate–vegetation interaction on PRR variations versus the effects of vegetation itself on PRR variations in the PLS-SEM at the annual scale. Detailed calculations are available in the Supporting Information (Text S1 and Figure S2). It was estimated that the contributions of climate–vegetation interaction to PRR variations was about 6.91~7.90%, that of vegetation growth was about 9.85~11.26%, and that of human-influenced vegetation was about 1.72~4.12%.
This study roughly estimated the contributions of human activities to PRR variations in Xinjiang through their impact on vegetation, as discussed in the previous paragraph; however, some studies in other areas have shown that human activities can also affect the PRR through other pathways. Irrigation is an important factor affecting PRR [37,81], which can affect it directly by influencing local evaporation. In the Haihe Plain, the contributions of irrigation to local precipitation in April, May, and June were 3.76%, 5.12%, and 2.29%, respectively, with ratios of 45.29%, 52.57%, and 22.10% to the PRR of April, May, and June, respectivley [82]. In the U.S. Great Plains region, irrigation increased the PRR by 75% in the summer of 2011 and by 85% in the summer of 2012, respectively [83]. Furthermore, previous studies showed that land use and cover (LUCC) can also influence the precipitation recycling process [84,85,86]. LUCC affected ET, air–water saturation, and sinking water vapor by influencing climatic factors, such as surface temperature [87]. For example, the construction of a number of hydraulic projects in the southeastern Hengduan Mountains after 2000 lowered the land surface temperature, leading to enhanced sinking air and moisture divergence, and ultimately weakening the local precipitation recycling process [88].
After quantifying the effects of climate and vegetation on PRR variations, this study also used PLS-SEM to quantify the influencing pathways of climate and vegetation change on PRR variations through influencing ET in Xinjiang on a monthly scale. Both vegetation and climate showed positive effects on ET. The positive effects of vegetation showed a decreasing trend, while the positive effects of climate presented a contradictory trend, which is due to the fact that the greater direct effects offset the indirect effects. The combined effects led to an increase in ET. However, the positive effects of both of these on PRR did not increase with the rising ET. The positive effects of climate and vegetation on the PRR showed a significant decline, while the PRR showed an overall increasing trend. A possible reason for this is that the PRR was not only affected by the ET, but also by the external water vapor input [12]. Furthermore, water vapor input occurring mainly along the western border showed a decreasing trend [48], which increases the occupation of ET in precipitation, thus leading to an increasing trend in the PRR.
Table 2. A review of PRR studies in Xinjiang and its surroundings.
Study AreaTime SpanApproachDataPRRReferences
Xinjiang1961–2010Brubaker model
Schar model
Meteorological stations, NCEP/NCAR6.48%
7.79%
[39]
Xinjiang1982–2020
(May–August)
DRMMERRA237.91%[40]
Xinjiang1979–2010
(summer)
DRMJRA-2514% (northern Xinjiang)
25% (southern Xinjiang)
[19]
Oasis in northern XinjiangAugust 2012–September 2013
(summer)
Three-component mixing modelPrecipitation isotope16.2% (Urumqi)
<5% (Shihezi and Caijiahu)
[17]
Oasis in southern XinjiangApril 2018–June 2020Bayesian isotopic mixing modelPrecipitation isotope17.0~63.9%[18]
Pamir Plateau and western KL2011–2014Two-component mixing modelPrecipitation isotope11.3~21.3%[89]
Northern slope of TS2018–2022
(summer)
HYSPLIT modelERA519.60%[41]
Arid regions of Northwestern China1979–2012Brubaker modelERA-Interim14.77%[90]
Arid regions of Northwestern China1961–2015Eltahir and Bras modelMeteorological stations, NCEP/NCAR4–10%[38]
Tarim River Basin1950–2005Yi Lan and Tao Shi Yan modelNCEP/NCAR14%[13]
Table 3. A review of the relative contributions of climate change and human activities on vegetation greening studies in Xinjiang and its surroundings.
RegionTime SpanVegetation IndexRelative Contributions
(Climate Change)
Relative
Contributions
(Human Activities)
References
Arid regions of Northwestern China1982–2020LAI82.08%17.92%[91]
Arid regions of Northwestern China2001–2018GPP62.60–66.50%33.50–37.40%[46]
Arid regions of Northwestern China1982–2010NDVI73.26%26.74%[45]
Arid regions of Northwestern China1981–2018LAI96.07% (before 2000)
73.72% (after 2000)
3.97% (before 2000)
26.28% (after 2000)
[43]

4.3. Implications for Water Management

According to the results, the contribution of RP to the increasing precipitation trend was 30.53%, and the contribution of precipitation formed by external advection to the increasing precipitation trend was 69.47% (Figure 8). Furthermore, the precipitation recycling process caused an average of 14.07% ET return to Xinjiang during 1982–2018. Compared to the increasing rate of ET (14.00 mm/decade), the increasing rate of ET water vapor flowing out to other regions was only 10.49 mm/decade, which indicates that the precipitation recycling processes reduced the increasing rate of ET water vapor loss by 25.07%. Overall, the RP formed by the precipitation recycling process increased the precipitation in Xinjiang on the basis of precipitation formed by external advection and also reduced the ET water vapor flowing out to other regions, thus alleviating the drought conditions in Xinjiang to a certain extent.
Based on the above results, we propose several recommendations for future water management, as follows:
(1)
When the supply of alpine glacier runoff reaches a turning point and subsequently declines, industrial water demand may conflict with the water needs of vegetation. Therefore, the precipitation regulated by vegetation should be quantified, as vegetation can reduce ET flow to the surrounding regions through the precipitation recycling process.
(2)
Some scholars have found that extreme precipitation in Xinjiang was closely related to the precipitation recycling process [92]. Therefore, a deeper understanding of this process could enhance our comprehension of extreme precipitation events.

4.4. Limitations

There are some limitations of this study. Firstly, the Eltahir and Bras model is based on the assumption of uniform mixing, which was used to calculate the PRR in this study. Secondly, when separating the climate-driven and vegetation-induced PRR variations, the effects of human activities (e.g., irrigation) were not considered, whereas, in the oasis region of southern Xinjiang, the effects of human activities on vegetation greening were strong. Therefore, judging the intensity of human activities using indicators such as the times of land-use changes and the amount of water used for artificial irrigation can be considered in future [93]. In addition, using climate models is also a good approach in future studies [30,94].

5. Conclusions

During 1982–2018, the LAI and ET increased significantly, with growth rates of 0.06 m2m−2/decade and 13.99 mm/decade, respectively. At the same time, the PRR of Xinjiang was 13.92%, which experienced a significant growth trend of 1.28%/decade. Then, this study quantified the vegetation-induced and climate-driven PRR variations, amounting to 20.88% and 79.12%, respectively. Finally, this study compared the effects of climate and vegetation change on PRR variations through ET in different periods. Both vegetation and climate showed positive effects on ET. The positive effects of vegetation showed a decreasing trend, while the positive effects of climate presented a contradictory trend, which was due to the greater direct effects offsetting the indirect effects. However, the positive effects of both on PRR variations through ET did not increase with the rising total amount of ET, but rather decreased sharply and then stabilized. This study can provide favorable theoretical support for mitigating the contradiction in water use and balancing economic development and ecological security by quantifying the regulation of precipitation by vegetation.

Supplementary Materials

The following supporting information can be downloaded at: https://www.mdpi.com/article/10.3390/rs16224156/s1, Text S1: Eltahir and Bras Model; Text S2: Calculation of total and indirect impacts based on path coefficients; Text S3: Estimating the contributions of the three components of vegetation-induced PRR variations; Figure S1: The training efficiency of the random forest models for climate-driven PRR variations trends in the “climate-dominated region” from 1982 to 2018; Figure S2: PLS-SEM analysis of the climate and vegetation indicators at the annual scale: precipitation, wind speed, temperature, soil moisture, LAI, ET, and PRR; Table S1: Percentage of land use types in the study area from 1992 to 2018; Table S2: Cronbach’s Alpha (CA), Composite Reliability (CR), Average Variance Extracted (AVE), and Goodness of Fit (GoF); Table S3: The indirect effects of climate on ET. Bold part displays significance at a 0.05 level.

Author Contributions

Conceptualization, X.L. and X.H.; Methodology, X.L.; Software, X.L.; Supervision, X.H. and S.Z.; Validation, S.Z.; Writing—original draft, X.L.; Writing—review and editing, X.H., G.H., J.Z., X.F. and Z.Z. All authors have read and agreed to the published version of the manuscript.

Funding

This research was funded by the Strategy Priority Research Program (Category B) of the Chinese Academy of Sciences, grant number XDB0720101.

Data Availability Statement

ERA5 reanalysis data are available from https://cds.climate.copernicus.eu/cdsapp#!/dataset/reanalysis-era5-single-lev-els-monthly-means?tab=form (accessed on 5 November 2023) and https://cds.climate.copernicus.eu/cdsapp#!/dataset/reanalysis-era5-pressure-levels-monthly-means?tab=overview (accessed on 5 November 2023). ERA5-Land reanalysis data are available from https://cds.climate.copernicus.eu/cdsapp#!/dataset/reanalysis-era5-land-monthly-means?tab=overview (accessed on 5 November 2023). GLEAM data are available from the GLEAM homepage at https://www.gleam.eu/ (accessed on 11 November 2023). A new daily gridded precipitation dataset for the Chinese mainland based on gauge observations is available from https://data.tpdc.ac.cn/zh-hans/data/e5c335d9-cbb9-48a6-ba35-d67dd614bb8c (accessed on 20 November 2023). AVHRR data are available from http://www.glass.umd.edu/ (accessed on 23 November 2023). ESA-CCI data are available from http://maps.elie.ucl.ac.be/CCI/viewer/download.php (accessed on 22 October 2024).

Conflicts of Interest

The authors declare no conflicts of interest.

References

  1. Reynolds, J.F.; Stafford Smith, D.M.; Lambin, E.F.; Turner, B.L.; Mortimore, M.; Batterbury, S.P.J.; Downing, T.E.; Dowlatabadi, H.; Fernández, R.J.; Herrick, J.E.; et al. Global desertification: Building a science for dryland development. Science 2007, 316, 847–851. [Google Scholar] [CrossRef] [PubMed]
  2. Huang, J.P.; Ji, M.X.; Xie, Y.K.; Wang, S.S.; He, Y.L.; Ran, J.J. Global semi-arid climate change over last 60 years. Clim. Dyn. 2016, 46, 1131–1150. [Google Scholar] [CrossRef]
  3. Daramola, M.T.; Xu, M. Recent changes in global dryland temperature and precipitation. Int. J. Climatol. 2022, 42, 1267–1282. [Google Scholar] [CrossRef]
  4. Rantanen, M.; Karpechko, A.Y.; Lipponen, A.; Nordling, K.; Hyvarinen, O.; Ruosteenoja, K.; Vihma, T.; Laaksonen, A. The Arctic has warmed nearly four times faster than the globe since 1979. Commun. Earth Environ. 2022, 3, 168. [Google Scholar] [CrossRef]
  5. Yao, J.Q.; Chen, Y.N.; Guan, X.F.; Zhao, Y.; Chen, J.; Mao, W.Y. Recent climate and hydrological changes in a mountain-basin system in Xinjiang, China. Earth Sci. Rev. 2022, 226, 103957. [Google Scholar] [CrossRef]
  6. He, B.; Wang, S.R.; Guo, L.L.; Wu, X.C. Aridity change and its correlation with greening over drylands. Agric. For. Meteorol. 2019, 278, 107663. [Google Scholar] [CrossRef]
  7. Jian, D.N.; Niu, G.Y.; Ma, Z.G.; Liu, H.Y.; Guan, D.B.; Zhou, X.; Zhou, J. Limited driving of elevated CO2 on vegetation greening over global drylands. Environ. Res. Lett. 2023, 18, 104024. [Google Scholar] [CrossRef]
  8. Lian, X.; Piao, S.; Chen, A.; Huntingford, C.; Fu, B.; Li, L.Z.X.; Huang, J.; Sheffield, J.; Berg, A.M.; Keenan, T.F.; et al. Multifaceted characteristics of dryland aridity changes in a warming world. Nat. Rev. Earth Environ. 2021, 2, 232–250. [Google Scholar] [CrossRef]
  9. Gou, J.J.; Miao, C.Y.; Samaniego, L.; Xiao, M.; Wu, J.W.; Guo, X.Y. CNRD v1.0: A High-Quality Natural Runoff Dataset for Hydrological and Climate Studies in China. Bull. Am. Meteorol. Soc. 2021, 102, E929–E947. [Google Scholar] [CrossRef]
  10. Miao, C.Y.; Gou, J.J.; Fu, B.J.; Tang, Q.H.; Duan, Q.Y.; Chen, Z.S.; Lei, H.M.; Chen, J.; Guo, J.L.; Borthwick, A.G.L.; et al. High-quality reconstruction of China’s natural streamflow. Sci. Bull. 2022, 67, 547–556. [Google Scholar] [CrossRef]
  11. Wang, J.; Song, C.; Reager, J.T.; Yao, F.; Famiglietti, J.S.; Sheng, Y.; MacDonald, G.M.; Brun, F.; Schmied, H.M.; Marston, R.A.; et al. Recent global decline in endorheic basin water storages. Nat. Geosci. 2018, 11, 926–932. [Google Scholar] [CrossRef] [PubMed]
  12. Brubaker, K.L.; Entekhabi, D.; Eagleson, P.S. Estimation of continental precipitation recycling. J. Clim. 1993, 6, 1077–1089. [Google Scholar] [CrossRef]
  13. Hai, H.E.; Guihua, L.U. Precipitation Recycling in Tarim River Basin. J. Hydrol. Eng. 2013, 18, 1549–1556. [Google Scholar] [CrossRef]
  14. Kong, Y.L.; Pang, Z.H.; Froehlich, K. Quantifying recycled moisture fraction in precipitation of an arid region using deuterium excess. Tellus Ser. B-Chem. Phys. Meteorol. 2013, 65, 19251. [Google Scholar] [CrossRef]
  15. Li, R.; Wang, C. Precipitation recycling using a new evapotranspiration estimator for Asian-African arid regions. Theor. Appl. Climatol. 2020, 140, 1–13. [Google Scholar] [CrossRef]
  16. Li, R.L.; Wang, C.H.; Wu, D. Changes in precipitation recycling over arid regions in the Northern Hemisphere. Theor. Appl. Climatol. 2018, 131, 489–502. [Google Scholar] [CrossRef]
  17. Wang, S.; Zhang, M.; Che, Y.; Chen, F.; Qiang, F. Contribution of recycled moisture to precipitation in oases of arid central Asia: A stable isotope approach. Water Resour. Res. 2016, 52, 3246–3257. [Google Scholar] [CrossRef]
  18. Wang, S.; Wang, L.; Zhang, M.; Shi, Y.; Hughes, C.E.; Crawford, J.; Zhou, J.; Qu, D. Quantifying moisture recycling of a leeward oasis in arid central Asia using a Bayesian isotopic mixing model. J. Hydrol. 2022, 613, 128459. [Google Scholar] [CrossRef]
  19. Hua, L.; Zhong, L.; Ke, Z. Characteristics of the precipitation recycling ratio and its relationship with regional precipitation in China. Theor. Appl. Climatol. 2017, 127, 513–531. [Google Scholar] [CrossRef]
  20. Numaguti, A. Origin and recycling processes of precipitating water over the Eurasian continent: Experiments using an atmospheric general circulation model. J. Geophys. Res. Atmos. 1999, 104, 1957–1972. [Google Scholar] [CrossRef]
  21. Mohamed, Y.A.; van den Hurk, B.; Savenije, H.H.G.; Bastiaanssen, W.G.M. Hydroclimatology of the Nile: Results from a regional climate model. Hydrol. Earth Syst. Sci. 2005, 9, 263–278. [Google Scholar] [CrossRef]
  22. te Wierik, S.A.; Cammeraat, E.L.H.; Gupta, J.; Artzy-Randrup, Y.A. Reviewing the Impact of Land Use and Land-Use Change on Moisture Recycling and Precipitation Patterns. Water Resour. Res. 2021, 57, e2020WR029234. [Google Scholar] [CrossRef]
  23. van der Ent, R.J.; Savenije, H.H.G.; Schaefli, B.; Steele-Dunne, S.C. Origin and fate of atmospheric moisture over continents. Water Resour. Res. 2010, 46, W09525. [Google Scholar] [CrossRef]
  24. Dirmeyer, P.A.; Brubaker, K.L. Characterization of the global hydrologic cycle from a back-trajectory analysis of atmospheric water vapor. J. Hydrometeorol. 2007, 8, 20–37. [Google Scholar] [CrossRef]
  25. Froehlich, K.; Kralik, M.; Papesch, W.; Rank, D.; Scheifinger, H.; Stichler, W. Deuterium excess in precipitation of Alpine regions—Moisture recycling. Isot. Environ. Health Stud. 2008, 44, 61–70. [Google Scholar] [CrossRef]
  26. Salamalikis, V.; Argiriou, A.A.; Dotsika, E. Isotopic modeling of the sub-cloud evaporation effect in precipitation. Sci. Total Environ. 2016, 544, 1059–1072. [Google Scholar] [CrossRef]
  27. van der Ent, R.J.; Tuinenburg, O.A.; Knoche, H.R.; Kunstmann, H.; Savenije, H.H.G. Should we use a simple or complex model for moisture recycling and atmospheric moisture tracking? Hydrol. Earth Syst. Sci. 2013, 17, 4869–4884. [Google Scholar] [CrossRef]
  28. Wei, J.; Knoche, H.R.; Kunstmann, H. Contribution of transpiration and evaporation to precipitation: An ET-Tagging study for the Poyang Lake region in Southeast China. J. Geophys. Res. Atmos. 2015, 120, 6845–6864. [Google Scholar] [CrossRef]
  29. Dominguez, F.; Kumar, P.; Liang, X.Z.; Ting, M.F. Impact of atmospheric moisture storage on precipitation recycling. J. Clim. 2006, 19, 1513–1530. [Google Scholar] [CrossRef]
  30. Baker, J.C.A.; Spracklen, D.V. Divergent Representation of Precipitation Recycling in the Amazon and the Congo in CMIP6 Models. Geophys. Res. Lett. 2022, 49, e2021GL095136. [Google Scholar] [CrossRef]
  31. Dominguez, F.; Hu, H.; Martinez, J.A. Two-Layer Dynamic Recycling Model (2L-DRM): Learning from Moisture Tracking Models of Different Complexity. J. Hydrometeorol. 2020, 21, 3–16. [Google Scholar] [CrossRef]
  32. Masson-Delmotte, V.; Zhai, A.P.; Pirani, S.L.; Connors, C.P.; Berger, N.S.; Caud, Y.; Chen, L.; Goldfarb, M.I.; Gomis, M.; Huang, K.; et al. (Eds.) IPCC (2021) Climate Change 2021; Cambridge University Press: Cambridge, UK, 2021. [Google Scholar]
  33. Niu, Q.; Xiao, X.; Zhang, Y.; Qin, Y.; Dang, X.; Wang, J.; Zou, Z.; Doughty, R.B.; Brandt, M.; Tong, X.; et al. Ecological engineering projects increased vegetation cover, production, and biomass in semiarid and subhumid Northern China. Land Degrad. Dev. 2019, 30, 1620–1631. [Google Scholar] [CrossRef]
  34. Zhang, H.; Hu, Z.; Zhang, Z.; Li, Y.; Song, S.; Chen, X. How does vegetation change under the warm–wet tendency across Xinjiang, China? Int. J. Appl. Earth Obs. Geoinf. 2024, 127, 103664. [Google Scholar] [CrossRef]
  35. Zhao, R.T.; Liu, X.C.; Dong, J.W.; Zhao, G.; Manevski, K.; Andersen, M.N.; Tang, Q.H. Human activities modulate greening patterns: A case study for southern Xinjiang in China based on long time series analysis. Environ. Res. Lett. 2022, 17, 044012. [Google Scholar] [CrossRef]
  36. Zhou, Y.Q.; Li, Y.M.; Li, W.; Li, F.; Xin, Q.C. Ecological Responses to Climate Change and Human Activities in the Arid and Semi-Arid Regions of Xinjiang in China. Remote Sens. 2022, 14, 3911. [Google Scholar] [CrossRef]
  37. Wang, X.; Cheng, Y.; Liu, L.; Niu, Q.; Huang, G. Improved understanding of how irrigated area expansion enhances precipitation recycling by land-atmosphere coupling. Agric. Water Manag. 2024, 299, 108904. [Google Scholar] [CrossRef]
  38. Wu, P.; Ding, Y.; Liu, Y.; Li, X. The characteristics of moisture recycling and its impact on regional precipitation against the background of climate warming over Northwest China. Int. J. Climatol. 2019, 39, 5241–5255. [Google Scholar] [CrossRef]
  39. Yao, J.Q.; Chen, Y.N.; Zhao, Y.; Guan, X.F.; Mao, W.Y.; Yang, L.M. Climatic and associated atmospheric water cycle changes over the Xinjiang, China. J. Hydrol. 2020, 585, 124823. [Google Scholar] [CrossRef]
  40. Zhang, J.; Wang, S.; He, Y.; Ren, Y.; Huang, J. Contribution of the Precipitation-Recycling Process to the Wetting Trend in Xinjiang, China. J. Geophys. Res. Atmos. 2022, 127, e2021JD036407. [Google Scholar] [CrossRef]
  41. Miao, M.; Zhang, M.; Wang, S.; Sun, Z.; Li, X.; Yuan, X.; Yang, G.; Hu, Z.; Zhang, S. Effect of oasis and irrigation on mountain precipitation in the northern slope of Tianshan Mountains based on stable isotopes. J. Hydrol. 2024, 635, 131151. [Google Scholar] [CrossRef]
  42. Dominguez, F.; Eiras-Barca, J.; Yang, Z.; Bock, D.; Nieto, R.; Gimeno, L. Amazonian Moisture Recycling Revisited Using WRF with Water vapour Tracers. J. Geophys. Res. Atmos. 2022, 127, e2021JD035259. [Google Scholar] [CrossRef]
  43. Xu, L.; Gao, G.; Wang, X.; Chen, Y.; Zhou, C.; Wang, K.; Fu, B. Quantifying the contributions of climate change and human activities to vegetation greening in the drylands of northern China. Acta Ecol. Sin. 2023, 43, 7274–7283. [Google Scholar]
  44. Zhao, P.; Chen, T.; Wang, Q.; Yu, R. Quantitative analysis of the impact of climate change and human activities on grassland ecosystem NPP in Xinjiang. J. Univ. Chin. Acad. Sci. 2020, 37, 51–62. [Google Scholar]
  45. Li, B.F.; Shi, X.; Chen, Y.N.; Jiang, Y.Q. Quantitative assessment of the ecological effects of land use/cover change in the arid region of Northwest China. Environ. Monit. Assess. 2019, 191, 704. [Google Scholar] [CrossRef] [PubMed]
  46. Chen, Y.; Feng, X.; Tian, H.; Wu, X.; Gao, Z.; Feng, Y.; Piao, S.; Lv, N.; Pan, N.; Fu, B. Accelerated increase in vegetation carbon sequestration in China after 2010: A turning point resulting from climate and human interaction. Glob. Chang. Biol. 2021, 27, 5848–5864. [Google Scholar] [CrossRef]
  47. Wang, Q.; Adiku, S.; Tenhunen, J.; Granier, A. On the relationship of NDVI with leaf area index in a deciduous forest site. Remote Sens. Environ. 2005, 94, 244–255. [Google Scholar] [CrossRef]
  48. Guan, X.F.; Yang, L.M.; Zhang, Y.X.; Li, J.G. Spatial distribution, temporal variation, and transport characteristics of atmospheric water vapor over Central Asia and the arid region of China. Glob. Planet. Chang. 2019, 172, 159–178. [Google Scholar] [CrossRef]
  49. Du, J.; Shu, J.; Yin, J.; Yuan, X.; Jiaerheng, A.; Xiong, S.; He, P.; Liu, W. Analysis on spatio-temporal trends and drivers in vegetation growth during recent decades in Xinjiang, China. Int. J. Appl. Earth Obs. Geoinf. 2015, 38, 216–228. [Google Scholar] [CrossRef]
  50. An, L.; Yao, Z.; Zhang, P.; Jia, S.; Zhao, J.; Gao, L.; Liu, Z. Regional characteristics and exploitation potential of atmospheric water resources in China. Int. J. Climatol. 2022, 42, 3225–3245. [Google Scholar] [CrossRef]
  51. Qu, L.L.; Yao, J.Q.; Zhao, Y. Mechanism analysis of the summer dry-wet interdecadal transition in the Tarim Basin, Northwest China. Atmos. Res. 2023, 291, 106840. [Google Scholar] [CrossRef]
  52. Tian, J.X.; Zhang, Z.X.; Zhao, T.B.; Tao, H.; Zhu, B. Warmer and wetter climate induced by the continual increase in atmospheric temperature and precipitable water vapor over the arid and semi-arid regions of Northwest China. J. Hydrol.-Reg. Stud. 2022, 42, 101151. [Google Scholar] [CrossRef]
  53. Yang, Y.; Lin, Z.; Luo, L.; Zhong, L.; Jiang, D. Variation of Surface Air Temperature Induced by Enhanced Land-Atmosphere Coupling During 1981-2020 in Xinjiang, Northwest China. J. Geophys. Res. Atmos. 2023, 128, e2022JD037983. [Google Scholar] [CrossRef]
  54. Miao, C.; Han, J.; Gou, J. A New Daily Gridded Precipitation Dataset for the Chinese Mainland Based on Gauge Observations; National Tibetan Plateau Data Center: Beijing, China, 2023. [Google Scholar] [CrossRef]
  55. Han, J.; Miao, C.; Gou, J.; Zheng, H.; Zhang, Q.; Guo, X. A new daily gridded precipitation dataset for the Chinese mainland based on gauge observations. Earth Syst. Sci. Data 2023, 15, 3147–3161. [Google Scholar] [CrossRef]
  56. Martens, B.; Miralles, D.G.; Lievens, H.; van der Schalie, R.; de Jeu, R.A.M.; Fernandez-Prieto, D.; Beck, H.E.; Dorigo, W.A.; Verhoest, N.E.C. GLEAM v3: Satellite-based land evaporation and root-zone soil moisture. Geosci. Model. Dev. 2017, 10, 1903–1925. [Google Scholar] [CrossRef]
  57. Xu, L.; Gao, G.; Wang, X.; Fu, B. Distinguishing the effects of climate change and vegetation greening on soil moisture variability along aridity gradient in the drylands of northern China. Agric. For. Meteorol. 2023, 343, 109786. [Google Scholar] [CrossRef]
  58. Miralles, D.G.; Holmes, T.R.H.; De Jeu, R.A.M.; Gash, J.H.; Meesters, A.G.C.A.; Dolman, A.J. Global land-surface evaporation estimated from satellite-based observations. Hydrol. Earth Syst. Sci. 2011, 15, 453–469. [Google Scholar] [CrossRef]
  59. Meng, S.S.; Xie, X.H.; Zhu, B.W.; Wang, Y.B. The relative contribution of vegetation greening to the hydrological cycle in the Three-North region of China: A modelling analysis. J. Hydrol. 2020, 591, 125689. [Google Scholar] [CrossRef]
  60. Paciolla, N.; Corbari, C.; Hu, G.C.; Zheng, C.L.; Menenti, M.; Jia, L.; Mancini, M. Evapotranspiration estimates from an energy-water-balance model calibrated on satellite land surface temperature over the Heihe basin. J. Arid. Environ. 2021, 188, 104466. [Google Scholar] [CrossRef]
  61. Xiao, Z.; Liang, S.; Wang, J.; Xiang, Y.; Zhao, X.; Song, J. Long-Time-Series Global Land Surface Satellite Leaf Area Index Product Derived from MODIS and AVHRR Surface Reflectance. IEEE Trans. Geosci. Remote Sens. 2016, 54, 5301–5318. [Google Scholar] [CrossRef]
  62. Hu, Y.G.; Li, H.; Wu, D.; Chen, W.; Zhao, X.; Hou, M.L.; Li, A.J.; Zhu, Y.J. LAI-indicated vegetation dynamic in ecologically fragile region: A case study in the Three-North Shelter Forest program region of China. Ecol. Indic. 2021, 120, 106932. [Google Scholar] [CrossRef]
  63. Eltahir, E.A.B.; Bras, R.L. Precipitation recycling in the amazon basin. Q. J. R. Meteorol. Soc. 1994, 120, 861–880. [Google Scholar] [CrossRef]
  64. Eltahir, E.A.B.; Bras, R.L. Precipitation recycling. Rev. Geophys. 1996, 34, 367–378. [Google Scholar] [CrossRef]
  65. Deng, Y.; Wang, S.; Bai, X.; Luo, G.; Wu, L.; Chen, F.; Wang, J.; Li, C.; Yang, Y.; Hu, Z.; et al. Vegetation greening intensified soil drying in some semi-arid and arid areas of the world. Agric. For. Meteorol. 2020, 292, 108103. [Google Scholar] [CrossRef]
  66. Pearl, J. The Causal Mediation Formula-A Guide to the Assessment of Pathways and Mechanisms. Prev. Sci. 2012, 13, 426–436. [Google Scholar] [CrossRef] [PubMed]
  67. Reinartz, W.; Haenlein, M.; Henseler, J. An empirical comparison of the efficacy of covariance-based and variance-based SEM. Int. J. Res. Mark. 2009, 26, 332–344. [Google Scholar] [CrossRef]
  68. Richter, N.F.; Cepeda, G.; Roldan, J.L.; Ringle, C.M. European management research using partial least squares structural equation modeling (PLS-SEM). Eur. Manag. J. 2016, 34, 589–597. [Google Scholar] [CrossRef]
  69. Xu, B.; Li, J.; Pei, X.; Yang, H. Decoupling the response of vegetation dynamics to asymmetric warming over the Qinghai-Tibet plateau from 2001 to 2020. J. Environ. Manag. 2023, 347, 119131. [Google Scholar] [CrossRef]
  70. Shi, Z.; Xu, X.; Souza, L.; Wilcox, K.; Jiang, L.F.; Liang, J.Y.; Xia, J.Y.; Garcia-Palacios, P.; Luo, Y.Q. Dual mechanisms regulate ecosystem stability under decade-long warming and hay harvest. Nat. Commun. 2016, 7, 11973. [Google Scholar] [CrossRef]
  71. Wang, C.; Ma, L.; Zhang, Y.; Chen, N.; Wang, W. Spatiotemporal dynamics of wetlands and their driving factors based on PLS-SEM: A case study in Wuhan. Sci. Total Environ. 2022, 806, 151310. [Google Scholar] [CrossRef]
  72. Jia, Z.X.; Lin, T.; Guo, X.Z.; Zheng, Y.C.; Geng, H.K.; Zhang, J.M.; Chen, Y.; Liu, W.H.; Lin, M.X. Vegetation greening mitigates the positive impacts of climate change on water availability in Northwest China. J. Hydrol. 2024, 644, 132086. [Google Scholar] [CrossRef]
  73. Zhong, Z.; He, B.; Wang, Y.-P.; Chen, H.W.; Chen, D.; Fu, Y.H.; Chen, Y.; Guo, L.; Deng, Y.; Huang, L.; et al. Disentangling the effects of vapor pressure deficit on northern terrestrial vegetation productivity. Sci. Adv. 2023, 9, eadf3166. [Google Scholar] [CrossRef] [PubMed]
  74. Zhu, X.H.; Zhang, P.F.; Wei, Y.G.; Li, Y.; Zhao, H.R. Measuring the efficiency and driving factors of urban land use based on the DEA method and the PLS-SEM model-A case study of 35 large and medium-sized cities in China. Sustain. Cities Soc. 2019, 50, 101646. [Google Scholar] [CrossRef]
  75. Zhao, Z.; Fu, B.; Lu, Y.; Li, T.; Deng, L.; Wang, Y.; Lu, D.; Wang, Y.; Wu, X. Variable climatic conditions dominate decreased wetland vulnerability on the Qinghai-Tibet Plateau: Insights from the ecosystem pattern-process-function framework. J. Clean. Prod. 2024, 458, 142496. [Google Scholar] [CrossRef]
  76. Jiapaer, G.; Liang, S.; Yi, Q.; Liu, J. Vegetation dynamics and responses to recent climate change in Xinjiang using leaf area index as an indicator. Ecol. Indic. 2015, 58, 64–76. [Google Scholar] [CrossRef]
  77. Shi, Y.; Shen, Y.; Li, D.; Zhang, G.; Ding, Y.; Hu, R.; Kang, E. Discussion on the present climate change from warm-dry to warm-wet in northwest china. Quat. Sci. 2003, 23, 152–164. [Google Scholar]
  78. Zhang, Y.; Peng, C.H.; Li, W.Z.; Tian, L.X.; Zhu, Q.Q.; Chen, H.; Fang, X.Q.; Zhang, G.L.; Liu, G.M.; Mu, X.M.; et al. Multiple afforestation programs accelerate the greenness in the ‘Three North’ region of China from 1982 to 2013. Ecol. Indic. 2016, 61, 404–412. [Google Scholar] [CrossRef]
  79. Liu, Y.; Li, L.; Chen, X.; Zhang, R.; Yang, J. Temporal-spatial variations and influencing factors of vegetation cover in Xinjiang from 1982 to 2013 based on GIMMS-NDVI3g. Glob. Planet. Chang. 2018, 169, 145–155. [Google Scholar] [CrossRef]
  80. Zhao, Y.; Fang, Y.J.; Cui, C.X.; Huang, A.N. Effects of irrigation on precipitation in the arid regions of Xinjiang, China. J. Arid. Land 2012, 4, 132–139. [Google Scholar] [CrossRef]
  81. Xu, D.; Lin, Y. Impacts of Irrigation and Vegetation Growth on Summer Rainfall in the Taklimakan Desert. Adv. Atmos. Sci. 2021, 38, 1863–1872. [Google Scholar] [CrossRef]
  82. Gui, Y.P.; Wang, Q.M.; Zhao, Y.; Ma, M.Y.; Li, H.H.; Zhai, J.Q.; Li, E.C. On the Increased Precipitation Recycling by Large-Scale Irrigation over the Haihe Plain. J. Meteorol. Res. 2022, 36, 450–461. [Google Scholar] [CrossRef]
  83. Yang, Z.; Qian, Y.; Liu, Y.; Berg, L.K.; Hu, H.C.; Dominguez, F.; Yang, B.; Feng, Z.; Gustafson, W.I.; Huang, M.Y.; et al. Irrigation Impact on Water and Energy Cycle During Dry Years Over the United States Using Convection-Permitting WRF and a Dynamical Recycling Model. J. Geophys. Res. Atmos. 2019, 124, 11220–11241. [Google Scholar] [CrossRef]
  84. Li, Y.; Wang, C.; Peng, H.; Xiao, S.; Yan, D. Contribution of moisture sources to precipitation changes in the Three Gorges Reservoir Region. Hydrol. Earth Syst. Sci. 2021, 25, 4759–4772. [Google Scholar] [CrossRef]
  85. Ganguly, A.; Oza, H.; Padhya, V.; Pandey, A.; Chakra, S.; Deshpande, R.D. Extreme local recycling of moisture via wetlands and forests in North-East Indian subcontinent: A Mini-Amazon. Sci. Rep. 2023, 13, 521. [Google Scholar] [CrossRef] [PubMed]
  86. Pranindita, A.; Wang-Erlandsson, L.; Fetzer, I.; Teuling, A.J. Moisture recycling and the potential role of forests as moisture source during European heatwaves. Clim. Dyn. 2022, 58, 609–624. [Google Scholar] [CrossRef]
  87. Jiang, H.; Lu, N.; Zhang, X.; Yao, L.; Bai, Y. Satellite observed cooling effects from re-vegetation on the Mongolian Plateau. Sci. Total Environ. 2021, 781, 146707. [Google Scholar] [CrossRef]
  88. Zhang, X.; Liu, Z.; Liu, Y.; Jiang, L.; Wang, R.; Jiang, H.; Li, J.; Tang, Q.; Yao, Z. Examining moisture contribution for precipitation in response to climate change and anthropogenic factors in Hengduan Mountain Region, China. J. Hydrol. 2023, 620, 129562. [Google Scholar] [CrossRef]
  89. Sun, C.; Chen, Y.; Li, J.; Chen, W.; Li, X. Stable isotope variations in precipitation in the northwesternmost Tibetan Plateau related to various meteorological controlling factors. Atmos. Res. 2019, 227, 66–78. [Google Scholar] [CrossRef]
  90. Guo, L.; Klingaman, N.P.; Demory, M.-E.; Vidale, P.L.; Turner, A.G.; Stephan, C.C. The contributions of local and remote atmospheric moisture fluxes to East Asian precipitation and its variability. Clim. Dyn. 2018, 51, 4139–4156. [Google Scholar] [CrossRef]
  91. Wang, W.; Ma, Y.; Jin, S.; Gong, W.; Sun, L.; Li, H.; Liu, B. An improved framework for quantifying the contribution of climatic and anthropogenic factors to vegetation dynamics—A case study of China. J. Environ. Manag. 2024, 370, 122967. [Google Scholar] [CrossRef]
  92. Zhang, J.; Wang, S.; Huang, J.; He, Y.; Ren, Y. The Precipitation-Recycling Process Enhanced Extreme Precipitation in Xinjiang, China. Geophys. Res. Lett. 2023, 50, e2023GL104324. [Google Scholar] [CrossRef]
  93. Hou, G.; Wu, S.; Long, W.; Chen, C.; Zhang, Z.; Fang, Y.; Zhang, Y.; Luo, G. Quantitative analysis of the impact of climate change and oasification on changes in net primary productivity variation in mid-Tianshan Mountains from 2001 to 2020. Ecol. Indic. 2023, 154, 110820. [Google Scholar] [CrossRef]
  94. Liu, Y.; Ge, J.; Guo, W.; Cao, Y.; Chen, C.; Luo, X.; Yang, L.; Wang, S. Revisiting Biophysical Impacts of Greening on Precipitation Over the Loess Plateau of China Using WRF with Water Vapor Tracers. Geophys. Res. Lett. 2023, 50, e2023GL102809. [Google Scholar] [CrossRef]
Figure 1. Study area of Xinjiang.
Remotesensing 16 04156 g001
Figure 2. Schematic diagram of the atmospheric water cycle. In this figure, N represents the amount of water vapor stored and the rest of the letters have the same meaning as before.
Remotesensing 16 04156 g002
Figure 3. Spatial distribution of (a) leaf area index (LAI) variations, (b) evapotranspiration (ET) variations, (d) correlation coefficients between LAI and ET from 1982 to 2018, respectively, and overall variations of (c) ET and LAI and the overall correlation coefficients from 1982 to 2018. Shaded parts mark pixels with significance at the 0.05 level and have the same meaning in the subsequent images.
Remotesensing 16 04156 g003
Figure 4. Spatial distribution of (a) (precipitation recycling rate) PRR, (b) PRR variations from 1982 to 2018, respectively, and (c) variations of ET and PRR and the overall correlation coefficients from 1982 to 2018.
Remotesensing 16 04156 g004
Figure 5. Spatial distribution of (a) climate-driven PRR trend and (b) vegetation-induced PRR from 1982 to 2018.
Remotesensing 16 04156 g005
Figure 6. PLS-SEM analysis of the climate and vegetation indicators: precipitation, wind speed, temperature, soil moisture, LAI, ET, and PRR in different periods. Bold part displays significance at a 0.05 level.
Remotesensing 16 04156 g006
Figure 7. Indirect and total effects in different periods. Bold displays with significance at a 0.05 level.
Remotesensing 16 04156 g007
Figure 8. Time series of precipitation, precipitation formed by external advection (P_out), and RP anomalies from 1982 to 2018. The pie chart shows the contribution of P_out and RP to the trend of precipitation.
Remotesensing 16 04156 g008
Table 1. Data used in this study.
DataWebsiteSpatial ResolutionTemporal ResolutionPeriod
ERA5https://cds.climate.copernicus.eu/
(accessed on 5 November 2023)
0.25° × 0.25°1 month1982–2018
ERA5-landhttps://cds.climate.copernicus.eu/
(accessed on 5 November 2023)
0.1° × 0.1°1 month, 1 h1982–2018
GLEAMhttps://www.gleam.eu
(accessed on 11 November 2023)
0.25° × 0.25°1 month, 1 year1982–2018
Daily precipitation datasethttps://data.tpdc.ac.cn/
(accessed on 20 November 2023)
0.25° × 0.25°1 day1982–2018
AVHRRhttp://www.glass.umd.edu/
(accessed on 23 November 2023)
0.05° × 0.05°8 days1982–2018
ESA-CCIhttp://maps.elie.ucl.ac.be/CCI/viewer/download.php (accessed on 22 October 2024)300 m × 300 m1 year1992, 2000, 2010, 2018
Disclaimer/Publisher’s Note: The statements, opinions and data contained in all publications are solely those of the individual author(s) and contributor(s) and not of MDPI and/or the editor(s). MDPI and/or the editor(s) disclaim responsibility for any injury to people or property resulting from any ideas, methods, instructions or products referred to in the content.

