Abstract
The ecosystem’s gross primary productivity (GPP) and greenness, as indicated by the normalized difference vegetation index (NDVI), are both essential ecological indicators used to evaluate how ecosystems responded to climate variability. However, the relationships between NDVI and GPP under the influence of drying and wetting and its characteristics along aridity (AI) gradients were not yet fully understood. In this study, we investigated the relationships of the NDVI-GPP (i.e., the strength of the coupling and the sensitivity, as quantified by the coefficient of determination (R2) and slope of the linear regression, respectively) along the aridity gradients during the growing season from 1982 to 2018 in China. The results show that the coupling between NDVI and GPP was stronger (i.e., high R2) in semi-arid regions (0.24) compared to humid and hyper-humid regions (R2 values were 0.11). For different plant functional types (PFTs), decoupling occurred in ENF with a determination coefficient value (R2) of 0.04, whereas GRA shows a higher coupling with an R2 of 0.20. The coupling trend experienced a shift in semi-arid regions, characterized by an aridity index (AI) ranging from 0.20 to 0.50. Additionally, the sensitivity of GPP to NDVI also decreased with increasing aridity. The slope values were 0.19, 0.21, 0.24, 0.20, 0.11, and 0.11 in hyper-arid, arid, semi-arid, dry sub-humid, humid, and hyper-humid, respectively. What is more, asynchronous changes in vegetation productivity and greenness can be detected by capturing the inter-annual variability (IAV) of NDVI and GPP. The IAV of GPP steadily decreased with the aridity gradients, while the IAV of NDVI present fluctuated, suggesting that NDVI was more variable than GPP under the influence of drying and wetting conditions. Our study suggests that there may be a stronger trade-off between ecosystem greenness and photosynthesis in more humid areas.
1. Introduction
The world is currently experiencing significant climate change, primarily characterized by global warming, which has led to notable changes in regional drying and wetting trends [1,2]. The main cause is the increase in atmospheric CO2 concentration, which has enhanced vegetation productivity through fertilization effects, although this effect seems to have declined in most regions in recent years [3]. However, continued warming will intensify dryness stress and atmospheric evaporative demand, resulting in increased vegetation mortality [4,5] and higher wildfire frequency. The resulting stress on photosynthesis further reduces vegetation productivity and weakens carbon cycles [6]. Consequently, regional terrestrial ecosystems may transition from being carbon sinks to carbon sources [7,8].
Gross primary production (GPP) and vegetation indices (VIs) play a crucial role in regulating climate change and mediating vegetation–land–atmosphere interactions [9,10,11]. As the primary indicator of photosynthetic activity, GPP significantly contributes to global carbon sequestration [12,13]. Simultaneously, various vegetation indices, including the leaf area index (LAI), enhanced vegetation index (EVI), and normalized difference vegetation index (NDVI), are used to monitor how vegetation greenness changes with the season, providing valuable insights into the seasonal patterns of GPP [14]. Both NDVI and EVI data products are sensitive indicators of leaf area and chlorophyll content. Unlike GPP and LAI, they are based purely on the radiometrically and geometrically corrected measurements made by satellites. MODIS EVI, in particular, provides a vegetation index that does not saturate at high chlorophyll situations and is less sensitive to atmospheric and soil contamination. Overall, satellite remote sensing technology provides a way to continuously monitor the greenness and productivity across wide areas [15]. Through this monitoring, a significant greening trend in vegetation area has been revealed since the 1980s, both in China and globally [16,17,18]. Ongoing greening has led to increased terrestrial ecosystem productivity [19,20,21], primarily due to the positive relationship between greenness and productivity [22,23]. Vegetation productivity and greenness are also affected by hydrological climate change and aridity conditions and show a trend towards non-linear responses. This depends on their resistance and resilience to long-term climate change [24], leading to the induction of asynchronized inter-annual changes at seasonal or longer temporal resolutions [25].
Although the previously established positive relationship between greenness and GPP, recent studies have reported changes or even decoupled in the LAI-GPP relationship, especially over short timescales [22,26,27]. The correlation between greenness and productivity is influenced by numerous factors, including differences in observation timing and various environmental factors [10,28]. A mismatch between greenness and productivity has been demonstrated in many studies. For instance, Xu et al. (2011) found that greenness decreased in Amazonian rainforests during the 2010 drought, but vegetation productivity remained unchanged [29]. Conversely, Yang et al. (2018) reported that during the 2015–2016 drought period, there was little change in greenness, while canopy photosynthesis decreased substantially [27]. Additionally, a weak correlation between vegetation greenness and GPP has also been reported in some ecosystems [30,31]. Sarmah et al. (2021) examined the spatiotemporal dynamics of greenness and productivity in South Asia and revealed that while there was a noticeable increase in greenness, the rise in productivity was comparatively modest [32]. Additionally, environmental factors also weaken the relationship between greenness and productivity. Studies validated that prolonged drought also causes a significant decline in greenness in arid ecosystems but has little effect on productivity [18]. Therefore, the response of GPP to changes in NDVI along aridity gradients needs to be fully investigated.
The response of vegetation dynamics to climate change is a key process in external forcing, quantified by vegetation sensitivity, which indicates the degree and magnitude of vegetation anomalies and phenology in response to disturbances [33]. Recent studies have extensively investigated the sensitivity of vegetation to climate change (i.e., temperature, precipitation, drought, and CO2) [10,34,35,36]. Generally, previous research has focused on specific regions or ecosystems over short time periods [37,38], which provides valuable information on ecosystem resilience. High sensitivity might lead to slow recovery of vegetation from disturbances or even lead to ecosystem succession [33]. Nevertheless, the effects of long-term drying and wetting trends on vegetation productivity and greenness, particularly along the spatial aridity gradients across China, are still not well understood. Furthermore, these studies have often overlooked the analysis of the sensitivity trends and variations among different plant functional types (PFTs). Greenness and productivity are closely linked to aridity conditions, as water availability strongly restricts plant growth [39]. What is more, the alignment of inter-annual variations in productivity with greenness, and how this relationship changes spatially remain unclear. Despite these uncertainties, little attention has been paid to the impact of the aridity gradient during the growing season. Therefore, it is essential to thoroughly investigate how changes in NDVI and GPP respond to aridity. This will help clarify the trajectory and magnitude of vegetation activity across different ecosystems in response to temporal and spatial changes in the aridity index. Understanding these dynamics is crucial for grasping how plant growth responds to varying aridity conditions.
Understanding the coupling between NDVI and GPP can provide insights into how changes in vegetation greenness correspond to variations in photosynthetic activity, while sensitivity analysis helps determine how responsive GPP is to changes in NDVI under different climatic conditions. Here, we used NDVI and GPP products to investigate the variability of the NDVI-GPP relationships across the aridity gradients in China during the growing season from 1982 to 2018. The main research objectives are to address the following two questions: (1) How do the coupling and sensitivity of NDVI-GPP vary across different aridity gradients and PFTs in China during the growing season? (2) What are the asynchronous changes between greenness and productivity of IAVs explaining spatial variability? Accordingly, this study aims to provide mechanistic evidence of the impacts of aridity gradients and PFTs on the relationships between NDVI and GPP.
2. Materials and Methods
2.1. Satellite Data
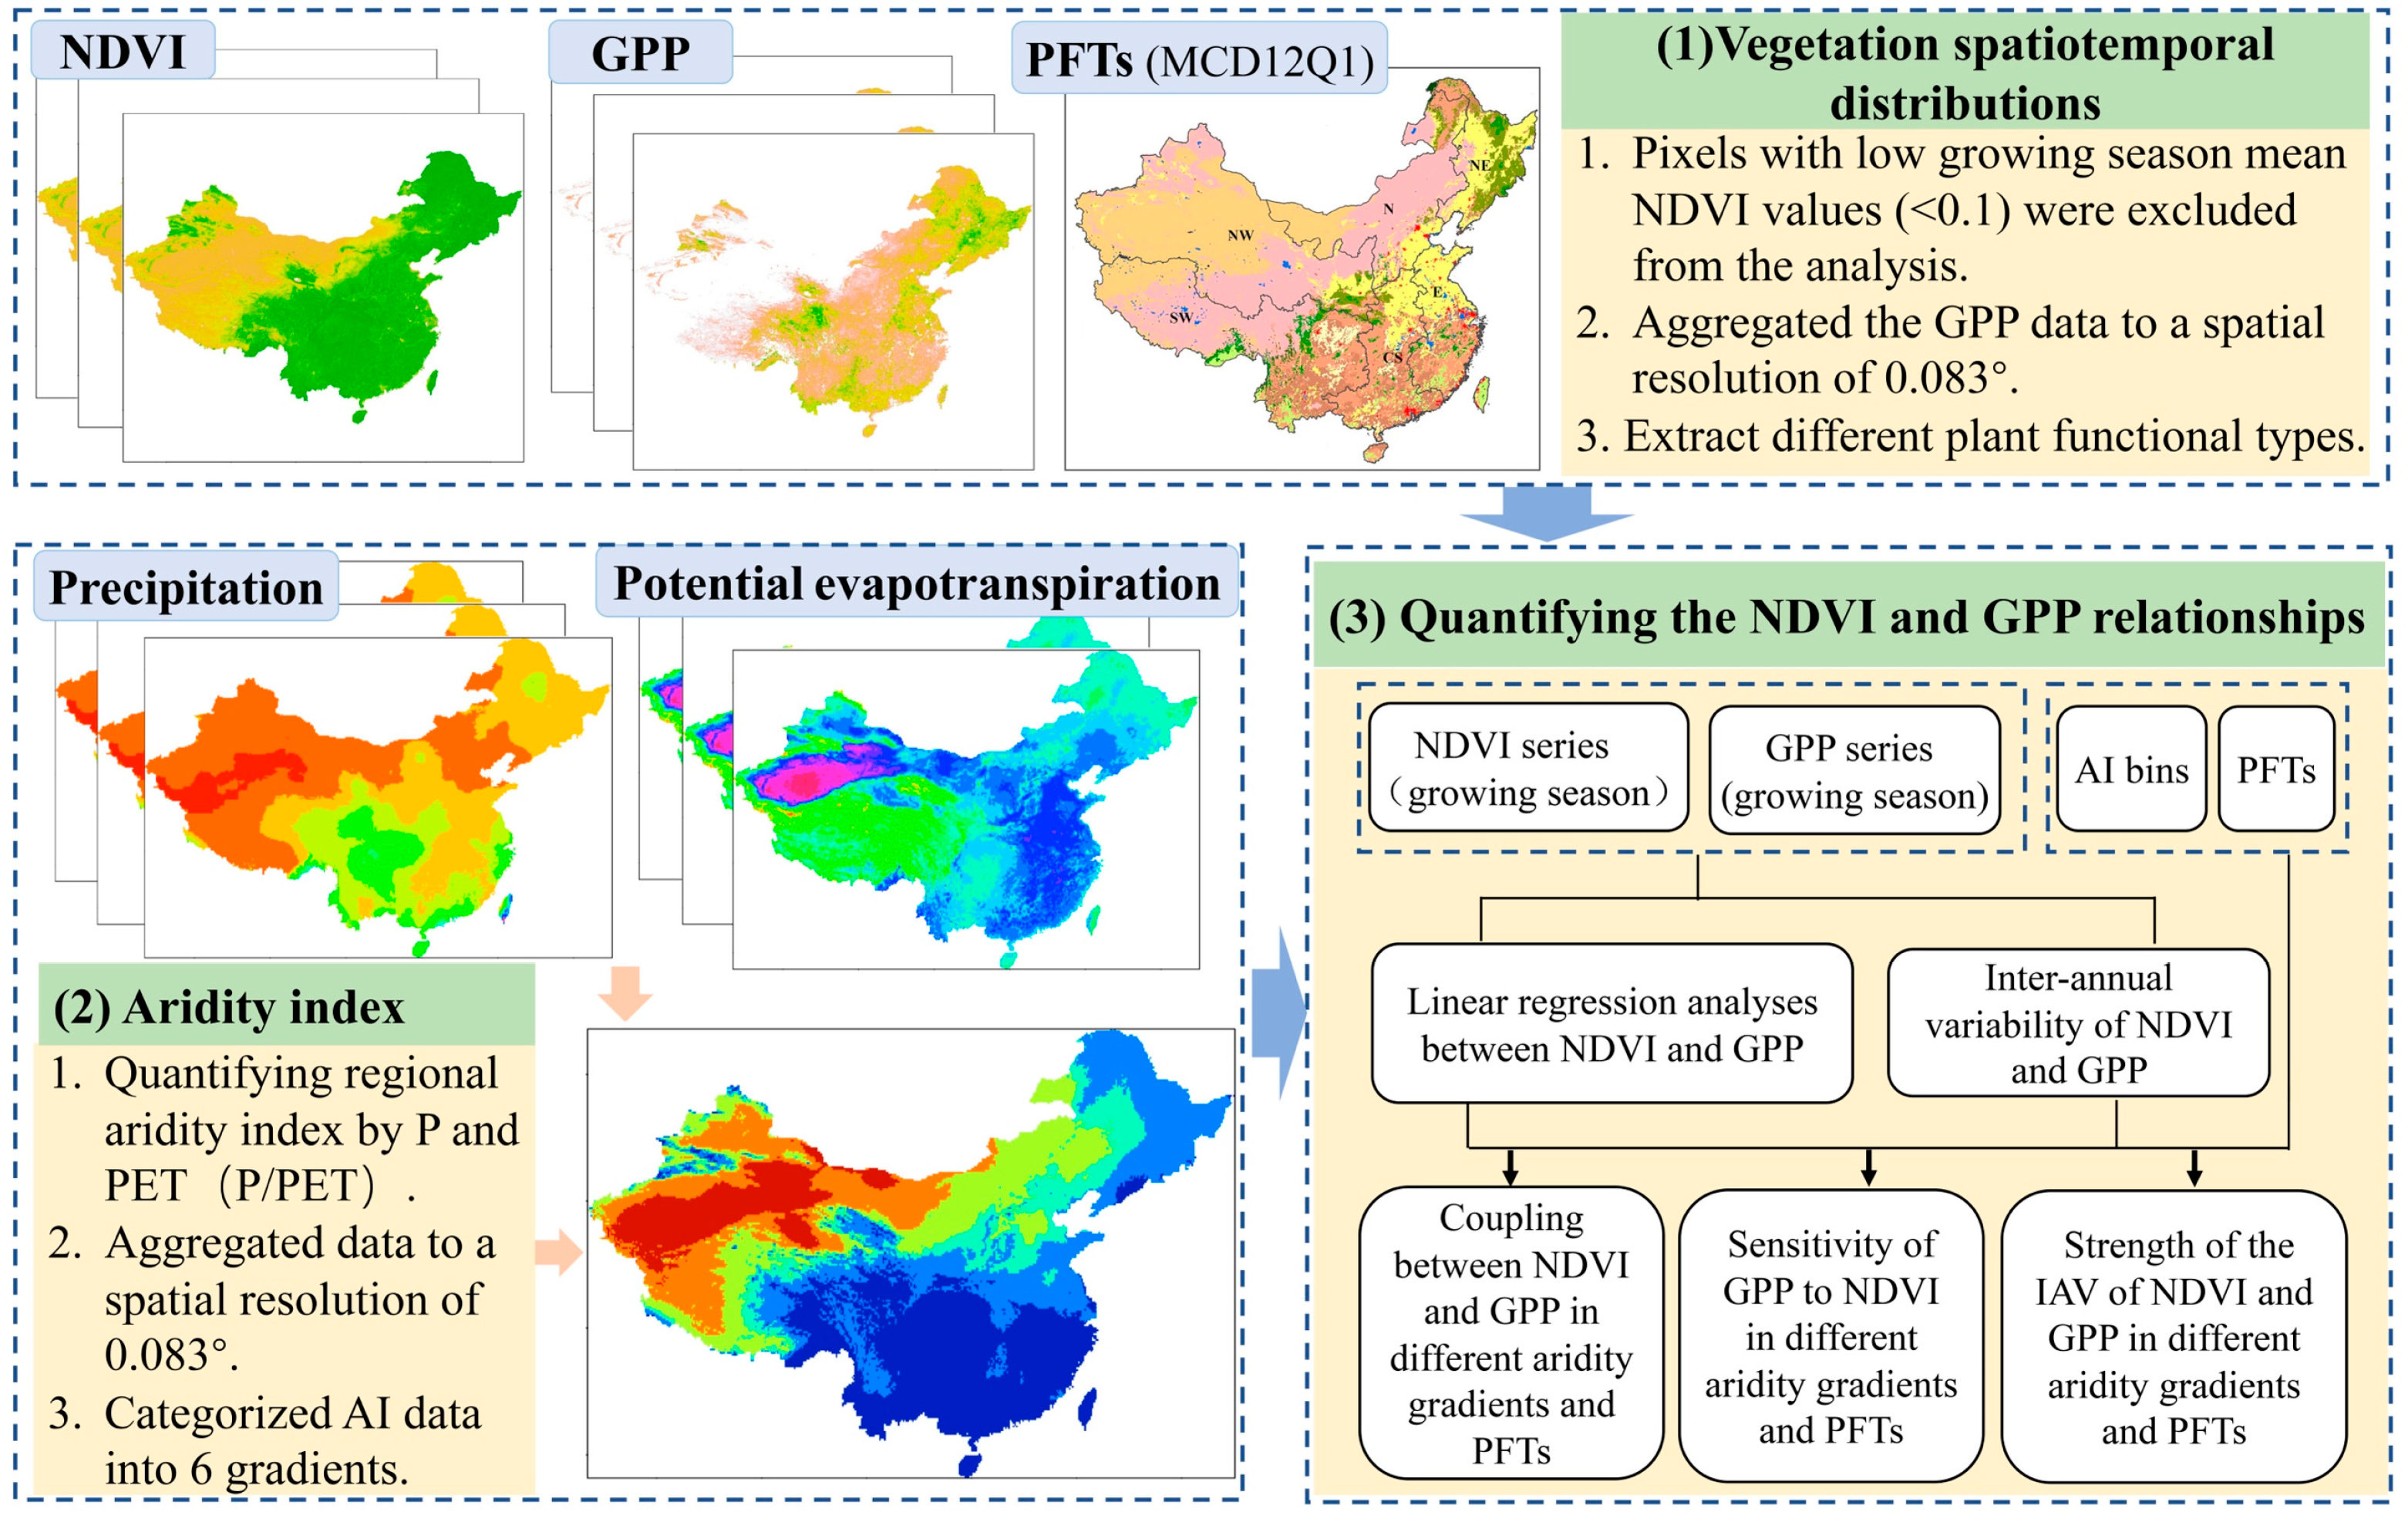
NDVI and GPP are commonly used to evaluate vegetation greenness and productivity. In this study, we used monthly NDVI data from the period of 1982–2018, which were obtained from the Advanced Very High Resolution Radiometer (AVHRR) satellite program under the Global Inventory Modeling and Mapping Studies (GIMMS) project. The NDVI data, which have a spatial resolution of 0.083°, was sourced from the https://cmr.earthdata.nasa.gov/search/concepts/C2759076389-ORNL_CLOUD.html (accessed on 18 May 2023). For GPP, we employed the NIRv_GPP product, which has an initially spatial resolution of 0.05°. The data can be obtained from https://data.tpdc.ac.cn/zh-hans/data/d6dff40f-5dbd-4f2d-ac96-55827ab93cc5 (accessed on 20 May 2023). To match the NDVI data used in our study, we aggregated the GPP data to a spatial resolution of 0.083°. Here, we focused on the growing season, defined consistently as from May to October in the study region [40]. The growing season NDVI and GPP values were calculated by averaging monthly NDVI and GPP values from May to October per year. In this study, pixels with a mean NDVI value below 0.1 during the growing season were excluded from the analysis of the relationship between NDVI and GPP.
2.2. Aridity Index
The aridity index (AI) serves as a measure to quantify regional dryness and humidity conditions, reflecting the soil water availability [41,42]. A decrease in AI implies increasing aridity, which diminishes soil water availability, disrupting the composition, structure, and function of the terrestrial ecosystems [43]. Here, we calculated the AI to assess the relationships between vegetation productivity and greenness in drying and wetting conditions. The AI is defined as the ratio of annual precipitation to annual potential evapotranspiration, with higher values indicating more humid conditions and lower values indicating more arid conditions. This index was derived from the multiyear average (1982–2018) of the ratio of annual precipitation (P) to annual potential evapotranspiration (PET). For the precipitation, the data were sourced from https://www.geodata.cn/data/datadetails.html?dataguid=192891852410344&docId=2218 (accessed on 1 August 2023), and for evapotranspiration, the data were downloaded from https://www.geodata.cn/data/datadetails.html?dataguid=34595274939620&docId=1751 (accessed on 1 August 2023). The data’s spatial resolution is 0.0083°. An AI value lower than 0.65 was considered indicative of drought conditions [44,45]. In this study, AI data were categorized into 6 gradients: hyper-arid (AI < 0.05), arid (AI between 0.03 and 0.20), semi-arid (AI between 0.20 and 0.50), dry sub-humid (AI between 0.50 and 0.65), humid (AI between 0.65 and 1), and hyper-humid (AI > 1.00). The mean AI value reflects the spatial variation in aridity conditions. The aridity gradient map illustrates a clear distribution of dry and wet conditions across China (Figure 1b). To match the NDVI data used in our study, we aggregated the AI data to a spatial resolution of 0.083°.
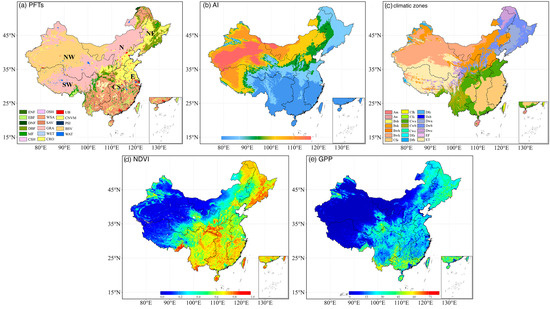
Figure 1.
(a) Land use types in China in 2010, including ENF (evergreen needleleaf forest), EBF (evergreen broadleaf forest), DNF (deciduous needleleaf forest), DBF (deciduous broadleaf forest), MF (mixed forests), CSH (closed shrublands), OSH (open shrublands), WSA (woody savannas), SAV (savannas), GRA (grasslands), WET (wetlands), CRO (croplands), UB (urban and built-up), CNVM (cropland/natural vegetation mosaic), PSI (permanent snow and ice), BSV (barren of sparsely vegetated), and WAT (water bodies). (b) Spatial pattern of aridity index (AI) in the study area. (c) The classification of the Koppen–Geiger climatic zones. Spatial distribution of annual mean NDVI (d) and GPP (e) during the growing season from 1982 to 2018.
2.3. Land Cover Data
The Moderate Resolution Imaging Spectroradiometer (MODIS) annual land cover type products (MCD12Q1) were utilized to identify vegetation types within the study area. These products, which have a spatial resolution of 0.05°, can be downloaded from https://lpdaac.usgs.gov/products/mcd12q1v006/ (accessed on 11 March 2022). The land cover was classified into 17 categories based on the International Geosphere–Biosphere Programme (IGBP) classification schemes. The data were re-gridded to a spatial resolution of 0.083° × 0.083° to align with NDVI data, allowing us to estimate the NDVI-GPP relationship across different PFTs. We concentrated on the following vegetation types: ENF (evergreen needleleaf forest), EBF (evergreen broadleaf forest), DNF (deciduous needleleaf forest), DBF (deciduous broadleaf forest), MF (mixed forests), CSH (closed shrublands), OSH (open shrublands), WSA (woody savannas), SAV (savannas), GRA (grasslands), WET (wetlands), CRO (croplands), and CNVM (cropland/natural vegetation mosaics) (Figure 1a).
Due to their limited coverage (0.01% for closed shrublands, 0.03% for open shrublands, and 0.04% for permanent wetland), these vegetation types were excluded from the analysis to avoid potential data distortion. As depicted in Figure 1a, grasslands dominate the Inner Mongolian Plateau, the Loess Plateau, and the Tibetan Plateau. Forestlands are mainly prevalent in southern China and northeastern China, while croplands are concentrated in the North China Plain, the Northeast Plain, the Loess Plateau, and the Sichuan Basin. Woody savannas and savannas are mainly distributed in southern China. The Koppen–Geiger climatic zones over China were shown in Figure 1c. The AI patterns shown in Figure 1b and spatial distribution of annual mean NDVI and GPP in China during the growing season from 1982 to 2018 were illustrated in Figure 1d,e.
2.4. Analysis Method
Previous studies using model simulations and satellite observations have demonstrated that NDVI and GPP have a linear correlation at the canopy scale [46]. In this study, linear regression analyses between GPP and NDVI were used to quantify the strength of the coupling of these two variables during the annual growing season. Specifically, we used the average annual GPP and NDVI for each pixel during the growing season over 37 years (1982–2018) for fitting. The square of the correlation coefficient (R2) of the linear regression was used to quantify the coupling between GPP and NDVI [47]. Subsequently, the slopes of linear relationships between NDVI and GPP were defined as NDVI-GPP sensitivity for different aridity gradients and PFTs [48,49]. Additionally, in order to investigate the inter-annual NDVI-GPP correlation across ecosystems and aridity gradients, CV (coefficient of variance: the ratio of standard deviation to mean) values were used to quantify the inter-annual variability (IAV) of NDVI and GPP. This index can be used to assess the asynchronous changes in vegetation productivity and greenness. The schematic illustration is shown in Figure 2.
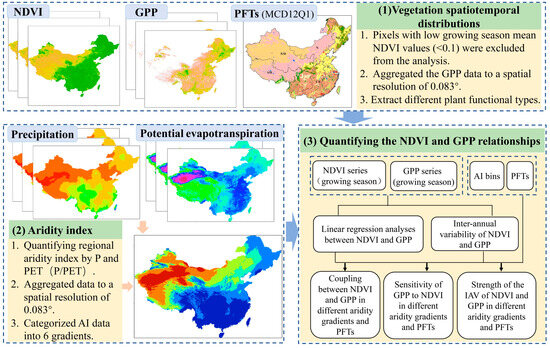
Figure 2.
Schematic representation of the analysis of NDVI and GPP relationships along the aridity gradients during the growing season in China from 1982 to 2018.
3. Results
3.1. Spatial Correlation Distributions of NDVI and GPP
Using the GPP and NDVI products, we analyzed the distribution of the coupling between NDVI and GPP across the aridity gradients. Our findings demonstrated a distinct contrast in NDVI and GPP values between the northern and southern regions of China. Spatially, there were significant variations across China, with R2 values from 0 to 0.86, and only 4.73% of the area having an R2 value larger than 0.50. These higher values were mainly distributed in parts of northern China, while lower R2 values were observed in southern China (Figure 3a). This difference is mainly induced by the varying land cover types. The southeast of China is a humid area with abundant precipitation and is mainly characterized by forests (ENF, EBF, DNF, DBF, and MF) and savannas [29]. In contrast, northern China is predominantly covered by grasslands. Overall, the relationship between NDVI-GPP decreased as AI increased (more humid). In the most regions of China, the mean R2 of the inter-annual growing season NDVI-GPP relationship was quite low (Figure 3a), indicating a weak dependency of GPP on NDVI.
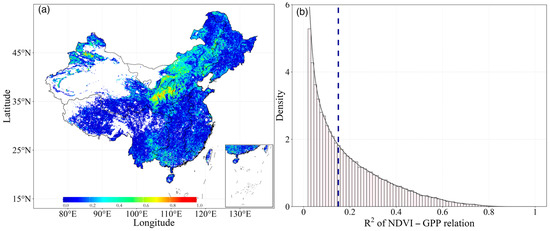
Figure 3.
Distribution of (a) inter-annual growing season Pearson correlation coefficients between GPP and NDVI during the period of 1982–2018, and (b) their density distribution of R2 calculated for all pixels in China ecosystems. The vertical dashed line represents the mean value.
Meanwhile, we analyzed the density of the R2 values of NDVI-GPP for all pixels. Obviously, the largest number of pixels had the lowest R2 values (ca. 0.02), and the overall average temporal R2 for all the ecosystems was 0.15 (Figure 3b). The frequency of R2 values declined exponentially as R2 increased. Moreover, 37.56% of the pixels had R2 values below average. In comparison, fewer pixels had higher R2 values. This phenomenon suggested that some external factors or disturbances may have weakened the relationship between the two variables.
NDVI-GPP coupling was quantified in different aridity gradients (Figure 4a) and PFTs (Figure 4b) for each month. The results showed a divergent trend in R2 values of NDVI-GPP relationships among different aridity gradients and PFTs. In different aridity gradients, the value of R2 was significantly higher in arid regions (AI < 0.65) (Figure 4a). The mean value in the arid region was 0.21. In contrast, the largest R2 value of 0.24 was found in semi-arid areas (0.20 < AI < 0.50). In hyper-arid and arid regions (AI < 0.20), the R2 values of NDVI-GPP were 0.19 and 0.21, respectively. As the AI continued to increase, a reverse trend was detected in humid (0.65 < AI < 1) and hyper-humid (AI > 1) regions, where the R2 values were 0.11. This phenomenon indicated that the dependency of NDVI and GPP increased with the aridity gradients (becoming wetter), suggesting a weak dependency of GPP on NDVI in more humid conditions.
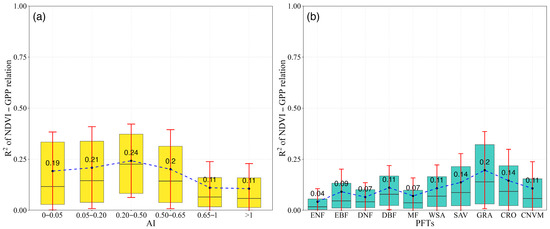
Figure 4.
The boxplot for NDVI (a) and GPP (b) values across the arid gradient and PFTs. The colored boxes show the range from the 25th to 75th percentiles, while the whiskers indicate the standard deviation. The black line represents the median (M) trends.
We also detected divergence among different PFTs. For the grasslands (GAR), the largest NDVI-GPP coupling value was observed, with an R2 of 0.20, while the lowest value of 0.04 was found in ENF (Figure 4b). In forest ecosystems (ENF, EBF, DNF, DBF, and MF), the mean R2 values were 0.08, with the largest value occurring in DBF at 0.11. The values in WSA, SAV, CRO, and CNVM were lower than those in GRA, with R2 values of 0.11, 0.14, 0.14, and 0.11, respectively. By comparing the R2 values among different PFTs, we found that in dry ecosystems, such as grasslands, the strength of the coupling is greater than in relatively wet ecosystems, such as forests.
3.2. Inter-Annual Variability of NDVI and GPP
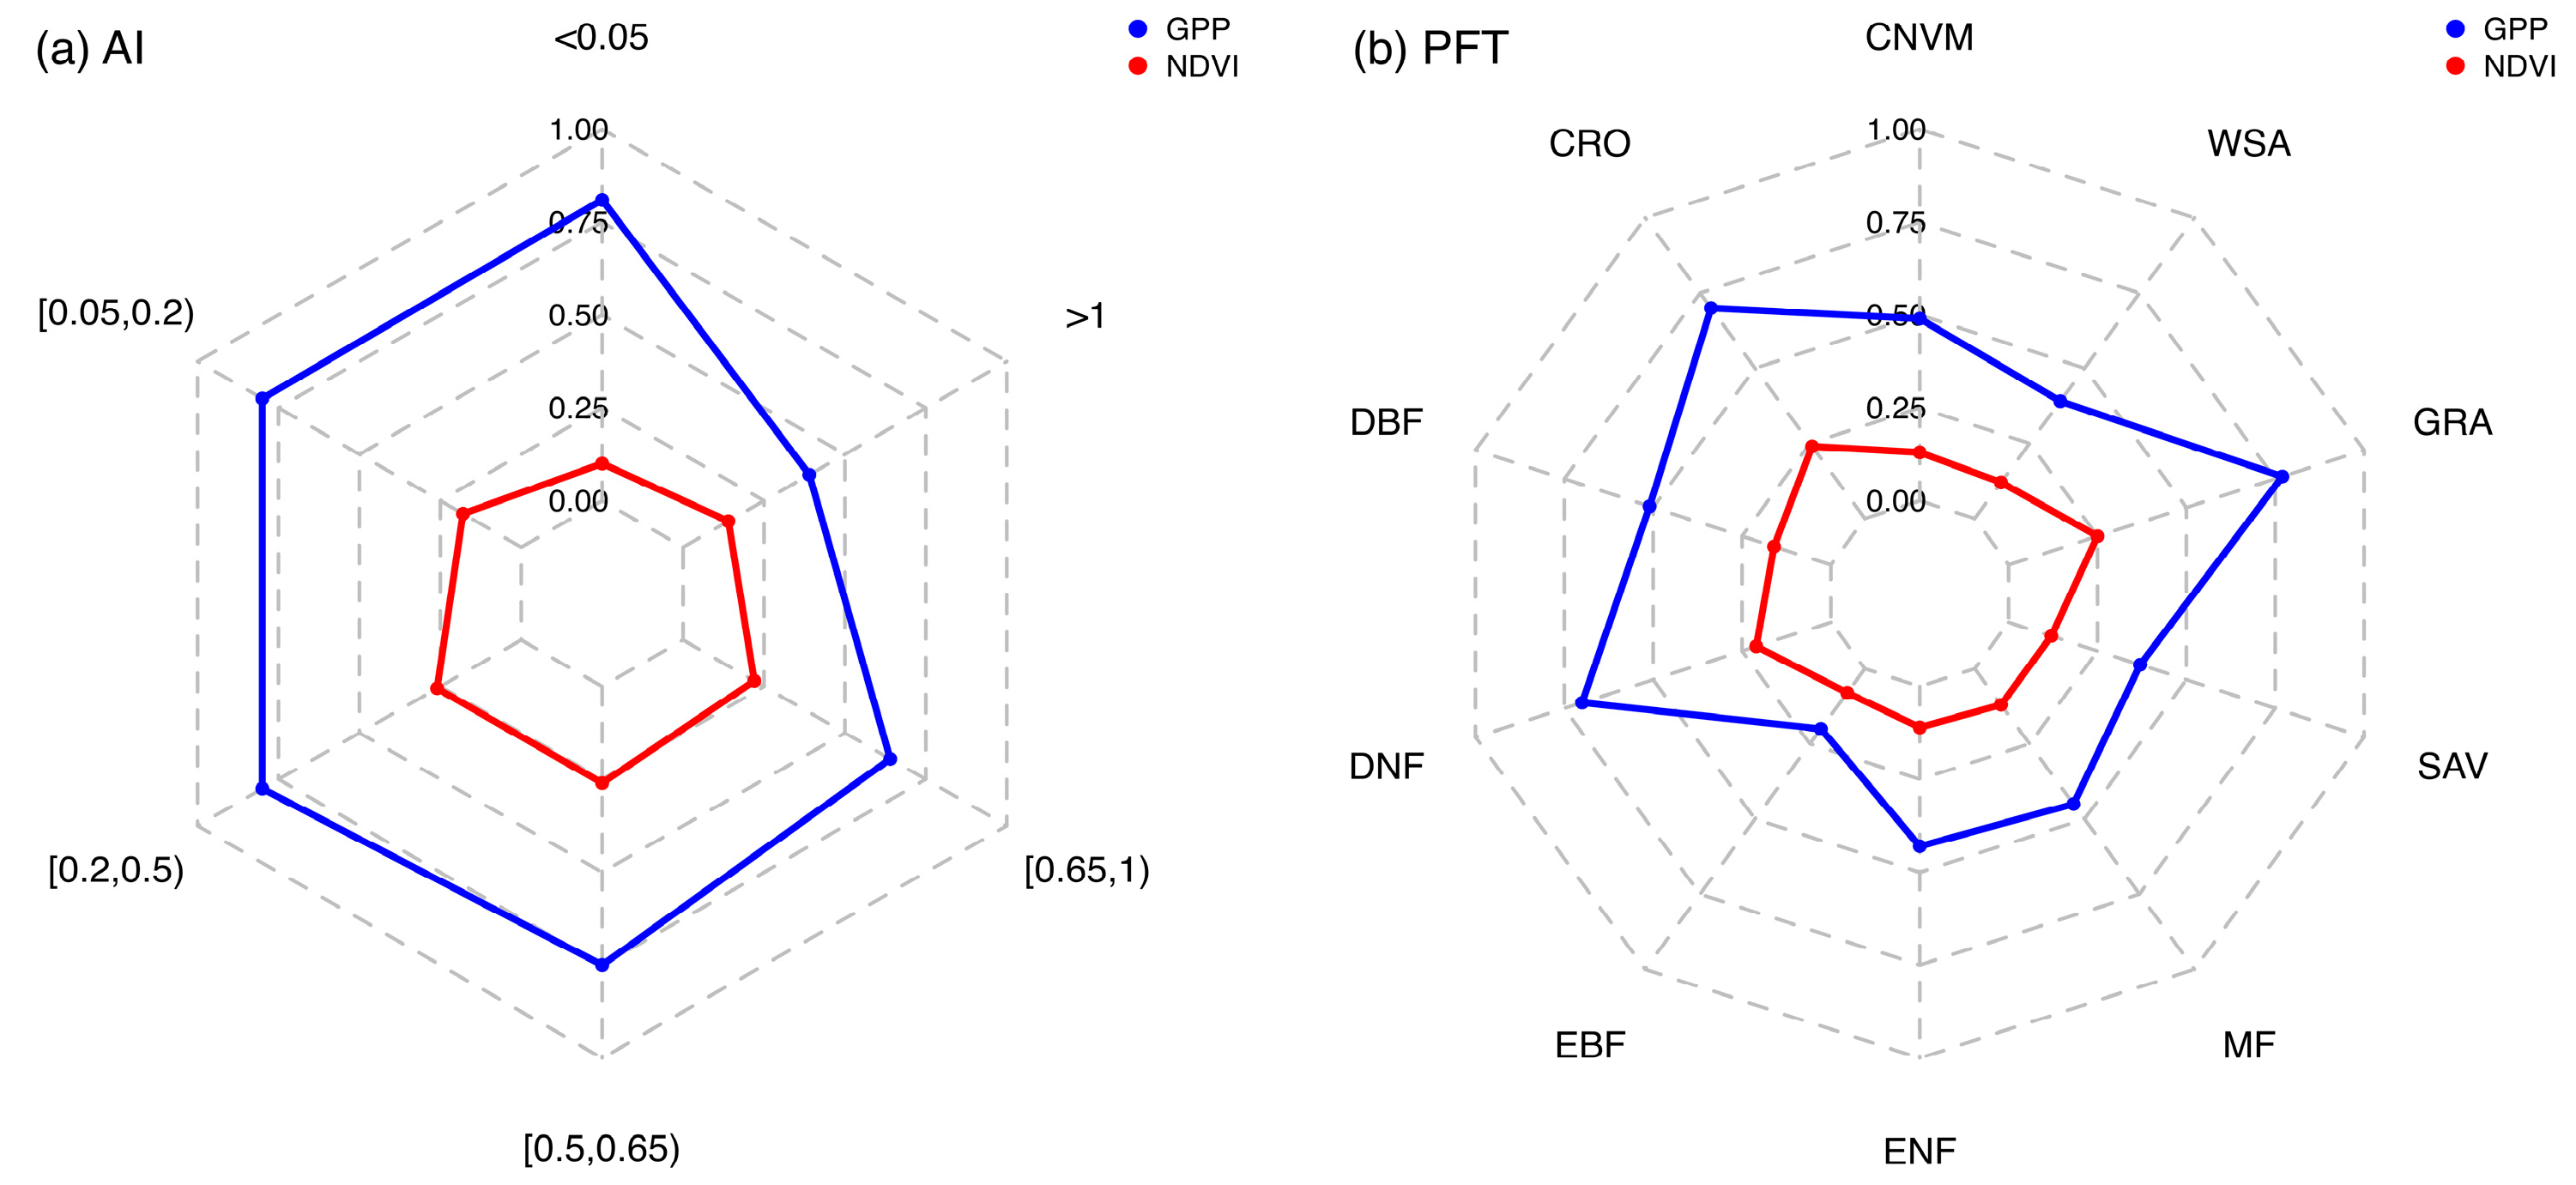
The calculated CV values illustrated the IAV of GPP and NDVI among the aridity gradients (Figure 5a) and the ecosystem types (Figure 5b). As shown in Figure 5a, the IAV of GPP steadily decreased with decreasing climate aridity. The IAV values for GPP were 0.81, 0.80, 0.80, 0.75, 0.64, and 0.39 in hyper-arid, arid, semi-arid, dry sub-humid, humid, and hyper-humid gradients, respectively. The IAVs of NDVI were 0.10, 0.18, 0.26, 0.26, 0.22, and 0.14 across the same respective gradients. In contrast, the IAV of GPP showed a steady decline, while the IAV of NDVI exhibited fluctuating trends, showing an increasing trend followed by a subsequent decrease. The IAV of GPP in both arid and semi-arid regions remained constant at 0.80, while NDVI increased from 0.18 to 0.26. Conversely, in semi-arid and dry sub-humid regions, the IAV of NDVI was consistent at 0.26, while GPP decreased from 0.80 to 0.75. These phenomena suggested that NDVI exhibited greater variability compared to GPP, particularly in arid and semi-arid regions. Conversely, GPP showed more variability than NDVI in semi-arid and dry sub-humid regions. Combined with Figure 4a and Figure 5a, the R2 of GPP-NDVI and IAV of NDVI displayed a similar trend, peaking at AI values between 0.2 and 0.5 (semi-arid areas) before decreasing. This result indicated that changes in NDVI govern the coupling between NDVI and GPP.
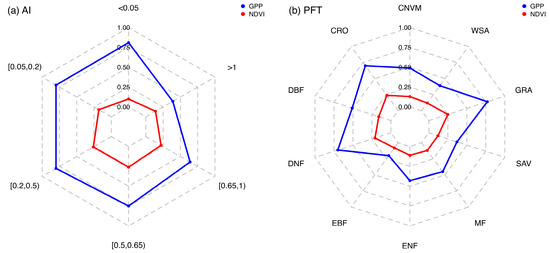
Figure 5.
Comparison of the strength of the inter-annual variability (coefficient of variance: the ratio of standard deviation to mean) of NDVI and GPP for AI gradients (a) and different PFTs (b).
Figure 5b illustrated the similar trend in the IAV of both GPP and NDVI among different PFTs. The IAV of GPP was lowest in EBF at 0.20 and largest in GRA at 0.77. Other values were as follows: ENF (0.43), DNF (0.70), DBF (0.51), MF (0.45), SAV (0.37), WSA (0.39), CRO (0.70), and CNVM (0.49). Similarly, the IAV of NDVI was lowest in EBF at 0.08 and highest in GRA at 0.25. The IAV values in other forest ecosystems were 0.11 in ENF, 0.12 in MF, 0.16 in DBF, and 0.21 in DNF. In CRO and CNWM, the values were 0.24 and 0.13, and in SAV and WSA, the value was 0.12. In forest ecosystems, the IAV for both GPP and NDVI exhibited synchronized changes, with the highest variability observed in DNF, followed by DBF, MF, ENF, and EBF. These differences likely reflect the varying adaptability and response characteristics of each forest type to environmental factors. Among these, EBF demonstrated a more stable response to environmental changes.
3.3. Distribution of the Sensitivity of NDVI-GPP
The sensitivity of GPP to NDVI, expressed as the slope of the liner regression between NDVI and GPP, exhibited an inconsistent pattern. As shown in Figure 6a, slope values ranged from −0.90 to 1.21, with approximately 71.37% of the area showing a positive slope. This indicated that NDVI has a positive effect on GPP. Particularly in the northwest region, higher slope values were exhibited, with an average value of 0.11. Conversely, in the southwest of China, the sensitivity of GPP to NDVI was lower, with the slope values below 0. These results are consistent with previous studies; that is, there is a strong linear relationship between NDVI and GPP, but there were spatial variations in the distribution of R2 among different regions. The R2 between NDVI-GPP was higher in northern China, while the sensitivity of NDVI to GPP was lower in northwest China. This suggested that the relationships between NDVI and GPP, in terms of R2 and sensitivity, are spatially asynchronous.
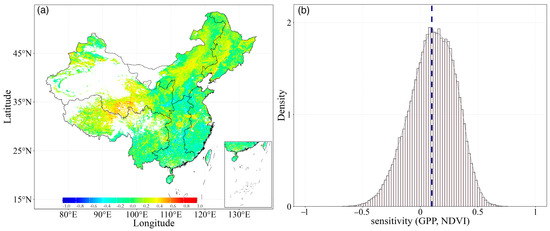
Figure 6.
Spatial distribution of the (a) sensitivity between GPP and NDVI in the growing season during the period of 1982–2018 and (b) their density distribution.
Meanwhile, we analyzed the density of the slope values of the NDVI-GPP relationship for all pixels (Figure 6b). The analysis revealed that the frequency distribution of the slope values closely resembles a Gaussian distribution. Most of the slope values were clustered around a central value, forming a bell-shaped curve typical of Gaussian distributions. The mean value of the slope distribution was calculated to be 0.11, suggesting that, on average, there is a moderately positive correlation between NDVI and GPP across China. This indicates that as vegetation greenness (NDVI) increases, there is a corresponding increase in productivity (GPP), reflecting a general trend where more vigorous vegetation supports higher levels of primary productivity across diverse ecosystems.
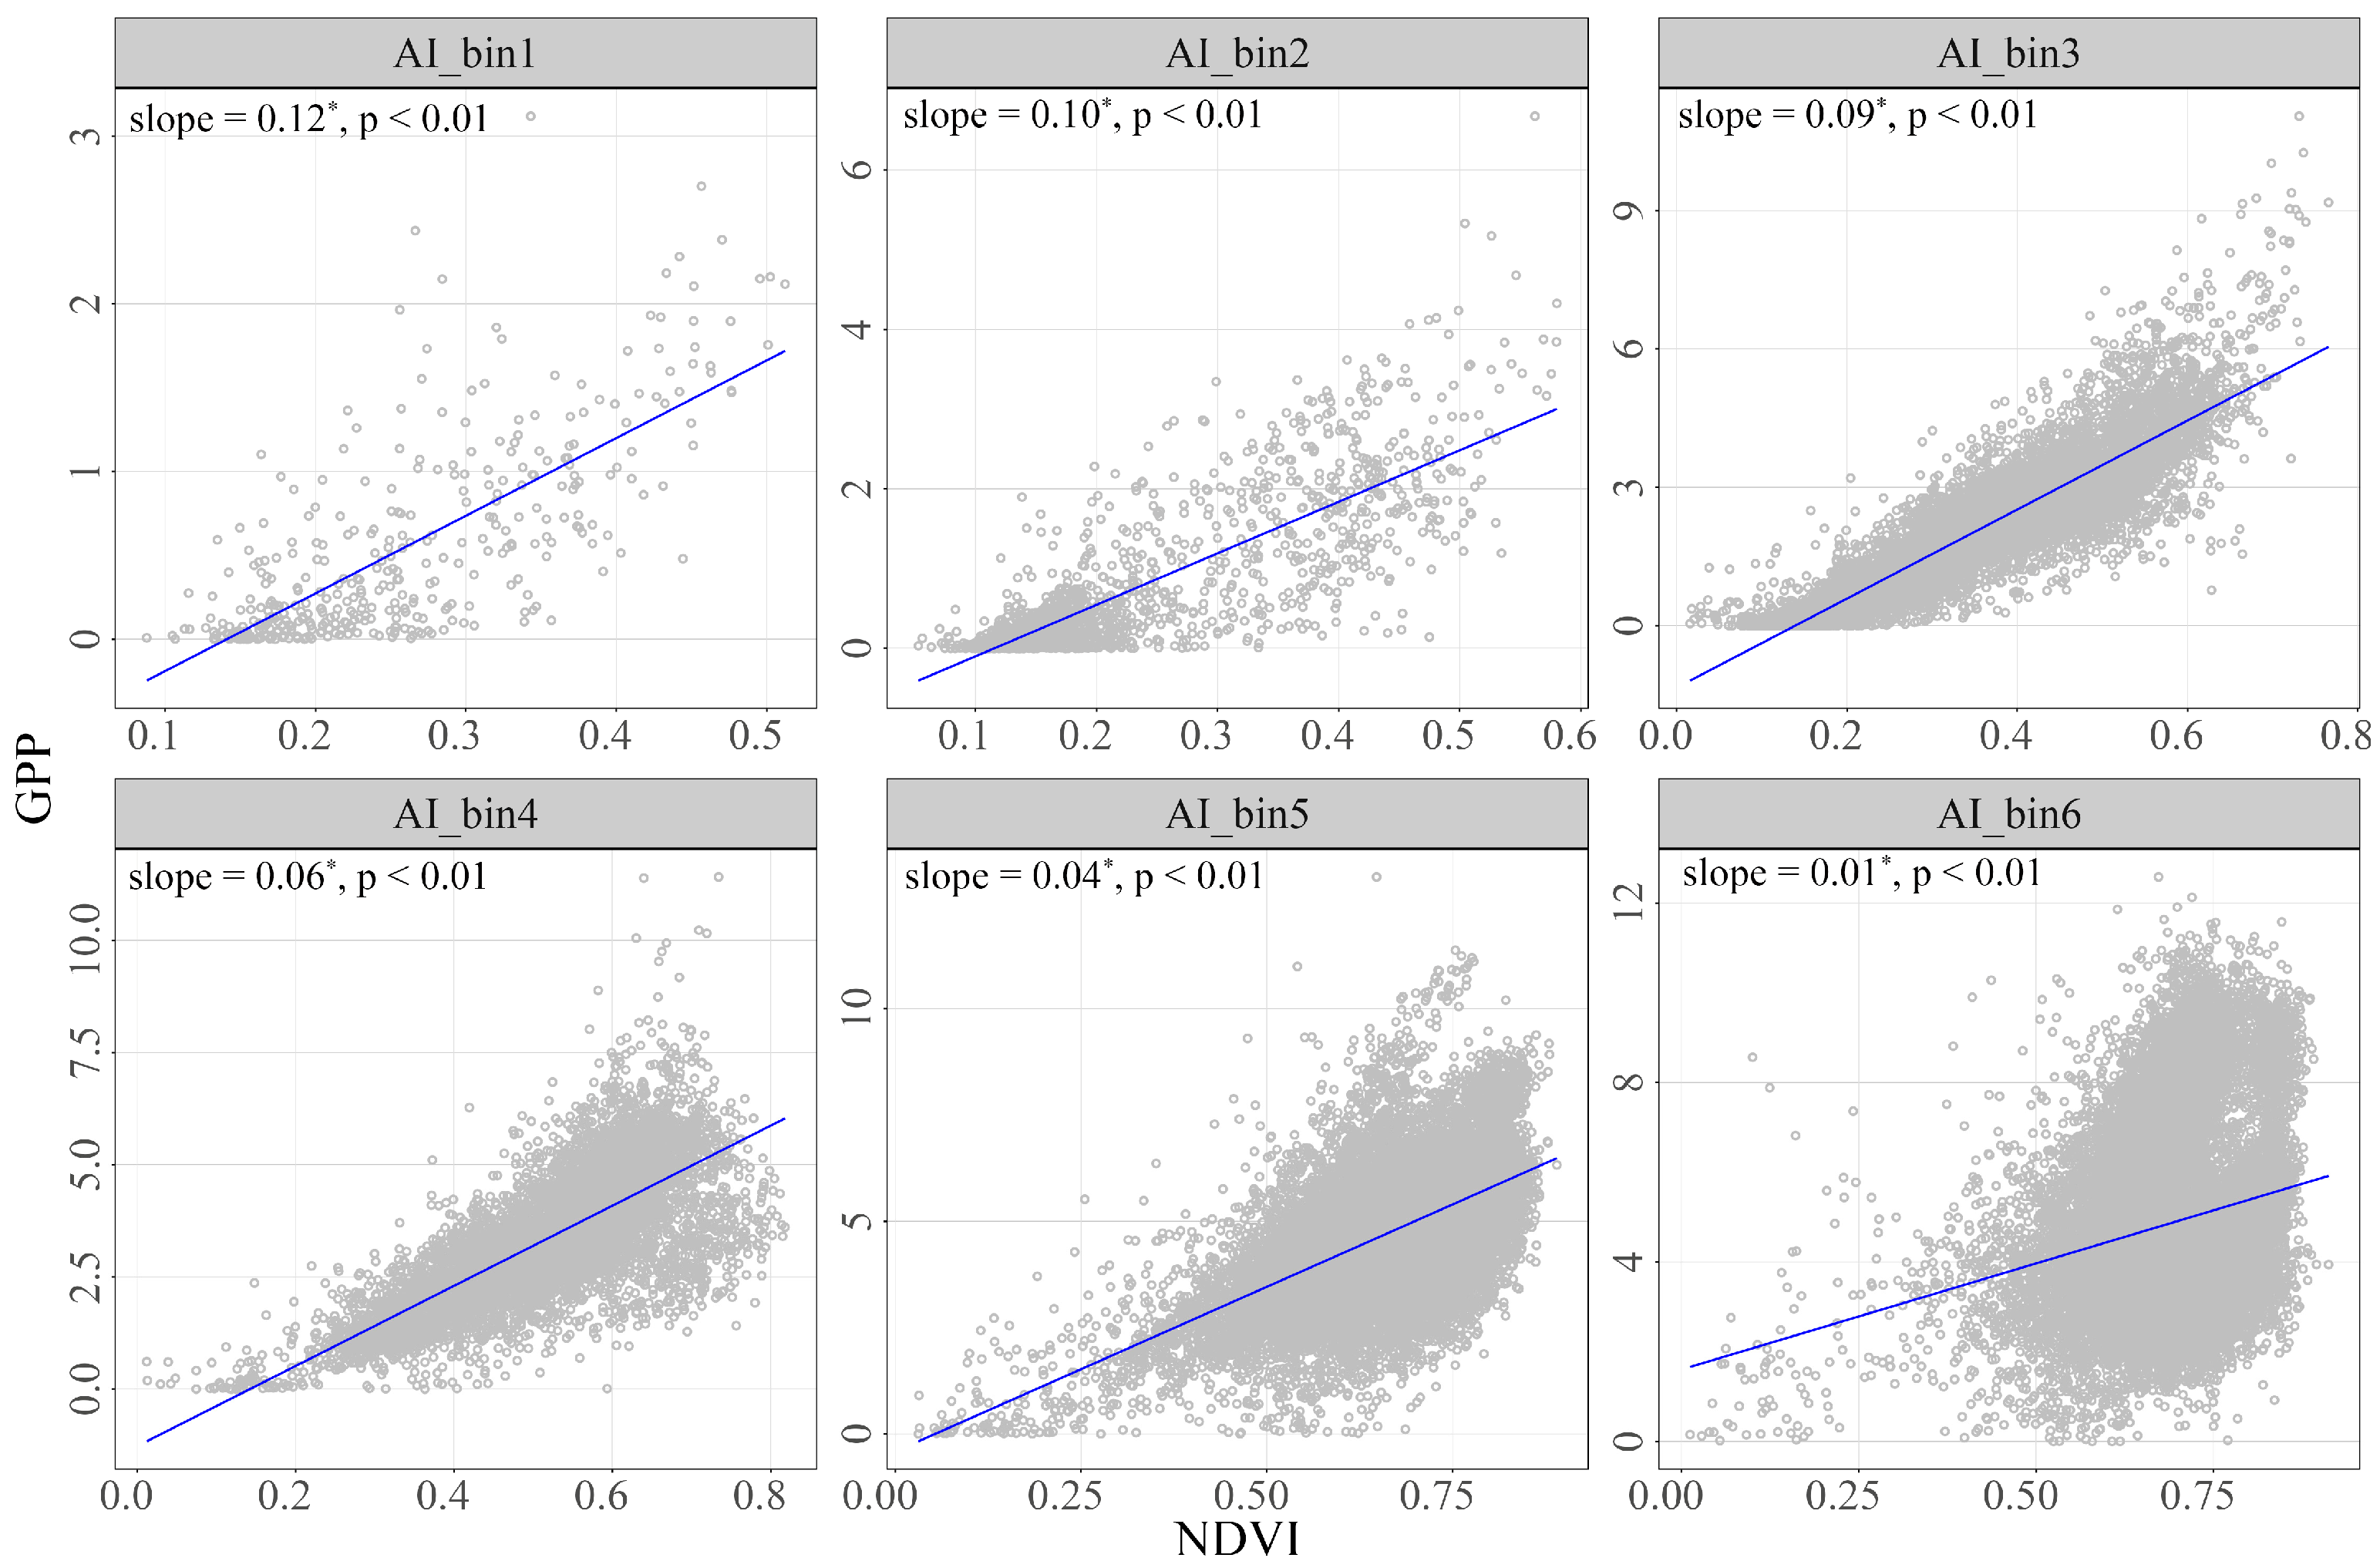
To explore the sensitivity of GPP to NDVI among aridity gradients, we calculated the mean values for each pixel over the period from 1982 to 2018 and then fitted the slope of NDVI and GPP (Figure 7). The analysis revealed that GPP was more sensitive to NDVI in hyper-arid areas, with a slope of 0.12. As the AI gradient increased (indicating more humid conditions), the slope showed a decreasing trend: 0.10 in arid regions, 0.09 in semi-arid regions, 0.06 in sub-humid regions, 0.04 in humid regions, and 0.01 in hyper-humid regions. This pattern highlighted the critical impact of moisture availability on the sensitivity of vegetation productivity to changes in NDVI. The decreasing slope values along with the humidity gradient underline the varying degrees of responsiveness of different ecosystems to environmental changes.
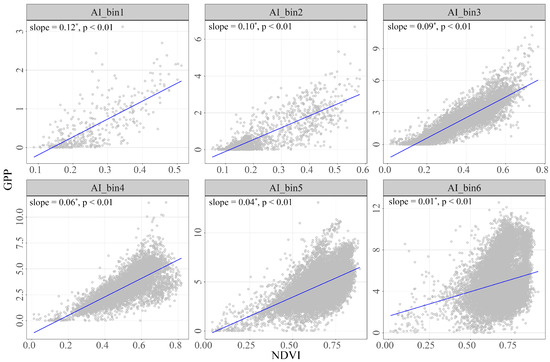
Figure 7.
The sensitivity of NDVI-GPP during the growing season period of 1982–2018 across all AI gradients. The asterisk (*) indicates a significant increase or decrease in slope.
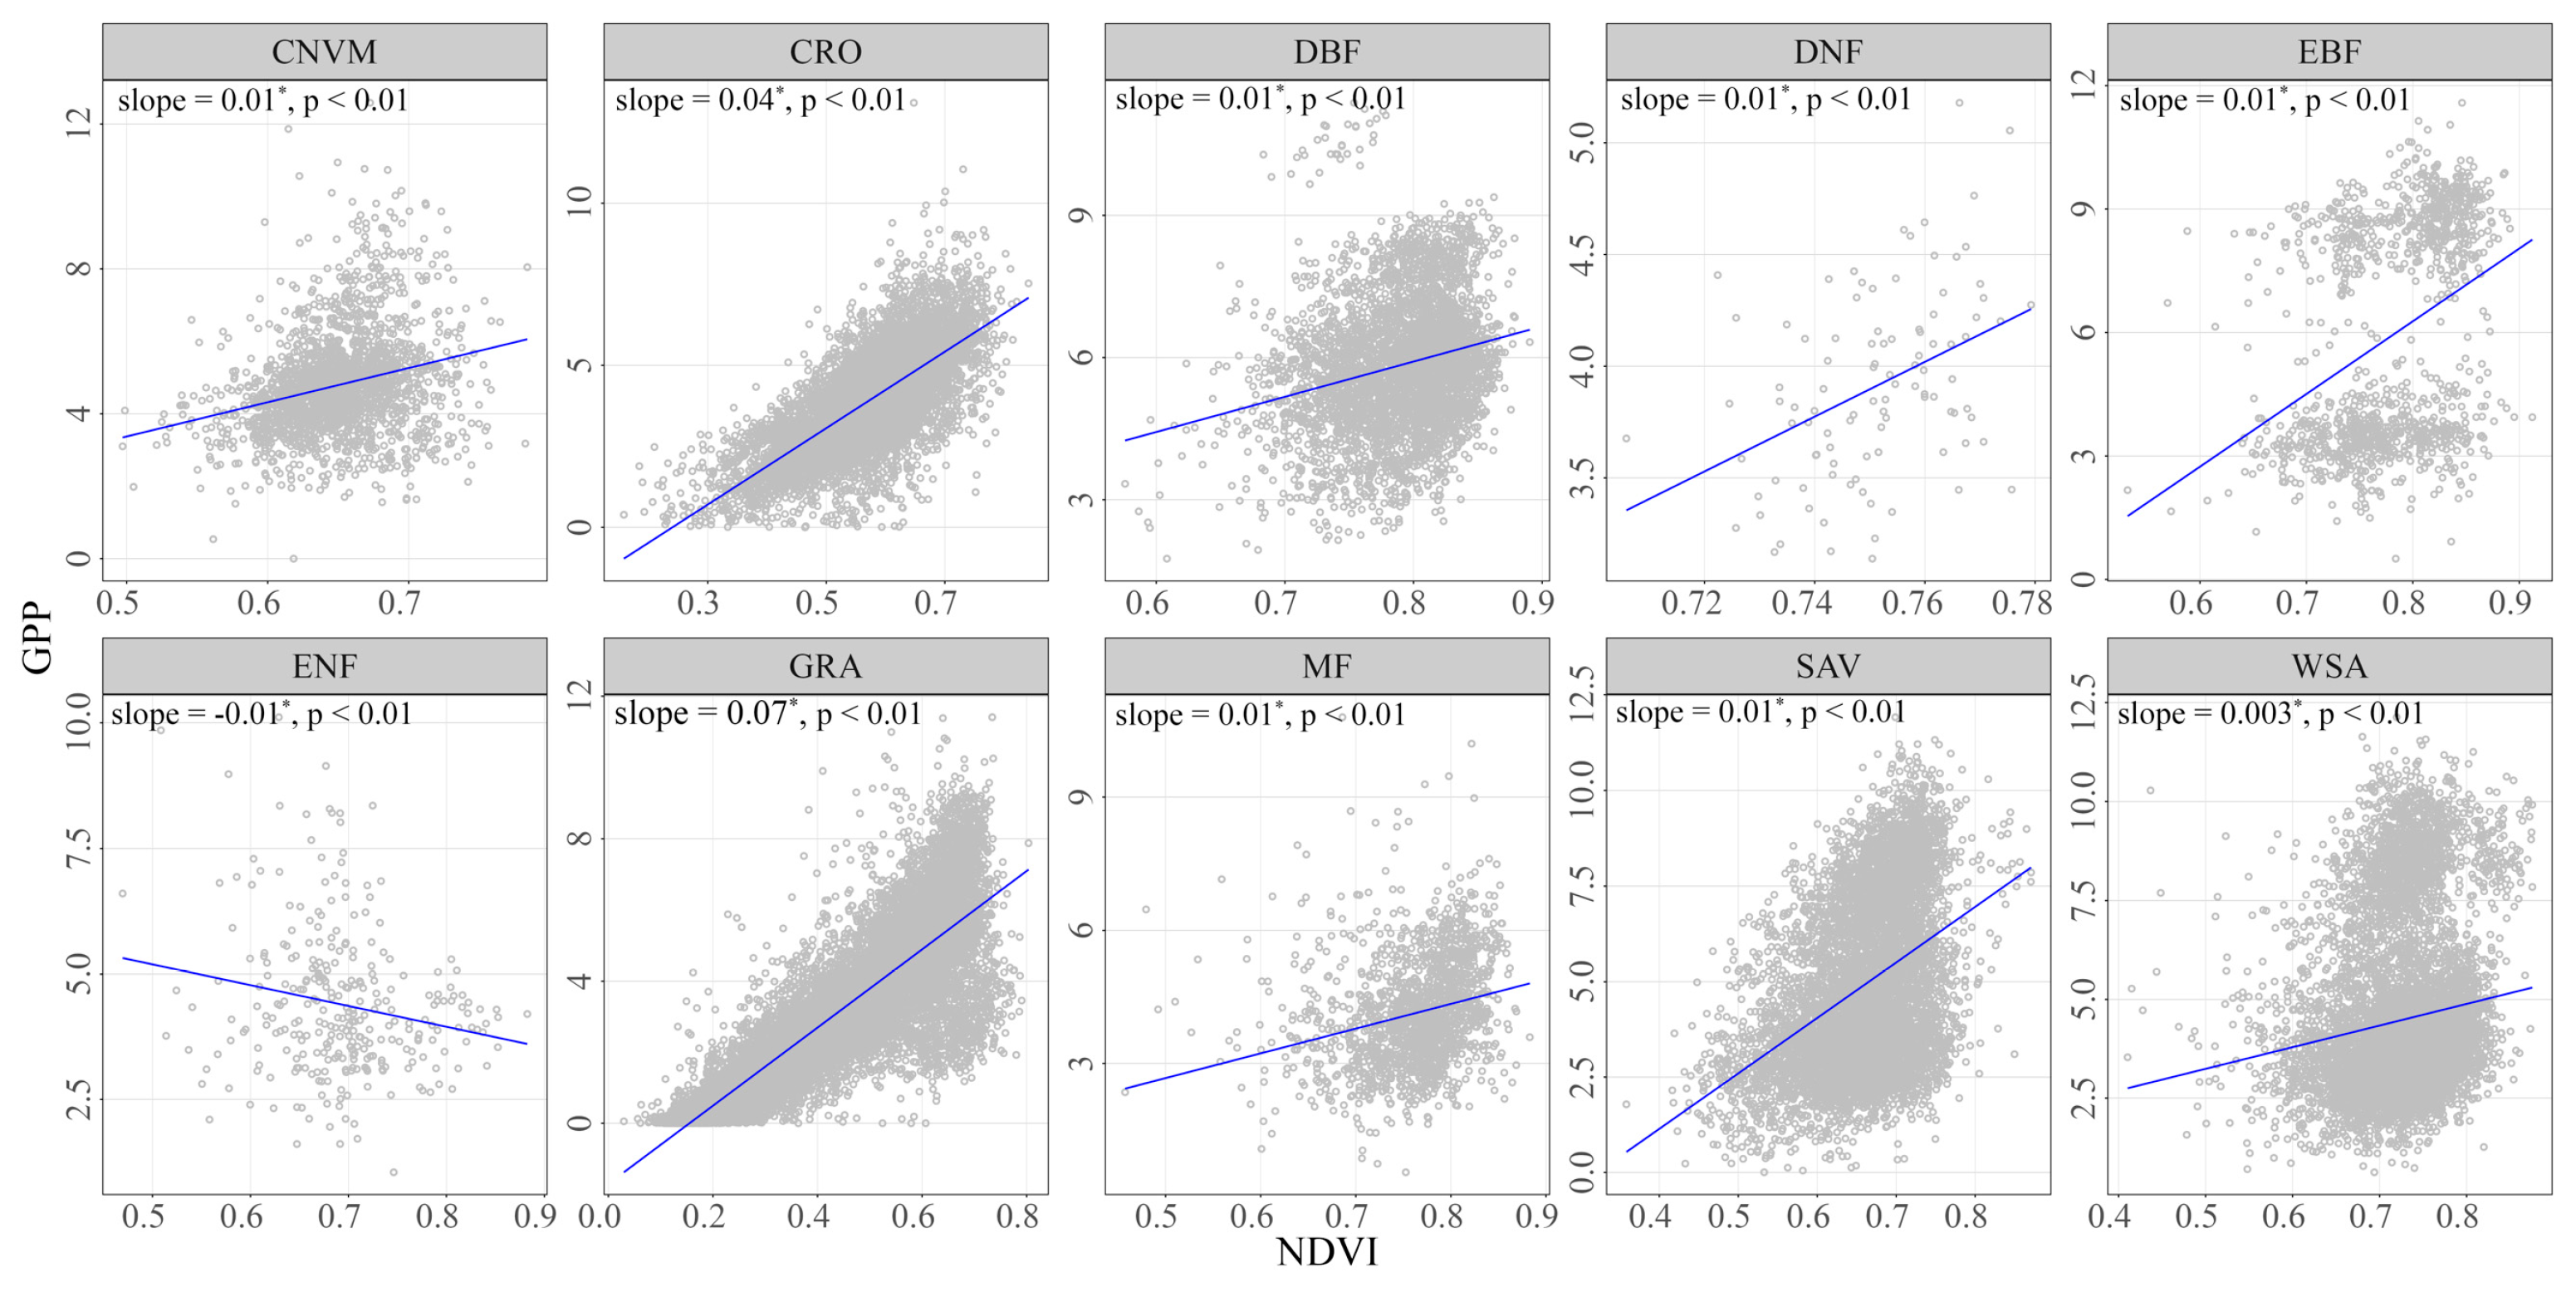
To address the driving factors behind the temporal variability of vegetation response to drying and wetting, we performed a sensitivity analysis to attribute the changes in PFTs (Figure 8). Positive slope values were found between NDVI-GPP in all ecosystems except for ENF. In ENF, the sensitivity value was −0.01, indicating that the increase in NDVI did not lead to an increase in GPP. The largest sensitivity values were observed in GRA, with a sensitivity value of 0.07, suggesting a strong positive response of GPP to NDVI in this ecosystem. In contrast, CRO showed lower sensitivity values of 0.04. These findings highlighted the varying degrees of vegetation response to drying and wetting conditions across different PFTs. The high sensitivity of GPP to NDVI in GRA emphasizes that changes in NDVI in grassland ecosystems can have a greater impact on GPP.
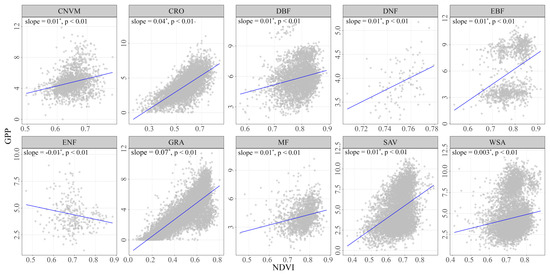
Figure 8.
The sensitivity of NDVI-GPP during the growing season from the period of 1982–2018 across all PFTs. The asterisk (*) indicates a significant increase or decrease in slope.
4. Discussion
This study was conducted to investigate how the relationships of coupling and sensitivity between NDVI and GPP vary along the aridity gradients and PFTs of China’s terrestrial ecosystems during the growing season from 1982 to 2018. Previous research has reported that canopy structure can explain the decoupling relationship between greenness and productivity in a short period of time [27,50]. Building upon these findings, our study observed a decadal-scale decoupling of greenness and productivity across China. This decoupling was also evident within PFTs (see Figure 4). Specifically, we found that the relationship of R2 values between NDVI and GPP decreases with increasing AI (becoming more humid), suggesting that wetter conditions weaken this relationship (Figure 4a). Concurrently, the sensitivity of GPP to NDVI also declined with increasing AI (Figure 7). In arid regions (AI ranging from 0 to 0.65), the strength of NDVI-GPP coupling is characterized by an R2 value of 0.21, with slopes ranging from 0.12 to 0.06. In contrast, in humid areas (AI greater than 0.65), the NDVI-GPP relationship showed an R2 of 0.11, with slopes ranging from 0.04 to 0.01 (Figure 4a and Figure 7). These findings suggest a significant decoupling and insensitivity between canopy greenness (NDVI) and productivity (GPP) in more humid areas. The result is consistent with Hu et al. (2022), who observed that aridity increased the strength of the coupling between LAI and GPP [26]. This implies that changes in greenness are a crucial strategy for ecosystems in arid environments to manage climate fluctuations.
It is worth noting that different types of trees (ENF, EBF, DNF, DBF, and MF) and grasses exhibit significant variability in the NDVI-GPP relationships. Overall, inter-annual GPP and NDVI were highly coupled (i.e., high R2) in grasslands, with a value of 0.20. However, weaker NDVI-GPP relationships (greenness–productivity decoupling) were found in forest ecosystems (i.e., ENF (0.04), EBF (0.09), DNF (0.07), DBF (0.11), and MF (0.07)), especially ENF (see Figure 4b). Previous studies have reported that environmental factors (water availability, heat stress, and temperature), as well as canopy structure and vegetation types, influence the NDVI-GPP relationships [51,52,53,54]. In grasslands, a previous study illustrated that the correlation between greenness and multi-year average GPP during the length of greening was the strongest (R2 is 0.49) [55], indicating high NDVI-GPP coupling in grassland [56]. For forest ecosystems, particularly in tropical forests, previous studies have also identified a decoupling between vegetation structure and productivity [26,56]. This phenomenon may be attributed to vegetation greenness changes slower than plant productivity over the season in forests, which limits the effectiveness of VIs in tracking photosynthetic activity. Additionally, as trees grow, the slight increase in greenness may cause the discrepancy between inter-annual variations in greenness and GPP (Figure 5b). Furthermore, forest ecosystems often have varying light conditions within the canopy, affecting photosynthetic rates differently in the upper and lower canopy layers. The greenness–productivity decoupling of forest ecosystems is likely driven by global and local factors, such as elevated CO2 and changes in fire regime. Although decoupling relationships between greenness and productivity were evident in forests, the study by Hu et al. (2022) demonstrated that this relationship was weaker in EBF rather than ENF [26]. This finding implies that relying solely on green products to assess changes in ecosystem carbon uptake in response to climatic variables can lead to uncertain evaluations, particularly in more hydric ecosystems. Compared with traditional enhanced vegetation index (EVI) and NDVI, solar-induced fluorescence (SIF) is more sensitive to drought-induced variations in canopy photosynthesis [57,58]. Therefore, integrating multiple remote sensing data to capture vegetation structural and physiological changes is essential for a more accurate diagnosis of the impact of aridity gradients, especially in forest ecosystems.
Mirroring the variability in PFTs, the relationships also differ significantly in their spatial patterns of vegetation distribution (Figure 1 and Figure 4b). Low R2 values were predominantly found in the southeastern and eastern humid regions of China (Figure 3a), areas primarily occupied by forests and crops (Figure 1a). A potential mechanism underlying the spatial variation in the NDVI-GPP relationship is that the tradeoff between ecosystem greenness (NDVI) and physiology (photosynthesis per unit leaf area) intensifies in more humid climates. In general, the eastern regions are classified as humid zones, characterized by well-watered areas with predominant forest and savanna land use. This environment allows plants to perform efficient photosynthesis, resulting in higher GPP values. Research has shown that in southeastern China, soil moisture has a significant negative correlation with NDVI but an insignificant positive correlation with GPP [18]. In southeastern China, there is an asynchronous trend where NDVI increases while GPP does not, indicating enhanced vegetation greenness but slightly reduced productivity [59]. This may be attributed to ecological engineering efforts, which can quickly enhance vegetation greenness, whereas improvements in ecological functions such as productivity may take significantly longer. Additionally, increased CO2 tends to benefit photosynthesis more than respiration, leading to a modest rise in carbon uptake [60]. As a result, this contributes to the observed asynchronous changes in vegetation greenness and productivity. Conversely, the western regions, characterized by relatively arid conditions, receive less precipitation and tend to have low soil moisture levels. The dominant PFTs are GRA (Figure 1a), which have shallow root systems that cannot access water from deeper soil layers. Additionally, changes in leaf and internal physiology activations are more consistent in these plants [61,62]. Consequently, there is a distinct difference in the response of vegetation greenness and productivity to long-term climate change between the eastern and western regions.
Additionally, by examining the changes in the IAV of vegetation greenness and GPP over the past three decades, quantified as the CV (see Methods), we found that the interannual variation of GPP and NDVI was not synchronized (Figure 5a). The IAV of GPP was largest in hyper-arid areas (0.81) and showed a stable decrease with increasing aridity gradients. In contrast, the IAV of NDVI initially increased and then decreased, with the largest value (0.26) occurring in semi-arid and dry sub-humid regions. A shift in IAV trends along the aridity gradients with an AI range of 0.20–0.65. Previous studies have attributed this asynchronous change to climate stress [63]. Water availability is a key factor regulating the IAV of regional and global carbon fluxes [33,64,65]. Reduced soil moisture due to precipitation deficit leads to decreased evapotranspiration as well as evaporative cooling, causing local temperature increases. This results in a high vapor pressure deficit (VPD) and evaporative demand, potentially further reducing soil moisture [66,67]. Low soil moisture and high VPD are anticipated to impact vegetation greenness and productivity differently [68], causing asynchronous changes in IAV of GPP and NDVI.
The findings of this study also revealed that the sensitivity of vegetation photosynthesis to greenness varied across drought gradients (Figure 7) and vegetation types (Figure 8). The regression fit to the mean multi-year NDVI and the mean multi-year GPP in each pixel revealed that the sensitivity of NDVI-GPP reached its highest (slope was 0.12) in hyper-arid regions where the aridity index was below 0.05. As the aridity gradient increased (becoming more humid), the sensitivity consistently decreased. This phenomenon indicated an insensitivity relationship between productivity and greenness in more humid regions. A comparison of R2 values clearly showed a fluctuation trend in the strength of coupling, with values of 0.19, 0.21, 0.24, 0.20, 0.11, and 0.11. This observation suggested that the sensitivity and the strength of coupling between NDVI and GPP did not change synergistically with aridity gradients. The discrepancy may be due to differences in soil water availability. NDVI reflects vegetation greenness through surface reflectance; it does not immediately respond to water stress. In contrast, GPP, which directly results from vegetation photosynthesis, can better reveal the physiological changes in vegetation due to water stress [69,70]. Moreover, soil water has a significantly positive influence on 25.44% of GPP [35]. Thus, semi-arid ecosystems were the primary contributors to interannual variations in carbon sinks within terrestrial ecosystems and exhibited high sensitivity to drought trends [71,72,73].
Although the positive trends in GPP and NDVI across China exist (Figure 6b), negative trends are still exhibited during the growing season. Specifically, in the southeastern ENF, the NDVI-GPP slope was negative. This may be due to the dense canopy of the ENF, which causes the NDVI to reach saturation levels. This saturated state makes it difficult to detect further increases in GPP, thus leading to a weaker or negative slope. Additionally, forested areas can experience water stress or excess water, influencing the NDVI-GPP relationship. Excess water can reduce GPP despite high NDVI values due to reduced oxygen availability for roots [74]. Plants can regulate their respiration and adjust their metabolism to optimize carbon assimilation. However, when hypoxia occurs due to excess soil moisture, they experience metabolic stress that limits photosynthetic efficiency. This stress impairs their ability to absorb essential nutrients, such as nitrogen and phosphorus, which are crucial for photosynthesis and growth [75]. Under hypoxic conditions, plants may appear green based on NDVI, but their GPP could be low due to restricted CO2 uptake, inefficient nutrient absorption, and reduced energy for growth [76]. Reduced CO2 intake directly decreases the rate of photosynthesis, thus lowering GPP. While NDVI captures the greenness of vegetation, which may remain high even when GPP is constrained by environmental stressors like hypoxia. Therefore, relying solely on NDVI to estimate the relationship between productivity and greenness in humid areas introduces uncertainty. To more accurately reflect actual photosynthetic performance, it is essential to consider other metrics, such as solar-induced fluorescence [77]. In this study, we primarily focused on the remote sensing datasets, and thus the results on sensitivity were not fully presented. Further research endeavors will be integrating data from land surface models, which will be crucial to better linking remote sensing-based analysis to the complex interplay between ecosystem variables.
5. Conclusions
In this study, we investigated the relationships between NDVI and GPP across different aridity gradients and various PFTs in China. By analyzing NDVI and GPP products, we found that the eastern regions of China had lower R2 between NDVI and GPP compared to the western regions. In most regions of China, the mean R2 of the inter-annual growing season NDVI-GPP relationship was quite low, indicating a weak dependency of GPP on NDVI. Overall, the relationship between NDVI-GPP decreased as AI increased in more humid regions. Among all PFTs, grasslands demonstrated the strongest relationship, with an R2 of 0.20. Additionally, we observed that the insensitivity of the NDVI-GPP relationship increased as the AI gradient increased. As AI increased from 0 to 1, the slopes decreased from 0.12 to 0.01. Moreover, the IAV of GPP showed a steady decline, while the IAV of NDVI exhibited fluctuating changes, particularly in semi-arid, dry sub-humid, humid gradients, suggesting that the NDVI was more variable than GPP. Our findings can help improve our understanding of the relationships between VIs and productivity, enhancing their application in monitoring ecosystem responses to varying environmental conditions.
Author Contributions
All authors contributed to the present paper’s preparation. Methodology, Y.L. and X.Y.; validation, X.Y.; data curation, L.Z., W.Z. and Y.Z.; writing—original draft preparation, Y.L.; writing—review and editing, X.Y. All authors have read and agreed to the published version of the manuscript.
Funding
This research is supported by the Open Foundation of the State Key Laboratory of Desert and Oasis Ecology, Xinjiang Institute of Ecology and Geography, Chinese Academy of Sciences (G2023-02-04); the National Natural Science Foundation of China (42205127); the Talent Training Project of the Chinese Academy of Sciences (Grant No. E1500103 and No. E3150101); and the National Youth Talent Project (Grant No. 2023000308).
Data Availability Statement
NDVI data can be sourced from https://cmr.earthdata.nasa.gov/search/concepts/C2759076389-ORNL_CLOUD.html (accessed on 18 May 2023). The monthly global NIRv_GPP product can be accessed at https://data.tpdc.ac.cn/zh-hans/data/d6dff40f-5dbd-4f2d-ac96-55827ab93cc5 (accessed on 20 May 2023). Monthly precipitation data can be accessed at https://www.geodata.cn/data/datadetails.html?dataguid=1928918 52410344&docId=2218 (accessed on 1 August 2023). Monthly evapotranspiration data can be accessed at https://www.geodata.cn/data/datadetails.html?dataguid=34595274939620&docId=1751 (accessed on 1 August 2023).
Conflicts of Interest
The authors declare no conflicts of interest.
References
- He, B.; Wang, S.; Guo, L.; Wu, X. Aridity change and its correlation with greening over drylands. Agric. For. Meteorol. 2019, 278, 107663. [Google Scholar] [CrossRef]
- Sheffield, J.; Wood, E.F.; Roderick, M.L. Little change in global drought over the past 60 years. Nature 2012, 491, 435–438. [Google Scholar] [CrossRef] [PubMed]
- Wang, S.; Zhang, Y.; Ju, W.; Chen, J.; Ciais, P.; Cescatti, A.; Sardans, J.; Janssens, I.; Wu, M.; Berry, J.; et al. Recent global decline of CO2 fertilization effects on vegetation photosynthesis. Science 2020, 370, 1295–1300. [Google Scholar] [CrossRef] [PubMed]
- Williams, A.P.; Allen, C.D.; Macalady, A.K.; Griffin, D.; Woodhouse, C.A.; Meko, D.M.; Swetnam, T.W.; Rauscher, S.A.; Seager, R.; Grissino-Mayer, H.D.; et al. Temperature as a potent driver of regional forest drought stress and tree mortality. Nat. Clim. Chang. 2013, 3, 292–297. [Google Scholar] [CrossRef]
- Zampieri, M.; Ceglar, A.; Dentener, F.; Toreti, A. Wheat yield loss attributable to heat waves, drought and water excess at the global, national and subnational scales. Environ. Res. Lett. 2017, 12, 064008. [Google Scholar] [CrossRef]
- Dubey, N.; Ghosh, S. The relative role of soil moisture and vapor pressure deficit in affecting the Indian vegetation productivity. Environ. Res. Lett. 2023, 18, 064012. [Google Scholar] [CrossRef]
- Liu, Y.; Zhou, Y.; Ju, W.; Wang, S.; Wu, X.; He, M.; Zhu, G. Impacts of droughts on carbon sequestration by China’s terrestrial ecosystems from 2000 to 2011. Biogeosciences 2014, 11, 2583–2599. [Google Scholar] [CrossRef]
- Piao, S.; Sitch, S.; Ciais, P.; Friedlingstein, P.; Peylin, P.; Wang, X.; Ahlström, A.; Anav, A.; Canadell, J.; Cong, N.; et al. Evaluation of terrestrial carbon cycle models for their response to climate variability and to CO2 trends. Glob. Chang. Biol. 2013, 19, 2117–2132. [Google Scholar] [CrossRef]
- Deng, Y.; Wang, X.; Lu, T.; Du, H.; Ciais, P.; Lin, X. Divergent seasonal responses of carbon fluxes to extreme droughts over China. Agric. For. Meteorol. 2023, 328, 109253. [Google Scholar] [CrossRef]
- Higgins, S.I.; Conradi, T.; Muhoko, E. Shifts in vegetation activity of terrestrial ecosystems attributable to climate trends. Nat. Geosci. 2023, 16, 147–153. [Google Scholar] [CrossRef]
- Wang, S.; Zhang, Y.; Ju, W.; Porcar-Castell, A.; Ye, S.; Zhang, Z.; Brümmer, C.; Urbaniak, M.; Mammarella, I.; Juszczak, R.; et al. Warmer spring alleviated the impacts of 2018 European summer heatwave and drought on vegetation photosynthesis. Agric. For. Meteorol. 2020, 295, 108195. [Google Scholar] [CrossRef]
- Anav, A.; Friedlingstein, P.; Beer, C.; Ciais, P.; Harper, A.; Jones, C.; Murray-Tortarolo, G.; Papale, D.; Parazoo, N. Spatiotemporal patterns of terrestrial gross primary production: A review. Rev. Geophys. 2015, 53, 785–818. [Google Scholar] [CrossRef]
- Beer, C.; Reichstein, M.; Tomelleri, E.; Ciais, P.; Jung, M.; Carvalhais, N.; Rödenbeck, C.; Arain, M.A.; Baldocchi, D.; Bonan, G.B.; et al. Terrestrial gross carbon dioxide uptake: Global distribution and covariation with climate. Science 2010, 329, 834–838. [Google Scholar] [CrossRef] [PubMed]
- Shen, M.; Tang, Y.; Desai, A.; Gough, C.; Chen, J. Can EVI-derived land-surface phenology be used as a surrogate for phenology of canopy photosynthesis? Int. J. Remote Sens. 2014, 35, 1162–1174. [Google Scholar] [CrossRef]
- West, H.; Quinn, N.; Horswell, M. Remote sensing for drought monitoring & impact assessment: Progress, past challenges and future opportunities. Remote Sens. Environ. 2019, 232, 111291. [Google Scholar]
- Hickler, T.; Eklundh, L.; Seaquist, J.; Smith, B.; Ardö, J.; Olsson, L.; Sykes, M.; Sjöström, M. Precipitation controls Sahel greening trend. Geophys. Res. Lett. 2005, 32. [Google Scholar] [CrossRef]
- Wang, Z.; Fu, B.; Wu, X.; Li, Y.; Feng, Y.; Wang, S.; Wei, F.; Zhang, L. Vegetation resilience does not increase consistently with greening in China’s Loess Plateau. Commun. Earth Environ. 2023, 4, 336. [Google Scholar] [CrossRef]
- Zheng, L.; Lu, J.; Chen, X. Drought offsets the vegetation greenness-induced gross primary productivity from 1982 to 2018 in China. J. Hydrol. 2024, 632, 130881. [Google Scholar] [CrossRef]
- Donohue, R.; Roderick, M.; McVicar, T.; Farquhar, G. Impact of CO2 fertilization on maximum foliage cover across the globe’s warm, arid environments. Geophys. Res. Lett. 2013, 40, 3031–3035. [Google Scholar] [CrossRef]
- Fensholt, R.; Langanke, T.; Rasmussen, K.; Reenberg, A.; Prince, S.; Tucker, C.; Scholes, R.; Le, Q.; Bondeau, A.; Eastman, R.; et al. Greenness in semi-arid areas across the globe 1981-2007- an Earth Observing Satellite based analysis of trends and drivers. Remote Sens. Environ. 2012, 121, 144–158. [Google Scholar] [CrossRef]
- Yang, Y.; Shi, Y.; Sun, W.; Chang, J.; Zhu, J.; Chen, L.; Wang, X.; Guo, Y.; Zhang, H.; Yu, L.; et al. Terrestrial carbon sinks in China and around the world and their contribution to carbon neutrality. Sci. China-Life Sci. 2022, 65, 861–895. [Google Scholar] [CrossRef] [PubMed]
- Smith, W.; Biederman, J.; Scott, R.; Moore, D.; He, M.; Kimball, J.; Yan, D.; Hudson, A.; Barnes, M.; MacBean, N.; et al. Chlorophyll fluorescence better captures seasonal and interannual gross primary productivity dynamics across dryland ecosystems of southwestern North America. Geophys. Res. Lett. 2018, 45, 748–757. [Google Scholar] [CrossRef]
- Zhang, Y.; Song, C.; Band, L.; Sun, G. No proportional increase of terrestrial gross carbon sequestration from the greening earth. J. Geophys. Res. Biogeosciences 2019, 124, 2540–2553. [Google Scholar] [CrossRef]
- Schwalm, C.; Anderegg, W.; Michalak, A.; Fisher, J.; Biondi, F.; Koch, G.; Litvak, M.; Ogle, K.; Shaw, J.; Wolf, A. Global patterns of drought recovery. Nature 2017, 548, 202–205. [Google Scholar] [CrossRef]
- Piao, S.; Wang, X.; Wang, K.; Li, X.; Bastos, A.; Canadell, J.; Ciais, P.; Friedlingstein, P.; Sitch, S. Interannual variation of terrestrial carbon cycle: Issues and perspectives. Glob. Chang. Biol. 2019, 26, 300–318. [Google Scholar] [CrossRef]
- Hu, Z.; Piao, S.; Knapp, A.; Wang, X.; Peng, S.; Yuan, W.; Running, S.; Mao, J.; Shi, X.; Ciais, P. Decoupling of greenness and gross primary productivity as aridity decreases. Remote Sens. Environ. 2022, 279, 113120. [Google Scholar] [CrossRef]
- Yang, J.; Tian, H.; Pan, S.; Chen, G.; Zhang, B.; Dangal, S. Amazon drought and forest response: Largely reduced forest photosynthesis but slightly increased canopy greenness during the extreme drought of 2015/2016. Glob. Chang. Biol. 2018, 24, 1919–1934. [Google Scholar] [CrossRef]
- Guanter, L.; Frankenberg, C.; Dudhia, A.; Lewis, P.; Gómez-Dans, J.; Kuze, A.; Suto, H.; Grainger, R.G. Retrieval and global assessment of terrestrial chlorophyll fluorescence from GOSAT space measurements. Remote Sens. Environ. 2012, 121, 236–251. [Google Scholar] [CrossRef]
- Xu, H.; Wang, X.; Zhao, C.; Yang, X. Assessing the response of vegetation photosynthesis to meteorological drought across northern China. Land Degrad. Dev. 2021, 32, 20–34. [Google Scholar] [CrossRef]
- Shi, H.; Li, L.; Eamus, D.; Huete, A.; Cleverly, J.; Tian, X.; Yu, Q.; Wang, S.; Montagnani, L.; Magliulo, V.; et al. Assessing the ability of MODIS EVI to estimate terrestrial ecosystem gross primary production of multiple land cover types. Ecol. Indic. 2017, 72, 153–164. [Google Scholar] [CrossRef]
- Walther, S.; Duveiller, G.; Jung, M.; Guanter, L.; Cescatti, A.; Camps-Valls, G. Satellite observations of the contrasting response of trees and grasses to variations in water availability. Geophys. Res. Lett. 2019, 46, 1429–1440. [Google Scholar] [CrossRef]
- Sarmah, S.; Singha, M.; Wang, J.; Dong, J.; Burman, P.; Goswami, S.; Ge, Y.; Ilyas, S.; Niu, S. Mismatches between vegetation greening and primary productivity trends in South Asia-A satellite evidence. Int. J. Appl. Earth Obs. Geoinf. 2021, 104, 102561. [Google Scholar] [CrossRef]
- Seddon, A.; Macias-Fauria, M.; Long, P.; Benz, D.; Willis, K. Sensitivity of global terrestrial ecosystems to climate variability. Nature 2016, 531, 229–232. [Google Scholar] [CrossRef] [PubMed]
- Jiao, W.; Chang, Q.; Wang, L. The sensitivity of satellite solar-induced chlorophyll fluorescence to meteorological drought. Earths Future 2019, 7, 558–573. [Google Scholar] [CrossRef]
- Liu, X.; He, B.; Guo, L.; Huang, L.; Yuan, W.; Chen, X.; Hao, X.; Xie, X.; Zhang, Y.; Zhong, Z.; et al. European carbon uptake has not benefited from vegetation greening. Geophys. Res. Lett. 2021, 48, e2021GL094870. [Google Scholar] [CrossRef]
- Zhang, Q.; She, D.; Zhang, L.; Wang, G.; Chen, J.; Hao, Z. High sensitivity of compound drought and heatwave events to global warming in the future. Earth’s Future 2022, 10, e2022EF002833. [Google Scholar] [CrossRef]
- You, N.; Meng, J.; Zhu, L. Sensitivity and resilience of ecosystems to climate variability in the semi-arid to hyper-arid areas of Northern China: A case study in the Heihe River Basin. Ecol. Res. 2018, 33, 161–174. [Google Scholar] [CrossRef]
- Zhou, S.; Williams, A.; Lintner, B.; Findell, K.; Keenan, T.; Zhang, Y.; Gentine, P. Diminishing seasonality of subtropical water availability in a warmer world dominated by soil moisture-atmosphere feedbacks. Nat. Commun. 2022, 13, 5756. [Google Scholar] [CrossRef]
- Gouveia, C.; Trigo, R.; Beguería, S.; Vicente-Serrano, S. Drought impacts on vegetation activity in the Mediterranean region: An assessment using remote sensing data and multi-scale drought indicators. Glob. Planet. Chang. 2017, 151, 15–27. [Google Scholar] [CrossRef]
- Wang, X.; Xu, T.; Xu, C.; Liu, H.; Chen, Z.; Li, Z.; Li, X.; Wu, X. Enhanced growth resistance but no decline in growth resilience under long-term extreme droughts. Glob. Chang. Biol. 2024, 30, e17038. [Google Scholar] [CrossRef]
- Gao, X.; Giorgi, F. Increased aridity in the Mediterranean region under greenhouse gas forcing estimated from high resolution simulations with a regional climate model. Glob. Planet. Chang. 2008, 62, 195–209. [Google Scholar] [CrossRef]
- Li, Y.; Chen, Y.; Li, Z. Dry/wet pattern changes in global dryland areas over the past six decades. Glob. Planet. Chang. 2019, 178, 184–192. [Google Scholar] [CrossRef]
- Hou, X.; Gao, S.; Li, X.; Wang, M.; Zhao, J.; Sui, X.; Liang, S. Responses of vegetation phenology to the asymmetric changes of temperature in daytime and night-time in the north of 20°N. Int. J. Climatol. 2022, 42, 8146–8161. [Google Scholar] [CrossRef]
- Li, X.; Piao, S.; Huntingford, C.; Peñuelas, J.; Yang, H.; Xu, H.; Chen, A.; Friedlingstein, P.; Keenan, T.; Sitch, S.; et al. Global variations in critical drought thresholds that impact vegetation. Natl. Sci. Rev. 2023, 10, nwad049. [Google Scholar] [CrossRef] [PubMed]
- Spinoni, J.; Vogt, J.; Naumann, G.; Carrao, H.; Barbosa, P. Towards identifying areas at climatological risk of desertification using the Köppen-Geiger classification and FAO aridity index. Int. J. Climatol. 2015, 35, 2210–2222. [Google Scholar] [CrossRef]
- Badgley, G.; Anderegg, L.; Berry, J.; Field, C. Terrestrial gross primary production: Using NIRV to scale from site to globe. Glob. Chang. Biol. 2019, 25, 3731–3740. [Google Scholar] [CrossRef]
- Hou, X.; Zhang, B.; Chen, J.; Zhou, J.; He, Q.; Yu, H. Response of vegetation productivity to greening and drought in the Loess Plateau based on VIs and SIF. Forests 2024, 15, 339. [Google Scholar] [CrossRef]
- Wei, D.; Tao, J.; Wang, Z.; Zhao, H.; Zhao, W.; Wang, X. Elevation-dependent pattern of net CO2 uptake across China. Nat. Commun. 2024, 15, 2489. [Google Scholar] [CrossRef]
- Wei, X.; He, W.; Zhou, Y.; Cheng, N.; Xiao, J.; Bi, W.; Liu, Y.; Sun, S.; Ju, W. Increased sensitivity of global vegetation productivity to drought over the recent three decades. J. Geophys. Res. Atmos. 2023, 128, e2022JD037504. [Google Scholar] [CrossRef]
- Yana, D.; Scottb, R.; Moorea, D.; Biedermanb, J.; Smitha, W. Understanding the relationship between vegetation greenness and productivity across dryland ecosystems through the integration of PhenoCam, satellite, and eddy covariance data. Remote Sens. Environ. 2019, 223, 50–62. [Google Scholar] [CrossRef]
- Li, X.; Xiao, J. TROPOMI observations allow for robust exploration of the relationship between solar-induced chlorophyll fluorescence and terrestrial gross primary production. Remote Sens. Environ. 2022, 268, 112748. [Google Scholar] [CrossRef]
- Liang, C.; Zhang, M.; Wang, Z.; Xiang, X.; Gong, H.; Wang, K.; Liu, H. The strengthened impact of water availability at interannual and decadal time scales on vegetation GPP. Glob. Chang. Biol. 2024, 30, e17138. [Google Scholar] [CrossRef] [PubMed]
- May, J.; Parker, T.; Unger, S.; Oberbauer, S. Short term changes in moisture content drive strong changes in Normalized Difference Vegetation Index and gross primary productivity in four Arctic moss communities. Remote Sens. Environ. 2018, 212, 114–120. [Google Scholar] [CrossRef]
- Zhao, W.; Rong, Y.; Zhou, Y.; Zhang, Y.; Li, S.; Liu, L. The relationship of gross primary productivity with NDVI rather than solar-induced chlorophyll fluorescence is weakened under the stress of drought. Remote Sens. 2024, 16, 555. [Google Scholar] [CrossRef]
- Li, J.; Han, W.; Zheng, J.; Yu, X.; Tian, R.; Liu, L.; Guan, J. Grassland productivity in arid Central Asia depends on the greening rate rather than the growing season length. Sci. Total Environ. 2024, 933, 173155. [Google Scholar] [CrossRef]
- Li, W.; Pacheco-Labrador, J.; Migliavacca, M.; Miralles, D.; van Dijke, A.; Reichstein, M.; Forkel, M.; Zhang, W.; Frankenberg, C.; Panwar, A.; et al. Widespread and complex drought effects on vegetation physiology inferred from space. Nat. Commun. 2023, 14, 4640. [Google Scholar] [CrossRef]
- He, M.; Kimball, J.; Yi, Y.; Running, S.; Guan, K.; Jensco, K.; Maxwell, B.; Maneta, M. Impacts of the 2017 flash drought in the US Northern plains informed by satellite-based evapotranspiration and solar-induced fluorescence. Environ. Res. Lett. 2019, 14, 074019. [Google Scholar] [CrossRef]
- Li, X.; Xiao, J.; Kimball, J.; Reichle, R.; Scott, R.; Litvak, M.; Bohrer, G.; Frankenberg, C. Synergistic use of SMAP and OCO-2 data in assessing the responses of ecosystem productivity to the 2018 US drought. Remote Sens. Environ. 2020, 251, 112062. [Google Scholar] [CrossRef]
- Ding, Z.; Peng, J.; Qiu, S.; Zhao, Y. Nearly half of global vegetated area experienced inconsistent vegetation growth in terms of greenness, cover, and productivity. Earths Future 2020, 8, e2020EF001618. [Google Scholar] [CrossRef]
- Liu, D.; Zhang, C.; Ogaya, R.; Fernández-Martínez, M.; Pugh, T.; Peñuelas, J. Increasing climatic sensitivity of global grassland vegetation biomass and species diversity correlates with water availability. New Phytol. 2021, 230, 1761–1771. [Google Scholar] [CrossRef]
- Kulmatiski, A.; Beard, K. Woody plant encroachment facilitated by increased precipitation intensity. Nat. Clim. Chang. 2013, 3, 833–837. [Google Scholar] [CrossRef]
- Tang, L.; Cai, X.; Gong, W.; Lu, J.; Chen, X.; Lei, Q.; Yu, G. Increased vegetation greenness aggravates water conflicts during lasting and intensifying drought in the poyang lake watershed, China. Forests 2018, 9, 24. [Google Scholar] [CrossRef]
- Bai, Y.; Liang, S.; Jia, A.; Li, S. Different satellite products revealing variable tends in global gross primary production. J. Geophys. Res. Biogeosci. 2023, 128, e2022JG006918. [Google Scholar] [CrossRef]
- Holdridge, L. Determination of world plant formations from simple climatic data. Science 1947, 105, 367–368. [Google Scholar] [CrossRef] [PubMed]
- Parra, A.; Greenberg, J. Climate-limited vegetation change in the conterminous United States of America. Glob. Chang. Biol. 2024, 30, e17204. [Google Scholar] [CrossRef]
- Wang, S.; Fu, B.; Wei, F.; Piao, S.; Maestre, F.; Wang, L.; Jiao, W.; Liu, Y.; Li, Y.; Li, C.; et al. Drylands contribute disproportionately to observed global productivity increases. Sci. Bull. 2023, 68, 224–232. [Google Scholar] [CrossRef]
- Zscheischler, J.; Seneviratne, S. Dependence of drivers affects risks associated with compound events. Sci. Adv. 2017, 3, e1700263. [Google Scholar] [CrossRef]
- Zhao, W.; Yu, X.; Liu, Y.; Xu, L.; Chen, Z.; Li, S. Distinct vegetation response to drying and wetting trends across an aridity threshold. Environ. Res. Commun. 2021, 3, 025002. [Google Scholar] [CrossRef]
- Wagle, P.; Xiao, X.; Torn, M.; Cook, D.; Matamala, R.; Fischer, M.; Jin, C.; Dong, J.; Biradar, C. Sensitivity of vegetation indices and gross primary production of tallgrass prairie to severe drought. Remote Sens. Environ. 2014, 152, 1–14. [Google Scholar] [CrossRef]
- Xiao, J.; Chen, M.; Liu, W.; He, J.; Pan, C.; Long, M. Perfect mechanical and robust electronic properties of new carbon nanothreads: A first principles study. Phys. E Low-Dimens. Syst. Nanostructures 2019, 111, 37–43. [Google Scholar] [CrossRef]
- Ahlström, A.; Raupach, M.; Schurgers, G.; Smith, B.; Arneth, A.; Jung, M.; Reichstein, M.; Canadell, J.; Friedlingstein, P.; Jain, A.; et al. The dominant role of semi-arid ecosystems in the trend and variability of the land CO2 sink. Science 2015, 348, 895–899. [Google Scholar] [CrossRef] [PubMed]
- Cao, S.; Yi, H.; Zhang, L.; Sun, Q.; Zhang, Y.; Li, H.; Wei, X.; Liu, Y. Spatiotemporal dynamics of vegetation net ecosystem productivity and its response to drought in Northwest China. GISci. Remote Sens. 2023, 60, 2194597. [Google Scholar] [CrossRef]
- Jiang, L.; Liu, W.; Liu, B.; Yuan, Y.; Bao, A. Monitoring vegetation sensitivity to drought events in China. Sci. Total Environ. 2023, 893, 164917. [Google Scholar] [CrossRef] [PubMed]
- Granata, F.; Gargano, R.; de Marinis, G. Artificial intelligence based approaches to evaluate actual evapotranspiration in wetlands. Sci. Total Environ. 2020, 703, 135653. [Google Scholar] [CrossRef] [PubMed]
- Yan, P.; He, N.; Yu, K.; Xu, L.; Van Meerbeek, K. Integrating multiple plant functional traits to predict ecosystem productivity. Commun. Biol. 2023, 6, 239. [Google Scholar] [CrossRef]
- Wang, X.; Wu, C.; Liu, Y.; Penuelas, J.; Peng, J. Earlier leaf senescence dates are constrained by soil moisture. Glob. Chang. Biol. 2023, 29, 1557–1573. [Google Scholar] [CrossRef]
- Shekhar, A.; Buchmann, N.; Gharun, M. How well do recently reconstructed solar-induced fluorescence datasets model gross primary productivity? Remote Sens. Environ. 2022, 283, 113282. [Google Scholar] [CrossRef]


Disclaimer/Publisher’s Note: The statements, opinions and data contained in all publications are solely those of the individual author(s) and contributor(s) and not of MDPI and/or the editor(s). MDPI and/or the editor(s) disclaim responsibility for any injury to people or property resulting from any ideas, methods, instructions or products referred to in the content. |
© 2024 by the authors. Licensee MDPI, Basel, Switzerland. This article is an open access article distributed under the terms and conditions of the Creative Commons Attribution (CC BY) license (https://creativecommons.org/licenses/by/4.0/).