Technical Note

Quasi-Linear Convective Systems in Catalonia Detected Through Radar and Lightning Data

Servei Meteorològic de Catalunya, C/Dr. Roux, 80, 08017 Barcelona, Spain
*
Author to whom correspondence should be addressed.
Remote Sens. 2024, 16(22), 4262; https://doi.org/10.3390/rs16224262
Submission received: 25 September 2024 / Revised: 3 November 2024 / Accepted: 4 November 2024 / Published: 15 November 2024

Abstract

:
Quasi-Linear Convective Systems (QLCSs) are a type of Mesoscale Convective System characterised by their linear shape and association with severe weather phenomena (such as hail, tornadoes, or wind gusts). This study deals with the application of a technique that consists of combinations of radar and lightning data to identify QLCS in Catalonia (the northeast region of the Iberian Peninsula) and the surrounding areas. Even with the limitation of reduced coverage, the technique has revealed efficiency in identifying the systems affecting the region of interest. Concretely, we have detected twenty cases for 2013–2023, significantly less than for other parts of Central Europe but similar to the global values for the whole continent and the United States of America. All cases occurred during the warm season and are divided into diurnal and nocturnal cases with different behaviours.

1. Introduction

Mesoscale Convective Systems (MCSs) are the largest convective storms [1,2]. They form in atmospheric environments with the convective clouds that organise upscale into a unique cloud structure, including a large upper cirriform cloud formation. In this way, the most usual definition of an MCS is a cumulonimbus cloud system producing a continuous precipitation area with an axis larger than 100 km. The common constitution of an MCS includes two differentiated regions, convective and stratiform, modelled by different meteorological regimes. According to Schumacher et al. (2020) [3] or Hitchcock and Lane (2023) [4], MCSs produce over half of the annual rainfall in some regions around the world. Additionally, some MCSs carry associated severe phenomena such as severe winds, heavy rainfall, and flash floods (Schumacher, 2009 [5]). Flash floods are more common in slow-moving systems. Other works also reported tornadoes or severe hail [6,7,8,9,10]. These authors also observed that the diurnal cycle over land dominates MCSs, while, in contrast, they usually occur at night over the ocean.
One main characteristic of MCSs is the presence of a Mesoscale Convective Vortex (MCV) in the stratiform regions [8,9], which appears as the interaction of different elements: a stable vortex in the middle layers, gravity waves associated with the convective disturbance, and the Coriolis force [1,11]. As many authors have stated, MCV causes the asymmetry observed in many MCSs [1,11]. Furthermore, Gibbs [12] found that the existence of MCV in MCSs favours the occurrence of a tornado or severe high-wind events in front of the more linear systems. Another classic element that distinguishes an MCS is the existence of cold pools [4,13] or the merging of the air reaching the surface as part of the different convective cell downdrafts. Cold pools are usually characterised by means of θ e (pseudoequivalent potential temperature, [13] or [14]. This air generates a leading edge or front of the storm. Cold pools modulate the propagation velocity of MCSs because of the unstable air enforcement in the system periphery. Furthermore, they help to lift parcels to the level of free convection.
MCS organization, structure, and maintenance depend on deep-moist convection ingredients (moist, instability, and lift). Additionally, the interaction between vertical wind shear with updrafts and cold pools [3,5]) also plays an important role. QLCSs (Quasi-Linear Convective Systems) are those MCSs with one long and narrow axis. This type is one of the classic convective organization modes [15]. However, there are more types: mesoscale convective complex (MCC), bow echo, trailing stratiform line (TS), leading stratiform (LS), parallel stratiform (PS), and back building (or quasi-stationary), among others. QLCSs are responsible for most of the tornadoes and severe hail occurring in MCS [3]. Apart from this classification, there are some others, most of them using weather radar imagery, such as the one presented by Haberlie et al. (2021) [7], that considered only three main categories or modes: QLCSs, cellular, and tropical systems.
Remote sensing is very useful for detecting, forecasting, and understanding MCSs. Many studies use satellite, radar, and lightning sources to identify and follow the evolution of these structures along part or the full path. Because we do not consider satellite imagery in the current analysis, we only briefly mention some research using this method because it is related to other points presented in our manuscript. For instance, Correoso et al. [16] detected multiple MCSs in the Iberian Peninsula and its surroundings through infra-red (IR) METEOSAT imagery and a −52 °C brightness temperature (BT) to analyse the cloud-to-ground (CG) flashes activity. They found that the 15% of total lightning (TL) occurred during the first storm phase when +CG (positive cloud-to-ground) dominance occurs. The +CG mode still dominates in the growing stage, with 59% TL, while at the phase of the maximum area, the −CG mode begins the more relevant. Finally, during the decaying phase, it maintains a high number of −CG flashes, with about 14% of the TL. Additionally, most of the CG activity was detected close to the cold cloud top (CT) temperatures, and the maximum flash rate (FR) coincides with the minimum CT temperature.
Continuing from the lightning activity perspective, this mainly occurs over the convective line [17]. Ringhauser et al. (2024) [18] showed that there exists coincidence in the observations of different lightning detection systems, even though most of them detect different types of sources associated with flashes. Furthermore, flashes detected in the stratiform region usually have a starting point in the convective area with large and multiple paths. Parker et al. (2001) [19] showed that LS and TS MCSs exhibited an early +CG mode and a later +CG dissipating mode. −CG flash densities in LS were lower in the first half of the life cycle. Additionally, PS presented smaller +CG fractions in earlier stages. In this mode, the parallel stratiform region also played some role in lightning production. Wang et al. (2019) [20] analysed flashes in the stratiform region using volumetric radar imagery, with some interesting results: those flashes initiated in the non-convective region initiated at lower altitude (between 5 and 10 km) but above the brightness band area (with reflectivity between 10 and 25 dBZ).
Going more in-depth with the exclusive definition of QLCSs compared to other MCS types, Ashley et al. (2019) [6] initially introduced the following simple interpretation: “a type of MCS characterised by a convective line much longer than they are wide”. An MCS is, from the radar point of view, a set of convective pixels (≥40 dBZ) persisting for at least 3 h with a continuous linear size of at least 100 km along the major axis [15]. However, to introduce a useful definition for most of the studies, [6] obtain this interesting and clear definition in their work: a QLCS must verify that (1) convective areas (≥40 dBZ) are longer than 100 km, and (2) 3 times longer than wider. The technique applies a 6 km aggregation method, considering that swaths of 3 h are necessary. Goodnight et al. (2022) [21] focused on the cases with tornadogenesis in QLCSs using weather radar data, classifying the systems in two categories: shearing instability dominant [8], which implied the presence of at least one low-level circulations adjacent to the tornadic vortex, or pre-tornadic mesocyclone dominant, which requires a mid-level circulation.
The weather radar is the most useful tool for studying the internal structure of QLCSs because of its capabilities for scanning in 3D the internal reflectivity field and other variables, such as the radial wind. In this way, Conrad and Knupp (2019) [22] used this product to detect the strong winds occurring behind and ahead of the QLCS, with a maximum wind speed near the leading edge. Most of the cited manuscripts in this introduction included some weather radar analysis to identify and characterise the MCS or QLCS [7,15,23,24,25] to identify one signature associated to the structures [9,13,26] or to compare with other data types, such as satellite or lightning [17,19,27]. Surowiecki et al. (2020) [28] and Surowiecki et al. (2024) [24] created the first climatologies of MCSs in Poland and QLCSs in Europe, respectively. They combined weather radar and lightning detection sources among severe ground weather hail observations. The technique was similar in both cases, considering the previously presented definitions and restrictions regarding radar reflectivity, duration, size, and proportions. In the two cases, the coverage is larger than in the present analysis, but the idea is similar. These works and Ashley et al. (2019) [6] are the basis of the research performed in the area of Catalonia and presented in this manuscript.
The previous works have many advantages, but there are some weak points. Here, we summarise the more relevant ones. Ashley et al. (2019) [6] identified a principal limitation in the system coverage, especially in mountainous areas or with the lowest beam radar over 3000 m. In the case of Surowiecki et al. (2024) [24], they found that some QLCSs did not reach the conditions for a specific part of the life cycle (or even for the entire duration), and they had to decide, as the objective of the method is the main problem in the methodology. On the other hand, Haberlie et al. (2020) [7] observed many heterogeneities between the different periods (e.g., seasons or part of the day) when we use a large data set. Those times have different meteorological conditions. The authors of [7] found that it is necessary to avoid transitions between periods to have problems with the algorithm’s parameters.
In Catalonia and the surrounding area (the Western Mediterranean basin), some previous works are referring to particular cases of MCS or QLCS: the tornadic event of 21 March 2012 (Bech et al. [29], the damaging winds and heavy rain case of 17 August 2003 (López 2007 [30], the heavy rainfall event of 9 October 1994 (Ramis et al., 1998 [31], the severe storm in the Balearic Islands of 29 October 2013 (Romero et al., 2015 [32], and the heavy rainfall and flood case of 10 June 2000 episode (Rigo and Llasat, 2005 [33])). Additionally, Rigo and Llasat (2004 and 2007 [34,35]) started an analysis of MCSs in Catalonia based on radar imagery, which was improved in Rigo et al. (2019) [36]. This study continues the previous works for MCSs in Catalonia but focuses on QLCSs and uses a combination of weather radar composite and lightning observations. We have not used satellite imagery because the time resolution (15 min) and the grid size (3 km) are different than those of the weather radar (6 min and 1 km, respectively). The main questions we want to answer are: (1) Is it possible to perform QLCS identification using remote sensing in the area of study, considering the limited area? (2) How usual are the QLCSs in Catalonia? (3) What are the most common features of these structures? (4) Are the QLSCs in Catalonia similar to other those of regions? To summarize, the motivation of this study is the development and application of a technique for identifying QLCSs using weather radar and lightning sources. Although we have applied the research to Catalonia because it is our area of interest for operational surveillance tasks, we think it is exportable to other regions with similar data.

2. Materials and Methods

2.1. Area of Study

This study analyses the occurrence of QLCSs in Catalonia for 2013–2023 through weather radar and lightning sources. Catalonia is located in the northeast of the Iberian Peninsula (see Figure 1) and has an area of nearly 32,000 km2. The region is limited by the Pyrenees at the north, the Ebro Valley at the west, and the Mediterranean Sea, with the coast running from southwest to northeast. The Pyrenees are a range that separates France and Spain and runs from west to east, with heights exceeding 3000 m. There are other minor ranges in Catalonia, with different maximum heights (between 500 to 2000 m), distance to the sea (from 2 to 200 km), and orientation (mostly parallel to the coastline or parallel to the Pyrenees). This complex topography, combined with the proximity of the Mediterranean Sea (a relatively warm sea that contributes with a warm and moist air mass at lower levels), makes Catalan meteorology very complex, combining events of severe weather with droughts, heavy rain cases and floods, and snow episodes [37,38,39]. As Rigo et al. [34,35,36] showed previously, MCSs occurred in most of those cases of adverse weather in Catalonia (except in the cases of droughts).

2.2. Data

The study consists of the analysis of two types of data: the cloud-to-ground flashes detected by the Lightning Location System Network (XDDE from the acronym in Catalan: Xarxa de Detecció de Descàrregues Elèctriques) and the volumetric data of the composition from the weather C-band single-pol radars (XRAD, Xarxa de Radars, or Radar network) of the Servei Meteorològic de Catalunya. Both networks run operationally and are composed of four elements. This subsection presents the main characteristics of both networks.
The XDDE was deployed between 2003 and 2006 and has run operationally since 2007. Each of the four detectors (red dots in Figure 1) consists of two types of receptor antennas: one very-high-frequency (VHF) antenna to detect the IC (intra-cloud) flashes and one low-frequency (LF) antenna that registers the CG strokes. The combination of the four sensors allows for a good precision in time (0.01 ms) and space (less than 500 m, over Catalonia). The use of ICs permits the nowcasting of severe weather phenomena [38], while the location of CGs helps to the detection of fires and damages on infra-structures, among others [40]. We have only considered CG flashes because they fit better to radar structures [41]. Figure 2 shows an example of the flashes detected during 19 October 2018, between 17.00 and 18.00 UTC. The episode produced heavy rains and floods in the southern part of Catalonia.
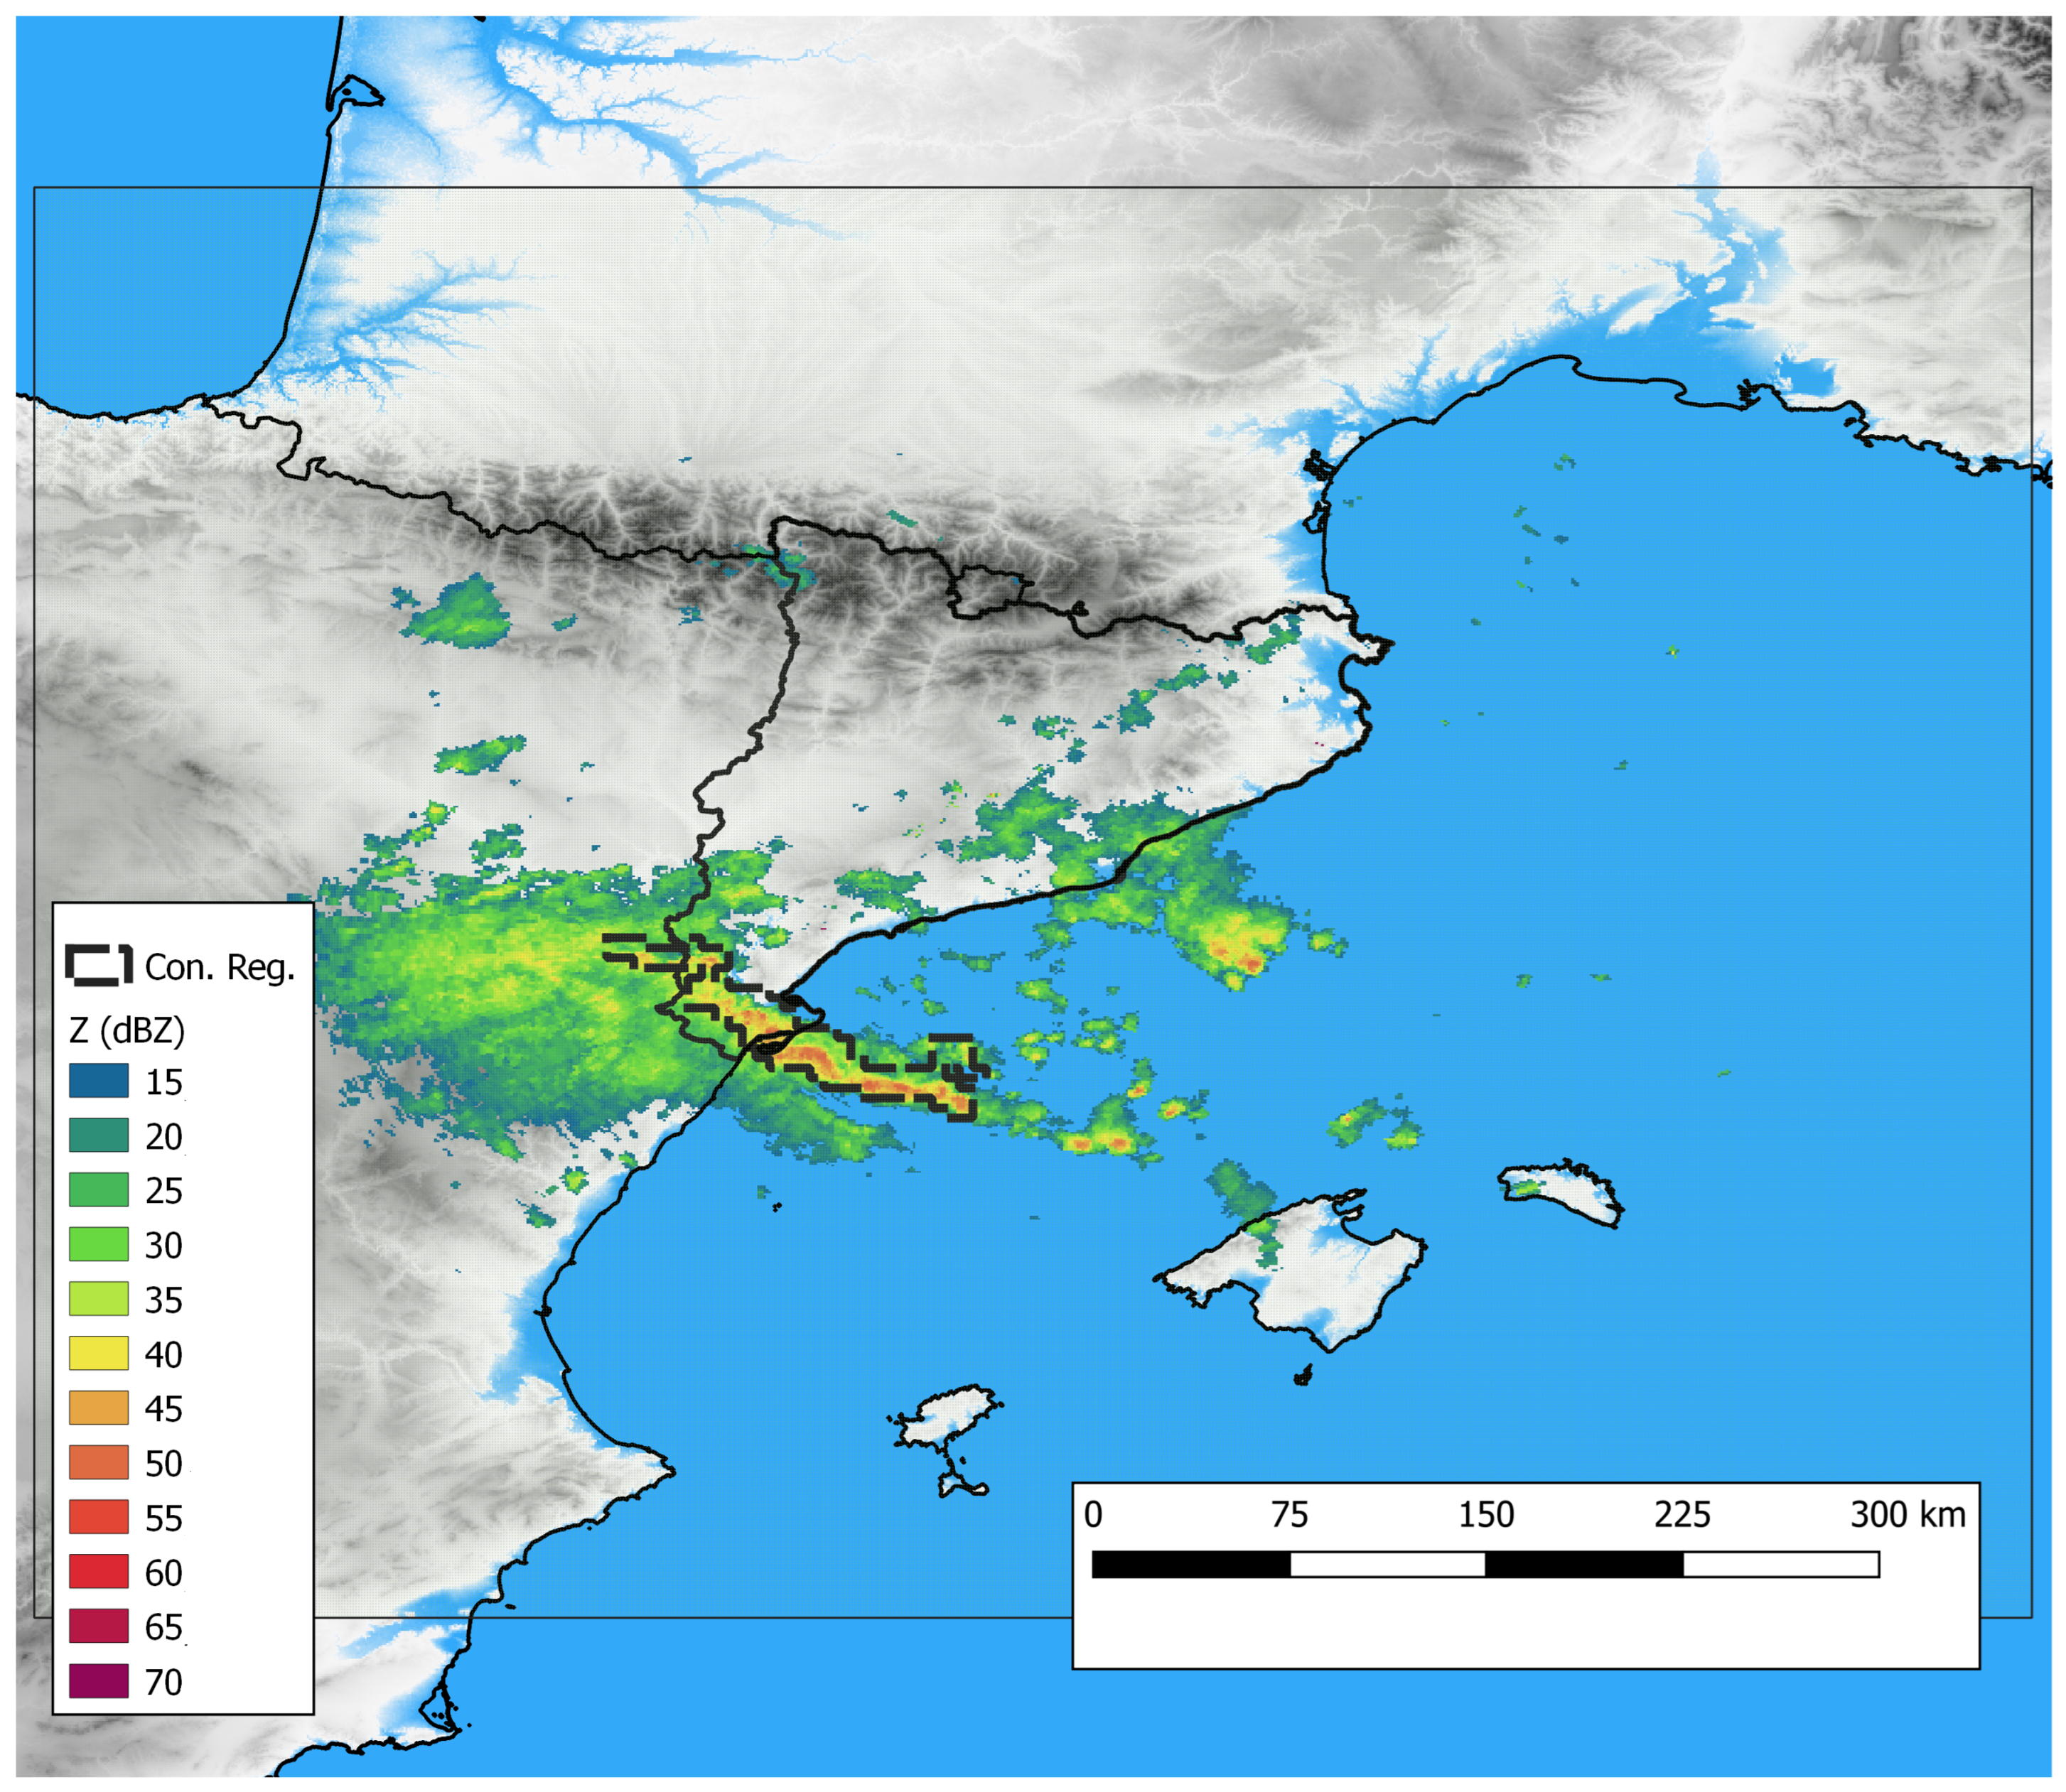
The XRAD has operated in real-time since 2002 and consists of four C-band weather radars with a single polarization. The radars are low-power systems. However, their distribution allows the acquisition of good products for Catalan and the surrounding area. They have a 6 min cycle in which the antenna scans 16 times the atmosphere in 15 elevations: the lower one is scanned twice, one with a range of 240 km and the second with a range of 130 km. The rest of the elevations have a range of 130 km too. Then, each radar provides a long-range PPI (Plan Position Indicator) for the lower elevation and 15 short-range PPIs, integrated into a unique volume file every 6 min. Once the full scan has finished, the computer sends the data to the central office processor, which generates multiple products for single radars or the composition of all. In the present study, we consider the CAPPI (Constant Altitude Plan Position Indicator) composition for the longest range (see an example in Figure 3, for the same event that Figure 2. Additionally, the daily maximum reflectivity has made the preliminary process easier. The manuscript [36] provides more information about the network.

2.3. Methodology

To identify QLCS in the region of study, we have considered the following premises, based on the bibliography shown in the introduction:
  • Intensity: The structure had lightning and high reflectivity radar echoes over Catalonia.
  • Duration: The structure lasted more than 3 h.
  • Length: The larger axis reached 100 km of continuous reflectivity (exceeding 30 dBZ) for at least one hour.
  • Linearity: The length of the convective region is at least three times longer than the width.
All the procedures applied in this research have been conducted using R software [42], developing routines based on the specific libraries for geospatial analysis (raster [43] and rgdal [44]) and for ellipses identification (scatterplot3d [45], SIBER [46], and conicfit [47]). The geospatial packages allowed for the easy management of large amounts of geo-referenced data (radar imagery and lightning locations), while the ellipses identification routines made it possible to perform fast calculation of the axes and area of the structures that exceed the different thresholds. None of the algorithms used artificial intelligence. Additionally, the validation confirmed the results through visual analysis and the experience of the researchers.
The preliminary step of the methodology is identifying days in the radar database (period 2013–2023) with a reflectivity exceeding 35 dBZ over Catalonia in an area larger than 500 km2, considering the daily maximum reflectivity product. This simple procedure reduces the initial 4016 candidate days to 876 days (a 21.86%), because it removes situations with low or no convective activity.
Once we reduced the number of candidate days, we applied a second preliminary step of the technique. This phase starts by selecting all the daily CG flashes (independently of their polarity) and transforming them in a raster with the same properties (grid size, number of rows and columns, and projection) than a radar file. Then, the algorithm searches for all those regions with an area larger than 200 km2, removing all the rest. This condition allows for the removal of non-real flashes or small convective cells, focusing only on the bigger structures. Finally, we searched for areas with a major axis exceeding 120 km in length, permitting removing all the structures that did not verify the third of the hypothesis. After this pre-method stage, the number of candidate days reduced to 302 for the whole period (only a 7.5%).
We started with the specific methodology after selecting days prone to include one or more possible QLCS. The algorithm selected the CG flashes during 6 min periods, coinciding with the radar time resolution. Again, the locations were re-assigned as a raster with the same geographical configuration as the radar CAPPI composite (see an example in Figure 4). This transformation allowed us to identify the biggest areas, transformed in ellipses. To be selected, one structure must exceed 80 km in the longest axis, and the eccentricity should be over 0.85 (indicating that the major axis is higher than the minor axis). The length threshold is lower in the lightning activity case (80 km instead of 100 km) because, according to a preliminary analysis of MCS cases that included some QLCS (Rigo et al., 2019) [36], lightning activity does not reach the complete extent acquired by the high reflectivity zones. Areas are similar only during the transition between the growing and the maturity stage, but in all the cases, the extent was lower for the electrically active region. The difference was 75% on average. So, we considered 80% of the radar threshold as a good discriminator. Furthermore, the example presented during this section (see Figure 3, Figure 4, Figure 5 and Figure 6) also shows this behaviour: the peak of the lightning activity during a brief part of the life cycle and how the area during this peak is lower than the reflectivity area. This step allowed us to identify convective systems with a linear structure. We detected 57 candidate structures with very different characteristics: (1) 13 were identified in only one (6 min) period. Otherwise, 18 lasted for six or more periods; (2) the structure more times identified in 30 periods (if each period corresponds to 6 min, the total time is 3 h; (3) the average number of candidate structures per year was 5.18, but 2022 (15) and 2023 (12) are the unique years clearly over this value; (4) finally, most of cases (54) occurred between June and October, with the maximum in August (18).
The second phase consists of identifying the QLCSs in the radar imagery, departing from the times with lightning information. So, once we have a concrete hour with a structure verifying the electrical conditions, we select the period between the previous three hours and the next three hours to search for structures with the same conditions (length of larger axis and eccentricity) in radar composite imagery with a time step of 12 min (see an example in Figure 5). This step allows us to follow the whole path of the structure to confirm whether it verifies the condition of duration. Finally, twenty structures verified all the four conditions (1 to 4) presented at the beginning of this section (intensity, duration, length, and linearity). Nine of the years registered at least one QLCS: only 2020 and 2021 did not register any. The years 2015, 2016, 2018, 2022, and 2023 registered three cases. All the QLCSs occurred between June and November, with a peak in October (5) and July, August, and September (4).
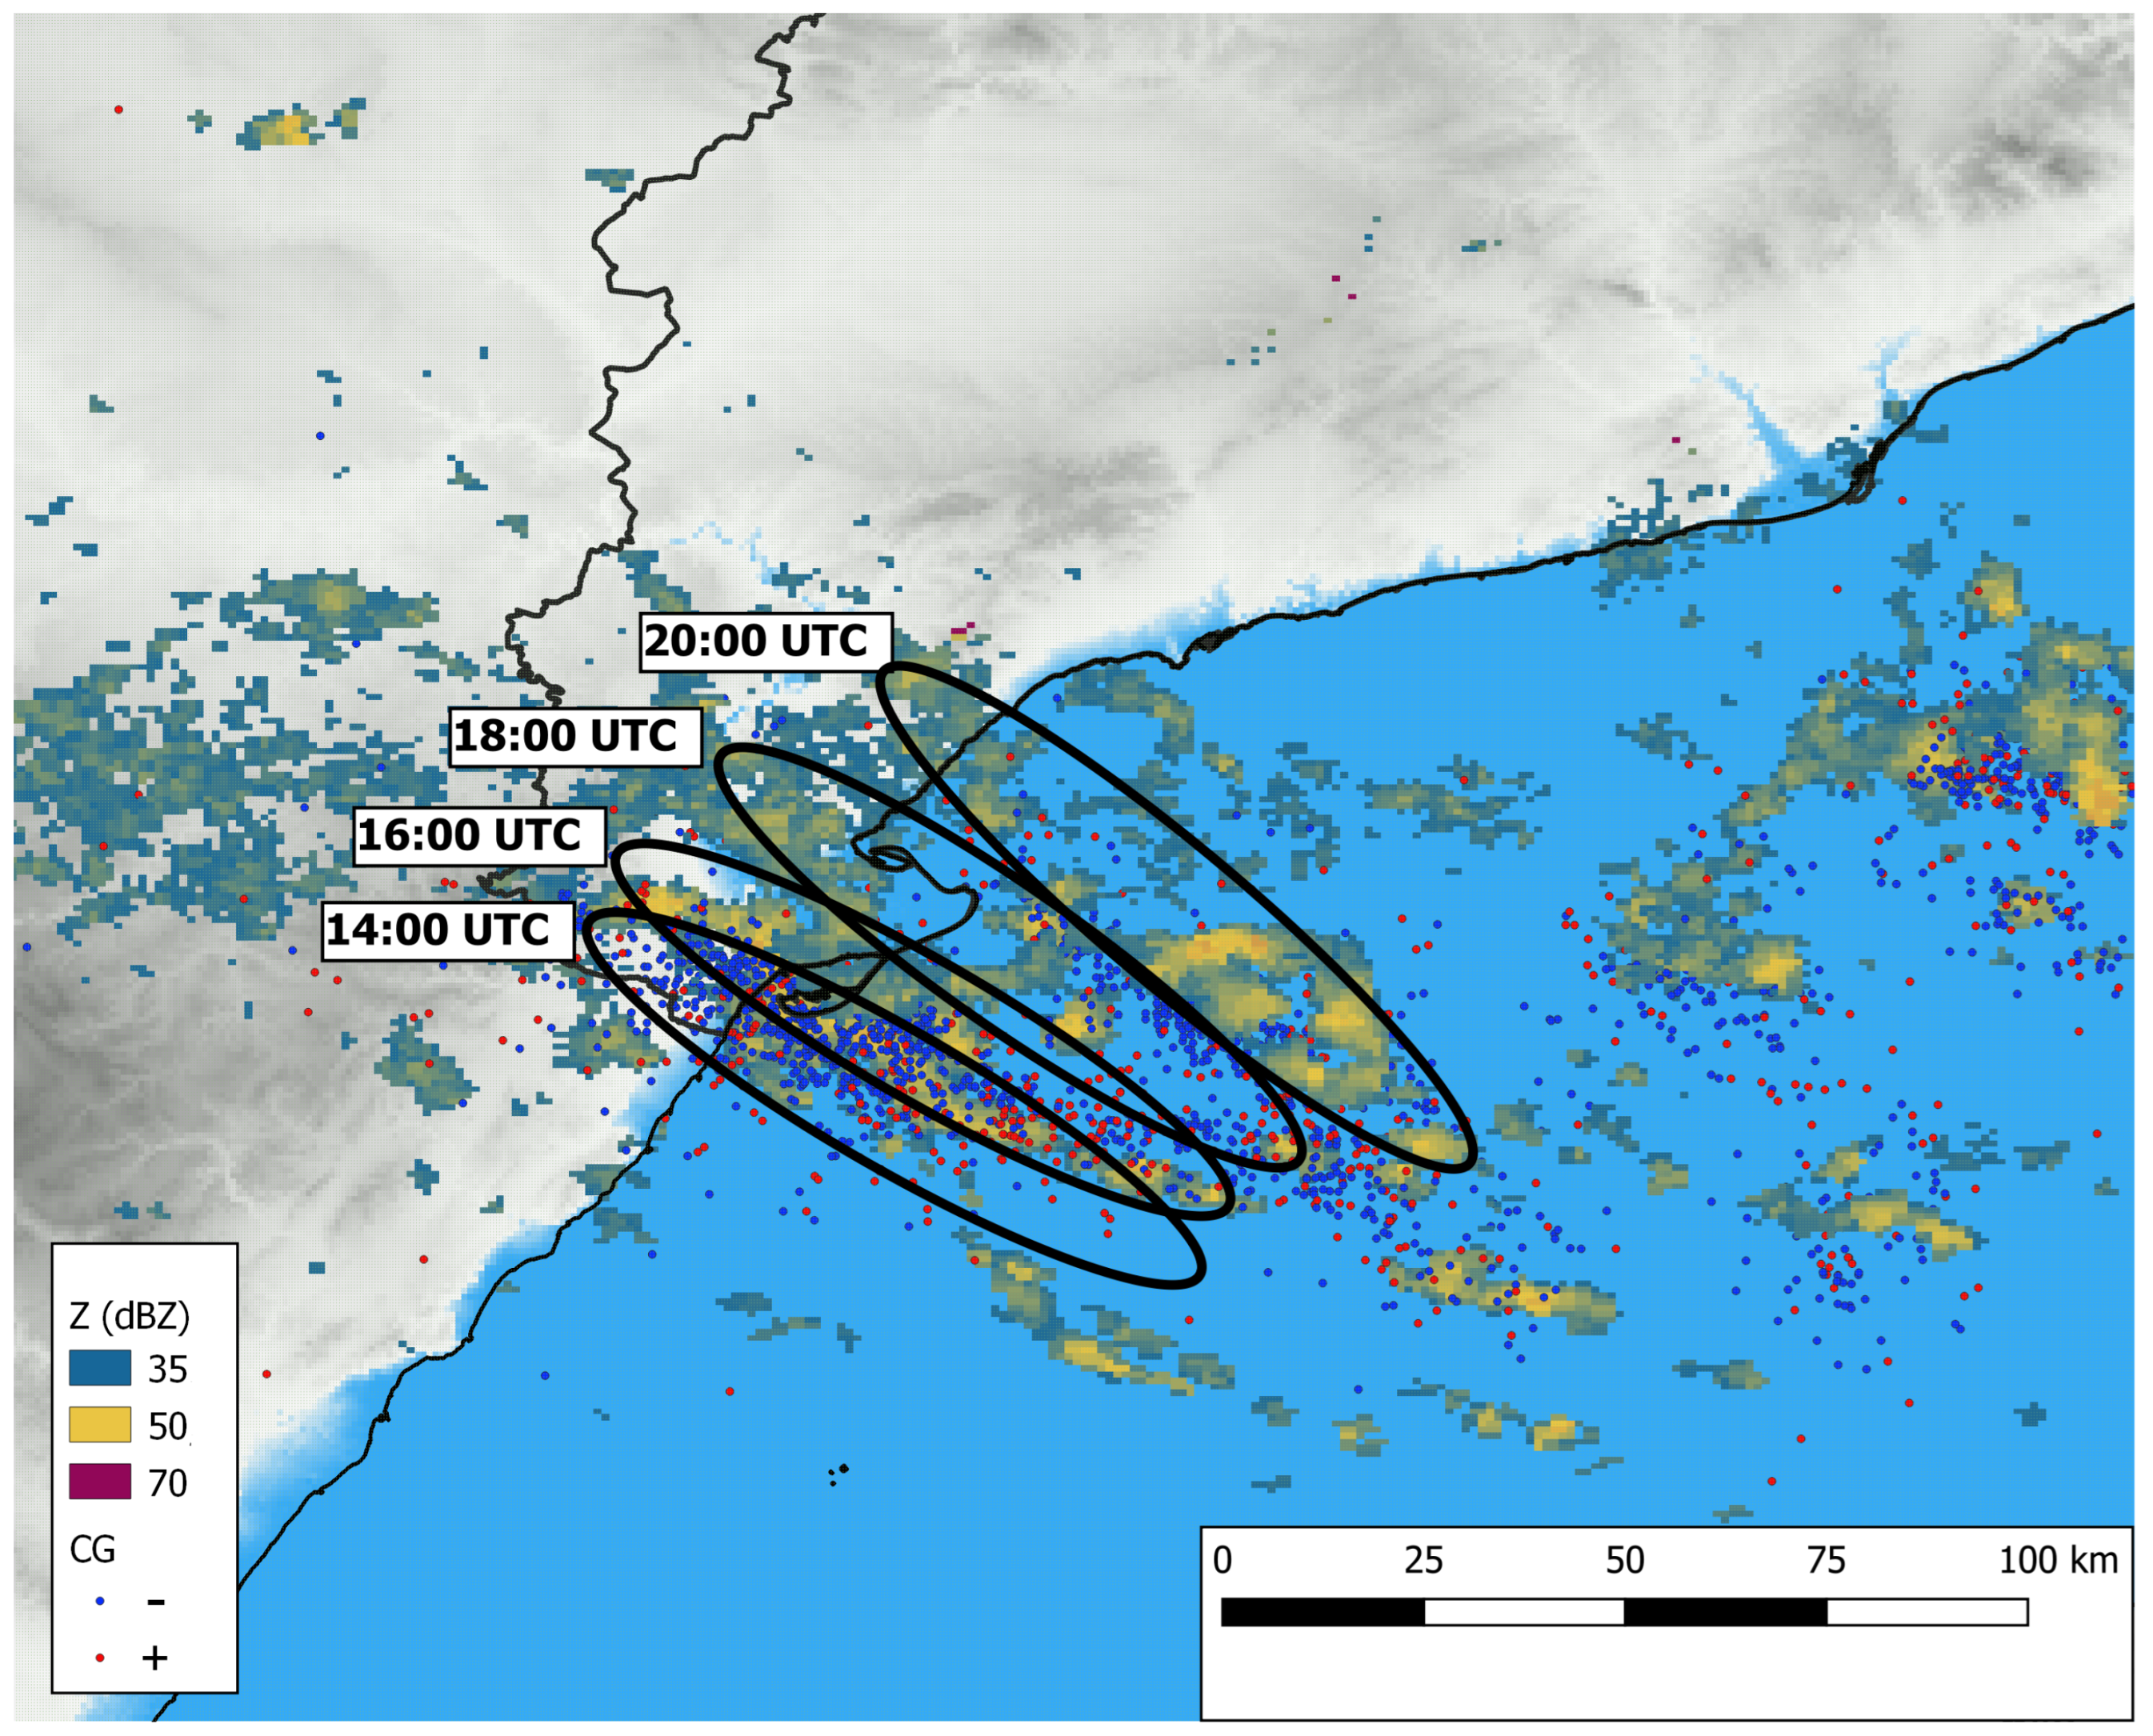
Figure 6 shows an example of the tracking of the QLCS that affected the Southern part of Catalonia during 19 October 2018. The figure shows how the lightning activity decreased notably after the first time of identification (14.00 UTC). In fact, the ellipses of the 16.00, 18.00, and 20.00 UTC show a low number of flashes, indicating the necessity of combining both sources (radar and lightning) to accurately follow the complete path of each system.
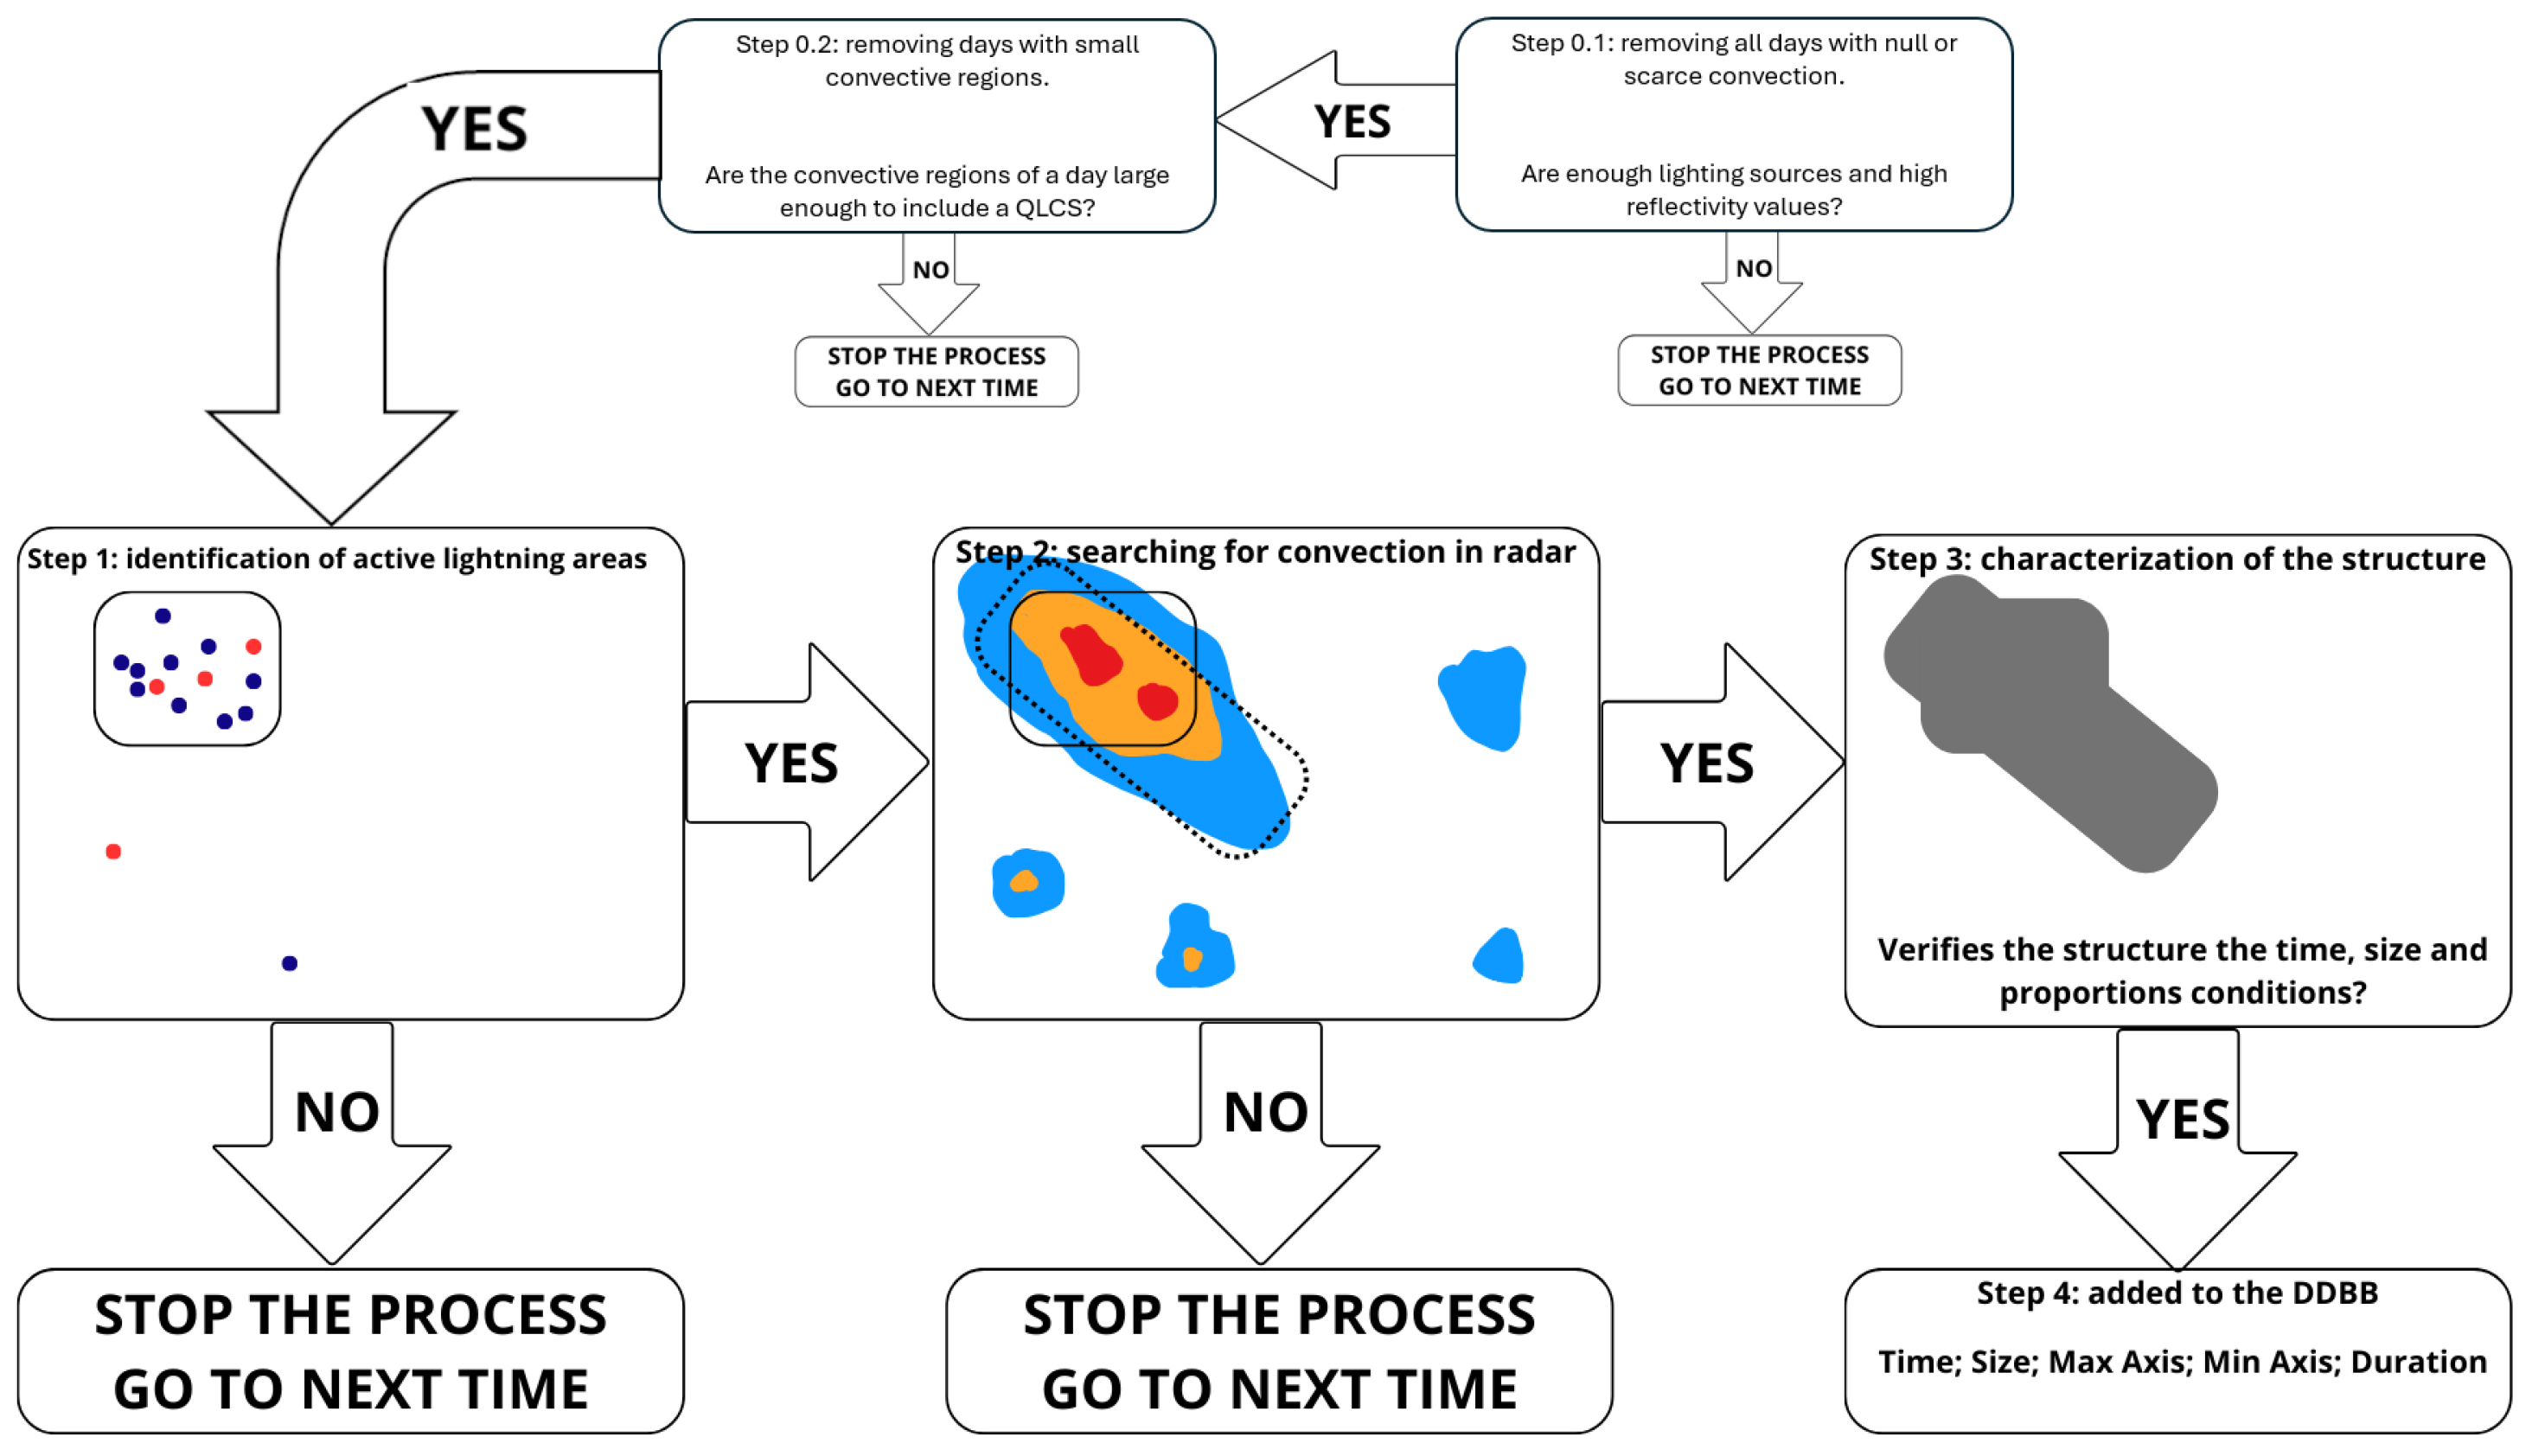
Figure 7 presents the flow scheme of the procedure. To summarize, there are three main steps (after the two preliminary for removing days without lightning activity or enough reflectivity extent over the study area): (1) the selection of the structures according to the lightning activity; (2) the identification of the structures in the radar imagery; and (3) the discrimination of those structures that not verify the previously presented conditions (intensity, duration, length, and linearity).
The results are highly dependent on the quality of the different fields (radar and lightning detections). Because both networks are real-time operational, the quality decreases as we move far from Catalonia. Trapero et al. (2009) [48] and Montanyà et al. (2006) [49] provided detailed information regarding the limitations of both networks, showing the pros and cons of both systems. In any case, it is worth noting that the research focuses on large convective systems, which are easier to detect than other precipitation structures. However, it is more complicated to accomplish the necessary conditions for defining a structure as QLCS (size, duration, etc.) in the external parts of the region presented in Figure 1.

3. Results

In this section, we present the main results referring to the 20 QLCS identified in the studied region during the period 2013–2023, from the point of view of the radar and lightning activity. Figure 8 shows the spatial density of the QLCS over the studied region. This field indicates the number of times (or radar imagery, generated every 6 min) in which the technique detected a QLCS over a certain pixel. As redder is the pixel, more times the algorithm has detected a QLCS in that point. It can be appreciated that the QLCS density decreases as we move far from Catalonia. Although it is possible that there exist some limitations in the identification of some stages of the QLCS in those regions because the structures would be in the worst coverage area, while manually tracking some of the systems, we have observed how the results paths are coherent with the observations.
We observe that there are three main areas of occurrence: the northern part, dominated by the orographic influence, the central part, in which there is a combination of sea and topography influences, and finally, the Mediterranean part, mainly influenced by the sea. The simplified trajectories shown in the same figure also confirm three main behaviours, with some systems moving only over land (ten of twenty), others between sea and land, and, finally, the last group, QLCSs developing exclusively over the sea. These trajectories summarise the general path of each QLCS, considering the centre of the structure. Therefore, part of a QLCS can be over land in the cases of a sea-influenced event, but most of the structure developed over the Mediterranean, and the contrary. Another interesting phenomenon observed in the figure is the different type of trajectories: quasi-straight paths versus those with curved motions. Both categories have similar number of cases (nine for quasi-straight paths, in front of eleven QLCS with curved trajectories) and one of the future actions would be determining which elements contribute to each type. Table 1 shows the date and the main trajectory characteristics for the identified QLCS.
Complementary to Figure 8, Table 2 summarises elements referring to the duration, speed, path length, intensity, the time of occurrence, and the electrical behaviour. The QLCS reflectivity ranges between 49 and 57 dBZ, with the maximum values during the hotter months (July and August), while there is a decrease as we move to end October and November. Additionally, QLCSs occurring over land showed larger values of reflectivity. This fact could be explained with the high relationship between land QLCSs and the diurnal cycle of convection. On the contrary, maritime QLCSs usually occurred during night. To conclude the reflectivity analysis, the higher values of this parameter usually occurred during the first third of the life cycle; however, in some cases with maritime influence, the maximum took place near the third quart of the total duration. These values did not coincide with those related with electrical activity. The larger rate of total lightning in QLCSs generally coincided with the mid of the life cycle. All the QLCSs showed a high electrical activity in a large part of the total duration and the rate between positive and negative CG indicated a dominance of the second type in a seven to ten proportion. As a common behaviour, this rate decreases as we move to the colder months, similarly to the evolution of maximum reflectivity.
Regarding the trajectory, we found that the average length of the path was a bit more than 250 km, ranging between 125 and 420 km. The duration has a mean value of 340 min (that is, five hours and 40 min), with a minimum of 192 and a maximum of 510 min (eight and half hours). In general, those structures with maritime influence had lower duration, but the speed was over to the average (47 km/h in front of the mean 45.4 km/h). QLCS occurring between September and October had a higher mean velocity (52.4 km/h) that those that took place in the other months (40.1 km/h). Regarding the part of the day (afternoon, between 11 to 17 UTC, associated with the diurnal cycle of convection, or the rest of the day), the averaged speed was similar between both categories (45.9 km/h in front of 43.0 km/h).
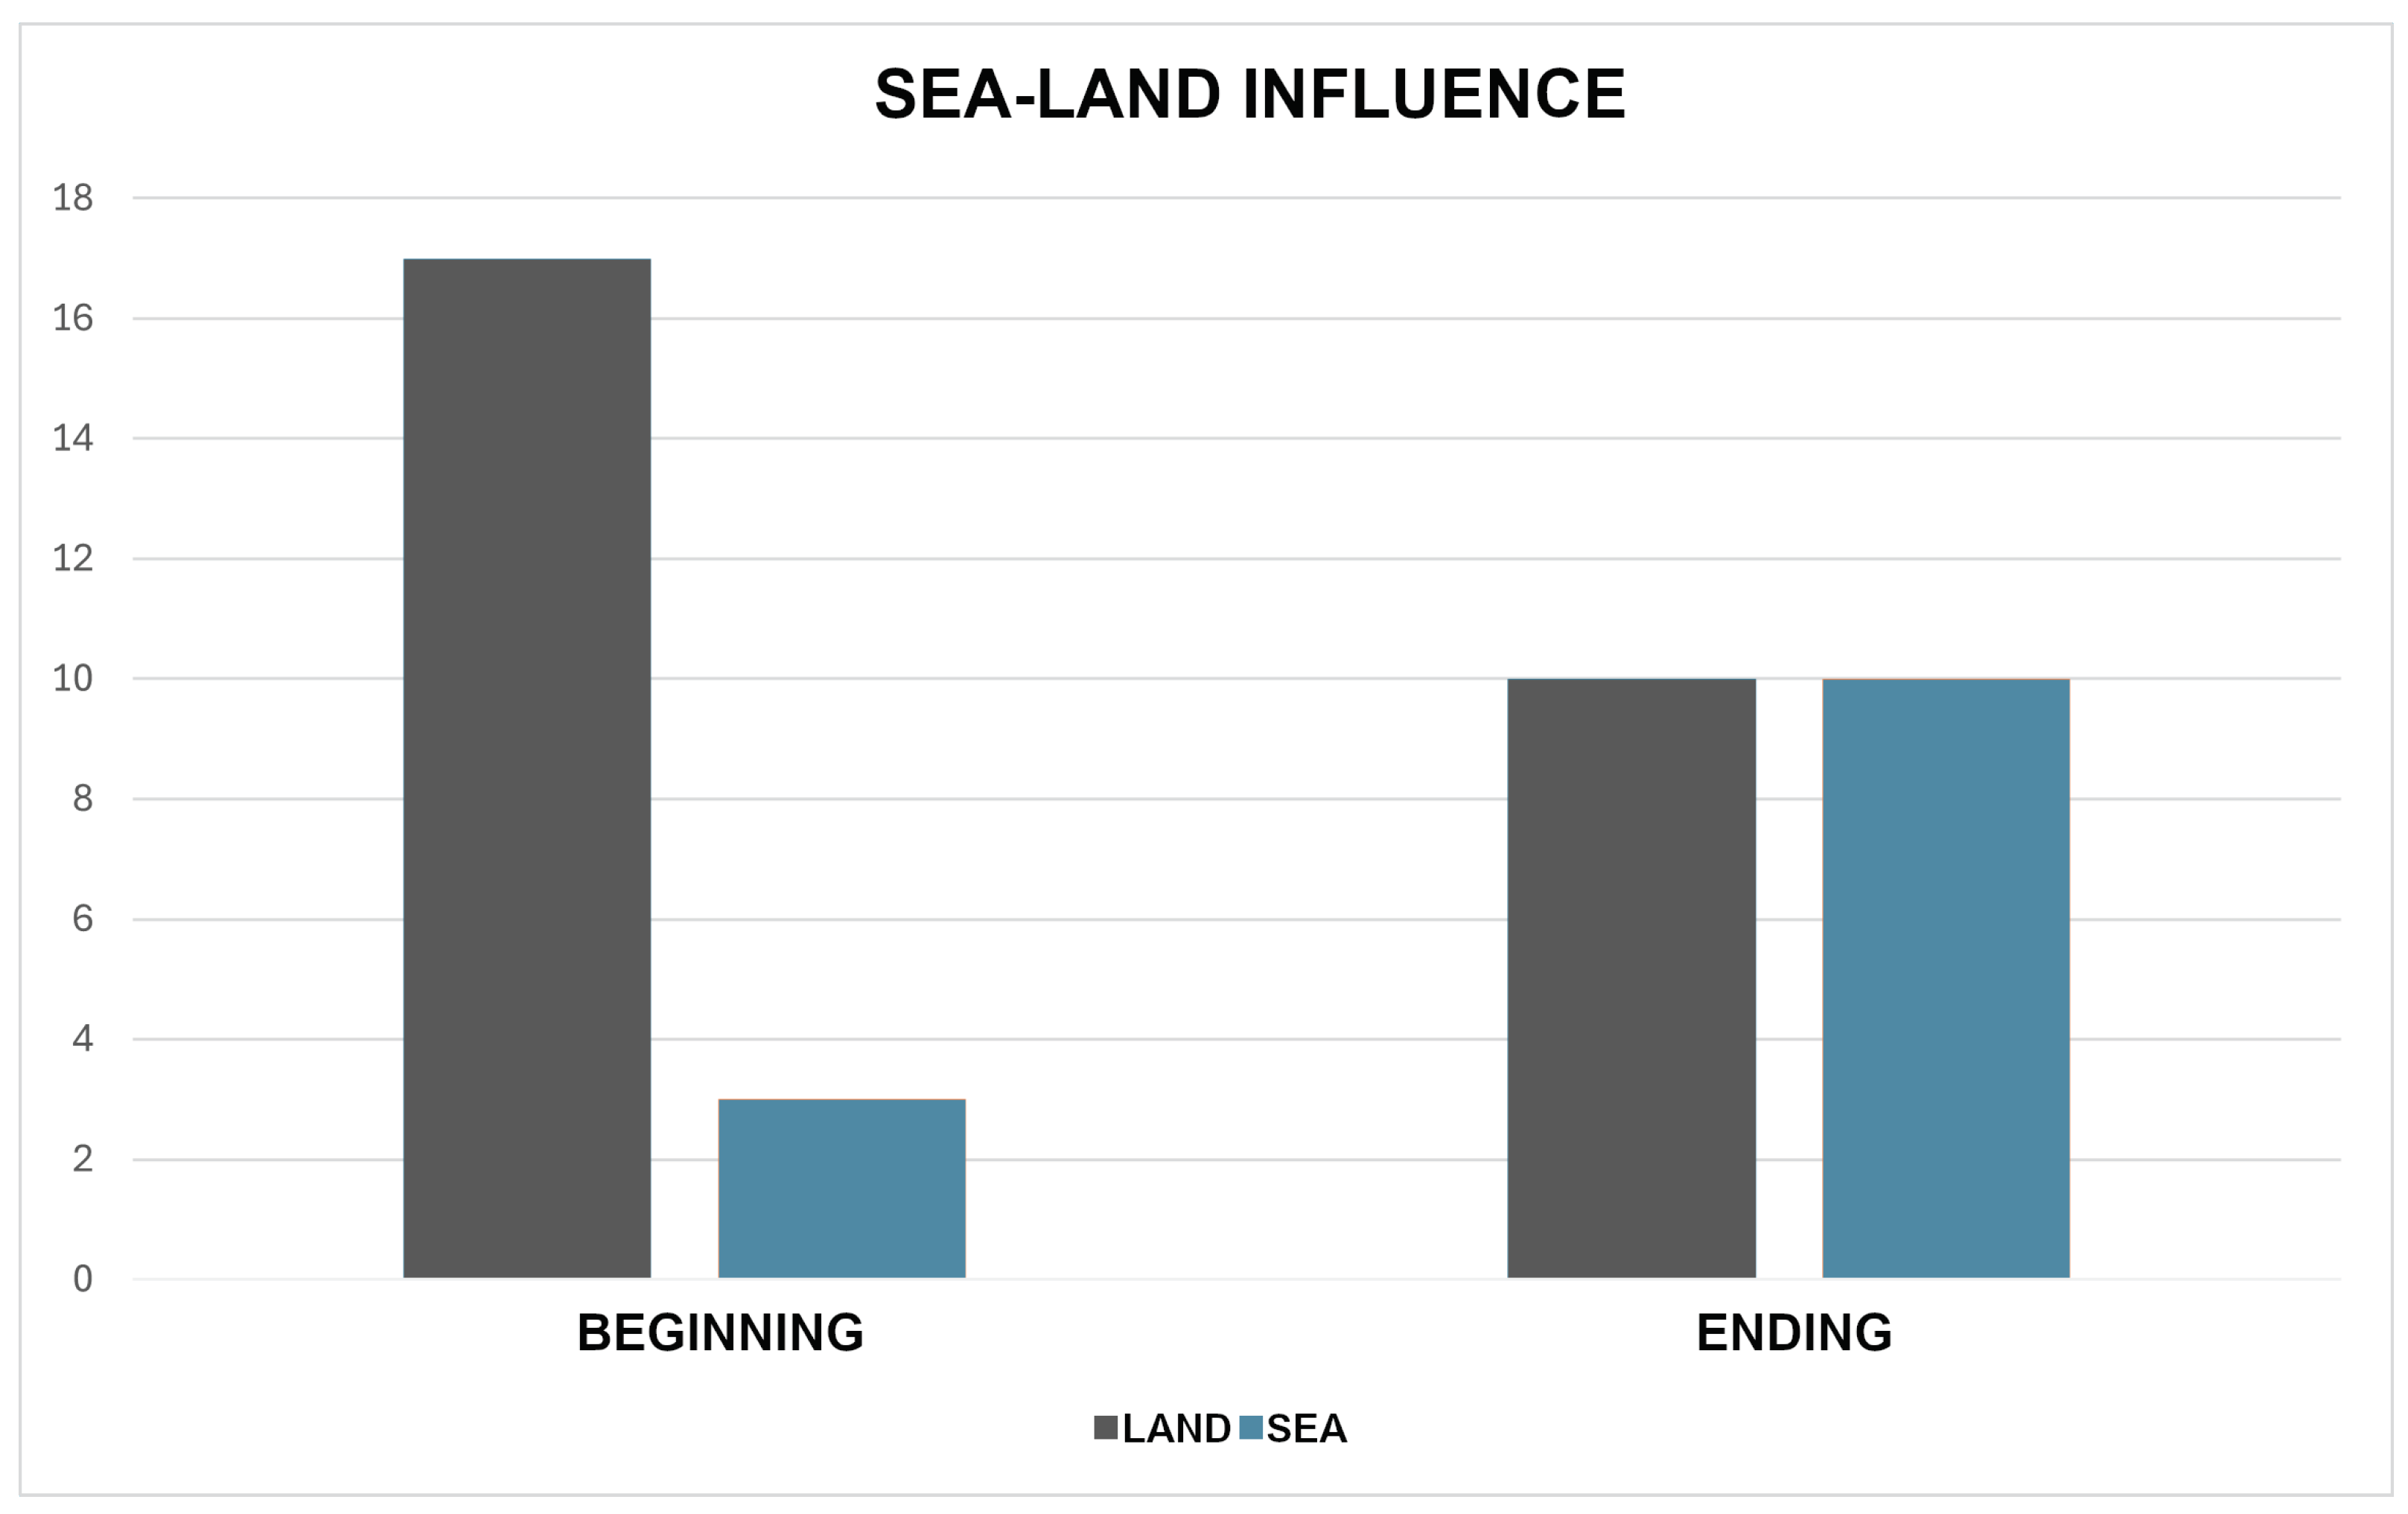
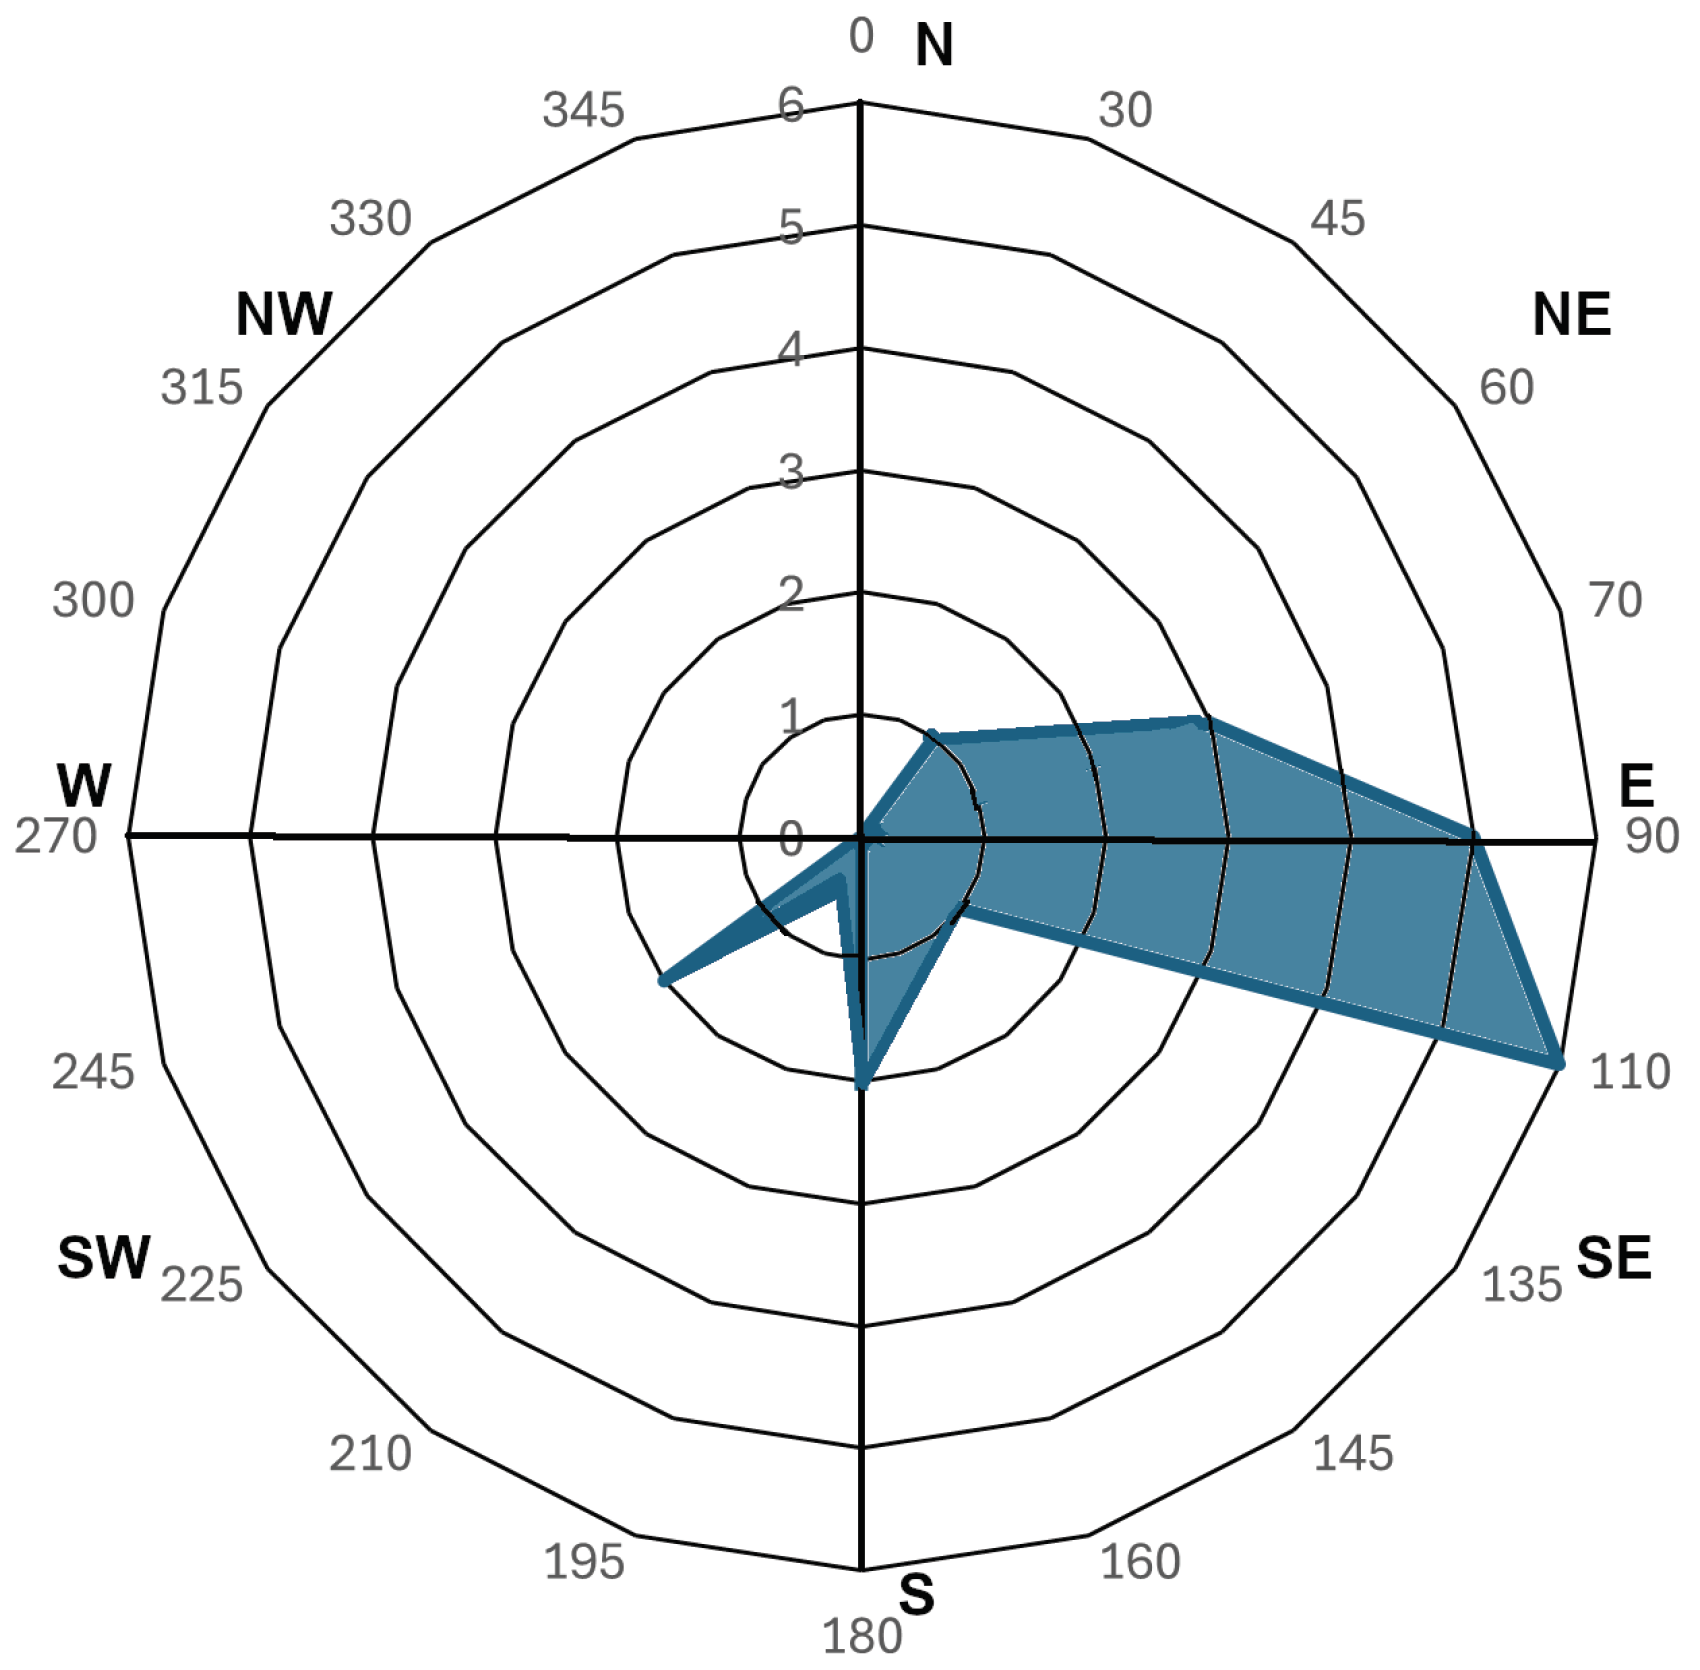
Figure 9 and Figure 10 help to better understand the previous QLCS motion patterns. The first figure shows how most of the QLCSs developed over land, and only three of them formed over the Mediterranean. However, a half of them concluded their life cycle over the sea. There are two causes of this result. First, the environment over sea is less conductive to strong convection than over land, but it can maintain convection for a longer period. Furthermore, convection can also initiate over the sea and move over land. These two points were treated by del Moral et al. (2020) [50] in the region of study or [5,6] in other parts of the world. Figure 10 explains the second cause: the presented wind rose in this figure shows the case number with each principal direction. It is necessary to bear in mind that the main direction results from the complete trajectory, but in most cases, the QLCS changed their direction at least twice. The main observed result is that fourteen of the twenty structures moved between ENE and ESE, that is, with eastern propagation. This is indicative that the general flow over Catalonia dominates the QLCS propagation. However, it is important to bear in mind that thunderstorms propagate perpendicular to the main QLCS direction, usually from sea to land. Then, these cases are conductive to heavy-rain leading to flash floods if the QLCS moves slow, following the convective train model [39,51].

4. Discussion

The objective of the presented research is to answer four questions. In this section, we try to give an answer to each question and discuss the results in any case. The first point to investigate is the possibility of detecting QLCS using remote sensing in the area of study. After analysing the results, we have validated them using the visual inspection of multiple planar radar imagery. There are indeed some doubtful cases (seven) in which the algorithm did not label a structure as a QLCS because the thresholds are restrictive, coinciding with previous research such as Surowiecki et al. (2024) [24] or Haberlie et al. (2020) [7]. The methodology used combines the theoretical definition obtained from different references (Ashley et al. (2019) [6], Carey et al. (2005) [17]) with the identification techniques based on using remote sensing data (Parker and Johnson, 2004 [26], Ashley et al. (2019) [6], and Surowiecki et al. (2024) [24]. Then, it is possible to identify and track QLCSs along their life cycle. However, some systems have not been fully tracked because of the limited area selected and the long path that some of the QLCSs can reach [6,24]. In any case, this is the first work developed in this way in Southern Europe, and we encourage other researchers to perform similar analysis in other regions to provide more information to compare and improve the knowledge about QLCS. Because of the difficulty of a validation procedure similar to those such as the procedures for the identification of hailstorms or supercells, which can be compared to ground registers, calculating some skill scores has been rendered impossible. In any case, we agree with Ashley et al. (2019) [6] in that the current techniques cannot improve “the skill of an experienced and engaged research or operational meteorologist with several datasets at their disposal”.
The second question that we asked was how usual the QLCSs in Catalonia and the surrounding area are. We have detected twenty systems for the period 2013–2023, which corresponds to a mean value of 1.8 cases per year. However, it is important to note that there exists a high variability between the different years, with some cases without any QLCS (2020 and 2021), four with one or two, and five years (2015, 2016, 2018, 2022, and 2023) with three systems. Considering that the total area in this research is 175,500 km2, the relative value is 1.036 × 10⁻⁵ systems/year × km2. This value is quite a bit less than the 3.209 × 10⁻⁵ systems/year × km2 obtained by Surowiecki et al. (2024) [24] for the entirety of Europe. However, the difference probably corresponds to two factors: first, they found that Catalonia and the northeastern part of the Iberian Peninsula have values far from the maximum, which corresponds to the line between Central France and Southern Denmark, as well as Hungary and neighbouring countries. The other factor is that these authors can better follow structures moving in the proximity of the studied area because of the longer range of the radar field. In any case, our results concur with European climatology and confirm that the number of cases is reduced but not far reduced when compared with other regions (e.g., 1.526 × 10⁻⁵ systems/year × km2 in the United States of America [6]).
The third point of interest was the identification of the most common features of these structures. We can summarise them in the following items:
  • Most of the systems developed over land but half dissipated over the Mediterranean Sea.
  • The predominant direction was from west to east. However, an important percentage did not move in a straight path.
  • Most of the cases (85 %) occurred between July and October, and the rest occurred in June and November.
  • There were two different behaviours regarding the time of occurrence: according to the diurnal convective cycle (land systems) and nocturnal structures (mainly occurring over the sea).
  • The length path moved between 125 and 425 km, while the duration ranged between 192 and 510 min. In consequence, the average speed was 45.4 km/h.
  • The maximum reflectivity usually (70 %) took place in the first third of the life cycle while the maximum lightning activity occurred later, in most cases around half of the duration of the QLCS. Also, it is important to remark that lightning activity continued in practically the entire life cycle and for the whole set of cases.
Considering those previous points, we asked finally about the similarities and differences with other studies. In the case of Catalonia, it has been observed that QLCSs are more intense and have higher lightning activity than all other categories of MCSs (Rigo et al., 2019 [36]). Regarding the period of occurrence, there were also differences with general Catalan MCSs but also with QLCSs in the United States of America (April to August, [6]). However, the result is very similar to that of the rest of Europe (with a summer peak, [24]). In the case of the dominant hours, there were coincidences with the rest of Europe and differences with cases in the United States. Then, it is probable that the meteorological triggers are different between both regions. Finally, the main direction, length, duration, and speed were very similar in general terms to the other European cases. In any case, the highest differences remain in the extreme cases because of the limitations of the system coverage.

5. Conclusions

To conclude this research, we can summarise our findings in the following points:
  • We have shown how it is possible to detect QLCSs with remote sensing (radar and lightning flashes), even in limited covered areas. The main drawback is that some structures are not completely followed, because these systems can last for many hours and cross long paths.
  • The results are very similar to the results obtained for other regions, but in particular with the main European climatology.
  • We can distinguish between two main behaviours: diurnal and nocturnal QLCSs.
  • Land and sea play important roles in the development, evolution, and dissipation of QLCSs.
Finally, we want to cite future research building upon the results obtained in this work:
  • Identification of lightning jumps and severe weather phenomena in QLCSs to compare to other convective modes and provide a forecast guide;
  • Characterization of the environments where the QLCSs occur in Catalonia, both in the mesoscale and the synoptic environments, to improve the knowledge and capability of forecasting in real-time surveillance tasks;
  • Detection of discriminant signatures, such as the Mesoscale Convective Vortex or the cold pool;
  • Combination of the presented method with overshooting signature data observed using satellites.

Author Contributions

Conceptualization, T.R. and C.F; methodology, T.R. and C.F.; software, T.R.; validation, C.F.; formal analysis, T.R.; investigation, T.R. and C.F.; data curation, T.R.; writing—original draft preparation, T.R.; writing—review and editing, C.F.; visualization, T.R. and C.F. All authors have read and agreed to the published version of the manuscript.

Funding

This research received no external funding.

Data Availability Statement

Data are available on request due to privacy reasons.

Acknowledgments

The authors want to thank to the Meteorological Service of Catalonia for the data provided.

Conflicts of Interest

The authors declare no conflicts of interest.

Abbreviations

The following abbreviations are used in this manuscript:
MCSMesoscale Convective System
MCVMesoscale Convective Vortex
QLCSQuasi-Linear Convective System
MCCMesoscale Convective Complex
TSTrailing Stratiform line
LSLeading Stratiform line
PSParallel Stratiform line
CGcloud-to-ground
TLTotal Lightning
+CGPositive Cloud-to-Ground
−CGNegative Cloud-to-Ground
CTCloud Top
FRFlash Rate
IRinfra-red
BTBrightness Temperature
XRADXarxa de Radars (Radar Network)
XDDEXarxa de Detectors de Descàrregues Elèctriques (Lightning Location Detection System)
VHFVery high frequency
LFLow frequency
ICIntra-cloud
PPIPlan Position Indicator
CAPPIConstant Altitude Plan Position Indicator

References

  1. Houze, R.A., Jr. Mesoscale convective systems. Rev. Geophys. 2004, 42, RG4003. [Google Scholar] [CrossRef]
  2. Houze, R.A., Jr. Mesoscale convective systems. Int. Geophys. 2014, 104, 237–286. [Google Scholar]
  3. Schumacher, R.S.; Rasmussen, K.L. The formation, character and changing nature of mesoscale convective systems. Nat. Rev. Earth Environ. 2020, 1, 300–314. [Google Scholar] [CrossRef]
  4. Hitchcock, S.M.; Lane, T.P. Two Quasi-Linear Convective Systems, Their Mesoscale Structure and Moisture Sources. Mon. Weather Rev. 2023, 151, 663–688. [Google Scholar] [CrossRef]
  5. Schumacher, R.S. Mechanisms for quasi-stationary behavior in simulated heavy-rain-producing convective systems. J. Atmos. Sci. 2009, 66, 1543–1568. [Google Scholar] [CrossRef]
  6. Ashley, W.S.; Haberlie, A.M.; Strohm, J. A climatology of quasi-linear convective systems and their hazards in the United States. Weather Forecast 2019, 34, 1605–1631. [Google Scholar] [CrossRef]
  7. Haberlie, A.M.; Ashley, W.S.; Karpinski, M.R. Mean storms: Composites of radar reflectivity images during two decades of severe thunderstorm events. Int. J. Climatol. 2021, 41, E1738–E1756. [Google Scholar] [CrossRef]
  8. Lovell, L.T.; Parker, M.D. Simulated QLCS vortices in a high-shear, low-CAPE environment. Weather Forecast 2022, 37, 989–1012. [Google Scholar] [CrossRef]
  9. Lyza, A.W.; Clayton, A.W.; Knupp, K.R.; Lenning, E.; Friedlein, M.T.; Castro, R.L.; Bentley, E.S. Analysis of Mesovortex Characteristics, Behavior, and Interactions during the Second 30 June-1 July 2014 Midwestern Derecho Event. E-J. Sev. Storms Meteorol. 2017, 12, 1–33. [Google Scholar] [CrossRef]
  10. Marion, G.R.; Trapp, R.J. Controls of quasi-linear convective system tornado intensity. J. Atmos. Sci. 2021, 78, 1189–1205. [Google Scholar] [CrossRef]
  11. Brown, M.C.; Marion, G.R.; Coniglio, M.C. Influence of Low-Level Shear Orientation and Magnitude on the Evolution and Rotation of Idealized Squall Lines. Part I: Storm Morphology and Bulk Updraft/Mesovortex Attributes. Mon. Weather Rev. 2024, 152, 2089–2110. [Google Scholar] [CrossRef]
  12. Gibbs, J.G. Evaluating Precursor Signals for QLCS Tornado and Higher Impact Straight-Line Wind Events. J. Oper. Meteorol. 2021, 9, 62–75. [Google Scholar] [CrossRef]
  13. McDonald, J.M.; Weiss, C.C. Cold pool characteristics of tornadic quasi-linear convective systems and other convective modes observed during VORTEX-SE. Mon. Weather Rev. 2021, 149, 821–840. [Google Scholar] [CrossRef]
  14. Murphy, T.A.; Stetzer, T.M.; Walker, L.; Fricker, T.; Bryant, B.; Woodrum, C. Analysis of the 12 April 2020 Northern Louisiana Tornadic QLCS. J. Oper. Meteorol. 2022, 10, 43–62. [Google Scholar] [CrossRef]
  15. Parker, M.D.; Johnson, R.H. Organizational modes of midlatitude mesoscale convective systems. Mon. Weather Rev. 2000, 128, 3413–3436. [Google Scholar]
  16. Correoso, J.F.; Hernández, E.; García-Herrera, R.; Barriopedro, D.; Paredes, D. A 3-year study of cloud-to-ground lightning flash characteristics of Mesoscale convective systems over the Western Mediterranean Sea. Atmos. Res. 2006, 79, 89–107. [Google Scholar]
  17. Carey, L.D.; Murphy, M.J.; McCormick, T.L.; Demetriades, N.W. Lightning location relative to storm structure in a leading-line, trailing-stratiform mesoscale convective system. J. Geophys. Res. Atmos. 2005, 110, D03105. [Google Scholar]
  18. Ringhausen, J.; Chmielewski, V.; Calhoun, K. Inter-Comparison of Lightning Measurements in Quasi-Linear Convective Systems. Atmosphere 2024, 15, 309. [Google Scholar] [CrossRef]
  19. Parker, M.D.; Rutledge, S.A.; Johnson, R.H. Cloud-to-ground lightning in linear mesoscale convective systems. Mon. Weather Rev. 2001, 129, 1232–1242. [Google Scholar]
  20. Wang, F.; Liu, H.; Dong, W.; Zhang, Y.; Yao, W.; Zheng, D. Radar reflectivity of lightning flashes in stratiform regions of mesoscale convective systems. J. Geophys. Res. Atmos. 2019, 124, 14114–14132. [Google Scholar] [CrossRef]
  21. Goodnight, J.S.; Chehak, D.A.; Trapp, R.J. Quantification of QLCS tornadogenesis, associated characteristics, and environments across a large sample. Weather Forecast 2022, 37, 2087–2105. [Google Scholar] [CrossRef]
  22. Conrad, D.M.; Knupp, K.R. Doppler radar observations of horizontal shearing instability in quasi-linear convective systems. Mon. Weather Rev. 2019, 147, 1297–1318. [Google Scholar] [CrossRef]
  23. Thompson, R.L.; Smith, B.T.; Grams, J.S.; Dean, A.R.; Broyles, C. Convective modes for significant severe thunderstorms in the contiguous United States. Part II: Supercell and QLCS tornado environments. Weather Forecast 2012, 27, 1136–1154. [Google Scholar] [CrossRef]
  24. Surowiecki, A.; Pilguj, N.; Taszarek, M.; Piasecki, K.; Púčik, T.; Brooks, H.E. Quasi-linear convective systems and derechoes across Europe: Climatology, accompanying hazards and societal impacts. Bull. Am. Meteorol. Soc. 2024, 105, E1619–E1643. [Google Scholar] [CrossRef]
  25. Schumacher, R.S.; Johnson, R.H. Organization and environmental properties of extreme-rain-producing mesoscale convective systems. Mon. Weather Rev. 2005, 133, 961–976. [Google Scholar] [CrossRef]
  26. Parker, M.D.; Johnson, R.H. Structures and dynamics of quasi-2D mesoscale convective systems. J. Atmos. Sci. 2004, 61, 545–567. [Google Scholar] [CrossRef]
  27. Wang, F.; Zhang, Y.; Liu, H.; Yao, W.; Meng, Q. Characteristics of cloud-to-ground lightning strikes in the stratiform regions of mesoscale convective systems. Atmos. Res. 2016, 178, 207–216. [Google Scholar] [CrossRef]
  28. Surowiecki, A.; Taszarek, M. A 10-year radar-based climatology of mesoscale convective system archetypes and derechos in Poland. Mon. Weather Rev. 2020, 148, 3471–3488. [Google Scholar] [CrossRef]
  29. Bech, J.; Arús, J.; Castán, S.; Pineda, N.; Rigo, T.; Montanyà, J.; van der Velde, O. A study of the 21 March 2012 tornadic quasi linear convective system in Catalonia. Atmos. Res. 2015, 158, 192–209. [Google Scholar] [CrossRef]
  30. López, J.M. A Mediterranean derecho: Catalonia (Spain), 17th August 2003. Atmos. Res. 2007, 83, 272–283. [Google Scholar] [CrossRef]
  31. Ramis, C.; Llasat, M.C.; Genovés, A.; Jansà, A. The October-1987 floods in Catalonia: Synoptic and mesoscale mechanisms. Meteorol. Appl. 1994, 1, 337–350. [Google Scholar] [CrossRef]
  32. Romero, R.; Ramis, C.; Homar, V. On the severe convective storm of 29 October 2013 in the Balearic Islands: Observational and numerical study. Q. J. R. Meteorol. Soc. 2015, 141, 1208–1222. [Google Scholar] [CrossRef]
  33. Rigo, T.; Llasat, M. Radar analysis of the life cycle of Mesoscale Convective Systems during the 10 June 2000 event. Nat. Hazards Earth Syst. Sci. 2005, 5, 959–970. [Google Scholar] [CrossRef]
  34. Rigo, T.; Llasat, M. A methodology for the classification of convective structures using meteorological radar: Application to heavy rainfall events on the Mediterranean coast of the Iberian Peninsula. Nat. Hazards Earth Syst. Sci. 2004, 4, 59–68. [Google Scholar] [CrossRef]
  35. Rigo, T.; Llasat, M.C. Analysis of mesoscale convective systems in Catalonia using meteorological radar for the period 1996–2000. Atmos. Res. 2007, 83, 458–472. [Google Scholar] [CrossRef]
  36. Rigo, T.; Berenguer, M.; del Carmen Llasat, M. An improved analysis of mesoscale convective systems in the western Mediterranean using weather radar. Atmos. Res. 2019, 227, 147–156. [Google Scholar] [CrossRef]
  37. Bech, J.; Pineda, N.; Rigo, T.; Aran, M. Remote sensing analysis of a Mediterranean thundersnow and low-altitude heavy snowfall event. Atmos. Res. 2013, 123, 305–322. [Google Scholar] [CrossRef]
  38. Farnell, C.; Rigo, T.; Pineda, N. Lightning jump as a nowcast predictor: Application to severe weather events in Catalonia. Atmos. Res. 2017, 183, 130–141. [Google Scholar] [CrossRef]
  39. Llasat, M.C.; Marcos, R.; Turco, M.; Gilabert, J.; Llasat-Botija, M. Trends in flash flood events versus convective precipitation in the Mediterranean region: The case of Catalonia. J. Hydrol. 2016, 541, 24–37. [Google Scholar] [CrossRef]
  40. van der Velde, O.A.; Montanyà, J.; Soula, S.; Pineda, N.; Mlynarczyk, J. Bidirectional leader development in sprite-producing positive cloud-to-ground flashes: Origins and characteristics of positive and negative leaders. J. Geophys. Res. Atmos. 2014, 119, 12–755. [Google Scholar] [CrossRef]
  41. Rigo, T.; Castillo, S. Evolution of Radar and Lightning Variables in Convective Events in Barcelona and Surroundings for the Period 2006–2020. Adv. Environ. Eng. Res. 2021, 2, 1–18. [Google Scholar] [CrossRef]
  42. R Core Team. R: A Language and Environment for Statistical Computing; R Foundation for Statistical Computing: Vienna, Austria, 2022. [Google Scholar]
  43. Hijmans, R.J. raster: Geographic Data Analysis and Modeling; R Package Version 3.6-3; R Foundation for Statistical Computing: Vienna, Austria, 2022. [Google Scholar]
  44. Bivand, R.; Keitt, T.; Rowlingson, B. rgdal: Bindings for the ‘Geospatial’ Data Abstraction Library. R Package Version 1.6-2; R Foundation for Statistical Computing: Vienna, Austria, 2022. [Google Scholar]
  45. Ligges, U.; Mächler, M. Scatterplot3d—An R Package for Visualizing Multivariate Data. J. Stat. Softw. 2003, 8, 1–20. [Google Scholar] [CrossRef]
  46. Jackson, A.L.; Parnell, A.C.; Inger, R.; Bearhop, S. Comparing isotopic niche widths among and within communities: SIBER—Stable Isotope Bayesian Ellipses in R. J. Anim. Ecol. 2011, 595–602. [Google Scholar] [CrossRef]
  47. Gama, J.; Chernov, N. conicfit: Algorithms for Fitting Circles, Ellipses and Conics Based on the Work by Prof. Nikolai Chernov; R Package Version 1.0.4; R Foundation for Statistical Computing: Vienna, Austria, 2015. [Google Scholar]
  48. Trapero, L.; Bech, J.; Rigo, T.; Pineda, N.; Forcadell, D. Uncertainty of precipitation estimates in convective events by the Meteorological Service of Catalonia radar network. Atmos. Res. 2009, 93, 408–418. [Google Scholar] [CrossRef]
  49. Montanyà, J.; Pineda, N.; March, V.; Illa, A.; Romero, D.; Solà, G. Experimental evaluation of the Catalan lightning detection network. In Proceedings of the 19th International Lightning Detection Conference, Tucson, AZ, USA, 24–25 April 2006. [Google Scholar]
  50. del Moral, A.; del Carmen Llasat, M.; Rigo, T. Connecting flash flood events with radar-derived convective storm characteristics on the northwestern Mediterranean coast: Knowing the present for better future scenarios adaptation. Atmos. Res. 2020, 238, 104863. [Google Scholar] [CrossRef]
  51. Doswell, C.A., III. Severe convective storms—An overview. In Severe Convective Storms; American Meteorological Society: Boston, MA, USA, 2001; pp. 1–26. [Google Scholar]
Figure 1. The area of study (shaded rectangle) that comprises Catalonia and its surrounding area. The blue and red dots indicate the location of the lightning detectors and radar of the Servei Meteorològic de Catalunya networks, respectively.
Remotesensing 16 04262 g001
Figure 2. Cloud-to-ground (red dots correspond to positive or +CG while blue points indicate negative or −CG) flashes detected between 17.00 and 18.00 UTC of 19 October 2018.
Remotesensing 16 04262 g002
Figure 3. Radar composite of the CAPPI at 1 km height at 18.00 UTC of 19 October 2018. The dashed bold line delimits the convective region associated with a QLCS after applying the methodology.
Remotesensing 16 04262 g003
Figure 4. Lightning structure (shaded green area) at 18.00 UTC of 19 October 2018.
Remotesensing 16 04262 g004
Figure 5. The structure (shaded brown area) identified after applying the algorithm to the radar imagery at 18.00 UTC of 19 October 2018. This structure verified three of the four points introduced in the text: intensity, length and linearity. If the structure lasted for more than three hours, then it could be labelled as a QLCS.
Remotesensing 16 04262 g005
Figure 6. Composite of the radar data (shaded areas), lightning flashes (blue and red dots), and ellipses indicating the QLCS identification for different times (14.00, 16.00, 18.00, and 20.00 UTC) of 19 October 2018.
Remotesensing 16 04262 g006
Figure 7. Scheme of the process followed for identifying the QLCS in the area of study.
Remotesensing 16 04262 g007
Figure 8. Spatial density of the QLCS and the simplified paths of each one (purple lines).
Remotesensing 16 04262 g008
Figure 9. Sea and land influence at the beginning and ending of the QLCS.
Remotesensing 16 04262 g009
Figure 10. Mean propagation vector for the set of QLCSs detected.
Remotesensing 16 04262 g010
Table 1. Main features (date, duration, and length of the trajectory) of the QLCS identified during the study.
Date (Day Month Year)Duration (min)Path Length (km)
4 October 2013376360
7 July 2014205384
31 July 2015341456
17 August 2015237354
3 September 2015229336
22 July 2016127252
6 October 2016273312
23 November 2016206336
18 October 2017182336
9 August 2018195228
6 September 2018200192
19 October 2018210216
10 September 2019207288
22 October 2019347372
5 August 2022204360
31 August 2022305324
23 September 2022422510
29 June 2023358468
29 June 2023223432
27 July 2023292372
Table 2. Max and mean values for different variables of the different QLCS: Zmx (maximum reflectivity during the life cycle), Zmn (median reflectivity during the life cycle), InsZmx (normalised time when the maximum reflectivity occurs), length (longitude of the trajectory), duration (time of the life cycle), speed (storm motion), DOY (day of the year), TimeIni (initial hour), TimeEnd (final hour), month, TLmx (maximum number of TL/6 min during the path), TLmn (mean number of TL/6 min during the path), InsTLmx (Normalised time when the maximum TL occurred), CG+mx (maximum number of positive CG/6 min during the path), CG+mn (mean number of positive CG/6 min during the path), InsCG+mx (normalised time when maximum number of positive CG occurred), CG−mx (maximum number of negative CG/6 min during the path), CG−mn (mean number of negative CG/6 min during the path), InsCG−mx (normalised time when maximum number of negative CG occurred), and NT T L > 0 (percentage of normalised time with TL occurrence).
Zmx (dBZ)Zmn (dBZ)InsZmx (%)Length (km)Duration (min)Speed (km/h)DOYTimeIniTimeEndMonth
MAX57.053.686.7422.4510.062.7327.019.023.011.0
MEAN53.649.928.1256.8344.445.4242.010.214.88.5
TLmxTLmnInsTLmx (%)CG+mxCG+mnInsCG+mx (%)CG−mxCG−mnInsCG−mx (%) NT T L > 0 (%)
MAX666.0361.586.9452.0201.1100.0487.0160.4100.0100.0
MEAN262.1137.051.1124.955.958.6177.881.150.897.5
Disclaimer/Publisher’s Note: The statements, opinions and data contained in all publications are solely those of the individual author(s) and contributor(s) and not of MDPI and/or the editor(s). MDPI and/or the editor(s) disclaim responsibility for any injury to people or property resulting from any ideas, methods, instructions or products referred to in the content.