Article

Changes in Urban Green Spaces in the Pearl River Delta Urban Agglomeration: From the Perspectives of the Area, Spatial Configuration, and Quality

1
Key Laboratory of Earth Surface System and Human-Earth Relations, Ministry of Natural Resources of China, Shenzhen Graduate School, Peking University, Shenzhen 518055, China
2
Guangzhou Institute of Geography, Guangdong Academy of Sciences, Guangzhou 510070, China
*
Author to whom correspondence should be addressed.
Remote Sens. 2024, 16(23), 4369; https://doi.org/10.3390/rs16234369
Submission received: 14 September 2024 / Revised: 27 October 2024 / Accepted: 19 November 2024 / Published: 22 November 2024

Abstract

:
Urban green spaces (UGSs) are integral to urban ecosystems, providing multiple benefits to human well-being. However, previous studies mainly focus on the quantity or quality of UGSs, with less emphasis on a comprehensive analysis. This study systematically examined the spatiotemporal UGS dynamics in the Pearl River Delta urban agglomeration (PRDUA) in China from the perspectives of the area, spatial configuration, and quality, using the high spatial resolution (30 m) Landsat-derived land-cover data and Normalized Difference Vegetation Index (NDVI) data during 1985–2021. Results showed the UGS area in both the old urban districts and expanded urban areas across all nine cities in the PRDUA has experienced a dramatic reduction from 1985 to 2021, primarily due to the conversion of cropland and forest into impervious surfaces. Spatially, the fragmentation trend of UGSs initially increased and then weakened around 2010 in nine cities, but with an inconsistent fragmentation process across different urban areas. In the old urban districts, the fragmentation was mainly due to the loss of large patches; in contrast, it was caused by the division of large patches in the expanded urban areas of most cities. The area-averaged NDVI showed a general upward trend in urban areas in nearly all cities, and the greening trend in the old urban districts was more prevalent than that in the expanded urban areas, suggesting the negative impacts of urbanization on NDVI have been balanced by the positive effects of climate change, urbanization, and greening initiatives in the PRDUA. These findings indicate that urban greening does not necessarily correspond to the improvement in UGS states. We therefore recommend incorporating the three-dimensional analytical framework into urban ecological monitoring and construction efforts to obtain a more comprehensive understanding of UGS states and support effective urban green infrastructure stewardship.

1. Introduction

Urbanization is a prevalent and ongoing process worldwide. According to the World Urbanization Prospects 2018 report, the global population reached 7.6 billion, with 55.26% residing in urban areas; it is projected that by 2050, the global population will reach 9.7 billion, with 68% living in urban areas [1]. Therefore, sustainable urban development is closely linked to the future of humanity [2]. Urban green spaces (UGSs), which include all vegetation-covered areas in the city, ranging from natural to artificial ecological systems with vegetation, play a crucial role in urban sustainability. They offer multiple benefits to humans, such as climate regulation [3,4,5], air quality improvement [6,7], biodiversity conservation [8,9,10], carbon sequestration [11], waterlogging control [12], and positive effects on the physical and mental health of urban residents [13,14,15]. Consequently, UGSs have been recognized as a key factor in promoting urban sustainability. Therefore, understanding the spatiotemporal dynamics of UGSs is important for ensuring sustainable urban development.
UGSs are confronted with increasing challenges, due to ongoing urbanization and climate change [16,17]. For example, urbanization has transformed a significant amount of natural or semi-natural surfaces into impervious surfaces, resulting in the reduction and fragmentation of UGSs, as well as plant species loss [17,18]. Furthermore, urbanization can indirectly affect urban vegetation growth by triggering the urban heat-island effect [19], the changes in the hydrological cycle and the atmospheric environment [20,21]. Studies showed that the urban heat-island effect generally exerted a positive influence on vegetation by extending the vegetation growing season [21,22,23]. Additionally, the relatively elevated concentration of CO2 and nitrogen deposition in urban areas enhanced vegetation growth [21]. To better protect and utilize UGSs, numerous nations have implemented diverse greening initiatives, such as urban-greening policies, forest city development plans, etc. [24,25,26]. Affected by these initiatives, the reduction in, and degradation of, UGSs have been controlled to varying degrees, and even reversed in some places [27,28].
Although extensive research has been conducted on UGSs, there are certain limitations. Firstly, prevailing research primarily concentrates on variations in the area or quality of UGSs, disregarding spatial structural and not carrying out a comprehensive analysis [28]. However, quantity, quality, and spatial structure all play an important role in the socio-ecological functioning of UGSs. For example, an increased proportion of edges can enhance the complexity of UGS, thereby facilitating equitable access to UGSs [29]; vegetation density is identified as the dominant driver for the cooling effect of UGSs, and dispersed small UGSs are shown to have a great potential for cooling effects [30]. Secondly, the time span of land use/cover data and vegetation index data used as a quality indicator in the research are relatively short, thus constraining the understanding of long-term UGS dynamics during the entire urbanization process [28]. In addition, previous studies mostly rely on coarse-resolution satellite data, such as the Moderate Resolution Imaging Spectroradiometer (MODIS, 500 m) or the Global Inventory Modeling and Mapping Studies (GIMMS, 8 km), which is not conducive to accurately grasping the detailed changes in UGSs. Hence, it is imperative to conduct a systematic analysis of UGS changes in terms of the area, spatial structure, and quality, using long-term and high-resolution data. Such an approach is crucial for scientific management of urban ecological environments and for promoting sustainable urban development.
The Pearl River Delta urban agglomeration (PRDUA), a vanguard of China’s reform and opening-up policy, has witnessed rapid urbanization and economic growth during the past few decades. Consequently, the PRDUA has become an ideal region for investigating the interplay between urbanization and the evolution of UGSs. With the urbanization and the implementation of ecological civilization construction policies, the land-use and land-cover across the PRDUA have undergone substantial changes, characterized by a dramatic increase in impervious surfaces and a decrease in UGSs [31,32]. Meanwhile, a general greening trend has been observed in the PRDUA since 2000, which was primarily attributed to human activities [33,34]. Although there has been substantial progress in the study of UGSs in the PRDUA, the time series and spatial resolution used in most studies are also relatively short and coarse, respectively. Additionally, the complete picture of dynamics in the area, spatial structure, and quality of UGSs in the PRDUA remains unclear. With this background, the study aims to conduct a systematic analysis of UGS changes in the PRDUA using long-term and high-resolution Landsat-derived data, from three dimensions: area, spatial structure, and quality. The outcomes will help to understand the process of UGS changes during the process of urbanization and provide support for sustainable urban development.

2. Materials and Methods
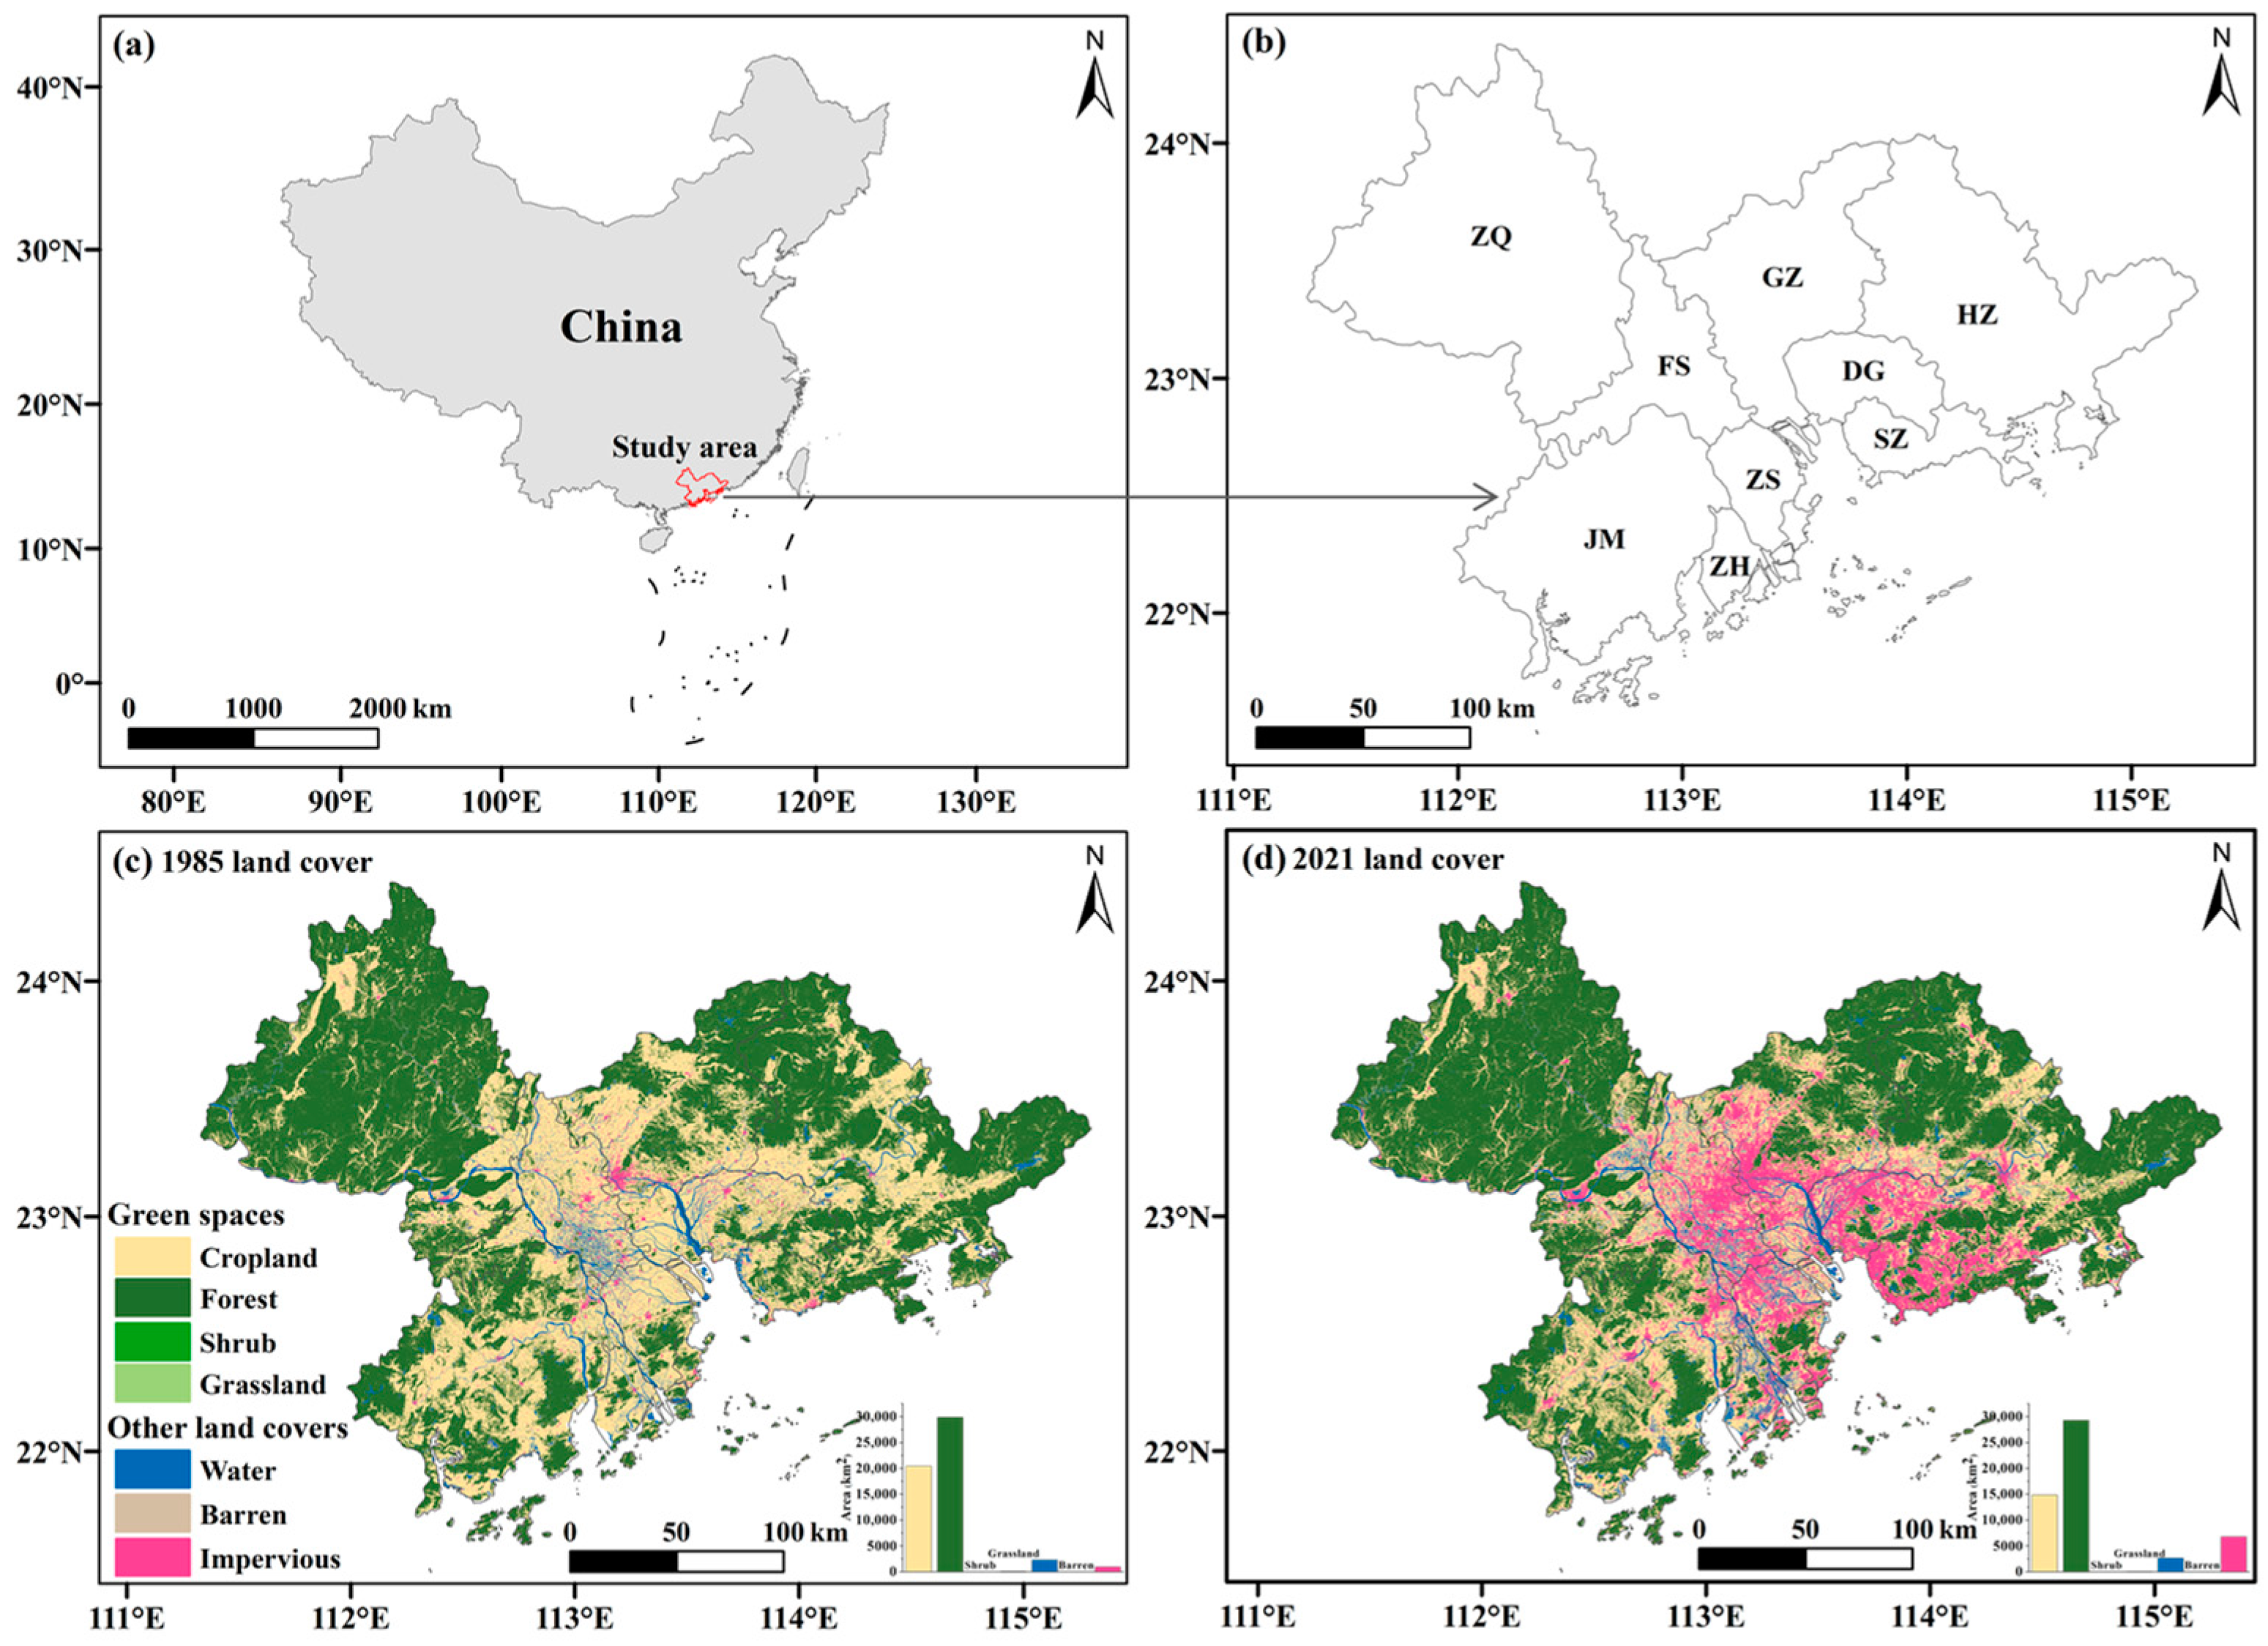
2.1. Study Area

The PRDUA is located in South China, with an area of 4.22 × 10⁴ km2. The PRDUA is one of the major urban agglomerations and economic centers in China, as well as the largest bay-area urban agglomeration in the world. It consists of nine cities in China (Figure 1), i.e., Guangzhou (GZ), Shenzhen (SZ), Zhuhai (ZH), Foshan (FS), Dongguan (DG), Zhongshan (ZS), Jiangmen (JM), Zhaoqing (ZQ), and Huizhou (HZ). The PRDUA is characterized by a subtropical monsoon climate, with a warm and wet environment, as well as changeable climate conditions. The annual mean temperature is 21–23 °C here, and the annual total precipitation amount is more than 1500 mm [35]. As a result, the region has a dense river network and abundant green spaces, primarily composed of forest and cropland. Since Shenzhen and Zhuhai were designated as China’s first Special Economic Zones in 1978, the PRDUA has become a hub for foreign trade and investment, leading to urban expansion with rapid economic development and population growth.
However, intensive human activities have also caused varying degrees of reduction and degradation in UGSs in the PRDUA (Figure 1 and Figure S1). To halt and reverse UGS loss and increase UGSs in pursuit of environmentally friendly urban development, the government has issued numerous urban ecological conservation and restoration policies since 1992, such as the ordinance for urban greening and returning farmland to forest and grassland [36]. Therefore, the PRDUA is a representative region for the interaction of human activities, climate change, and green spaces. Further, according to the Guangdong Statistical Yearbook, there are considerable disparities in urbanization and economic levels among nine cities in the study area. For example, in 2021, Shenzhen and Guangzhou’s GDP reached CNY 3.07 trillion and 2.7 trillion, respectively, while Foshan and Dongguan’s GDP were CNY 1.22 trillion and 1.09 trillion, respectively. The remaining five cities’ GDP ranged from CNY 265 billion to 498 billion. Given these differences, the dynamics in green spaces in different cities will be analyzed individually in this study.

2.2. Materials

The primary data used in this study include land cover, the Normalized Difference Vegetation Index (NDVI), and an urban boundary dataset. The subsequent sections provide a detailed introduction to each dataset.

2.2.1. Land-Cover Dataset

We used the China Land Cover Dataset (CLCD) developed by Yang and Huang (2021) to examine long-term interannual changes in area and spatial configuration of UGSs across the PRDUA [37]. The CLCD is the first annual land-cover dataset of China, derived from Landsat images and generated using the OpenAI Earth Engine (GEE) platform. The dataset covers a substantial period from 1985 to 2023, with a single data point (i.e., 1985) before 1990 and annual data available after 1990, and a spatial resolution of 30 m. The overall accuracy of the CLCD is 79.31%, which is better than many mainstream datasets such as MCD12Q1, ESACCI_LC, FROM_GLC, and GlobeLand30 [37]. Since its release, the CLCD has been widely used in the PRDUA and its adjacent areas [38,39,40,41,42,43]. For instance, Li et al. (2023) utilized the CLCD to analyze the impact of regional cooperation on the evolution of green spaces (i.e., forest and grassland) in the Guangdong–Hong Kong–Macao Greater Bay Area [38]. The paper introducing the CLCD has garnered significant attention, as evidenced by its citation count of 1296 (accessed through Web of Science on 11 September 2024). The CLCD is freely available at https://zenodo.org/records/8176941 (accessed on 1 August 2024). In this study, cropland, forest, shrub, and grassland were classified as green spaces.

2.2.2. NDVI Dataset

The NDVI is one of the most widely used indices for vegetation assessment [44]. Studies have demonstrated its efficacy in representing vegetation growing status [34,44]. Consequently, we selected NDVI as a proxy for UGS quality. Here, we utilized Landsat-derived NDVI data because of their capacity to detect changes in vegetation status, especially in small green spaces that may be overlooked by coarse-spatial-resolution land cover data [45]. In recent years, the Landsat-derived NDVI data have been increasingly used to characterize vegetation growth and assess ecological environmental conditions at fine spatial scales [46,47,48]. In this study, we utilized China’s annual maximum NDVI dataset, which spanned from 1986 to 2021 and featured a spatial resolution of 30 m. The dataset can be accessed at https://www.resdc.cn/DOI/DOI.aspx?DOIID=68 (accessed on 30 April 2024). Notably, the use of annual maximum NDVI data allows us to capture the optimal state of terrestrial vegetation, while mitigating noise interference from factors such as cloud cover and the influence of vegetation phenology on interannual NDVI trends [49]. Given the time span of NDVI data, the study period for this study was set between 1985 and 2021.

2.2.3. Urban Boundary Dataset

To investigate the effects of urbanization on UGSs, each city was delineated into the old urban districts, expanded urban areas, and rural areas using the urban boundary dataset. The urban boundary dataset was derived from the 30 m global artificial impervious surface data in Google Earth Engine, demonstrating high accuracy and covering a time span from 1990 to 2020 with a 5-year interval [50]. Notably, it has been extensively employed in previous studies [51,52,53]. The dataset was taken from the FROM-GLC research group of Tsinghua University (https://data-starcloud.pcl.ac.cn) (accessed on 7 March 2024). Considering the absence of urban boundary data for 1985 and 1986, and the minimal changes in urban boundaries in the PRDUA before 1990, we defined the urban boundary in 1990 as the old urban districts. Subsequently, the expanded urban areas in each city were determined by extending the urban boundary from 1990 to 2020, reflecting the continuous urbanization process in PRDUA. Finally, the remaining areas in 2020 for cities were identified as rural regions.

2.3. Methods

2.3.1. Transformation Matrix Method

The transformation matrix method is widely utilized in the analysis of land use/cover transitions within a specific study area during a given period. One of the primary strengths of this method lies in its ability to intricately depict the trajectory of land use/cover changes throughout the study duration. In this study, we employed the transformation matrix method to portray the state and dynamic process of each land-cover type between 1985 and 2021 in each city. The transformation matrix is typically represented in a two-dimensional table, as exemplified in Formula (1).
A i j = A 11 A 21 A m 1 A 12 A 22 A m 2 A 13 A 23 A m 3 A 14 A 24 A m 4 A 1 n A 2 n A m n
where i and j are the land-cover types at the start and end year of the study period, respectively; Aij is the area of the transformation from the ith land-cover type to the jth land-cover type. Given the readability, we used a Sankey chart here to visualize the transformation matrix.

2.3.2. Dynamic Degree Model

The dynamic degree model provides a quantitative depiction of the magnitude and direction of green-space changes during a given period. The model includes the single dynamic degree model and comprehensive dynamic degree model. In the present study, only the single dynamic degree model was used, as all types of green spaces were analyzed collectively in each city region. The green-space dynamic degree can be calculated as follows:
V = U b U a U a × 1 T × 100 %
where V is the dynamic degree of green spaces during the study period, and V > 0 signifies an expansion in the extent of green spaces, whereas V < 0 denotes a contraction in green spaces, and a larger absolute value of V indicates a more substantial change in the area of green spaces. Ua and Ub are the areas of green spaces at the beginning and end year of the study period, respectively; and T is the duration of the study period.

2.3.3. Landscape Metrics

Spatial aggregation and fragmentation are essential indicators of the spatial distribution of UGSs and significantly impact their socio-ecological functioning. Consequently, we primarily selected three indicators related to these patterns to assess the variations in the spatial configuration of UGSs at a landscape level. These indices include the number of patches (NP), patch density (PD), and aggregation index (AI). Specifically, NP represents the number of green-space patches in a specific analysis unit; PD is a measure of the number of patches per unit area in a given analysis unit. It is determined by dividing the total green-space patch count by the total area of green-space landscape, as follows:
PD = NP/A
where A is the total green-space landscape area. AI represents the degree to which green-space patches are aggregated together. It can be computed as follows:
A I = g i j m a x g i j × 100
where both i and j represent individual green-space patches; gij indicates the count of adjacent green-space patches in a given analysis unit. AI values range from 0 to 100, with values closer to 100 indicating the higher levels of aggregation. Generally, the larger the PD values and smaller the AI values, the more fragmented and dispersed the patches are. In this study, the FRAGSTATS software (Version 4.2) was employed to compute three landscape metrics for each city region.
Furthermore, the linear regression model, together with the least-squares method, were utilized to estimate the temporal trends of variables during the study period; the Pearson correlation coefficients were employed to elucidate the relationships among the variables. Subsequently, the statistical significances of both the trends and correlation coefficients were assessed using the Student’s t test. In this study, a p-value of less than 0.05 was considered statistically significant for all analyses.

3. Results

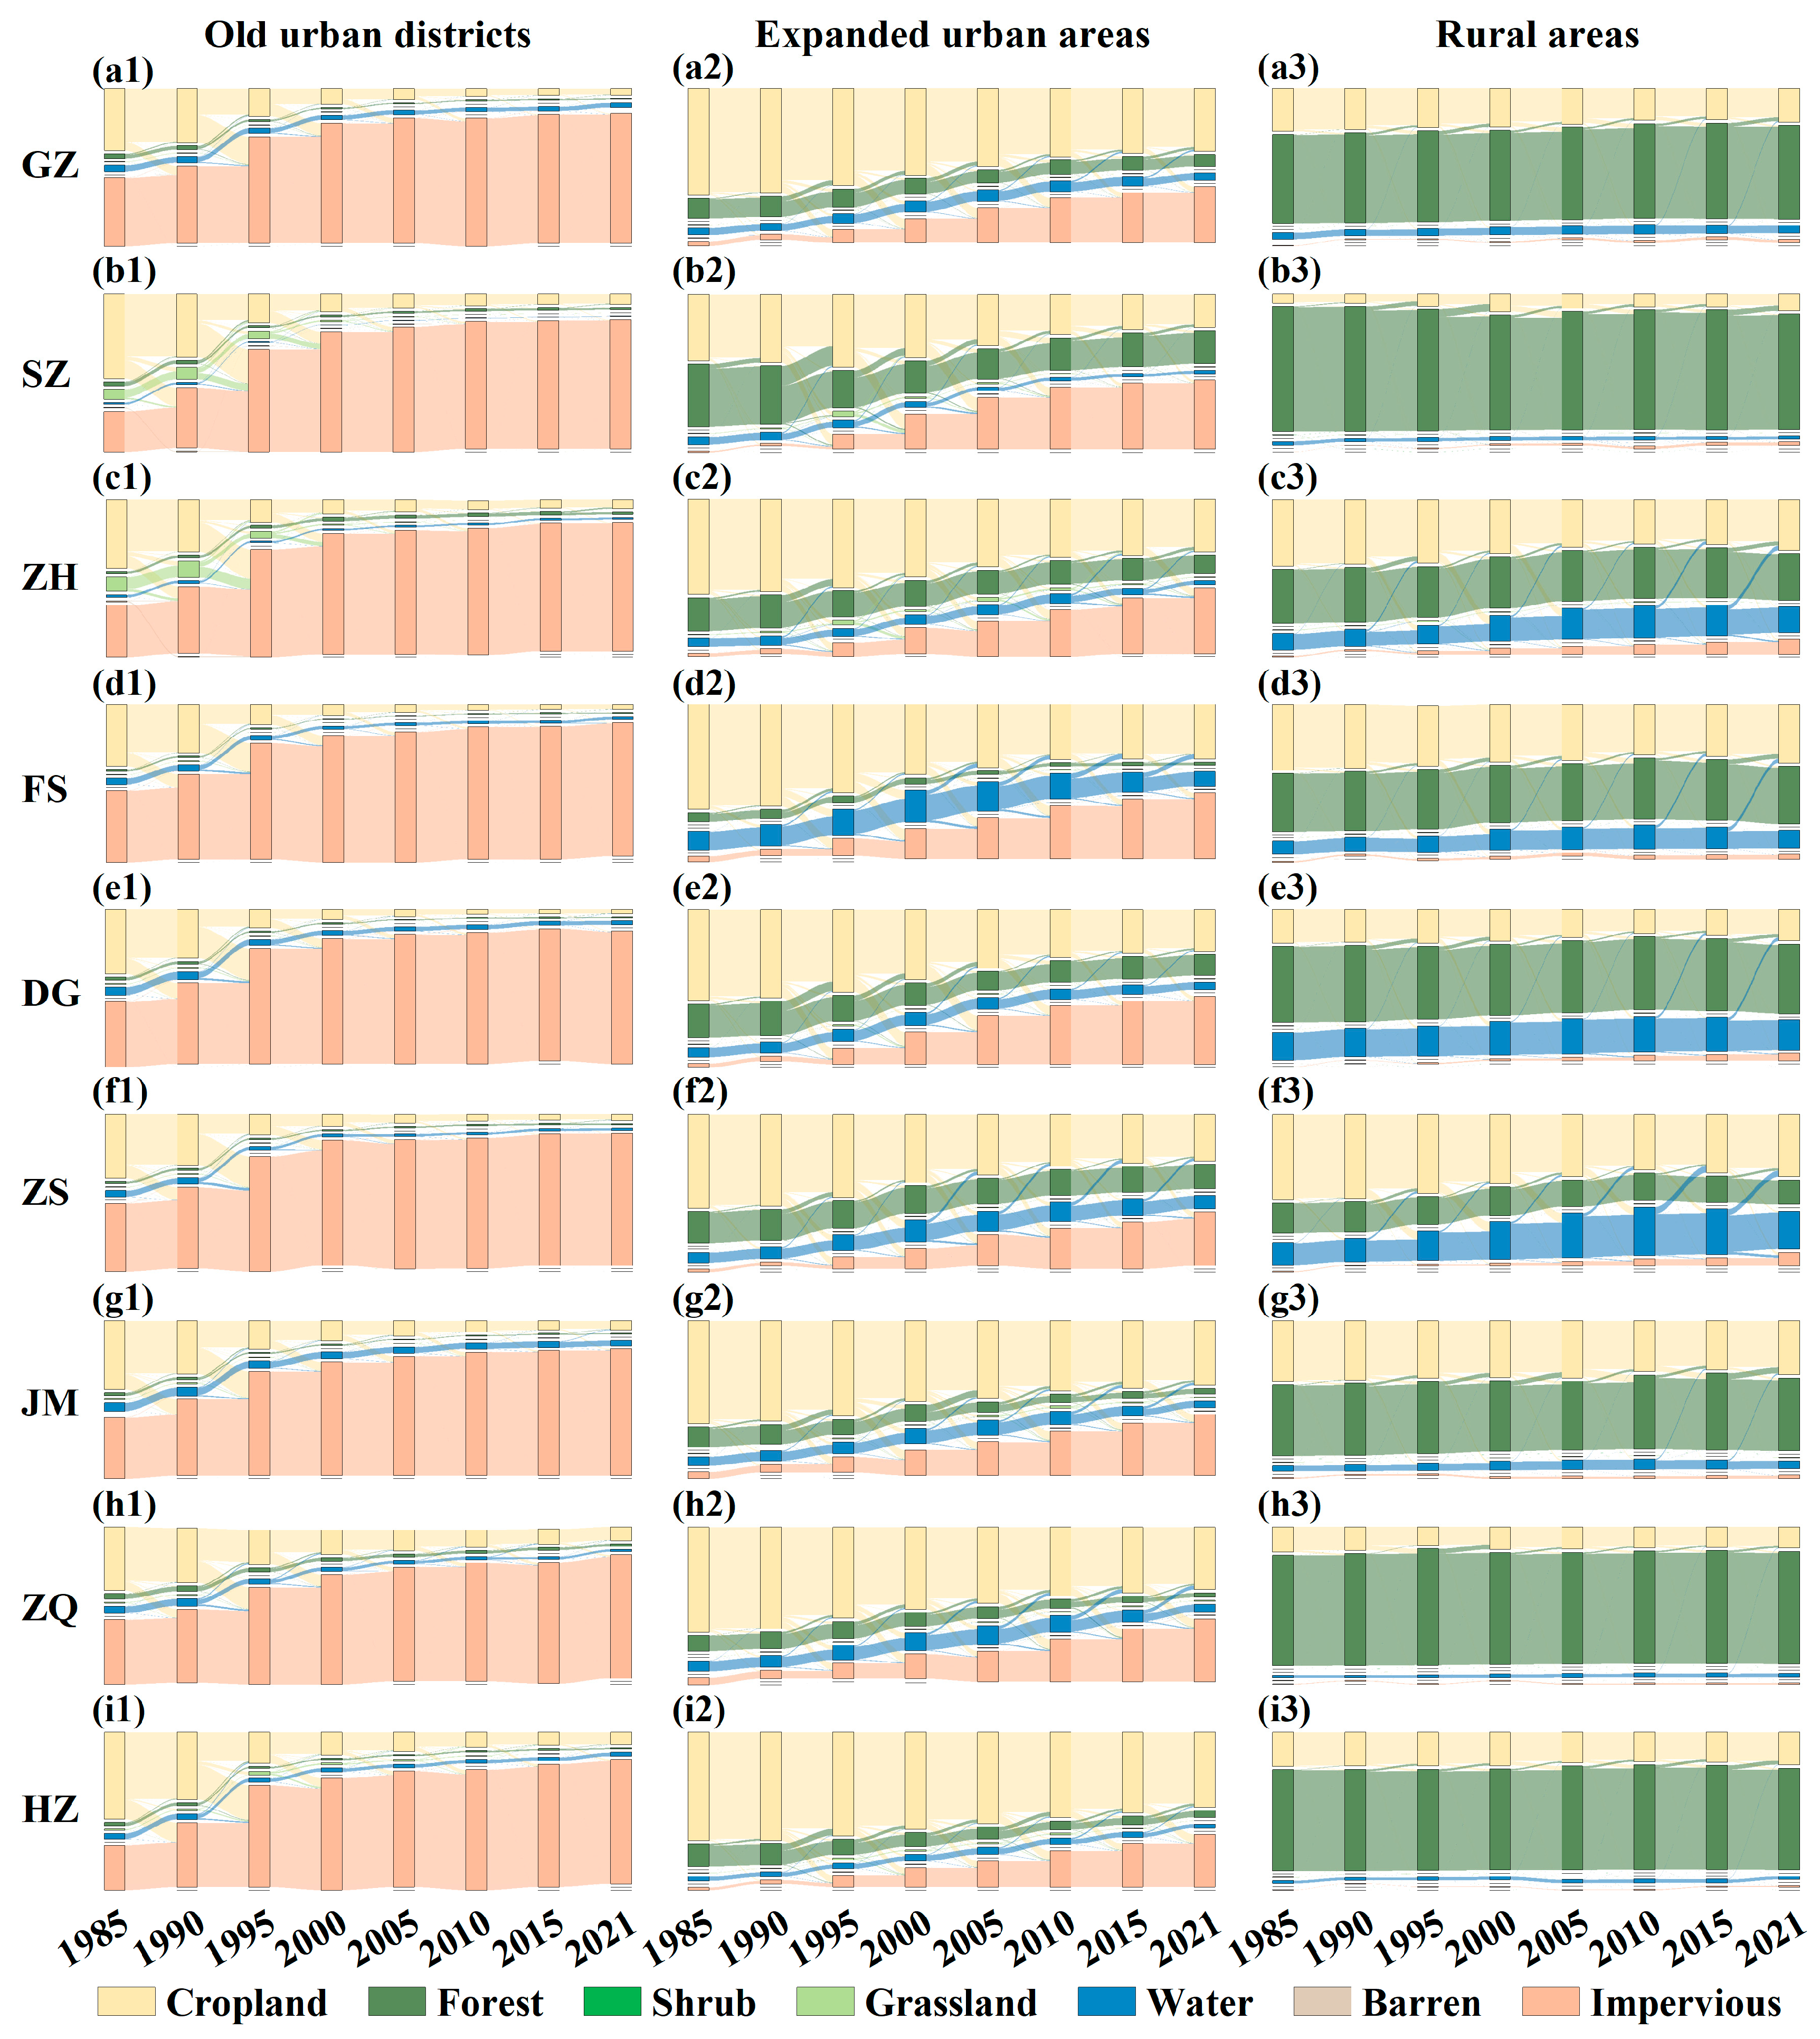
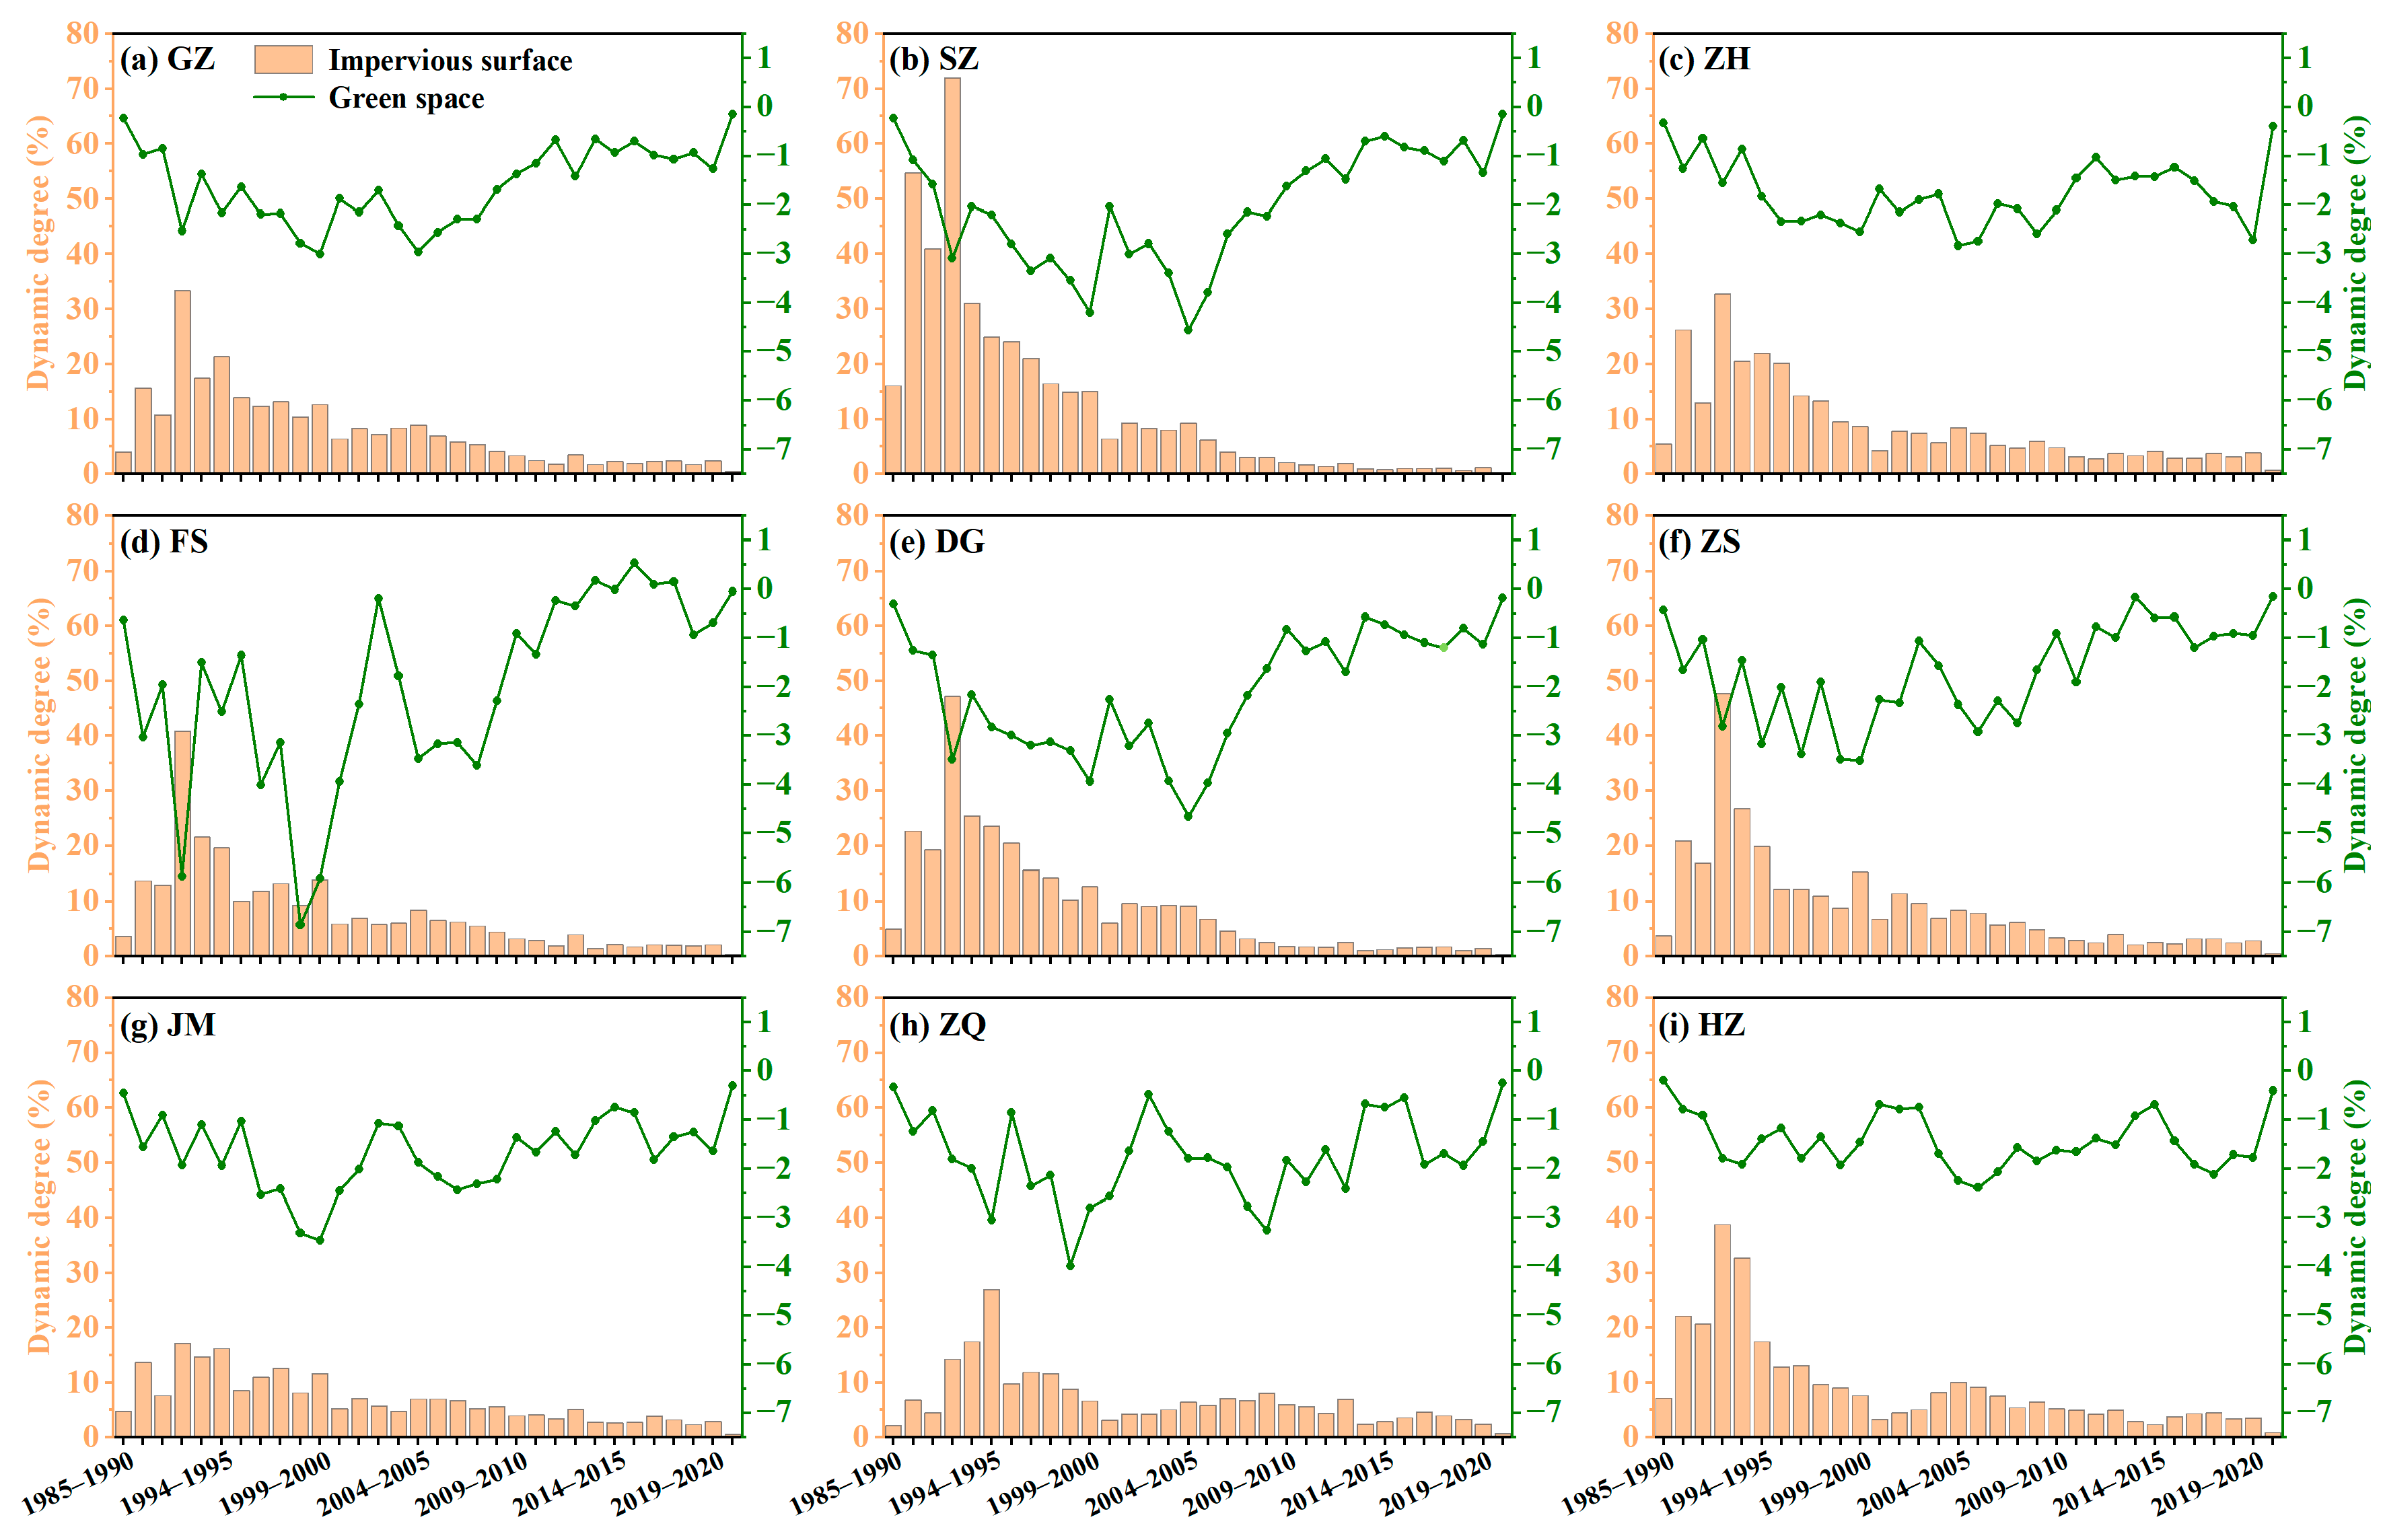
3.1. Changes in Urban Green-Space Area

Figure 2 illustrates the trajectories of land-cover transformations in different city subregions in the studied nine cities in the PRDUA from 1985 to 2021. Generally, the UGSs in all cities were mainly composed of cropland and forest, which was in accordance with the composition of land cover in the corresponding city in the PRDUA (Figure 2). The dynamic change of UGS area showed a distinct pattern among different city subregions during the study period. In the old urban districts, specifically, there was a universal continuous increase in impervious surface areas in all cities, with a corresponding decrease in UGS areas, especially before the year 2005. After 2005, the increase rate in impervious surface area in the old urban districts slowed down, and the decrease rate in UGS area also decelerated, tending towards stabilization. Compared to the old urban districts, each city’s correspondingly expanded urban areas had a lower proportion of impervious surface areas and a larger proportion of UGS areas. This is in line with the general laws of urbanization. Similarly, the UGS area decreased with the increase in the city’s impervious surface area. The reduction in UGS area in the expanded urban areas mainly occurred after 1990. Overall, the conversion of cropland to construction land was the main manifestation of UGS loss, followed by the transition of forest to construction land. Although the green-space area in rural areas also showed a significant downward trend in different cities, the shifts from cropland to impervious surfaces and water bodies were the predominant contributor to green-space loss in rural areas in most cities. Therefore, it can be concluded that urbanization was mainly responsible for the UGS loss. And it is projected that impervious surface area will increase in the expanded urban areas in future, and that the resulting green-space area will decrease.
Concurrent with the observed transformations leading away from green spaces, there were substantial cases of land cover being repurposed into green spaces and frequent transitions among different green-space types in each city. A notable occurrence in the transformation into green spaces was the conversion of water bodies into cropland, particularly observed in Foshan and Zhongshan. In urban regions, especially in the expanding urban areas, the interchange between cropland and forest was characterized by high frequency. Overall, the disappearing UGSs were predominantly concentrated in the core areas of the PRDUA during 1985–2021, such as the urban areas in Foshan, Dongguan, Zhongshan, Zhuhai, Guangzhou, Shenzhen, Zhaoqing, and Jiangmen. In contrast, the emergence of new green spaces was relatively limited and also concentrated in the central PRDUA, with a particular concentration in Foshan and northwest Zhongshan (Figure S2).
To better characterize the changes in UGS area, Figure 3, Figures S3 and S4 illustrate the dynamic degrees of green spaces in different subregions in nine cities in the PRDUA during 1985–2021. Overall, the dynamic degrees of UGS areas in nine cities of the PRDUA were negative, but with significant spatiotemporal differences. Taking the expanded urban areas as an example, the dynamic degrees of impervious surfaces in nine cities were positive, while those for UGSs were generally negative. Notably, the relatively negative dynamic-degree values of UGSs corresponded to the relatively large dynamic-degree values of the impervious surfaces. This phenomenon indicates that the expansions of urban areas are at the expense of green spaces in nine cities in the PRDUA. Specifically, the dynamic degrees of UGSs in nine cities generally displayed a decrease–increase pattern, with the turning points primarily occurring around 2005. Before these turning points, influenced by rapid urban expansion, the UGS area in each city experienced a sharp decline, while the decrease rate in UGS area in each city slowed down afterward. In cities like Foshan, there were even instances of UGS area increase in certain years. In general, a decline in the absolute values of dynamic degrees of UGSs in nine cities has been recorded during the study period. Spatially, the absolute values of dynamic degrees were ordered as the old urban districts > the expanded urban areas > rural areas in each city. Whether for the old urban districts or the expanded urban areas, the dynamic degrees of green spaces in Dongguan were the smallest among all the cities, indicating the most intense reduction in UGS therein.

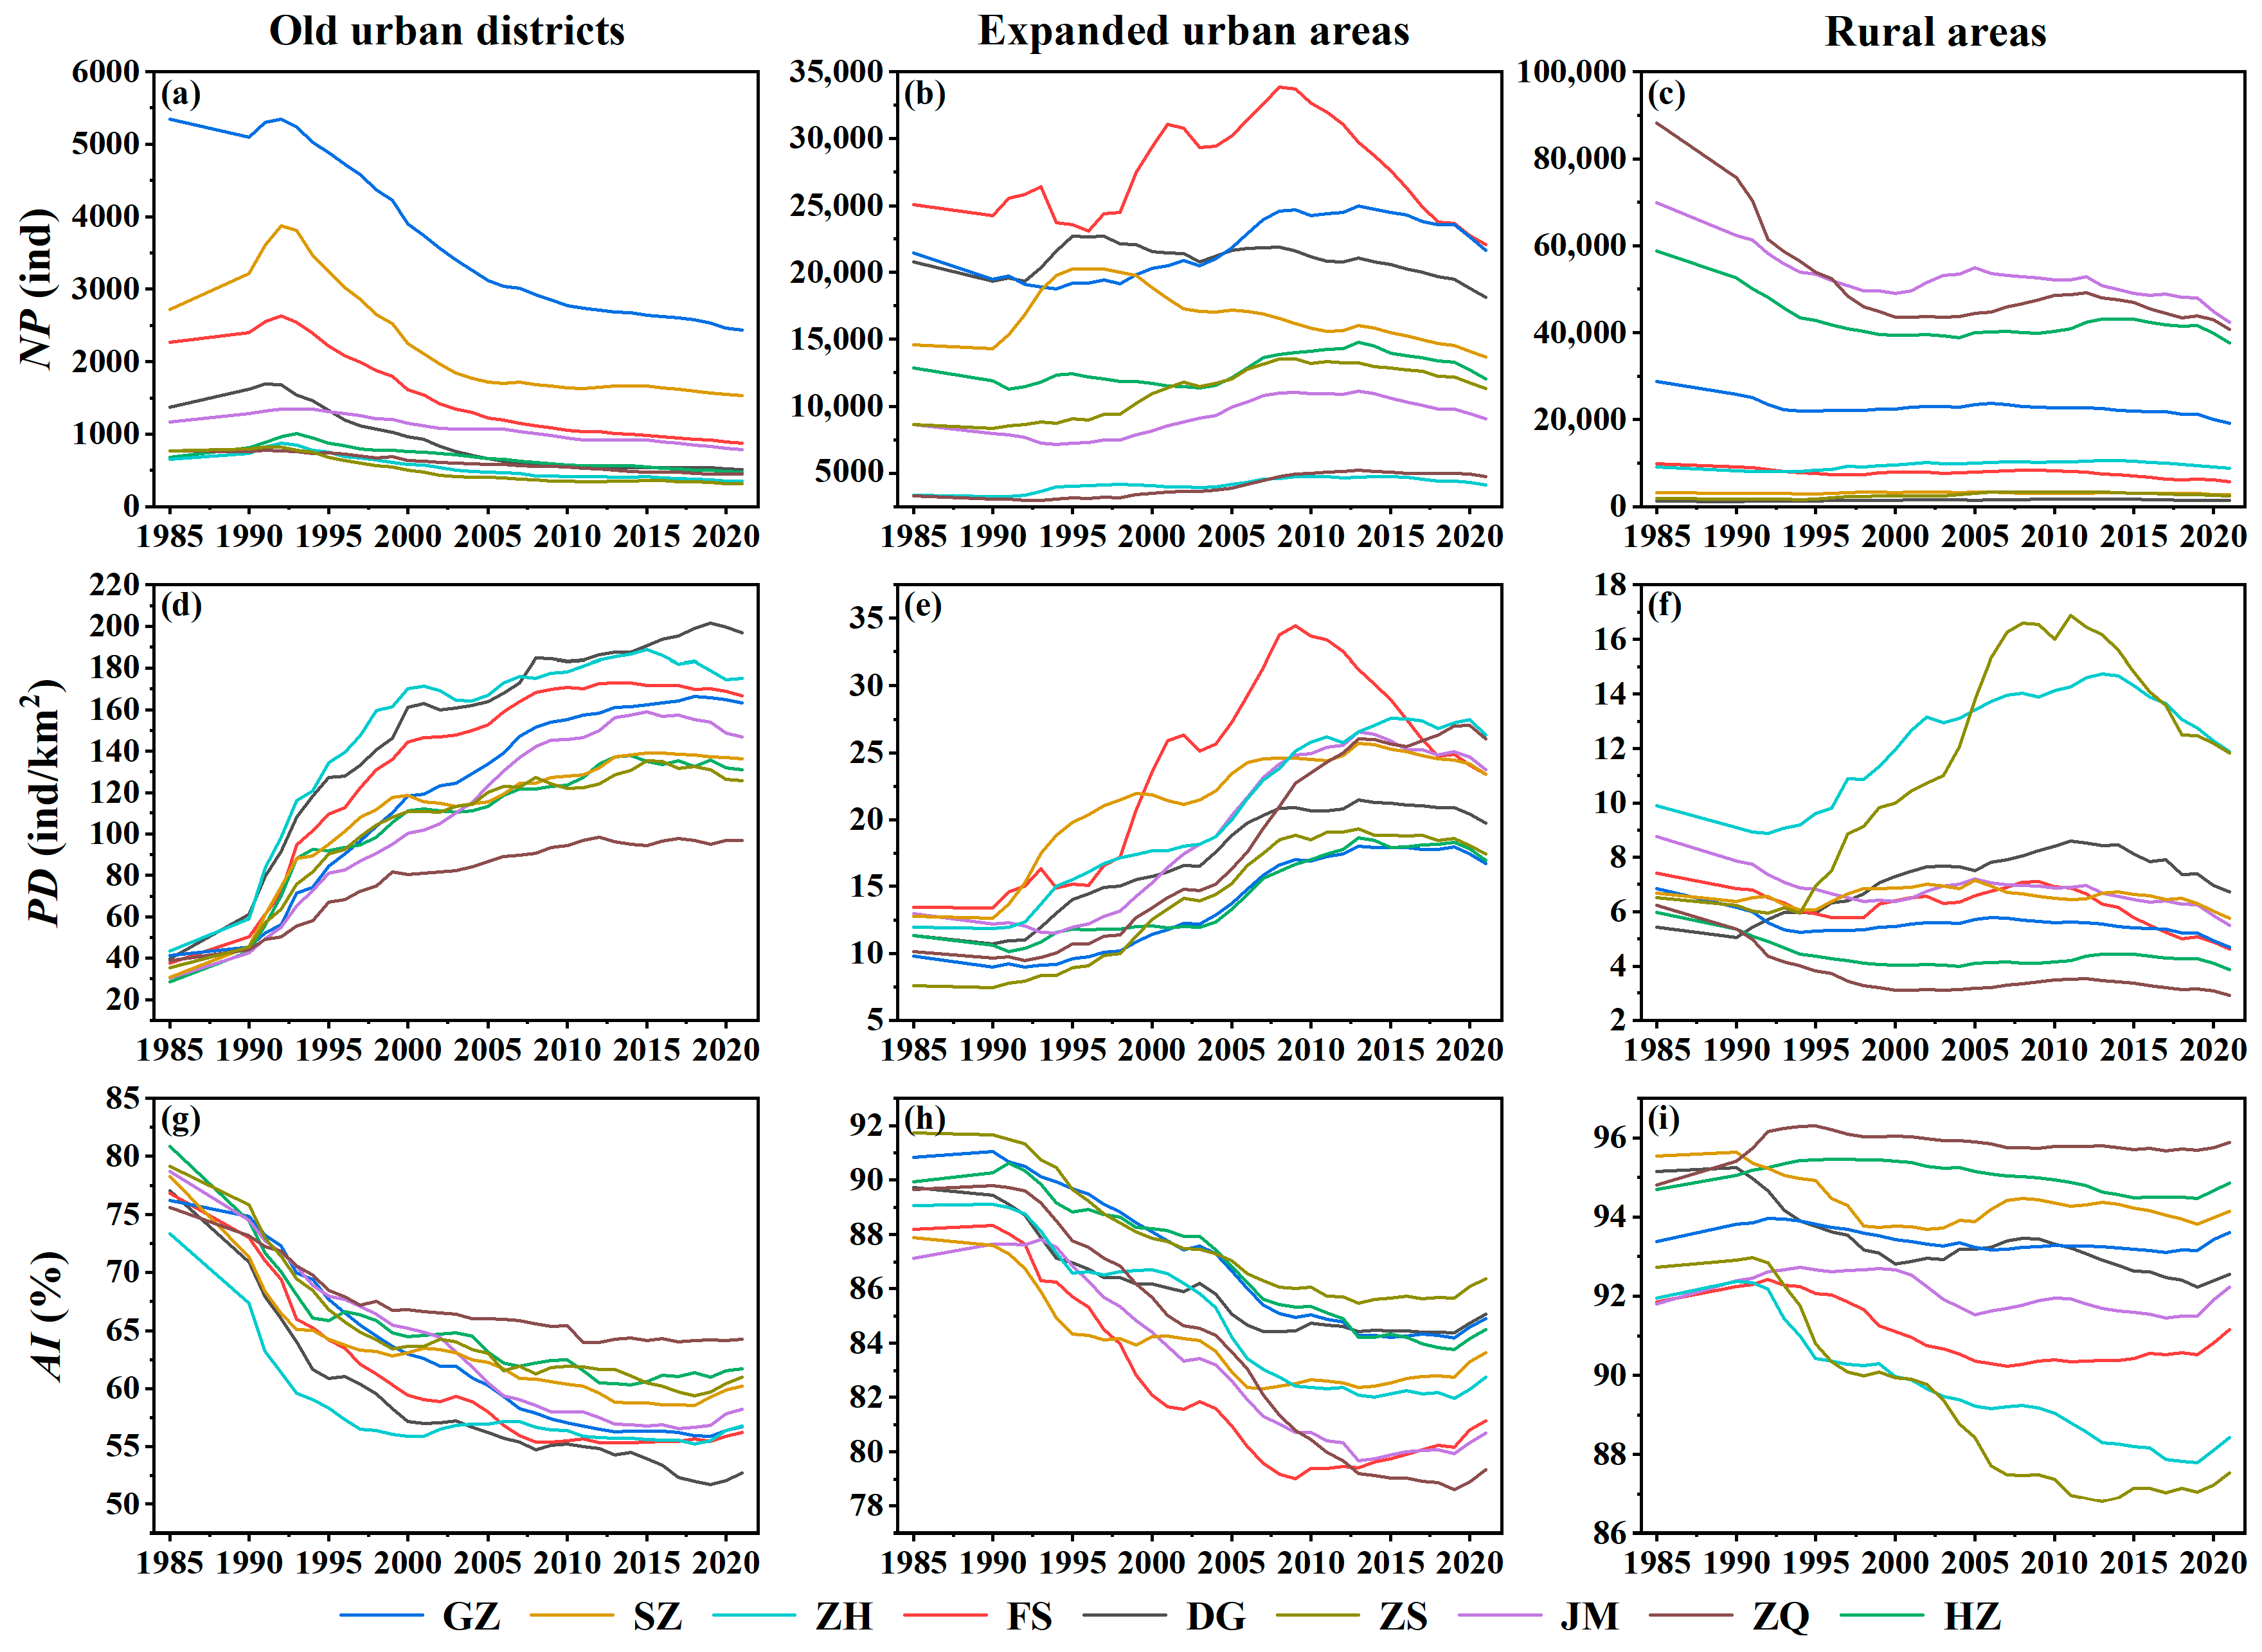
3.2. Changes in Landscape Pattern of Urban Green Space

During the study period, there was a substantial change in the spatial structure of UGSs across nine cities (Figure 4). Both the green spaces in the old urban districts and the expanded urban areas in nine cities exhibited a temporally consistent pattern: an initial increase followed by a decline in NP, an initial increase that subsequently stabilized in PD, and an initial decrease that then tended to stabilize in AI. Notably, the turning points where the NP of green spaces shifted from increasing to decreasing occurred earlier in the old urban districts, compared to the expanded urban areas. For instance, Guangzhou’s old urban district reached the turning point in 1992, while its urban expansion areas followed in 2008. Similarly, Shenzhen demonstrated a temporal disparity, with the old urban district and expanded urban areas reaching their respective turning points in 1992 and 2005.
In rural areas, the heterogeneous trends in NP and PD of green spaces were observed among the different cities, although AI consistently demonstrated a declining trend in all cities. In comparison, the old urban districts exhibited lower NP and AI values for green spaces relative to the expanded urban areas, while demonstrating higher PD values. Further, it can be found that urban areas consistently displayed elevated PD and reduced AI compared to their rural counterparts. These results suggest a progressive fragmentation and spatial discretization of the urban green landscape for each city in response to urbanization processes in the PRDUA, especially before 2010. The AI of green spaces showed a robust negative correlation with the PD across all urban subregions in nine cities. The correlation coefficients ranged from −0.93 to −1.00 (an approximation of −0.997, p < 0.01), with an average value of −0.98. This further confirmed the discrete distribution pattern of UGSs in each city.

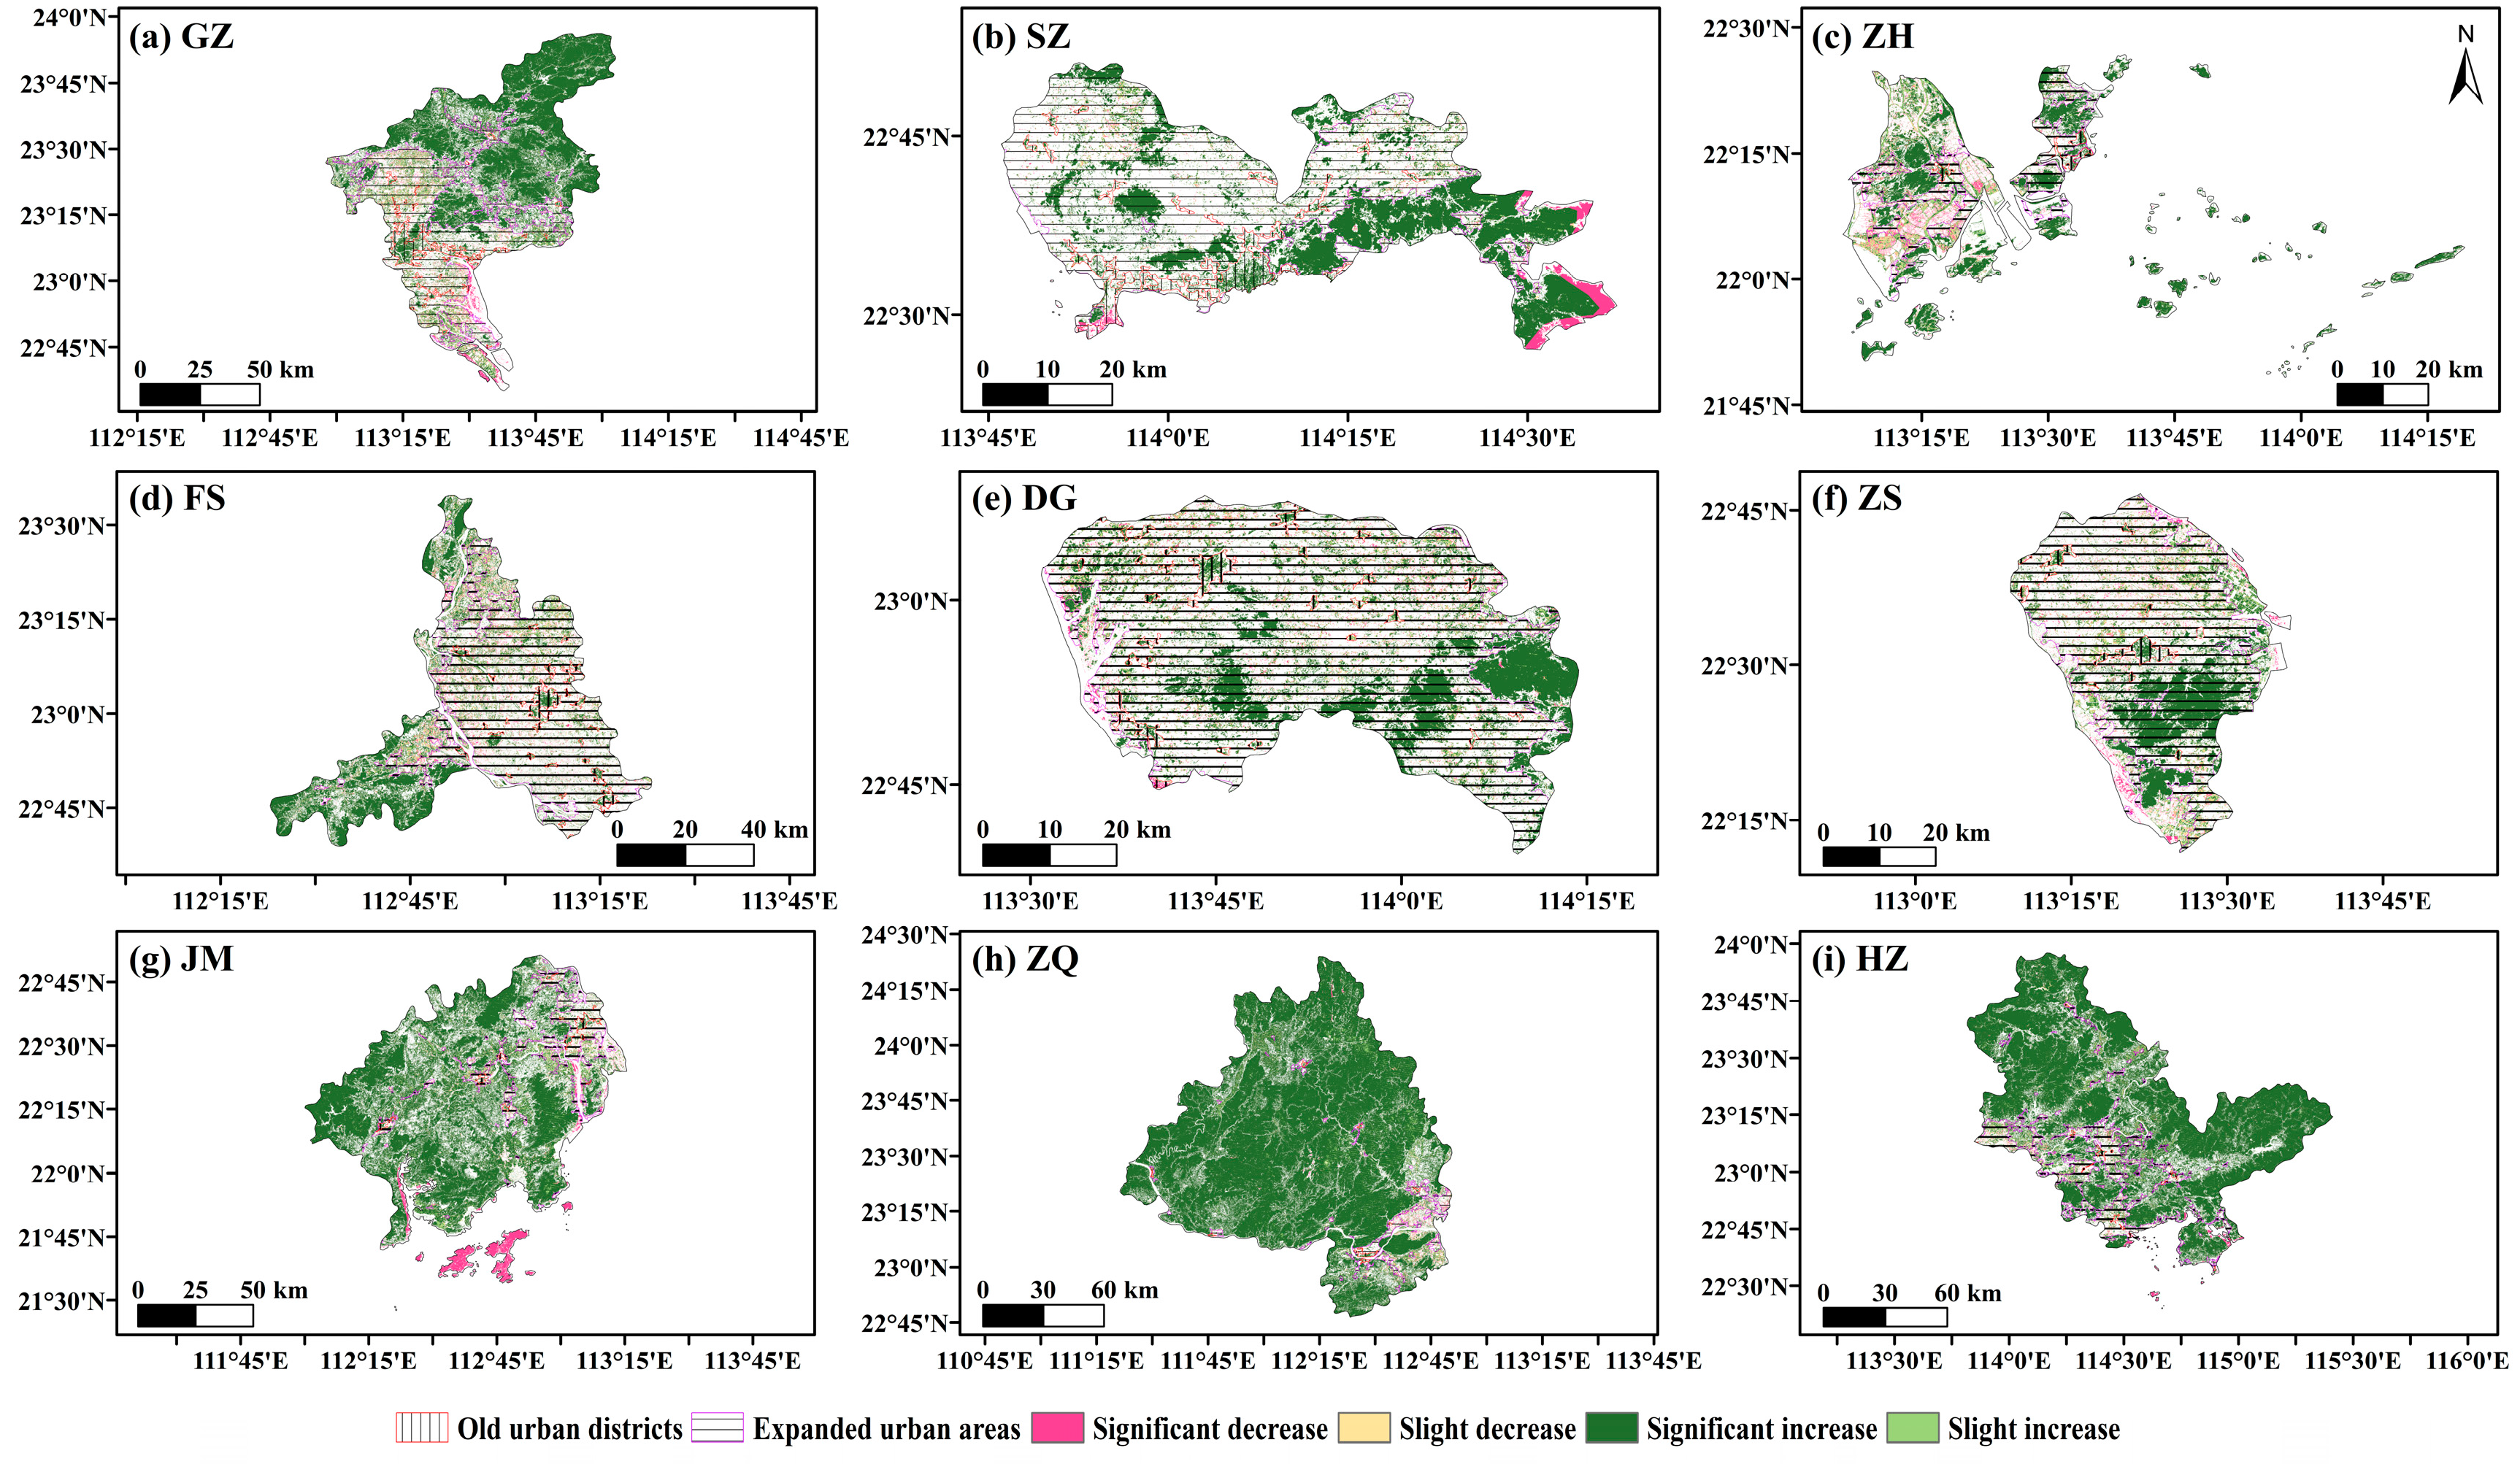
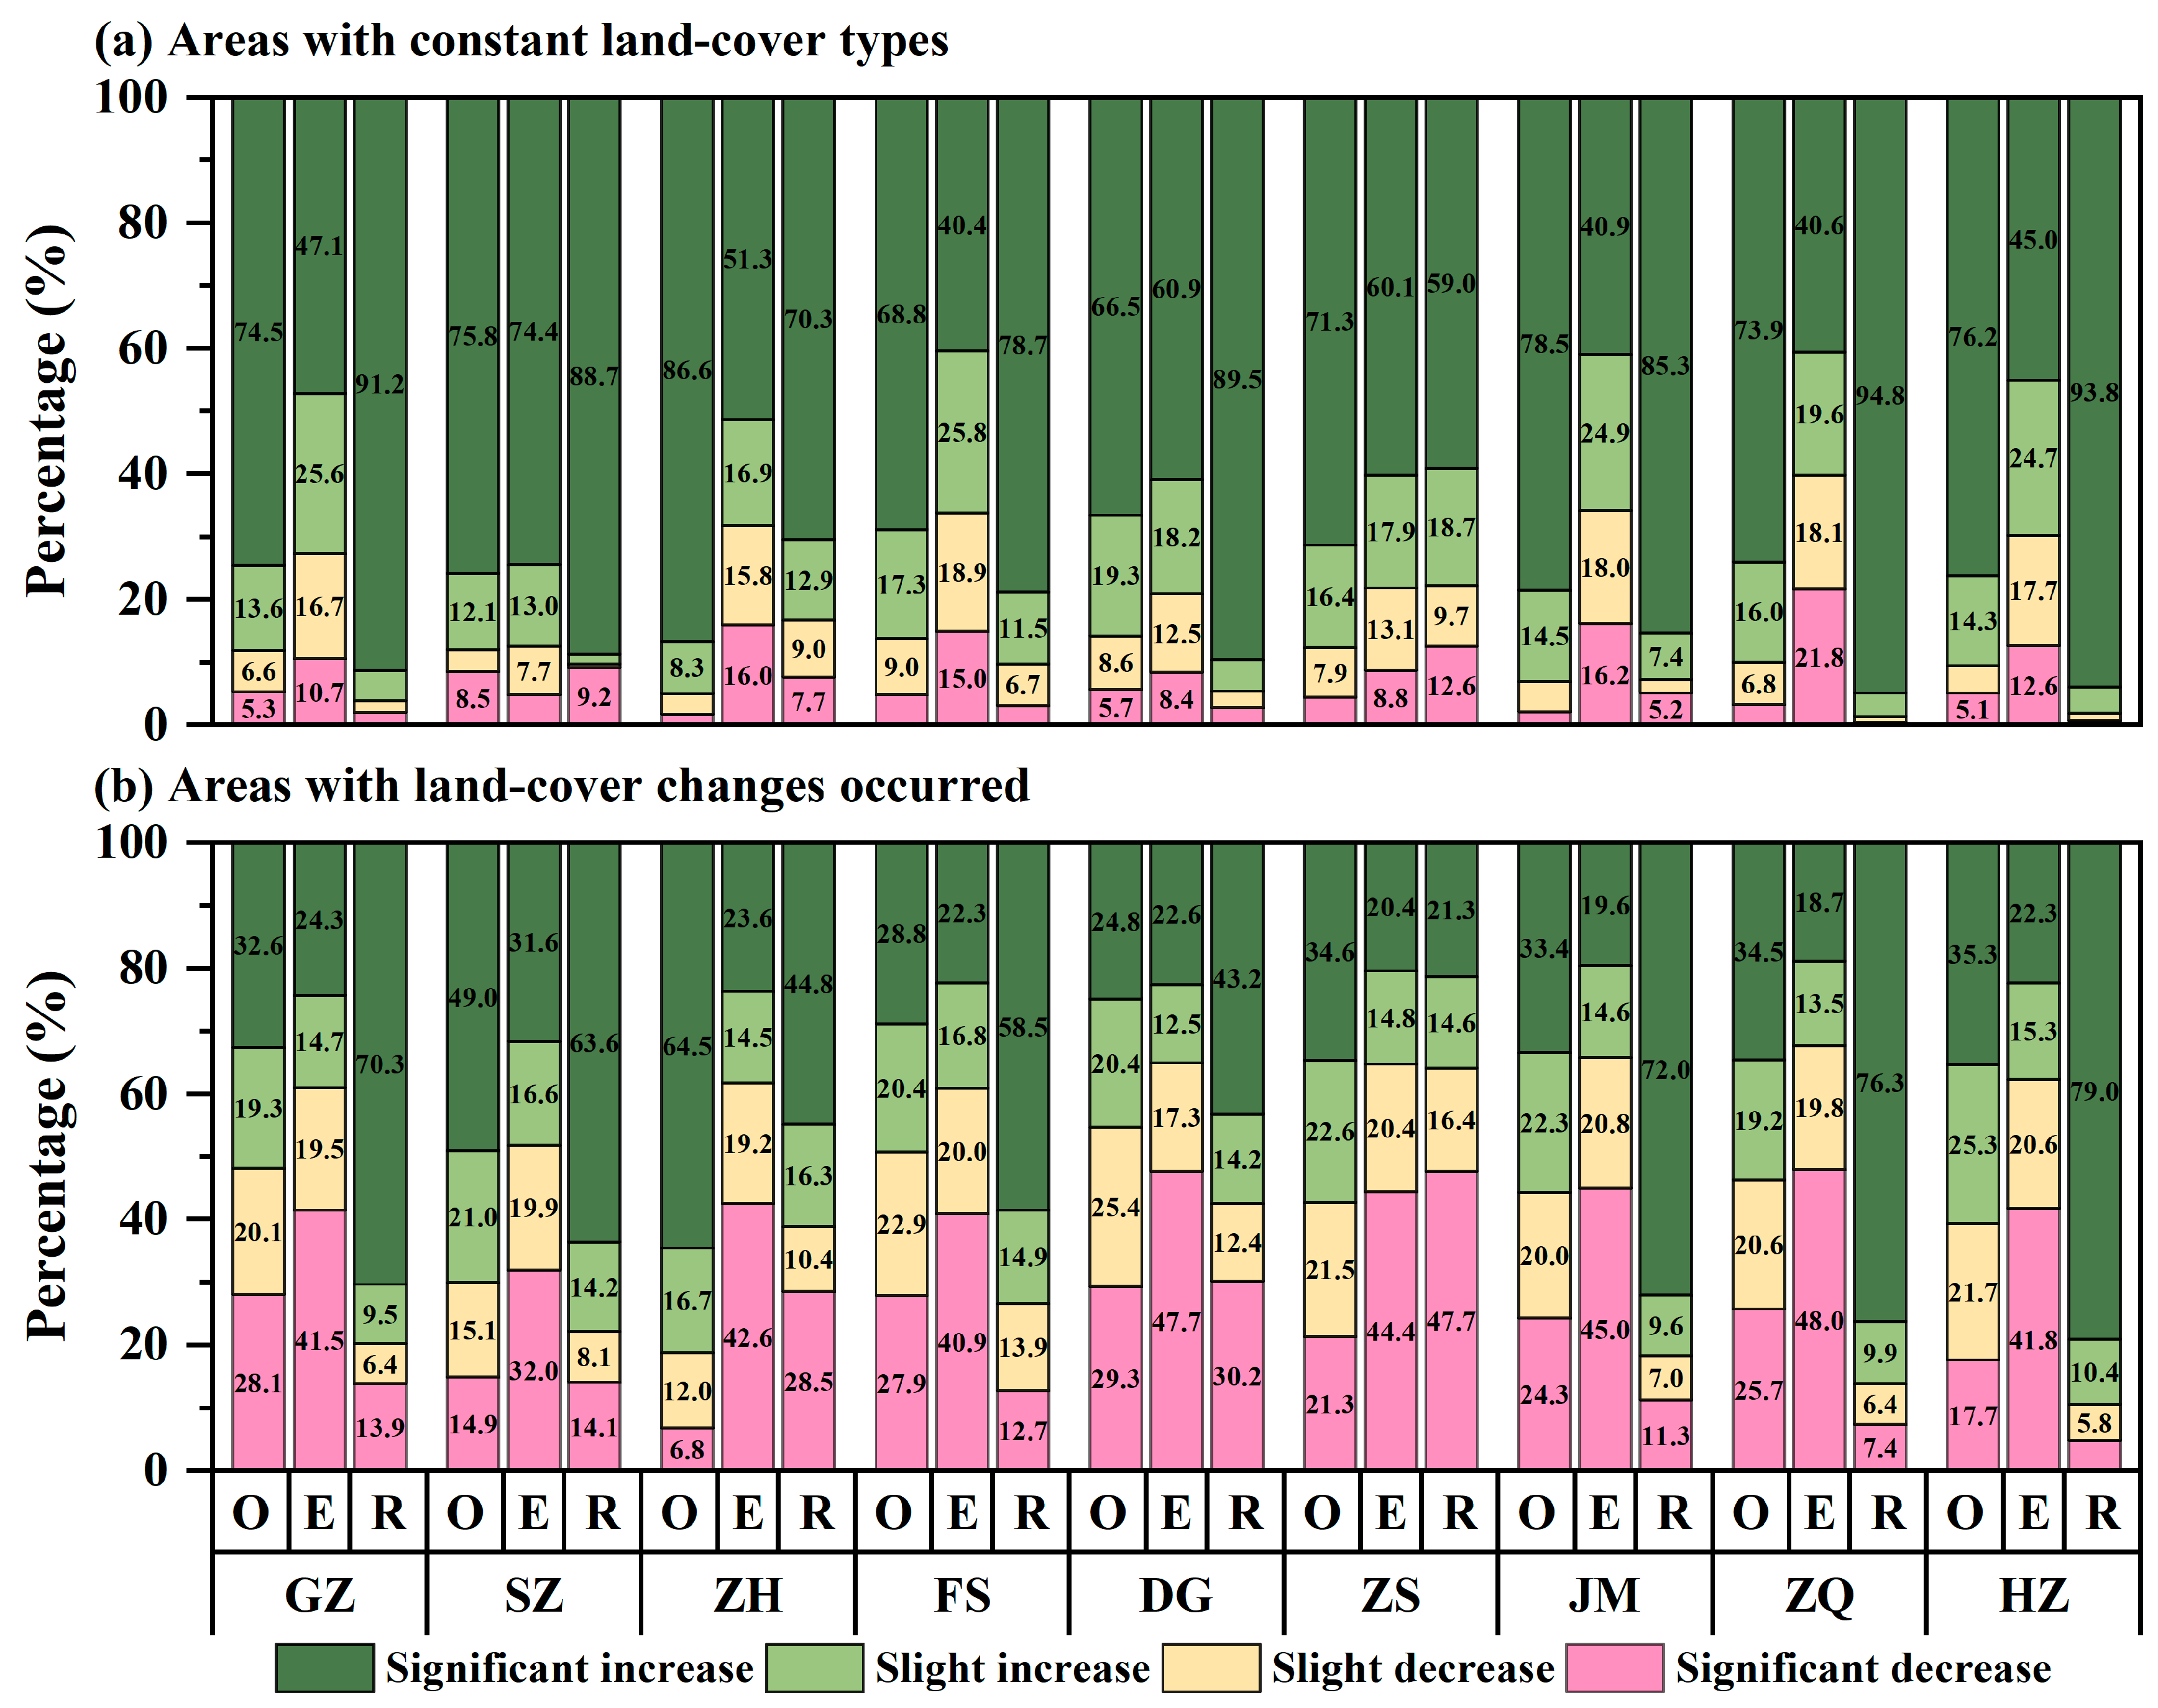
3.3. Changes in Vegetation Greenness

We used the vegetation greenness (i.e., NDVI) as a proxy to analyze the spatiotemporal characteristics of UGS quality in each city across the PRDUA. Considering the heightened sensitivity of NDVI to vegetation cover change compared to land use/cover data, the analysis of NDVI was extended beyond green spaces to encompass all land-cover types, excluding the permanent water bodies. This is helpful for capturing the “invisible” small green-space patches in 30 m resolution land-cover data, such as street plantation, pocket gardens, and green roofs.
Figure 5 illustrates the distributions of linear trends in annual NDVI across three subregions in each city. As shown in Figure 5a, the NDVI in green spaces, where the land-cover type has remained unchanged during the whole study period, showed a predominantly increasing trend in different subregions of nine cities (over 55.26% of total pixels) throughout the study period. Taking Guangzhou as an example, the number of greening (significantly greening) pixels in the old urban districts, expanded urban areas, and rural areas accounted for 83.29% (68.74%), 72.17% (46.09%), and 96.13% (91.25%) of the total number of green-space pixels with constant land-cover types in the corresponding areas, respectively. The percentages of browning (significantly browning) green-space pixels in the corresponding areas were 16.71% (8.78%), 27.83% (10.69%), and 3.87% (2.01%), respectively. In comparison, there was a distinct pattern of greening rates in green spaces with constant land-cover types across different city regions. In five cities, the pattern was characterized by a hierarchy of greening rates, with rural areas having the highest rates, followed by old urban districts, and then expanded urban areas. In six cities, the greening rate in rural areas exceeded that of the old urban districts, while in seven cities, it was higher than the expanded urban areas. Furthermore, in eight cities, the old urban districts showed a larger greening rate compared to their respective expanded urban areas. These results indicate that urbanization has exerted a certain adverse impact on vegetation, especially in the expanded urban areas. On average, the largest area-averaged NDVI trends in green spaces, for areas where land-cover types remained stable, were consistently recorded in Shenzhen for both old urban districts and expanded urban areas. The greatest area-averaged NDVI trend in rural areas was recorded in Zhaoqing. In contrast, for the old urban districts, expanded urban areas, and rural areas, the lowest area-averaged NDVI trend was observed in Dongguan, Zhaoqing, and Zhongshan, respectively.
When considering all the land-cover types within the given region, excluding permanent water bodies, the NDVI also showed a dominant increasing trend in the old urban districts and rural areas of nine cities (Figure 5b). However, nearly half, or even more than half, of the grids exhibited a negative trend in NDVI in the expanded urban areas across most cities. Similarly, an evident urban–rural gradient was observed in the NDVI trend. Specifically, seven cities showed the order of the NDVI trend as follows: rural areas > old urban districts > expanded urban areas. Moreover, the NDVI trends in the old urban districts of all cities were consistently greater than those of the expanded urban areas. These results further indicate that urbanization has a discernible adverse impact on regional NDVI, particularly in the expanded urban areas. Comparing Figure 5a with Figure 5b, it was evident that when the NDVI trend values across all land-cover types were pooled for analysis, the average values of the NDVI trends in different city areas were smaller than those in the corresponding area’s green spaces with constant land-cover types. This result can be attributed to the effects of land-cover changes, such as the conversion of some green spaces to impervious surfaces. Among nine cities, Zhongshan exhibited the distinct urban–rural gradient of NDVI trends, with the old urban districts > expanded urban areas > rural areas. This suggests that urbanization has a positive influence on vegetation therein.
To further reveal the influence of land-cover change on NDVI dynamics, Figure 6 and Figure 7 show the spatial distributions of NDVI trends in different city subregions where land-cover change occurred or did not occur during the study period, respectively (permanent water bodies were not considered here). Based on Figure 6 and the corresponding statistics (Figure 8a), it was evident that in areas where the land-cover types remained constant, the NDVI exhibited a prevailing increasing trend across the different subregions of all cities, and the significant increasing trend was dominant therein. On average, the highest occurrence of greening was observed in rural areas, followed by the old urban districts. Figure 7 and the corresponding statistics (Figure 8b) demonstrated that, in comparison to areas with constant land-cover types, the areas with changed land cover experienced a notable increase in the percentage of slightly and significantly browning areas. The spatial heterogeneity in NDVI trends was evident in areas where land-cover change occurred, with significant differences observed among different cities and within different subregions of each city. For instance, in terms of the old urban districts, the NDVI for Foshan and Dongguan mainly showed a browning trend, while all other cities primarily displayed a greening trend. Regarding the expanded urban areas, all cities experienced a prevailing browning trend, with the percentage of browning areas ranging from 51.86% in Shenzhen to 67.8% in Zhuhai. With respect to the rural areas, the NDVI for Zhongshan showed a predominant browning trend. In contrast, rural areas in other cities primarily demonstrated a predominant greening trend, with the percentage of greening areas ranging from 57.40% in Dongguan to 89.41% in Huizhou. The aforementioned analysis once again highlights the fact that changes in land-cover types are primarily responsible for the observed NDVI decline in certain areas.
Analyzing the change patterns of annual NDVI across different city subregions, it can be observed that the trends were fundamentally similar across nine cities, except for the expanded urban areas in Zhuhai. The correlation coefficients between the annual NDVI of individual city regions and the PRDUA average ranged from 0.29 to 0.96, averaging 0.78, with most values exceeding the significance threshold of p < 0.01 (Figure 9b). This similarity may be partly attributed to the influence of large-scale climate change. As depicted in Figure 9a, the area-averaged NDVI in the PRDUA exhibited a significant increasing trend, increasing from 0.48 during 1986–1990 to 0.63 during 2017–2021. According to the 5-year moving average, the greening rate in NDVI was slower before 1997 compared to the period 1997–2016, indicating an accelerated greening trend under climate change and urbanization.

4. Discussion

4.1. Spatiotemporal Patterns of Urban Green Spaces in the PRDUA

The previous research primarily concentrates on variations in the area or quality of UGSs, disregarding spatial structural and a comprehensive analysis, thereby impeding a complete understanding of UGS dynamics. This study proposed an analytical framework to examine the spatiotemporal evolutions of UGSs during the urbanization process. The framework delved into three fundamental dimensions: area, spatial configuration, and quality. These dimensions can comprehensively describe the variations in UGSs from macro- to microscales and from quantity to quality. Applying this analytical framework to the PRDUA, China, the results indicated a significant UGS loss in nine cities since 1985, primarily due to the conversion of cropland and forest into impervious surfaces. This was consistent with the results detected by the Global 30 m land-cover dynamic monitoring products in the PRDUA from 2000 to 2020 [32]. The dynamic degrees of UGSs in nine cities generally followed a decrease–increase pattern. The turning point occurred around 1993 in the old urban districts and 2005 in the expanded urban areas. Given the constant land area and increased population of each urban subregion, the changes in the UGS area indicate a significant decrease in both the urban green rate and per capita UGS area from 1985 to 2021. After 1993 (2005), the trend in green rate reduction slowed down, and gradually shifted to an increase in the old urban districts (expanded urban areas).
In terms of spatial configuration, generally, the fragmentation trend of UGSs initially increased and then weakened around 2010 in nine cities. However, the spatial evolution patterns showed evident differences between the old urban districts and expanded urban areas. In the old urban districts, there was a consistent negative change in total green-space area, AI and NP, but a positive change in PD, suggesting that the loss of large patches is the primary contributor to the overall shrinkage and fragmentation of UGSs. The finding agreed with one by Feng et al. (2021) in the PRDUA, based on China’s national land-use and cover-change dataset [54]. In contrast, in the expanded urban areas, nine cities can be classified into two change-pattern groups. One group, comprising Shenzhen and Dongguan, demonstrated landscape metric changes that were congruent with those observed in the old urban districts. Another group, consisting of the remaining cities, exhibited a negative change in both total green-space area and AI, but a positive change in both NP and PD. These results suggested that green-space loss and its fragmentation in the expanded urban areas of most cities were mainly due to the division of large patches into smaller, or more isolated ones. In addition, it should be noted that the increase in NP of UGS and their fragmentation were also related to comprehensive spatial planning and regreening initiatives in the expanded urban areas [53,54].
Despite the dramatic decrease in the area and a general trend toward discrete spatial distribution of UGSs across nine cities in the PRDUA during the study period, the area-averaged NDVI, which considered both green and non-green spaces, has demonstrated a significant increase in most areas of nine cities (Table 1). Furthermore, the majority of cities exhibited a greening pattern characterized by rural areas > old urban districts > expanded urban areas. These findings were consistent with the documented global vegetation-greening trend and urban vegetation-greening trend reported in previous studies [55,56,57]. Nonetheless, Figure 8b shows that the substantial vegetation in areas experiencing land-cover changes exhibited a browning trend. In particular, over 51.86% of the changed areas in the expanded urban areas in nine cities have showcased a browning trend. These results suggest that the negative impacts of land-cover change driven by urbanization on NDVI have been mitigated by the positive effects of climate change and urbanization in the PRDUA [27]. Zhang et al. (2022) found a widespread positive indirect effect of urbanization on vegetation growth based on a survey of 672 cities worldwide [18]. Further, they concluded that developed cities (or highly urbanized city areas) had a higher indirect impact than that of developing cities (or low-urbanization areas). Similarly, Yu et al. (2023) also found an increase in vegetation greenness, along with urban growth, in most of the investigated 340 Chinese cities [58]. In this study, a general larger greening trend was observed in the old urban districts compared to the expanded urban areas in most cities, supporting this conclusion. The urban heat island and human management practices (e.g., municipal irrigation) were mainly responsible for the difference [18]. Additionally, it should be noted that some areas where land-cover types were unchanged showed a decreasing trend for the NDVI. Similar phenomena have also been observed in the Guangdong–Hong Kong–Macao Greater-Bay-Area Urban Agglomeration [34] and the Yangtze River Delta, China [59]. This might be related to the variations in vegetation coverage, productivity, and local climate conditions, suggesting the complexity of vegetation change in the context of urbanization [34].

4.2. The Influences of Policies on Urban Green Spaces

The evolution of UGSs is jointly influenced by climate change and human activities, with greening policies being considered a significant factor for the UGS recovery [27,60,61]. The PRDUA is a typical rapidly urbanized region globally, characterized by rapid economic development, substantial population growth, and intensive human–land interactions. Hence, the PRDUA has been a focal point for numerous Chinese government policies aimed at enhancing green spaces. For example, China’s central government proposed many national policies and actions, such as ecological civilization construction in 2007, the ecological redline policy in 2011, and the green development concept in 2015, etc. In parallel, Guangdong Provincial government also issued many urban-greening policies. In 1999, the government issued the “Guangdong Urban Greening Regulation” to improve the urban living environment through the implementation of public, residential, and landscape-greening initiatives. In 2009, the government proposed the “Outline Plan for the Reform and Development of the Pearl River Delta (2008–2020)”, which aimed to construct a resilient regional ecological security system. In 2011, the government proposed a “Guangdong Province Ecological Landscape Forest Belt Construction Plan (2011–2020)”, which aimed to construct the ecological landscape forest belts along the major roads, rivers, and coastlines. In 2012, the “Master Plan for the Construction of Greenway Network in Guangdong Province (2011–2015)” was implemented, with a focus on constructing a greenway network to improve the connectivity of major green spaces among different cities. Since 2013, the ”New Round of Greening Guangdong” has been proposed, with an objective of making Guangdong Province become the first national green ecological province in China. In 2017, the government issued the “Pearl River Delta National Forest Urban Agglomeration Construction Plan (2016–2025)”. In 2020, the “Guangdong 10,000 m Greenway Master Plan (2020–2035)” was implemented, which was aimed at constructing an ecological, resilient, and secure river and lake system. In 2021, the PRDUA completed the creation of the national forest-city cluster, becoming the first national forest-city cluster in China. These policies have all exerted a certain impact on the area, spatial configuration, and quality of UGSs in the PRDUA.
Under the development strategies in China emphasizing a rapid and extensive urbanization, the PRDUA has experienced an extensive and enduring wave of urbanization during the study period, particularly before 2005. This has led to substantial UGS losses. However, with the practice of the ecological civilization concept around 2007 and the subsequent implementation of urban-greening initiatives, the UGS loss rate has slowed. This deceleration can be attributed to strengthened governmental oversight and strategic planning of UGSs. Additionally, a prevalent pattern of interconversion between cropland and forest land in nine cities was observed, likely a response to governmental policies such as the “Grain for Green”, “Forest-City Construction”, and “Cropland Requisition–Compensation Balance" initiatives [62]. As the UGS area decreased, their fragmentation also increased. This was due to the loss of large green-space patches and their division into smaller, or more isolated ones. In recent years, the government has embraced this issue, and planned to construct a regional green-space network to improve their connectivity. After 2010, regional greening efforts including greenway network construction and comprehensive land-consolidation measures were significantly reinforced in the PRDUA. As a result, the number of UGS patches tended to decrease in the expanded urban areas in most cities, exhibiting a tendency towards concentration.
Moreover, it was certain that governmental policies have also played a positive role in urban greening. For example, with the promotion of the “Pearl River Delta National Forest Urban Agglomeration Construction Plan (2016–2025)”, from 2016 to 2020, the PRDUA has constructed 89 ribbon forests and 717 pocket parks, with 6900 kilometers of ecological landscape forest belts and 4200 kilometers of greenways, either newly built or upgraded. As a result, the vegetation health and density of most existing UGSs has been improved significantly. Additionally, under the guidance of the concept of ecological civilization, all municipalities of the PRDUA actively promoted the vertical greening, including the construction of green roofs and walls in urban areas, which significantly contributed to an increase in NDVI without expanding the ground area of UGSs. All of these can, to some extent, explain the decrease in UGS area but the increase in NDVI. The positive effects driven by the polices has also been confirmed in the Guangdong–Hong Kong–Macau Greater Bay Area [38], most cities in China [24,27,63], and Manchester in the United Kingdom [25]. For example, Zhang et al. (2024) concluded that vegetation browning due to urban expansion has been balanced by the greening in urban core areas in most Chinese cities during 2000–2020, attributed to the implementation of urban-greening initiatives [27].

4.3. Implication and Limitation

In summary, the PRDUA has experienced a paradoxical situation where urban greening occurred alongside a concurrent reduction in UGS area and increase in fragmentation. This means that while UGS area is decreasing and its distribution is becoming more dispersed, its quality is improving. The differential changes in the quantity and quality of UGSs during the urbanization process raise a critical question: whether these changes can meet the needs of sustainable urban development. In recent years, scholarly investigations have begun to examine human exposure to green spaces and associated equity issues. For instance, Chen et al. (2022) discovered a pronounced disparity in human exposure to UGSs between cities in the Global North and Global South, with the latter demonstrating an exposure inequality twice that of the former [51]. The researchers attributed 53% of this spatial disparity to the combined effects of UGS areas and their spatial configuration. Li et al. (2024) found that the cooling capacity of cities in the Global South was approximately 70% of that in cities in the Global North, due to discrepancies in the quantity and quality of UGSs between them, highlighting the importance of integrated analysis of the quantity and quality [64]. Additionally, some studies have shown that the fragmentation of UGSs had a negative role on their cooling capacity [65] and ecosystem services [66]. Consequently, the greening of urban areas does not necessarily compensate for the potential adverse effects caused by the UGS area loss and fragmentation, to some extent. The findings in this study underscore the potential limitations of analyzing UGS changes from a singular perspective, as it may yield an incomplete comprehension of the complex UGS dynamics.
This study systematically examined the characteristics of UGS dynamics from the perspectives of quantity, spatial structure, and quality. The land-cover and urban-boundary data utilized in this study are widely used in previous studies, and both the land-cover and NDVI datasets have a high spatial resolution of 30 m. However, for urban-scale analysis, these datasets inevitably introduced a certain degree of uncertainty into the results. For example, some small green spaces, such as street trees, lawns, pocket gardens, and green spaces within gaps of constructed land, may not be identified at a 30 m resolution. Additionally, the urban boundary data might misclassify urban and rural areas, which could increase the uncertainty of the comparison results of UGS characteristics between different city subregions. Therefore, the land use/cover data and urban boundary data, with a higher spatial resolution, are required to improve the accuracy and robustness of UGSs analysis in future. Additionally, this study used the NDVI to represent the quality of green spaces. However, the quality of green spaces is not only related to their greenness, but also to their vegetation composition, species diversity, ecosystem service functions, and vegetation resilience. Accordingly, an integrated quality indicator including the ecosystem service functions and green-space exposure equality should be incorporated into the three-dimensional framework to obtain a more comprehensive understanding of UGS states and support effective urban green-infrastructure stewardship in future research. Furthermore, future studies will focus on the underlying mechanisms of UGS changes in terms of quantity, spatial structure, and quality.

5. Conclusions

Based on high-spatial-resolution data (30 m) of land cover during 1985–2021 and NDVI from 1986–2021, this study conducted a systematic analysis of spatiotemporal UGS dynamics in the PRDUA from a comprehensive perspective of the area, spatial configuration, and quality. The UGSs in all cities were predominantly composed of cropland and forest. There was a significant decline in UGS area across nine cities from 1985 to 2021, primarily attributed to the occupation of construction land. The most substantial UGS losses were recorded in the central PRDUA. The dynamic degrees of UGSs in nine cities generally displayed a decrease–increase pattern. In terms of spatial configuration, generally, the fragmentation trend of UGSs initially increased, and then weakened around 2010, in nine cities. However, the spatial evolution pattern between the old urban districts and expanded urban areas was inconsistent. For the old urban districts, the large patch loss was the primary contributor to the shrinkage and fragmentation of UGSs, while in the expanded urban areas of most cities, the division of large patches into smaller, or more isolated ones, drove the UGS loss and fragmentation. The NDVI showed a dominant increasing trend in the old urban districts of all cities, but nearly half or more of the grids in the expanded urban areas of most cities exhibited a negative trend. Additionally, a general urban–rural gradient of NDVI trends was observed in most cities, with the pattern being the rural areas > old urban districts > expanded urban areas. The land-cover changes were primarily responsible for an observed NDVI decline in certain areas. When considering the cities or individual urban areas as a whole, a general upward trend in NDVI was observed in all cases, except for the expanded urban areas in Zhuhai. This suggests that the negative impacts of urbanization on NDVI have been mitigated by the positive effects of climate change, urbanization, and greening initiatives within the PRDUA. However, urban greening is not always indicative of the improvement in UGS states, given the concurrent processes of UGS area loss and the fragmentation. We therefore recommend incorporating the three-dimensional analytical framework into urban ecological monitoring and construction efforts to obtain a more comprehensive understanding of UGS states and support effective urban green-infrastructure stewardship.

Supplementary Materials

The following supporting information can be downloaded at: https://www.mdpi.com/article/10.3390/rs16234369/s1, Figure S1: The state and change flows of land cover in nine cities in the PRDUA from 1985 to 2021; Figure S2: Disappearing (a) and emerging (b) green spaces in the PRDUA during 1985–2021. The rectangular frames indicate the main areas of disappearing and emerging green spaces; Figure S3: Dynamic degrees of green spaces in the old urban areas in nine cities in the PRDUA during 1985–2021; Figure S4: Dynamic degrees of green spaces in the rural areas in nine cities in the PRDUA during 1985–2021.

Author Contributions

Conceptualization, T.Y.; formal analysis, T.Y., S.L. and L.S.; funding acquisition, T.Y.; investigation, T.Y., S.L. and L.S.; methodology, T.Y.; supervision, S.L. and H.Z.; visualization, T.Y. and L.S.; writing—original draft, T.Y.; writing—review and editing, T.Y., S.L., L.S. and H.Z. All authors have read and agreed to the published version of the manuscript.

Funding

This research was funded by the Key Laboratory of Earth Surface System and Human–Earth Relations, Ministry of Natural Resources of China [Grant No. LBXT2023YB07], the National Natural Science Foundation of China [Grant No. 42301044], and the GDAS Project of Science and Technology Development [Grant No. 2023GDASZH-2023010101, 2020GDASYL-20200104005].

Data Availability Statement

The China Land Cover Dataset is freely available at https://zenodo.org/records/8176941 (accessed on 1 August 2024). The China′s annual maximum NDVI dataset can be accessed at https://www.resdc.cn/DOI/DOI.aspx?DOIID=68 (accessed on 30 April 2024). The urban boundary dataset can be obtained from https://data-starcloud.pcl.ac.cn (accessed on 7 March 2024).

Conflicts of Interest

The authors declare no conflicts of interest.

References

  1. UN DESA. World Urbanization Prospects: The 2018 Revision, online ed.; Population Division, UN DESA: New York, NY, USA, 2018. [Google Scholar]
  2. Caprotti, F. Future cities: Moving from technical to human needs. Palgr. Commun. 2018, 4, 35. [Google Scholar] [CrossRef]
  3. Wang, C.; Ren, Z.; Dong, Y.; Zhang, P.; Guo, Y.; Wang, W.; Bao, G. Efficient cooling of cities at global scale using urban green space to mitigate urban heat island effects in different climatic regions. Urban For. Urban Green. 2022, 74, 127635. [Google Scholar] [CrossRef]
  4. Wu, S.; Lin, X.; Bian, Z.; Lipson, M.; Lafortezza, R.; Liu, Q.; Grimmond, S.; Velasco, E.; Christen, A.; Masson, V.; et al. Satellite observations reveal a decreasing albedo trend of global cities over the past 35 years. Remote Sens. Environ. 2024, 303, 114003. [Google Scholar] [CrossRef]
  5. Zhang, Q.; Zhou, D.; Xu, D.; Rogora, A. Correlation between cooling effect of green space and surrounding urban spatial form: Evidence from 36 urban green spaces. Build. Environ. 2022, 222, 109375. [Google Scholar] [CrossRef]
  6. Chen, H.; Lin, Y.; Chiueh, P. High-resolution spatial analysis for the air quality regulation service from urban vegetation: A case study of Taipei City. Sustain. Cities Soc. 2022, 83, 103976. [Google Scholar] [CrossRef]
  7. Chen, H.; Lin, Y.; Chiueh, P. Nexus of ecosystem service-human health-natural resources: The nature-based solutions for urban PM2.5 pollution. Sustain. Cities Soc. 2023, 91, 104441. [Google Scholar] [CrossRef]
  8. Neo, L.; Chong, K.Y.; Lindsay, S.; Middleton, D.J.; Tan, P.Y.; Er, K.B.H. A botanical oasis rather than a biological desert: Rediscoveries, new species and new records in a tropical city. Plants People Planet 2024, 6, 697–709. [Google Scholar] [CrossRef]
  9. Spotswood, E.N.; Beller, E.E.; Grossinger, R.; Grenier, J.L.; Heller, N.E.; Aronson, M.F.J. The Biological Deserts Fallacy: Cities in Their Landscapes Contribute More than We Think to Regional Biodiversity. Bioscience 2021, 71, 148–160. [Google Scholar] [CrossRef]
  10. Yao, H.; Li, Z.; Geisen, S.; Qiao, Z.; Breed, M.F.; Sun, X. Degree of urbanization and vegetation type shape soil biodiversity in city parks. Sci. Total Environ. 2023, 899, 166437. [Google Scholar] [CrossRef]
  11. Guo, H.; Du, E.; Terrer, C.; Jackson, R.B. Global distribution of surface soil organic carbon in urban greenspaces. Nat. Commun. 2024, 15, 806. [Google Scholar] [CrossRef]
  12. Zhang, W.; Villarini, G.; Vecchi, G.A.; Smith, J.A. Urbanization exacerbated the rainfall and flooding caused by hurricane Harvey in Houston. Nature 2018, 563, 384–388. [Google Scholar] [CrossRef] [PubMed]
  13. Yang, B.; Zhao, T.; Hu, L.; Browning, M.H.E.M.; Heinrich, J.; Dharmage, S.C.; Jalaludin, B.; Knibbs, L.D.; Liu, X.; Luo, Y.; et al. Greenspace and human health: An umbrella review. Innovation 2021, 2, 100164. [Google Scholar] [CrossRef] [PubMed]
  14. Zhang, L.; Tan, P.Y.; Gan, D.R.Y.; Samsudin, R. Assessment of mediators in the associations between urban green spaces and self-reported health. Landsc. Urban Plan. 2022, 226, 104503. [Google Scholar] [CrossRef]
  15. Zhu, W.; Wang, J.; Qin, B. The relationship between urban greenness and mental health: A national-level study of China. Landsc. Urban Plan. 2023, 238, 104830. [Google Scholar] [CrossRef]
  16. Esperon-Rodriguez, M.; Tjoelker, M.G.; Lenoir, J.; Baumgartner, J.B.; Beaumont, L.J.; Nipperess, D.A.; Power, S.A.; Richard, B.; Rymer, P.D.; Gallagher, R.V. Climate change increases global risk to urban forests. Nat. Clim. Change 2022, 12, 950–955. [Google Scholar] [CrossRef]
  17. Zhang, P.; Dong, Y.; Ren, Z.; Wang, G.; Guo, Y.; Wang, C.; Ma, Z. Rapid urbanization and meteorological changes are reshaping the urban vegetation pattern in urban core area: A national 315-city study in China. Sci. Total Environ. 2023, 904, 167269. [Google Scholar] [CrossRef]
  18. Zhang, L.; Yang, L.; Zohner, C.M.; Crowther, T.W.; Li, M.; Shen, F.; Guo, M.; Qin, J.; Yao, L.; Zhou, C. Direct and indirect impacts of urbanization on vegetation growth across the world’s cities. Sci. Adv. 2022, 8, eabo0095. [Google Scholar] [CrossRef]
  19. Li, Y.; Schubert, S.; Kropp, J.P.; Rybski, D. On the influence of density and morphology on the Urban Heat Island intensity. Nat. Commun. 2020, 11, 2647. [Google Scholar] [CrossRef]
  20. Cuthbert, M.O.; Rau, G.C.; Ekström, M.; O Carroll, D.M.; Bates, A.J. Global climate-driven trade-offs between the water retention and cooling benefits of urban greening. Nat. Commun. 2022, 13, 518. [Google Scholar] [CrossRef]
  21. Zhao, S.; Liu, S.; Zhou, D. Prevalent vegetation growth enhancement in urban environment. Proc. Natl. Acad. Sci. USA 2016, 113, 6313–6318. [Google Scholar] [CrossRef]
  22. Peng, X.; Jiang, S.; Liu, S.; Valbuena, R.; Smith, A.; Zhan, Y.; Shi, Y.; Ning, Y.; Feng, S.; Gao, H.; et al. Long-term satellite observations show continuous increase of vegetation growth enhancement in urban environment. Sci. Total Environ. 2023, 898, 165515. [Google Scholar] [CrossRef] [PubMed]
  23. Zhang, S.; Jia, W.; Zhu, H.; You, Y.; Zhao, C.; Gu, X.; Liu, M. Vegetation growth enhancement modulated by urban development status. Sci. Total Environ. 2023, 883, 163626. [Google Scholar] [CrossRef] [PubMed]
  24. Feng, D.; Bao, W.; Yang, Y.; Fu, M. How do government policies promote greening? Evidence from China. Land Use Policy 2021, 104, 105389. [Google Scholar] [CrossRef]
  25. Mell, I.C.; Henneberry, J.; Hehl-Lange, S.; Keskin, B. Promoting urban greening: Valuing the development of green infrastructure investments in the urban core of Manchester, UK. Urban For. Urban Green. 2013, 12, 296–306. [Google Scholar] [CrossRef]
  26. Shen, G. Three decades of urban forestry in China. Urban For. Urban Green. 2023, 82, 127877. [Google Scholar] [CrossRef]
  27. Zhang, X.; Brandt, M.; Tong, X.; Tong, X.; Zhang, W.; Fensholt, R. Urban core greening balances browning in urban expansion areas in China during recent decades. J. Remote Sens. 2024, 4, 0112. [Google Scholar] [CrossRef]
  28. Feng, F.; Yang, X.; Jia, B.; Li, X.; Li, X.; Xu, C.; Wang, K. Variability of urban fractional vegetation cover and its driving factors in 328 cities in China. Sci. China Earth Sci. 2024, 67, 466–482. [Google Scholar] [CrossRef]
  29. Chen, J.; Kinoshita, T.; Li, H.; Luo, S.; Su, D. Which green is more equitable? A study of urban green space equity based on morphological spatial patterns. Urban For. Urban Green. 2024, 91, 128178. [Google Scholar] [CrossRef]
  30. Yan, L.; Jia, W.; Zhao, S. The Cooling Effect of Urban Green Spaces in Metacities: A Case Study of Beijing, China’s Capital. Remote Sens. 2021, 13, 4601. [Google Scholar] [CrossRef]
  31. Ding, Q.; Shao, Z.; Huang, X.; Altan, O.; Hu, B. Time-series land cover mapping and urban expansion analysis using OpenStreetMap data and remote sensing big data: A case study of Guangdong-Hong Kong-Macao Greater Bay Area, China. Int. J. Appl. Earth Obs. 2022, 113, 103001. [Google Scholar] [CrossRef]
  32. Huang, Z.; Chen, Y.; Zheng, Z.; Wu, Z. Spatiotemporal coupling analysis between human footprint and ecosystem service value in the highly urbanized Pearl River Delta urban Agglomeration, China. Ecol. Indic. 2023, 148, 110033. [Google Scholar] [CrossRef]
  33. Geng, S.; Zhou, X.; Zhang, H.; Yang, L.; Sun, Z.; Yan, X.; Liu, M. Climatic and Anthropogenic Contributions to Vegetation Changes in Guangdong Province of South China. Remote Sens. 2023, 15, 5377. [Google Scholar] [CrossRef]
  34. Geng, S.; Zhang, H.; Xie, F.; Li, L.; Yang, L. Vegetation Dynamics under Rapid Urbanization in the Guangdong-Hong Kong-Macao Greater Bay Area Urban Agglomeration during the Past Two Decades. Remote Sens. 2022, 14, 3993. [Google Scholar] [CrossRef]
  35. Zhang, Z.; Peng, J.; Xu, Z.; Wang, X.; Meersmans, J. Ecosystem services supply and demand response to urbanization: A case study of the Pearl River Delta, China. Ecosyst. Serv. 2021, 49, 101274. [Google Scholar] [CrossRef]
  36. Xu, D.; Bai, T.; Song, Y.; Xia, Z.; Duan, X.; Santamouris, M.; Cui, Y. Reassessing the climate mitigation potential of Chinese ecological restoration: The undiscovered potential of urban. Innov. Geosci. 2024, 2, 100068. [Google Scholar] [CrossRef]
  37. Yang, J.; Huang, X. The 30 m annual land cover dataset and its dynamics in China from 1990 to 2019. Earth Syst. Sci. Data 2021, 13, 3907–3925. [Google Scholar] [CrossRef]
  38. Li, Y.; Zhang, X.; Xia, C. Towards a greening city: How does regional cooperation promote urban green space in the Guangdong-Hong Kong-Macau Greater Bay Area? Urban For. Urban Green. 2023, 86, 128033. [Google Scholar] [CrossRef]
  39. Mu, X.; Qiu, J.; Cao, B.; Cai, S.; Niu, K.; Yang, X. Mapping Soil Erosion Dynamics (1990–2020) in the Pearl River Basin. Remote Sens. 2022, 14, 5949. [Google Scholar] [CrossRef]
  40. Ou, Y.; Bao, Z.; Ng, S.T.; Song, W.; Chen, K. Land-use carbon emissions and built environment characteristics: A city-level quantitative analysis in emerging economies. Land Use Policy 2024, 137, 107019. [Google Scholar] [CrossRef]
  41. Song, C.; Yang, J.; Wu, F.; Xiao, X.; Xia, J.; Li, X. Response characteristics and influencing factors of carbon emissions and land surface temperature in Guangdong Province, China. Urban Clim. 2022, 46, 101330. [Google Scholar] [CrossRef]
  42. Wang, Z.; Yang, H.; Hu, Y.; Peng, Y.; Liu, L.; Su, S.; Wang, W.; Wu, J. Multifunctional trade-off/synergy relationship of cultivated land in Guangdong: A long time series analysis from 2010 to 2030. Ecol. Indic. 2023, 154, 110700. [Google Scholar] [CrossRef]
  43. Wu, Y.; Yang, J.; Li, S.; Guo, C.; Yang, X.; Xu, Y.; Yue, F.; Peng, H.; Chen, Y.; Gu, L.; et al. NDVI-Based Vegetation Dynamics and Their Responses to Climate Change and Human Activities from 2000 to 2020 in Miaoling Karst Mountain Area, SW China. Land 2023, 12, 1267. [Google Scholar] [CrossRef]
  44. Huang, S.; Tang, L.; Hupy, J.P.; Wang, Y.; Shao, G. A commentary review on the use of normalized difference vegetation index (NDVI) in the era of popular remote sensing. J. For. Res. 2021, 32, 1–6. [Google Scholar] [CrossRef]
  45. Zhang, J.; Zhang, Y.; Cong, N.; Tian, L.; Zhao, G.; Zheng, Z.; Gao, J.; Zhu, Y.; Zhang, Y. Coarse spatial resolution remote sensing data with AVHRR and MODIS miss the greening area compared with the Landsat data in Chinese drylands. Front. Plant Sci. 2023, 14, 1129665. [Google Scholar] [CrossRef]
  46. Meng, Y.; Hou, B.; Ding, C.; Huang, L.; Guo, Y.; Tang, Z. Spatiotemporal patterns of planted forests on the Loess Plateau between 1986 and 2021 based on Landsat NDVI time-series analysis. GISci. Remote Sens. 2023, 60, 2185980. [Google Scholar] [CrossRef]
  47. Xu, S.; Xiao, W.; Yu, C.; Chen, H.; Tan, Y. Mapping Cropland Abandonment in Mountainous Areas in China Using the Google Earth Engine Platform. Remote Sens. 2023, 15, 1145. [Google Scholar] [CrossRef]
  48. Zhang, T.; Huang, B.; Yan, Y.; Lin, Y.; Wong, H.; Wong, S.Y.; Chung, R.Y. Associations of residential greenness with unhealthy consumption behaviors: Evidence from high-density Hong Kong using street-view and conventional exposure metrics. Int. J. Hyg. Environ. Health 2023, 249, 114145. [Google Scholar] [CrossRef]
  49. Sun, L.; Chen, J.; Li, Q.; Huang, D. Dramatic uneven urbanization of large cities throughout the world in recent decades. Nat. Commun. 2020, 11, 5366. [Google Scholar] [CrossRef]
  50. Li, X.; Gong, P.; Zhou, Y.; Wang, J.; Bai, Y.; Chen, B.; Hu, T.; Xiao, Y.; Xu, B.; Yang, J.; et al. Mapping global urban boundaries from the global artificial impervious area (GAIA) data. Environ. Res. Lett. 2020, 15, 94044. [Google Scholar] [CrossRef]
  51. Chen, B.; Wu, S.; Song, Y.; Webster, C.; Xu, B.; Gong, P. Contrasting inequality in human exposure to greenspace between cities of Global North and Global South. Nat. Commun. 2022, 13, 4636. [Google Scholar] [CrossRef]
  52. Chen, B.; Wu, S.; Jin, Y.; Song, Y.; Wu, C.; Venevsky, S.; Xu, B.; Webster, C.; Gong, P. Wildfire risk for global wildland-urban interface areas. Nat. Sustain. 2024, 7, 474–484. [Google Scholar] [CrossRef]
  53. Wu, S.; Chen, B.; Webster, C.; Xu, B.; Gong, P. Improved human greenspace exposure equality during 21st century urbanization. Nat. Commun. 2023, 14, 6460. [Google Scholar] [CrossRef]
  54. Feng, R.; Wang, F.; Wang, K. Spatial-temporal patterns and influencing factors of ecological land degradation-restoration in Guangdong-Hong Kong-Macao Greater Bay Area. Sci. Total Environ. 2021, 794, 148671. [Google Scholar] [CrossRef]
  55. Du, J.; Fu, Q.; Fang, S.; Wu, J.; He, P.; Quan, Z. Effects of rapid urbanization on vegetation cover in the metropolises of China over the last four decades. Ecol. Indic. 2019, 107, 105458. [Google Scholar] [CrossRef]
  56. Piao, S.; Wang, X.; Park, T.; Chen, C.; Lian, X.; He, Y.; Bjerke, J.W.; Chen, A.; Ciais, P.; Tømmervik, H.; et al. Characteristics, drivers and feedbacks of global greening. Nat. Rev. Earth Environ. 2020, 1, 14–27. [Google Scholar] [CrossRef]
  57. Chao, L.; Li, Q.; Dong, W.; Yang, Y.; Guo, Z.; Huang, B.; Zhou, L.; Jiang, Z.; Zhai, P.; Jones, P. Vegetation Greening Offsets Urbanization-Induced Fast Warming in Guangdong, Hong Kong, and Macao Region (GHMR). Geophys. Res. Lett. 2021, 48, e2021GL095217. [Google Scholar] [CrossRef]
  58. Yu, S.; Leichtle, T.; Zhang, Z.; Liu, F.; Wang, X.; Yan, X.; Taubenböck, H. Does urban growth mean the loss of greenness? A multi-temporal analysis for Chinese cities. Sci. Total Environ. 2023, 898, 166373. [Google Scholar] [CrossRef]
  59. Yuan, J.; Xu, Y.; Xiang, J.; Wu, L.; Wang, D. Spatiotemporal variation of vegetation coverage and its associated influence factor analysis in the Yangtze River Delta, eastern China. Environ. Sci. Pollut. Res. 2019, 26, 32866–32879. [Google Scholar] [CrossRef]
  60. Zhang, Y.; Zhang, T.; Zeng, Y.; Cheng, B.; Li, H. Designating National Forest Cities in China: Does the policy improve the urban living environment? For. Policy Econ. 2021, 125, 102400. [Google Scholar] [CrossRef]
  61. Yang, J.; Huang, C.; Zhang, Z.; Wang, L. The temporal trend of urban green coverage in major Chinese cities between 1990 and 2010. Urban For. Urban Green. 2014, 13, 19–27. [Google Scholar] [CrossRef]
  62. Liu, C.; Song, C.; Ye, S.; Cheng, F.; Zhang, L.; Li, C. Estimate provincial-level effectiveness of the arable land requisition-compensation balance policy in mainland China in the last 20 years. Land Use Policy 2023, 131, 106733. [Google Scholar] [CrossRef]
  63. Liu, T.; Liu, X.; Cai, Y. Urban Trees Expansion and Exposure Improvement in China: Insights From Satellite Observations (1985–2023). IEEE J.-Stars 2024, 17, 9694–9705. [Google Scholar] [CrossRef]
  64. Li, Y.; Svenning, J.; Zhou, W.; Zhu, K.; Abrams, J.F.; Lenton, T.M.; Ripple, W.J.; Yu, Z.; Teng, S.N.; Dunn, R.R.; et al. Green spaces provide substantial but unequal urban cooling globally. Nat. Commun. 2024, 15, 7108. [Google Scholar] [CrossRef] [PubMed]
  65. Lin, J.; Qiu, S.; Tan, X.; Zhuang, Y. Measuring the relationship between morphological spatial pattern of green space and urban heat island using machine learning methods. Build. Environ. 2023, 228, 109910. [Google Scholar] [CrossRef]
  66. Li, D.; Yang, Y.; Xia, F.; Sun, W.; Li, X.; Xie, Y. Exploring the influences of different processes of habitat fragmentation on ecosystem services. Landsc. Urban Plan. 2022, 227, 104544. [Google Scholar] [CrossRef]
Figure 1. The location of the PRDUA (a,b), and its land-cover maps in 1985 (c) and 2021 (d), respectively.
Remotesensing 16 04369 g001
Figure 2. The state and change flows of land cover in nine cities in the PRDUA from 1985 to 2021. Regarding subplot numbering, letters represent cities, and numbers indicate urban subregions.
Remotesensing 16 04369 g002
Figure 3. Dynamic degrees of green spaces in the expanded urban areas in nine cities in the PRDUA during 1985–2021.
Remotesensing 16 04369 g003
Figure 4. (ai) The changes in landscape metrics of green spaces in nine cities in the PRDUA during 1985–2021.
Remotesensing 16 04369 g004
Figure 5. Box plots of trends in annual NDVI in nine cities in the PRDUA during 1986–2021. (a) represents green spaces with constant land-cover types during the study period, and (b) represents all the land-cover types, excluding permanent water bodies.
Remotesensing 16 04369 g005
Figure 6. Spatial patterns of trends in annual NDVI in areas with constant land-cover types in nine cities in the PRDUA during 1986–2021.
Remotesensing 16 04369 g006
Figure 7. Spatial patterns of trends in annual NDVI in areas with land-cover change occurring in nine cities in the PRDUA during 1986–2021.
Remotesensing 16 04369 g007
Figure 8. The frequency distributions of trends in annual NDVI in different city subregions where land-cover change did not occur (a) or occurred (b) during 1986–2021. O, E, and R indicate the old urban districts, expanded urban areas, and rural areas, respectively.
Remotesensing 16 04369 g008
Figure 9. The change in area-averaged NDVI in the PRDUA during 1986–2021 (a) and correlation of annual NDVI in different city subregions with the PRDUA average (b). The solid-colored bars represent the relationship between annual NDVI in areas with constant land-cover types and the PRDUA average, while the bars with forward slashes indicate the relationship between the areas excluding permanent water bodies and the PRDUA average. ** indicate the trends significant at p < 0.01.
Remotesensing 16 04369 g009
Table 1. Slopes of areas and landscape metrics in green spaces, as well as area-averaged NDVI across the PRDUA during the study period.
CitySubregionsArea (hm2/a)NP (ind/a)PD (ind/(km2·a))AI (%/a)NDVI
GZO−274.79 **−100.21 **3.91 **−0.59 **0.0044 **
E−2990.70 **176.17 **0.34 **−0.24 **0.0027 **
R−494.62 **−109.52 **−0.02 **−0.02 **0.0069 **
SZO−157.81 **−65.86 **2.49 **−0.36 **0.0051 **
E−1890.95 **−109.55 **0.33 **−0.13 **0.0063 **
R−20.62 **−3.83−0.01−0.03 **0.0050 **
ZHO−26.35 **−14.76 **3.16 **−0.26 **0.0046 **
E−402.09 **36.47 **0.55 **−0.24 **−0.0007
R−648.69 **51.86 **0.16 **−0.13 **0.0017 **
FSO−113.91 **−55.51 **3.56 **−0.52 **0.0039 **
E−2874.66 **47.640.50 **−0.27 **0.0019 *
R−322.19 **−67.86 **−0.04 **−0.06 **0.0056 **
DGO−62.33 **−36.71 **3.98 **−0.53 **0.0031 **
E−3046.11 **−41.99 *0.35 **−0.15 **0.0043 **
R−74.68 **11.15 **0.08 **−0.07 **0.0059 **
ZSO−39.14 **−16.00 **2.42 **−0.42 **0.0040 **
E−1576.79 **150.69 **0.42 **−0.19 **0.0041 **
R−251.42 **45.23 **0.30 **−0.20 **0.0014
JMO−72.68 **−16.99 **3.79 **−0.59 **0.0047 **
E−909.73 **104.63 **0.54 **−0.28 **0.0011
R−992.08 **−390.30 **−0.04 **−0.03 **0.0055 **
ZQO−37.35 **−11.01 **1.66 **−0.27 **0.0042 **
E−462.86 **79.03 **0.66 **−0.40 **0.0006
R−743.80 **−736.57 **−0.05 **0.000.0080 **
HZO−40.75 **−13.52 **2.54 **−0.39 **0.0042 **
E−1348.99 **68.22 **0.29 **−0.22 **0.0024 *
R−331.35 **−252.47 **−0.02 **−0.03 **0.0071 **
*, ** indicate the trends significant at p < 0.05 and 0.01, respectively.
Disclaimer/Publisher’s Note: The statements, opinions and data contained in all publications are solely those of the individual author(s) and contributor(s) and not of MDPI and/or the editor(s). MDPI and/or the editor(s) disclaim responsibility for any injury to people or property resulting from any ideas, methods, instructions or products referred to in the content.

